Spotlight on sexually transmitted infections in London: 2024 data
Updated 8 October 2026
Applies to England

© Crown copyright 2026
This publication is licensed under the terms of the Open Government Licence v3.0 except where otherwise stated. To view this licence, visit nationalarchives.gov.uk/doc/open-government-licence/version/3 or write to the Information Policy Team, The National Archives, Kew, London TW9 4DU, or email: psi@nationalarchives.gov.uk.
Where we have identified any third party copyright information you will need to obtain permission from the copyright holders concerned.
This publication is available at https://www.gov.uk/government/publications/sexually-transmitted-infections-london-data/spotlight-on-sexually-transmitted-infections-in-london-2024-data
Summary
This report focusses on sexually transmitted infections (STIs) in London. HIV is reported on separately. Access the UK Health Security Agency (UKHSA) report on STIs and screening for chlamydia in England for a national perspective (1).
While this report primarily focuses on the trend between 2023 and 2024, some trends relative to 2019 or earlier are included to provide a comparison to sexual health service provision and STI diagnoses prior to the COVID-19 pandemic during 2020 and 2021. For England, the numbers of consultations, sexual health screens and STI diagnoses in 2020 and 2021 are lower than preceding years and any trends during periods which include those years must be interpreted in that context.
STIs represent an important public health problem in London. The health risks associated with them are well documented. Untreated syphilis, for example, can cause heart and brain disease (2), while complications of gonorrhoea and chlamydia include pelvic inflammatory disease (PID) which can damage fertility. STIs can also increase the risk of acquiring HIV. Of all the UKHSA’s regions, London has the highest rate of new STIs in England.
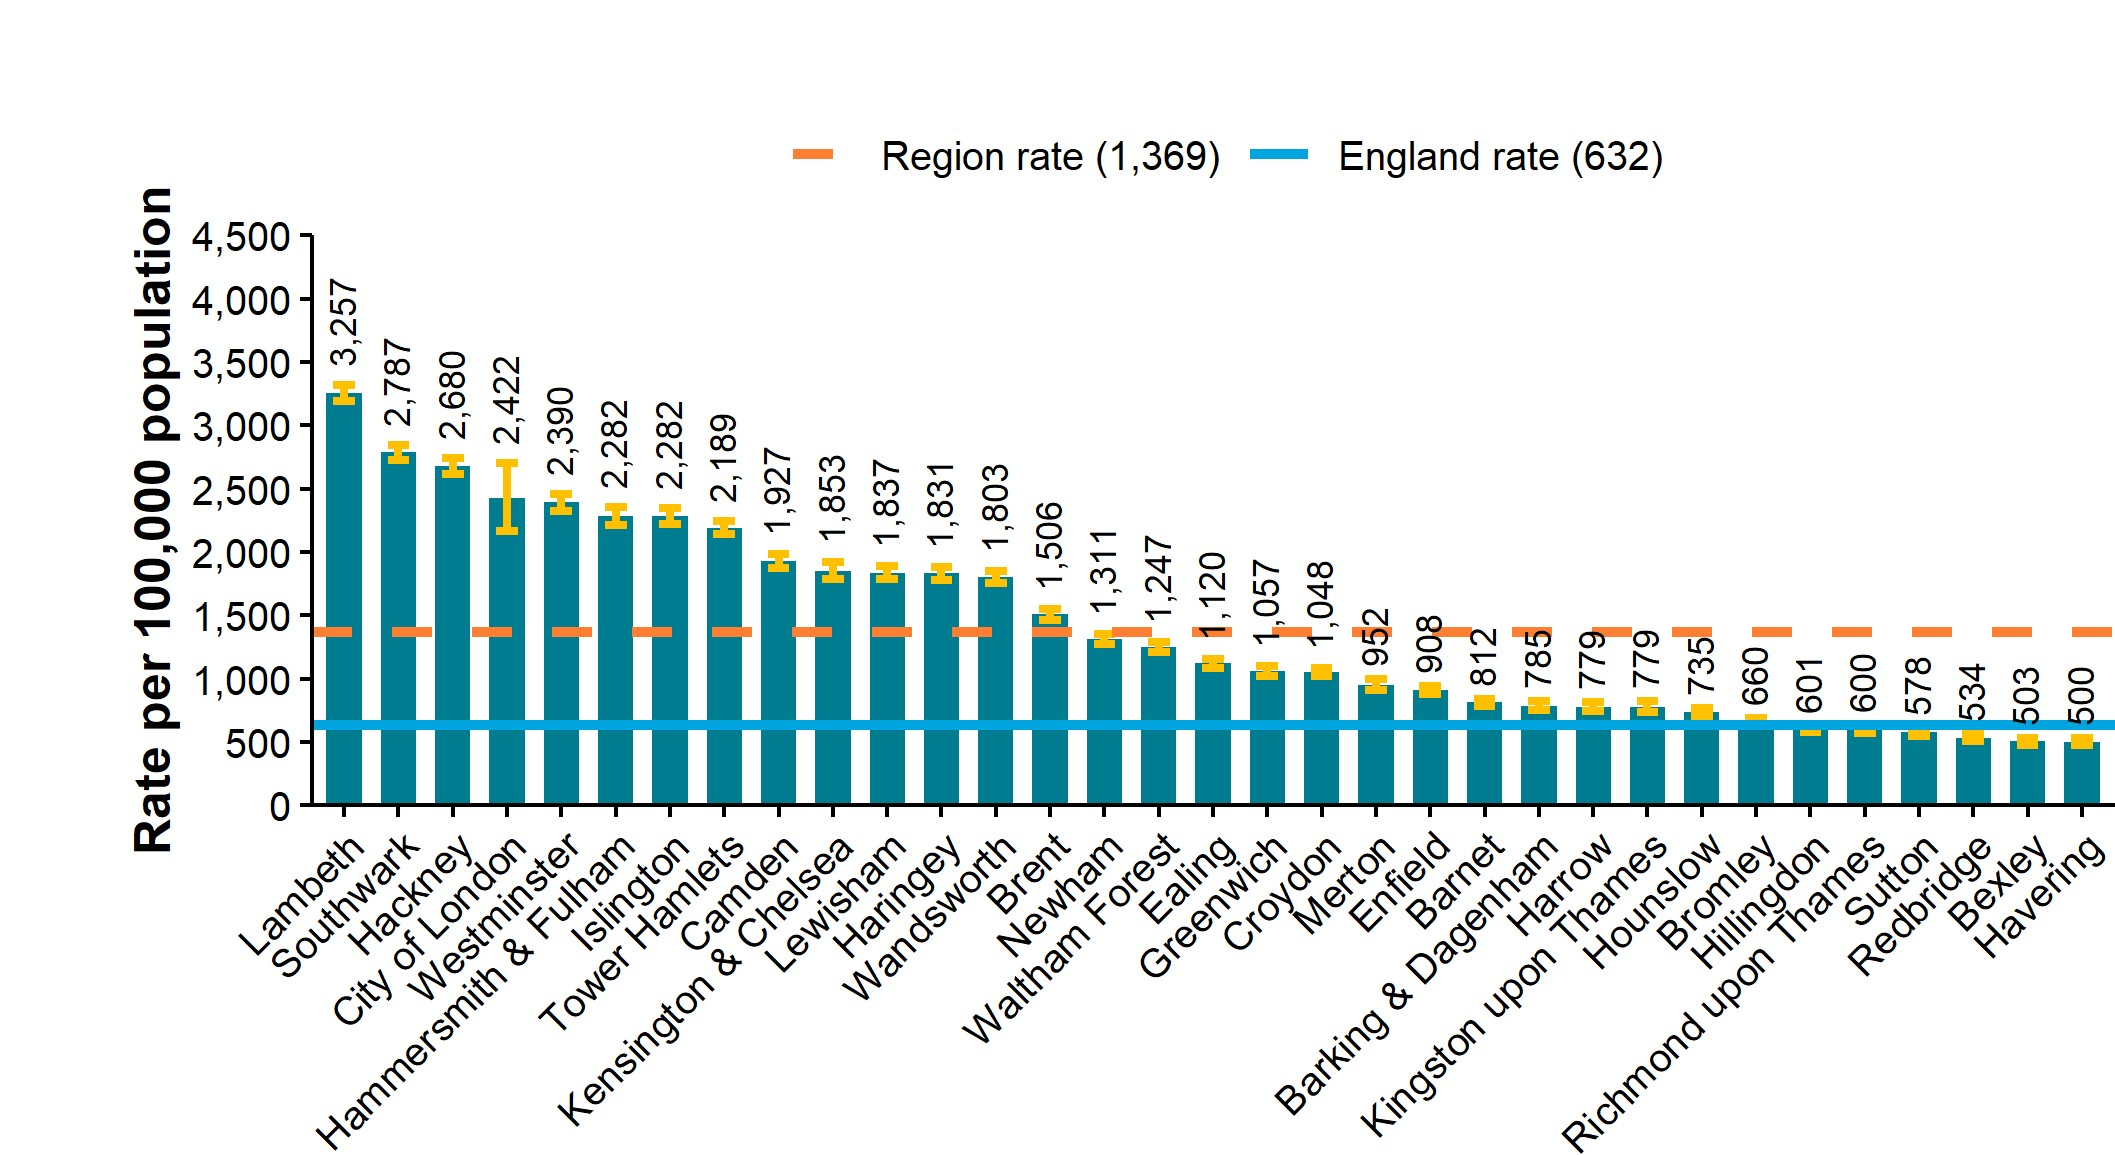
More than 122,000 new STIs were diagnosed in London residents in 2024, a rate of 1,369 diagnoses per 100,000 population. Rates by local authority ranged from 500 new STI diagnoses per 100,000 population in Havering to 3,257 new STI diagnoses per 100,000 population in Lambeth.
The number of new STIs diagnosed in London residents decreased by 4% between 2023 and 2024. Syphilis decreased by 4%, gonorrhoea decreased by 6%, chlamydia decreased by 10%, genital warts decreased by 2% however genital herpes increased by 8%.
UKHSA recommends that local areas should be working towards achieving a chlamydia detection rate no lower than 3,250 per 100,000 among women aged 15 to 24 years and this is an indicator in the Public Health Outcomes Framework. In 2024, the chlamydia detection rate among London women aged 15 to 24 years was 1,688 per 100,000 residents.
Rates of new STIs are different in men and women (1,886 and 819 per 100,000 residents, respectively). Where gender and sexual orientation are known, gay, bisexual and other men who have sex with men (GBMSM) account for 46% of London residents diagnosed with a new STI (excluding chlamydia diagnoses reported via CTAD) (81% of those diagnosed with syphilis and 75% of those diagnosed with gonorrhoea).
STIs disproportionately affect young people. London residents aged between 15 and 24 years accounted for 25% of all new STI diagnoses in 2024. A steep decline has been seen in genital warts diagnosis rates in females aged 15 to 19 following the introduction in 2008 of vaccination for girls against human papillomavirus (HPV), the virus which causes genital warts. Recent years have seen fluctuating rates though, with a 24% decrease in London from 2020 to 2024.
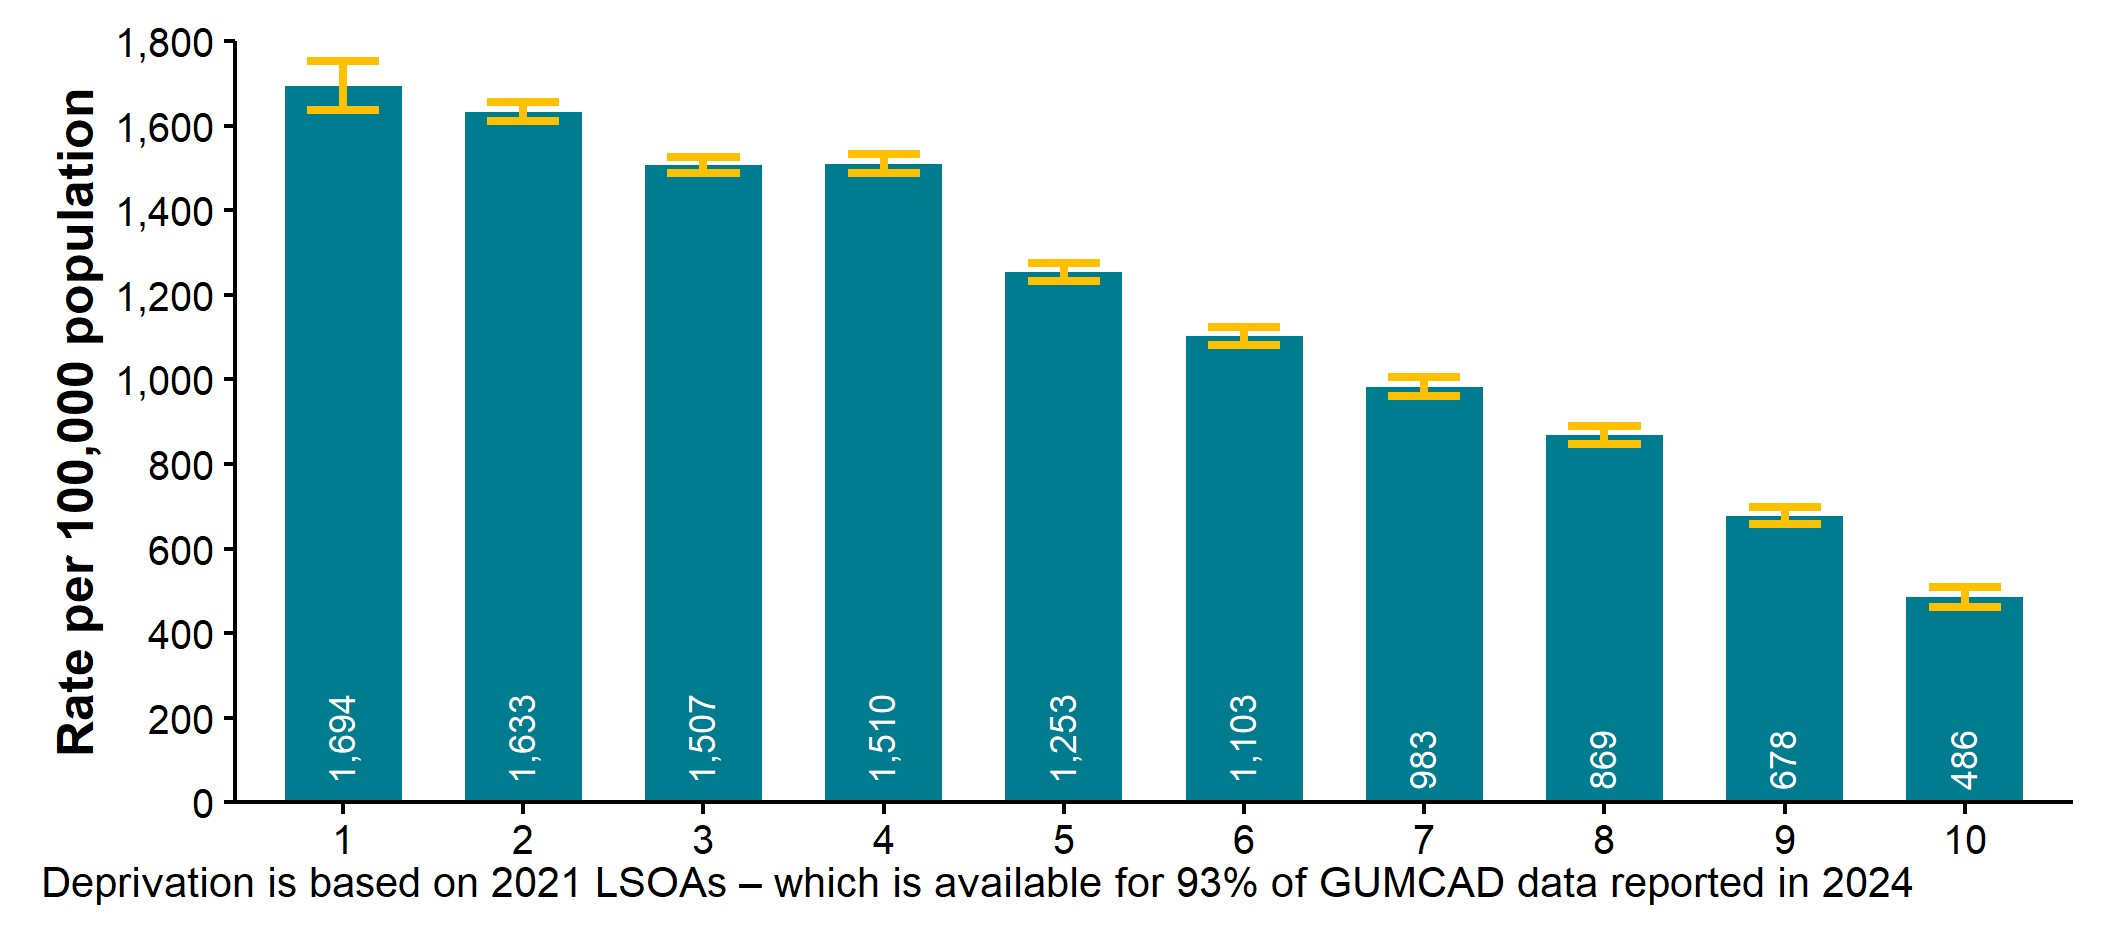
The White ethnic group has the highest number of new STI diagnoses: 58,971 (52.9%). Although 9.3% of new STIs are in the Black Caribbean ethnic group, they have the highest rate: 3,019 per 100,000, which is 2.4 times the rate seen in the White ethnic group. Where country of birth was known, 51% of London residents diagnosed with a new STI in 2024 (excluding chlamydia diagnoses reported via CTAD) were UK-born. The rate of new STIs among people who lived in the most deprived areas (1,694 per 100,000) was 3.5 times higher than the rate for people who live in the least deprived areas (486 per 100,000).
Access to sexual health services
Access to sexual health services (SHSs) has an impact on trends in STI diagnoses. Overall, the STI testing rate (excluding chlamydia in under 25-year-olds) in London in 2024 increased by 1% compared to 2023 and was 12% higher than prior to the COVID-19 pandemic in 2019. Positivity in London residents tested for STIs (excluding chlamydia in under 25-year-olds) decreased by 7% to 7.8% when 2024 is compared to 2023. It was 14% lower than reported for 2019, the last pre-pandemic year.
There was a 1% increase in the number of SHS consultations (which include asymptomatic screening via the internet) in London in 2024 compared to 2023 (from 1,569,952 to 1,581,718).
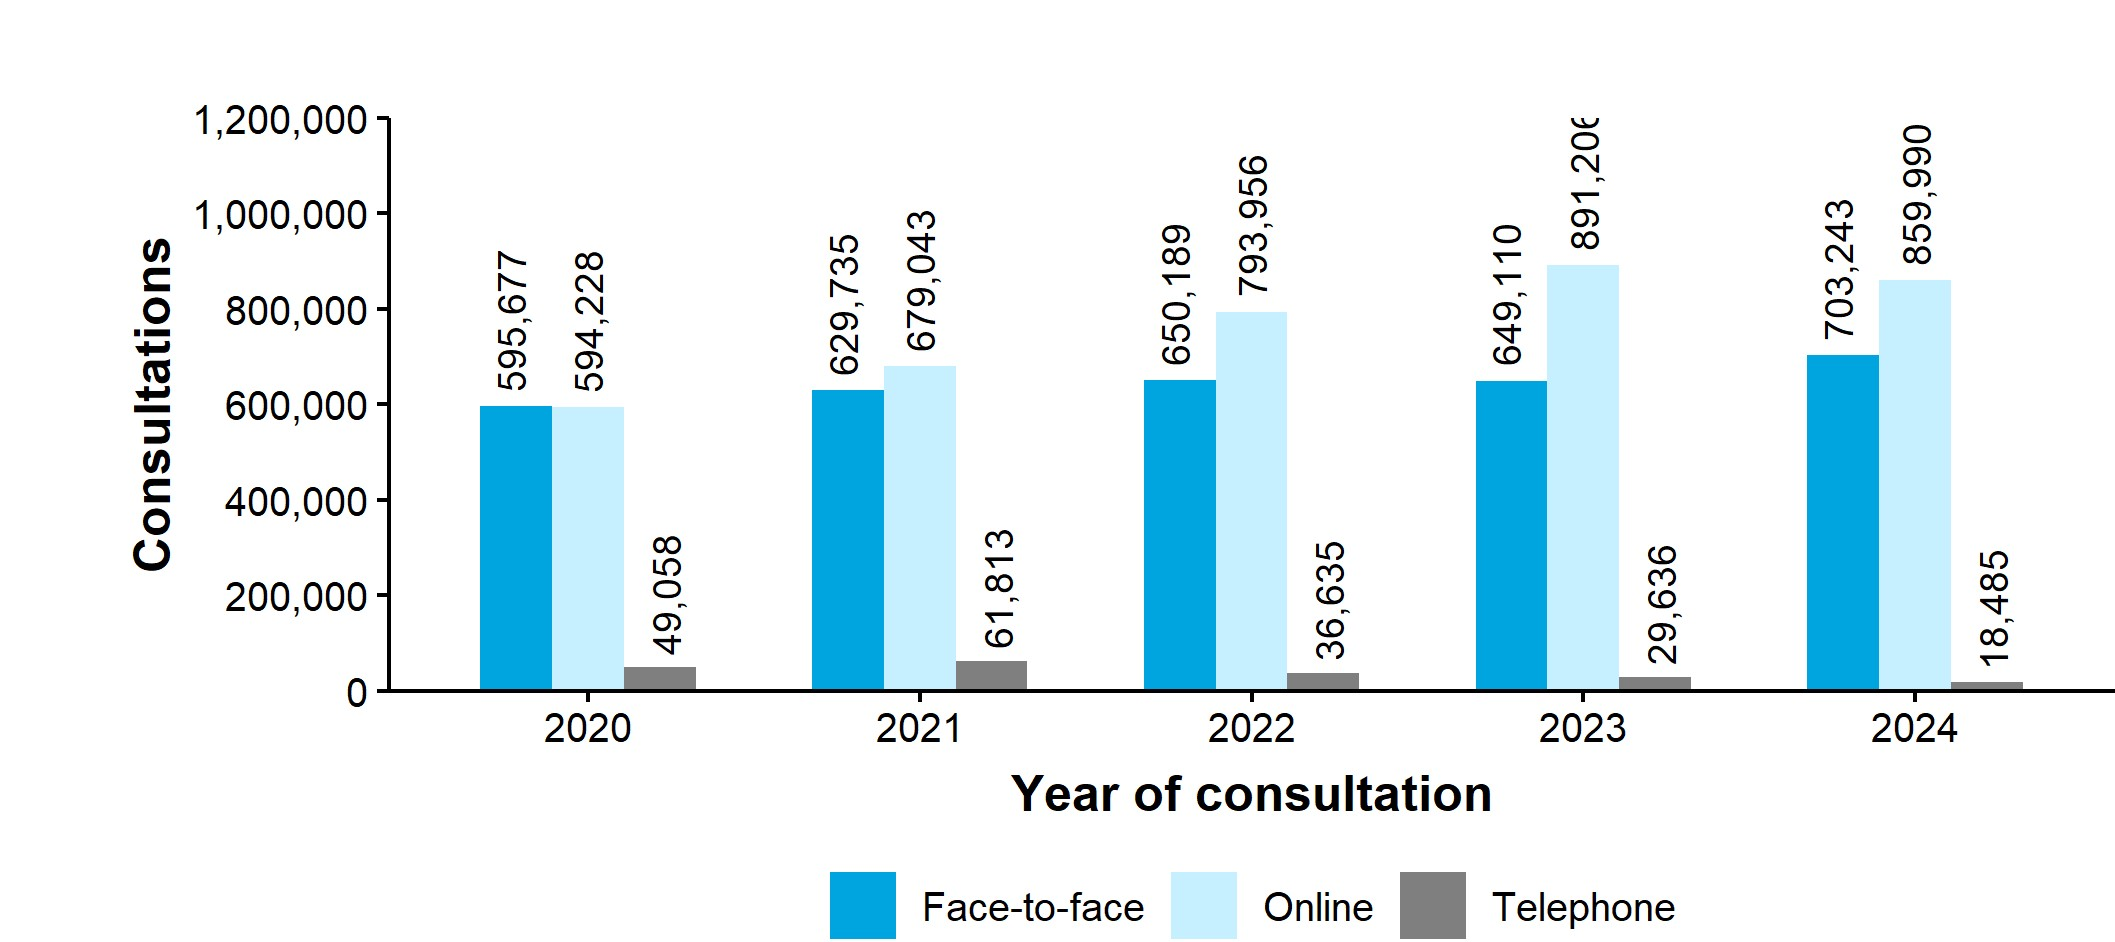
Of all consultations in 2024, over half (54%, 859,990) were via the internet (compared to 21% in 2019), 44% (703,243) were delivered face-to-face and 1% (18,485) were via telephone. Compared to 2023, rises were seen in 2024 in face-to-face consultations (8% increase) but for the first time since the COVID-19 pandemic there was a decrease in consultations via the internet (a fall of 4%). Telephone consultations continued to decline with 38% fewer consultations via this medium in 2024 compared to 2023. In 2024, the number of face-to-face consultations was 25% lower than in 2019. For heterosexual men, 61% of their consultations were online, compared to 58% for heterosexual or bisexual women and 47% for GBMSM.
Trends by STI
The number of new STIs diagnosed in London residents decreased by 4% between 2023 and 2024. While the number of genital herpes diagnoses increased by 8%, falls were seen in the other major STIs: syphilis decreased by 4%, gonorrhoea by chlamydia by 6%, chlamydia by 10% and genital warts by 2%. There was a 13% increase in trichomoniasis diagnoses and a 9% increase in diagnoses of Mycoplasma genitalium.
While the overall number of new STIs diagnosed in London in 2024 was 19% lower than seen in the last pre-COVID-19 pandemic year (2019), the numbers of syphilis and gonorrhoea diagnoses in 2024 exceeded those reported for 2019.
Although GBMSM continued to make up over 8 in 10 of those diagnosed with syphilis, the number of diagnoses in this group in 2024 represented a 2% decrease compared to 2019. By contrast, large proportional increases were seen in syphilis diagnoses for heterosexual or bisexual women (57%) and heterosexual men (52%).
Gonorrhoea diagnoses remained below pre-pandemic levels for the youngest age groups, but they were above those levels for all age groups from 25 to 34 years upwards. The largest rise from 2019 to 2024 was seen in the 65 years and older age group at 51% but based on relatively small numbers (a rise from 133 to 150 diagnoses). The next largest rise was in the 35-to-44-year age group where the number of diagnoses rose by 28%.
National chlamydia screening detection rate indicator
UKHSA recommends that local areas should be working towards achieving a chlamydia detection rate no lower than 3,250 per 100,000 female population aged 15 to 24 years. The detection rate is a measure of chlamydia control activity, aimed at reducing the incidence of reproductive sequelae of chlamydia infection and interrupting transmission. An increased detection rate is indicative of increased control activity; it is not a measure of morbidity. The chlamydia detection rate is an indicator in the Public Health Outcomes Framework (3). In 2024, the rate per 100,000 among London female residents aged 15 to 24 years was 1,688, a little over half of the desired rate and the lowest rate in this population over the last 10 years. Given that London is a higher incidence area for STIs including chlamydia, the fact that the detection rate is only around half of the rate recommended at a national level is of concern.
Populations with greater sexual health needs
Gay, bisexual and other sex who have sex with men
GBMSM continue to be affected by health inequalities in outcomes related to STIs. Where gender and sexual orientation are known, GBMSM accounted for 46% of London residents diagnosed with a new STI in 2024 (excluding chlamydia diagnoses reported via CTAD), 81% of those diagnosed with syphilis, 75% of those diagnosed with gonorrhoea and 43% of those diagnosed with chlamydia. The proportion of syphilis diagnoses in GBMSM among London residents has tended to decrease over the past 5 years (due to an upward trend among heterosexuals, particularly heterosexual or bisexual women). It was 90% in 2015 and remained at similar levels until 2021 when it fell to 86%. For other major STIs, including gonorrhoea and chlamydia, the proportion in GBMSM has increased.
Among GBMSM, decreases in diagnoses of most major STIs were seen in 2024 when compared to 2023. The exception was genital herpes which saw a 9% rise. The number of new STIs diagnosed in GBMSM in 2024 was 4% lower than in 2023, with falls of 8% for syphilis, 3% for gonorrhoea and 9% for chlamydia. Diagnoses of syphilis, gonorrhoea, chlamydia and genital herpes in GBMSM had been following a rising trend prior to the COVID-19 pandemic. Compared to 2019, the last pre-pandemic year, diagnoses of syphilis were 2% lower and diagnoses of chlamydia were 32% lower. By contrast, diagnoses of gonorrhoea were 11% higher. Compared to 2015, the number of diagnoses in 2024 was 28% higher for syphilis, 69% higher for gonorrhoea and 22% higher for chlamydia.
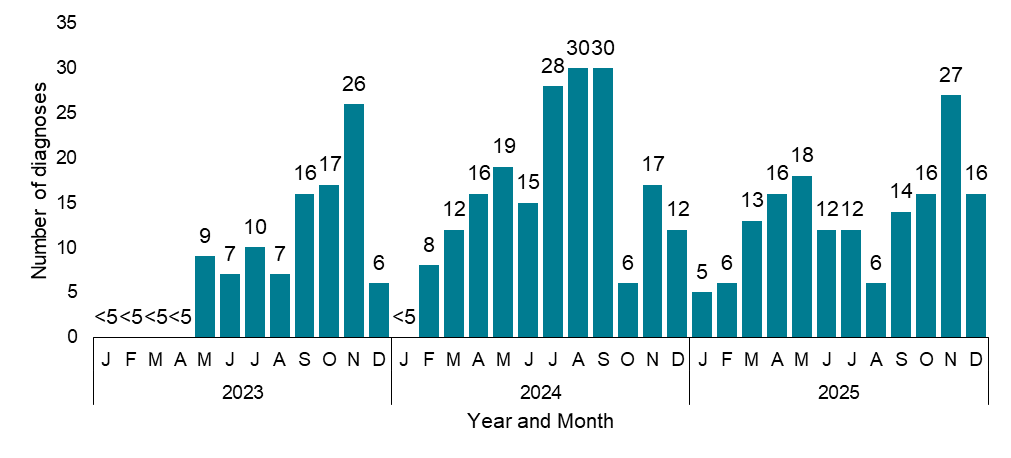
Mpox is a zoonotic infection, caused by the monkeypox virus, that previously occurred mostly in West and Central Africa and is transmitted through close contact (including through sexual contact). Previous cases in the UK had been either imported from countries where mpox is endemic or had been contacts with documented epidemiological links to imported cases. In 2022, there was a very large outbreak of mpox with community transmission in the UK, mainly in GBMSM. London was most affected in 2022, with case numbers peaking in July (881 diagnoses), before falling to low numbers by November of the same year. The number of diagnoses in Londoners presumed to be GBMSM has remained low since the end of 2022 with a maximum of 30 diagnoses per month (4) between 2023 and 2025. This clade IIb outbreak is distinct from the clade Ib cases associated with travel that have been reported since October 2024.
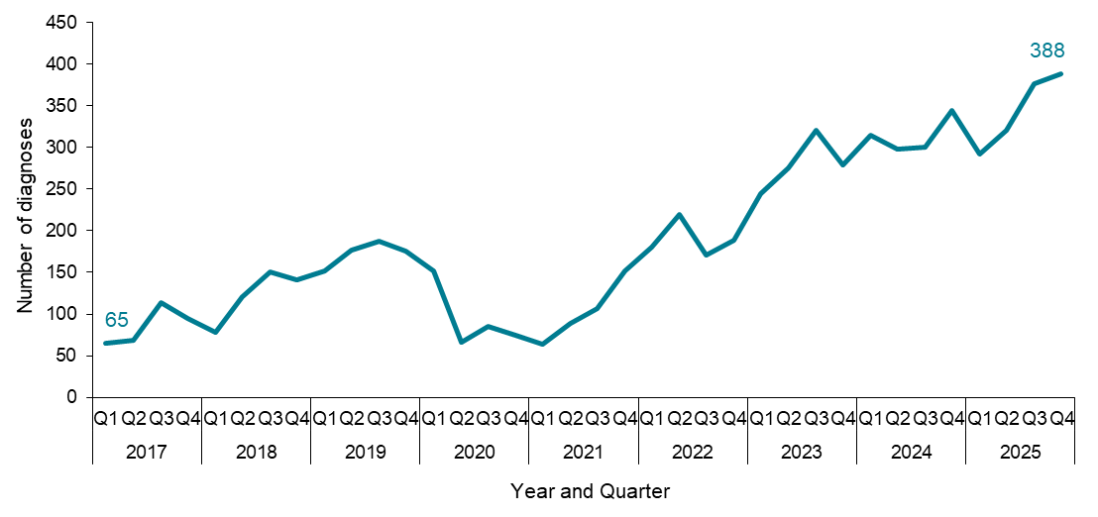
Shigella is a gastrointestinal infection that can cause severe diarrhoea, with fever and abdominal pain. It is caused by a bacterium found in faeces. Sex that may involve anal or faecal contact is one way that the infection can spread. GBMSM are at increased risk. Following a fall in 2020, the number of shigella infections among presumptive GBMSM in London has followed a strongly rising trend since the first quarter of 2021, exceeding pre-pandemic levels by early 2022. There were 388 diagnoses reported in the final quarter of 2025.
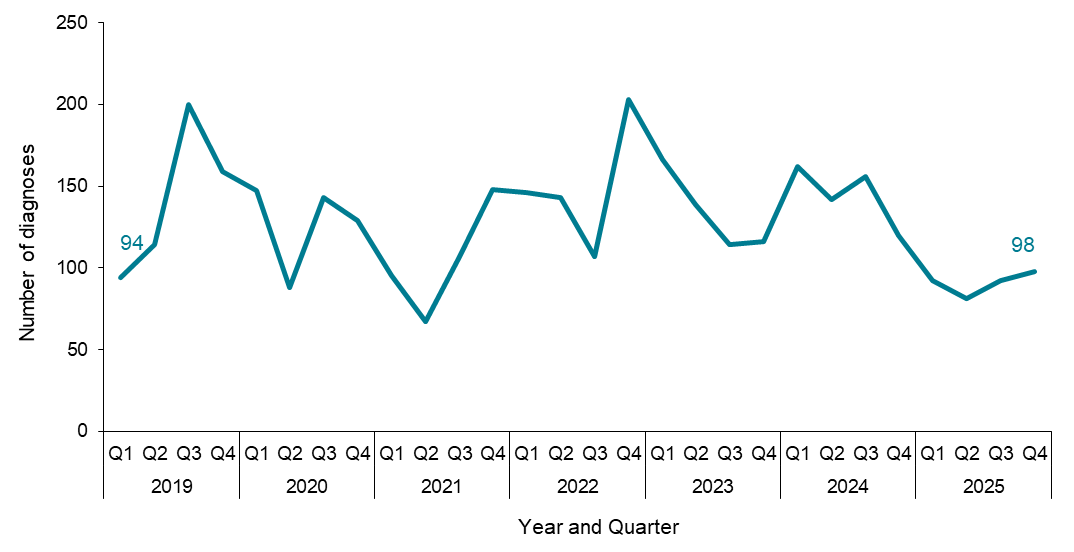
Lymphogranuloma venereum (LGV), a form of chlamydia which spreads to the lymph nodes, continued to be diagnosed in London almost exclusively in GBMSM in 2024 and 2025. The pandemic period decrease was small, and the post-pandemic rebound has been similarly limited. There were 98 diagnoses reported in adult men resident in London in the fourth quarter of 2025.
Data for 2024 shows that GBMSM London residents diagnosed with a new STI were more likely to be born abroad, particularly in Europe, Asia or Latin America, than heterosexual men or heterosexual or bisexual women. They were also more likely to belong to either the White British or Other White ethnic groups. They had an older median age at diagnosis for all major STIs other than syphilis. For syphilis, median age at diagnosis was similar for GBMSM and heterosexual men. Median age at diagnosis for a new STI was 34 years for GBMSM in 2024 compared to 29 for heterosexual men and 27 for heterosexual or bisexual women.
It is important to consider differences in service access when interpreting differences in diagnoses between groups. GBMSM tend to access sexual health services more frequently than heterosexual men or heterosexual or bisexual women and were more likely to access these services during the COVID-19 pandemic. Consultation numbers have also rebounded more strongly for this group since the pandemic with a 51% rise in consultations among GBMSM London residents from 2019 to 2024, compared to a 26% rise for heterosexual men and a 33% rise for heterosexual or bisexual women. GBMSM accounted for 23% of all consultations at SHSs in London in 2024 (where gender and sexual orientation was known) compared to 21% in 2019.
Young people
STIs disproportionately affect young people. London residents aged between 15 and 24 years accounted for 21% of consultations at SHSs and 25% of all new STI diagnoses in 2024, whereas this age group accounts for around 13% of the London population. The age group with the highest new STI diagnosis rate was 20- to 24-year-olds (3,747 per 100,000 population). The higher rates of STIs among young people aged 20 to 24 years are likely to be due to greater rates of partner change compared to older age groups (5).
The pandemic appears to have had differing impacts by age group, both on consultation numbers and diagnosis rates. Consultation numbers in 2024 exceeded those in 2019, the last pre-pandemic year, for all age groups other than the youngest. A fall of 41% was seen for 13- to 14-year-olds and a fall of 30% for those aged 15 to 19 years. A rise was seen for the 20-to-24-year age group but at 5% it was far smaller than seen for any of the older age groups. Compared to 2023, numbers of consultations rose for all groups other than the 15 to 19 and 20 to 24 years. For both of these groups a 10% fall was seen.
Examining these trends further by gender and sexual orientation, numbers of consultations and diagnoses in young GBMSM were less affected than those in young heterosexual men and young heterosexual or bisexual women. Consultations in 2024 among GBMSM aged 15 to 19 years increased 2% compared to 2019 (but decreased 6% compared to 2023). By contrast, consultations among heterosexual males aged 15 to 19 years decreased 27% from 2019 and for heterosexual and bisexual females aged 15 to 19 years decreased 30%.
The greatest expansion in consultations between 2019 and 2024 was via online access (triage via an online consultation form followed, where appropriate, by a test kit sent by post to the patient). The increase in consultations via this medium between 2019 and 2024 was proportionally lower for the 15 to 19 and 20-to-24-year age groups compared to older age groups and the 15 to 19, 20 to 24 and 25 to 34 year age groups all saw declines when 2024 is compared to 2023. The decrease in face-to-face consultations between 2019 and 2024 was also greater for younger age groups.
Younger age groups also had much lower new STI rates in 2024 than in 2019. In 2024, the new STI diagnosis rate for Londoners aged 15 to 19 years (1,407) was 55% lower than in 2019. A 12% decrease was seen compared to 2023. A similar picture was seen for Londoners aged 20 to 24 years. For this group the new STI diagnosis rate was 37% lower than that seen in 2019 and 12% lower than in 2023. By contrast the rate among 35- to 44-year-olds (1,818) in 2024 was only 8% higher than the 2019 rate and 2% higher than the 2023 rate.
When 2024 is compared to 2019, a steep decline (78% decrease) is seen in genital warts diagnosis rates in females aged 15 to 19. Compared to 2023, a decline of 22% is seen. For boys aged 15 to 19, there was a similarly large decrease compared to 2019 (a fall of 68%) but an increase of 16% compared to 2023. The decrease in consultations for this age group should be borne in mind when interpreting recent trends. The long-term decline in genital warts diagnoses followed the introduction, for girls, in 2008, of vaccination against human papillomavirus (HPV), the virus which causes genital warts.
Young people may have been disproportionately affected by pandemic restrictions on social mixing. There may also be inequalities in service access. For example, young people may be more likely to be living at home with their families where they may find it difficult to receive test kits provided by online services. Trends seen for face-to-face services suggest they may also be finding these services more difficult to access due to reduced opening hours and reduced availability of walk-in appointments. Reductions in funding for organisations that work with and mentor young people may also affect engagement with sexual health services. The decline in chlamydia screening has contributed to the trends seen for young people, but similar patterns are also seen in GUMCAD data.
Ethnic groups affected by health inequalities
Large health inequalities are seen between ethnic groups with the Black and mixed ethnic groups particularly affected. However, when interpreting analyses by ethnic group it is important to understand that ethnicity is a complex concept and is self-identified within the limitations of the options that are provided. Ethnicity may incorporate cultural, religious and linguistic differences as well as differences in physical attributes and world region of origin. People may identify their ethnic group differently in different contexts or over time.
Ethnic group is not a proxy for country or world region of birth (for example most Londoners who identify as Black Caribbean are UK-born) and identification by ethnic group may vary by country of birth, as the meanings of terms like ‘White’ and ‘Black’ in relation to ethnicity are cultural rather than universal.
There are large differences in age structure between ethnic groups (6). STI rates for groups with older age distributions, such as the White British group, will tend to be depressed by a larger number of elderly people in the denominator. There is also intersectionality with other factors such as deprivation and stigma. It is not yet possible to measure some of these factors (for example stigma) consistently using existing data, although work is ongoing to address this.
People belonging to the Black African, Black Caribbean and Other Black groups make up around 14% of the population of London, but they accounted for 20% of consultations at SHSs and 21% of new STI diagnoses in 2024. The number of new STI diagnoses in those belonging to a Black ethnic group was 5% higher than in 2023. Differences are seen between specific Black ethnic groups. STI rates for the Black African group tend to be lowest (1,468 per 100,000 population in 2024) and those for the Black Caribbean group highest (3,019).
Londoners belonging to Black ethnic groups diagnosed with a new STI in 2024 were more likely to be female (37%) and aged 15 to 24 years (35%) compared to Londoners belonging to the White and Asian ethnic groups and, among men, there was a lower proportion of GBMSM. For all Black ethnic groups, a greater proportion of Black London residents diagnosed with a new STI in 2024 lived in areas categorised as falling into the top 2 quintiles of deprivation (representing the most deprived areas). Overall, 73% of those belonging to a Black ethnic group lived in an area within the top 2 deciles of deprivation compared to 61% of all Londoners diagnosed with a new STI in 2024.
One factor in which Black ethnic groups varied significantly was in the proportion born in the UK. Those in the Black Caribbean and Other Black ethnic groups were more likely to have been born in the UK than those in the Black African ethnic group. In 2024, 78% of new STI diagnoses in Black Caribbeans and 72% in the Other Black group being made among people born in the UK, compared to 45% of new STI diagnoses in Black Africans.
Although only 9% of new STIs reported for London residents in 2024 were in Black Caribbeans, they had the highest new STI diagnosis rate: 3,019 per 100,000 population (all ages). The new STI diagnosis rate is strongly influenced by diagnoses of chlamydia, the most prevalent STI. Research has found that, when compared to all other ethnic groups, there were no unique clinical or behavioural factors explaining the disproportionately high rates of STI diagnoses among people of Black Caribbean ethnicity; this ethnic disparity in STIs is likely influenced by underlying socioeconomic factors and the role they play in the structural determinants of the health of this community (7).
The mixed ethnic group is affected by health inequalities in relation to STIs in ways similar to those experienced by Black ethnic groups. The new STI diagnosis rate for this group in 2024 was 2,201 per 100,000 population (all ages). This was the second highest of 10 ethnic group-specific rates but the number of new STI diagnoses was 4% lower than in 2023. This ethnic group makes up around 6% of London’s population. It accounted for 9% of consultations at SHSs and 10% of new STI diagnoses in 2024. The mixed and other ethnic groups are particularly heterogenous and trends for these groups should be interpreted with caution as they are sensitive to changes in the groups’ composition.
The Other White ethnic group is often grouped with the White British group into a single White ethnic group but, in London, differs from this group markedly. In 2024, it had the fourth highest new STI diagnosis rate at 1,774 per 100,000 population (all ages) and the highest rates for syphilis (87) and gonorrhoea (628). The number of new STI diagnoses was 6% lower than in 2023. This ethnic group makes up around 17% of London’s population. It accounted for 21% of consultations at SHSs and 24% of new STI diagnoses in 2024.
Compared to Londoners belonging to other ethnic groups diagnosed with a new STI in 2024, Londoners belonging to the Other White ethnic group were less likely to be aged 15 to 24 years than any other ethnic group (14%) and more likely to be male (77%). In addition, 86% were born abroad. Only the Chinese ethnic group (87%) had a higher proportion. Around 80% of men in this ethnic group diagnosed with a new STI in 2024 were reported to be GBMSM. Again, only the Chinese ethnic group had a higher proportion of diagnoses in men that were reported to be in GBMSM (86%). The most frequently reported world region of birth for Londoners in the Other White ethnic group who were born abroad was Europe excluding the UK (69% of those born abroad) and around 13% of those born abroad had been born in Latin America.
Relationships between ethnic group and world region of birth are complex. This may be particularly true for those born in Latin America. In 2024, 45% of London residents born in Latin America, diagnosed with a new STI, identified themselves as belonging to the Other White ethnic group, 26% to the other ethnic group and 24% to the mixed ethnic group.
It is also worth noting that the White British ethnic group remained the largest ethnic group, accounting for 35% of consultations and 29% of new STIs and making up 37% of the population of London.
Implications for prevention
STI prevention efforts should include a range of measures. Proactive culturally competent and evidence-based health promotion and high-quality health education improve risk awareness and encourage safer sexual behaviour and more frequent testing. Consistent and correct condom use substantially reduces the risk of contracting and transmitting an STI. Vaccination reduces the risk of being infected with certain infections, for example HPV and hepatitis B. STI testing, open access to SHSs for rapid diagnosis and treatment with robust contact tracing, allows earlier diagnosis and treatment and reduces the length of time that people can transmit STIs to others. Such measures need to be effectively commissioned, including targeting programmes and resources at those groups highlighted above who have the greatest sexual health needs.
Established HIV prevention activities may also impact on wider STI control. The London HIV Prevention Programme (LHPP) promotes combined prevention choices for Londoners (8) and was able to support the mpox outbreak response. An England-wide HIV Prevention Programme runs campaigns to improve knowledge, understanding and interventions among populations most at-risk of HIV in England, particularly aimed at GBMSM and people of Black ethnicity and other groups in whom there is a higher or newly increasing burden of infection (7).
Access to services
Following a rapid expansion during the COVID-19 pandemic, London residents continue to access the majority of their sexual health consultations online. However, different population groups access services differently. Heterosexuals, particularly men, access a higher proportion of their sexual health service consultations online than GBMSM. Since 2019, the largest proportional increase in the number of consultations has been in GBMSM and the smallest proportional increase has been in heterosexual men. The post-pandemic bounce back in the number of consultations has been smaller for younger compared to older age groups. Service providers will be aware that the impact of changes in consultation medium differs by sexual orientation and age group, and it remains important to understand whether the changes in how people use services have affected the equity of access to needed services (9, 10).
The lower STI test positivity seen since the pandemic, despite the recovering in STI testing rates, may reflect additional testing in lower risk groups who are less likely to test positive but may also indicate barriers to testing for some individuals resulting in missing diagnoses.
STI prevention and health promotion
STI prevention and health promotion for younger age groups remain a priority. Implementation of good quality evidenced-based Relationship Education in primary schools, as well as inclusive Relationships, Sex and Health Education (RSHE) in all secondary schools is important to support young people with the information and skills they need to prepare to look after their sexual health before sexual debut and beyond. This is particularly true for young people who belong to groups most impacted by sexual health inequalities (11, 12, 13).
Many areas in England, including London, continue to provide schemes which distribute condoms to young people (mostly under 20 years of age) and other groups most at risk through a variety of outlets via the C-Card scheme (14) and condoms are provided free from sexual health clinics for all ages. However, the evidence suggests that most of those who register with the C-Card scheme do not go on to become repeat users (15). Easy access to condoms for everyone without barriers can encourage consistent use.
The National HPV Vaccination Programme introduced vaccination against HPV, the virus which causes genital warts, for children aged 12 to 13 years (for girls in 2008 and for boys in 2019). Prior to the pandemic the programme achieved high coverage in girls and was successful in producing a long-term decline in genital warts in those aged 15 to 19 years. However, vaccination was disrupted by the pandemic, with low coverage in 2019 to 2020 and has still to return to the pre-pandemic levels (16). An additional HPV vaccination programme for GBMSM via SHSs and HIV clinics was introduced in 2018 (17). This group will have benefited less from the years when the childhood HPV vaccination programme was female-only (18).
The National Chlamydia Screening Programme (NCSP) is also targeted at young people. In June 2021, the NCSP changed to focus on reducing reproductive harm of untreated infection primarily in young women (19) and programmes are recommended to achieve the new Detection Rate Indicator (DRI) in order to do so. It is of concern that the detection rate for London remains considerably below the level aimed for by the NCSP.
Black ethnic groups continue to be affected by health inequalities, including in relation to sexual health, with Black Caribbeans particularly affected. Priorities and areas for action that have been identified for Black Caribbean communities include: building trust in a context of historical and ongoing health inequalities, raising awareness among Black Caribbean communities about how STIs are prevented, transmitted, diagnosed and treated and how to improve sexual wellbeing, using multiple channels, brands and influencers that are familiar, relatable and trusted by the target audience; workforce training and development ensuring that services are equipped to provide non-judgmental, empathetic and culturally competent approaches to sexual health care; encouraging ongoing collaboration with local partners and ensuring that community members are involved in the design and delivery of sexual health promotion and sexual health interventions (20).
As GBMSM continue to experience high rates of STIs they remain a priority for targeted STI prevention and culturally appropriate health promotion beyond HIV prevention, including full immunisation against hepatitis A, hepatitis B, HPV and mpox.
The Joint Committee on Vaccination and Immunisation (JCVI) has introduced a targeted vaccination programme for gonorrhoea in SHSs using 4CMenB vaccine (21, 22).
There is a continued need to strengthen public health measures to reduce transmission of syphilis across London. National clinical guidelines recommend frequent testing in GBMSM at higher risk (23), but surveillance data has suggested that this is not uniformly occurring, especially in GBMSM living with HIV. There have also been concerns about poor knowledge and awareness of syphilis among GBMSM (24). The Syphilis Action Plan includes recommendations to address the increase in syphilis in England (25). The UKSHA has also worked with the British Association for Sexual Health and HIV (BASHH) on the UK’s first national guideline for the use of doxycycline post-exposure prophylaxis (doxyPEP) for the prevention of syphilis (26).
The continued rise in shigella infections in 2025, among presumptive GBMSM, to levels much higher than observed pre-pandemic is concerning. This rise, in the context of reports of extensively drug-resistant infection (27), necessitates a continued focus on culturally competent harm reduction messages for GBMSM regarding the practice of good hygiene during and after sex and the recognition of symptoms (28).
UKHSA’s main messages
Commissioners and providers of Sexual Health Services (SHSs) have an important role in communicating messages about safer sexual behaviours and how to access services. The main prevention messages and programmes include:
- using condoms consistently and correctly protects against HIV and other STIs such as chlamydia, gonorrhoea, and syphilis – condoms can also be used to prevent unplanned pregnancy
- regular screening for STIs and HIV is essential to maintain good sexual health – everyone should have an STI screen, including an HIV test, on at least an annual basis if having condomless sex with new or casual partners, and in addition –
- women, and other people with a womb and ovaries, aged under 25 years who are sexually active should have a chlamydia test annually and on change of sexual partner
- gay, bisexual and other men who have sex with men (GBMSM) should have tests for HIV and STIs annually or every 3 months if having condomless sex with new or casual partners
- doxycycline post-exposure prophylaxis (doxyPEP) is recommended to people at risk of syphilis to reduce their risk of infection – doxyPEP is available at specialist SHSs
- HIV pre-exposure prophylaxis (PrEP) is available for free from specialist SHSs and can be used to reduce an individual’s risk of acquiring HIV
- HIV post-exposure prophylaxis (PEP) can be used to reduce the risk of acquiring HIV following some sexual exposures – PEP is available for free from most specialist SHSs and most emergency departments
- people living with diagnosed HIV who are on treatment and have an undetectable viral load are unable to pass on the infection to others during sex – this is known as ‘Undetectable=Untransmittable’ or ‘U=U’
- vaccinations are available which will protect against disease caused by some organisms and prevent the spread of these infections –
- GBMSM can obtain the hepatitis A and hepatitis B vaccines from specialist SHSs – these vaccines are also available for other people at high risk of exposure to the viruses
- GBMSM aged up to and including 45 years can obtain the HPV vaccine from specialist SHSs
- GBMSM who have a recent history of multiple sexual partners or an STI and other high-risk groups are eligible for a meningococcal B disease vaccine (4CMenB) which can protect against gonorrhoea and help tackle the increasing levels of antibiotic-resistant strains of the disease
- mpox vaccination is available for those at increased risk, including GBMSM who have a recent history of multiple sexual partners
- routine childhood vaccination (hepatitis B and HPV), including catchup for those who have missed vaccinations at school, is important in preventing STIs
- specialist SHSs are free and confidential and offer testing and treatment for HIV and STIs, condoms, vaccination, HIV PrEP and PEP –
- clinic-based services are commissioned for residents of all areas in England
- online self-sampling for HIV and STIs is widely available
- information and advice about sexual health, including how to access services, is available at Sexual health services and from the national sexual health helpline on 0300 123 7123
Charts, tables and maps
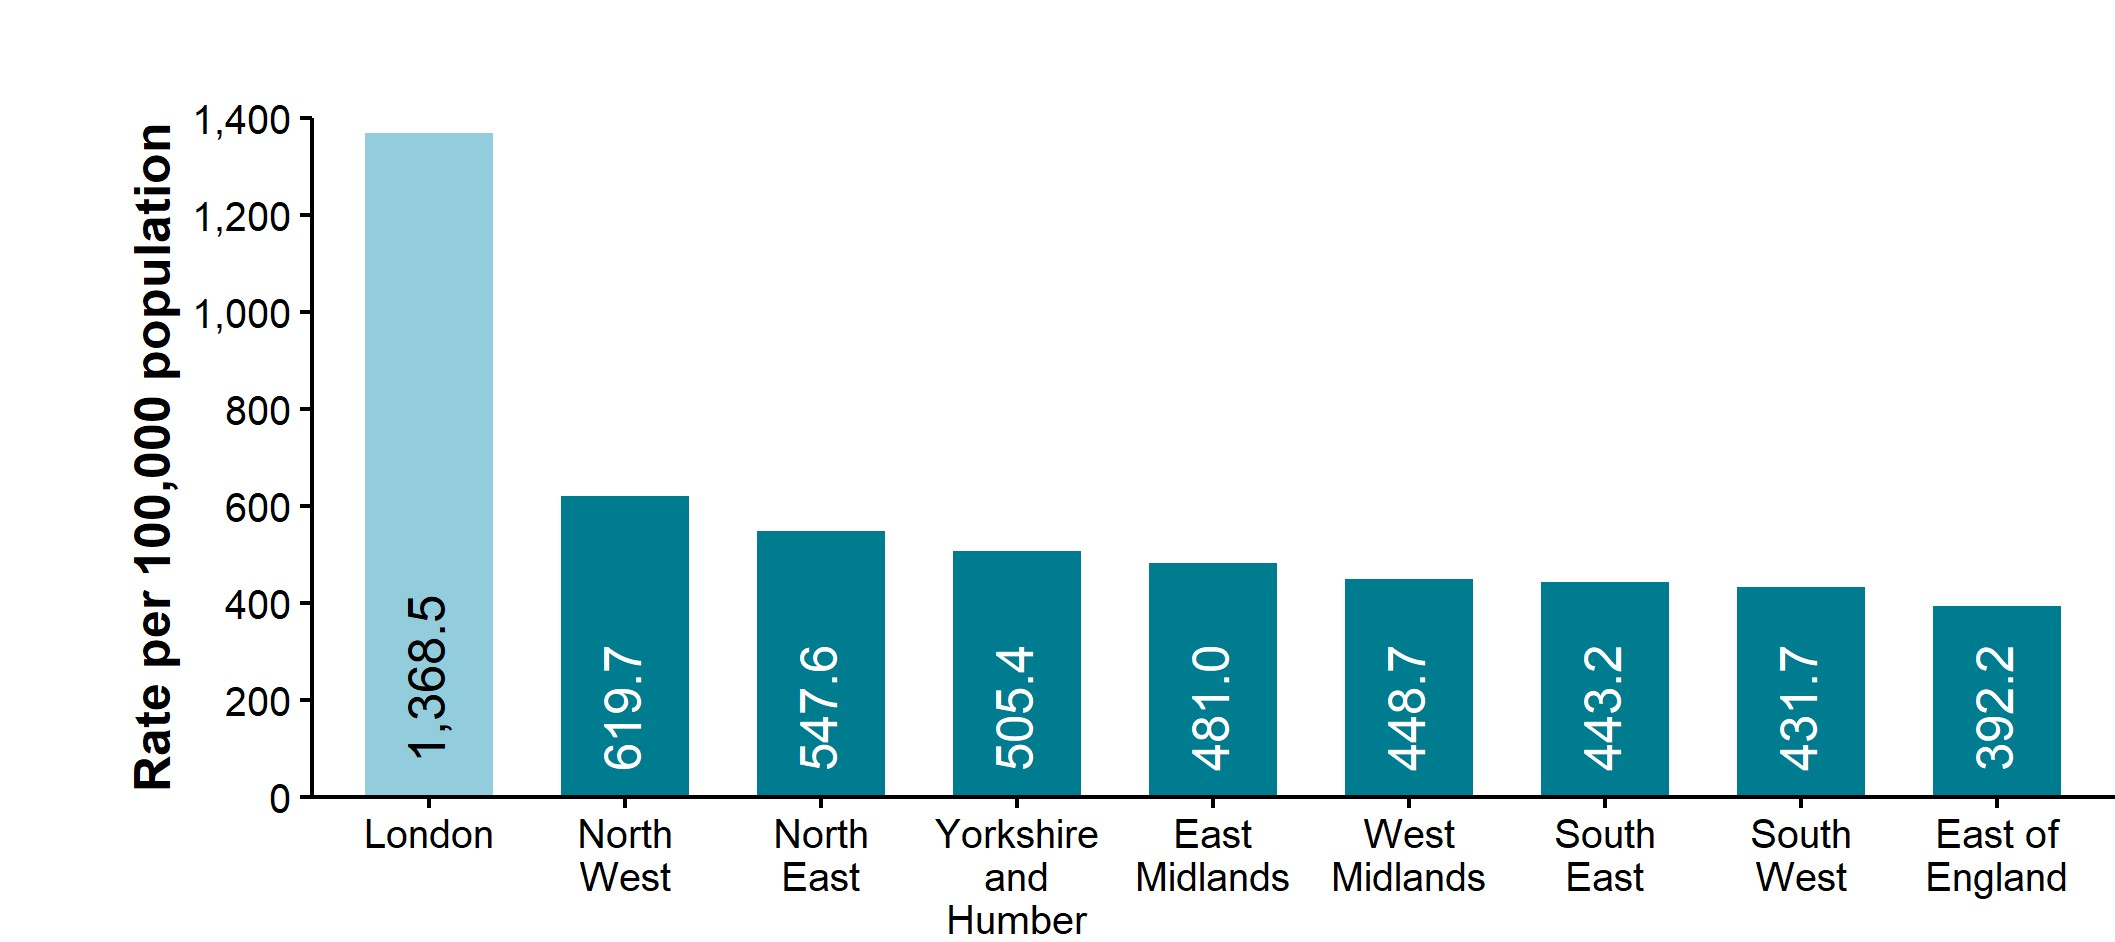
Figure 1. New STI diagnosis rates by UKHSA region of residence, England, 2024
Data sources: GUMCAD, CTAD
Figure 1 is a column chart showing new STI diagnosis rates by English region for the year 2024. Rates are per 100,000 population and are not age-restricted or adjusted.
The chart shows that London not only had the highest new STI diagnosis rate of all English regions (1,369) but that its rate was more than twice that of the region with the next highest rate (the North West with 620). The London rate was, however, 4% lower than in 2023 (1,422).
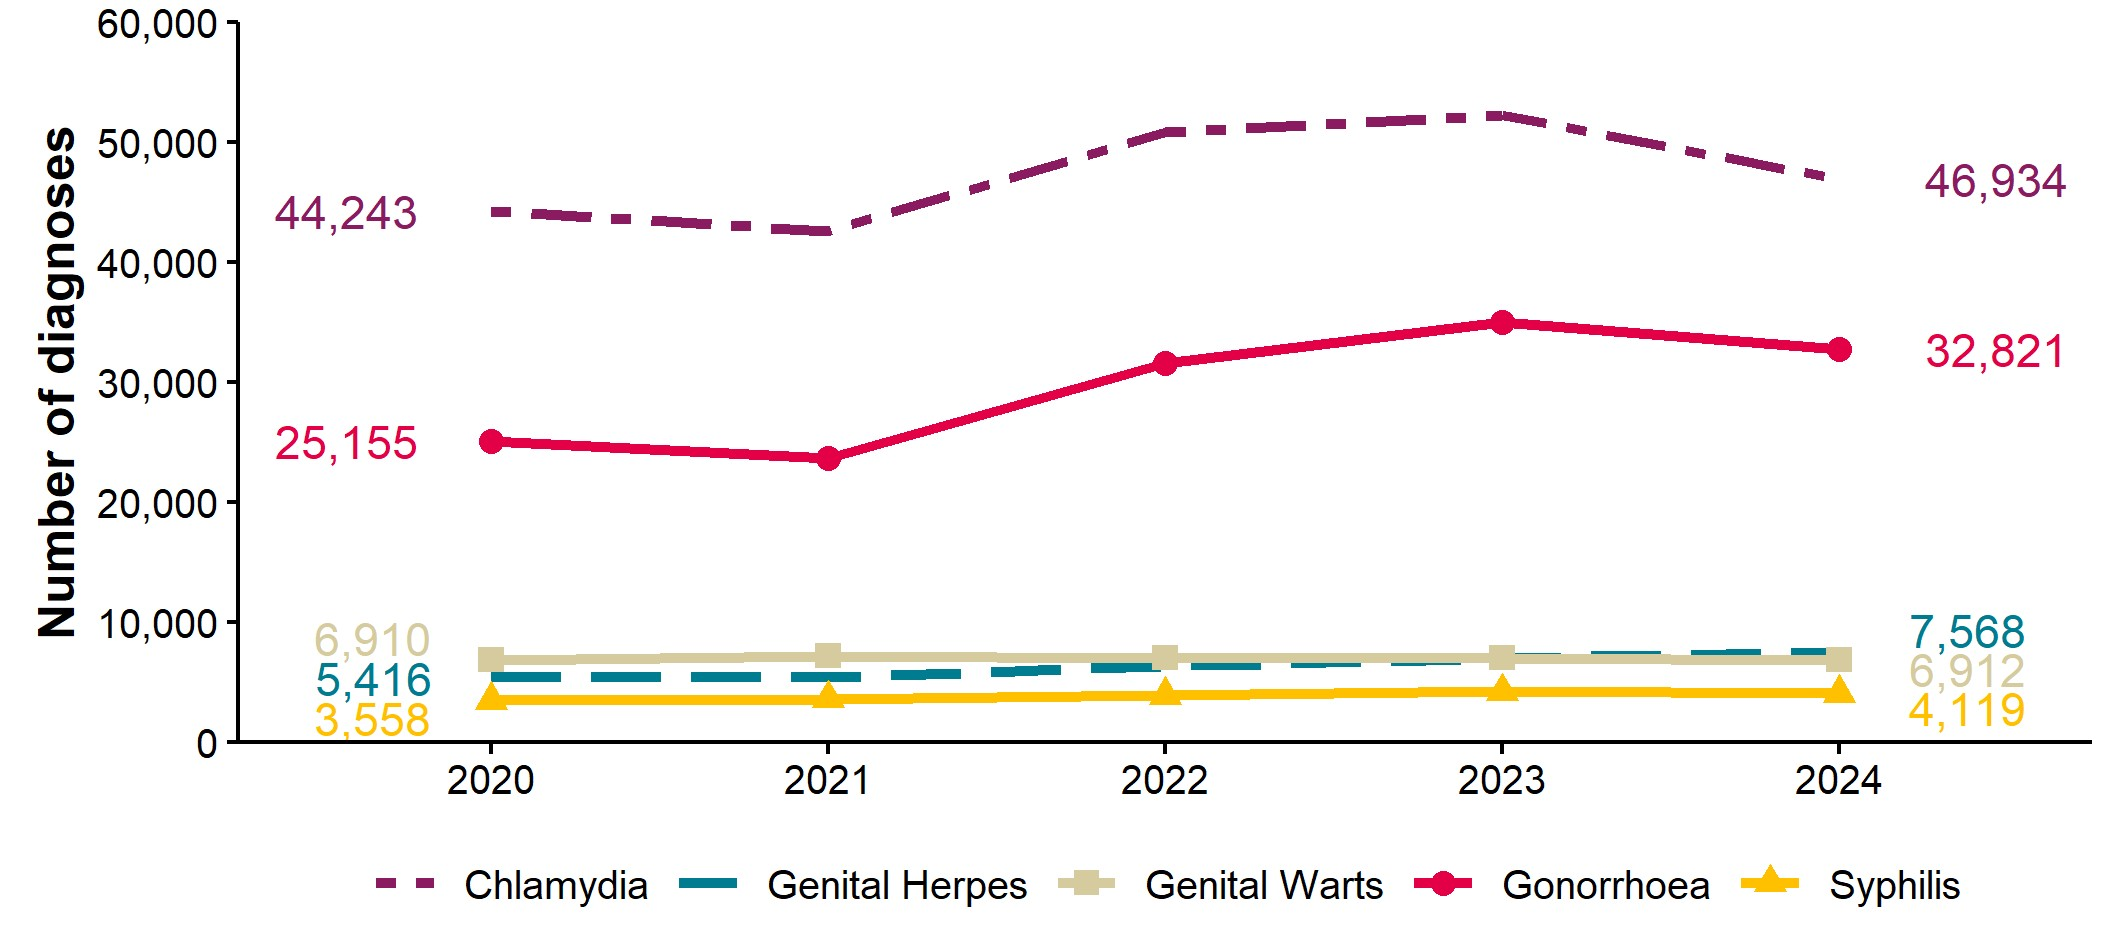
Figure 2. Number of diagnoses of the 5 main STIs, London residents, 2020 to 2024
Data sources: GUMCAD, CTAD
Note 1: It is important to consider whether there have been any changes to testing or vaccination practices when interpreting increases or decreases in STIs:
Note 2: Any increase in gonorrhoea diagnoses may be due to the increased use of highly sensitive nucleic acid amplification tests (NAATs) and additional screening of extra-genital sites in GBMSM.
Note 3: Any decrease in genital wart diagnoses may be due to a moderately protective effect of HPV-16/18 vaccination.
Note 4: Any increase in genital herpes diagnoses may be due to the use of more sensitive NAATs.
Increases or decreases may also reflect changes in testing practices.
Figure 2 is a line chart showing trends in the diagnoses of the 5 main STIs (syphilis, gonorrhoea, chlamydia, genital herpes and genital warts) in London residents from 2020 to 2024. The chart shows chlamydia (46,934 diagnoses) as the top line of the chart, which reflects the fact that this is the most prevalent STI in the general population. Diagnoses of all the 5 main STIs were higher than in 2020. However, 2020 was the main COVID-19 pandemic year with restricted social mixing and reduced access to services. Using 2019 instead as the comparison year, diagnoses of chlamydia, genital herpes and genital warts were all lower in 2024 while diagnoses of syphilis were 6% higher and diagnoses of gonorrhoea were 1% higher.
Table 1. Percentage change in new STI diagnoses, London residents
| Diagnoses | 2024 | Percentage change 2019 to 2024 | Percentage change 2020 to 2024 | Percentage change 2023 to 2024 |
|---|---|---|---|---|
| Chlamydia | 46,934 | −28% | +6% | −10% |
| Genital Herpes | 7,568 | −17% | +40% | +8% |
| Genital Warts | 6,912 | −43% | 0% | −2% |
| Gonorrhoea | 32,821 | +1% | +30% | −6% |
| M. genitalium | 3,766 | +44% | +88% | +9% |
| Syphilis | 4,119 | +6% | +16% | −4% |
| Trichomoniasis | 3,774 | −7% | +79% | +13% |
| All new STIs | 122,420 | −19% | +20% | −4% |
Data sources: GUMCAD, CTAD
See notes for Figure 2. See section 3.3 for a list of diagnoses that are included in the other STIs.
Table 1 summarises the changes seen in the previous 2 charts. It is especially useful for less common STIs such as syphilis as changes for these can be hard to see in charts which are scaled to include infections with much higher numbers, such as chlamydia. The table shows the number of diagnoses of new STIs and each of the 5 main STIs for London residents in 2024. Three columns follow this one. The first shows percentage change from 2019 (the last pre-pandemic year) to 2024, the second shows percentage change from 2020 (the first year in the five-year trend chart), while the third shows percentage change from 2023 to 2024. The comparison with 2019 has been added because of the distorting effects of comparisons with a year when disruptions to social mixing and service access led to a sudden and temporary reduction in diagnoses.
Different patterns are seen for different STIs. For syphilis, we see an increase whether 2019 or 2020 is compared, albeit much smaller if the former. However, there was a decrease of 4% in 2024 compared to the previous year, 2023. For gonorrhoea, there is a similar pattern with increases of 1% (compared to 2019) and 30% (compared to 200) but a decrease of 6% compared to 2023. These are both bacterial STIs of particular concern as they are often linked with higher risk sexual behaviours and dense sexual networks.
Numbers of chlamydia diagnoses were lower in 2024 compared to any of the 3 comparison years, with a 10% decrease compared to 2023. By contrast, diagnoses of genital herpes, although 17% lower compared to 2019 and 40% lower compared to 2020, rose by 8% when compared to 2023. Large increases were seen for M. genitalium and trichomoniasis, but these should be interpreted in the context of changes in testing and awareness.
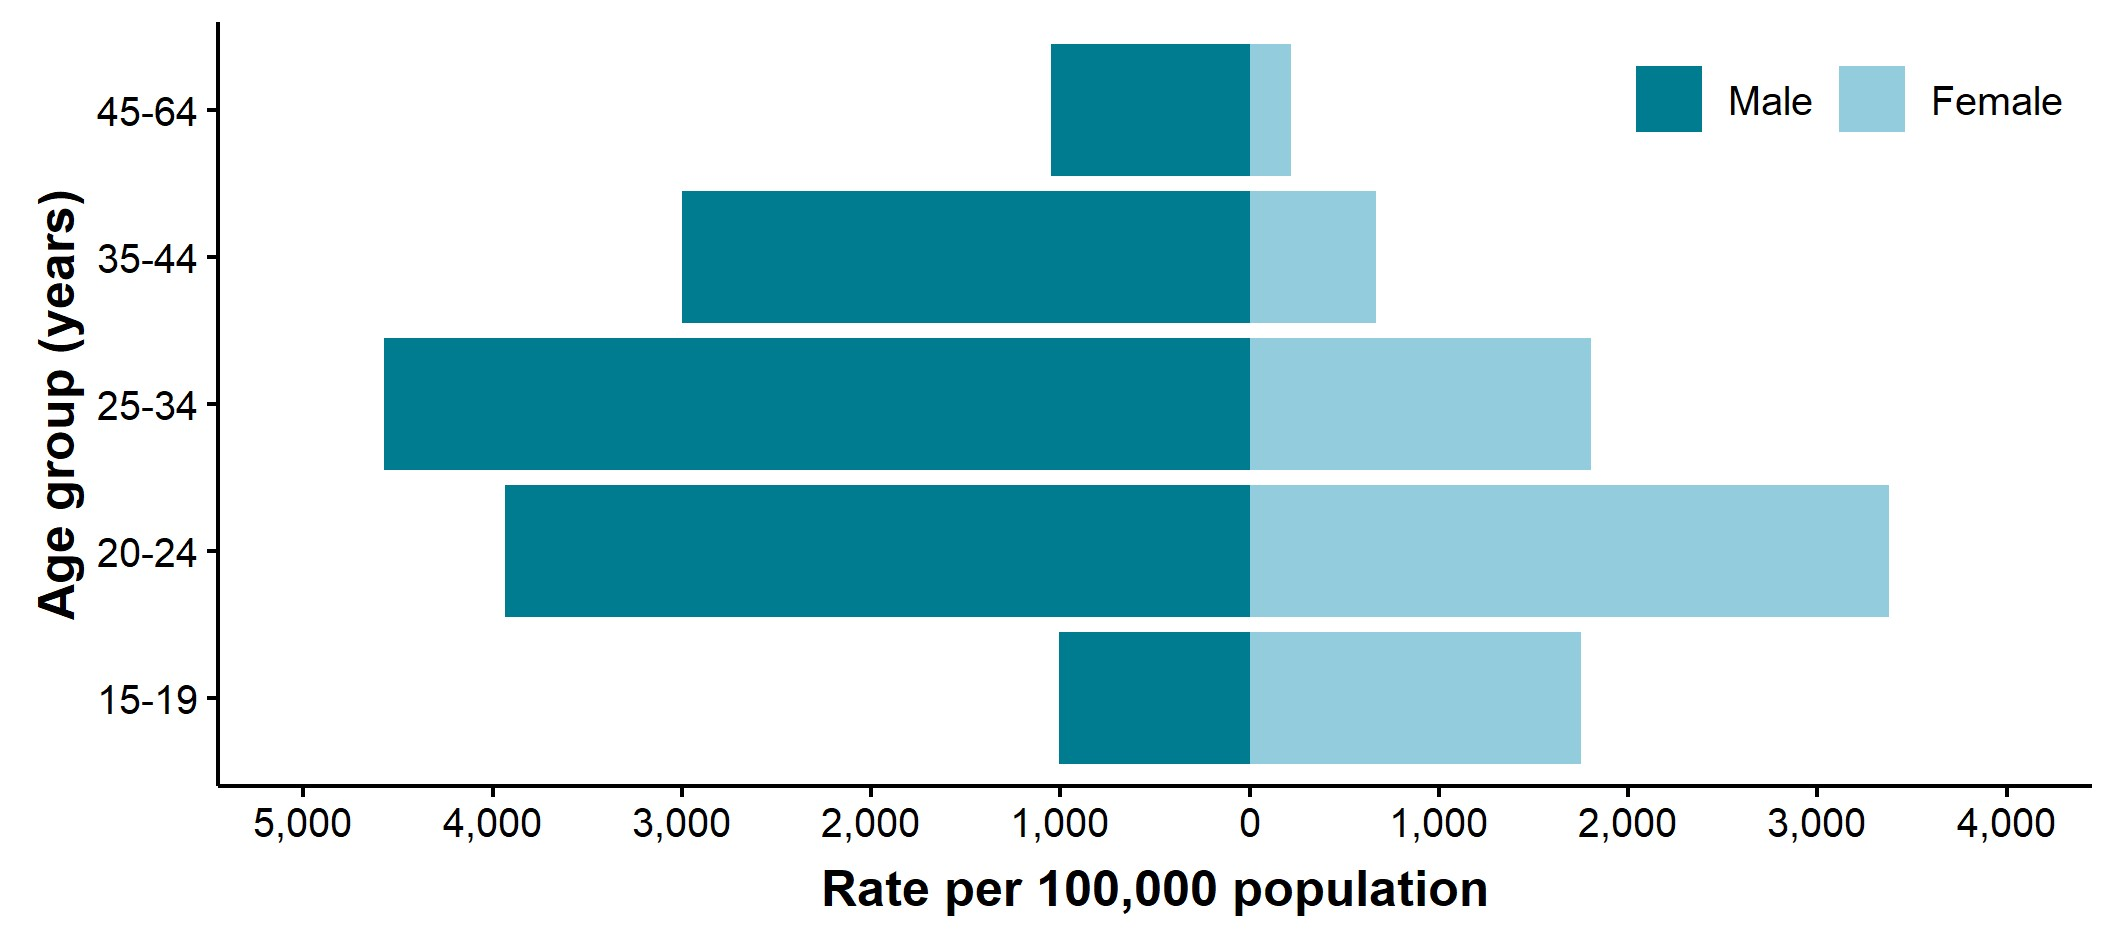
Figure 3. Rates of new STIs per 100,000 London residents by age group (for those aged 15 to 64 years only) and gender, 2024
Data sources: GUMCAD, CTAD
Figure 3 is a pyramid chart which shows rates of new STIs by age group and gender in 2024. Rates are by 100,000 population in each age group for each gender and only Londoners aged 15 to 64 years are included. This reflects the sensitivity of data relating to those aged less than 15 years and the need to prevent the disclosure of small numbers.
The distribution of rates by age and gender in 2024 was skewed towards females in the youngest age group (15- to 19-year-olds), was similar for both males and females for 20- to 24-year-olds and was increasingly skewed towards males in age groups for those aged 25 years and above. The highest rate for women was 3,379 (20-to-24-year age group) while the highest rate for men was 4,573 (25-to-34-year age group).
The shape of this age and gender pyramid does not tend to change significantly over time and is dominated by diagnoses of chlamydia, the most common STI in the UK. Age-gender pyramids for specific STIs other than chlamydia may have different contours, for example the equivalent pyramid for syphilis is very strongly skewed towards males and is skewed towards older ages, while the pyramid for trichomoniasis is skewed towards females.
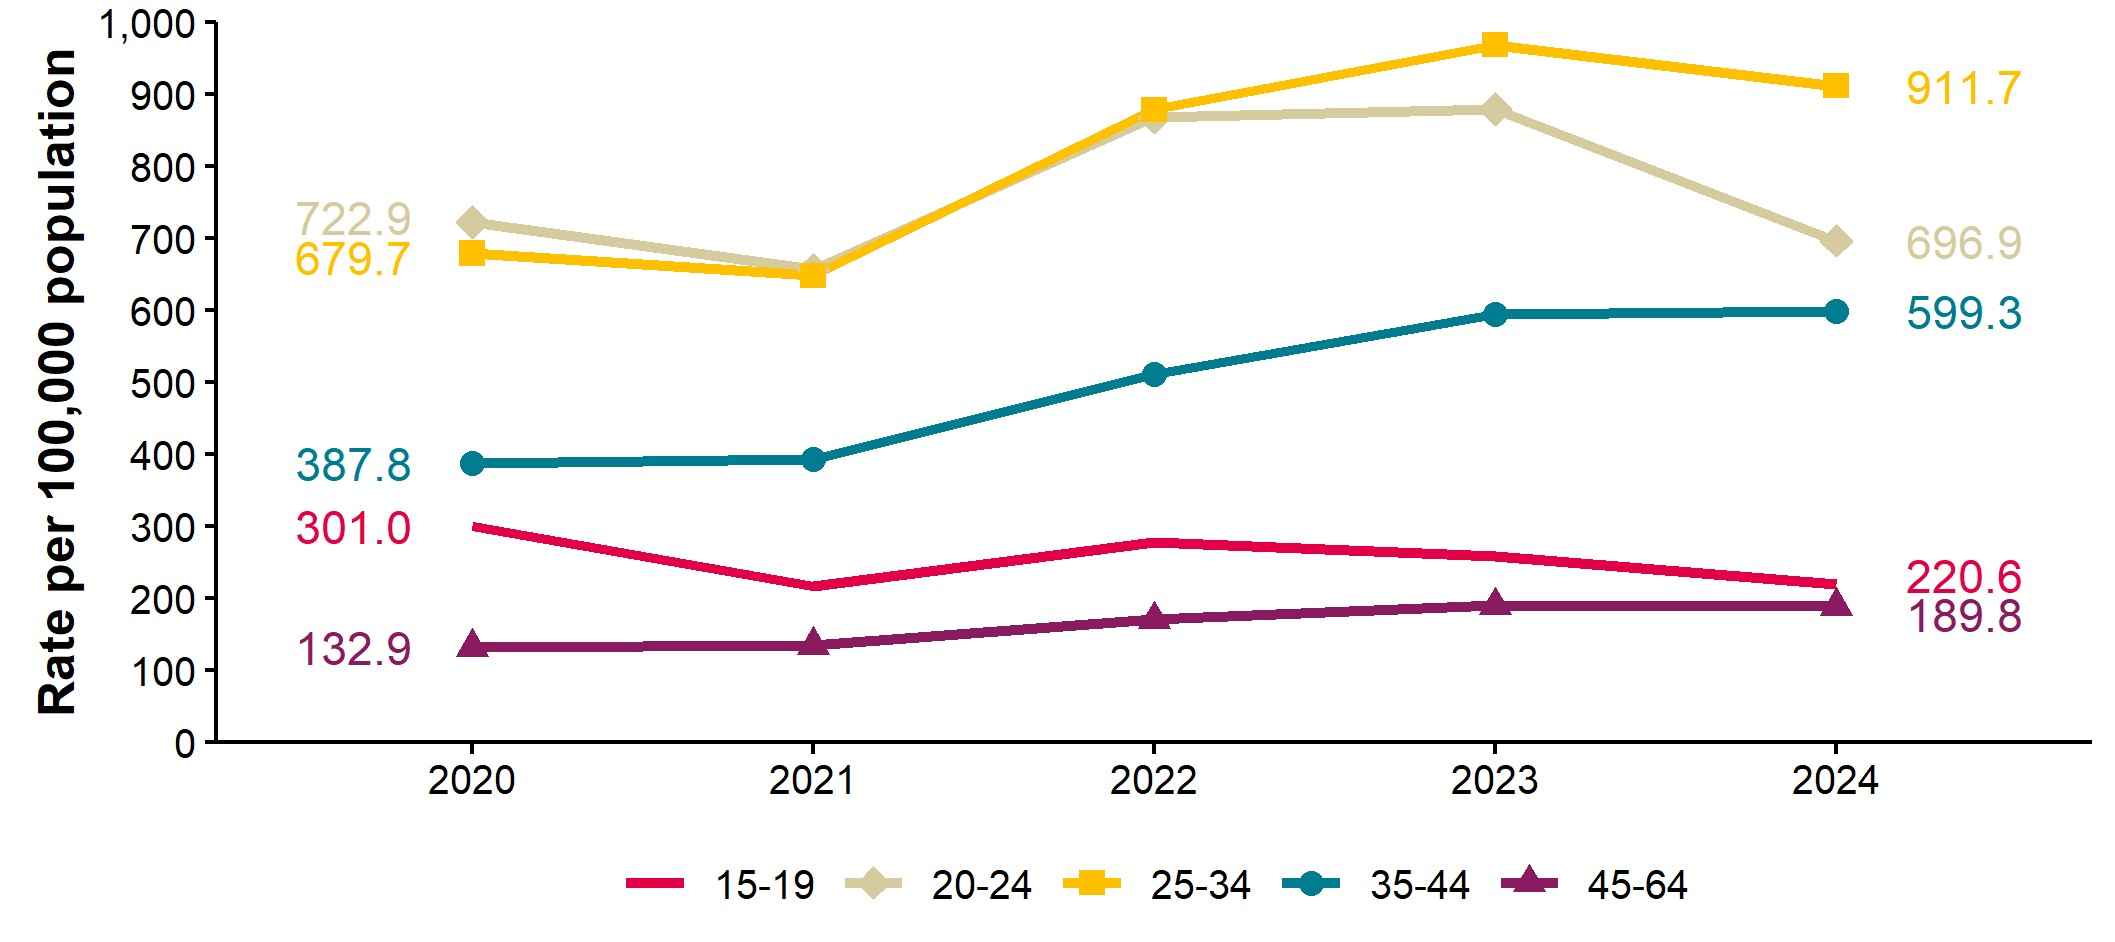
Figure 4. Rates of gonorrhoea per 100,000 London residents by age group [note] (for those aged 15 to 64 years only), 2020 to 2024
Data sources: GUMCAD
Note: Age-specific rates are shown for those aged 15 to 64 years only.
Figure 4 is a line chart showing trends by gonorrhoea diagnosis rate by age group in London residents for the years 2020 to 2024. Rates are per 100,000 population for each age group. As with the previous chart, only Londoners aged 15 to 64 years are included. Over the past 5 years, rates in those aged 25 to 34 years have overtaken rates in those aged 20 to 24 years, with rates in the 25-to-34-year age group rising to 912 in 2024, while rates in those aged 20 to 24 were 697.
Rates for other age groups were much lower. The rate for the youngest age group, the 15- to 19-year-olds, fell most during the pandemic. It has still not recovered and at 221 is less than half the equivalent rate in 2019 (the last pre-pandemic year). Similar trends have been seen in consultations. Younger age groups appear to have been more impacted by disruptions to service access and opportunities for social contact during the COVID-19 pandemic, compared to older age groups.
These trends are currently affected by the COVID-19 pandemic dip in diagnoses (2020 to 2021). However, the pattern of continued depression in rates for younger age groups and rises in older age groups holds even when a comparison is done with 2019.
Gonorrhoea is the second most common STI in the UK, accounting for 27% of new STIs diagnosed in London residents in 2024. It is caused by the bacterium Neisseria gonorrhoeae. Symptoms vary and in some people (particularly women) may be absent. For those who do become symptomatic, symptoms normally start to show about 2 weeks after infection but in some cases may take months to appear (29). Gonorrhoea can still be transmitted even when a person has no symptoms. If untreated it can lead to complications, including fertility problems for women (30) Cases of gonorrhoea where the organism is resistant to antibiotics have become increasingly common (31).
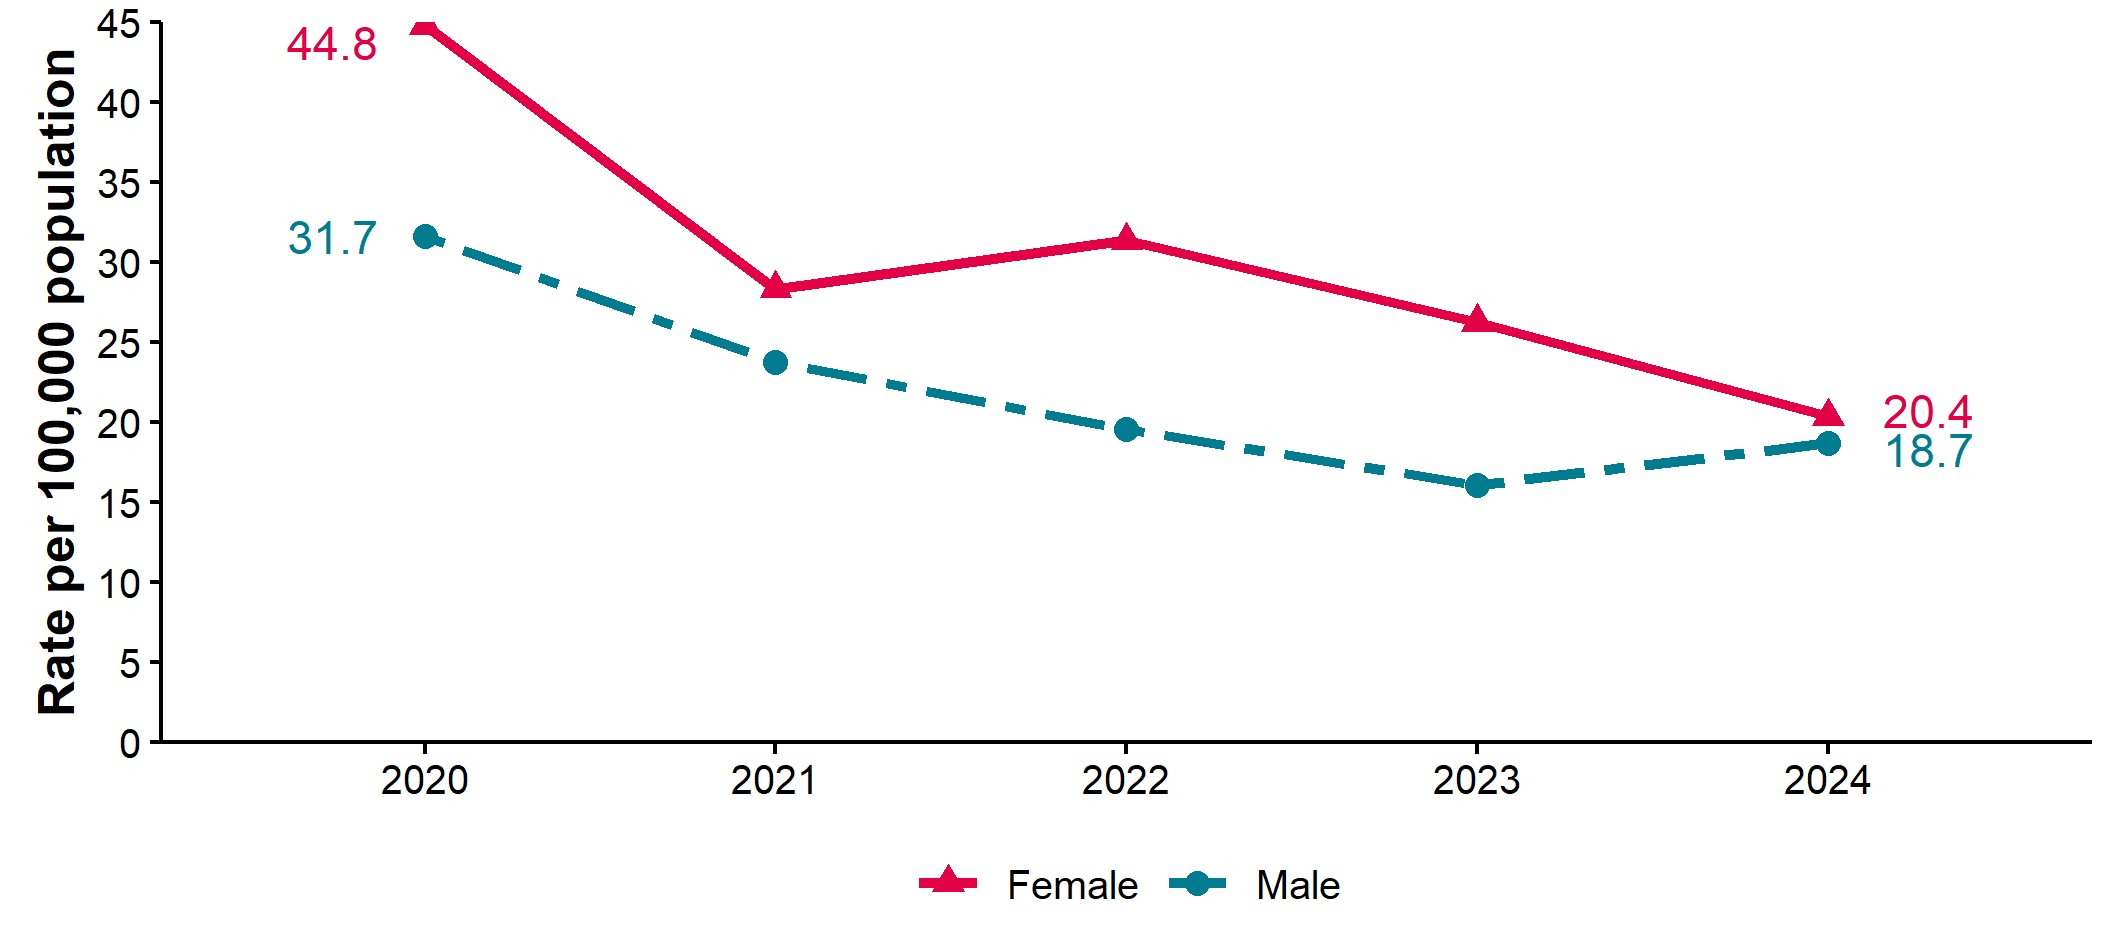
Figure 5. Rates of genital warts per 100,000 London residents aged 15 to 19 years by gender, 2020 to 2024
Data sources: GUMCAD
Figure 5 is a line chart showing trends in diagnosis rates of genital warts by gender for London residents aged 15 to 19 years over the years 2020 to 2024. For girls, following a small rise in 2022, the rate has resumed a downward trend, reaching 20 diagnoses per 100,000 girls aged 15 to 19 years in 2024. By contrast, the rate for boys aged 15 to 19 years rose slightly in 2024 to 19 diagnoses per 100,000 boys aged 15 to 19 years.
Genital warts are small, rough lumps which form around the genital area and anus. This STI is caused by the human papillomavirus (HPV), a virus which can also cause cancer. It can take from a few weeks to several months for warts to appear after infection. People without symptoms can still pass the virus on (32).
The trend seen in the chart needs to be understood within the context of a sustained steep decline in rates over a decade to 2019, following the introduction of the HPV vaccination programme for children aged 12 to 13 years (for girls in 2008 and for boys in 2019). In 2014 the equivalent rates were 372 for girls and 145 for boys.
Disruptions to the HPV vaccination programme are known to have occurred during the COVID-19 pandemic (2020 to 2021) and there may have been underdiagnosis during that period due to restricted access to services. In addition, numbers of consultations in the 15-to-19-year age group have yet to return to pre-pandemic levels, so there is a possibility that for this age group underdiagnosis continues to be an issue.
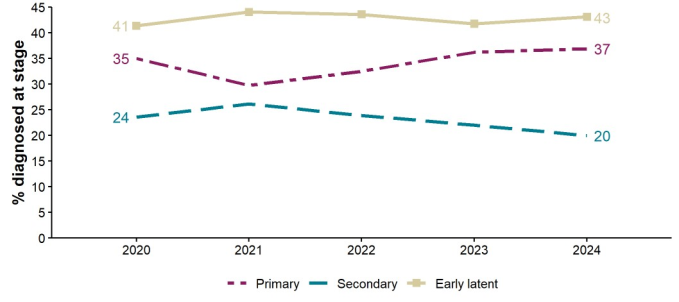
Figure 6. Syphilis diagnoses by percentage clinical stage: London residents, 2020 to 2024
Data sources: GUMCAD
Figure 6 is a line chart showing trends in diagnoses of infectious syphilis by clinical stage at diagnosis for London residents over the years 2020 to 2024. The first and final years are labelled with the percentage of the total the stage accounts for.
The chart shows that the proportion of diagnoses made at the early latent stage have increased slightly from 41% (1,472 diagnoses) of the total in 2020 to 43% (1,776) of the total in 2024. The decline in primary syphilis diagnoses seen during the pandemic years (2020 to 2021) has reversed. The proportion of primary syphilis diagnoses in 2024 was 37% (1,520) up from 35% (1,247) in 2020. Secondary syphilis diagnoses have declined slightly. This stage accounted for 20% (823) of syphilis diagnoses in 2024, down from 24% (839) in 2020.
Syphilis is caused by the bacterium Treponema pallidum. It is primarily sexually transmitted but can also be transmitted from mother to baby during pregnancy or childbirth. As shown in the chart, it is an STI with multiple clinical stages. Primary syphilis describes the first stage after diagnosis which lasts around 21 days during which the person will develop a hard sore or chancre, usually in the genital area or near the anus. Secondary syphilis describes the stage that syphilis progresses to if not treated at the primary stage. Rashes and lesions develop at this stage. The next stage, latent syphilis, often has no symptoms, but will eventually, over a period of years, progress without treatment to tertiary syphilis (not shown in the chart above) which involves serious health complications and may cause death. Late latent and tertiary syphilis are not infectious apart from, rarely, from mother to baby. It should be noted that the classification of syphilis diagnoses by clinical stage can be challenging and some diagnoses may be misclassified (33, 34).
The dip in primary syphilis diagnoses seen during the pandemic years (2020 to 2021) may reflect a combination of behavioural change (due to decreased opportunities for social mixing) and reduced access to services, leading to delays in diagnosis.
Differences in trends by clinical stage were seen by gender and sexual orientation and, as GBMSM account for 81% of diagnoses, the overall trend is dominated by the trend for this group, which was the one most affected by the pandemic dip in primary syphilis diagnoses (followed by resurgence). Heterosexual men continued to be the only group for which this stage was the most common stage at diagnosis (53% of syphilis diagnoses in 2020 and 45% in 2024). Heterosexual and bisexual women by contrast had the highest proportion of syphilis diagnoses made at the early latent stage with this stage accounting for 52% of diagnoses in 2024 and 48% in 2020.
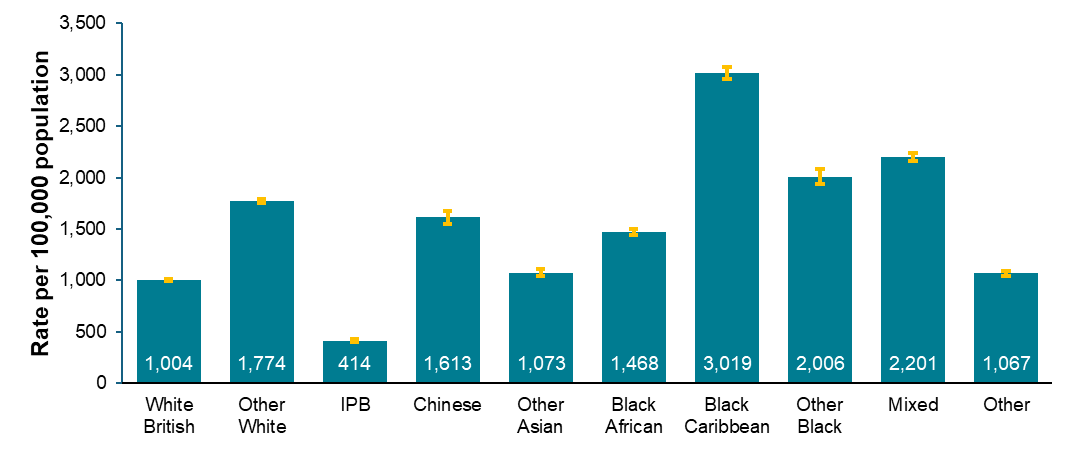
Figure 7. Rates of new STIs per 100,000 London residents by ethnic group, 2024
Data sources: GUMCAD, CTAD
Figure 7 is a column chart showing rates of new STI diagnoses by ethnic group among London residents in 2024. The chart shows that the Black Caribbean ethnic group had the highest new STI diagnosis rate with 3,019 per 100,000 population. The next highest rates were those for the mixed ethnic group (2,201) and Other Black ethnic group (2,006). The ethnic groups with the lowest rates were the Indian, Pakistani and Bangladeshi (IPB) group (414), White British group (1,004) and Other ethnic group (1,067). The largest increase compared to 2023 was seen for the IPB ethnic group (a 10% rise), whilst the largest decrease was seen for the White British group (a 6% fall).
Rates are for all ages. Age distributions will differ by ethnic group with the White British group having the oldest age distribution which will depress its rate as numbers of STI diagnoses in the oldest age groups are low. Groups containing larger numbers of migrants tend to have younger age distributions, although this is sensitive to the migration pattern for each ethnic group over time and to changes in self-identification. Identification with an ethnic group may also vary by context.
Ethnic group should not be interpreted as a proxy for world region of birth. Forty-three percent of Londoners in the IPB ethnic group and 45% of those in the Black African ethnic group diagnosed with a new STI in 2024 were born in the UK, while for other groups the proportion was even higher: 55% for the mixed group, 72% for the Other Black group and 78% for Black Caribbeans.
Other important determinants, such as deprivation and issues of stigma, also vary by ethnic group. Ethnic group specific rates should always be interpreted in the wider context of determinants and never in isolation.
In addition, differences are seen when ethnic group specific rates are calculated for specific STIs. The Other White ethnic group has the highest rate for both gonorrhoea and syphilis for example.
People’s sexual networks tend to contain more people of the same or similar ethnic group and a person’s risk of acquiring an STI is affected by the prevalence of STIs within their sexual network. However, the groups shown are relatively broad and some are more heterogenous than others.
The other and mixed ethnic groups are extremely heterogenous, and their composition will vary at a local level and over time. At a regional level, 30% of Londoners in the other ethnic group and diagnosed with a new STI in 2024 were born in Latin America, 23% in the UK, 18% in the Middle East or Central Asia and 10% in the European Union (EU). Forty-three percent of those in the mixed ethnic group were described as having ‘any other mixed background’, while 31% were described as having a mixed White and Black Caribbean background, 14% a mixed White and Black African background and 12% a mixed White and Asian background.
Table 2. Percentage of new STI diagnoses among London residents by ethnic group, 2024
| Ethnic group | Number | Percentage (excluding unknown) |
|---|---|---|
| White British | 32,509 | 29% |
| Other White | 26,462 | 24% |
| IPB [note] | 5,257 | 5% |
| Chinese | 2,380 | 2% |
| Other Asian | 4,307 | 4% |
| Black African | 10,233 | 9% |
| Black Caribbean | 10,427 | 9% |
| Other Black | 2,927 | 3% |
| Mixed | 11,130 | 10% |
| Other | 5,940 | 5% |
| Unknown | 10,848 |
Data sources: GUMCAD, CTAD
Note: IPB = Indian, Pakistani and Bangladeshi
Table 2 summarises the number of new STI diagnoses by ethnic group and the percentage that each group made up of all new STI diagnoses in 2024 where ethnic group is known. White ethnic groups accounted for 53% of new STI diagnoses (58,971 diagnoses), with the White British group making up the first 29% (32,509) and the Other White other group the remaining 24% (26,462). Asian ethnic groups accounted for 11% of new STI diagnoses (11,944), Black ethnic groups for 21% (23,587), the mixed ethnic group for 10% (11,130) and the heterogenous other group for 5% (5,940).
There has been little change in the distribution of new STI diagnoses by ethnic group over the past 5 years.
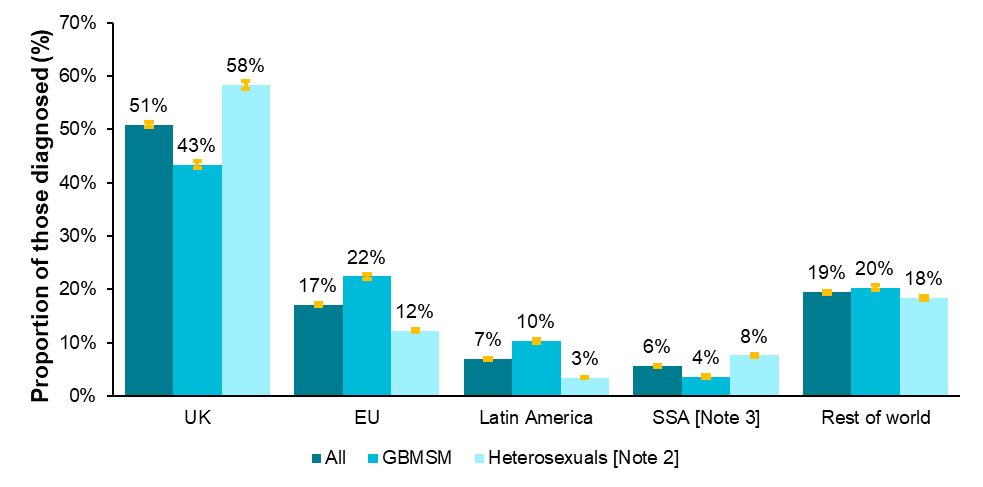
Figure 8. Percentage of London residents diagnosed with a new STI by world region of birth [note 1], 2024
Data sources: GUMCAD data only
Note 1: Data on country of birth is not collected by CTAD. All information about world region of birth is based on diagnoses made in specialist and non-specialist services which report to GUMCAD.
Note 2: For this chart ‘heterosexuals’ includes heterosexual men and heterosexual or bisexual women.
Note 3: SSA = Sub-Saharan Africa
Figure 8 is a column chart showing the proportion of London residents who were diagnosed with a new STI in 2024 by their world region of birth. Additional columns show these proportions for GBMSM and for heterosexuals. This chart is based only on diagnoses reported to GUMCAD as CTAD, the dataset which reports data about community tests and diagnoses of chlamydia, does not collect information about country of birth. The proportions are calculated using all GUMCAD new STI diagnoses where country of birth was reported, apart from chlamydia, for which only diagnoses at specialist SHSs are included.
The chart shows that over half of Londoners diagnosed with a new STI in 2024 were born in the UK (56%) with the next most common world region of birth being the European Union (EU) at 17%. These proportions have remained relatively stable over the period 2019 to 2024.
Variation was seen by sexual orientation. For example, GBMSM Londoners diagnosed with a new STI were more likely to be born in the EU (22%) or Latin America (10%) compared to heterosexual men and heterosexual or bisexual women while heterosexual men and heterosexual or bisexual women were more likely than GBMSM to be born in the UK (58%) or Sub-Saharan Africa (8%).
London is a global city (35) with large communities of people born outside the UK, in Europe or in populous world regions such as Latin America and Sub-Saharan Africa. It has the highest proportion of people born abroad of any city in the UK (36). Migrants are more likely than non-migrants to be working-age adults, rather than older adults, who tend to have a lower incidence of STIs. It is essential to consider the size of a community and its distributions by gender and age when interpreting the proportion of diagnoses in people belonging to that community.
Figure 9. Rates of new STIs per 100,000 London residents by decile of deprivation [note], 2024
Data sources: GUMCAD, CTAD
Note: Deciles run from 1 to 10 in order of decreasing deprivation, with 1 being the decile for the most deprived area.
Figure 9 is a column chart which shows the new STI diagnosis rate by 100,000 population for each decile of deprivation in 2024. Deciles run from 1 to 10 in order of decreasing deprivation and are calculated at the level of lower super output area (LSOA) of residence, a unit of geography containing around 1,500 residents, across England. All new STI diagnoses in London residents reported with an LSOA of residence code that could be linked to Index of Multiple Deprivation (IMD) data for 2021 are included. The rates are not adjusted for the underlying population demographics for example age distribution.
The chart shows that new STI diagnosis rates were highest in LSOAs which are linked to the decile of deprivation (1,694 per 100,000 population), then follow a declining trend before reaching 486 for the decile of lowest deprivation. Rates for each of the first 4 deciles were above the London regional rate of 1,369 and almost 73% of Londoners diagnosed with a new STI in 2024 lived in an area where deprivation was within the first 5 deciles.
Differences are apparent when these diagnoses are stratified by ethnic group, with the proportion living in areas in the first 5 deciles of deprivation lower for those reported to be White British (65%), slightly lower for those belonging to the Chinese and Other Asian ethnic groups (70% and 69%), slightly higher for those in the mixed ethnic group (76%) and higher for those belonging to Black ethnic groups (84%). Very similar proportions were seen even when these groups were further stratified by whether born in the UK. The rates in the least deprived deciles may be depressed by the tendency for more affluent areas to have older populations. However, the association between deprivation and increased health inequalities is well evidenced (37, 38).
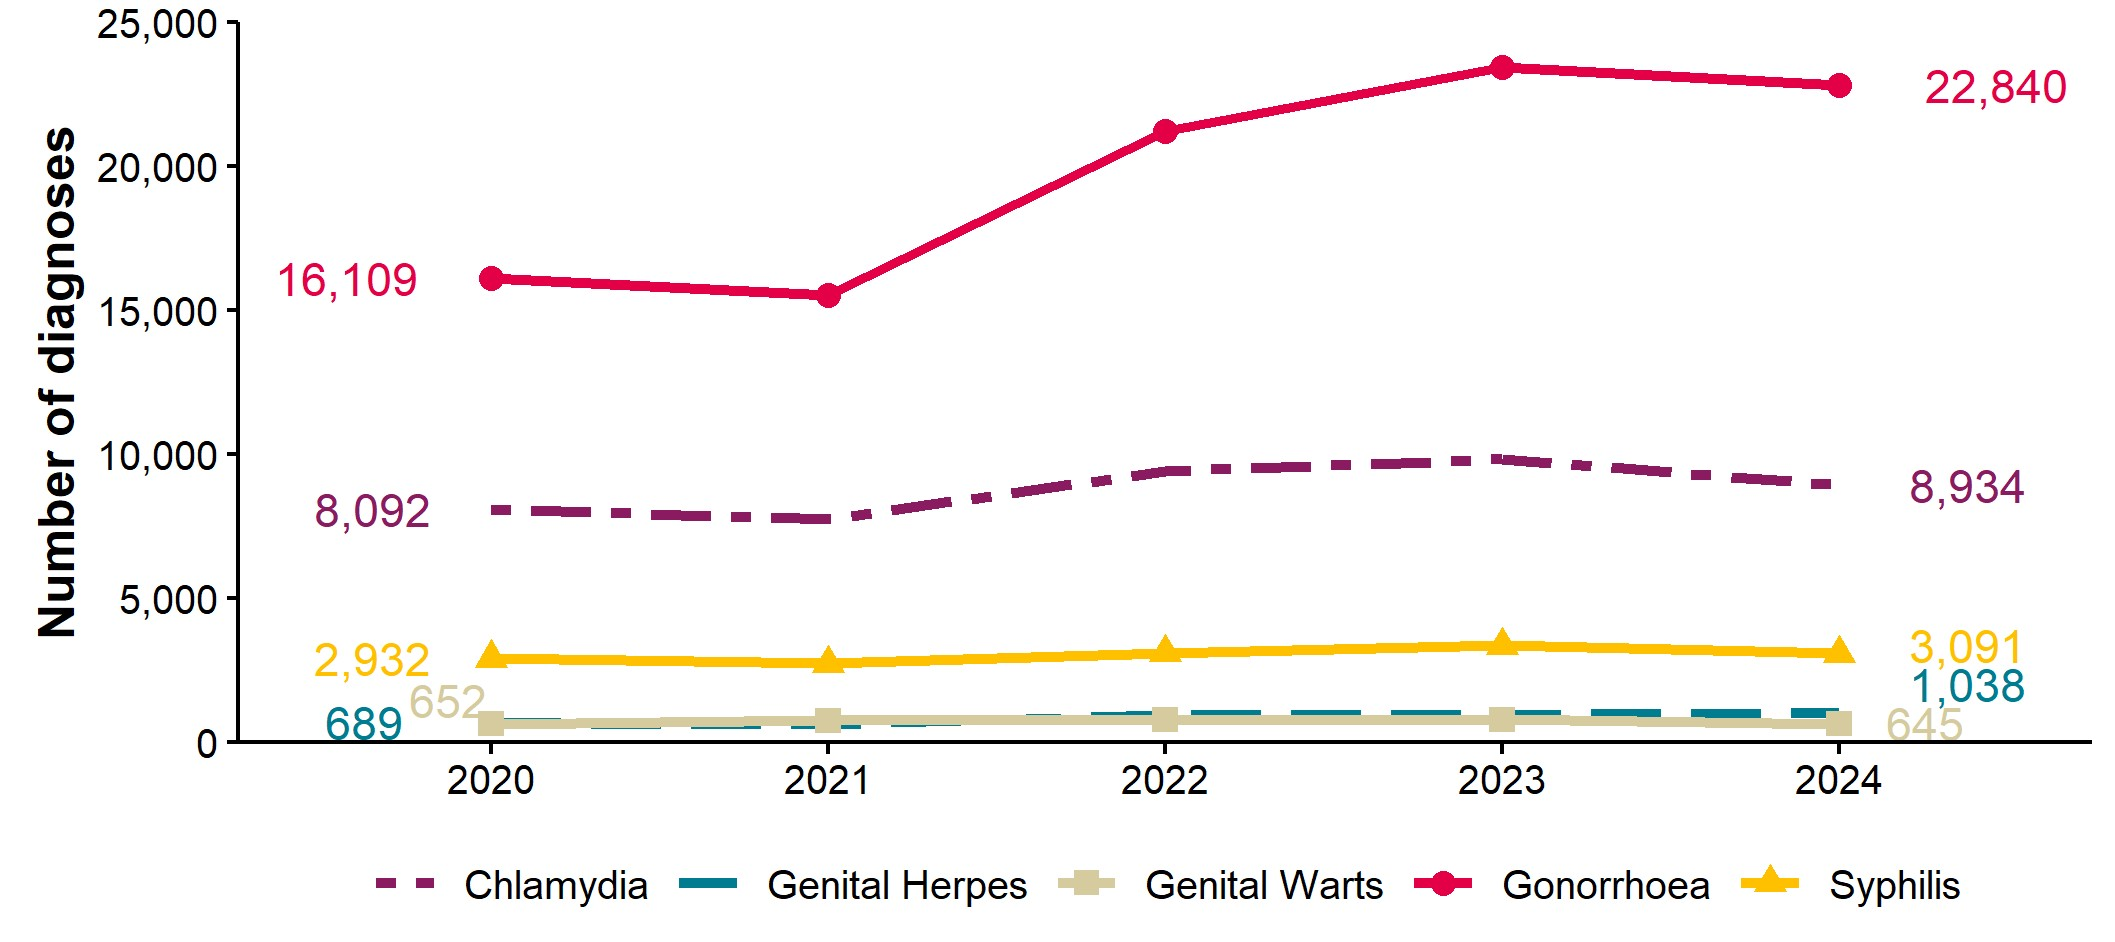
Figure 10. Diagnoses of the 5 main STIs among GBMSM [note 1], London residents, 2020 to 2024
Data sources: GUMCAD data only
Note 1: Data on sexual orientation is not collected by CTAD. All information about GBMSM is based on diagnoses made in specialist and non-specialist services which report to GUMCAD and exclude chlamydia diagnoses via online services.
Note 2: It is important to consider whether there have been any changes to testing or vaccination practices when interpreting increases or decreases in STIs:
-
increases in gonorrhoea may be due to the increased use of highly sensitive nucleic acid amplification tests (NAATs) and additional screening of extra-genital sites in GBMSM
-
decreases in genital wart diagnoses may be due to the moderately protective effect of HPV-16/18 vaccination.
Increases in genital herpes diagnoses may be due to the use of more sensitive NAATs
Figure 10 is a line chart showing trends in the diagnoses of the 5 main STIs (syphilis, gonorrhoea, chlamydia, genital herpes and genital warts) in gay, bisexual and other men who have sex with men resident in London for the period 2020 to 2024. The data comes from GUMCAD only as CTAD does not collect information on sexual orientation. It also excludes chlamydia diagnoses reported via online services due to a proportion of missing information about sexual orientation. It is important to be aware of these exclusions when interpreting the number of chlamydia diagnoses.
The chart shows that gonorrhoea (22,840 diagnoses), rather than chlamydia, remained the most prevalent STI among GBMSM in 2024. Following the main pandemic year 2020 and a further year of significant disruptions to social mixing and service access in 2021, diagnoses of the 5 main STIs in GBMSM began to rise again in 2022 and 2023. A reversal of this trend as seen in 2024 for most of the 5 main STIs (genital herpes was the exception). For gonorrhoea and genital herpes, the number of diagnoses in 2024 exceeded pre-pandemic levels.
Table 3. Percentage change in new STI diagnoses in GBMSM [note] residents in London
| Diagnoses | 2023 | 2024 | Percentage change 2023 to 2024 |
|---|---|---|---|
| Chlamydia | 9,848 | 8,934 | −9% |
| Genital Herpes | 951 | 1,038 | 9% |
| Genital Warts | 801 | 645 | −19% |
| Gonorrhoea | 23,451 | 22,840 | −3% |
| Syphilis | 3,371 | 3,091 | −8% |
| Other | 4,888 | 5,123 | 5% |
| All new STIs | 43,310 | 41,671 | −4% |
Data sources: GUMCAD data only
See notes for Figure 10. See section 3.3 for a list of diagnoses that are included in the other STIs.
Table 3 summarises the changes seen in the previous chart. The table shows the number of diagnoses of new STI and each of the 5 main STIs for GBMSM London residents in 2024. The final column shows percentage change from 2023 to 2024.
Year on year decreases were seen for 4 of the 5 major STIs, with the exception being genital herpes which increased by 9%. Genital warts saw the steepest decrease, falling by 19%.
Figure 11. Rate of new STI diagnoses per 100,000 London residents by local authority of residence, 2024
Data sources: GUMCAD, CTAD
Figure 11 is a column chart which displays the rate of new STI diagnoses in 2024 by London local authority of residence. Rates are by 100,000 population and for all ages. Local authorities are shown in descending order. The overall London rate and England rate are represented as lines.
The local authority with the highest rate was Lambeth (3,257 per 100,000). Havering had the lowest rate (500). The ordering of the local authorities reflects a tendency for inner London local authorities to have higher rates than outer London local authorities. Inner London local authorities tend to have more diverse populations, especially in relation to sexual orientation, ethnicity and country of origin, in comparison with outer London local authorities. They may also have higher socio-economic deprivation scores. Twenty-seven of London’s 33 local authorities had new STI rates that were greater than the rate for England as a whole.
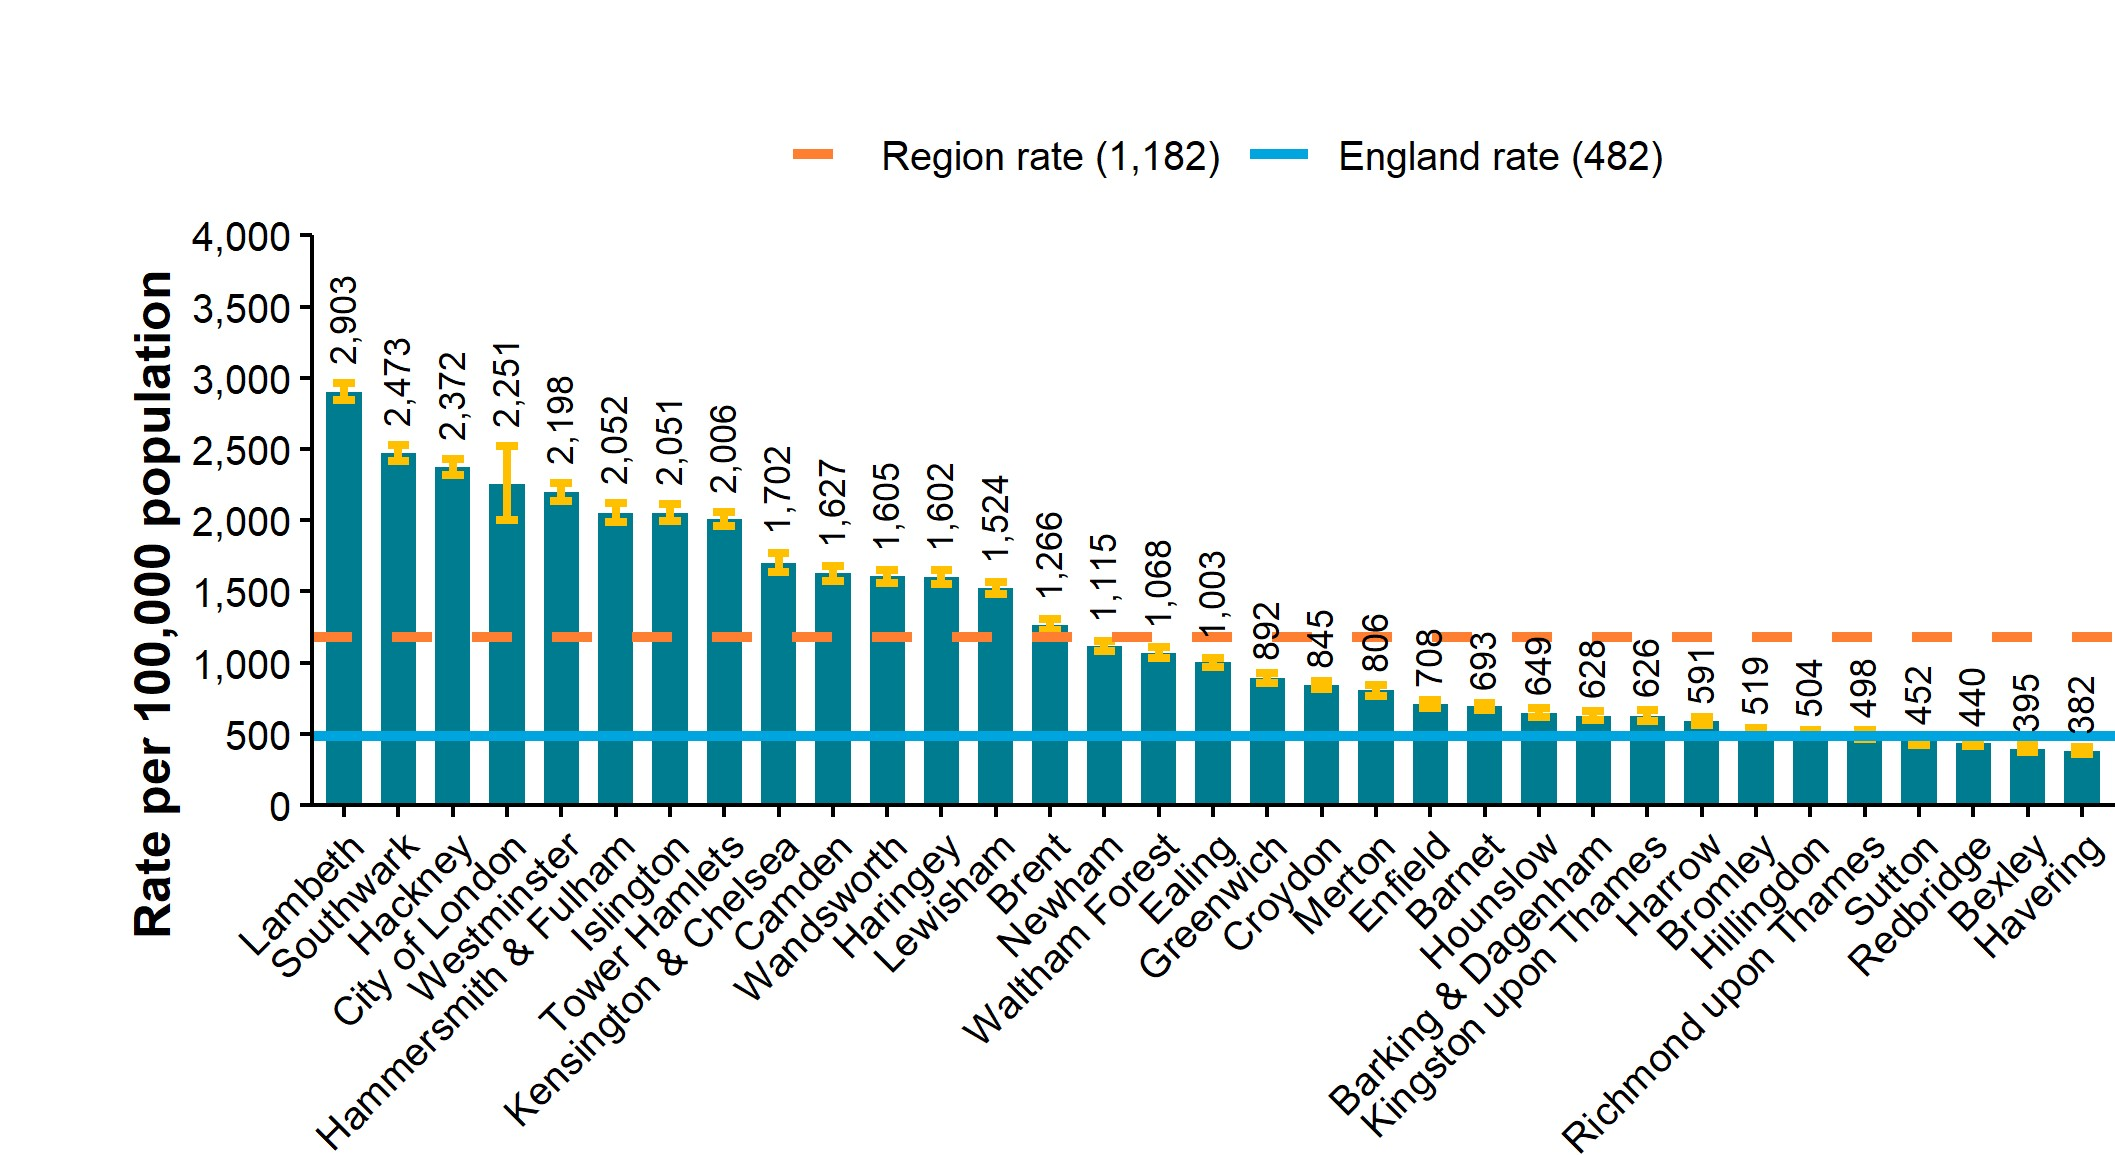
Figure 12. Rate of new STI diagnoses (excluding chlamydia diagnoses in residents aged under 25 years [note]) per 100,000 London residents by local authority of residence, 2024
Data sources: GUMCAD, CTAD
Note: Chlamydia diagnoses in the target group of the National Chlamydia Screening Programme NCSP (those aged 15 to 24 years) are excluded because these diagnoses could reflect how NCSP is implemented locally rather than actual prevalence.
Figure 12 is another column chart. Like the previous chart it displays the rate of new STI diagnoses in 2024 by London local authority, however for this version of the rate, chlamydia diagnoses in those aged less than 25 years are excluded. This is because this age group is actively targeted for screening for chlamydia. Variations in the local implementation of screening may distort the new STI rate, and removing diagnoses for the affected age group helps us address this issue. The demographic profile of the local population also needs to be considered when interpreting this chart. As with the previous chart, the London and England rates are superimposed on the chart as lines.
The ordering of local authorities is not markedly different in this version of the chart. As with the previous chart, Lambeth had the highest rate (2,903 per 100,000) and Havering the lowest (382). Twenty-nine of London’s 33 local authorities had a rate higher than that for England as a whole.
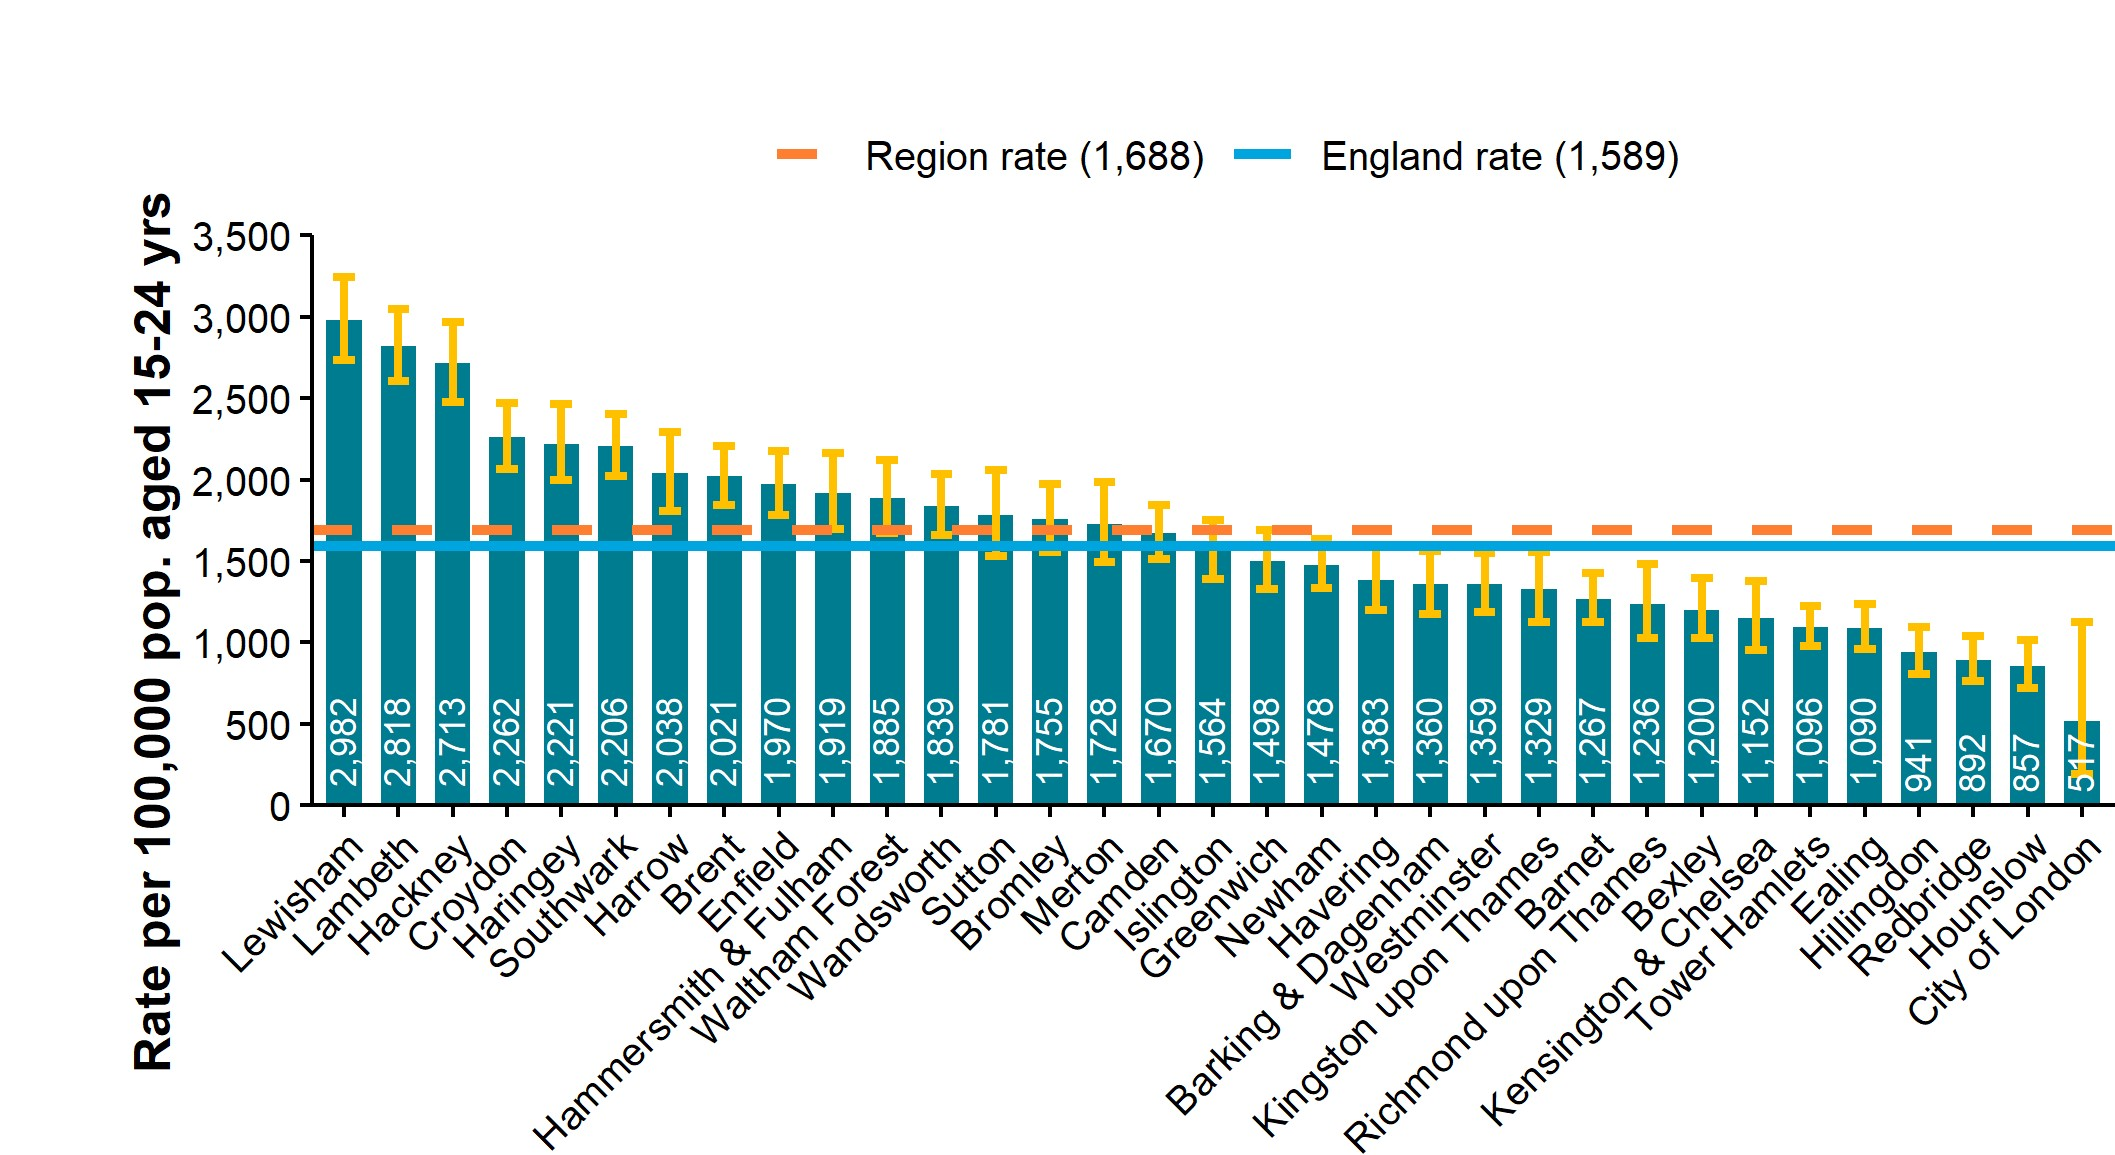
Figure 13. Chlamydia detection rate per 100,000 female London residents aged 15 to 24 years by local authority of residence, 2024
Data sources: GUMCAD, CTAD
Figure 13 is another column chart. Rates are shown in descending order as with the previous charts and show the chlamydia detection rate in 2024 for girls and women resident in London aged 15 to 24 years, the age group targeted for chlamydia screening. Rates are by 100,000 female population in this age group. Prior to 2024, STI Spotlight reports showed this rate unrestricted by gender. In June 2021 the focus of the National Chlamydia Screening Programme (NCSP) was changed to a focus on reducing the harms from untreated chlamydia infection and a new detection rate indicator (DRI) of 3,250 per 100,000 female population aged 15 to 24 years.
Although there are more inner London local authorities towards the left of the chart and more outer London local authorities towards the right, there is more geographic variation for this rate. For example, Bromley (1,755), an outer London local authority is in the middle of the chart. Lewisham had the highest chlamydia detection rate (2,982) and City of London the lowest (517).
Chlamydia detection rates for girls and women aged 15 to 24 years are tending to fall in London local authorities. The rate for London as a region was 1,688 in 2024. This is only 52% of the 3,250 DRI target and represents a fall of 52% from 3,531 in 2019, the last pre-pandemic year and of 15% from 2023. London local authorities may be displaced to the right (lower detection rate) compared to the previous chart (higher new STI rate) for a number of reasons including a higher proportion of diagnoses in GBMSM. However, it may also suggest a greater shortfall in detections for these local authorities. The demographic profile of the local population needs to be considered when interpreting this chart.
Chlamydia is the most common STI in the UK. Including diagnoses made via community screening, it accounted for 38% of new STIs diagnosed in London residents in 2024. It is particularly common in younger age groups. Most people who become infected do not have any symptoms but if symptoms do develop this can happen any time from a week to several months after infection. Untreated chlamydia infections can result in serious health problems. They may increase the risk of HIV and STI acquisition and transmission and cause fertility problems for women (39, 40).
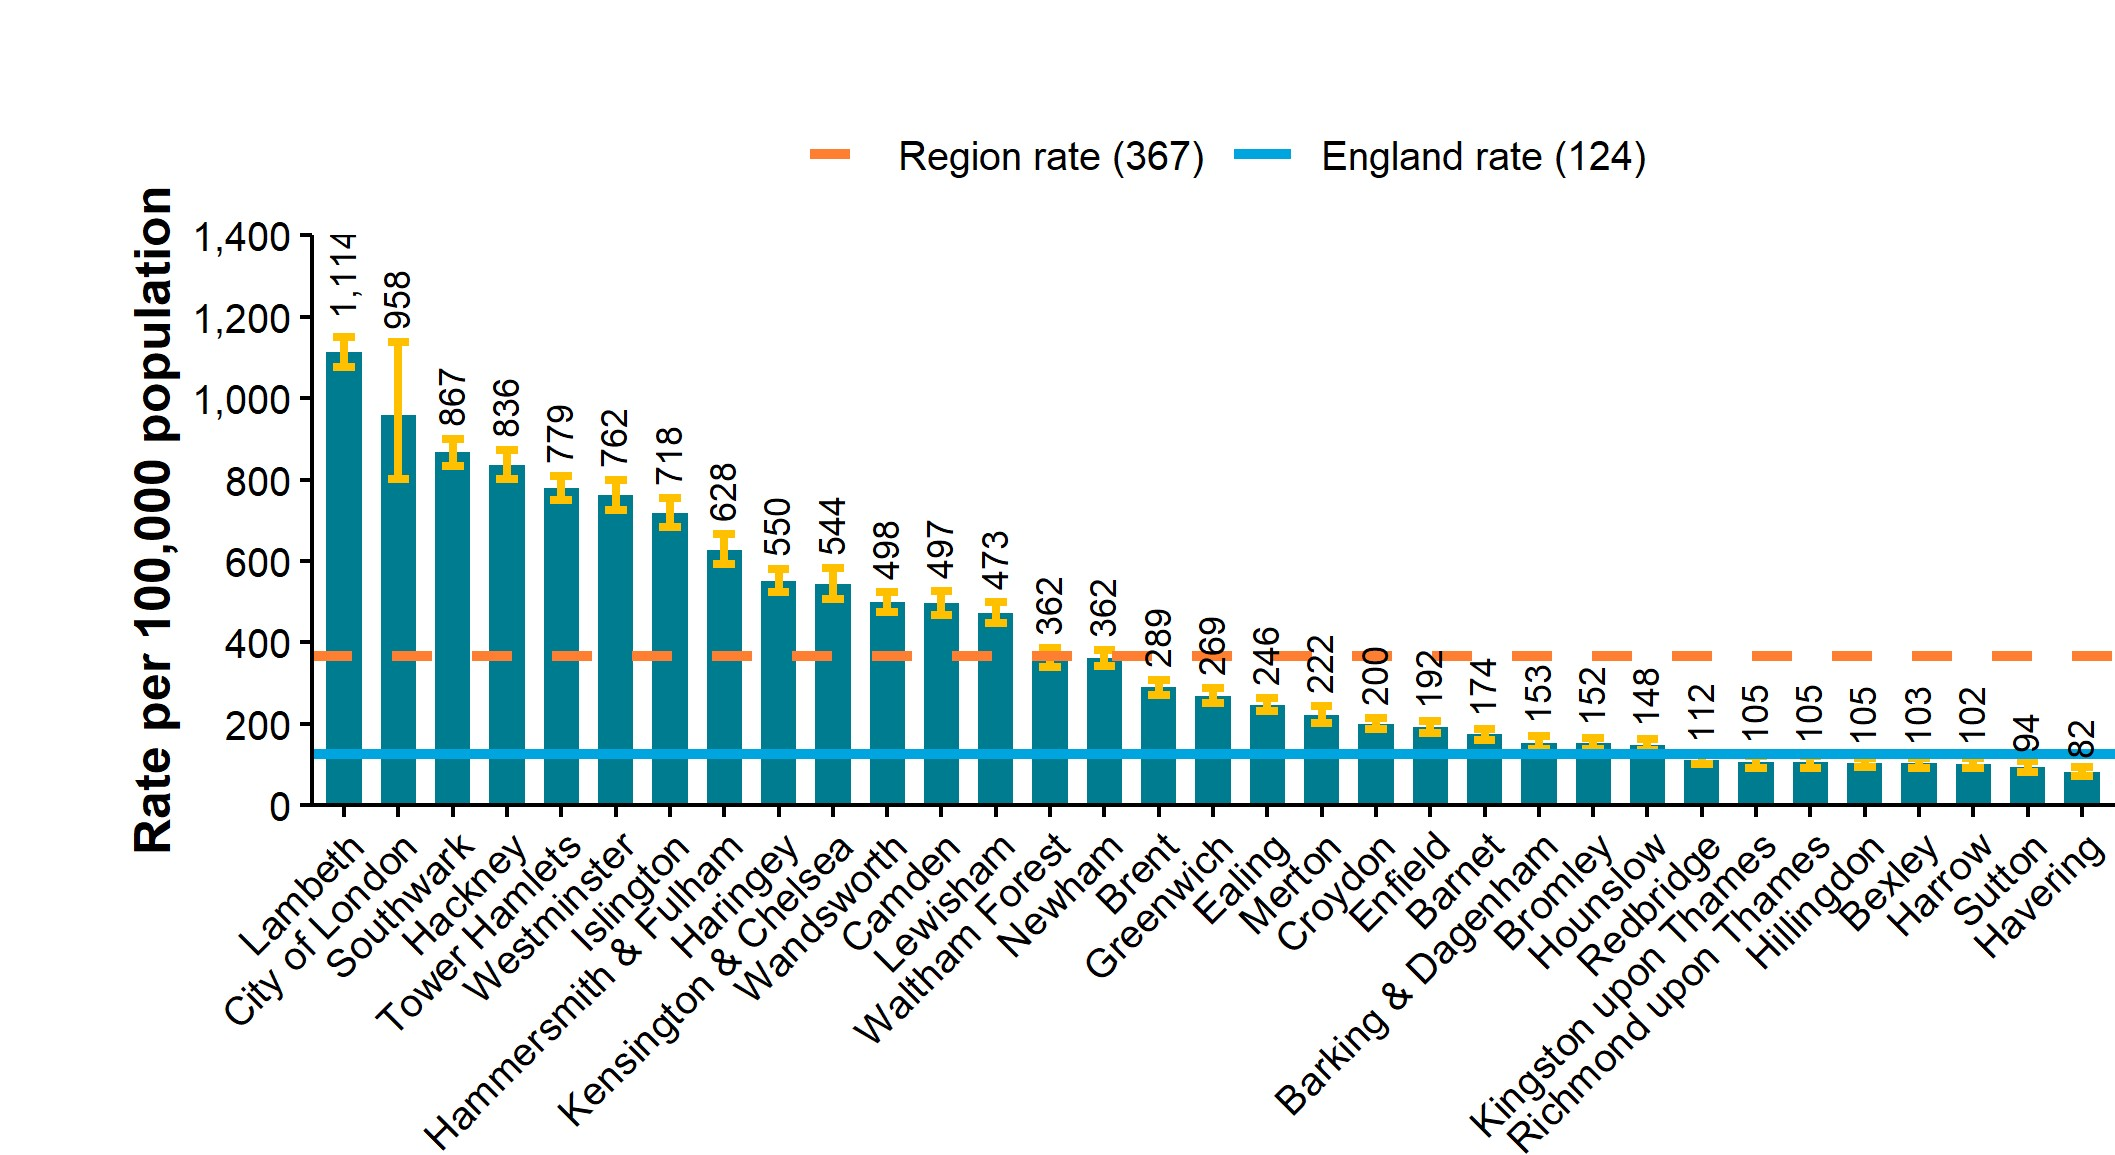
Figure 14. Rate of gonorrhoea diagnoses per 100,000 London residents by local authority of residence, 2024
Data sources: GUMCAD
Figure 14 is also a column chart. It shows rates of gonorrhoea diagnoses in 2024 in London residents by 100,000 population. The rates are not gender-specific but as gonorrhoea is a more common STI among GBMSM, local authorities with larger GBMSM populations will tend to have higher rates. The demographic profile of the local population needs to be considered when interpreting this chart.
Lambeth had the highest gonorrhoea diagnosis rate in London in 2024 with 1,114, while Havering had the lowest at 82. Most London local authorities saw a decrease when 2024 is compared 2023, apart from City of London (+9%), Ealing (+4%), Enfield (+2%) and Haringey (+2%). When interpreting numbers and trends for the City of London the wider confidence intervals (due to a smaller population) need to be considered.
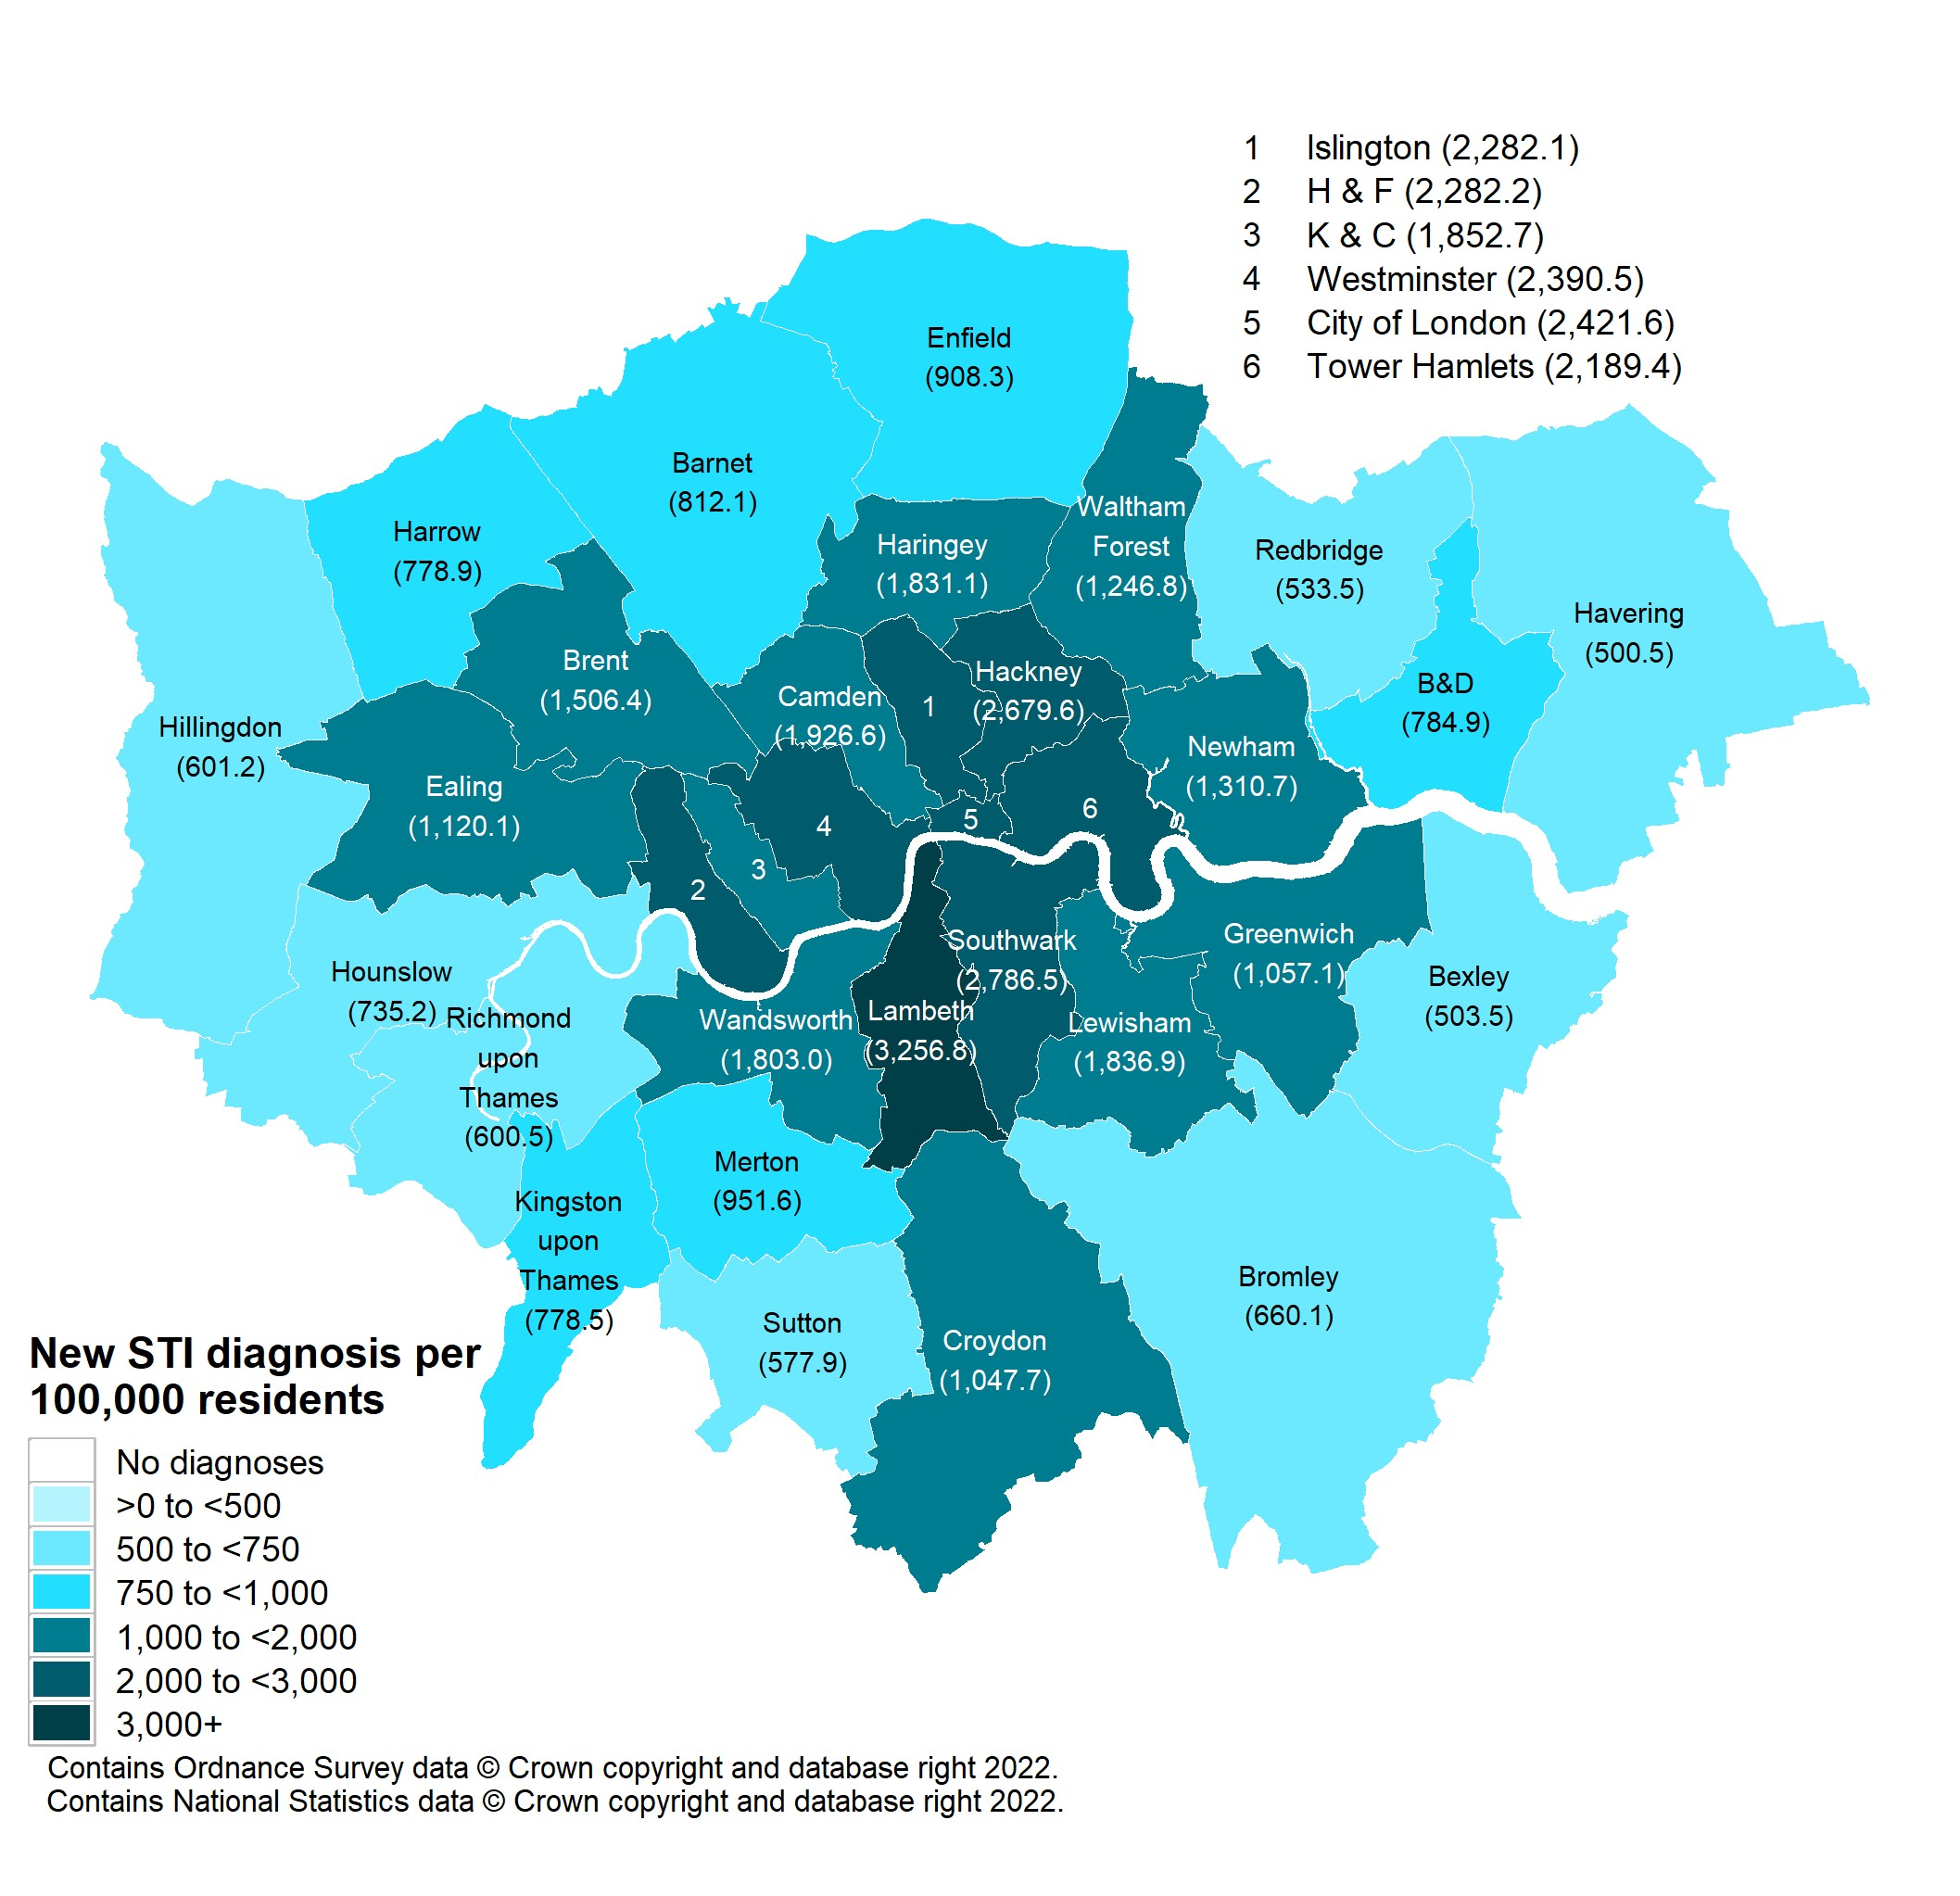
Figure 15. Map of new STI rates per 100,000 London residents by local authority, 2024
Data sources: GUMCAD, CTAD
Figure 15 is a map showing new STI diagnosis rates per 100,000 population for London local authorities in 2024. The higher rates in inner London local authorities described for Figure 11 earlier can be seen clearly. Also visible are higher rates in some outer London boroughs. These tend not to be quite as high as those seen in inner London but are still considerably higher than those in nearby outer London local authorities. Examples are Haringey in North London (1,831), Brent in West London (1,506), Newham in East London (1,311) and Croydon in South London (1,048).
Figure 16. Map of new STI rates per 100,000 London residents by middle super output area (MSOA21), 2024

Data sources: GUMCAD, CTAD
Figure 16 shows a map of new STI rates per 100,000 residents by middle super output area (MSOA) of residence in 2024.
The map shows that when we look at London in more geographical detail than at local authority level we see even more geographical variation: areas of lower rates in areas within inner London local authorities and areas of higher rates in some outer London local authorities.
MSOA is a geographical classification designed to create areas of similar population size (around 7,500 residents) and as such may vary widely in area size, reflecting differences in population densities. Inner London local authorities tend to have considerably higher population densities than outer London ones. The total area of lighter coloured MSOAs may look larger in the map above but this reflects lower diagnosis rates in outer London local authorities with lower population densities. In addition, a greater proportion of the population in outer London is 65 years or older compared to inner London, an age group in which STI diagnoses tend to be lower. This difference in age structure will tend to depress rates for areas in outer London relative to those for inner London.
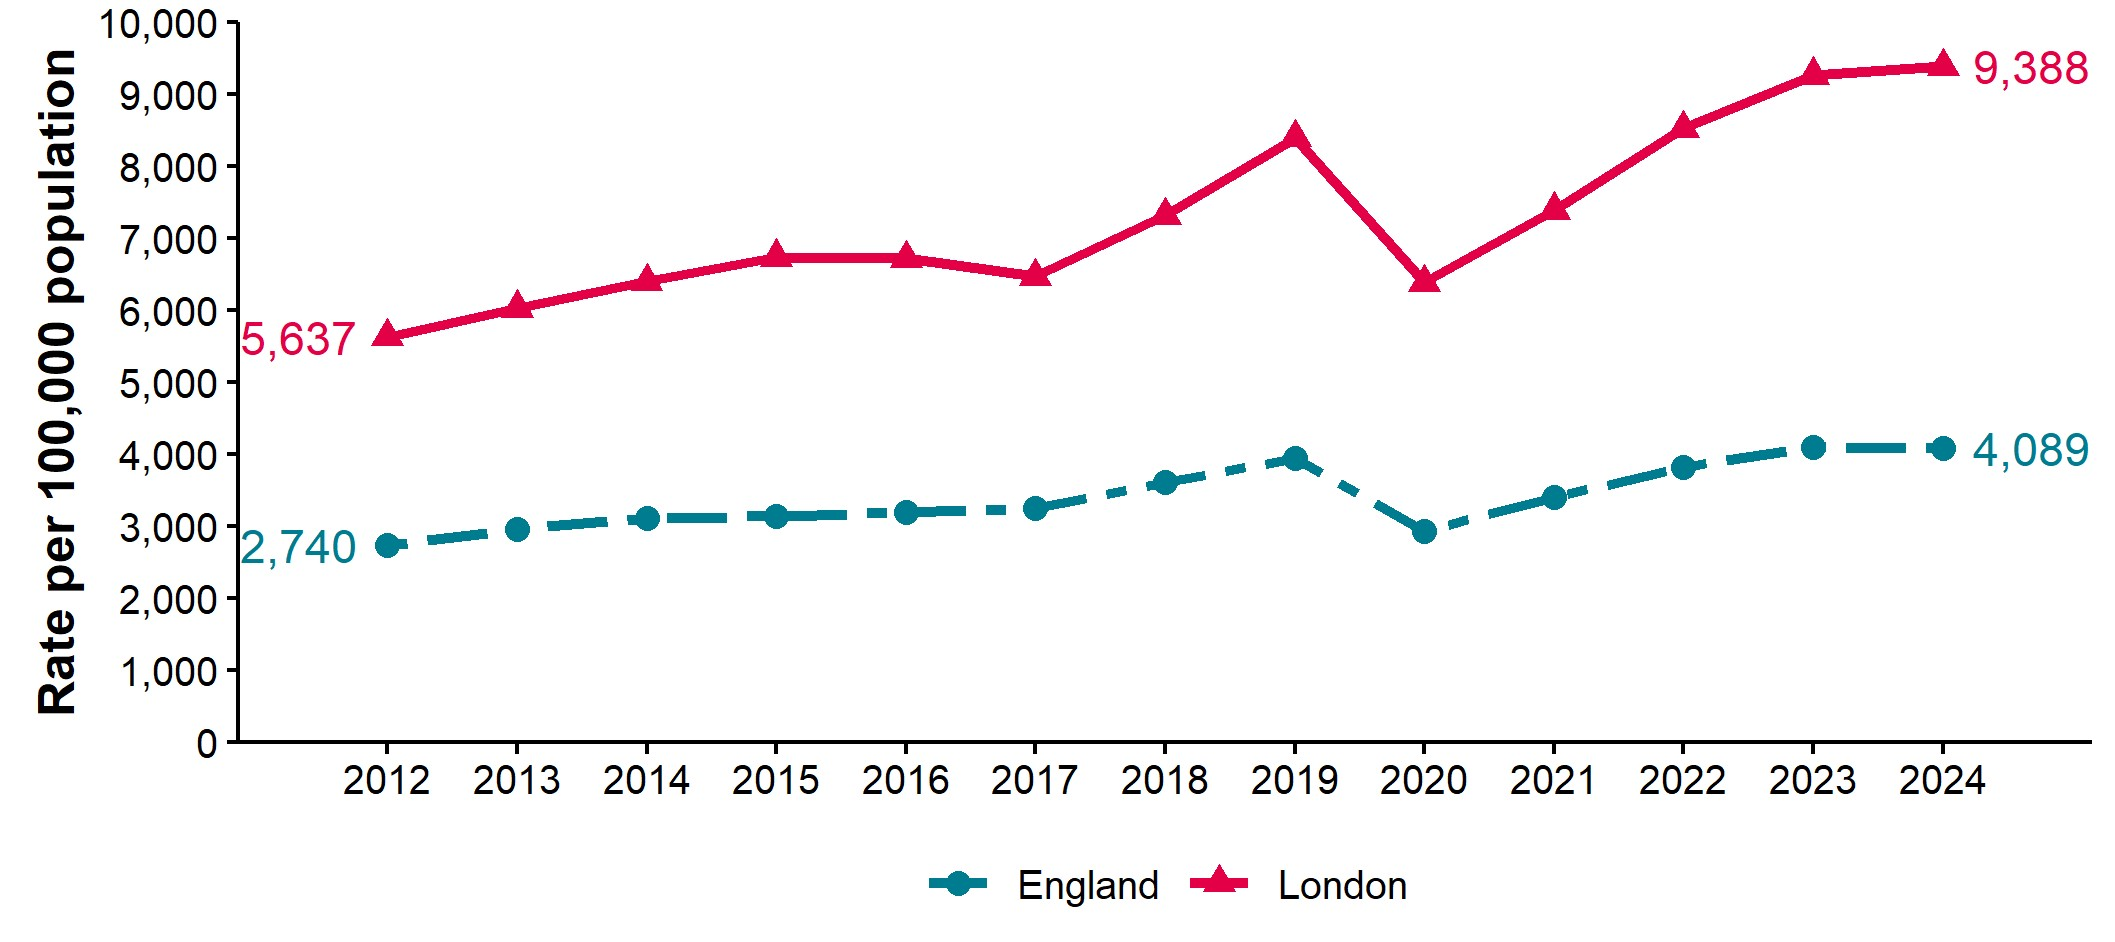
Figure 17. STI testing rate (excluding chlamydia in under 25-year-olds [note]) per 100,000 London residents, 2012 to 2024
Data sources: GUMCAD, CTAD
Note: Chlamydia diagnoses in the target group of the National Chlamydia Screening Programme NCSP (those aged 15 to 24 years) are excluded because these diagnoses could reflect how NCSP is implemented locally rather than actual prevalence.
Figure 17 is a line chart showing trends in the STI testing rate for London and England from 2012 to 2024. Tests for chlamydia in those aged less than 25 years are excluded. The line for London is considerably above that of England. In 2024, London had a testing rate of 9,388 per 100,000 population aged 15 to 64 years, compared to England’s 4,089. The lines for both London and England show a noticeable downward turn in 2020, the main pandemic year, but both lines turn upward again from 2021 onwards. London’s rate has risen more steeply than England’s over the six-year period from 2019 to 2024: 12% compared to 3%. It now exceeds pre-pandemic levels but, as Figure 18 shows, positivity has not returned to pre-pandemic levels.
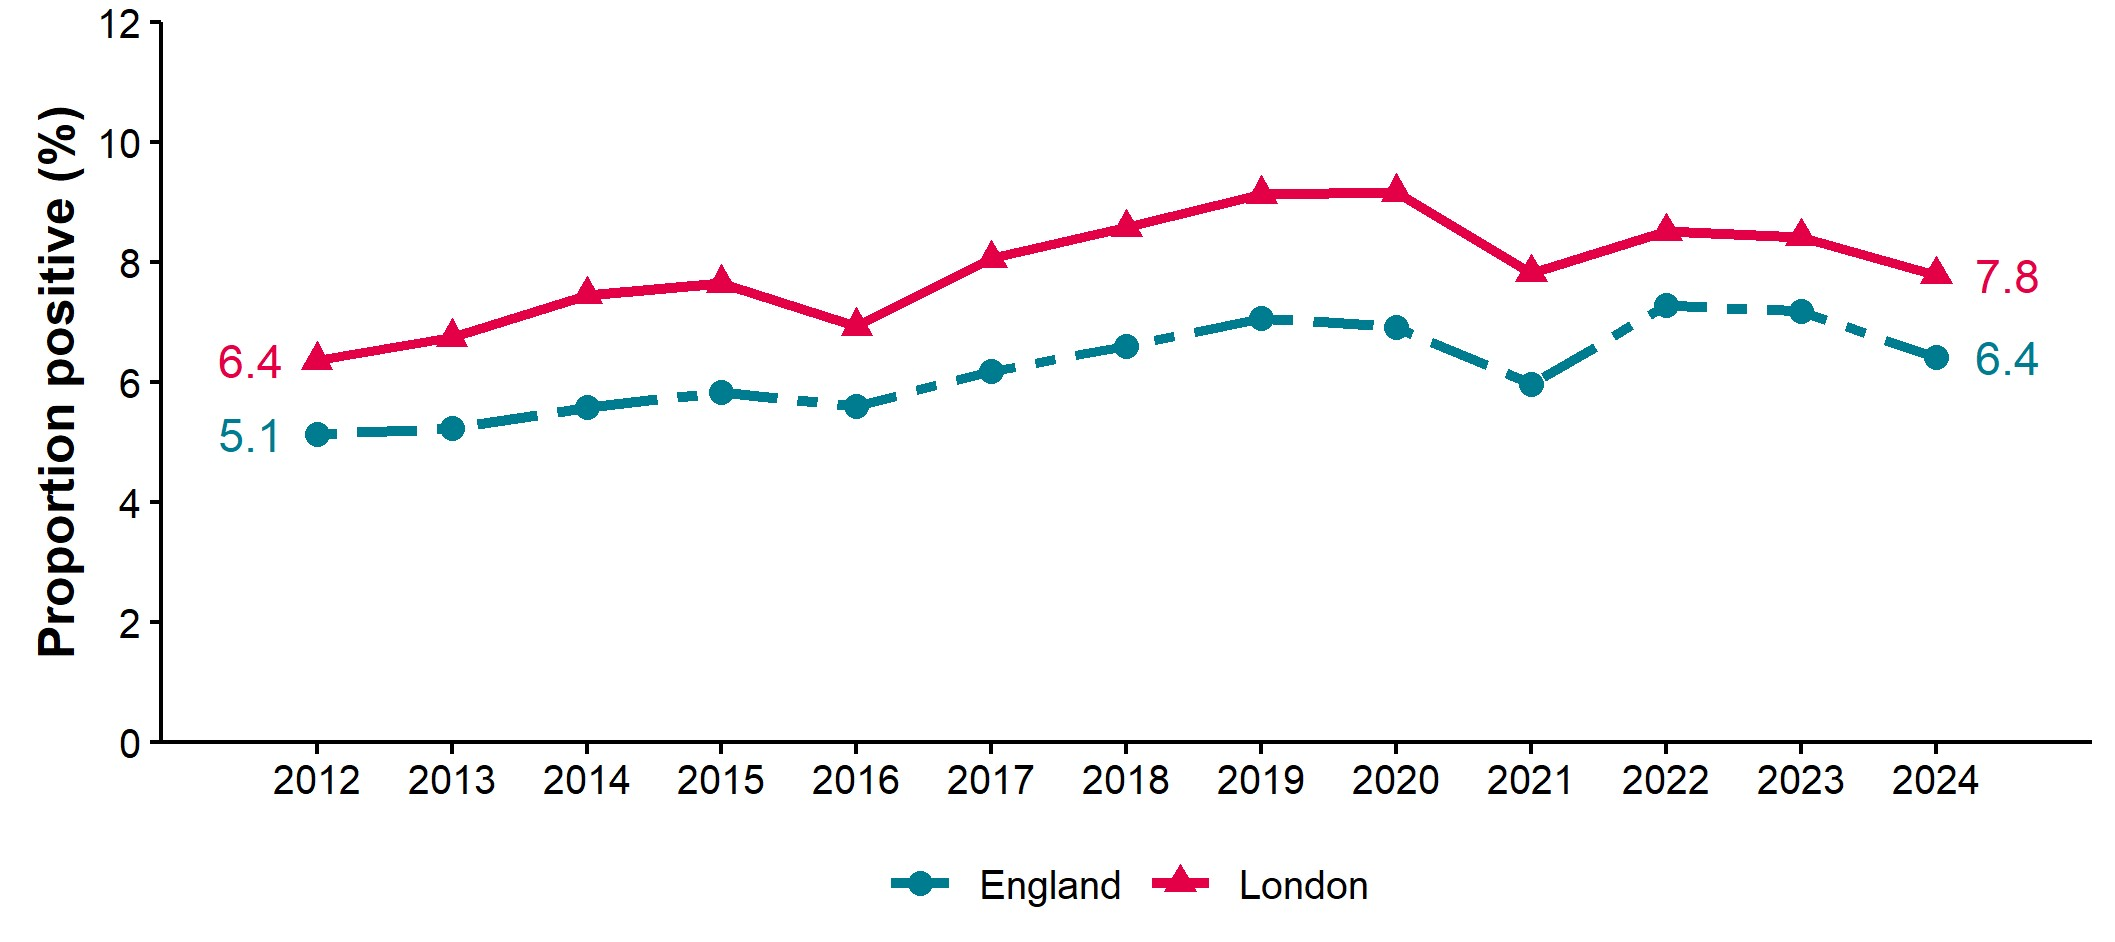
Figure 18. STI testing positivity rate (excluding chlamydia in under 25-year-olds [note]) in London residents, 2012 to 2024
Data sources: GUMCAD, CTAD
Note: Chlamydia diagnoses in the target group of the National Chlamydia Screening Programme NCSP (those aged 15 to 24 years) are excluded because these diagnoses could reflect how NCSP is implemented locally rather than actual prevalence.
Figure 18 is a line chart like Figure 17. It has 2 lines, one each for London and England, covering the five-year period 2012 to 2024. Whereas Figure 17 showed the STI testing rate, this chart shows the proportion of tests that were positive. As with the previous chart, chlamydia tests in those aged less than 25 years are excluded. The line for London is higher than the line for England as a whole, but the difference is not so marked as seen for the testing rate. In 2024, 7.8% of STI tests in Londoners were positive, compared to 6.4% for England residents as a whole. Positivity rose slightly in the main pandemic year, 2020, before falling in 2021. It rose again in 2022 but has since declined again and remains below pre-pandemic levels.
The difference in trends for London’s STI testing rate compared to its STI testing positivity rate may be partly a reflection of more testing in groups with a lower prevalence of STIs, but it is important not to over-interpret a short-term trend.
Table 4. Number of diagnoses of new STIs by UKHSA region of residence, data source and data subset 2024
| UKHSA region of residence | GUMCAD specialist SHSs |
GUMCAD non-specialist SHSs [note 1] |
CTAD [note 2] | Total |
|---|---|---|---|---|
| East Midlands | 13,865 | 5,900 | 4,244 | 24,009 |
| East of England | 17,674 | 2,317 | 6,551 | 26,542 |
| London | 87,381 | 11,044 | 23,995 | 122,420 |
| North East | 10,121 | 1,722 | 3,004 | 14,847 |
| North West | 33,672 | 4,248 | 9,175 | 47,095 |
| South East | 29,777 | 2,455 | 8,472 | 40,704 |
| South West | 17,434 | 2,856 | 4,797 | 25,087 |
| West Midlands | 19,125 | 4,566 | 3,618 | 27,309 |
| Yorkshire and Humber | 20,263 | 1,671 | 6,339 | 28,273 |
Data sources: GUMCAD, CTAD
Note 1: Diagnoses from enhanced GPs reporting to GUMCAD are included in the ‘Non-specialist sexual health services (SHSs)’ total.
Note 2: Including site type 12 chlamydia from GUMCAD.
Table 4 summarises new STI diagnoses for each UKHSA English region in 2024 by the surveillance system through which they were reported and, for GUMCAD, whether they were reported by specialist or non-specialist sexual health services (SHSs). Of the 122,420 new STI diagnoses in London residents, about 7 in 10 were reported by specialist SHSs via GUMCAD while about 1 in 10 were reported via the same system but by non-specialist SHSs. A fifth of new STI diagnoses were reported through CTAD. London’s proportions were in line with those for England as a whole.
Table 5. Number of diagnoses of the 5 main STIs in London by STI, data source and data subset 2024
| Five main STIs | GUMCAD specialist SHSs | GUMCAD non-specialist SHSs [note 1] | CTAD [note 2] | Total |
|---|---|---|---|---|
| Chlamydia | 22,482 | 457 | 23,995 | 46,934 |
| Genital herpes | 7,299 | 269 | 7,568 | |
| Genital warts | 6,655 | 257 | 6,912 | |
| Gonorrhoea | 23,197 | 9,624 | 32,821 | |
| Syphilis | 4,098 | 21 | 4,119 |
Data sources: GUMCAD, CTAD
Note 1: Diagnoses from enhanced GPs reporting to GUMCAD are included in the ‘Non-specialist sexual health services (SHSs)’ total.
Note 2: Including site type 12 chlamydia from GUMCAD.
Table 5 summarises diagnoses of the 5 main STIs for London residents in 2024 by the surveillance system through which they were reported and, for GUMCAD, whether they were reported by specialist or non-specialist sexual health services (SHSs). CTAD only collects information on chlamydia diagnoses so the only entry in that column is for that STI. It accounted for 51% of chlamydia diagnoses with 48% being reported by specialist SHSs through GUMCAD and just 1% by non-specialist SHSs through GUMCAD. The only STI where more than 3% of diagnoses were reported via non-specialist SHSs was gonorrhoea (29%). The STI with the highest proportion reported via specialist SHSs was syphilis, where 99% of diagnoses were in this setting.
Figure 19. Shigella diagnoses in London residents presumed GBMSM by year and quarter of specimen: 2017 to 2025
Data source: SGSS
Figure 19 is a line chart which shows shigella diagnoses in London residents presumed to be GBMSM between the beginning of 2017 and the end of 2025. Years are subdivided into quarters. Unlike the preceding charts, the data is drawn from the laboratory reporting system, Second Generation Surveillance System (SGSS). Whilst SGSS data is more timely than data available from the GUMCAD Surveillance System, given the voluntary reporting of STIs, the data for STIs in SGSS cannot be considered complete.
In 2017, at the start of the chart London saw 65 diagnoses a quarter. By 2019, the year before the COVID-19 pandemic, over 180 diagnoses were being reported for at least one quarter. The pandemic produced a steep fall in 2020, but a rising trend returned in the second quarter of 2021. Diagnoses have generally continued to increase since then and 2025 saw a further steep rise with the number of diagnoses per quarter reaching 388 by the fourth quarter of the year. This was the highest number of diagnoses reported over the nine-year period (41).
Figure 20. LGV diagnoses in London adult male residents aged 16 years or older by year and quarter of specimen: 2019 to 2025
Data source: SGSS
Figure 20 is a line chart showing LGV diagnoses in London adult male residents aged 16 years or older by year and calendar quarter from the beginning of 2019 to the end of the of 2025. As with the previous chart, it is based on data from the laboratory reporting system, SGSS. Only data for men is included as LGV is very rare in women and investigations of cases reported to be female have suggested that these are mostly due to reporting errors. Most diagnoses are among GBMSM.
The trend for LGV is difficult to interpret. The number of LGV diagnoses peaked in the third quarter of 2019 with 200 diagnoses and then fell. As with other STIs, there was a steep drop in the second quarter of 2020, the main lockdown period. In 2022, there was another rapid rise to 203 diagnoses in the third quarter. Since then, the trend has fluctuated. Diagnoses in 2025 have been at relatively low levels compared to most of the past 6 years but the third and fourth quarters of 2025 have shown signs of a slight rise.
Figure 21. Confirmed and highly probable mpox cases by year and month of specimen: London residents, 2023 to 2025
Data sources: SGSS and Rare and Imported Pathogens Laboratory, UKHSA
Figure 21 is a bar chart showing the number of confirmed and highly probable mpox clade IIb cases in London residents by month from January 2023 to December 2025. An oscillating trend is seen with highs of up to 30 cases per month and lows of below 10 per month. A total of 161 cases were reported for 2025, the most recent year, with the highest number being reported for November (27 cases) but with a fall to 16 in December.
Even for the months with the highest number of cases, the numbers are much lower than was seen in 2022 during the very large outbreak of mpox with community transmission in the UK, mainly in GBMSM. London was most affected during that outbreak, with 2,439 cases reported in 2022 (69% of the England total), with 98% being adult males. Numbers were especially high in June and July of that year when more than 850 cases were reported each month.
In response to the rise in mpox cases, over 50,000 mpox vaccinations were given in 2022 in London, mainly to GBMSM. Vaccinations have continued to be given.
Mpox is a zoonotic infection, caused by the monkeypox virus, that previously occurred mostly in West and Central Africa and is transmitted through close contact (including through sexual contact). Previous cases in the UK had been either imported from countries where mpox is endemic or contacts with documented epidemiological links to imported cases.
Figure 22. Consultations by service medium: London residents, 2020 to 2024
Data sources: GUMCAD
Figure 22 is a column chart. It shows the number of sexual health consultations for London residents for the 5 years from 2020 to 2024 by consultation medium. Consultations is a term used here to describe contacts with sexual health services, which may vary from a face-to-face clinic appointment, to online triage or asymptomatic screening.
The rise in online consultations accelerated rapidly in 2020, the main pandemic year, due to the need to facilitate access to services during the first lockdown when face-to-face consultations were tightly restricted. In 2024, for the first time since online consultations were introduced in London, there was a slight fall, rather than rise, in the number of consultations delivered via this route.
Face-to-face consultations, which fell in the pandemic, have tended to increase gradually since 2021 and this trend continued in 2024. However, the number of face-to-face consultations remained below pre-pandemic levels.
Consultations by phone rose during the pandemic but have decreased every year since. This trend continued in 2024.
When all consultation mediums are considered together, the total number of consultations increased by 30% from approximately 1,200,000 to 1,600,000 between 2019 and 2024. GBMSM saw a higher proportional rise in consultations in this time period (51% increase), compared to heterosexual or bisexual women (33% increase) and heterosexual men (26% increase).
There was also variation by sexual orientation for the proportion of consultations that were online, with the highest proportion of online consultations in 2024 being among heterosexual men (61%), compared to heterosexual or bisexual women (58%) and GBMSM (47%). This variation may reflect preferences in contact type, availability of a face-to-face consultation or clinical need for a face-to-face consultation.
Information on data sources
Find more information on local sexual health data sources in the UKHSA guide.
The gender and age group chart is restricted to those aged 15 to 64 years as information about STIs in those aged less than 15 years is considered highly sensitive. Analyses specific to this group are not provided in routine outputs. Rates for those aged 65 or older are withheld to ensure that no deductive disclosure is possible for the less than 15 years age group. The proportion of STIs in those aged less than 15 years or older than 64 years is very low.
GUMCAD surveillance system
This disaggregate reporting system collects information about attendances and diagnoses at specialist (Level 3) and non-specialist (Level 2) sexual health services. Information about the patient’s area of residence is collected along with demographic data and other variables. GUMCAD superseded the earlier KC60 system and can provide data from 2009 onwards. GUMCAD is the main source of data for this report.
Due to limits on how much personally identifiable information sexual health clinics are able to share, it is not possible to deduplicate between different clinics. There is a possibility that some patients may be counted more than once if they are diagnosed with the same infection (for infection specific analyses) or a new STI of any type (for new STI analyses) at different clinics during the same calendar year.
CTAD surveillance system
CTAD collects data on all NHS and local-authority or NHS-commissioned chlamydia testing carried out in England. CTAD is comprised of all chlamydia (NAATs) tests for all ages (with the exception of conjunctival samples), from all venues and for all reasons. CTAD enables unified, comprehensive reporting of all chlamydia data, to effectively monitor the impact of the NCSP through estimation of the coverage of population screening, proportion of all tests that are positive and detection rates.
For services which report to GUMCAD and for which CTAD does not receive data on the patient’s area of residence (for example, SHSs), information about chlamydia diagnoses is sourced from GUMCAD data.
CTAD does not collect information about sexual orientation or country of birth. Reports from CTAD are excluded from figures in this report which relate to analyses by sexual orientation or world region of birth.
New STIs
New STI diagnoses comprise diagnoses of the following: chancroid, LGV, donovanosis, chlamydia, gonorrhoea, genital herpes (first episode), HIV (acute and AIDS defining), Molluscum contagiosum, non-specific genital infection (NSGI), non-specific pelvic inflammatory disease (PID) and epididymitis, chlamydial PID and epididymitis (presented in chlamydia total), gonococcal PID and epididymitis (presented in gonorrhoea total), scabies, pediculosis pubis, syphilis (primary, secondary and early latent), trichomoniasis and genital warts (first episode), Mycoplasma genitalium, shigella.
Calculations
Confidence Intervals were calculated using Byar’s method for numerators >= 10. For small numerators, Byar’s method is less accurate and so an exact method based on the Poisson distribution is used.
ONS mid-year population estimates for 2023 were used as a denominator for rates (other than by ethnic group) for 2024. ONS estimates of population by ethnic group for the year 2019 were used as a denominator for rates by ethnic group for 2024. This is the first time that new estimates of population by ethnic group have been available since 2011. This must be considered if comparing rates for 2024 in this report with rates by 2023 in last year’s report, as the rates in the last report used the 2011 estimates.
Further information
As of 2020, all analyses for this report include data from non-specialist (Level 2) SHSs and enhanced GP services as well as specialist (Level 3) SHSs.
For further information, see the online Sexual and Reproductive Health Profiles.
For more information on HIV data, see the separate HIV Spotlight report.
For more information on local sexual health data sources, see the UKHSA guide.
Local authorities have access to the Summary Profile of Local Authority Sexual Health (SPLASH) reports (accessible from the Sexual and Reproductive Health Profiles) and the SPLASH supplement reports via the HIV and STI Data exchange.
About Field Services
UKHSA’s Field Services was established in 2018 as a national service comprising geographically dispersed multi-disciplinary teams integrating expertise in Field Epidemiology, Real-time Syndromic Surveillance and Public Health Microbiology to strengthen the surveillance, intelligence and response functions of UKHSA.
You can contact your local FS team at FES.SEaL@ukhsa.gov.uk
Acknowledgements
We would like to thank:
- local SHSs for supplying the SHS data
- local laboratories for supplying the CTAD data
- UKHSA Blood Safety, Hepatitis, Sexually Transmitted Infections (STI) and HIV Division for collection, analysis and distribution of data
References
- Stephanie J Migchelsen, Ubah Daahir, Clare Macdonald, Ana-Karina Harb, Lana Drisdale-Gordon, Stephen Duffell, Marta Checchi, Lucinda Slater, George Baldry, Hridhya Vijayan, Giulia Habib Meriggi, Tika Ram, Kate Soldan, Kate Folkard, Katy Sinka, Hamish Mohammed and contributors. Sexually transmitted infections and screening for chlamydia in England, 2024. UK Health Security Agency 2025 (accessed 16 March 2026)
- NHS Health A to Z. Syphilis (accessed 16 March 2026)
-
‘Chlamydia proportion of females aged 15 to 24 screened’ Office for Health Improvement and Disparities, Public Health Profiles (accessed 16 March 2026)
- UKHSA. Mpox (monkeypox) outbreak: epidemiological overview, 5 March 2026 (accessed 16 March 2026)
- Mercer CH and others. ‘Changes in sexual attitudes and lifestyles in Britain through the life course and over time: findings from the National Surveys of Sexual Attitudes and Lifestyles (Natsal)’ The Lancet 2013: volume 382, issue 9,907, pages 1,781 to 1,794
- Office for National Statistics (ONS). Ethnic group by age and sex, England and Wales: Census 2021 2023 (accessed 16 March 2026)
- Bardsley M, Wayal S, Blomquist P, Mohammed H, Mercer CH, Hughes G. Improving our understanding of the disproportionate incidence of STIs in heterosexual-identifying people of black Caribbean heritage: findings from a longitudinal study of sexual health clinic attendees in England Sexually Transmitted Infections 2022: volume 98, pages 23 to 31 (accessed 16 March 2026)
- HIV prevention England (accessed 16 March 2026)
- Ratna N, Dema E, Conolly A and others. O16 Ethnic variations in sexual risk behaviour, sexual health service use and unmet need during the first year of the COVID-19 pandemic: an analysis of population-based survey and surveillance data Sexually Transmitted Infections 2022: volume 98, pages A8 to A9 (accessed 16 March 2026)
- Sumray K, Lloyd KC, Estcourt CS, Burns F and Gibbs J. Access to, usage and clinical outcomes of, online postal sexually transmitted infection services: a scoping review Sexually Transmitted Infections 2022: pages 1 to 8 (accessed 16 March 2026)
- Macdowall W, Jones KG, Tanton C, Clifton S, Copas AJ, Mercer CH and others. ‘Associations between source of information about sex and sexual health outcomes in Britain: findings from the third National Survey of Sexual Attitudes and Lifestyles (Natsal-3)’ British Medical Journal Open 2015: volume 5, issue 3, e007837
- Sex Education Forum. Sex and Relationship Education (SRE) – the evidence 2022 (accessed 16 March 2026)
- Department for Education. ‘Policy statement: relationships education, relationships and sex education, and personal, social, health and economic education’ 2017
- Come Correct (accessed 16 March 2026)
- Bleasdille M, Ratna N, Nardone A, Lowndes CM, Folkard K. ‘Quantitative Review: London Come Correct Condom Distribution Scheme January 2013 – December 2016. A report to London Association of Directors of Public Health’ 2017
- UKHSA. Human papillomavirus (HPV) vaccination coverage in adolescents in England: 2024 to 2025 (accessed 16 March 2026)
- UKHSA. HPV vaccination programme for men who have sex with men (MSM) 2018 (accessed 16 March 2026)
- UKHSA. Information on HPV for GBMSM from September 2023 2023 (accessed 16 March 2026)
- NCSP: programme overview (accessed 16 March 2026)
- Estupiñán M, Mercer C, Woode Owusu M, Gerressu M, Winter A, Hughes G, Mohammed H, Jayes D. Sexually transmitted infections: Promoting the sexual health and wellbeing of people from a Black Caribbean background. From research to public health practice: an evidence-based resource for commissioners, providers and third sector organisations Public Health England 2021 (accessed 16 March 2026)
- Department of Health and Social Care. JCVI advice on the use of meningococcal B vaccination for the prevention of gonorrhoea 2023 (accessed 16 March 2026)
- NHS England. NHS and local government to roll out world-first vaccine programme to prevent gonorrhoea 2025 (accessed 16 March 2026)
- Clutterbuck D and others. ‘2016 United Kingdom national guideline on the sexual health care of men who have sex with men’ International Journal of STD and AIDS 2018: page 95646241774689
- Datta J and others. ‘Awareness of and attitudes to sexually transmissible infections among gay men and other men who have sex with men in England: a qualitative study’ Sexual Health 2019: volume 16, issue 1, pages 18 to 24
- UKHSA. Addressing the increase in syphilis in England: PHE Action Plan 2019 (accessed 16 March 2026)
- BASHH. Doxycycline Post-Exposure Prophylaxis 2025 2025 (accessed 29 April 2026)
- UKHSA press release. Rise in extremely drug-resistant Shigella in gay and bisexual men (accessed 16 March 2026)
- UKHSA. Shigella: leaflet and poster for men who have sex with men (accessed 16 March 2026)
- NHS Health A to Z. Gonorrhoea (accessed 16 March 2026)
- UKHSA. The surveillance, epidemiology, diagnosis and management of gonorrhoea (Neisseria gonorrhoeae) (accessed 16 March 2026)
- UKHSA. Antibiotic-resistant gonorrhoea cases rising in England (accessed 16 March 2026)
- NHS Health A to Z. Genital Warts (accessed 16 March 2026)
- World Health Organization fact sheets. Syphilis (accessed 16 March 2026)
- Government of Western Australia Department of Health. Syphilis – clinical presentation (accessed 16 March 2026)
- Britannica. ‘Global city’ definition (accessed 16 March 2026)
- Office for National Statistics. Population of the UK by country of birth and nationality: year ending June 2021 (accessed 16 March 2026)
- NHS England. Equality, diversity and health inequalities. Deprivation (accessed 16 March 2026)
- UKHSA. Health inequalities in health protection report 2025 (accessed 13 April 2026)
- NHS Health A to Z. Chlamydia (accessed 16 March 2026)
- World Health Organization. Chlamydia (accessed 13 April 2026)
- UKHSA. Sexually transmitted Shigella spp. in England: 2016 to 2025 (accessed 9 June 2026)