Secondary accountability measures: 2025 guidance for maintained secondary schools, academies and free schools
Updated 16 October 2025
Applies to England

© Crown copyright 2025
This publication is licensed under the terms of the Open Government Licence v3.0 except where otherwise stated. To view this licence, visit nationalarchives.gov.uk/doc/open-government-licence/version/3 or write to the Information Policy Team, The National Archives, Kew, London TW9 4DU, or email: psi@nationalarchives.gov.uk.
Where we have identified any third party copyright information you will need to obtain permission from the copyright holders concerned.
This publication is available at https://www.gov.uk/government/publications/progress-8-school-performance-measure/secondary-accountability-measures-2025-guidance-for-maintained-secondary-schools-academies-and-free-schools
Summary
This is a guide for maintained secondary schools, academies and free schools. It explains how Key Stage 4 (KS4) performance measures have been calculated based on pupils at the end of KS4[footnote 1] in the academic year 2024 to 2025.
The headline measures which appear in performance tables are:
- Progress 8 – progress across 8 qualifications[footnote 2]
- EBacc entry – percentage of pupils entering the English Baccalaureate (EBacc)
- pupil destinations – percentage of students staying in education or going into employment after KS4
- attainment in English and maths – percentage of pupils achieving a grade 5 or above in English and maths.
- Attainment 8 – attainment across the same 8 qualifications as Progress 8
- EBacc APS – English Baccalaureate Average Point Score (APS)
A range of additional performance measures and contextual information is also published alongside the headline measures.
Who this publication is for
This guidance is for:
- senior leaders working in secondary schools and trusts, including maintained schools, academies, alternative provision (AP), free schools and special schools
- independent schools or colleges with 14 to 16 provision seeking information on secondary accountability measures
- governors and trustees
- local authorities
Main points
The guidance includes information about KS4 performance measures for 2024 to 2025 and the use of 2024 to 2025 KS4 school and college level performance data. It also includes information about how we will calculate KS4 multi-academy trust (MAT) measures for the academic year 2024 to 2025.
2024 to 2025 performance measures
We published provisional KS4 school and college level performance data for academic years 2024 to 2025 in October 2025 and will update with revised data in February 2026.
The 2024 to 2025 performance measures are presented in a broadly similar way to prior to the pandemic, for example, with comparison tables for schools, local authorities and MATs.
It is not possible to calculate Progress 8 for academic years 2024 to 2025 and 2025 to 2026, as there is no Key Stage 2 (KS2) prior attainment data available to use to calculate Progress 8 (due to the relevant cohort’s primary tests and assessments being cancelled in academic years 2019 to 2020 and 2020 to 2021 due to COVID-19 disruption).
In April 2024, the previous government announced that there will be no replacement for Progress 8 for 2024 to 2025 and 2025 to 2026. Department for Education (DfE) will continue to publish the remaining headline attainment, entry and destination measures.
We will also, for the first time since the pandemic, return to publishing time-series, showing a school or college’s performance in academic year 2022 to 2023, 2023 to 2024 and 2024 to 2025 for each headline entry and attainment measure. Information about the calculation of Progress 8 is in annex A.
When DfE publishes 2024 to 2025 KS4 performance measures through the compare the performance of schools and colleges page in October 2025, messaging will be included to:
- explain why it is not possible to calculate Progress 8 for 2024 to 2025
- caution users about the limitations of using attainment only data to interpret school performance
We will also continue to show the most recent available Progress 8 scores (2023 to 2024 and 2022 to 2023) alongside the remaining headline measures.
It will be possible to produce Progress 8 in 2026 to 2027, as KS2 prior attainment will be available for this cohort.
How the 2024 to 2025 KS4 performance data will be used
Users of education school performance data will need to consider this data alongside a range of other information about a school and its individual circumstances, for example by speaking to a school directly. Conclusions should not be drawn on a single piece of data alone.
DfE officials may use 2024 to 2025 KS4 performance data when setting criteria to allocate additional funding.
As set out in DfE guidance, school and trust leaders should not make pay progression for teachers dependent on the assessment data for a single group of pupils. Performance management targets relating to pupil performance should not be used in isolation and other factors should also be considered.
From academic year 2024 to 2025, the requirement for objectives and the appraisal process to lead to performance-related pay outcomes for teachers and leaders were removed. The statutory requirement to make a pay decision following the completion of the appraisal process remains.
Ofsted
As set out in Ofsted’s school inspection handbook, Inspectors will consider what nationally published school performance data (where it is available) indicates about pupils’ achievement in the school over time and will use it as a starting point for discussions with leaders about achievement.
Inspectors will be aware of the data’s gaps or limitations (for example in relation to small cohorts) and will take into account that published outcomes do not reflect the achievement of pupils in every year group, or of some groups, such as pupils with special educational needs (SEN).
Inspectors will consider data alongside evidence gathered on site to provide a fuller picture of achievement over time, particularly for groups of pupils of phrases for which published data is not available.
Department for Education (DfE) regional directors
DfE regional directors will have 2024 to 2025 assessment, test and exam results data to refer to. They will be aware:
- that there will be no Progress 8 measure for 2024 to 2025
- of the limitations of attainment only data
Decisions will not be made on a single year’s data and will continue to be informed by a range of factors.
2024 to 2025 KS4 school performance data can:
- be used to make comparisons between schools, trusts and with local authority and national averages
- be considered alongside data from 2022 to 2023 and 2023 to 2024, as the approach to grading was consistent across years
KS4 performance measures
The following sections set out how we have calculated the headline KS4 performance measures for 2024 to 2025.
For 2024 to 2025, the KS4 headline measures are:
- EBacc entry - percentage of pupils entering the English Baccalaureate
- pupil destinations - percentage of students staying in education or going into employment after KS4
- attainment in English and maths - percentage of pupils achieving a grade 5 or above in English and maths
- Attainment 8 - attainment across the same 8 qualifications as Progress 8
- EBacc APS - English Baccalaureate Average Point Score
For 2024 to 2025, for the first time since 2018 to 2019, we will return to publishing 3-year time series. This is because there is published school level data available for 3 consecutive academic years (2022 to 2023, 2023 to 2024 and 2024 to 2025).
Attainment 8
Attainment 8 measures pupils’ attainment across 8 qualifications including:
- maths (double weighted) and English (double weighted, if both English language and English literature are sat)
- 3 qualifications that count in the EBacc measures – as in the EBacc entry and attainment measures section
- 3 further qualifications that can be GCSE qualifications (including EBacc subjects) or technical awards from the DfE approved list
Attainment 8 and Progress 8 calculations are described in more detail in annex A, with worked examples in annex B.
EBacc entry and attainment measures
The EBacc entry measure reports the percentage of pupils entered for the EBacc. To enter the EBacc, pupils must take up to 8 GCSEs across 5 subject pillars.[footnote 3] The structure of the EBacc is set out on page 7 of the previous government’s response to its consultation on implementing the EBacc.
EBacc APS measures pupils’ point scores across the 5 pillars of the EBacc. This ensures the attainment of all pupils is recognised, not just those at particular grade boundaries, encouraging schools to enter pupils of all abilities, and support them to achieve their full potential. For English results to be included in the EBacc APS calculation, pupils must sit both English language and English literature. The better grade counts towards EBacc APS. The way we calculate EBacc APS is set out in annex C.
Percentage of pupils staying in education or going into employment after KS4 (pupil destinations)
The headline pupil destination measure shows the percentage of pupils continuing to a sustained education, employment, or training destination in the year after completing KS4 study (after year 11). The data published is for pupils who finished year 11 in 2023. Pupils are counted in a sustained destination if they have a recorded activity throughout the first 2 terms of the academic year 2023 to 2024 (or any consecutive 6 months in the year for apprenticeships).
Additional breakdowns show whether pupils were in education, apprenticeships, or employment, did not stay in education or employment for at least 2 terms, or whether activity was not captured in the data. Education destinations including further education (FE) colleges and other FE providers, sixth form colleges, school sixth forms and other education destinations are also shown. Further information on the KS4 destination measures is in annex E.
We recognise that destination measures may have been affected by the broader impacts of COVID-19, including school and college closures during 2020 and 2021 and alternative grading arrangements.
Attainment in English and maths measures
These measures show the proportion of pupils achieving a grade 5 and above (a headline measure) and the proportion of pupils achieving a grade 4 and above in GCSE English and maths.
A pupil must achieve the relevant threshold grade in either English literature or English language. There is no requirement to sit both.
An AS level at grade A to E in English or maths also counts towards achieving both the grade 5 and above and grade 4 and above measures, as the AS level grades meet the required thresholds.
Publication of KS4 secondary accountability measures
Headline secondary accountability measures are published as a statistical publication at national, local authority and at school level on Explore Education Statistics (EES), as well as at school level on the performance tables website. From 2022 to 2023, institution level data for all schools, including independent schools and FE colleges, is included in published provisional data.[footnote 4]
The statistical publication on EES includes pupil characteristic breakdowns including gender and disadvantaged status and, from February 2025, some further breakdowns at school level.
Where a mainstream school has a SEN unit or resourced provision, all pupils in the school at the end of KS4 are included in the school’s performance measures.
When available, Progress 8 and its constituent buckets, and pupil destinations, are not published for independent schools and independent special schools.[footnote 5] Pupil destinations are also only published for schools which had pupils completing the key stage 2 years previously.
As usual, suppression is applied at school level, so we do not disclose the results of small numbers of pupils. Figures are suppressed if the school has 5 or fewer pupils included in the cohort. This applies to sub-groups of pupils as well as the whole cohort; for example, if there were 5 boys and 3 girls in a school, we would not publish attainment for boys or girls separately but would publish attainment for all pupils (as this is based on 8 pupils).
The same rules are applied across pupils included in each headline measure. We apply extra suppression, where appropriate, to destination measures because it contains employment data and to protect confidentiality. When available, the Progress 8 score is suppressed if fewer than 50% of pupils at the end of KS4 are included in the measure (for example because they do not have KS2 prior attainment recorded).
Schools, colleges and local authorities also have access to school and pupil level performance data through Analyse School Performance (ASP) and pupil level performance data through Get Information About Pupils (GIAP).
Calculating Attainment 8
Qualifications included in the measures
Attainment 8 and, when available, Progress 8, are based on a calculation of pupils’ performance across 8 qualifications. These qualifications are:
- a double weighted maths bucket that will contain the point score of the pupil’s EBacc maths qualification
- an English bucket based on the higher point score of a pupil’s EBacc English language or English literature qualification. This will be double weighted provided a pupil has taken both qualifications
- a bucket which can include the 3 highest point scores from any of the EBacc qualifications in science subjects, computer science, history, geography, and languages. For more information see the list of qualifications that count in the EBacc. The qualifications can count in any combination and there is no requirement to take qualifications in each of the pillars of the EBacc
- the open bucket contains the 3 highest point scores in any 3 other subjects, including English language or literature (if not counted in the English slot), further GCSE qualifications (including EBacc subjects) or any other technical awards from the DfE approved list: Performance measures: technical and vocational qualifications. For more information, see the list of qualifications included in the KS4 performance measures: KS4 qualifications discount codes and point-scores.
If a pupil has not taken the maximum number of qualifications that count in each group, then they will receive a point score of zero where a slot is empty.
Maths qualifications
This bucket of Attainment 8 is double weighted. Only maths qualifications which also count towards the EBacc can count in the maths bucket of Attainment 8.
Where a pupil has taken more than one EBacc maths qualification, qualifications which are not used in the maths bucket cannot count elsewhere in Attainment 8.[footnote 6]
Approved mathematical type qualifications that do not count towards the EBacc, for example GCSE statistics, can be counted in a slot in the ‘open’ bucket of Attainment 8 regardless of whether a pupil has also taken an EBacc maths qualification.
For more information on Free Standing Maths Qualifications (FSMQ), see the Level 3 qualifications section.
English qualifications
If a student sits both English language and English literature, the higher grade is double weighted in the English bucket. The lower grade can count in the ‘open’ bucket of subjects (not in the EBacc bucket).
If only one of GCSE English literature or English language is taken, then this qualification will count in the English bucket, but will not be double-weighted.
An explanation of how English counts towards other headline performance measures is provided in annex F.
Qualifications in the EBacc subjects
Only qualifications that count towards the EBacc measure can be included in the Progress 8 bucket reserved for EBacc qualifications.
English literature and English language cannot be included in the EBacc bucket. The better of these qualifications will count in the ‘English’ bucket, and the other can count in the ‘open’ bucket if the grade is higher than other eligible subjects.
Maths cannot be included in the EBacc bucket.
There are no other stipulations about the types of EBacc subjects which can count in the 3 slots of the EBacc bucket. Any combination of EBacc subjects can be used to fill these slots. For example:
- biology, chemistry, French
- Spanish, French, German
- history, geography, Spanish
Science and computer science qualifications
All students must study science up to the age of 16. The KS4 science and computing curricula are compulsory in state-funded maintained schools, and academies are required to provide a broad and balanced curriculum, including English, maths and science, up to the age of 16.
There is the combined science GCSE (double award), the single science GCSEs (biology, chemistry and physics) and computer science GCSE.
Separate GCSEs in biology, chemistry, physics and computer science each take up 1 slot, and can count in Progress 8 in any combination. The combined science GCSE can take 2 slots in either the EBacc or open buckets of Progress 8 where this represents the highest relevant grades achieved. One grade from this qualification can fill one slot if higher grades are achieved in other qualifications.
The points awarded to combined science are averaged. This means that a combined science grade of a grade 6 and a grade 5 would be averaged to 2 x 5.5 points to fill either 1 or 2 slots as appropriate (a maximum of 11 points across 2 slots).
Any other science subject may count in the open bucket of Progress 8.
Details of the combined science, single science and computer science qualification pathways and how they may count in the headline measures is in the discounting and early entry guidance. An example of the science pathways is in annex D.
Qualifications in the ‘open’ bucket
Up to 3 GCSE qualifications (including EBacc subjects not used in the EBacc bucket) or technical awards (which are included in the approved list for the year in which the student will reach the end of KS4) can count towards the 3 slots in the ‘open’ bucket in the Attainment 8 measure.
For example, if a student takes a technical award early in Year 10 in 2022 to 2023, the technical award must be on the approved list for 2023 to 2024 to count in performance measures as this is when the student will reach the end of KS4.
Technical awards are approved level 1 and 2 qualifications that equip 14 to 16-year-olds with applied knowledge and practical skills not usually acquired through general education. More information on technical awards is available in the technical award guide.
DfE introduced a revised approval process for KS4 technical qualifications for inclusion in performance measures from 2024 to 2025. Only technical qualifications that have been approved by DfE are included in the 2023 to 2024 KS4 performance measures alongside academic qualifications.
Level 3 qualifications
AS levels can count in the appropriate bucket of the Attainment 8 measure for their subject. For example, maths AS levels count in the maths slot, a French AS-level in the ‘EBacc group’, and an Art AS level in the ‘open’ bucket.
If a GCSE in the same subject has been taken, the AS level will always count in Attainment 8 and the GCSE will not, even if the AS has a lower point score than the GCSE.
AS levels at grade A score higher points in Attainment 8 than a grade 9 GCSE.
There is no cap in the number of AS levels which can count towards a pupil’s Attainment 8 score.
Level 3 qualifications not included in the EBacc list can only count in an ‘open’ slot. This includes FSMQ.
FSMQ will only count in an ‘open’ slot if a pupil has not taken an EBacc maths qualification.
FSMQ do not discount EBacc maths qualifications, so early entry rules are not applicable across these qualifications. For example, even if a pupil sat an FSMQ in year 10 and an EBacc maths qualification in year 11, the ‘open’ slot would not be filled by the FSMQ, as the pupil would have an EBacc maths qualification which counts.[footnote 7]
One graded music qualification can count in the ‘open’ bucket of Attainment 8 and can count alongside GCSE music.
Point scores
The point scores for different types of qualifications for performance measures for academic year 2024 to 2025 are in annex G.
Impact of the number of qualifications taken on a pupil’s Attainment 8 score
The number of qualifications each pupil should enter remains a professional judgement for schools led by what best meets the needs of an individual.
The Attainment 8 score for each pupil will be determined by assigning points to the pupils’ highest grades in each Attainment 8 bucket.
Where available, the Progress 8 score for each pupil will always be determined by dividing the total points for their 8 qualifications by 10 (English and maths both double-weighted), regardless of how many qualifications the pupil sits.
It may benefit lower-attaining pupils to work towards good grades (and hence score more points) in fewer subjects, with the emphasis on doing well in English and maths, rather than to take more subjects but achieve lower grades overall.
Discounting, pathway and first entry rules
Discounting ensures that, where a pupil has taken 2 or more qualifications with a significant overlap in content, the performance tables only give credit once for teaching a single course of study.
Rules for first entry in a particular subject apply under Attainment 8 and, when available, Progress 8, as do rules for pathways in English, maths and science qualifications.
Only a pupil’s first entry to a qualification will count towards their school’s performance measures. There are some potential exceptions, such as where a pupil has entered an approved Level 3 qualification or moved school.
This means that, if a pupil takes a GCSE early, for example when they are in year 10, the result in that GCSE qualification will count towards their school’s performance measures when the pupil reaches the end of KS4. Further information is available in the discounting and early entry guidance.
Where a pupil was awarded a qualification in winter 2022 (or earlier for 2025 KS4 performance measures), the first entry rule does not apply. In most cases this will apply to pupils in years 8 and below. In these cases, performance measures count the best grade achieved, from before the 3-year cut-off point of the first entry after the cut-off point.[footnote 8]
KS4 multi-academy trust measures
We intend to produce and publish KS4 MAT measures in February 2026 for the academic year 2024 to 2025 based on revised data. We will produce the following KS4 measures at MAT level:
- percentage entering EBacc
- EBacc APS
- percentage achieving EBacc at grade 5 and above, or grade 4 and above
- Attainment 8
- percentage of pupils achieving grade 5 or above in English and maths GCSE
As MAT-level measures are an aggregate of school-level measures, we will use the usual methodology to calculate MAT measures, as far as possible. Where appropriate, the adapted methodology for calculating KS4 performance measures set out in annex H will also apply.
Eligibility for inclusion in the MAT measures
We include data at MAT level for MATs that are sufficiently well established to have had time to have an impact on the performance of schools within the MAT. This means that the aggregate data is more informative than the individual institution data.
As of 12 September 2024, we will produce measures for MATs that have at least 3 schools with results at KS4, and where those schools have been with the MAT for at least 3 academic years (defined as having joined that MAT before 12 September 2022). [footnote 9]
This means that we do not produce measures for all MATs. It also means that, where we do produce measures for a MAT, the measures may be based on the results from only some of their schools, if they also have schools that have been with the MAT for less than 3 years.
As the MAT sector continues to mature, each year the number of MATs that have at least 3 academies that have been part of the MAT for at least 3 years increases. This means that each year we expect to produce measures for more MATs than we did for the previous academic years, and some MATs will have MAT measures produced for the first time.
Previously, we have calculated and reported at sponsor level, for the very small number of MATs this includes. From 2021 to 2022, we no longer report at this level and report at trust level only.
The measures cover state-funded mainstream schools within MATs only. Special schools, pupil referral units, AP academies and AP free schools are not included.
Calculating KS4 measures at MAT level
For each of the measures we publish at MAT level, the score or percentage for each MAT is based on the weighted average of its individual schools’ respective progress/attainment scores. This is to ensure that a school’s contribution to the overall MAT level score is proportional to its size when calculating the average.
For Attainment 8, EBacc entry and attainment measures, and attainment in English and maths, the score is weighted for:
- the number of pupils at the end of the key stage
- the length of time the school has been with that MAT (those that have been with the MAT for 3 years are given a weight of 3, those with the MAT for 4 years are given a weight of 4 and those with the MAT for 5 or more years are given a weight of 5 – as the usual combined duration of KS3 and KS4 is 5 years)
Disadvantaged pupils and MAT measures
We calculate breakdowns of all KS4 MAT level measures for disadvantaged pupils. Evidence shows that overall performance of disadvantaged pupils is lower than that of other pupils. This data indicates how well a MAT improves the performance of disadvantaged pupils. Disadvantaged pupils are those who were eligible for free school meals at any time during the last 6 years and looked after children (children who were in the care of the local authority for a day or more or who have been adopted from care).
Worked examples of KS4 MAT measures are included in annex H.
Information available to secondary schools about their year 7 pupils
Secondary schools receive information through common transfer files on the teacher assessment and test score (the scaled score) awarded to each pupil.
Question Level Analysis data is available to secondary schools through the ASP service. This helps secondary schools identify areas of focus for incoming year 7 pupils in each test subject.
GIAP provides access to pupil level census and attainment data, as well as providing pupil level pupil premium allocation details. The service can be accessed through DfE Sign-in.
Secondary schools should continue to view KS2 test results as just one piece of data and continue to supplement this data with their own ongoing assessments of pupil capability.
As primary tests and assessments were cancelled in academic years 2019 to 2020 and 2020 to 2021 due to COVID-19 disruption, this information is not available for these cohorts.
Annex A: Progress 8 methodology
It is not possible to calculate Progress 8 for academic years 2024 to 2025 and 2025 to 2026. This is because there is no relevant KS2 prior attainment data available to calculate Progress 8 for these cohorts, as primary tests and assessments were cancelled in academic years 2019 to 2020 and 2020 to 2021 due to COVID-19 disruption.
This annex explains how DfE calculated Progress 8 for 2022 to 2023.
Progress 8
Progress 8 aims to capture the progress that pupils make from the end of primary school to the end of KS4. It is a type of value-added measure, which means that pupils’ results are compared to other pupils nationally with similar prior attainment. Every increase in grade a pupil achieves in their Attainment 8 subjects counts towards a school’s Progress 8 score.
Progress 8 is calculated for individual pupils solely to calculate average Progress 8 scores, including school Progress 8 scores. Schools should not share individual pupil progress scores with pupils or parents.
A Progress 8 score is calculated for each pupil by comparing their Attainment 8 score with the average Attainment 8 scores of all pupils nationally who had a similar starting point using assessment results from the end of primary school. In 2016, changes were introduced to KS2 outcomes in English reading and maths. They are now reported as scaled scores instead of national curriculum levels. More information is available in the measurement of prior attainment section.
The greater the Progress 8 score, the greater the progress made by the pupil compared to the average for pupils with similar prior attainment.
A school’s Progress 8 score is calculated as the average of its pupils’ Progress 8 scores. It gives an indication of whether, as a group, pupils in the school made above or below average progress compared to similar pupils in other schools.
If a school’s Progress 8 score is:
- zero, it means pupils, on average, did as well at KS4 as other pupils across England who got similar results at the end of KS2
- above zero, it means pupils made more progress, on average, than pupils across England who got similar results at the end of KS2
- below zero, it means pupils made less progress, on average, than pupils across England who got similar results at the end of KS2
A negative progress score does not mean pupils made no progress, or the school has failed. Rather, it means pupils in the school made less progress than other pupils across England with similar results at the end of KS2.
Worked examples on how Attainment 8 and Progress 8 measures are calculated are shown below.
Pupils with extremely negative progress scores
We limit how negative[footnote 10] a pupil’s progress score can be when calculating the school average. These pupils still have large negative scores (to reflect that the pupils have made much less progress than other pupils in the same prior attainment group as them), but the disproportionate effect they have on their school’s score has been reduced.
We do this by setting a minimum progress score that can be assigned to pupils within the prior attainment groups where extremely negative scores exist. Prior attainment groups from 1 to 16 (inclusive) will not have a minimum progress score threshold set, as the average Attainment 8 scores at KS4 for these groups are not high enough to allow for extremely negative progress scores.
Progress figures published in performance tables are calculated using the methodology outlined in this guidance. We also published figures in download data that do not place limits on pupil progress scores for transparency.
Interpreting Progress 8 scores
A school’s Progress 8 score is calculated as the average of its pupils’ Progress 8 scores. For all mainstream pupils nationally, the average Progress 8 score will be zero. When including pupils at special schools, the national average will be slightly less than zero as Progress 8 scores for special schools are calculated using Attainment 8 averages based upon mainstream pupils. School scores should be interpreted alongside their associated confidence intervals.
The minimum grades each pupil requires to achieve a positive Progress 8 score will not be known in advance. This is because each pupil’s results are compared to other pupils with similar prior attainment within the same national cohort.
Care should be taken when using a previous year’s attainment averages to predict future Progress 8 results. This is because changes to national subject entry patterns and performance will cause these averages to change. Schools may change their curriculum offer in response to the Progress 8 measure, so any modelling based on current national results could be misleading.
Pupils reaching their estimated grades
A pupil’s estimated grade is what they are anticipated to achieve based on the national average for their prior attainment group. Progress 8 does not give credit to a school for helping a pupil reach their estimated grade. Schools get credit for each increase in grade a pupil achieves, regardless of how this grade relates to their estimated grade. For example, the Progress 8 score can improve equally if a pupil working well below their estimated grade moves up one grade, or if another pupil moves up one grade to achieve their estimated grade.
Presentation of Progress 8 scores in performance tables
Progress 8 scores are presented in performance tables alongside confidence intervals and a banding.
Confidence intervals
Progress 8 results are calculated for a school based on a specific cohort of pupils. A school may have been just as effective but have performed differently with a different set of pupils. Similarly, some pupils may be more likely to achieve high or low grades independently of which school they attend.
To account for this natural uncertainty, 95% confidence intervals around Progress 8 scores are provided as a proxy for the range of scores within which each school’s underlying performance measure can be inaccurate.
The results of schools with a small cohort tend to have wider confidence intervals. This reflects the fact that the performance of a small number of pupils taking their KS4 exams can have a disproportionate effect on the school’s overall results.
Both the Progress 8 score and the confidence interval for a school should be considered when comparing with other schools, pupil groups or national or local authority averages.
Rounding method used in performance tables
Progress scores (including confidence intervals) are published to 2 decimal places and use normal rounding conventions.
Digits below 5 are rounded down and those that are 5 or above are rounded up. Therefore, a score of 0.21453 will be rounded down to 0.21 and a score of 0.09540 will be rounded up to 0.10.
The bandings are calculated on rounded data, an established convention within the performance tables.
We base our bandings, and whether we consider a school’s score to be above or below average (significantly different from 0), on the published value of the confidence interval at 2 decimal places.
For example, we do not treat a school with an upper confidence limit of -0.00234, which is shown as 0.00, as significantly below average.
Progress 8 scores are presented in performance tables alongside confidence intervals and a banding.
Making comparisons between years
Progress 8 is a relative, in-year measure and cannot be compared directly year on year. For example, knowing a school had a Progress 8 score of -0.2 in 2023 and a score of -0.3 in 2024 tells you how the school did compared to the national average in those years, but not whether their performance improved across years.
Using performance data to predict individual pupils’ scores and sharing pupils’ progress data
The previous government’s response to the Workload Advisory Group report ‘Making Data Work’ provides advice to schools about the proportionate use of setting predictions or targets for individual pupils to aid teaching.
It makes clear that predicting pupils’ attainment can sometimes be appropriate, but that pupils or their parents need not be routinely told the levels that they ‘should’ or ‘are likely to’ achieve at the end of KS4. The group also stated that ‘flight paths’ (where pupils are told the levels they will achieve based on the performance of pupils with similar starting points in previous years) are not valid as a prediction, as they understate the variation in pupil development.
Schools are not held to account by DfE for pupil targets and predictions, and local authorities and MATs should not routinely request such information.
Similarly, schools should not share individual pupil progress scores with pupils or parents. Schools should not try to predict pupil or school level progress scores in advance of official provisional data being available in the autumn.
Measurement of prior attainment
Changes to the KS2 baseline for calculating Progress 8
In 2016, changes were introduced to KS2 national curriculum tests, with pupil outcomes expressed as KS2 scaled scores for English reading and maths instead of national curriculum levels. Further information on scaled scores can be found online.
Most pupils reaching the end of KS4 in 2023 to 2024 took national curriculum tests in 2019. A few may have completed KS4 in a different period of time and will have taken national curriculum tests in 2018, while those who would have in 2020 did not due to the COVID-19 pandemic.
Most of the first cohort who took national curriculum tests in summer 2016 reached the end of KS4 in academic year 2020 to 2021. We did not publish Progress 8 in 2020 to 2021, so many of these changes came into effect in the 2021 to 2022 performance measures. The way we define low, middle and high prior attainment at KS4 using KS2 scaled scores was reflected in KS4 attainment statistics and accompanying data files published in November 2021.
When reporting on prior attainment, we define low, middle and high prior attainment at KS4 using KS2 scaled scores as follows:
Table 1: Low, middle and high prior attainment definitions
| Prior Attainment Group | Average scaled score in English reading and maths |
|---|---|
| Low prior attainers | Below 100 |
| Middle prior attainers | Greater than or equal to 100, but less than 110 |
| High prior attainers | Greater than or equal to 110 |
Using these definitions changed the percentage of pupils in each group, compared to when prior attainment was defined using national curriculum levels. This is discussed in the KS4 attainment statistics publication published in November 2021.
Pupils working below the standard of the test at KS2 are assigned nominal point scores for the purposes of including them in prior attainment measures. The process used from 2021 to define low, middle and high prior attainment is described in guidance accompanying the 2023 KS4 attainment statistics publication.
Pupils with test results in both English reading and maths
Most pupils will have been awarded a scaled score for English reading and maths. For these pupils, their prior attainment has been calculated as the average of their English reading and maths scaled scores.
Average scaled scores are calculated to one decimal place. For example, a pupil with an English reading scaled score of 110 and a maths scaled score of 105 would be allocated an average scaled score of 107.5.
KS2 scaled scores, when used for the purpose of the Progress 8 baseline, do not have special consideration applied.[footnote 11]
Pupils working below the level of the test
Pupils working below the level of the test will have KS2 teacher assessed outcomes instead of test results. To include these pupils in Progress 8, their teacher-assessed outcomes have been given nominal scaled scores. The average scaled score is calculated either by averaging their English reading and maths nominal scores, or, if a pupil has one teacher-assessed outcome and one test result, by averaging the test score with the nominal scaled score.
As in previous years, we have allocated a nominal point score for pupils without a pre-key stage teacher assessment who were entered for the test but gained too few marks to achieve a scaled score. These pupils will have been allocated the code “N12”. In 2024, the points assigned to code N are 79.
Pupils with a pre-key stage teacher assessed outcome are converted into nominal scaled scores using the KS2 methodology from the year the pupil completed their KS2 studies. Most pupils reaching the end of KS4 in academic year 2023 to 2024 will have completed their KS2 assessments in 2019. Some will have completed KS2 in 2018 or 2020. The methodology used to convert KS2 teacher assessed outcomes to nominal scaled scores in 2017, 2018 and 2019 is described below. Primary tests and assessments were cancelled in 2020 due to COVID-19 disruption.
In 2016, pupils were allocated 1 of 4 nominal scaled scores, depending on whether they were assessed as being below the interim pre-key stage standards, meeting the foundations for the expected standard, showing early development of the expected standard or showing evidence for growing development of the expected standard.
In 2019, new pre-key stage standards were used to report teacher assessment in English reading, English writing and mathematics for pupils working below the standard of national curriculum assessments engaged in subject specific study. The pre-key stage standards replaced the interim pre-key stage standards and P scales 5 to 8. The pre-key stage standards included 6 standards at KS2.
P scales 1 to 4 were still used for the statutory assessment of pupils not yet engaged in subject specific study at the end of KS2.
The nominal scaled scores allocated to pupils with KS2 teacher assessed outcomes obtained from 2016 to 2019 are shown in table 2 and table 3.
For 2017, 2018 and 2019, we planned to allocate nominal scores between 59 and 71 to pupils with P scale teacher assessments, depending on the pupil’s P scale, for the purposes of calculating Progress 8. This was not possible for technical reasons. We will consider how we might include pupils assessed against the engagement model (the assessment that has since academic year 2021 to 2022 replaced P scales 1 to 4) when it becomes possible to produce Progress 8 in 2026 to 2027.
Table 2: Points allocated to KS2 teacher assessment categories 2016 to 2018
| Teacher assessment for pupils below the level of the test at KS2 (2016 to 2018) | Points (below the scaled score range) 2016 | Points (below the scaled score range) 2017 | Points (below the scaled score range) 2018 |
|---|---|---|---|
| Pupils below the interim pre-key stage standard | 70 | 71 | 71 |
| Foundations for the expected standard | 73 | 73 | 73 |
| Early development of the expected standard | 76 | 76 | 76 |
| Growing development of the expected standard | 79 | 79 | 79 |
Table 3: Points allocated to each Key Stage 2 teacher assessment category 2019
| Teacher assessment for pupils below the level of the test at KS2 (2019) | Points (below the scaled score range) 2019 |
|---|---|
| Below pre-key stage standard | 62 |
| Standard 1 | 64 |
| Standard 2 | 64 |
| Standard 3 | 70 |
| Standard 4 | 73 |
| Standard 5 (working towards the KS1 expected standard) | 76 |
| Standard 6 (working towards the KS1 expected standard) | 79 |
Pupils missing a result
Some pupils might not have test results or teacher assessed outcomes in both English reading and maths. Where pupils have only one, their average scaled score is equal to their one result. These pupils are then treated in the same way as pupils with results in both English reading and maths for the purposes of placing them into prior attainment groups and calculating their Progress 8 scores.
Pupils who have no KS2 assessment
Some pupils do not have KS2 results that can be used as a starting point for measuring Progress 8. This includes pupils who joined secondary school from private schools or overseas, or whose KS2 test results were cancelled because of issues with how the tests were carried out. These pupils’ scores will not be included in the Progress 8 measure (and the pupils will not be included in the denominator when calculating the average of the progress scores for the school).
However, these pupils will be included in the attainment measures for the school, unless they have arrived from a non-English speaking country in year 10 or year 11 and the school requests for their results to be removed. We expect the school to be able to discuss with Ofsted, parents and others the progress these pupils have made through secondary school.
Table 4: Disregard codes for Key Stage 2 teacher assessment categories
| Disregard codes | Description |
|---|---|
| A | Absent |
| D | Disapplied |
| F | Pupil will take the test in the future |
| HNM | Has not met the standard |
| L | Left |
| M | Missing |
| P | Pupil has taken the test in the past |
| Z | Ineligible |
Prior Attainment Group thresholds for pupils with extremely negative progress scores
Minimum thresholds are set using revised data for mainstream provision.[footnote 12] Where a minimum score is set for a prior attainment group, it is based on the variation in pupil progress scores within that prior attainment group (as measured by the standard deviation). The minimum scores are fixed at a set number of standard deviations below the mean for that prior attainment group so that approximately 1% of pupils are identified nationally[footnote 13] (in most cases, this is no more than 1 or 2 pupils per school).
By design, these minimum scores will change each year. As such, predicting if a pupil’s score will be affected by this methodology change, in advance of progress scores being made available, is not possible.
Adjusting extremely negative progress scores, number of standard deviations and prior attainment group thresholds
The threshold score applied to the pupil’s progress score is dependent on the prior attainment group that the pupil is in.[footnote 14] To work these thresholds out:
-
Calculate the mean and standard deviation of Progress 8 scores within each prior attainment group.
-
Ascertain the number of standard deviations each pupil’s Progress 8 score is from their prior attainment group average.
-
Order the numbers of standard deviations from low to high and select the number of standard deviations such that about 1% of pupils nationally[footnote 15] are below this value. In 2024, this number is -2.802937, to 6 decimal places.
-
Multiply the standard deviations in the first step with the results from the third step to give the threshold for each prior attainment group (the minimum score for that prior attainment group).
-
If a pupil’s original score falls below the minimum calculated in step 4, their progress score will be replaced with the new minimum.
-
Average the adjusted progress score to calculate the school’s progress score.
Confidence intervals
A 95% confidence interval is calculated for each school’s Progress 8 score. This gives an estimated range where we can be statistically confident that the true value of the Progress 8 score lies.
The confidence interval, denoted [Low CIs , UppCIs] is given by the formula :
[Low CIs , UppCIs] = [P8s - CIs , P8s + CIs]
where:
| LowCIs | is the lower confidence limit for the school’s Progress 8 score |
| UppCIs | is the upper confidence limit for the school’s Progress 8 score |
| P8s | is the school’s Progress 8 score |
| CIs | is the size of the confidence interval for the school’s Progress 8 score |
CIs = 1.96 × σN/√( ns)
where:
| 1.96 | is the critical value for a 95% confidence interval |
| σN | is the standard deviation of the Progress 8 scores for all eligible pupils nationally |
| ηs | is the number of eligible pupils that belong to the school |
The national average Progress 8 score of all pupils at state-funded maintained mainstream school scores will be 0.
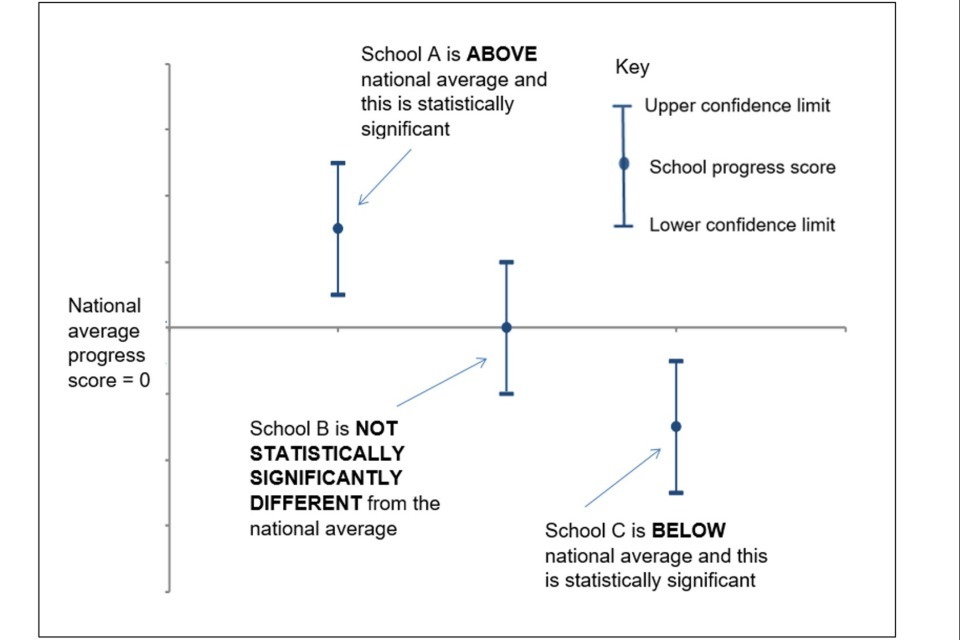
When a school has their:
- lower confidence interval limit higher than 0 (LowCIs > 0), the school’s Progress 8 score is above average, and the result is statistically significant
- upper confidence interval limit lower than 0 (UppCIs < 0), the school’s Progress 8 score is below average, and the result is statistically significant
- confidence interval straddle 0 (LowCIs < 0 <UppCI_s), the school’s Progress 8 score is likely to be above or below average, and the result is not statistically significant
Figure 1: Confidence intervals
Confidence intervals worked example
We can calculate the size of the confidence interval for the school’s Progress 8 score using CIs:
CIs = 1.96 x σ N = 1.96 × 1.415869/√142 = 1.96 × 0.1188 = 0.23
We derive the confidence interval for the school’s Progress 8 score:
= [+0.26 - 0.23 , +0.26 + 0.23] = [+0.03 , +0.49]
As Low CIs > 0, we can say that the school’s Progress 8 score is above the national average Progress 8 score, so this result is statistically significant.
National standard deviation of all Progress 8 scores and Progress 8 bucket scores
The standard deviations below are based on the Progress 8 scores of all eligible pupils at mainstream schools and are the national figures used in confidence interval calculations.
Table 5: Revised 2024 national standard deviations of Progress 8 and Progress 8 bucket scores
| Measure | Revised 2024 |
|---|---|
| Progress 8 | 1.415869 |
| Progress 8 English bucket | 1.613526 |
| Progress 8 maths bucket | 1.486500 |
| Progress 8 EBacc bucket | 1.636842 |
| Progress 9 open bucket | 1.616183 |
Table 6: Minimum scores in 2024
| KS2 prior attainment group | KS2 average scaled score range | Minimum threshold for adjusted Progress 8 |
|---|---|---|
| 1 to 16 | 59 to 102 | N/A |
| 17 | 102.5 to 103 | -4.087 |
| 18 | 103.5 to 104 | -4.161 |
| 19 | 104.5 to 105 | -4.174 |
| 20 | 105.5 to 106 | -4.242 |
| 21 | 106.5 to 107 | -4.262 |
| 22 | 107.5 to 108 | -4.268 |
| 23 | 108.5 to 109 | -4.229 |
| 24 | 109.5 to 110 | -4.253 |
| 25 | 110.5 to 111 | -4.274 |
| 26 | 111.5 to 112 | -4.190 |
| 27 | 112.5 to 113 | -4.112 |
| 28 | 113.5 to 114 | -3.960 |
| 29 | 114.5 to 115 | -3.797 |
| 30 | 115.5 to 116 | -3.686 |
| 31 | 116.5 to 117 | -3.539 |
| 32 | 117.5 to 118 | -3.448 |
| 33 | 118.5 to 119 | -3.119 |
| 34 | 119.5 to 120 | -2.748 |
Schools should use table 6 to see which prior attainment group a pupil will have been allocated to depending on their KS2 average scaled score, and what the lowest score they can be allocated in 2024 is.
Not all prior attainment groups have extremely negative scores. This is because the average Attainment 8 score for pupils in the lowest prior attainment groups will be relatively low. For example, in prior attainment group 1 (scaled scores between 59 and 82), the average Attainment 8 score was 15.96, whereas for prior attainment group 34 (scaled scores between 119.5 and 120), the average Attainment 8 score was 82.03. So, a pupil doing very badly in group 34 can get an extremely negative score (for example -8.20), whereas the lowest score a pupil in group 1 can get is -1.60.
It is only pupils in the middle to higher prior attainment groups that can gain a Progress 8 score that is so far below those for others with similar prior attainment that it has a disproportionate impact on the school’s score.
As set out in table 6, the lowest prior attainment groups (1 to 16) have minimum scores that are above the threshold for that prior attainment group, due to no pupils having scores extreme enough to be below the threshold. The middle to higher prior attainment groups (17 to 34) have pupils with extreme progress scores below the threshold. These are the only prior attainment groups where pupils’ scores have been changed by this methodology.
Provisional 2024/25 Attainment 8 averages
Each Attainment 8 average is the average Attainment 8 score of all pupils nationally in state-funded mainstream schools within the same prior attainment group at KS2. The following tables show the provisional Attainment 8 averages for each KS2 prior attainment group, based on the 2025 cohort averages.
Changes to national subject entry patterns and performance, as well as changes in methodology for calculating measures and the approach to grading, can cause these averages to change. Schools may change their curriculum offer in response to the Progress 8 measure, so any modelling based on current national results can be misleading.
Table 7: Provisional 2025 Attainment 8 averages and English, maths, EBacc and open averages for each KS2 prior attainment group
| KS2 prior attainment group | KS2 average scaled score range | Attainment 8 average | English average | Maths average | EBacc average | Open average |
|---|---|---|---|---|---|---|
| 1 | 59 to 82 | 15.96 | 3.86 | 2.39 | 4.37 | 5.35 |
| 2 | 82.5 to 86 | 16.64 | 4.18 | 2.50 | 4.37 | 5.59 |
| 3 | 86.5 to 87.5 | 19.02 | 4.76 | 3.07 | 5.00 | 6.19 |
| 4 | 88 to 89 | 20.79 | 5.15 | 3.45 | 5.49 | 6.71 |
| 5 | 89.5 to 90.5 | 22.01 | 5.37 | 3.75 | 5.86 | 7.03 |
| 6 | 91 to 92 | 23.71 | 5.74 | 4.16 | 6.34 | 7.48 |
| 7 | 92.5 to 93 | 25.02 | 6.02 | 4.48 | 6.67 | 7.84 |
| 8 | 93.5 to 94 | 26.43 | 6.34 | 4.82 | 7.06 | 8.22 |
| 9 | 94.5 to 95 | 27.65 | 6.55 | 5.13 | 7.44 | 8.53 |
| 10 | 95.5 to 96 | 29.13 | 6.82 | 5.51 | 7.92 | 8.89 |
| 11 | 96.5 to 97 | 30.24 | 7.03 | 5.78 | 8.20 | 9.23 |
| 12 | 97.5 to 98 | 32.30 | 7.46 | 6.24 | 8.82 | 9.78 |
| 13 | 98.5 to 99 | 33.78 | 7.73 | 6.56 | 9.29 | 10.19 |
| 14 | 99.5 to 100 | 35.47 | 8.06 | 6.95 | 9.81 | 10.65 |
| 15 | 100.5 to 101 | 37.27 | 8.39 | 7.32 | 10.39 | 11.18 |
| 16 | 101.5 to 102 | 38.94 | 8.72 | 7.68 | 10.90 | 11.65 |
| 17 | 102.5 to 103 | 41.03 | 9.10 | 8.13 | 11.59 | 12.20 |
| 18 | 103.5 to 104 | 42.98 | 9.47 | 8.52 | 12.23 | 12.75 |
| 19 | 104.5 to 105 | 45.13 | 9.85 | 8.98 | 12.95 | 13.35 |
| 20 | 105.5 to 106 | 47.46 | 10.28 | 9.45 | 13.74 | 13.99 |
| 21 | 106.5 to 107 | 49.77 | 10.70 | 9.93 | 14.51 | 14.63 |
| 22 | 107.5 to 108 | 52.57 | 11.17 | 10.53 | 15.48 | 15.39 |
| 23 | 108.5 to 109 | 55.30 | 11.66 | 11.09 | 16.38 | 16.18 |
| 24 | 109.5 to 110 | 57.61 | 12.06 | 11.57 | 17.16 | 16.82 |
| 25 | 110.5 to 111 | 60.22 | 12.50 | 12.12 | 18.06 | 17.54 |
| 26 | 111.5 to 112 | 62.87 | 12.99 | 12.63 | 18.92 | 18.33 |
| 27 | 112.5 to 113 | 65.48 | 13.39 | 13.20 | 19.81 | 19.07 |
| 28 | 113.5 to 114 | 68.16 | 13.82 | 13.77 | 20.73 | 19.84 |
| 29 | 114.5 to 115 | 70.61 | 14.23 | 14.29 | 21.53 | 20.56 |
| 30 | 115.5 to 116 | 73.17 | 14.60 | 14.91 | 22.36 | 21.31 |
| 31 | 116.5 to 117 | 75.47 | 14.95 | 15.42 | 23.10 | 21.99 |
| 32 | 117.5 to 118 | 77.28 | 15.27 | 15.77 | 23.69 | 22.55 |
| 33 | 118.5 to 119 | 79.75 | 15.70 | 16.26 | 24.42 | 23.37 |
| 34 | 119.5 to 120 | 82.03 | 16.15 | 16.71 | 25.02 | 24.15 |
Table 8: Provisional 2025 EBacc pillar averages for each KS2 prior attainment group
| KS2 prior attainment group | KS2 average scaled score range | Science average | Humanities average | Languages average |
|---|---|---|---|---|
| 1 | 59 to 82 | 1.83 | 1.72 | 4.36 |
| 2 | 82.5 to 86 | 1.78 | 1.50 | 3.22 |
| 3 | 86.5 to 87.5 | 2.01 | 1.70 | 3.22 |
| 4 | 88 to 89 | 2.15 | 1.84 | 3.31 |
| 5 | 89.5 to 90.5 | 2.30 | 1.92 | 3.21 |
| 6 | 91 to 92 | 2.43 | 2.07 | 3.38 |
| 7 | 92.5 to 93 | 2.55 | 2.19 | 3.37 |
| 8 | 93.5 to 94 | 2.66 | 2.26 | 3.32 |
| 9 | 94.5 to 95 | 2.80 | 2.42 | 3.30 |
| 10 | 95.5 to 96 | 2.94 | 2.54 | 3.44 |
| 11 | 96.5 to 97 | 3.04 | 2.62 | 3.48 |
| 12 | 97.5 to 98 | 3.21 | 2.81 | 3.55 |
| 13 | 98.5 to 99 | 3.36 | 2.97 | 3.66 |
| 14 | 99.5 to 100 | 3.52 | 3.17 | 3.70 |
| 15 | 100.5 to 101 | 3.68 | 3.33 | 3.79 |
| 16 | 101.5 to 102 | 3.84 | 3.53 | 3.82 |
| 17 | 102.5 to 103 | 4.05 | 3.75 | 3.97 |
| 18 | 103.5 to 104 | 4.24 | 3.99 | 4.10 |
| 19 | 104.5 to 105 | 4.45 | 4.23 | 4.24 |
| 20 | 105.5 to 106 | 4.68 | 4.50 | 4.40 |
| 21 | 106.5 to 107 | 4.92 | 4.77 | 4.53 |
| 22 | 107.5 to 108 | 5.21 | 5.09 | 4.80 |
| 23 | 108.5 to 109 | 5.47 | 5.39 | 5.00 |
| 24 | 109.5 to 110 | 5.72 | 5.65 | 5.20 |
| 25 | 110.5 to 111 | 6.01 | 5.96 | 5.46 |
| 26 | 111.5 to 112 | 6.28 | 6.25 | 5.71 |
| 27 | 112.5 to 113 | 6.57 | 6.50 | 5.96 |
| 28 | 113.5 to 114 | 6.86 | 6.81 | 6.30 |
| 29 | 114.5 to 115 | 7.13 | 7.05 | 6.49 |
| 30 | 115.5 to 116 | 7.41 | 7.29 | 6.80 |
| 31 | 116.5 to 117 | 7.66 | 7.51 | 7.07 |
| 32 | 117.5 to 118 | 7.87 | 7.69 | 7.28 |
| 33 | 118.5 to 119 | 8.12 | 7.92 | 7.59 |
| 34 | 119.5 to 120 | 8.33 | 8.13 | 7.79 |
Table 9: Provisional 2025 Average EBacc and open slots filled for each KS2 prior attainment group
| KS2 prior attainment group | KS2 average scaled score range | Average EBacc slots filled (out of 3) | Average open slots filled (out of 3) |
|---|---|---|---|
| 1 | 59 to 82 | 1.86 | 2.05 |
| 2 | 82.5 to 86 | 2.12 | 2.23 |
| 3 | 86.5 to 87.5 | 2.23 | 2.32 |
| 4 | 88 to 89 | 2.33 | 2.42 |
| 5 | 89.5 to 90.5 | 2.39 | 2.45 |
| 6 | 91 to 92 | 2.45 | 2.49 |
| 7 | 92.5 to 93 | 2.48 | 2.53 |
| 8 | 93.5 to 94 | 2.55 | 2.59 |
| 9 | 94.5 to 95 | 2.57 | 2.61 |
| 10 | 95.5 to 96 | 2.61 | 2.63 |
| 11 | 96.5 to 97 | 2.63 | 2.66 |
| 12 | 97.5 to 98 | 2.68 | 2.70 |
| 13 | 98.5 to 99 | 2.70 | 2.72 |
| 14 | 99.5 to 100 | 2.73 | 2.74 |
| 15 | 100.5 to 101 | 2.77 | 2.78 |
| 16 | 101.5 to 102 | 2.79 | 2.79 |
| 17 | 102.5 to 103 | 2.81 | 2.82 |
| 18 | 103.5 to 104 | 2.83 | 2.83 |
| 19 | 104.5 to 105 | 2.85 | 2.86 |
| 20 | 105.5 to 106 | 2.87 | 2.87 |
| 21 | 106.5 to 107 | 2.89 | 2.89 |
| 22 | 107.5 to 108 | 2.91 | 2.90 |
| 23 | 108.5 to 109 | 2.92 | 2.92 |
| 24 | 109.5 to 110 | 2.93 | 2.93 |
| 25 | 110.5 to 111 | 2.94 | 2.93 |
| 26 | 111.5 to 112 | 2.95 | 2.94 |
| 27 | 112.5 to 113 | 2.95 | 2.95 |
| 28 | 113.5 to 114 | 2.96 | 2.96 |
| 29 | 114.5 to 115 | 2.97 | 2.96 |
| 30 | 115.5 to 116 | 2.97 | 2.97 |
| 31 | 116.5 to 117 | 2.98 | 2.97 |
| 32 | 117.5 to 118 | 2.98 | 2.97 |
| 33 | 118.5 to 119 | 2.98 | 2.98 |
| 34 | 119.5 to 120 | 2.99 | 2.99 |
Progress 8 bandings
How we calculated the bandings for 2024
If a school’s banding is:
- “well above average”, it means the progress score is greater than or equal to 0.5, and the entire confidence interval is above 0.
16% of state-funded mainstream schools in England - “above average”, it means the progress score is greater than 0 but lower than 0.5, and the entire confidence interval is above 0.
18% of state-funded mainstream schools in England - “below average”, it means that the progress score is score is lower than 0 but greater than or equal to -0.5, and the entire confidence interval is below 0.
17% of state-funded mainstream schools in England - “well below average”, it means that the progress score is score is lower than -0.5 and the entire confidence interval is below 0.
16% of state-funded mainstream schools in England
Annex B: Attainment 8 worked examples (usual methodology)
Calculating Attainment 8
Worked Example A
Table 10 sets out how the Attainment 8 score would be calculated for Pupil A, based on current point scores.
Table 10: KS4 results for Pupil A
| ID | Qualification | Grade | Points | Included in the measure | Bucket | Doubled? | Total points |
|---|---|---|---|---|---|---|---|
| Qa1 | GCSE maths | 7 | 7 | Yes | Maths | Yes | 14 |
| Qa2 | GCSE English language | 8 | 8 | Yes | English | Yes | 16 |
| Qa3 | GCSE English literature | 6 | 6 | Yes | Open | No | 6 |
| Qa4 | GCSE biology | 7 | 7 | Yes | EBacc | No | 7 |
| Qa5 | GCSE art | 4 | 4 | Yes | Open | No | 4 |
| Qa6 | GCSE physics | 6 | 6 | Yes | EBacc | No | 6 |
| Qa7 | GCSE French | 9 | 9 | No | |||
| Qa8 | AS Level French | C | 7 | Yes | EBacc | No | 7 |
| Qa9 | GCSE Spanish | 6 | 6 | Yes | Open | No | 6 |
| Qa10 | GCSE religious studies | 3 | 3 | No |
Referring to the IDs of qualifications above, the following illustrates the calculation of the Attainment 8 score for Pupil A:

The calculation of the Attainment 8 score for Pupil A is:
Attainment 8 score = (Qa1 + Qa1) + (Qa2 + Qa2 as taken English literature) + (Qa4 + Qa6 + Qa8 + Qa3 + Qa5 + Qa9)
= (7 + 7) + (8 +8) + (7 + 6 + 7 + 6 +4 +6)
= 66
Dividing the Attainment 8 score by 10 gives the pupil’s average grade: 6.6.
Worked Example B
Table 11 sets out how the Attainment 8 score would be calculated for Pupil B.
Table 11: KS4 results for Pupil B
| ID | Qualification | Grade | Points | Included in the measure | Bucket | Doubled? | Total points |
|---|---|---|---|---|---|---|---|
| Qb1 | GCSE Maths | 3 | 3 | Yes | Maths | Yes | 6 |
| Qb2 | GCSE English Language | 4 | 4 | Yes | English | No | 4 |
| Qb3 | GCSE Combined Science | 5-5 | 5 | Yes | EBacc EBacc | No No | 55 |
| Qb4 | GCSE Computer Science | 4 | 4 | Yes | EBacc | No | 4 |
| Qb5 | WJEC Vocational Award in Hospitality and Catering | Level 2 Distinct ion | 7 | Yes | Open | No | 7 |
| Qb6 | Pearson BTEC Tech Award in Sport | Level 2 Merit | 5.5 | Yes | Open | No | 5.5 |
| Qb7 | NCFE Level 1/2 Technical Award in Business and Enterprise | Level 2 Pass | 4 | Yes | Open | No | 4 |
| Qb8 | Pearson BTEC Tech Award in Health and Social Care | Level 1 Pass | 1.25 | No |

The calculation of the Attainment 8 score for Pupil B is:
Attainment 8 score = (Qb1 + Qb1) + (Qb2 + 0) + (Qb3 + Qb3+ Qb4 + Qb5 + Qb6 +Qb7)
= (3 + 3) + (4 +0) + (5 + 5 + 4 +7 + 5.5 +4)
= 40.5
Dividing the Attainment 8 score by 10 gives the pupil’s average grade: 4.05.
Pupil B has not taken English literature, so the score for English language is not doubled. They have also taken 2 EBacc subjects, as computer science[footnote 16] counts as a separate science in addition to combined science, so they score in each of the 3 EBacc slots. The 3 highest scores from the 4 technical awards they entered count towards the open slots.
Calculating a pupil’s Progress 8 score
Pupil B has an Attainment 8 score of 40.5. Their KS2 scaled score was 101. The national average revised Attainment 8 score for pupils with Pupil B’s KS2 result is 37.27 in 2024. Revised 2024 attainment averages are shown in annex A. Pupil B’s Progress 8 score is the difference between their actual Attainment 8 score and the estimated Attainment 8 score, divided by 10: 40.5 – 37.27 = 3.23 /10 = 0.32 (to 2 decimal points).
Calculating a school’s Progress 8 score
The school’s Progress 8 score is the mean average of its pupils Progress 8 scores.
Worked example A
Pupil B is 1 of 142 pupils in their school’s KS4 cohort, who gain a range of Progress 8 scores:
Table 12: Worked example of unadjusted school Progress 8 score
| Pupil Number | Pupil name | P8 score |
|---|---|---|
| 1 | Pupil B | +0.32 |
| 2 | Pupil C | -0.20 |
| … | Pupil… | … |
| 142 | Pupil Z | +1.10 |
| Sum: | +36.94 |
The school’s unadjusted Progress 8 score is calculated as the mean (the sum of the P8 score divided by the number of pupils). In this example, this is 36.94/142 = 0.26.
Calculating a school’s (adjusted) Progress 8 score
At Pupil B’s school, Pupil E is the only person in the school with an extremely negative Progress 8 score. Pupil E’s KS2 prior attainment was higher than most pupils nationally and has a KS2 scaled score of 116. They achieved no Attainment 8 points by the end of KS4. As a result, their (unadjusted) Progress 8 score is -7.32.
In this case, the minimum progress for pupils in Pupil E’s prior attainment group is -3.69. Therefore, this extremely negative pupil progress score will be adjusted from -7.32 to -3.69.
Table 13: Worked example of school adjusted Progress 8 score
| Pupil Number | Pupil name | P8 score |
|---|---|---|
| 1 | Pupil F | +0.56 |
| 2 | Pupil C | -0.20 |
| 3 | Pupil E | -3.69 |
| … | Pupil… | … |
| 142 | Pupil Z | +1.10 |
| Sum: | +40.56 |
The school’s adjusted Progress 8 score is calculated as 40.56/142 = 0.29. Note that the unadjusted score in the previous example was 0.26.
The impact is larger on smaller schools. For example, if there are 50 pupils in this school at the end of KS4, then this would have raised the school’s adjusted Progress 8 score to 0.81 from an unadjusted score of 0.74.
Annex C: EBacc APS worked examples – usual methodology
This measure shows pupils’ point scores across the 5 pillars of the EBacc. The EBacc APS is calculated by allocating points to a pupil’s best grades in EBacc subjects. These are:
- the better grade of either English language or English literature when both subjects are taken
- the grade for maths
- the best 2 grades from exams taken in science (if the single sciences option is chosen, 3 out of 4 single sciences must be taken - the best 2 grades will be used from these subjects. If GCSE combined science is taken, then the grades for GCSE combined science are used)
- the better grade of either geography or history
- the best grade in a language
These points will be totalled for each pupil, with a 0 for any missing pillars, and then divided by 6 to create an APS score per pupil.[footnote 17] These scores are added together for all pupils in a school’s end of KS4 cohort and divided by the number in the cohort to calculate the EBacc APS per pupil.
Worked example 1
Table 14 sets out how the EBacc APS would be calculated for Pupil G, based on their attainment in EBacc subjects.
Table 14: KS4 results for Pupil G
| ID | Qualification | Grade | Points | Included in the measure | Pillar | Points used toward EBacc APS |
|---|---|---|---|---|---|---|
| Qc1 | GCSE English language | 8 | 8 | Yes | English | 8 |
| Qc2 | GCSE English literature | 7 | 7 | No | English | No |
| Qc3 | GCSE Maths | 5 | 5 | Yes | Maths | 5 |
| Qc4 | GCSE Biology | 4 | 4 | No | Science | No |
| Qc5 | GCSE Physics | 5 | 5 | No | Science | No |
| Qc6 | GCSE Chemistry | 7 | 7 | Yes | Science | 7 |
| Qc7 | GCSE Computer Science | 7 | 7 | Yes | Science | 7 |
| Qc8 | GCSE History | 5 | 5 | Yes | Humanities | 5 |
| Qc9 | GCSE French | 4 | 4 | Yes | Languages | 4 |
| Qc10 | GCSE Religious studies | 5 | 5 | No | None - does not count towards EBacc | No |
Pupil G sat both English language and English literature, so their English score can be used toward their EBacc APS. Their score in the English pillar was taken from English language as this was their best result. Pupil G took a maths GCSE that counts towards the EBacc maths pillar, so this score is used.
Pupil G chose the single sciences option and sat 4 single sciences, so their science score can be used toward their EBacc APS. Their 2 highest scoring grades were in GCSE chemistry and GCSE computer science.
Pupil G’s results for history and French are used toward the humanities and languages pillars, respectively. Pupil G did not enter for other qualifications in these areas, so these points are used. GCSE religious studies does not count toward the EBacc, so is not used in the calculation of EBacc APS.
Total EBacc point score = Qc1 + Qc3 + + Qc6 + Qc7 + Qc8 + Qc9
= 8 + 5 + (7 + 7) + 5+ 4
= 36
Average EBacc point score = 36 ÷ 6 = 6
Worked example 2
Table 15 sets out how the EBacc APS would be calculated for Pupil H, based on their attainment in EBacc subjects.
Table 15: KS4 results for Pupil H
| ID | Qualification | Grade | Points | Included in the measure | Pillar | Points used toward EBacc APS |
|---|---|---|---|---|---|---|
| Qd1 | GCSE English language | 3 | 3 | No | English | No |
| Qd2 | GCSE Maths | 5 | 5 | Yes | Maths | 5 |
| Qd3 | GCSE Combined Science | 3-3 | 6 | Yes | Science | 6 |
| Qd4 | GCSE German | 4 | 4 | Yes | Languages | 4 |
| Qd5 | GCSE Music | 4 | 4 | No | None – does not count towards EBacc | No |
| Qd6 | BTEC Travel and Tourism | Distinction | 7 | No | None – does not count towards EBacc | No |
Pupil H did not sit both English language and English literature, so their English score cannot be used toward their EBacc APS. Pupil H took GCSE maths, which counts towards the EBacc maths pillar, so this score can be used.
Pupil H took GCSE combined science so both grades are used towards EBacc APS. Their GCSE German qualification counts towards the EBacc languages pillar. However, Pupil H did not take any humanities qualifications so scores a 0 for this pillar for EBacc APS. Their remaining 2 qualifications do not count towards EBacc, so cannot be included in the calculation.
Total EBacc point score = Qd2 + Qd3 + Qd4
= 0 (English) + 5 + (3 + 3) + 0 (Humanities)+ 4
= 15
Average EBacc point score =
15÷ 6 = 2.5
Calculating a school’s EBacc APS score
Pupil G and Pupil H are 2 of 200 pupils in their school’s KS4 cohort, each assigned EBacc APS scores:
Table 16: School EBacc APS score
| Pupil number | Pupil name | EBacc APS | |
|---|---|---|---|
| 1 | Pupil G | 6.0 | |
| 2 | Pupil C | 5.42 | |
| … | Pupil… | … | |
| 200 | Pupil Z | 2.5 | |
| Sum: | 912.43 | ||
The school’s EBacc APS is calculated as 912.43/200= 4.56
Annex D: adapted methodology and worked examples for results achieved between January 2020 and August 2021
Early entries achieved between January 2020 to August 2021
Note that early entries from 2019 to 2020 or earlier are not counted in the 2025 KS4 performance measures as we only include early entries from the 5 year period covered by Progress 8. The guidance that follows only covers entries from 2021, as 2020 entries are now out of scope, whereas in 2022 to 2024 KS4 performance measures, the guidance also applied to 2019 to 20 entries.
The previous government decided that results from qualifications achieved between January 2020 and August 2021 would not be used in school and college level performance measures in future years[footnote 18]. Considering this, the methodology for calculating KS4 performance measures for 2021 to 2022 was adjusted. This was to take account of pupils entered early[footnote 19] for qualifications between January 2020 and August 2021, who have reached the end of KS4 in academic year 2021 to 2022. We will continue to apply this adapted methodology when calculating KS4 performance measures for 2023 to 2024 where a pupil has entered a qualification early and has a qualification result achieved between January 2020 and August 2021.
It is important to note that these changes to methodology minimise, but cannot eliminate, the impact of gaps in data. The approach was the best option available given the commitment not to use qualification results achieved between January 2020 and August 2021. Messages were in performance tables to highlight the change in methodology and potential impact on a school’s performance measures.
When calculating KS4 performance measures for 2023 to 2024, we have counted entries (but not results) from qualifications taken between January 2020 and August 2021.[footnote 20]
Discounting and early entries from qualifications achieved between January 2020 and August 2021 and re-entries in the 2023 to 2024 academic year
Discounting ensures that where a pupil has taken 2 or more qualifications with a significant overlap in content, the performance measures only give credit once for teaching a single course of study.
Where a pupil has been entered early in a subject between January 2020 and August 2021 and is then re-entered for the same subject in the 2023 to 2024 academic year, the best entry rule will apply as the earlier entries are from before the cut-off point at which first entry rules apply. If the 2023 to 2024 re-entry has a better grade than the 2020 or 2021 entry, then the 2023 to 2024 entry will count towards KS4 performance measures for 2023 to 2024.
If the earlier entry has the highest grade, this will discount the 2023 to 2024 re-entry and neither will count in 2023 to 2024 KS4 performance measures. More information can be found in the discounting and early entries guidance.
Worked example of Progress 8/Attainment 8 with adapted methodology
Pupil F has entered GCSE English literature early in year 8 in the academic year 2020 to 2021, gaining a grade 7, and GCSE English language in year 11 in academic year 2023 to 2024, gaining a grade 6. The 2020 to 2021 entry in English literature is used to trigger the double weighting for English. In line with DfE’s commitment not to use qualification results achieved between January 2020 and August 2021 in future measures, only the grade 6 (double weighted) in English language gained in the 2023 to 2024 academic year would count towards their school’s performance measures.
Pupil F would be assigned 12 performance measure points for English in Attainment 8/Progress 8 for academic year 2023 to 2024. The English literature grade from academic year 2020 to 2021 would not be included.
Step 1: English & Maths
Pupil F has entered both English literature and English language and so triggers double weighting. However, because their English literature entry was in 2021, we cannot use the grade. Instead, we double weight their English language grade in the final calculation.
Table 17: Step 1 in Progress 8 worked example using adapted methodology
| Subject | Year Taken | Grade | Points Used in P8/A8 |
|---|---|---|---|
| English literature | 2021 | 7 | No |
| English language | 2024 | 6 | 12 |
| Maths | 2024 | 7 | 14 |
Step 2: EBacc qualifications
Pupil F’s 3 highest scoring EBacc qualifications count towards the EBacc bucket. The remaining qualifications can count in the ‘Other’ bucket.
Table 18: Step 2 in Progress 8 worked example using adapted methodology
| Subject | Year Taken | Grade | Points Used in P8/A8 |
|---|---|---|---|
| Chemistry | 2024 | 8 | 8 |
| Biology | 2024 | 6 | 6 |
| Physics | 2024 | 5 | 5 |
| History | 2024 | 5 | No |
| German | 2024 | 4 | No |
Step 3: Other qualifications
The 3 best results of the remaining qualifications are counted from the ‘Other’ bucket.
Pupil F’s final Attainment 8 score = 12 + 14 + 8 + 6 + 5 + 5 + 6 + 8 = 64
Table 19: Step 3 in Progress 8 worked example using adapted methodology
| Subject | Year Taken | Grade | Points Used in P8/A8 |
|---|---|---|---|
| History | 2024 | 5 | 5 |
| German | 2024 | 4 | No |
| Music | 2024 | 6 | 6 |
| Art | 2024 | 8 | 8 |
Calculating a pupil’s Progress 8 score – adapted methodology continued
Pupil F has an Attainment 8 score of 64. Their KS2 scaled score was 110. The national average revised Attainment 8 score for pupils with Pupil F’s KS2 result is 57.61 in 2024. Revised 2024 attainment averages are shown in annex A. Pupil F’s Progress 8 score is the difference between their actual Attainment 8 score and the estimated Attainment 8 score, divided by 10. That becomes: 64-57.61 = 6.39/10 = 0.64 (to 2 decimal places).
Table 20: Worked example of pupil Progress 8 score
| Pupil F’s prior attainment group – includes those with scaled score of | Average Attainment 8 score of all pupils in this prior attainment group | Pupil F’s estimated Attainment 8 score | Pupil F’s actual Attainment 8 score | Pupil F’s Progress 8 score (actual estimate) |
|---|---|---|---|---|
| 109.5 to 110 | 57.61 | 64 | (64-57.61)/10=0.64 |
Calculating a school’s Progress 8 score
The school’s Progress 8 score is the mean average of its pupils’ Progress 8 scores.
Pupil F is 1 of 142 pupils in their school’s KS4 cohort, who gain a range of Progress 8 scores:
Table 21: Worked example of unadjusted school Progress 8 score
| Pupil number | Pupil name | EBacc APS | |
|---|---|---|---|
| 1 | Pupil F | +0.64 | |
| 2 | Pupil C | -0.20 | |
| … | Pupil… | … | |
| 142 | Pupil Z | +1.10 | |
| Sum: | +36.94 | ||
The school’s unadjusted Progress 8 score is calculated as 36.94/142 = 0.26.
Details of how an adjusted Progress 8 score is calculated is set out in annex A.
Worked example of EBacc attainment measures with adapted methodology
When calculating EBacc entry and attainment measures, we will count entries, but not results, from qualifications taken between January 2020 and August 2021.
EBacc attainment measures including EBacc APS, EBacc threshold attainment measures (9-5, 9-4, 9-1) and EBacc value added measures at school level may be impacted by the commitment not to use results from qualifications achieved between January 2020 and August 2021.
If a pupil was entered for GCSE Spanish in summer 2021, received a teacher assessed grade (TAG) and is entered for the other subjects required for EBacc entry in summer 2024, then the GCSE Spanish entry from summer 2021 would count towards the EBacc entry measure.
Given the commitment made by the previous government not to include qualification results achieved from January 2020 to August 2021 in performance measures, the grade achieved in GCSE Spanish in summer 2021 would not count towards any of the EBacc attainment measures for academic year 2023 to 2024. This would mean that the pupil would not be counted as having achieved a grade 5 or above in all EBacc subjects (even if the summer 2021 result is a grade 5 or above), and their EBacc APS score would be affected as they would not receive a score for the languages pillar.
Table 22 sets out how the EBacc APS would be calculated in 2024 for Pupil I, based on their attainment in EBacc subjects taken in 2021 and 2024 exam years.
Table 22: EBacc APS using adapted methodology
| Exam Number | Qualification | Grade | Points | Exam year | Exam season | Pillar | Points used toward EBacc APS |
|---|---|---|---|---|---|---|---|
| E1 | GCSE English language | 7 | 7 | 2024 | Summer | English | 7 |
| E2 | GCSE English literature | 8 | 0 | 2021 | Summer | English | No |
| E3 | GCSE maths | 7 | 7 | 2024 | Winter | Maths | 7 |
| E4 | GCSE combined science | 55 | 10 | 2024 | Summer | Science | 10 |
| E5 | GCSE geography | 6 | 6 | 2024 | Summer | Humanities | 6 |
| E6 | GCSE physical education | 7 | 7 | 2024 | Summer | None - does not count towards EBacc | No |
| E7 | GCSE Spanish | 9 | 0 | 2021 | Winter | Languages | No |
| E8 | GCSE French | 8 | 8 | 2024 | Summer | Languages | 8 |
| E9 | GCSE history | 7 | 0 | 2021 | Summer | Humanities | No |
| E10 | BTEC travel and tourism | Distinction | 7 | 2024 | Summer | None - does not count towards EBacc | No |
Total EBacc point score = E1 + E3 + E4 + E5 + E8
= 7 + 7 + 10 + 6 + 8 = 38
EBacc APS =
38 ÷ 6 = 6.33
Note that any exam from summer of 2021 has its points set to 0.
Despite Pupil I achieving a higher grade in GCSE English literature than GCSE English language, the GCSE English language score is the one used in the calculation.
The GCSE maths exam is a 2021 autumn resit, taken in the winter season, but not classed as an extraordinary resit, so the grade will be counted.
The GCSE Spanish exam is a 2021 autumn resit, taken in the winter season, but falls into the extraordinary exam series, so the grade will not count.
Note that GCSE French and GCSE Spanish do not discount each other, so the GCSE French result in 2024 can be counted.
Worked examples of science pathways with adapted methodology and impact on EBacc APS
Science pathways example 1
Table 23 sets out how the science pathways would work when calculating EBacc APS in 2024 for Pupil J, based on their attainment in EBacc subjects in 2021 and 2024 exam years.
Table 23: Science pathways 1
| Exam Number | Qualification | Grade | Points | Exam year | Exam Season | Pillar | Points used toward EBacc APS |
|---|---|---|---|---|---|---|---|
| E1 | GCSE English language | 6 | 6 | 2024 | Summer | English | No |
| E2 | GCSE English literature | 8 | 8 | 2024 | Summer | English | 8 |
| E3 | GCSE maths | 7 | 7 | 2024 | Summer | Maths | 7 |
| E4 | GCSE biology | 7 | 0 | 2021 | Summer | Science | No |
| E5 | GCSE | ||||||
| chemistry | 6 | 0 | 2021 | Summer | Science | No | |
| E6 | GCSE computer science | 5 | 5 | 2024 | Summer | Science | 5 |
| E7 | GCSE history | 7 | 7 | 2024 | Summer | Humanities | 7 |
| E8 | GCSE music | 6 | 6 | 2024 | Summer | None - does not count towards EBacc | No |
| E9 | GCSE religious studies | 7 | 6 | 2024 | Summer | None - does not count towards EBacc | No |
| E10 | GCSE German | 6 | 6 | 2024 | Summer | Languages | 6 |
Total EBacc point score = E2 + E3 + (E4 + E6) + E7 + E10
= 8 + 7 + (0+5) + 7 + 6
= 33
EBacc APS =
33 ÷ 6 = 5.5
Pupil J is on the individual science pathway because they entered GCSE biology and chemistry in summer 2021.
We can count their entries from summer 2021, but the results for those qualifications are allocated 0 points. Therefore, in the calculation (taking the 2 best grades in the individual sciences), we use the grade 5 from computer science, but it is coupled with a 0 from biology.
The calculation is still divided by 6, despite 2 qualification results not counting in the science pillar.
Science pathways example 2
Table 24 sets out how the science pathways would work when calculating EBacc APS in 2024 for Pupil K, based on their attainment in EBacc subjects in 2021 and 2024 exam years.
Table 24: Science pathways 2
| Exam Number | Qualification | Grade | Points | Exam year | Exam Season | Bucket | Points used toward EBacc APS |
|---|---|---|---|---|---|---|---|
| E1 | GCSE English language | 6 | 6 | 2024 | Summer | English | None |
| E2 | GCSE English literature | 8 | 8 | 2024 | Summer | English | 8 |
| E3 | GCSE maths | 7 | 7 | 2024 | Summer | Maths | 7 |
| E4 | GCSE physics | 6 | 0 | 2021 | Summer | Science | None |
| E5 | GCSE combined science | 7:7 | 0 | 2024 | Summer | Science | None |
| E6 | GCSE geography | 4 | 4 | 2024 | Summer | Humanities | 4 |
| E7 | GCSE French | 6 | 6 | 2024 | Summer | Languages | 6 |
| E8 | GCSE art | 6 | 6 | 2024 | Summer | None - not part of the EBacc | None |
| E9 | GCSE drama | 5 | 5 | 2024 | Summer | None - not part of the EBacc | None |
| E10 | GCSE physical education | 7 | 7 | 2024 | Summer | None - not part of the EBacc | None |
Total EBacc point score = E2 + E3 + E6 + E7
= 8 + 7 + 0 + 4 + 6
= 25
EBacc APS =
25 ÷ 6 = 4.17
This example highlights how a pupil is allocated to a science pathway.
Pupil K starts on the Individual Science pathway in 2021 because they are entered for GCSE physics. They enter GCSE combined science in 2024. Pupil K is on the Individual Science pathway, and therefore their GCSE combined science results are discounted.
Note that Pupil K has also not met EBacc requirements for individual sciences. If a pupil is on the individual science pathway, 3 out of 4 single sciences must be chosen, and the 2 best grades will count towards EBacc APS.
Worked example of Attainment in English and maths measures with adapted methodology
We will count entries, but not results, from qualifications taken between January 2020 and August 2021, though results can affect discounting. If a pupil was entered for GCSE English literature in summer 2021, received a TAG and entered for GCSE English language and GCSE maths in academic year 2023 to 2024, then we will potentially count the results from GCSE English language and GCSE maths in 2023 to 2024.
If the pupil achieved a grade 5 in GCSE English literature in summer 2021 and a grade 4 in GCSE English language in academic year 2023 to 2024, neither result counts towards the attainment in English and maths at grade 4 and above, or towards attainment in English and maths at grade 5 and above. This is due to the best entry rules. The grade 5 discounts the grade 4, but the grade 5 would not count as the result was achieved in GCSE English literature in summer 2021.
If a pupil was entered for GCSE maths in summer 2021 and GCSE English language or GCSE English literature in 2023 to 2024, they would count as “entered in both subject areas”, but their GCSE maths grade from summer 2021 would not count towards the attainment in English and maths measure at grade 4 and above, or at grade 5 and above in academic year 2023 to 2024.
Table 25: Attainment in English and maths with adapted methodology
| Exam Number | Qualification | Grade | Exam year | Exam Season | Points | Discounted | Achieved 9-5 |
|---|---|---|---|---|---|---|---|
| E1 | GCSE English language | 6 | 2021 | Winter | 6 | No | Yes |
| E2 | GCSE English literature | 4 | 2024 | Summer | 4 | No | No |
| E3 | GCSE maths | 8 | 2021 | Summer | 0 | No | No |
| E4 | GCSE maths | 7 | 2024 | Summer | 0 | Yes | No |
Pupil G has taken the above exams relating to English and maths GCSEs.
The GCSE English language exam is a 2021 autumn resit, taken in the winter season, but not classed as an extraordinary resit, so therefore the grade will count.
Pupil G has also re-entered for GCSE maths in 2024, after receiving a TAG in 2021.
The 2021 TAG result cannot be used in 2024 calculations. However, because there is already an entry to GCSE maths in 2021, the 2024 re-entry is still discounted because of the best entry rule.
So Pupil G will receive a score of 0 for their maths bucket of this measure – and therefore not achieve the 9 to 5 English and maths measure overall.
Annex E: understanding destination measures
Data sources
Data from the national pupil database (NPD) are used to calculate education destinations. The NPD links pupil and student characteristics (for example age, gender, and ethnicity) to learning aims and attainment information for children in schools in England. Five administrative data sources used in compiling the NPD have been used to determine pupils’ education destinations. These are the:
- Individualised Learner Record (ILR) covering English FE providers and specialist post-16 institutions
- school census covering English schools
- awarding body data
- AP census
- Higher Education Statistics Authority (HESA) data covering UK universities
Employment data and out-of-work benefit data have been linked to the NPD to form the longitudinal education outcomes (LEO) dataset. Along with local authority data, LEO data is used to calculate employment destinations. Additional administrative datasets are also used. These are:
- employment data from His Majesty’s Revenue and Customs (HMRC)
- out-of-work benefit data from the Department for Work and Pensions and local authority
- data from the National Client Caseload Information System (NCCIS)
Cohort
The KS4 cohort is from state-funded mainstream schools and maintained and non-maintained special schools.
The national and local authority totals on the performance tables website include both state-funded mainstream and special schools.
Destinations are not reported for independent schools (including independent special schools).
Schools with destinations reported
The 2025 KS4 performance measures include information on schools which were open during academic year 2024 to 2025, and which had pupils at the end of KS4 in this academic year.
Since destination measures are calculated for pupils who completed KS4 at the school 2 years prior (in the academic year 2022 to 2023), not all schools with attainment results have destination measures reported.
The reference date for open schools is at the start of each academic year, so changes to school types, openings and closures between 12 September 2022 and 12 September 2024 affect reporting.
Information included in the table
Pupils staying in education or employment for at least 2 terms after KS4
Any sustained education, apprenticeship, or employment destination.
Total number of pupils included in destination measures (cohort)
This is the total number of pupils in the academic year 2022 to 2023 cohort and is used to create the denominator for the measure.
Pupils staying in education for at least 2 terms after KS4
Students finishing KS4 who stayed in education from October to March the following year, including at school sixth forms, sixth-form colleges, FE colleges and other settings in England.
Further education college or other further education provider
Sustained participation in one or more FE institutions identified from the ILR. General and specialist FE colleges (other than sixth-form colleges) are reported here as well as other FE providers.
Any provider in the ILR not identified as a sixth form college or FE college is listed as ‘other FE provider’. It also includes pupils studying FE in a higher education (HE) institution. Pupils may be identified within the HESA data as being registered for FE level study at a HE institution.
School sixth form
State-funded mainstream school sixth forms are identified from the school census data. The measure reports the proportion of the cohort participating at these institutions.
Sixth-form college
Sixth-form colleges are identified separately from the ILR data. The measure reports the proportion of the cohort participating at these institutions.
Other education
All remaining education destinations are grouped under this heading.
Independent schools
These destinations were identified from awarding body data that has been used to provide an indication of participation. For example, if a student sat an A level exam in Summer 2025, it has been assumed the student completed a 2-year course of study and fulfilled the full 6 months participation from October 2023 to March 2024.
Pupils are identified as attending independent schools if awarding body data provides an indication of participation, but there is no record of them attending other schools?
Alternative provision
Data on pupils in AP includes those who have their primary registration at a Pupil Referral Unit, an AP academy, an AP free school or a hospital school. These destinations include other AP of education funded by the local authority outside of state place funded schools. This includes independent schools, non-maintained special schools, and providers who do not meet the criteria for registration as a school.
Attendance via AP for a period of time in the first 5 months of the academic year is used as a proxy for sustained participation.
Special schools
Pupils recorded on the school census as attending maintained or non-maintained special schools.
Specialist post-16 institutions
This includes data on pupils attending specialist post-16 institutions, as obtained from the ILR data.
UK higher education institutions
Pupils who have gone to any HE institution in the UK for higher level study (level 4 and above), as recorded in HESA data.
Education combinations
Pupils identified as attending more than 1 type of institution over the 6 months. For example, a student may have attended an FE college for 3 months and a school sixth form for 3 months. Providing they fulfilled the sustained participation criteria across the institution types, they are counted in the measure.
Apprenticeships
Pupils who started an apprenticeship at any point in the year and continued it for at least 6 months (academic year 2023 to 2024). Since October 2018, apprenticeship destinations have been reported separately from education and employment.
Pupils staying in employment for at least 2 terms after KS4
Pupils finishing KS4 who were in employment in the UK from October to March the following year.
Employment destinations are calculated from HMRC data in the LEO dataset and NCCIS data recorded by local authorities. To count as a sustained destination, a pupil must be recorded as in employment in 5 out of the 6 months between October and March. A one month pause is permitted to allow for those pupils taking separate periods of temporary employment. Should the one month pause occur in March, then the student is required to be in employment in April for the destination to be counted as sustained.
Pupils with training participation recorded in NCCIS are also included in this category, as are those completing the required 6 months participation through a combination of employment and education.
This category also includes pupils who have been identified as being self-employed because they completed a self-assessed tax return in the destination year (covering the financial year from April 2023 to April 2024). This is only if they did not claim benefits for more than one month in the period from October to March.
Pupils who have sustained participation in education throughout the period are reported as being in a sustained education destination and not in employment, even if they were in employment alongside their study.
Pupils not staying in education or employment for at least 2 terms after KS4
Students finishing KS4 study who did not stay in education or employment for at least 2 terms. They may have been enrolled on a course or in employment for part of this time, but did not sustain this activity or were recorded by their local authority as not in education, employment or training (NEET) or claimed out-of-work benefits in the year.
Destination unknown
Students finishing KS4 who had no participation in education or employment found from October to March the following year and were not recorded by their local authority as NEET, nor recorded as receiving out-of-work benefits at any point in the year. Possible reasons for this could be that the young person was:
- not in education, employment, or training
- living, working, or studying overseas
- attending a Scottish, Welsh, or Northern Irish school or college
- undertaking activity other than paid employment or study in the UK
- not successfully matched to a record in our data sources
Suppression of destination data
The Code of Practice for Statistics requires us to take reasonable steps to ensure that our published or disseminated statistics protect confidentiality. Where appropriate, we apply disclosure control to protect confidentiality.
Annex F: English in the headline performance measures
Attainment 8 and, when available, Progress 8
If a pupil sits both English language and English literature, the higher grade is double-weighted. The lower grade can count in the ‘open’ bucket of these measures. If only GCSE English literature or English language is taken, then this qualification will count but will not be double-weighted.[footnote 21]
EBacc average point score
For English results to be included in the EBacc APS calculation, pupils must sit both English language and English literature. The better grade counts towards EBacc APS.[footnote 22]
Attainment in English and maths at grade 5 or above
A pupil needs to achieve a grade 5 or above in either English literature or English language. There is no requirement to sit both.
DfE also publishes the percentage of pupils achieving a grade 4 or above in English and maths. The same English requirements apply to this measure as for English and maths at grade 5 or above.
Annex G: point score scales for 2022 and future years
This annex explains the point score scales that are used in 2022 and future performance measures. A list of all qualifications which count at KS4, and their corresponding performance points, is available online.
Table 26: Point score scales for combined science qualifications in Attainment 8 and Progress 8
| Combined science qualification grade | Points |
|---|---|
| Grade 9-9 (Double Award) | 9 |
| Grade 9-8 (Double Award) | 8.5 |
| Grade 8-8 (Double Award) | 8 |
| Grade 8-7 (Double Award) | 7.5 |
| Grade 7-7 (Double Award) | 7 |
| Grade 7-6 (Double Award) | 6.5 |
| Grade 6-6 (Double Award) | 6 |
| Grade 6-5 (Double Award) | 5.5 |
| Grade 5-5 (Double Award) | 5 |
| Grade 5-4 (Double Award) | 4.5 |
| Grade 4-4 (Double Award) | 4 |
| Grade 4-3 (Double Award) | 3.5 |
| Grade 3-3 (Double Award) | 3 |
| Grade 3-2 (Double Award) | 2.5 |
| Grade 2-2 (Double Award) | 2 |
| Grade 2-1 (Double Award) | 1.5 |
| Grade 1-1 (Double Award) | 1 |
Table 27: Point score scales for level 1 qualifications
| Level 1 grade structure | Example grade | Points |
|---|---|---|
| 4 grade scheme | Distinction* | 3.00 |
| 4 grade scheme | Distinction | 2.00 |
| 4 grade scheme | Merit | 1.50 |
| 4 grade scheme | Pass | 1.00 |
| 3 grade scheme | Distinction | 3.00 |
| 3 grade scheme | Merit | 2.00 |
| 3 grade scheme | Pass | 1.25 |
| 2 grade scheme | Advanced Credit | 2.5 |
| 2 grade scheme | Credit | 1.25 |
| Pass only | Pass | 1.75 |
Table 28: Point score scales for level 2 qualifications
| Level 2 grade structure | Example grade | Points |
|---|---|---|
| 4 grade scheme | Distinction* | 8.50 |
| 4 grade scheme | Distinction | 7.00 |
| 4 grade scheme | Merit | 5.50 |
| 4 grade scheme | Pass | 4.00 |
| 3 grade scheme | Distinction | 7.75 |
| 3 grade scheme | Merit | 6.25 |
| 3 grade scheme | Pass | 4.00 |
| Pass only | Pass | 5.50 |
Table 29: Point score scales for AS level
| AS level grade | Points |
|---|---|
| A | 10.75 |
| B | 8.88 |
| C | 7.00 |
| D | 5.13 |
| E | 3.50 |
Table 30: Point score scales for graded music examinations
| Graded music level | Grade | Points |
|---|---|---|
| Grade 8 | Distinction | 8.50 |
| Grade 8 | Merit | 8.50 |
| Grade 8 | Pass | 8.50 |
| Grade 7 | Distinction | 8.50 |
| Grade 7 | Merit | 8.50 |
| Grade 7 | Pass | 7.00 |
| Grade 6 | Distinction | 8.50 |
| Grade 6 | Merit | 8.50 |
| Grade 6 | Pass | 7.00 |
Table 31: Point score scales for FSMQ
| Free standing maths qualification grade | Points |
|---|---|
| A | 5.13 |
| B | 4.00 |
| C | 3.25 |
| D | 2.50 |
| E | 1.88 |
Illustrative examples of how to use these tables – points for all qualifications can be calculated following this method
Example A – Calculating the points for a level 2 qualification with 4 passing grades
These qualifications are at level 2, so table 23 should be used.
There are 4 possible passing grades (Distinction*, Distinction, Merit, Pass), so the level 2 4-grade scheme should be used.
Table 32 shows the 2025 points for a level 2 qualification with 4 passing grades.
Table 32: Point score scales for level 2 qualification with 4 passing grades
| Level 2 qualification with four passing grades | Points |
|---|---|
| Distinction* | 8.50 |
| Distinction | 7.00 |
| Merit | 5.50 |
| Pass | 4.00 |
The performance points practical guide provides guidance on points.
Example B – Calculating the points for a BTEC Technical Award
BTEC Technical Awards can be both level 1 and level 2 qualifications.
At level 1, there are 3 possible outcomes (Level 1 Pass, Level 1 Merit, Level 1 Distinction), which makes for a 3-grade structure. Table 29 shows the points score scale for points between 1.25 and 3.0.
At level 2 in a BTEC Technical Award, there are 4 possible outcomes (Distinction*, Distinction, Merit, Pass) which makes for a 4-grade structure. Table 32 shows the points score scale for points between 4.00 and 8.50.
The table below shows the point score scales for the BTEC Technical Award:
Table 33: Point score scales for BTEC Technical Award
| BTEC Technical Award grade | Points |
|---|---|
| Level 2 Distinction* | 8.50 |
| Level 2 Distinction | 7.00 |
| Level 2 Merit | 5.50 |
| Level 2 Pass | 4.00 |
| Level 1 Distinction | 3.0 |
| Level 1 Merit | 2.0 |
| Level 1 Pass | 1.25 |
Example C – Calculating the points for an OCR Cambridge National Certificate
OCR Cambridge National Certificates can be both level 1 and level 2 qualifications.
Grades level 1 distinction, level 1 merit and level 1 pass are at level 1, which makes for a 3-grade structure. Table 22 shows the scale for points between 1.25 and 3.
Grades level 2 distinction*, level 2 distinction, level 2 merit and level 2 pass are at level 2, which makes for a 4-grade structure. Table 23 shows the scale for points between 4 and 8.5.
The table below shows the point scores for the OCR Cambridge National Certificate:
Table 34: Point score scales for OCR Cambridge National Certificate
| OCR Cambridge National Certificate grade | Points |
|---|---|
| Level 2 Distinction* | 8.50 |
| Level 2 Distinction | 7.00 |
| Level 2 Merit | 5.50 |
| Level 2 Pass | 4.00 |
| Level 1 Distinction | 3.00 |
| Level 1 Merit | 2.00 |
| Level 1 Pass | 1.25 |
Point scores for other qualifications can be calculated using a similar method, as in examples A, B and C above.
Annex H: worked examples of MAT measures
MAT level EBacc entry
To calculate the MAT EBacc entry percentage, we:
- multiply pupils entered in the EBacc by number of years in the MAT to calculate the total weighted number of pupils entered for EBacc
- multiply the number of pupils at the end of key stage by number of years in the MAT to calculate the total weighted number of pupils at the end of key stage
- divide the number of weighted pupils entered for EBacc by the weighted number of pupils at the end of key stage in all academies in the MAT
Table 35 outlines a MAT with 5 eligible academies, with a range of EBacc entry percentages.
Table 35 MAT measures EBacc entry worked example
| (i) Number of pupils at end of key stage | (ii) Pupils entered for the EBacc | % of pupils entered for the EBacc | (iii) Number of years with MAT | (iv) Total weighted pupils at end of key stage (i) *(iii) | (v) Total weighted pupils entered for EBacc (ii) * (iii) | |
|---|---|---|---|---|---|---|
| Academy 1 | 172 | 13 | 8% | 5 | 860 | 65 |
| Academy 2 | 264 | 121 | 46% | 4 | 1,056 | 484 |
| Academy 3 | 194 | 83 | 43% | 5 | 970 | 415 |
| Academy 4 | 102 | 25 | 25% | 4 | 408 | 100 |
| Academy 5 | 89 | 71 | 80% | 3 | 267 | 213 |
| Total | 821 | 313 | 3,561 | 1,277 |
Unweighted MAT EBacc entry rate ((sum of ii / sum of i) * 100) = 38%
Weighted MAT EBacc entry rate ((sum of v / sum of iv) * 100) = 36%
MAT level achieving EBacc at grade 5 or above
To calculate the MAT level achieving EBacc percentage, we:
- multiply the pupils achieving 9 to 5 for the EBacc by number of years in the MAT to calculate the total weighted number of pupils achieving grade 5 or above
- multiply the number of pupils at the end of key stage by number of years in the MAT to calculate the total weighted number of pupils at the end of key stage
- divide the number of weighted pupils achieving 9 to 5 by the weighted number of pupils at end of key stage
Table 36 outlines a MAT with 5 eligible academies, with a range of achieving EBacc at grade 5 or above percentages.
Table 36: MAT measures achieving 9-5 in EBacc worked example
| (i) Number of pupils at end of key stage | (ii) Pupils achieving EBacc at grade 5+ | % of pupils achieving EBacc at grade 5+ | (iii) Number of years with MAT | (iv) Total weighted pupils at end of key stage (i) *(iii) | (v) Total weighted pupils achieving EBacc at grade 5+ (ii) * (iii) | |
|---|---|---|---|---|---|---|
| Academy 1 | 163 | 98 | 60% | 5 | 815 | 490 |
| Academy 2 | 215 | 61 | 28% | 5 | 1,075 | 305 |
| Academy 3 | 222 | 42 | 19% | 4 | 888 | 168 |
| Academy 4 | 114 | 30 | 26% | 4 | 456 | 120 |
| Academy 5 | 124 | 27 | 22% | 3 | 372 | 81 |
| Total | 838 | 258 | 3,606 | 1,164 |
Unweighted MAT pupils achieving EBacc at grade 5+ ((sum of ii / sum of i) * 100) = 31%
Weighted MAT pupils achieving EBacc at grade 5+ ((sum of v / sum of iv) * 100) = 32%
MAT level achieving grade 5 or above in English and Maths
To calculate the MAT level achieving grade 5 or above in English and maths percentage, we:
- multiply the pupils achieving grade 5 or above in the 2 subjects by number of years in the MAT to calculate the total weighted number of pupils achieving above grade 5 in English and maths
- multiply the number of pupils at the end of key stage by number of years in the MAT to calculate the total weighted number of pupils at the end of key stage
- divide the number of weighted pupils achieving 5 or above by the weighted number of pupils at key stage
Table 37 outlines a MAT with 5 eligible academies, with a range of achieving grade 5 or above in English and maths percentages
Table 37: MAT measures achieving grade 5 or above in English and maths worked example
| (i) Number of pupils at end of key stage | (ii) Pupils entered achieving grade 5+ in English and Maths | % of pupils achieving grade 5+ in English and Maths | (iii) Number of years with MAT | (iv) Total weighted pupils at end of key stage (i) *(iii) | (v) Total weighted pupils achieving grade 5+ in English and Maths (ii) * (iii) | |
|---|---|---|---|---|---|---|
| Academy 1 | 155 | 91 | 59% | 5 | 775 | 455 |
| Academy 2 | 162 | 68 | 42% | 3 | 486 | 204 |
| Academy 3 | 123 | 61 | 50% | 5 | 615 | 305 |
| Academy 4 | 223 | 105 | 47% | 4 | 892 | 420 |
| Academy 5 | 198 | 116 | 59% | 4 | 792 | 464 |
| Total | 861 | 441 | 3,560 | 1,848 |
Unweighted MAT pupils achieving grade 5+ in English and Maths ((sum of ii / sum of i) * 100) = 51%
Weighted MAT pupils achieving grade 5+ in English and Maths ((sum of v / sum of iv) * 100) = 52%
MAT level Attainment 8
To calculate each academy’s Attainment 8 score, we:
- multiply number of pupils at the end of KS4 by the number of years in the MAT to calculate the total weight of the academy
- multiply the academy’s Attainment 8 score by the total weight of the academy to calculate the academy’s weighted score
- divide the total weighted score of all academies in the MAT by the total weight of all academies
Table 38 shows the Attainment 8 score for a MAT, with 5 eligible academies, each with their own Attainment 8 score.
Table 38: MAT measures Attainment 8 worked example
| (i) Attainment 8 score | (ii) Number of pupils at end of key stage | (iii) Number of years with MAT | (iv) Total weight (ii) * (iii) | (v) Weighted score (i) * (iv) | |
|---|---|---|---|---|---|
| Academy 1 | 54 | 140 | 5 | 700 | 37,800 |
| Academy 2 | 41 | 224 | 3 | 672 | 27,552 |
| Academy 3 | 36 | 188 | 4 | 752 | 27,072 |
| Academy 4 | 61 | 111 | 3 | 333 | 20,313 |
| Academy 5 | 58 | 124 | 3 | 372 | 21,576 |
| Total | 787 | 2,829 | 134,313 |
MAT score (sum of v / sum of iv) = 47.5
The same measure is also produced for disadvantaged pupils in the MAT.
Table 39: Attainment 8 for disadvantaged pupils in a MAT
| (i) Disadvantaged Attainment 8 score | (ii) Number of disadvantaged pupils at end of key stage | (iii) Number of years with MAT | (iv) Total weight (ii) * (iii) | (v) Weighted score (i) * (iv) | |
|---|---|---|---|---|---|
| Academy 1 | 40 | 30 | 5 | 150 | 6,000 |
| Academy 2 | 45 | 59 | 3 | 177 | 7,965 |
| Academy 3 | 39 | 50 | 4 | 200 | 7,800 |
| Academy 4 | 51 | 22 | 3 | 66 | 3,366 |
| Academy 5 | 47 | 90 | 3 | 270 | 12,690 |
| Total | 251 | 863 | 37,821 |
MAT score (sum of v / sum of iv) = 43.8
MAT level EBacc APS
To calculate the MAT level EBacc APS, we:
- multiply the number of pupils at the end of KS4 by the number of years in the MAT to calculate the total weight of the academy
- multiply the academy’s EBacc APS by the total weight of the academy to calculate the academy’s weighted score
- divide the total weighted score of all academies in the MAT by the total weight of all academies
Table 40 shows the EBacc APS score for a MAT, with 5 eligible academies, each with their own EBacc APS score
Table 40: MAT measures EBacc APS worked example
| (i) EBacc APS | (ii) Number of pupils at end of key stage | (iii) Number of years with MAT | (iv) Total weight (ii) * (iii) | (v) Weighted score (i) * (iv) | |
|---|---|---|---|---|---|
| Academy 1 | 3.74 | 210 | 4 | 840 | 3,141.6 |
| Academy 2 | 3.77 | 178 | 3 | 534 | 2,013.18 |
| Academy 3 | 5.44 | 142 | 5 | 710 | 3,862.4 |
| Academy 4 | 4.27 | 232 | 5 | 1,160 | 4,953.2 |
| Academy 5 | 4.96 | 114 | 3 | 342 | 1,696.32 |
| Total | 876 | 3,586 | 15,666.7 |
MAT score (sum of v / sum of iv) = 4.37
MAT level Progress 8 – when available
To calculate the MAT level Progress 8, we:
- multiply the number of pupils at the end of KS4 by the number of years in the MAT to calculate the total weight of the academy
- multiply the academy’s Progress 8 score by the total weight of the academy to calculate the academy’s weighted score
- divide the total weighted score of all academies in the MAT by the total weight of all academies
Table 41 shows a MAT with 5 eligible academies, with a range of Progress 8 scores.
Table 41: MAT measures Progress 8 worked example
| (i) Progress 8 score | (ii) Number of pupils at end of key stage | (iii) Number of years with MAT | (iv) Total weight (ii) * (iii) | (v) Weighted score (i) * (iv) | |
|---|---|---|---|---|---|
| Academy 1 | 2.5 | 140 | 5 | 700 | 1,750 |
| Academy 2 | -2.5 | 224 | 3 | 672 | -1,680 |
| Academy 3 | 3.3 | 188 | 4 | 752 | 2,481.6 |
| Academy 4 | -1.5 | 111 | 3 | 333 | -499.5 |
| Academy 5 | -1.5 | 124 | 3 | 372 | -558 |
| Total | 787 | 2,829 | 1,494.1 |
MAT score (sum of v / sum of iv) = + 0.5
Annex I: other additional measures
We also publish additional measures in performance tables. These are outlined below.
The proportion of pupils achieving a grade 4 or above in English and maths
For transparency and to help schools show progress, the headline threshold attainment measure in English and maths is published at grade 4 and above. This measure has the same methodology as its headline counterpart regarding qualification inclusion and requirements.
The additional measure shows where pupils achieved a grade 4 or above in GCSE English language or English literature and maths. Grades E or above in AS level English language or English literature and maths also count towards achieving this measure.
The proportion of pupils achieving the EBacc at grade 5 or above and grade 4 and above.
Following the introduction of EBacc APS in 2018, the EBacc attainment threshold measure is no longer a headline measure. We continue to publish the proportion of pupils achieving the EBacc at grade 5 and above, and at grade 4 and above. Grades E or above in AS level English language or English literature and maths also count towards achieving this measure.
Average number of EBacc slots filled in Attainment 8 at school level
The number of EBacc slots filled per pupil within a school divided by the total number of pupils at the end of KS4 within the school.
The number of EBacc slots filled per pupil is calculated according to Attainment 8 methodology outlined earlier in the guidance.[footnote 23]
Average number of open slots filled in Attainment 8 at school level
The number of open slots filled per pupil within a school divided by the total number of pupils at the end of KS4 within the school.
The number of Open slots filled per pupil is calculated according to Attainment 8 methodology outlined earlier in the guidance.[footnote 24]
Pupils achieving 5 or more GCSEs at grade 4 or above including English and maths
This measure is calculated with the following criteria:
- the attainment threshold is set to include those who achieve a grade 4 or above
- a pupil would have to achieve a grade 4 or above in English literature or English language (there is no requirement to sit both)
- the combined science qualification is counted as 1 GCSE
Annex J: pupils and institutions included in KS4 performance measures
Pupils at the end of KS4
Pupils are identified as being at the end of KS4 if they were on roll at the school and in year 11 at the time of the January school census.
Age is calculated as of 31 August at the start of the academic year (most pupils are aged 15 at this point). Some pupils may complete this key stage in an earlier or later year group.
Institutions
Included in KS4 National statistics
National statistics include all state-funded schools. This includes academies, free schools, city technology colleges, FE colleges with provision for 14 to 16 year olds and state-funded special schools. The statistics also include separate figures for independent schools.
Included at school level in performance tables
Provisional and revised performance measures are published at school level for state-funded schools[footnote 25], FE colleges with 14 to 16 direct entry and for independent schools.
Pupils and their results are attributed to schools by matching pupil, exam and census data.
For state funded schools, a pupil is matched to a school based on the pupil level annual school census (PLASC). Any exam results achieved by a pupil are matched to that pupil, regardless of where they were entered for the exam, including private exam entries.
For independent schools and FE colleges, pupils are allocated to a school or college based on exam data collected from awarding organisations and information from the ILR. Any exam results achieved by a pupil are matched to that pupil, regardless of where they were entered, including private exam entries.
Institutions can request some amendments to their pupil and exam data during the KS4 checking exercise.
Exams taken by a pupil at a previous school may potentially be discounted, and therefore will not count for the current school’s KS4 performance measures, based on our discounting rules for moving schools.
Annex K: timeline of changes since 2016
Table 42 provides a high-level summary of the range of school and college KS4 performance measures since 2016, detailing extensions to reporting (additional measures or extending coverage to include more qualifications).
It also outlines any methodological changes to how measures are calculated. Note, methodological changes are not applied retrospectively to previous cohorts/tables.
Table 42: Timeline of changes since 2016
| Year | Change |
|---|---|
| 2016 | A new set of headline measures were introduced for all state funded secondary schools: • Progress 8 • Attainment 8 • the percentage of pupils achieving A* to C in English and maths • the percentage of pupils achieving the English Baccalaureate • the percentage of pupils entering the English Baccalaureate • the percentage of students staying in education or employment after KS4 (destinations) New additional measures introduced: • percentage of pupils entering more than one language qualification • the percentage of pupils entering physics, chemistry and biology Methodology change: Point score scale changes from 16-58 scale to a 1 to 8 point scale, where 1 is equivalent to a grade G GCSE and 8 equivalent to an A* GCSE Removal of ‘in school’ disadvantaged gap measures Floor standard definition changed: Progress 8 score below -0.5, unless the confidence interval suggests the score may not be below average. |
| 2017 | Reformed GCSE qualifications: English and maths GCSEs, graded 9 to 1, were included in performance tables. Change to headline performance measures to reflect changes in grading: • the proportion of pupils achieving a grade 5 or above in English and maths • the proportion of pupils achieving the EBacc grade 5 or above in English and maths, and grade C or above in unreformed subjects New additional measures: • the proportion of pupils achieving in English and maths grade 4 or above • the proportion of pupils achieving the EBacc grade 4 or above in English and maths, and grade C or above in unreformed subjects. New supporting information published: • average number of EBacc slots filled in Attainment 8 at school level • average number of open slots filled in Attainment 8 at school level Multi academy trust measures introduced: • Progress 8 • Percentage entering EBacc • Percentage achieving EBacc at grade 5 and above/grade 4 and above |
| 2018 | Reformed GCSE qualifications: most GCSEs in EBacc subjects were graded 9 to 1. Change in headline performance measure: EBacc threshold attainment measure replaced as a headline measure with a new measure; EBacc average point score (APS). New additional measures (to replace old threshold measures based on unreformed GCSEs): • EBacc attainment at grade 4 and above • EBacc attainment at grade 5 and above Methodology change: A minor change to Progress 8 to reduce the disproportionate effect that extremely negative individual scores can have on a school’s overall score. Multi academy trust measures introduced: • EBacc average point score |
| 2019 | Almost all GCSEs were graded 9-1. There were no changes to KS4 performance measures The floor and coasting standards were removed. |
| 2020 | No accountability measures produced at school level (apart from destination measures) due to the COVID-19 pandemic and the cancellation of most exams, tests and assessments. The school and college checking exercise was also cancelled. Centre Assessed Grades were used to award qualifications. |
| 2021 | No accountability measures produced at school level (apart from destination measures, exam entries information and EBacc entry measure) due to the COVID-19 pandemic and the cancellation of most exams, tests and assessments. The school and college checking exercise was also cancelled. Teacher Assessed Grades were used to award qualifications. |
| 2022 | Accountability measures at school level return, following return of exams. Methodology changes: • New KS2 baseline for Progress 8 due to the introduction of scaled scores to replace levels Qualification results achieved between January 2020 and August 2021 not included in performance measures but entries are. New MAT measures published: • Attainment 8 • Percentage of pupils achieving grade 5 or above in English and maths |
| 2023 | No changes to KS4 performance measures |
| 2024 | No changes to KS4 performance measures |
| 2025 | Progress 8 not produced as primary tests and assessments were cancelled due to COVID-19 disruption meaning there is no KS2 prior assessment data available to calculate the measure. Return to publishing three-year time series. |
Annex L: secondary performance measures
Table 43 shows the performance measures and breakdowns that will be available on a school’s page for 2024 to 2025. There is further performance data and measures available about a school in the download data.
Table 43: Secondary performance measures
| Headline measures | Attainment 8: score EBacc entry: percentage of pupils entering the EBacc Destination measures: Percentage of pupils staying in education or employment for at least two terms after KS4 Attainment in English and maths: percentage of pupils achieving a grade 5 or above in English and maths Attainment in EBacc: EBacc Average Point Score (APS) |
| Subjects entered | The subjects entered by pupils attending the school at KS4 |
| Results by pupil characteristics | Breakdowns of headline measures are presented for: Disadvantaged pupils English as an additional language (EAL) Gender Non-mobile pupils It is not possible to produce prior attainment (low, middle and high prior attainers) as there is no KS2 baseline. |
| EBacc – additional measures |
EBacc attainment at grade 5 and above EBacc attainment at grade 4 and above EBacc attainment at grade 5 and grade 4 and above by subject groups EBacc attainment at grade 1 or above by subject groups EBacc entries by subject group EBacc value added by subject group |
| Other KS4 results | Attainment 8 scores by subject areas Additional entry and achievement measures Entries into triple science: the percentage of pupils entered for biology, chemistry and physics Attainment in English and maths: percentage of pupils achieving a grade 4 or above in English and maths Exam entries per pupil, all KS4 quals Exam entries per pupil GCSEs Percentage of pupils entered for more than one foreign language Percentage of pupils achieving at least one qualification |
| Pupil destinations | Pupils staying in education or employment for at least two terms after KS4 Pupils staying in education (split by institution type) Pupils staying in apprenticeships Pupils staying in employment Pupils not staying in education or employment |
| MATs | Attainment 8 score EBacc Percentage of pupils entering the EBacc EBacc APS EBacc at grade 5 and grade 4 and above English and maths grade 5 and above The above measures are broken down by disadvantaged pupils |
-
Pupils are identified as being at the end of KS4 if they were on roll at the school and in year 11 at the time of the January school census. Age is calculated as of 31 August at the start of the academic year, and the majority of pupils at the end of KS4 were age 15 at this point. Some pupils may complete this key stage in an earlier or later year group. ↩
-
It will not be possible to calculate Progress 8 for academic years 2024 to 2025 and 2025 to 2026 due to gaps in the baseline caused by COVID-19 disruption. We will provide the most recent available Progress 8 scores (2023 to 2024 and 2022 to 2023). See Annex A for further information. ↩
-
Some AS level qualifications in the same subject pillars can also count towards the EBacc. ↩
-
Before 2022 to 2023 school level data for state-funded schools was published in the provisional publication, while results data for independent schools and FE colleges were published alongside state-funded schools with the revised publication. Institution level data for all schools was published in provisional data for 2024 to 2025. ↩
-
We do not publish KS2 data for independent schools because they do not have to follow the national curriculum or enter pupils for KS2 tests. This means that independent schools are not included in the calculation of Progress 8. They are still included in other attainment measures at KS4. ↩
-
First entry and discounting rules as set out in the discounting and early entry section still apply. ↩
-
If the EBacc maths qualification was taken between January 2020 and August 2021 and therefore was impacted by COVID-19 the result for the EBacc maths qualification would not count but the Free Standing Maths Qualification could count in the ‘open’ bucket. ↩
-
Early entries in KS4 performance measures are taken from the 5-year period covered by Progress 8. Entries from 2019 to 2020 and earlier will not be counted. ↩
-
Where an academy has joined a trust since 12 September 2022 but immediately prior to that date the academy was part of a trust that was sponsored by their current trust since at least 12 September 2022, we will include the academy in the measures for their trust. ↩
-
We do not set a maximum limit on how positive a pupil’s progress score can be as there are much smaller numbers of extremely positive progress scores that have a disproportionate impact than extremely negative ones. ↩
-
The DfE add 3 points to a pupil’s scaled score for each subject where special consideration is applied. The score is capped at the maximum score available for a test. For pupils who took KS2 tests from 2018 to 2019 onwards, KS2 scores for reading, maths and grammar, punctuation and spelling without special consideration applied are shown in GIAP. There is also a flag to show where special consideration has been applied. More information on special consideration can be found in the KS2 tests: special consideration guidance. ↩
-
Data from special schools are not included when setting minimum thresholds. Students in special schools who have extremely negative progress scores are not capped. ↩
-
Due to natural fluctuation of performance year-on-year, it may not be possible to use the same standard deviation value each year to calculate the minimum scores. ↩
-
Set at the provisional data stage, updated in the revised data stage, based on mainstream provision. ↩
-
Of pupils who are included in Progress 8. ↩
-
Since 2014 computer science has counted as an individual science in the performance tables. However, it can also count alongside combined science or single sciences in Attainment 8/Progress 8 and it is not involved in science pathway discounting, so it is possible for computer science to count in Attainment 8 and Progress 8 measures alongside combined science. ↩
-
Science grades count in two pillars, meaning a total of six pillars for EBacc APS. ↩
-
We will include results from qualifications taken in autumn 2019, as these were pre-pandemic. We will not include results from qualifications taken in autumn 2020. ↩
-
Most commonly when pupils were in year 10 but also in year 9. ↩
-
We also count the results of qualifications achieved in autumn 2019 and first entry rules will apply. ↩
-
If a pupil is entered for both English language and English literature but does not sit one of them and receives a grade X for that subject, then the pupil’s numerical grade in the other English GCSE will count in the English bucket of Progress 8/Attainment 8 but will not be double weighted. ↩
-
If a pupil is entered for both English language and English literature but does not sit one of them and receives a grade X for that subject, then the pupil’s numerical grade in the other English GCSE is not included in EBacc APS and they will receive a zero for the English pillar. ↩
-
In 2022, this measure did not include entries data from qualifications taken between January 2020 and August 2021, because the measure is calculated using results included in Attainment 8. ↩
-
In 2022, this measure did not include entries data from qualifications taken between January 2020 and August 2021, because the measure is calculated using results included in Attainment 8. ↩
-
All state-funded schools include local authority maintained mainstream schools, academies, free schools, city technology colleges, state-funded special schools and some information for FE colleges with provision for 14 to 16 year-olds. They exclude independent schools, independent special schools, non-maintained special schools, hospital schools, pupil referral units and AP. AP includes academy and free school AP. ↩