Police powers and procedures England and Wales year ending 31 March 2015
Published 19 November 2015
Applies to England and Wales

© Crown copyright 2015
This publication is licensed under the terms of the Open Government Licence v3.0 except where otherwise stated. To view this licence, visit nationalarchives.gov.uk/doc/open-government-licence/version/3 or write to the Information Policy Team, The National Archives, Kew, London TW9 4DU, or email: psi@nationalarchives.gov.uk.
Where we have identified any third party copyright information you will need to obtain permission from the copyright holders concerned.
This publication is available at https://www.gov.uk/government/statistics/police-powers-and-procedures-england-and-wales-year-ending-31-march-2015/police-powers-and-procedures-england-and-wales-year-ending-31-march-2015
1. Introduction
This release contains statistics on the use of various police powers in England and Wales up to the year ending 31 March 2015. The release is broken down into 7 main sections.
The arrests section contains information provided by the 43 territorial police forces in England and Wales on a financial-year basis (April to March). It includes statistics on:
- arrests for notifiable offences
- the offence group for which persons were arrested
- the age, gender and ethnicity of persons arrested
The stop and search section contains information provided by the 43 police forces in England and Wales, and the British Transport Police (BTP) on a financial-year basis. It includes statistics on:
- the number of stops and searches carried out under a number of different legislative powers
- section 1 of the Police and Criminal Evidence Act 1984 (PACE)
- section 60 of the Criminal Justice and Public Order Act 1994
- section 44/47A of the Terrorism Act 2000
- the ethnicity of persons searched
- the reason given by the officer for conducting a search
- the number of searches that led to an arrest
Annex A provides some provisional data on the best use of stop and search scheme.
The section on other PACE powers contains data provided by the 43 police forces in England and Wales on a financial-year basis. It includes statistics on:
- the number of persons detained under a warrant for further detention
- the number of road checks conducted under section 4 of PACE
- the number of intimate searches made under section 55 of PACE
The fixed penalty notices for motoring offences section contains data from the national fixed penalty processing system (PentiP), on a calendar-year basis. It includes statistics on:
- the number of endorsable and non-endorsable fixed penalty notices (FPNs) issued for a range of motoring offences
- the number of FPNs issued as a result of camera-detected offences
- the number of cases where the penalty was paid
The breath tests section contains data from the 43 police forces in England and Wales on a calendar-year basis. It includes statistics on:
- the number of alcohol screening breath tests carried out by police
- the number of tests that were positive or refused
Further information on data collection can be found in the user guide. This release is accompanied by data tables on the relevant sections, and Annex A which provides data on the best use of stop and search scheme.
2. Key findings
2.1 Arrests
In the year ending March 2015, there were 950,000 arrests carried out by police in England and Wales, a fall of 7% on the previous year, and continuing the downward trend since a peak in the year ending March 2007, when there were almost 1.5 million arrests.
Consistent with previous years, the majority of arrests in the year ending March 2015 were of males (84%). Over a third of arrests (35%) were for offences related to violence against the person and 1 in 5 (20%) were for theft and handling stolen goods.
In the year ending March 2015, the majority (80%) of persons arrested considered themselves to be White. Persons who identified themselves as being Black (or Black British) were almost 3 times as likely to be arrested as those who were White.
2.2 Stop and search
In the year ending March 2015, there were 541,000 stops and searches conducted by police in England and Wales, a fall of 40% compared with the previous year. This was the lowest number of stops and searches carried out since the data collection began. Over the same period, arrests resulting from stop and search fell by 31%.
Fourteen per cent of stops led to an arrest, up 2 percentage points compared with 12% in the previous year.
In the year ending March 2015, the total number of stops and searches carried out in England and Wales has fallen by 58% since the year ending March 2011, with stops of individuals belonging to BME groups falling 68% and stops of White individuals falling by 55%. Over the same period, stops on those who were Black have fallen by 70%.
In the year ending March 2015 persons from Black and Minority Ethnic groups (BME) were twice as likely to be stopped as those who were White, with those who were Black (or Black British) being over 4 times more likely than those who were White. This is driven by the fact that the Metropolitan Police Service (MPS), who account for a disproportionately large proportion of stop and search, have a large proportion of BME residents than in England and Wales generally.
2.3 Detentions, road checks and intimate searches
In the year ending March 2015, there were a total of 3,133 persons detained under part IV of PACE for more than 24 hours by police in England and Wales, representing a fall of 16% on the previous year.
There were 16 road checks carried out by police in England and Wales in the year ending March 2015, one road check fewer than in the previous year. In terms of the number of vehicles stopped there was a 29% increase over the same time period.
There were a total of 75 intimate searches carried out by police in England and Wales in the year ending March 2015.
2.4 Fixed penalty notices and breath tests
There were around 1.02 million fixed penalty notices (FPNs) issued for motoring offences by police in England and Wales in 2014, a fall of 11% compared with the previous year. However, during this period, the number of FPNs issued for speed limit offences increased by 4%.
Police in England and Wales carried out 607,000 breath tests in 2014, a fall of 10% compared with the 676,000 carried out in the previous year. Eleven per cent of these were positive or refused, up 1 percentage point on the previous year.
3. Arrests
3.1 Key findings
- in the year ending March 2015, there were 950,000 arrests carried out by police in England and Wales, a fall of 7% on the previous year, and continuing the downward trend since a peak in the year ending March 2007, when there were almost 1.5 million arrests; eight per cent (75,000) of these arrests resulted from a stop and search
- consistent with previous years, the majority of arrests in the year ending March 2015 were of males (84%)
- over a third of arrests (35%) were for offences related to violence against the person and 1 in 5 (20%) were for theft and handling stolen goods
- the majority (80%) of persons arrested considered themselves to be White; persons who identified themselves as being Black or Black British were almost 3 times as likely to be arrested as those who were White
Figure 3.1 Number of arrests, by gender, England and Wales

Not suplied by author.
Source: Arrests table A.01, Home Office
3.2 Introduction
Data presented here are on the police powers of arrest. In line with police recorded crime statistics, these data cover arrests for all notifiable offences carried out by police in England and Wales. A person arrested for a notifiable offence is counted for each occasion on which they are arrested, provided that the offence is not connected or related to an offence for which the person has already been subject to arrest during the year. If it is connected, or if a person has been arrested for one or more notifiable offences on the same occasion, the offence with the highest maximum penalty is recorded.
Data are presented on a financial-year basis (April to March) and are provided directly to the Home Office by the 43 territorial police forces in England and Wales. The Home Office does not receive arrest data from the British Transport Police.
Figures on arrests reported to the Home Office reflect police activity and should not be used to infer levels of crime committed by offenders. When considering arrest figures on sexual offences, it should be considered that these are influenced by the willingness of victims to report offences. The number of arrests for drug offences is greatly dependent on police activities and priorities, and does not give a reliable indication of trends in the level of drug offending.
The Office for National Statistics (ONS) amended some categories of the police recorded crime series in the year ending March 2013. These changes are not reflected in this publication; however, future bulletins will take the changes into account to bring it in line with ONS Crime Statistics.
Further details of the amendments made by ONS can be found in the user guide.
3.3 Arrests by gender
Consistent with previous years, where males have accounted for between 83% and 85% of arrests, the majority of arrests in the year ending March 2015 were also of males (84%). In the year ending March 2015 there was a fall of 7% in both the number of males arrested, compared with the year ending March 2014 (from 867,000 arrests to 802,000 arrests), and in the number of females arrested over the same time period (from 158,000 arrests to 148,000 arrests).
The most common reason for arrest for both males and females were for offences relating to violence against the person, followed by theft and handling stolen goods. However, there were some differences in arrest patterns for males and females. For example, though males accounted for 84% of arrests overall, they made up 97% of arrests for sexual offences, 92% of arrests for burglary and 91% of arrests for robbery. Figure 3.2 shows the proportion of arrests by offence type for either gender.
Figure 3.2 Proportion of arrests by gender and offence group1, England and Wales, year ending March 2015
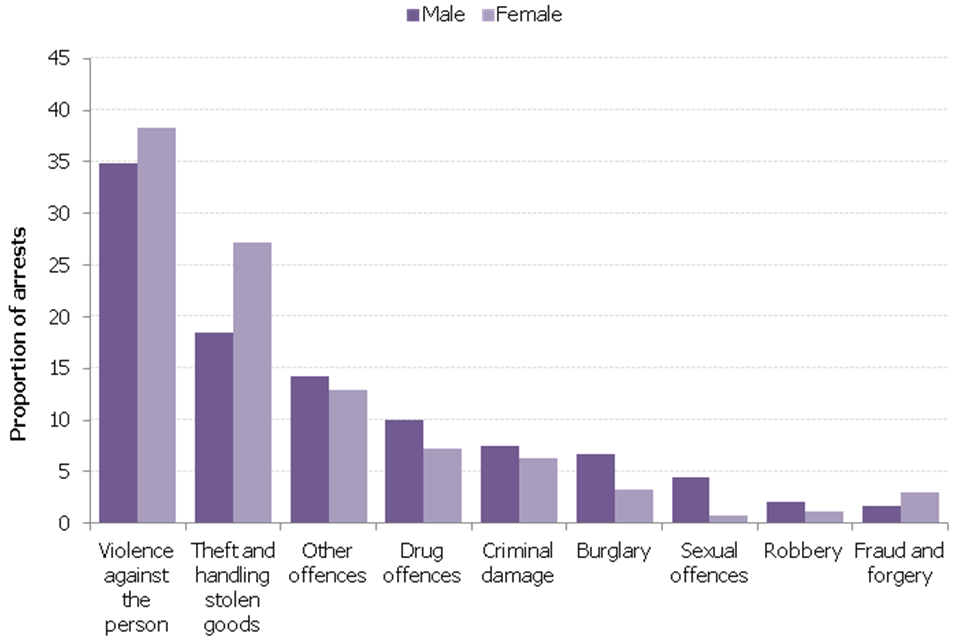
Not suplied by author.
Source: Arrests table A.02, Home Office
Chart Notes
- Other offences include public order offences, possession of weapons and other miscellaneous offences.
3.4 Arrests by age
Data on arrests by age are grouped into one of five categories: ‘Under 10’, ‘Aged 10-17’, ‘Aged 18-20’, ‘Aged 21 and over’, or, ‘Age unknown’. The legal age limit for arrest is 10 years old, therefore, the ‘Under 10’ category includes persons who, after further investigation, were found to be under the legal age limit for arrest.
The proportions of arrests of each age group remained similar to previous years. In the year ending March 2015, the age group that saw the largest decrease in the number of arrests was the 18-20 year olds, falling by 15% compared with the previous year. Arrests of 10-17 year olds fell by 13% and arrests of those aged 21 and over fell by 5%.
The ages of those arrested were similar for males and females, with around 79% of all arrestees being 21 or over. Figure 3.3 shows the number of persons arrested by offence type and age.
Figure 3.3 Age group1 of persons arrested, by offence type, England and Wales, year ending March 2015
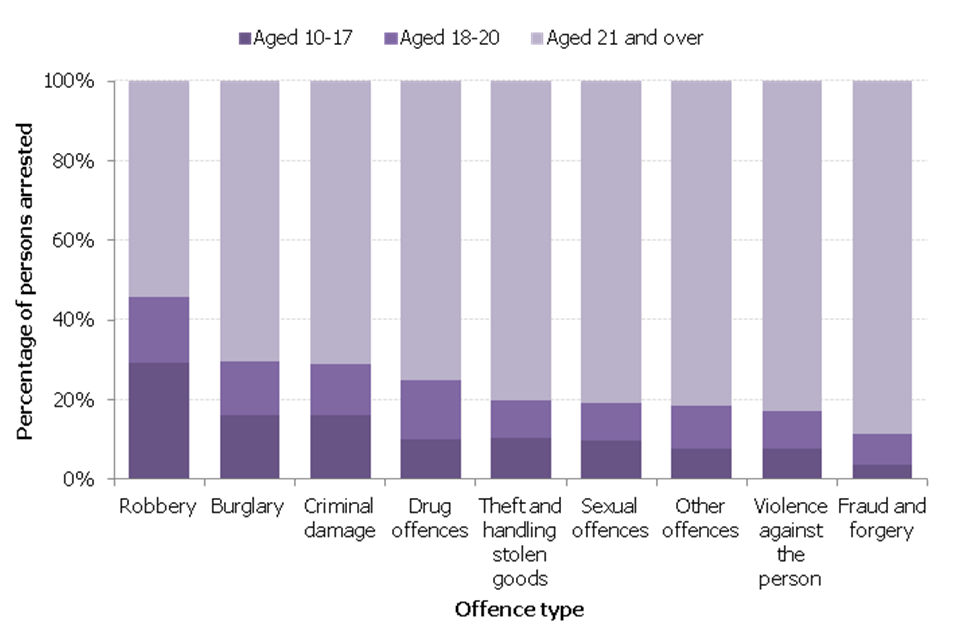
Not suplied by author.
Source: Arrests table A.03, Home Office
Chart Notes
- Excludes those whose age was unknown, and those who were under 10 years old at the time of the arrest.
3.5 Arrests by ethnicity
When an individual is arrested, they are asked to define their ethnicity. For the purpose of this analysis, these are grouped into 6 categories:
- White
- Black (or Black British)
- Asian (or Asian British)
- Chinese or Other
- Mixed
- Not stated
The ethnic breakdown of those arrested in the year ending March 2015 was similar to the previous year. Excluding those who did not state their ethnicity, 80% of those arrested self-defined their ethnicity as White, 9% as Black (or Black British) and 7% as Asian (or Asian British). The rest considered themselves either of mixed ethnicity, or Chinese or other.
In the year ending March 2015, persons from Black and Minority Ethnic groups (BME) were one and a half times as likely to be arrested as those who were White, and those who were Black (or Black British) were 3 times more likely to be arrested than those who identified themselves as White (Figure 3.4).
Figure 3.4 Likelihood1 of being arrested by self-defined ethnic group, compared with those from White ethnic groups, England and Wales2, year ending March 2015
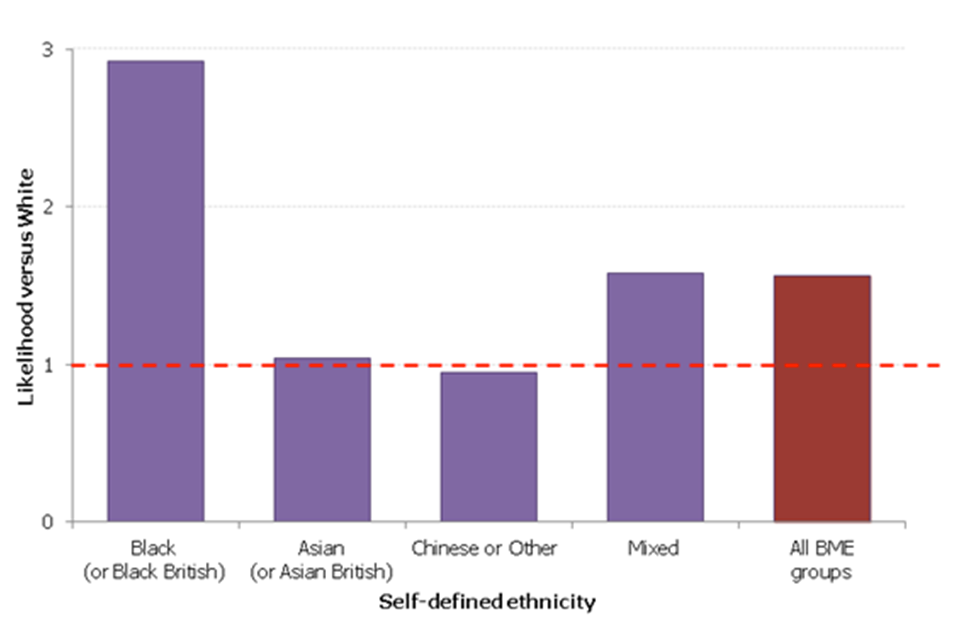
Not suplied by author.
Source: Arrests table A.04, Home Office
Chart Notes
- A likelihood of 1 indicates that the ethnic group is equally as likely to be stopped as those who are White.
- Population breakdowns are based on the 2011 census (the latest available figures). It is likely that ethnicity breakdowns have changed since 2011. Such changes are not accounted for in the figures. Therefore, these figures should be considered estimates only.
In the year ending March 2015, decreases in the number of arrests were seen across all ethnicities. There was a decrease of 8% in the number of arrests of those who considered themselves to be White, and a 4% decrease in the number of arrests of those who identified themselves as BME (Table 3.1).
Table 3.01 Ethnic breakdowns of persons arrested in England and Wales, year ending March 2015 compared with year ending March 2014
| Numbers and percentages | England and Wales | ||
|---|---|---|---|
| Self-defined ethnicity | Year ending March 2014 | Year ending March 2015 | % change |
| White | 803,069 | 737,756 | -8 |
| Black (or Black British) | 86,337 | 83,505 | -3 |
| Asian (or Asian British) | 64,376 | 60,802 | -6 |
| Mixed | 31,223 | 29,621 | -5 |
| Chinese or Other | 14,737 | 13,951 | -5 |
| Not stated | 25,227 | 23,891 | -5 |
| All BME | 196,673 | 187,879 | -4 |
| Total | 1,024,969 | 949,526 | -7 |
Source: Arrests table A.04, Home Office
3.6 Arrests by offence group
In the year ending March 2015, just over a third of all arrests by police in England and Wales were for violence against the person offences (35%). The next most common reason for arrest was for theft and handling stolen goods offences, which accounted for 20% of all arrests, a 2 percentage point decrease on the previous year. The breakdown of arrests by offence groups has remained fairly consistent from year to year.
The number of persons arrested in the year ending March 2015 fell across all offence groups with the exception of violence against the person, which increased by 4,202 arrests (1%) when compared with the previous year, and sexual offences, which increased by 2,581 (8%) over the same time period (Figure 3.5). The direction of this trend is in line with police recorded crime statistics (Table 3.2).
Figures on arrests reported to the Home Office reflect police activity and should not be used to infer levels of crime committed by offenders, or their specific characteristics. Furthermore, not all arrests result in a crime being recorded. Crime statistics in England and Wales are available on the Office for National Statistics (ONS) website.
Figure 3.5 Percentage change in number of arrests, by offence group1, England and Wales, year ending March 2015 compared with year ending March 2014
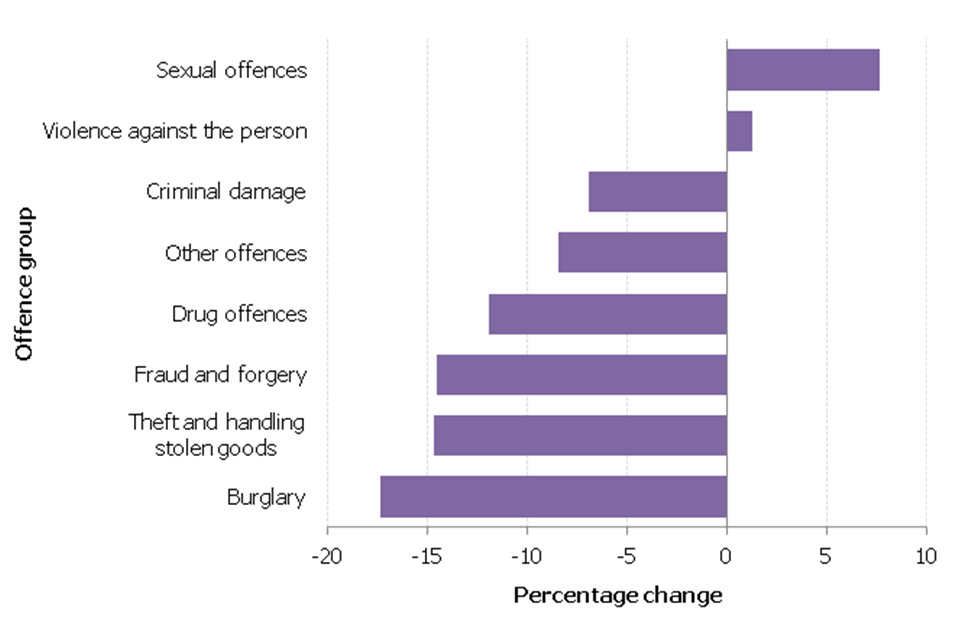
Not suplied by author.
Source: Arrests table A.02, Home Office
Chart Notes
- Other offences include public order offences, possession of weapons and other miscellaneous offences.
Comparisons with recorded crime are limited here to trends over time. As arrests relate to persons and recorded crime relates to offences, it is not appropriate to compare actual numbers. Furthermore, an individual arrested in a particular financial year, could be arrested for an offence that was recorded by police in a previous year.
Table 3.02 Changes in arrests and police recorded crime, by offence type1, England and Wales, year ending March 2015
| Number and percentages | England and Wales | |||||
|---|---|---|---|---|---|---|
| Arrests | Police recorded crime | |||||
| Offence group | Year ending March 2014 | Year ending March 2015 | % change | Year ending March 2014 | Year ending March 2015 | % change |
| Robbery | 23,075 | 18,372 | -20 | 57,828 | 50,236 | -13 |
| Burglary | 70,594 | 58,323 | -17 | 443,212 | 411,425 | -7 |
| Drug offences | 103,002 | 90,723 | -12 | 198,216 | 169,901 | -14 |
| Violence against the person | 332,356 | 336,558 | 1 | 634,625 | 778,908 | 23 |
| Sexual offences | 33,780 | 36,361 | 8 | 64,232 | 88,171 | 37 |
Source: Arrests table A.03, Home Office
Police recorded crime open data, GOV.UK
Table Notes
- For those offence types which appear in both the arrests data and police recorded crime.
- Excludes British Transport Police (BTP).
After a continued fall for 7 consecutive years (from a peak of 487,569 in the year ending March 2007) arrests for violence against the person increased for the first time. The number of arrests for property crimes such as burglary, theft and handling stolen goods, and criminal damage all continued to fall to the lowest levels since collections began.
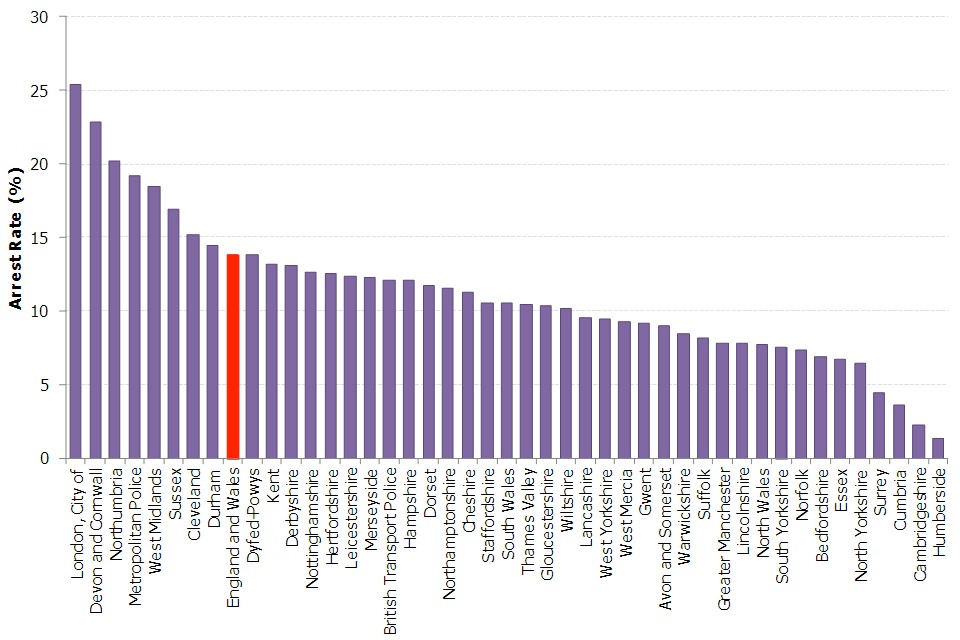
3.7 Arrests by police force area
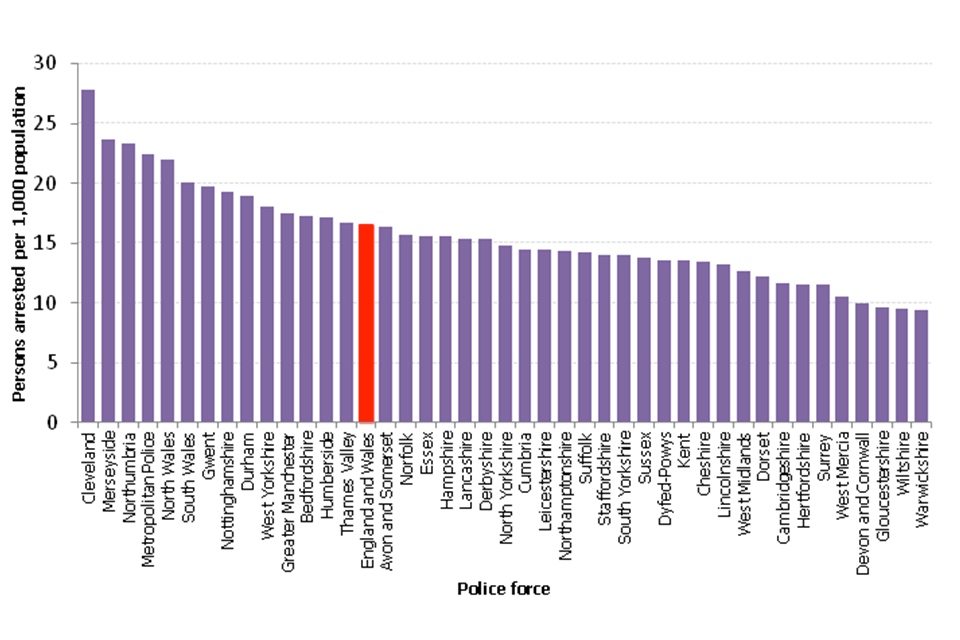
Due to the small resident population within the City of London police force area, caution is needed when examining the ethnic breakdown of those arrested by that force. Differences in the proportion of Black or Ethnic Minority arrestees in some police force areas (for example MPS and West Midlands) may, in part, reflect the different proportions of ethnic groups in the overall population, as well as visitors to those areas. Furthermore, an individual arrested in a particular police force area will not necessarily be a resident of that area. Population breakdowns are based on residents of a particular area. Therefore, findings on arrest rates must be met with caution.
The number of arrests per 1,000 population was highest in Cleveland with 28 arrests per 1,000 members of the population. Warwickshire recorded the lowest arrest rates with 9 arrests per 1,000 members of the population. The arrest rate for England and Wales as a whole was 17 arrests per 1,000 members of the population.
Out of the 43 forces in England and Wales, 6 showed an increase in the number of arrests and the remaining 37 showed a decrease in the number of arrests in the year ending March 2015 compared with the previous year.
Sussex saw the largest decrease in terms of percentage, at 26%. The largest increase in the number of arrests was seen in Cheshire where there were 4% more arrests in the year ending March 2015 compared with the year ending March 2014.
Figure 3.6 Number of persons arrested per 1,000 population, by police force area, England and Wales, year ending March 2015
Not suplied by author.
Source: Arrests table A.05, Home Office.
3.8 Data quality and interpreting the figures
The presented figures are correct at the time of publication and may include revisions submitted by forces for the previous years.
In line with a recommendation by the National Statistician’s Review of Crime Statistics for England and Wales, which identified fraud as one of the gaps in crime statistics, police recorded crime data published by the Office for National Statistics (ONS) now include information from additional sources such as Action Fraud and the National Fraud Intelligence Bureau. Information about the ONS’s changes to offence classifications can be found via their crime and justice methodology webpage.
3.9 Other data sources
Whilst some ethnic breakdowns are provided here, detailed figures and analysis continue to be the responsibility of the Ministry of Justice (MoJ). The latest edition of its Statistics on Race and the Criminal Justice System series was published in December 2013. Figures presented relate to the period up to and including the financial year ending March 2012, and may since have been superseded by data included in this edition of Police powers and procedures. The next edition of MoJ’s bulletin, with arrest figures for the financial year ending March 2014, is expected to be published on 26 November 2015.
MoJ also publishes biennial statistics on the representation of females and males as victims, suspects, offenders and employees in the criminal justice system. Its latest statistics can be found in Statistics on Women and the Criminal Justice System 2013, and includes arrest figures for the financial year ending March 2014.
The Youth Justice Board’s (YJB’s) series on Youth Justice Statistics looks at the flow of young people through the Youth Justice System. The latest edition was released in January 2015 and includes arrests data for the financial year ending March 2013, which may since have been superseded by data included in this edition of Police powers and procedures. The next release in expected in January 2016 and will cover the period up to the year ending March 2015.
Data on individuals given an out of court disposal or proceeded against at court are published in MoJ’s Criminal Justice Statistics Quarterly.
Crime Statistics, including police recorded crime figures, are published by ONS on a quarterly basis.
4. Stop and search
4.1 Key findings
In the year ending March 2015, there were 541,000 stops and searches conducted by police in England and Wales, a fall of 40% compared with the previous year. This represents the largest year-on-year fall, and reaches the lowest number of stops and searches conducted in a year since the data collection began:
- 99.8% of these were conducted under section 1 of the Police and Criminal Evidence Act 1984
- the remainder were conducted under section 60 of the Criminal Justice and Public Order Act 1994
- there were zero stops under section 47A of the Terrorism Act
Over the same period, the number of arrests resulting from a stop and search has fallen by 31%.
Fourteen per cent of stops and searches led to an arrest, up 2 percentage points compared with the 12% in the previous year, to the highest arrest rate since the data collection began.
In the year ending March 2015, the total number of stops and searches carried out in England and Wales has fallen by 58% since the year ending March 2011, with stops of individuals belonging to BME groups falling 68% and stops of White individuals falling by 55%. Over the same period, stops on those who were Black have fallen by 70%.
Those from Black and Minority Ethnic (BME) groups were twice as likely to be stopped and searched as those who were White. In particular, those who were Black (or Black British) were more than 4 times more likely to be stopped than those who were White. This is driven by the fact that the Metropolitan Police Service (MPS), who account for a disproportionately large proportion of stop and search, have a large proportion of BME residents than in England and Wales generally.
4.2 Introduction
This section looks at stops and searches conducted by police in England and Wales under 3 different legislative powers. These are:
- section 1 of the Police and Criminal Evidence Act 1984 (PACE) and associated legislation
- section 60 of the Criminal Justice and Public Order Act 1994
- sections 44/47A of the Terrorism Act 2000
The powers allow police to search persons and vehicles without a warrant in specific situations. Details of the above legislation and the legislation associated with section 1 of PACE are included in the user guide.
This release includes statistics on the number of stops and searches carried out by police in England and Wales on a financial-year basis (April to March). It includes statistics on:
- the number of stops and searches, and subsequent arrests carried out under different legislation
- the reason for the stop and search and/or subsequent arrest
- the ethnicity of persons stopped
4.3 Section 1 of the Police and Criminal Evidence Act 1984 and associated legislation
Under section 1 of PACE (and associated legislation), police are given the power to search persons and/or vehicles for a range of items including stolen property, offensive weapons, controlled drugs or evidence relating to terrorism, if the officer has reasonable cause to suspect he/she will find such items. The full code of practice for police officers on the use of stop and search powers can be found in the PACE code A guidance. Further details can be found in the user guide.
Section 1 of PACE is the most common power used by police to conduct a stop and search. In the year ending March 2015, it accounted for 99.8% of all stops and searches in England and Wales.
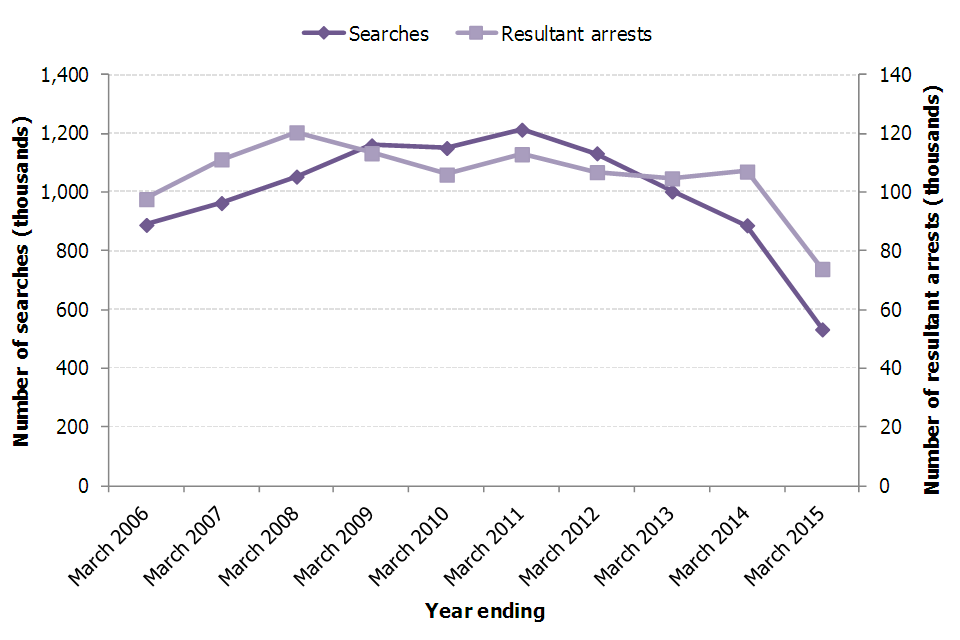
In the year ending March 2015, there were 539,788 stops and searches conducted under section 1 of PACE by police in England and Wales. This was a fall of 40% compared with the previous year continuing a downward year-on-year trend since the year ending March 2011. The most recent fall was the largest year-on-year fall and led to the lowest number of stops under this power since the data collection began.
Figure 4.1 Number of stops and searches and resultant arrests, under section 1 of PACE, England and Wales1
Not suplied by author.
Source: Stop and search table SS.02, Home Office.
Chart Notes
- Excludes British Transport Police (BTP).
The number of arrests following a stop and search generally follow a similar pattern to the total number of stops and searches. However between the year ending March 2011 and the year ending March 2014, there were consistent year-on-year falls in the number of searches, which fell by a quarter between the two periods. At the same time, resultant arrest remained fairly stable (falling slightly by 5% across the period). In the most recent year, the number of arrests resulting from stops fell by 31%, roughly in line with the total number of stops (which fell by 40%) to reach the lowest number of resultant arrests on record.
4.4 Arrest Rate
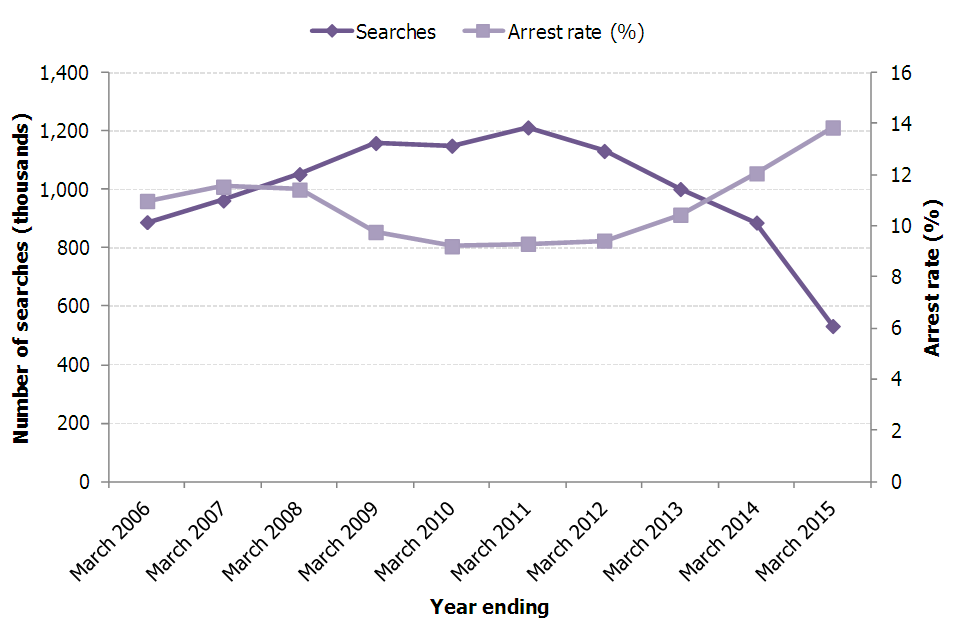
Of the 539,788 stops in the year ending March 2015, 74,680 led to an arrest. This was an arrest rate of 14%, the highest rate since the current data collection began, and an increase of 2 percentage points on the 12% arrest rate seen in the previous year.
Historically, as the number of stops has increased, the arrest rate has decreased, which may indicate stop and search powers were sometimes used in a less targeted way. Over the last 4 years, as the number of stops has reduced, the arrest rate has increased. The year ending March 2015 saw the lowest number of stops, but the highest arrest rate in the current data series. This may suggest that the police are taking a more targeted approach to the use of stop and search and are therefore finding reason for an arrest in a higher proportion of cases.
Figure 4.2 Number of stops and searches and resultant arrest rates, under section 1 of PACE, England and Wales1
Not suplied by author.
Source: Stop and search table SS.02, Home Office.
Chart Notes
- Excludes British Transport Police.
Although the arrest rate can be used as an indicator for the effectiveness of stop and search, there are a number of other outcomes (such as drugs possession warnings, cautions etc.) that may be used by police when carrying out a stop and search which are not covered here. The best use of stop and search scheme aims to capture these additional outcomes to get a fuller picture of how effectively stop and search is being used. See the section on best use of stop and search for more details.
4.5 Reason for search
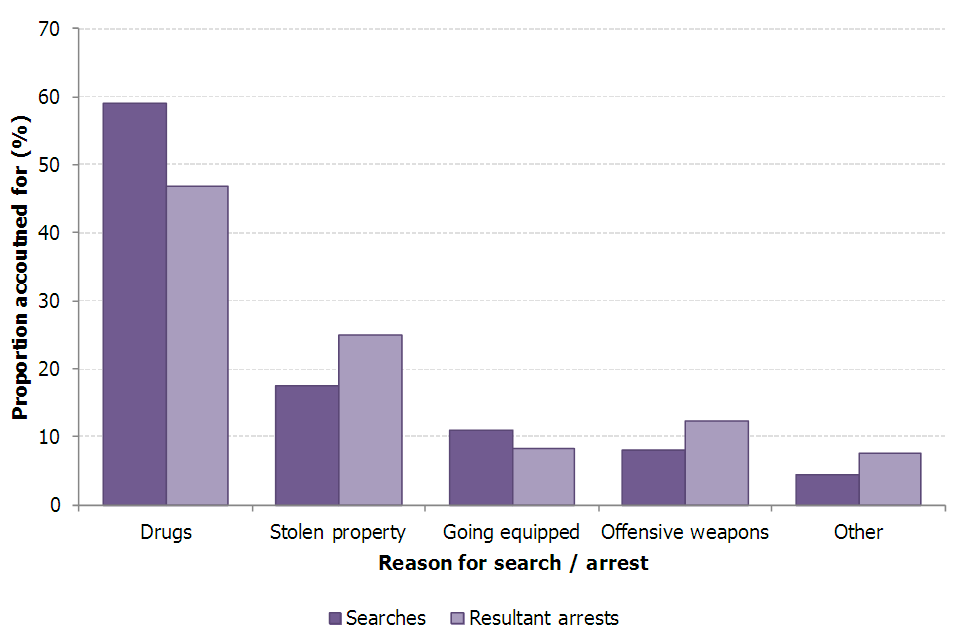
There are a number of reasons why the police may carry out a section 1 PACE stop and search. For example, they may suspect an individual is carrying drugs, or a weapon. Any arrests resulting from a PACE search may not be related to the initial reason for the search. For example, an officer may suspect that an individual is carrying drugs, but actually arrest them as they are found to be carrying a weapon. As a result, arrest rates give an overall picture of the number of searches leading to arrests, but do not give insight into arrest rates for specific offence categories. The best use of stop and search scheme will address this shortcoming by requiring forces to collect data on whether the reason for a given outcome is the same as the reason for the initial search.
Figure 4.3 Proportion of PACE stops and searches and resultant arrests, by reason for search/arrest, England and Wales1, year ending March 2015
Not suplied by author.
Source: Stop and search tables SS.05, Home Office.
Chart Notes
- Excludes South Wales who could not accurately categorise the reason for all their section 1 PACE stops and searches.
- For this analysis, ‘offensive weapons’ includes searches made for firearms.
- ‘Other’ includes searches made for articles relating to criminal damage, as well as searches under other legislation such as section 43 of the Terrorism Act 2000.
In the year ending March 2015, the most common reasons for carrying out a PACE stop and search was on suspicion of drug possession, which accounted for 59% of all PACE stops. The number of stops and searches carried out by police has some correlation with the number of drug seizures made by police in England and Wales. In the year ending March 2015, the number of drug-related searches fell by 34% compared with the previous year. At the same time, the number of drug seizures made by police in England and Wales fell by 15%.
Figure 4.4 Number of drug-related stops and searches1, compared with the number of drug seizures2 made by police in England and Wales
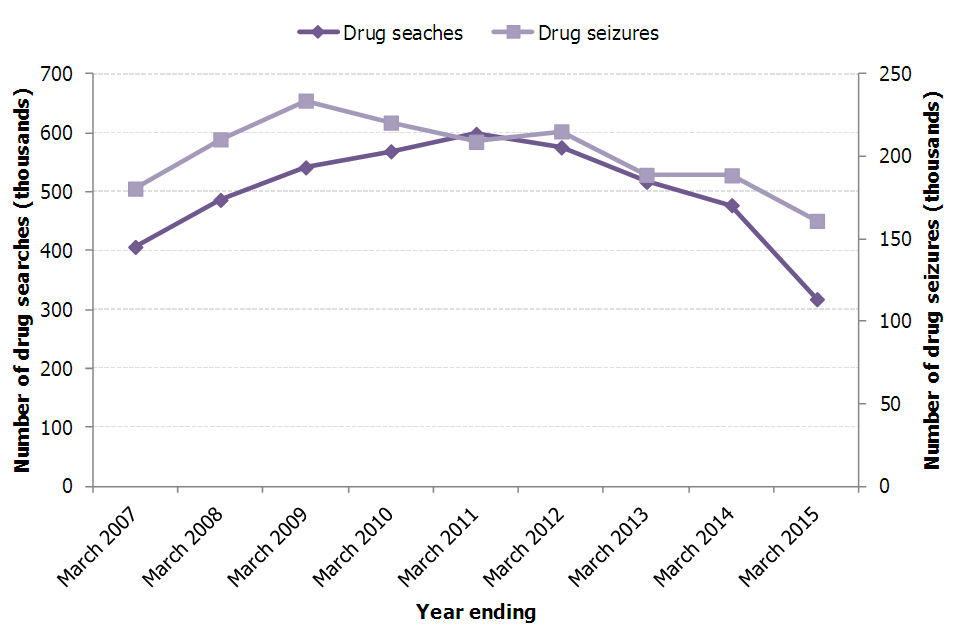
Not suplied by author.
Source: Stop and search open data, Home Office.
Seizures of drugs in England and Wales, financial year ending 2015, Home Office.
Chart Notes
- Drug searches include all searches made under section 1 of PACE on suspicion of drug possession.
- Drug seizures data exclude some forces for certain years, and contain estimates for some years. Further details can be found in summary table 1 of the Seizures of drugs in England and Wales publication.
4.6 Section 60 of the Criminal Justice and Public Order Act 1994
Under section 60 of the Criminal Justice and Public Order Act 1994, the police have the power to stop and search persons and/or vehicles in anticipation of violence through the use of offensive weapons. Further details can be found in the user guide.
In the year ending March 2015, police in England and Wales carried out 1,082 stops and searches under section 60 of the Criminal Justice and Public Order Act . This represents a fall of 73% compared with the previous year. Since a peak of 150,000 searches in the year ending March 2009, the use of section 60 stop and search has drastically declined. The current year total is less than 1% of the total in the year ending March 2009.
The Metropolitan Police Service (MPS) account for a large proportion of all section 60 searches in England and Wales. Between the years ending March 2009 and March 2012, the MPS accounted for over three-quarters of all section 60 searches. After this period, the MPS began to reduce the use of this power. In the year ending March 2015, they accounted for only 1 in 5 section 60 searches, similar to the level of crime accounted for by the force. As the MPS have accounted for such a large proportion of stops, trends in the force’s use of the power have a significant impact on the overall trend in England and Wales.
Figure 4.5 Stops and searches under section 60 of the Criminal Justice and Public Order Act 1994, England and Wales1
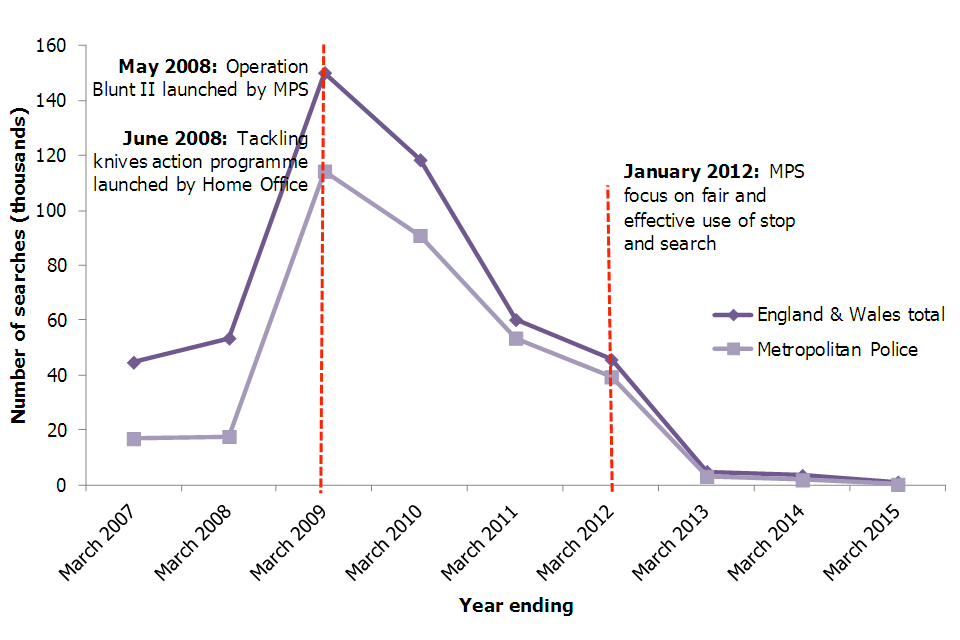
Not suplied by author.
Source: Stop and search table SS.08, Home Office.
Chart Notes
- Excludes British Transport Police.
In the year ending March 2009, there were large increases in the number of section 60 stops and searches conducted in England and Wales. This coincided with 2 initiatives aimed at reducing knife crime:
- Operation Blunt II, launched by the MPS in May 2008
- tackling knives action programme, launched by the Home Office in June 2008
In more recent years, the decline in the number of searches has followed reviews by the MPS and the Home Office on the use of stop and search powers. The falls have been seen in line with an increased focus on fair and proportionate use of stop and search powers, as well as the introduction of the best use of stop and search scheme which revised the conditions which must be met to conduct a stop and search under this power. See section 4 of the best use guidance for more details.
In the year ending March 2015, 18 out of 44 forces in England and Wales did not carry out any stops and searches under section 60, compared with 10 the previous year. Only 3 (Merseyside, Essex and MPS) carried out more than 100 searches under this power.
The proportion of section 60 searches that resulted in an arrest in the year ending March 2015 was 3%. Since the year ending March 2006, the arrest rate has been no higher than around 5%, which is significantly lower than the arrest rate following searches under section 1 of PACE, which has been between 9% and 14% over the same period. This could reflect the fact that in order to conduct a section 60 stop and search, an officer does not need to have any grounds for suspecting an individual to be carrying an article, whereas under section 1 of PACE, an officer must have reasonable grounds to suspect he/she will find a stolen or prohibited article.
Figure 4.6 Number of stops and searches and resultant arrest rates, under section 60 of the Criminal Justice and Public Order Act 1994, England and Wales1
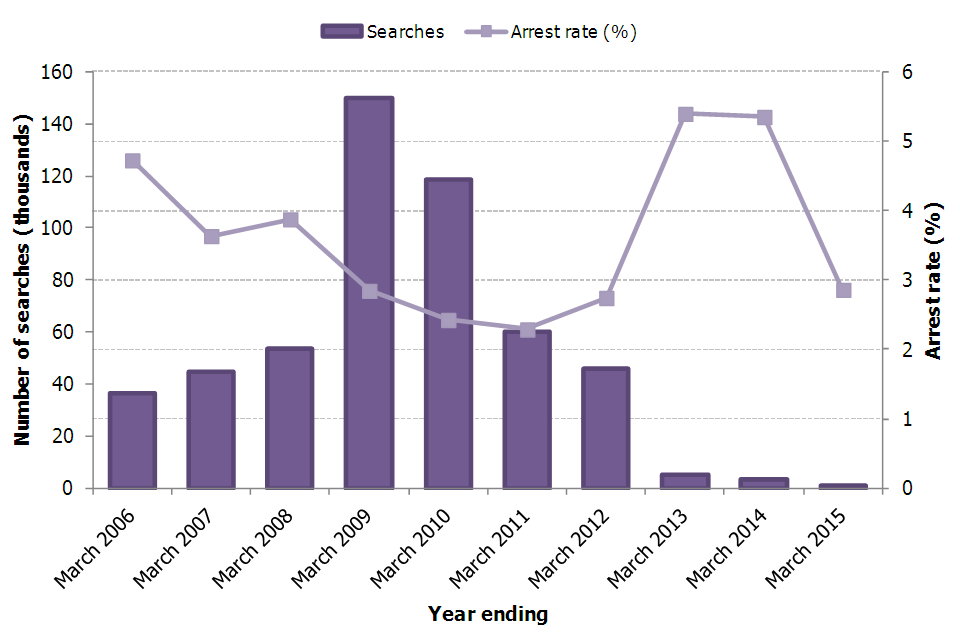
Not suplied by author.
Source: Stop and search table SS.08, Home Office
Chart Notes
- Excludes British Transport Police.
4.7 Section 44/47A of the Terrorism Act 2000
Section 47A of the Terrorism Act 2000 (TACT) allows the police to stop and search persons, without reasonable suspicion, in order to prevent acts of terrorism. Searches under this power may only be authorised in a specific area for a defined period where the police reasonably suspect an act of terrorism will take place. Section 47A of TACT stop and search powers replaced similar powers under sections 44 to 47 of TACT on 18 March 2011 (further information can be found in the user guide). There has, as yet, been no use of stop and search powers under section 47A of TACT.
Data on stop and search under sections 44 and 47A can be found in the data tables.
Data on stop and search under section 43 of the Terrorism Act 2000 (where an officer must have reasonable suspicion to conduct a search) are included in the ‘other’ category under section 1 PACE. These cannot be separately identified. Data on stop and search under section 43 of TACT carried out by the MPS are published in the Home Office quarterly Operation of police powers under the Terrorism Act 2000 publication.
4.8 Stop and search by police force area
The MPS account for a large proportion of all stops and searches in England and Wales. In the year ending March 2015, they accounted for 32% of all stops and searches under section 1 PACE and section 60. When looking at the use of stop and search among different police forces, the population covered by each police force must be taken into consideration.
Figure 4.7 Number of stops and searches per 1,000 population1, by police force area2,3, England and Wales, year ending March 2015
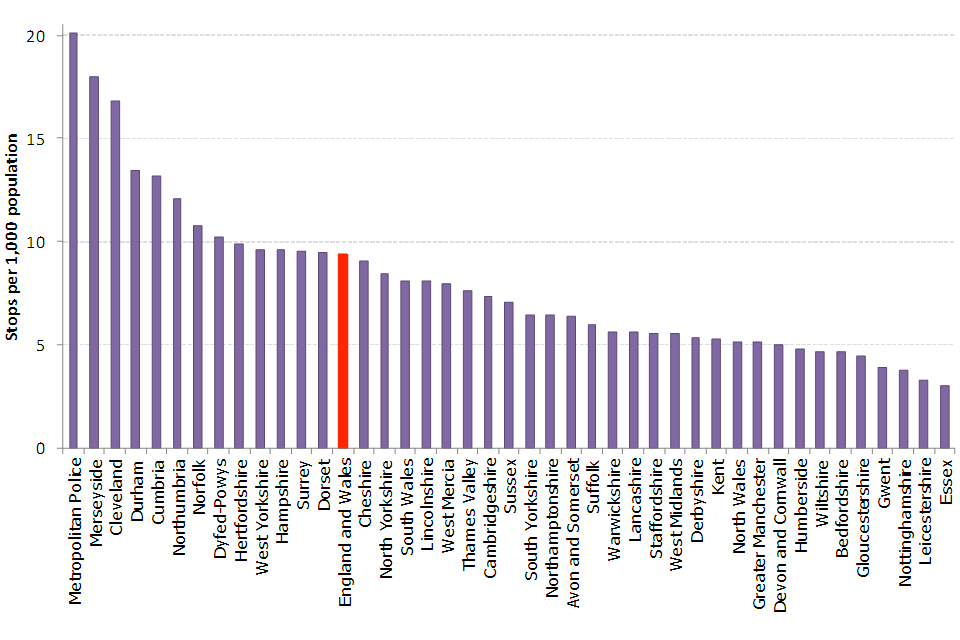
Not suplied by author.
Source: Stop and search table SS.14, Home Office
Chart Notes
- Calculated using the mid-2014 population estimates for England and Wales supplied by the Office for National Statistics (ONS).
- Population data for British Transport Police are not available; however, the force’s searches are included in the England and Wales rates.
- Rates for City of London are not included due to a small residential population relative to the transient or visiting population. However, the forces searches are included in the England and Wales rates.
Overall in England and Wales there were 9 searches per 1,000 population. The MPS had the highest search rate at 20 stops per 1,000 population. Essex had the lowest number of searches per 1,000 population with 3 searches.
Figure 4.8 Arrest rate following a stop and search, by police force area, England and Wales, year ending March 2015
Not suplied by author.
Source: Stop and search table SS.14, Home Office
City of London police had the highest arrest rate, with 1 in 4 searches leading to an arrest. This was followed by Devon and Cornwall (who had a 23% arrest rate) and Northumbria (20%). Half of police forces had an arrest rate of around 10% or less, with Humberside having the lowest rate (1%), followed by Cambridgeshire (2%).
While arrest rates do offer some indication of the effective and targeted use of stop and search, there are a range of other outcomes that the police may use that could indicate a successful stop and search. These are not included in this section, but the best use of stop and search scheme aims to collect data on these additional outcomes (see the Best Use of Stop and Search section for more details).
4.9 Stop and search by ethnicity
When conducting a stop and search, police are required to ask the person being stopped to define their ethnicity. For the purpose of this analysis, ethnicities are grouped into the following:
- White
- Black (or Black British)
- Asian (or Asian British)
- Chinese or other
- Mixed
- Not Stated
When looking at the ethnic breakdowns of those stopped and searched, the ethnic breakdown of the residential and visiting population of each area must be considered. Areas with higher proportions of ethnic minority residents and visitors are likely to see higher numbers of stops and searches on these groups. This is particularly relevant for the MPS. Findings at a national level are influenced by forces that have a higher rate of stop and search.
In the year ending March 2015, the total number of stops and searches carried out in England and Wales has fallen by 58% since the year ending March 2011, with stops of individuals belonging to BME groups falling 68% and stops of White individuals falling by 55%. Over the same period, stops on those who were Black have fallen by 70%.
Those who considered themselves to be from BME groups were around twice as likely to be stopped and searched than those who considered themselves to be White. This has fallen since the year ending March 2011 (the year of the most recent census providing population breakdowns by ethnicity), when those from BME groups were 3 times more likely to be searched than those who were White. The corresponding figure for those who are from Black (or Black British) ethnicities has fallen from over 6 times more likely to around 4 times more likely over the same period.
Although the probability of being stopped and searched as a BME individual relative to a White individual was fairly similar in the MPS to England and Wales overall, the fall in the disproportionate use of the power is heavily influenced by large falls in its use within the MPS, where BME individuals make up a greater proportion of the population. The number of stop and searches carried out in the MPS has fallen more steeply than in England and Wales overall, by two-thirds since the year ending March 2011 and this, coupled with the fact the MPS accounts for a large proportion of BME stops and searches leads to a reduction of the disproportional use of the power.
Figure 4.9 Likelihood1 of being stopped and searched by self-defined ethnic group, compared with those from White ethnic groups, England and Wales, year ending March 2011 compared with year ending March 20152,3,4
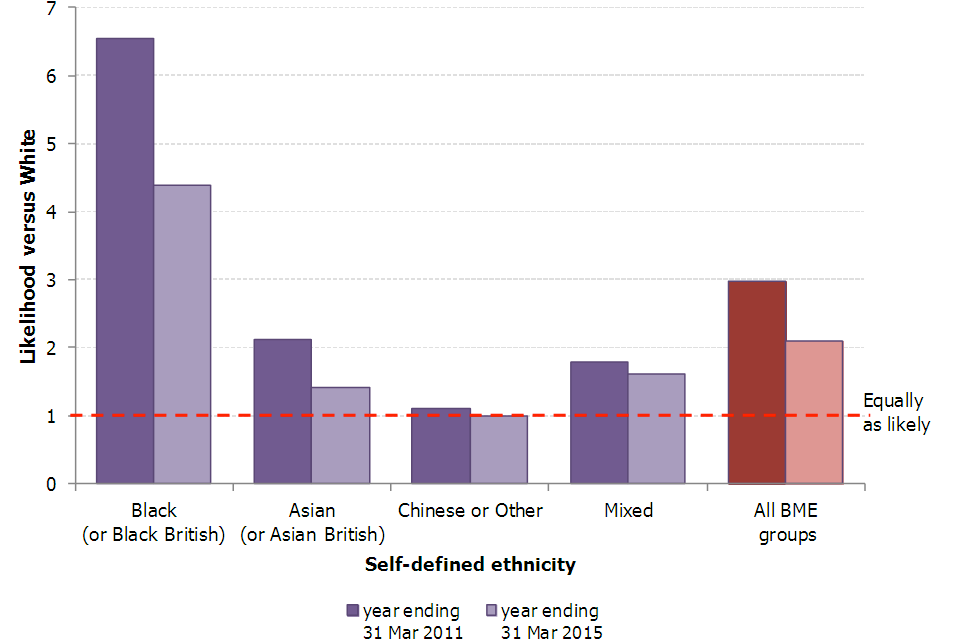
Not suplied by author.
Source: Stop and search table SS.13, Home Office
Chart Notes
- A likelihood of 1 indicates that the ethnic group is equally as likely to be stopped as those who are White.
- Population breakdowns are based on the 2011 census (the latest available figures). It is likely that ethnicity breakdowns have changed since 2011. Such changes are not accounted for in the figures. Therefore, these figures should be considered estimates only.
- Includes searches under section 1 of PACE (and associated legislation) and section 60 of the Criminal Justice and Public Order Act 1994.
- Rates per 1,000 population are published in table SS.13.
Table 4.01 Ethnic breakdowns of persons stopped under section 1 PACE and section 60 of the Criminal Justice and Public Order Act 1994, England and Wales, year ending March 20151,2
| Percentages | |||
|---|---|---|---|
| Self-defined ethnicity | |||
| White | Black (or Black British) | Other BME5 | |
| Section 1 PACE | |||
| England and Wales3 | 82 | 4 | 9 |
| MPS | 45 | 28 | 20 |
| Section 60 | |||
| England and Wales4 | 76 | 5 | 11 |
| MPS | 16 | 55 | 19 |
Source: Stop and search table SS.16, Home Office
Table Notes
- Excludes vehicle only searches.
- Cases where the ethnicity was ‘not stated’ are not included in the table.
- England and Wales totals exclude South Wales (as they were not able to accurately categorise ethnicities for all stops and searches under this power) and the MPS (which are provided separately), for section 1 PACE.
- Excludes data for the MPS, which are provided separately.
- ‘Other BME’ includes Asian (or Asian British), Mixed, and Chinese or other ethnicities.
A large proportion of persons from BME groups are stopped and searched under section 60 of the Criminal Justice and Public Order Act 1994, compared with section 1 PACE. This is particularly apparent in the MPS where 74% of those stopped under section 60 are from BME groups, compared with 48% of those stopped under PACE.
Figure 4.10 Ethnic breakdowns of persons stopped and searched1,2, all stops and searches, England and Wales3, year ending March 2015
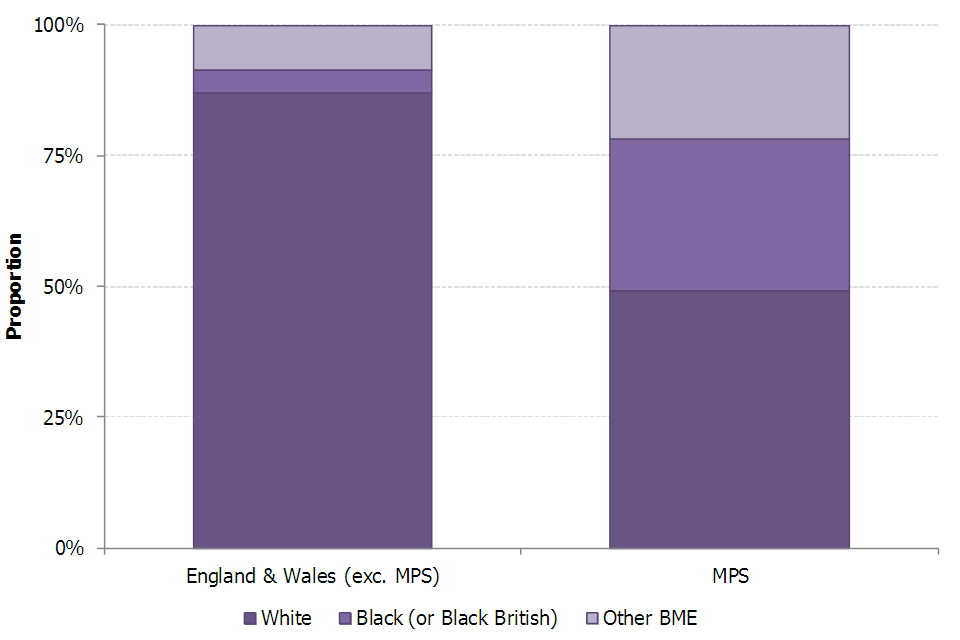
Not suplied by author.
Source: Stop and search table SS.16, Home Office
Chart Notes
- Excludes vehicle only searches and cases where the individual did not state their ethnicity.
- Includes searches under section 1 of PACE and section 60 of the Criminal Justice and Public Order Act 1994.
- Excludes section 1 PACE data for South Wales as the force were unable to accurately categorise the ethnicities of all persons searched.
4.10 Best use of stop and search
In April 2014, the Best Use of Stop and Search scheme was announced by the Home Secretary. The scheme requires forces to collect data on:
- a broader range of stop and search outcomes (such as cautions, community resolutions and drugs possession warnings)
- information on whether the reason for giving an outcome was linked to the reason for conducting the initial search
Annex A provides information on the data collected under the best use scheme. It draws on data taken from police.uk for a subset of forces and provides analysis on the use of additional outcomes, as well as the link between an outcome and the reason for a stop. Data in Annex A are not considered official or national statistics and should be interpreted with caution.
4.11 Data quality and interpreting the figures
Data presented here have been provided to the Home Office by the 43 territorial police forces in England and Wales. Since the year ending March 2010, BTP have also been providing data to the Home Office. Data prior to the year ending March 2010 is not directly comparable with data from the year ending March 2010 onwards, unless BTP are excluded. Unless otherwise stated, data for BTP are included in the tables.
For some years, certain forces have only provided partial data. For example, the reason for some stops and searches may not have been recorded, or may have been grouped into the ‘other’ category. Such cases have been outlined in the relevant table notes. In order to ensure data are comparable over time, certain forces may have been excluded from certain analysis. These have been specified in the footnotes for the relevant tables.
When an officer records the self-defined ethnicity of an individual, they record the ethnicity stated by the individual being stopped. In some cases this may not be the actual ethnicity of the individual.
Population ethnicity breakdowns are based on data from the 2011 census. In the analysis on rates of stop and search by ethnicity (section 4.7), population data from 2011 are compared with stop and search data for more recent years. Ethnicity breakdowns within the population are likely to have changed since 2011; however, these changes will not have been accounted for in the analysis. As a result, the findings outlined in Figure 4.9 and table SS.13 must be interpreted with caution.
The user guide provides further details relating to definitions, legislation and procedure around stop and search.
4.12 Other data sources
Quarterly figures for stops and searches conducted in Great Britain under the Terrorism Act 2000 appear in the Home Office series Operation of police powers under the Terrorism Act 2000. This includes data provided to the Home Office by the MPS on stop and search under section 43 of the Terrorism Act 2000 (included in the ‘other’ section of PACE stop and search for all forces, in this release).
The Ministry of Justice publishes a biennial Race and the criminal justice system series which includes data supplied by the Home Office on stop and search. The 2015 publication is due to be released in November and includes figures up to 2013/14 taken from the previous Police powers and procedures publication.
The Metropolitan Police publish monthly reports on the use of stop and search by the force. Other forces may publish similar reports.
5. Other PACE powers
5.1 Introduction
Police have a number of other powers that are authorised under the Police and Criminal Evidence Act 1984 (PACE). This section provides information on the police powers of detentions, road checks, and intimate searches.
Under section 42 of PACE, police may detain a suspect before charge, usually for a maximum of 24 hours, or for up to 36 hours, when an alleged offence is an indictable one. From 20 January 2004, new powers were introduced which enable an officer of the rank superintendent or above to authorise continued detention for up to 36 hours for all arrestable offences. Additionally, police may apply to magistrates to authorise warrants of further detention for up to 60 hours, extending the maximum detention period to a maximum of 96 hours without charge.
Road checks can be carried out under section 4 of the Police and Criminal Evidence Act (PACE) 1984, for the purpose of ascertaining whether a vehicle is carrying a person who may be of interest to the police. This section gives information on the number of times this power has been used, including the number of resultant arrests and the total number of vehicles stopped, on a financial-year basis.
If a person who is arrested is believed to be concealing Class A drugs, or anything that could be used to cause physical injury, under section 55 of the Police and Criminal Evidence Act 1984 a suitably qualified person may carry out an intimate search. This section includes data on the number of intimate searches carried out by police in England and Wales, as well as details on who conducted the search and why, on a financial-year basis.
Further details on intimate searches can be found in the user guide.
5.2 Detentions
This section provides information on the number of persons detained for more than 24 hours who were subsequently released. It also provides details on the number of warrants for further detention that were applied for and the number that led to charges. Data are collected by the Home Office from the 43 territorial police forces in England and Wales on a financial-year basis.
In the year ending March 2015, there were a total of 3,133 persons detained under part IV of PACE for more than 24 hours by police in England and Wales. This represents a fall of 16% compared with the previous year (based on data from 38 forces who were able to provide complete data for the year ending March 2014 and the year ending March 2015).
Ninety-four per cent (2,933) of those detained were held for between 24 and 36 hours, before being released without charge, and a further 3% (87 persons) were held for more than 36 hours, before being released without charge. The remaining 113 were detained under warrant for further arrest.
Police in England and Wales applied to magistrates for 507 warrants of further detention. Forty-eight of these applications were refused, meaning warrants were granted in 91% of cases. When a warrant of further detention was granted, this led to a charge in 69% of cases (a rise of one percentage point compared with the previous year).
5.3 Road checks
In the year ending March 2015 there were 16 road checks carried out by police in England and Wales, resulting in 2,598 vehicles being stopped (based on 40 police forces who could supply data to the Home Office). Although this was one road check fewer than in the previous year, the number of vehicles stopped rose by 29% over the same time period (from 2,021 in the year ending March 2014 to 2,598 in the year ending March 2015). Road checks were carried out by a total of 7 forces and the average number of vehicles stopped per road check rose from 119 in the year ending March 2014 to 162 in the year ending March 2015.
Each of the 16 road checks that were authorised in the year ending March 2015 were to ascertain whether the vehicle was carrying an individual who had witnessed an indictable offence. None of the road checks resulted in an arrest.
5.4 Intimate searches
There were a total of 75 intimate searches carried out by police in England and Wales in the year ending March 2015. Of these, 74 (or 99%) were carried out by a suitably qualified person. One search was carried out by a police officer.
Of all searches, 87% were made in an attempt to find Class A drugs, the remaining 13% of searches were conducted to find harmful articles. This is consistent with breakdowns for recent years, where around 80-90% of searches were conducted to find Class A drugs. Of the searches made for drugs (in the year ending March 2015), Class A drugs were found in 14% of cases, up 6 percentage points from 8% in the year ending March 2014. Of the searches made for harmful articles (10 searches), one resulted in a harmful article being found.
Of the 36 police forces in England and Wales who could supply data to the Home Office, 21 had carried out intimate searches in the year ending March 2015. Surrey Police conducted the most intimate searches with 14, followed by South Wales, who conducted 11.
5.5 Data quality and interpreting the figures
The presented statistics are correct at the time of publication. There have been no revisions submitted by forces for previous years.
Lincolnshire and Thames Valley were unable to provide detentions data for the year ending March 2015. Cheshire and Dorset were only able to provide partial data. These forces have been excluded from some year-on-year comparisons, as outlined in the notes for the detentions tables.
Avon and Somerset, Hampshire and Gloucestershire were unable to provide road check data to the Home Office in the year ending March 2015. A number of other forces were unable to provide data for previous years.
Cambridgeshire, Dorset, Durham, Gwent, Kent, Lincolnshire and Thames Valley were unable to provide any data on intimate searches for the year ending March 2015. Data for these 7 forces have been excluded from any comparison between these 2 years.
The user guide provides further details relating to definitions, legislation and procedures, and data quality.
6. Fixed penalty notices for motoring offences
6.1 Key findings
In 2014, there were around 1.02 million fixed penalty notices (FPNs) issued for motoring offences by police in England and Wales, a fall of 11% compared with 2013. The number of non-endorsable FPNs issued fell by a third, compared with a 3% fall in endorsable FPNs.
Throughout the same period, the number of FPNs issued for speed limit offences, which account for the majority of FPNs issued, increased by 4%.
6.2 Introduction
A fixed penalty notice (FPN) is a prescribed financial penalty issued to a motorist as an alternative to facing prosecution. They can be issued for a range of motoring offences such as seat belt offences, and using a handheld mobile phone while driving. An FPN can be endorsable (accompanied by points on a driving licence) or non-endorsable (not accompanied by points on a driving licence).
This section includes data on the number of FPNs issued by police in England and Wales (excluding British Transport Police) on a calendar-year basis. The data are broken down to show the:
- number of FPNs issued by each police force in England and Wales
- types of offences for which FPNs are issued
- number of FPNs resulting from camera-detected offences
- number of fines that have been paid and registered in court
Data on FPNs issued by police in England and Wales for motoring offences are presented in the FPN tables.
6.3 Trends in FPNs
There were around 1.02 million FPNs issued for motoring offences by the police in England and Wales (including police employed traffic wardens) in 2014. This represents a fall of 11% compared with the previous year and continues a year-on-year downward trend in the number of FPNs issued since 2005. Around 836,000 (82%) of these were endorsable, and 187,000 were non-endorsable.
Although there have been falls in both the number of endorsable and non-endorsable FPNs issued, the number of non-endorsable FPNs has fallen at a faster rate than endorsable FPNs over the last few years. In 2014, the number of non-endorsable FPNs fell by a third compared with 2013, while the number of endorsable FPNs issued fell by only 3%.
Figure 6.1 Number of endorsable and non-endorsable FPNs issued for motoring offences, England and Wales1,2,3
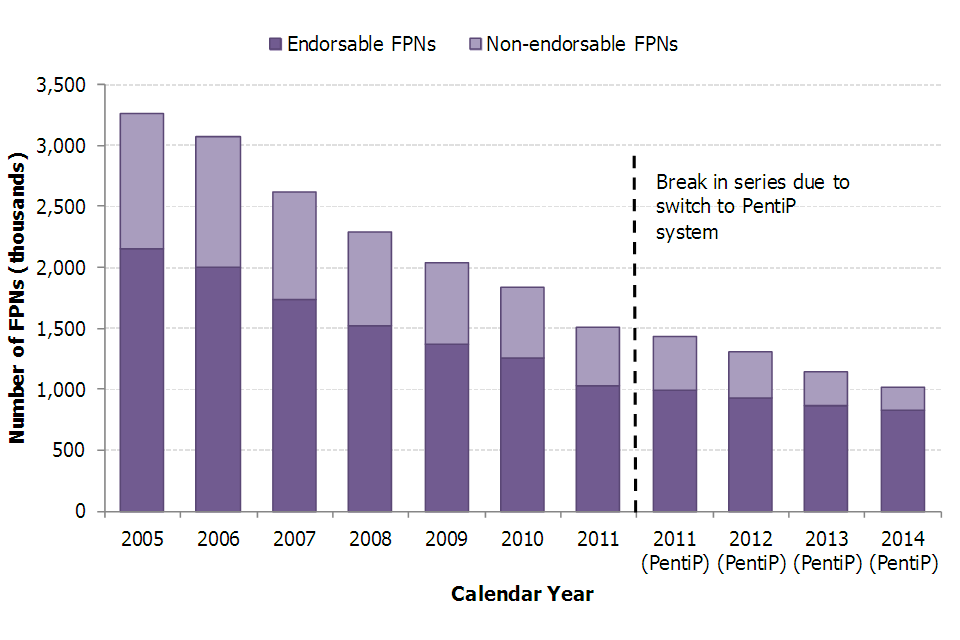
Not suplied by author.
Source: Table FPN_01, Home Office
Chart Notes
- Excludes British Transport Police (BTP).
- Data from 2011 onwards are extracted from the PentiP system and are not directly comparable with data from previous years. Further information can be found in the user guide.
- Data for 2011 is presented twice. Once for the VP/FPO system, and once for the PentiP system. The comparison between the 2 2011 bars highlights the difference between the 2 recording methods.
6.4 FPNs by offence type
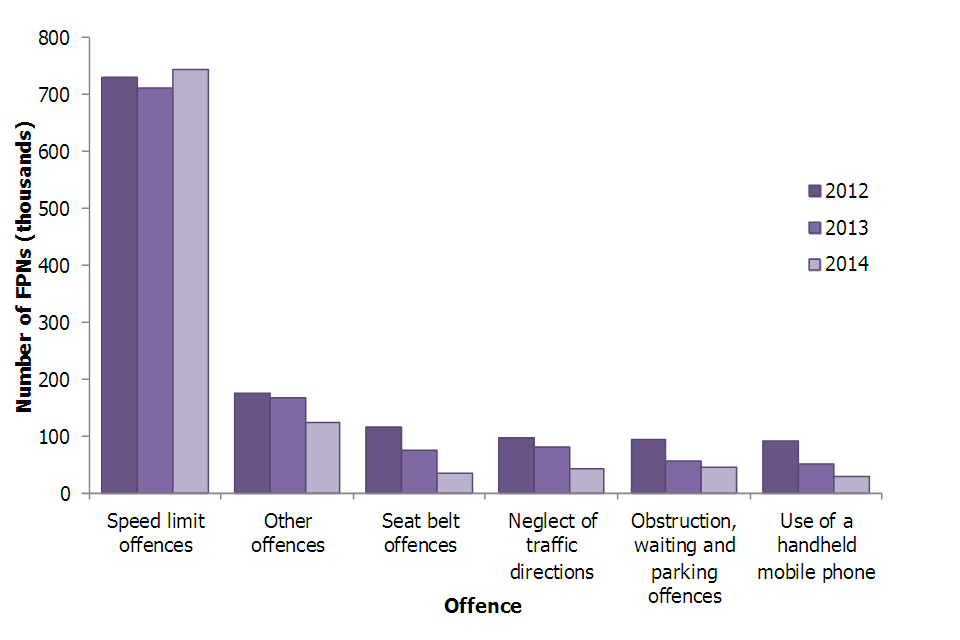
Nearly three-quarters of FPNs issued in 2014 were for speed limit offences, up 10 percentage points on the previous year. Although the majority of FPNs have been for speed limit offences in every year, the proportion that such FPNs accounted for in 2014 is the highest on record. The number of FPNs issued for speed limit offences showed a year-on-year fall between 2005 and 2013. The most recent year saw an increase of 31,000 FPNs (or 4%) compared with the previous year. Most other offence types saw a fall in the number of FPNs issued.
Figure 6.2 Number of FPNs issued by type of motoring offence1
Not suplied by author.
Source: Table FPN_02, Home Office
Chart Notes
- ‘Other offences’ includes all offences not separately presented in the chart.
As well as speeding offences, there were 2 other offences that saw an increase in the number of FPNs issued in 2014, compared with 2013, but these were small in numerical terms so had little effect on the overall trend:
- ‘Careless driving (excluding use of a handheld mobile phone while driving)’ saw an increase of 11%, or 415 FPNs
- ‘Miscellaneous motoring offences (excluding seat belt offences)’ saw an increase of 13%, or 74 FPNs
All other offences saw a decrease in the number of FPNs issued. Most notably, FPNs issued for ‘seatbelt offences’, which more than halved from 75,000 in 2013 to 36,000 in 2014, and ‘use of a handheld mobile phone while driving’ which fell by 43% to 30,000 over the same period.
Offences that come under ‘neglect of traffic directions’ and ‘speed limit offences’ may be detected by the police, or by traffic enforcement cameras. The proportion of ‘neglect of traffic directions’ offences that were detected by a camera in 2014 was 49%, down 8 percentage points on the previous year. The majority (90%) of FPNs for ‘speed limit offences’ were camera-detected in 2014. This was an increase of 4 percentage points on the previous year.
Table 6.01 Number of FPNs for ‘speed limit offences’ and ‘neglect of traffic directions’ offences and proportion of which were camera-detected, 2013 and 2014
| Numbers and percentages | England and Wales | |
|---|---|---|
| Offence type | Calendar year 2013 | Calendar year 2014 |
| Neglect of traffic directions | 75,268 | 39,090 |
| Of which: Camera-detected (%) | 57 | 49 |
| Speed limit offences | 711,739 | 743,054 |
| Of which: Camera-detected (%) | 86 | 90 |
Source: Table FPN_06, Home Office
6.5 Outcomes of FPNs
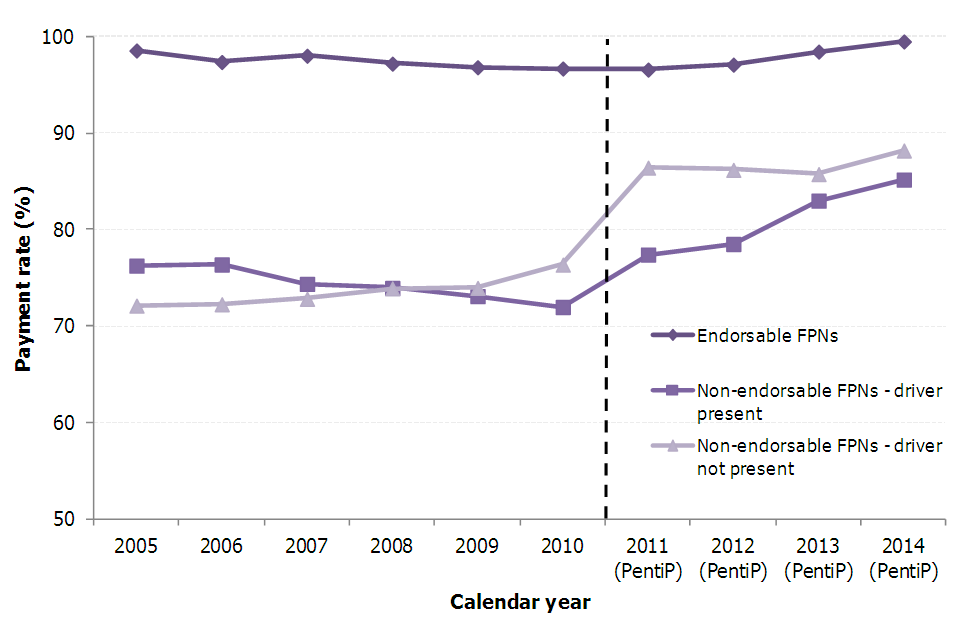
When an individual is issued with an FPN, they may pay the fine, or alternatively the fine may be registered in court. In 2014, the fine was paid in 97% of cases, an increase of 2 percentage points on the previous year. As with previous years, the fine was paid in a larger proportion of endorsable offences (99%) than non-endorsable offences, which saw a payment rate of 85% when the driver was present at the time the penalty notice was issued and 88% when the driver was not present at the time that the notice was issued.
Payment rates have remained fairly constant since 2005. Since the implementation of the PentiP system in 2011, payment rates for non-endorsable FPNs have increased. This is due in part to differences in recording between the two systems. The PentiP system does not record cases that have been referred for court proceedings, or those for which no further action was taken.
Figure 6.3 FPN payment rate by type of FPN, England and Wales1,2,3
Not suplied by author.
Source: Table FPN_05, Home Office
Chart Notes
- Data from 2011 onwards are extracted from the PentiP system and are not directly comparable with data from previous years. Further information can be found in the user guide.
- Driver present includes cases where the driver was present at the time the penalty notice was issued.
- Driver not present includes cases where the driver was not present at the time the penalty notice was issued.
6.6 Data quality and interpreting the figures
From 2011, data are extracted from the PentiP system, a national system designed to process FPNs. It replaced the Vehicle Procedures and Fixed Penalty Office (VP/FPO) system. VP/FPO data were supplied to the Home Office by individual police forces and are presented for the years 2005 to 2011. Caution must be taken when comparing the 2 data sources. The number of FPNs reported in the PentiP data are slightly lower than equivalent data taken from VP/FPO data (see Figure 6.1).
The user guide contains further information relating to definitions, legislation, procedure and the change to PentiP.
Data relating to the failure to hold an operator’s licence and work record or employment offences (relating to the failure of employers or employees to observe limits on driving time) are presented only from 2011 onwards. There were just over 4,500 FPNs issued in relation to these offence groups in 2014; since these represent fewer than 1% of the total FPNs issued in England and Wales, these categories have been included in long-term trend analysis.
6.7 Other data sources
The MoJ publish data in their Criminal Justice Statistics Quarterly publication on:
- penalty notices for disorder (PNDs); these follow similar principles to FPNs and can be issued for low-level summary offences, such as being drunk and disorderly, petty theft, and possession of cannabis
- prosecutions and convictions for motoring offences
The Department for Transport (DfT) publish a number of Road Accident and Safety Statistics including data on:
- road casualties
- drink and drug driving
7. Breath tests
7.1 Key findings
Police carried out 607,000 breath tests in 2014, a fall of 10% compared with the 676,000 breath tests carried out in 2013. Eleven per cent of breath tests carried out in 2014 were positive or refused, up one percentage point on 2013.
The months of June and December accounted for over a third of all breath tests in 2014. This is in line with the Police drink and drug driving campaigns during the summer and Christmas period.
7.2 Introduction
Under the Road Traffic Act 1988, police may conduct a breath test at the roadside in order to determine whether motorists are driving with alcohol in their body, beyond the prescribed limit. If a person refuses a breath test, police may deal with this in the same way, and the individual may be subject to the same penalties as someone who fails a breath test.
This section includes data on the number of breath tests carried out by police in England and Wales (excluding British Transport Police). It presents data on a calendar-year basis up to and including 2014. The data show:
- the number of breath tests carried out by police in England and Wales
- the number of positive/refused breath tests
- the number of breath tests conducted per 1,000 population in each police force across England and Wales
Further details relating to definitions, legislation and procedure are given in the user guide.
7.3 Trends in breath tests
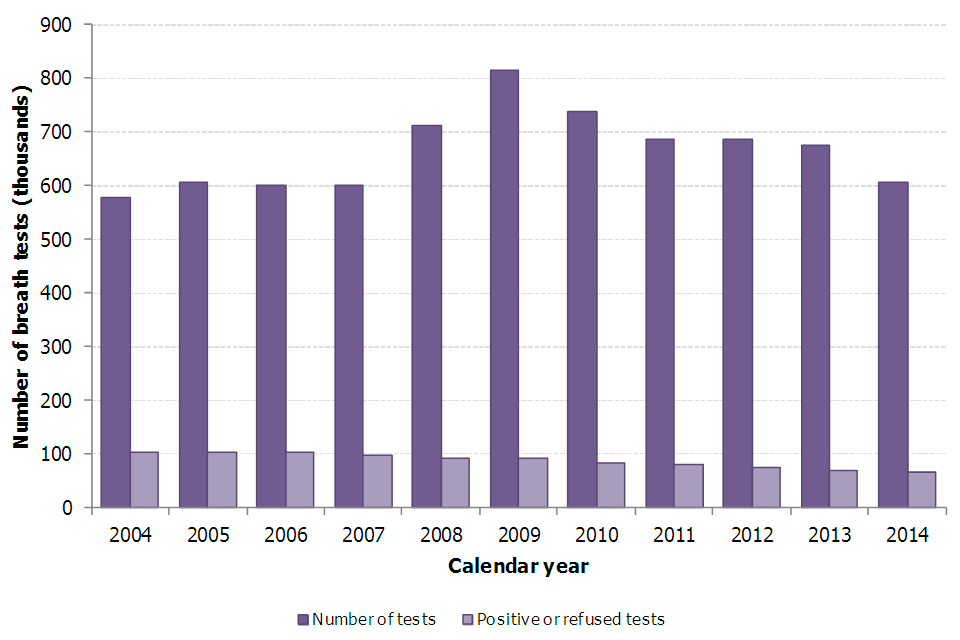
There were 606,775 breath tests carried out by police in 2014, the lowest number since 2007. This represents a fall of 10% when compared with 676,353 breath tests carried out in 2013. The decrease followed a downward trend since 2011 after falling from a peak of 815,290 breath tests in 2009. Reductions in police resources and change in priorities may have led to lower numbers of breath tests being conducted.
There were 66,666 breath tests which were positive or refused in 2014 compared with 70,675 positive or refused tests in 2013. The proportion of breath tests that were positive or refused gradually fell from 18% in 2004 to 11% in 2009 and has remained stable at between 10% and 12% since then.
Figure 7.1 Number of breath tests, and number of positive/refused tests carried out by police in England and Wales
Not suplied by author.
Source: Breath test table BT.03, Home Office
7.4 Seasonal variation
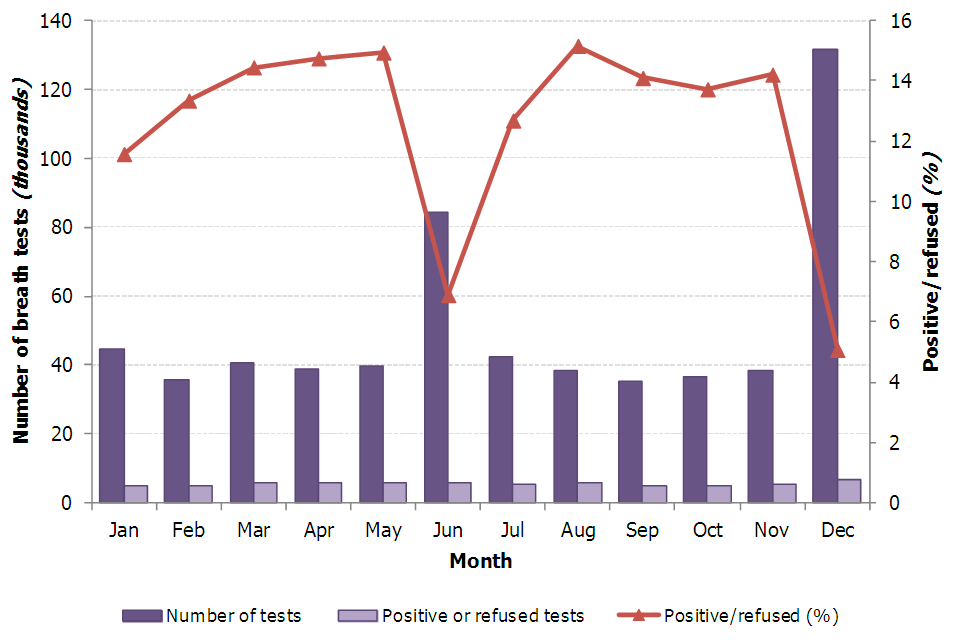
In 2014, the month where the highest numbers of breath tests were carried out was December when 131,586 breath tests were carried out; this equates to 22% of all breath tests in 2014 and coincides with the annual national Christmas drink and drug driving campaign. The month with the second highest number of breath tests was June, with 84,450. This accounted for a further 14% of all breath tests in 2014 and is likely to be due to police campaigns against drinking and drug driving during the summer period.
Excluding the 2 peaks in June and December, the number of breath tests in each month averaged just over 39,000 tests. The number of tests carried out in June (84,450) was more than double, and in December (131,586) was more than treble, the average of the other months.
Although there were much higher numbers of breath tests in June and December, the actual number of positive or refused tests only increased slightly and the proportion of tests that were positive or refused was much lower in June (7%) and December (5%) than it was throughout the rest of the year (14%).
Figure 7.2 Number of breath tests, and number positive/refused tests carried out by police in England and Wales, by month, 2014
Not suplied by author.
Source: Breath test table BT.04, Home Office
7.5 Geographical patterns
In 2014, 11 breath tests were conducted per 1,000 population across England and Wales. The rate for Wales (25 per 1,000 population) was more than twice that for England (10 per 1,000 population). This was driven by relatively large rates of breath tests carried out by Dyfed-Powys and North Wales which was down to a particularly proactive approach from the forces during the summer and Christmas drink driving campaigns.
Excluding Dyfed-Powys and North Wales, Suffolk had the highest rate with 24 tests per 1,000 population and Avon and Somerset had the lowest rate with 4 tests per 1,000 population. The percentage of breath tests per 1,000 population that were positive or refused ranged from 5% in North Wales to 34% in Cambridgeshire.
7.6 Data quality and interpreting the figures
A breath alcohol screening test can be required when a driver involved in a collision is suspected of driving with alcohol in the body or following the commission of a moving traffic offence. Results of breath alcohol screening tests can only be regarded as indicative of the level of alcohol present in a sample of breath and are not used to determine whether a driver was above or below the legal limit to drive. It remains the case that it is only at a police station or hospital that a specimen(s) can be obtained to determine a person’s actual alcohol concentration, using pre-calibrated evidential devices ensuring the sample has not been affected by any interfering substances or that blood or urine specimens may be taken for subsequent laboratory analysis. These subsequent evidential tests are not included in the breath test statistics.
From April 2008, new digital recording equipment started to be used by forces. The devices are able to record exact breath alcohol readings and the result of individual tests, as well as reason for test, time of day, day of week and age and gender profiles of those tested, and results are downloaded to data systems on a monthly basis and provided to the Department for Transport (DfT).
Data presented here have been sourced from annual statistical returns received from the 43 police forces in England and Wales. By 2011, a large number of police forces in England and Wales had been making greater use of the digital breath test devices, in comparison to previous years. However, the manual recording systems are still being used by some police forces. The figures presented here are based on the combined results of both systems. Negative breath test data supplied to the Home Office may have been under-reported based on the old system and it is likely that moving to the digital services has led to improvements in data recording practices by forces. This appears to have been reflected in the decrease in the proportion of positive or refused tests of total breath tests, since the beginning of 2008.
The user guide provides further details relating to data quality and interpreting the figures.
7.7 Other data sources
Analysis of reported roadside breath alcohol screening tests, based on data from digital breath testing devices, is published by the Department for Transport (DfT). Latest figures were included within the DfT’s Reported road casualties in Great Britain: 2014 annual report.
8. Annex A: Best use of stop and search
On 30 April 2014, the Best Use of Stop and Search scheme was announced by the Home Secretary. The aims of the scheme were to:
- achieve greater transparency around how stop and search is used
- improve community engagement and involvement in the use of stop and search powers
- develop a more intelligence-led approach to the use of stop and search
- encourage accountability in the police use of stop and search powers
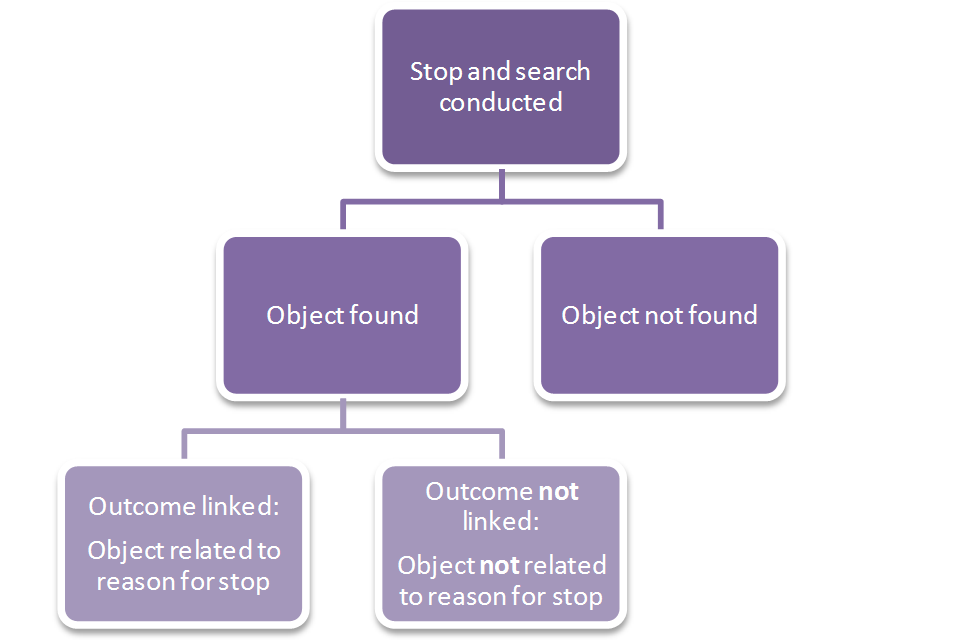
Historically, forces have provided details on the number of stops and searches conducted, and the number that have led to an arrest. Arrests represent only one of a number of possible outcomes available to the police when conducting a stop and search. As part of the scheme, forces are required to report on a wider range of outcomes, details of which can be found in the Best Use of Stop and Search guidance. For each stop and search, only one outcome is recorded. Where an outcome follows an arrest, only the arrest will be recorded in order to avoid double counting. The figures therefore show the number of stops and searches that have resulted in an outcome, rather than the total number of outcomes given following a stop and search.
Forces are also required to report on whether the reason for a given outcome was linked to the initial reason for conducting the search. This aims to increase transparency by allowing for a distinction between those outcomes that are a result of a professional judgement, and those that are likely to represent a chance detection.
Figure 1 Possible outcomes1 of a stop and search
Not suplied by author.
Notes:
- For the full list of outcomes, see the Best Use of Stop and Search guidance.
The following section takes police data which are published on the police.uk website. These data are taken from a subset of forces that were able to provide some data in the 9 months to August 2015. These data have not undergone the usual strict data quality checks and procedures and should be considered indicative only. The findings in this section are not considered Official or National Statistics.
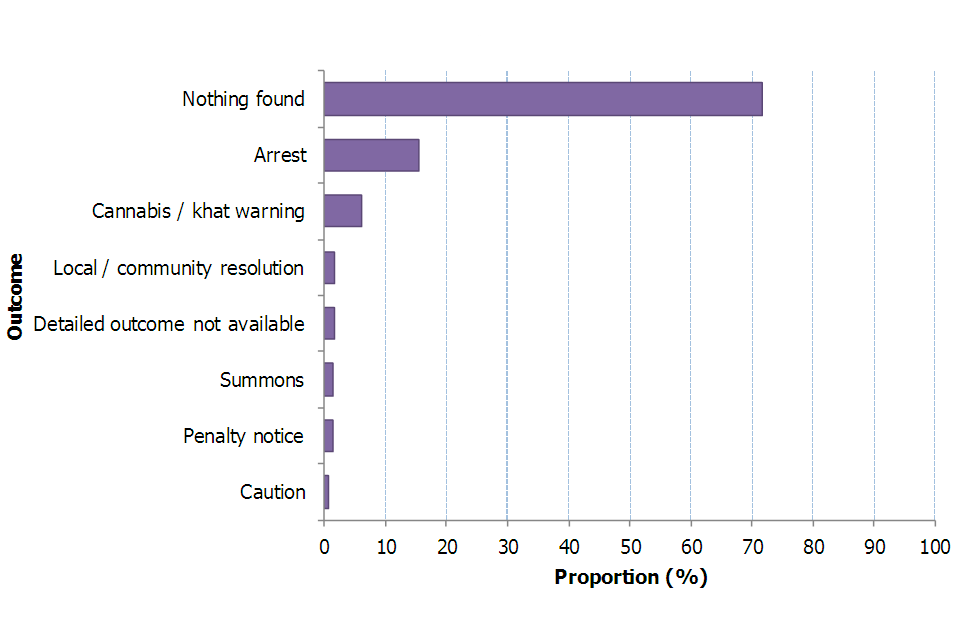
8.1 Outcomes following stop and search
The following includes data from 36 forces in the 9 months to August 2015. It contains information on searches under both section 1 PACE and section 60 of the Criminal Justice and Public Order Act 1994:
- an article was found, and an outcome given in 28% of stops and searches; in the remaining 72% of stops, nothing was found during the course of the search
- in 15% of stops the principle outcome was an arrest, and 13% led to an alternative outcome as the principle outcome
- the most common ‘alternative’ outcome given was a drugs possession warning (such as a cannabis or khat warning); these were issued as the principle outcome in 6% of stops
Figure 2 Principle outcomes following stop and search, England and Wales1,2
Not suplied by author.
Source: police.uk.
Chart notes:
- Includes data from 36 forces in England and Wales.
- Includes partial data taken from the 9 months to August 2015.
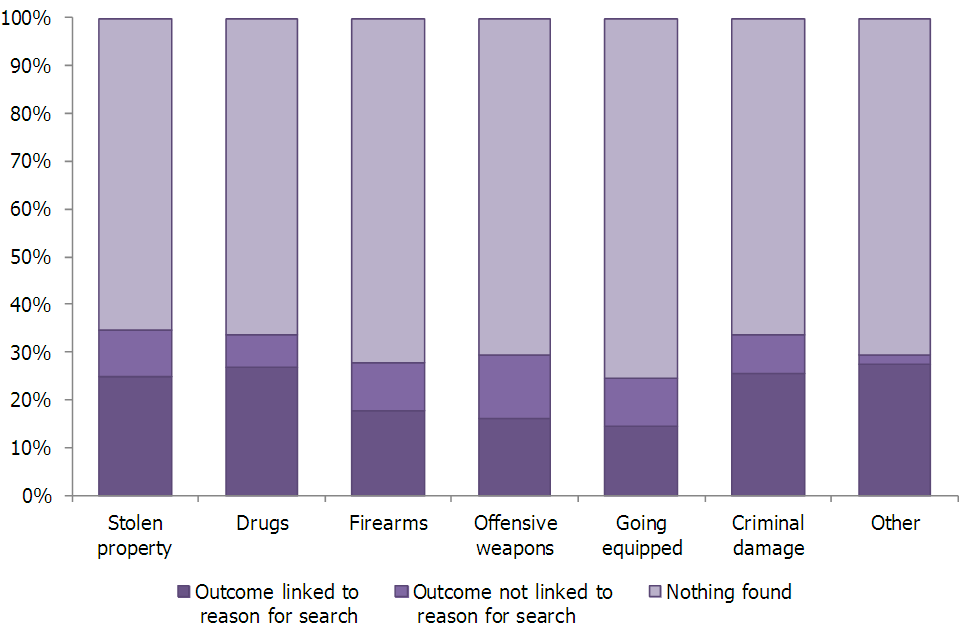
8.2 Outcome linked to reason for stop and search
As per figure 1, if an officer finds an article during the course of a search, it may either be related to the initial reason for the search (indicating professional judgement from the officer), or unrelated to the initial reason (indicating a possible chance detection).
The following includes data from 8 forces that were able to record whether the reason for the search was linked to the outcome of the search. As this analysis only accounts for a very small proportion of all stops and searches in England and Wales, these findings should be treated with caution:
- in a quarter of stops and searches, an outcome was issued where the reason for the outcome was the same as the reason for conducting the initial stop (i.e. linked outcome); in a further 8% of cases, officers issued an outcome for a reason not related to the initial reason for the stop
- some reasons for searches had a higher proportion of outcomes that were linked to the reason for search than others. For example, officers issued an outcome for drugs following a drug-related search in 27% of cases; in contrast, when stopping someone on suspicion of carrying an offensive weapon, officers issued an outcome related to offensive weapons in only 16% of cases
Figure 3 Proportion of stops and searches by outcome1
Not suplied by author.
Source: police.uk.
Chart notes:
- Figures in this chart will not match figures in other analysis in this section because the analyses use a different subset of forces.
Future developments
The above analyses are based on limited data for a subset of forces taken from police.uk. These data are continually being developed. The Home Office are working with forces to ensure all forces are working towards providing data that is accurate and reliable. As more data become available, it will be possible to do more detailed analysis.
The Home Office intends to publish more detailed analysis for the year ending 31 March 2016 in the next annual police powers and procedures publication.