Plastic Packaging Tax Evaluation: final evaluation
Published 28 October 2026

© Crown copyright 2026
This publication is licensed under the terms of the Open Government Licence v3.0 except where otherwise stated. To view this licence, visit nationalarchives.gov.uk/doc/open-government-licence/version/3 or write to the Information Policy Team, The National Archives, Kew, London TW9 4DU, or email: psi@nationalarchives.gov.uk.
Where we have identified any third party copyright information you will need to obtain permission from the copyright holders concerned.
This publication is available at https://www.gov.uk/government/publications/plastic-packaging-tax-evaluation/plastic-packaging-tax-evaluation-final-evaluation--2
Chapter 1: Executive Summary
1.1 Introduction to the evaluation
The Plastic Packaging Tax (PPT) was introduced in April 2022 to encourage the use of recycled plastic in packaging and reduce reliance on virgin plastic. The tax applies to finished plastic packaging containing less than 30% recycled content, creating a financial incentive for businesses to increase the recycled content of their packaging. Since its introduction, PPT receipts have declined year-on-year. As an environmental tax, one possible explanation is that businesses have increased the recycled content of their packaging above the 30% threshold, thereby reducing their tax liability. This evaluation examines the extent to which PPT has influenced business behaviour, increased the use of recycled plastic in packaging, and contributed to its intended environmental outcomes.
1.2 Overall finding
The evaluation finds that PPT has had a moderately positive impact on business behaviour and environmental outcomes. The strongest evidence of behavioural change is an increase in the proportion of plastic packaging meeting the 30% recycled content threshold over the lifespan of the tax. The evidence also indicates that PPT has influenced packaging decisions more broadly, including encouraging some businesses to redesign packaging and reduce overall plastic use. However, responses have been uneven across businesses and appear concentrated among a subset of firms.
PPT has also influenced wider business decision-making beyond recycled content. Half of businesses surveyed reported passing through some or all of the costs of PPT to customers, while many reported that the tax had influenced packaging strategies and investment decisions. These included material substitution, packaging redesign and packaging reduction. However, PPT operated within a broader commercial, environmental and regulatory context, meaning that it was likely one of several factors shaping packaging decisions rather than the sole driver of change.
The evaluation also finds evidence of positive environmental outcomes, including reductions in plastic packaging waste and lower estimated greenhouse gas emissions associated with plastic packaging. However, the available evidence does not allow the effects of PPT to be isolated from other influences, and therefore the scale of the tax’s contribution to these outcomes cannot be determined with certainty.
1.3 Has PPT increased recycled content and reduced virgin plastic use?
PPT has been a contributing factor in increasing the amount of plastic packaging meeting the 30% recycled content threshold. The clearest evidence of behavioural change is the growth in the proportion of packaging above this threshold over the lifespan of the tax. The available evidence suggests that this increase was concentrated among a subset of businesses registered for the tax. The qualitative research also demonstrated that some businesses made changes in anticipation of the tax. While some businesses also reported reducing their use of plastic packaging, these reductions were generally modest in scale and were not observed consistently across the tax base. The findings indicate that PPT has influenced behaviour at the margin rather than driving widespread or transformative changes across the plastic packaging market.
The extent of changing the recycled content in plastic packaging appears to have been shaped by a range of factors affecting businesses’ ability and incentive to respond. These included the availability and quality of recycled plastic; the relative cost of recycled and virgin plastic after accounting for PPT liabilities; and wider technical and operational factors. While the evidence suggests that stronger incentives would likely encourage further behavioural change, the findings also indicate that businesses’ responses were influenced by a combination of economic, technical and supply-side factors rather than any single constraint. Consequently, some businesses have reported responding to the tax through alternative positive routes, such as reducing packaging volumes or switching materials.
Assessing the full impact of PPT remains challenging. A key limitation is that detailed baseline information on recycled content levels in plastic packaging was not collected prior to the introduction of the tax, making it difficult to quantify the scale of behavioural change attributable to PPT, particularly where changes may have occurred quickly following implementation. In addition, HMRC administrative data collected through PPT returns is not designed to capture detailed information on recycled content levels within packaging. This reflects a deliberate effort to minimise administrative burden on businesses. As a result, the evaluation relies primarily on survey and interview evidence to understand behavioural responses and has limited ability to precisely assess how changes in recycled content levels have evolved across the market over time.
The stated ability to change recycled content varied depending on a business’s position in the supply chain, operational characteristics and existing sustainability practices. Manufacturers of plastic packaging generally reported stronger changes, including greater increases in recycled content and larger reductions in plastic use, reflecting their greater ability to alter production decisions. In contrast, importers of plastic packaging appeared less responsive on average, as they often had less direct influence over packaging specifications and production processes. This may have limited the extent to which they could implement packaging changes quickly relative to manufacturers.
The evidence suggests that businesses’ starting positions and characteristics influenced their responses to PPT. Businesses handling larger volumes of packaging and those reporting stronger sustainability practices were more likely to have packaging meeting the 30% recycled content threshold. Variation in responses was limited across packaging product types but more pronounced across plastic polymer types, reflecting differing technical constraints, costs and market conditions. Businesses without manufacturing sites outside the UK were also more likely to report substantial increases in recycled content, highlighting the importance of production and supply-chain arrangements in determining the extent to which businesses can respond to PPT.
1.4 Has PPT changed wider packaging choices?
PPT formed part of the decision-making process for many businesses, but generally acted alongside wider commercial, environmental and regulatory drivers. While the majority of businesses surveyed reported that PPT had influenced their packaging strategy to some degree, only a small minority reported a significant influence. Businesses frequently identified customer requirements, sustainability objectives, wider environmental regulation and recycled plastic market conditions as also shaping packaging decisions.
Businesses responded through a combination of pricing and packaging adjustments. Half of surveyed businesses reported passing through some or all PPT costs to customers, while the most commonly reported packaging responses were material substitution, packaging redesign and packaging reduction. HMRC administrative data shows declining plastic packaging volumes since the introduction of the tax, consistent with these reported behaviours. However, the available evidence cannot isolate the effect of PPT from wider influences, meaning these trends cannot be attributed solely to the tax.
1.5 Has PPT stimulated demand or supply for recycled plastic?
Evidence suggests that PPT contributed to increased demand for recycled plastic. The clearest indication of this is the increase in the proportion of plastic packaging meeting the 30% recycled content threshold, alongside evidence that a subset of businesses increased recycled content in response to the tax. However, evidence that these changes have translated into wider effects across the recycled plastics system remains limited.
Recycling rates were higher following the introduction of PPT, but this appears to reflect lower levels of plastic packaging waste arising rather than a substantial increase in the volume of plastic packaging recycled. Survey evidence also found no clear consensus that the availability of recycled plastic had increased, with many businesses reporting that availability had remained unchanged or that they were unsure whether it had changed. Overall, the evidence suggests PPT increased demand for recycled plastic to some extent, but there is limited evidence that these changes have yet translated into substantial supply-side responses within the recycled plastics market.
1.6 Has PPT reduced plastic waste and improved environmental outcomes?
There is evidence consistent with PPT contributing to reductions in plastic packaging waste and positive environmental outcomes. Plastic packaging waste fell following the introduction of the tax and has remained at a lower level since. Compared with other packaging materials, plastic was the only material to show a notable reduction in waste arising in the UK following the introduction of PPT, suggesting the changes observed were more pronounced for taxed plastic packaging than for packaging waste more generally.
The evaluation also found evidence of improved environmental outcomes associated with increased use of recycled content. Estimated greenhouse gas emissions associated with plastic packaging production have fallen since the introduction of PPT, reflecting reductions in virgin plastic use and greater use of recycled material. The central estimates suggest average emissions reductions of 260,000 tonnes of carbon dioxide equivalent (tCO2e) per year between financial year 2022 to 2023 and financial year 2025 to 2026. However, there is less evidence that PPT has substantially increased the volume of plastic waste collected for recycling or changed the composition of plastic waste entering recycling systems.
Overall, the findings suggest that the environmental impacts associated with PPT have primarily arisen through reductions in plastic use and increases in recycled content within packaging, rather than through substantial increases in recycling volumes.
Chapter 2: Introduction
This chapter provides an introduction to the PPT and provides an overview of the objectives of the evaluation.
2.1 Overview of the Plastic Packaging Tax
2.1.1 Policy overview
The PPT is an environmental tax designed to incentivise the use of recycled plastic in packaging and consequently decrease the use of new materials to reduce the environmental impacts associated with plastic packaging. As the tax has an explicit environmental objective, the primary purpose of PPT is not to raise revenue, but to change behaviour by altering relative prices faced by businesses. It was first announced during Budget 2018 and came into force on 1 April 2022.
The primary objective of the tax is to encourage behavioural change among businesses by providing a clear economic incentive to substitute virgin plastic with recycled material. By increasing demand for recycled plastic, the tax aims to stimulate greater recycling and collection of plastic waste, thereby diverting plastic from lower points of the waste hierarchy, such as landfill and incineration, and reducing wider environmental harms.
The tax applies to finished plastic packaging manufactured in, or imported into, the UK. Liability is placed on businesses that manufacture plastic packaging domestically and on businesses that import plastic packaging into the UK. For domestic production, the legally liable entities are the manufacturers, meaning that downstream businesses purchasing packaging from those businesses are not directly liable for the tax. For imports, liability rests with the businesses responsible for importing the plastic packaging into the UK. The tax is subject to a small number of exclusions and exemptions (for example, certain transport packaging and packaging integral to goods), which are intended to ensure that the scope of the tax remains proportionate. A collection of guidance on the Plastic Packaging Tax is available.
For the purposes of the tax, plastic packaging refers to packaging components that are predominantly plastic by weight and are designed to contain, protect, handle, deliver or present goods. Businesses that manufacture or import 10 tonnes or more of such packaging within a 12-month period are required to register for the tax. These businesses must report all in-scope plastic packaging, even where the material meets or exceeds the recycled content threshold and is therefore not liable for a tax charge. Plastic packaging used for human medicinal products is additionally exempt from PPT. To ensure the costs of complying with the tax were not disproportionate to the environmental harm the tax seeks to address, the de minimis threshold was set so that only businesses that manufacture or import 10 or more tonnes of plastic packaging within a 12-month period are liable to register for the tax.
The PPT is structured around 2 primary design features: a tax rate and a recycled content threshold. The tax is charged at a flat rate per tonne of chargeable plastic packaging, with the rate set at £200 per tonne in the first year of the tax, which has been uprated with the Consumer Price Index (CPI) to £228.82 per tonne from 1 April 2026. The recycled content threshold determines whether packaging is liable for the tax. Plastic packaging components containing less than 30% recycled plastic are subject to the tax, while those meeting or exceeding this threshold are not. Together, these 2 elements form the core incentive mechanism of the tax. The threshold sets the minimum level of recycled content required to avoid liability, while the rate determines the financial incentive for businesses to meet or exceed this level.
HMRC publishes Official Statistics on the PPT, which provide further context on the scale and operation of the tax, including information on revenue, the number of registered businesses, and the total tonnage of plastic packaging declared. PPT revenue accrued by HMRC totalled £250 million in financial year 2025 to 2026.
Figure 2.1: PPT accrued revenue, between financial years 2022 to 2023 and 2025 to 2026.
Source: HMRC.
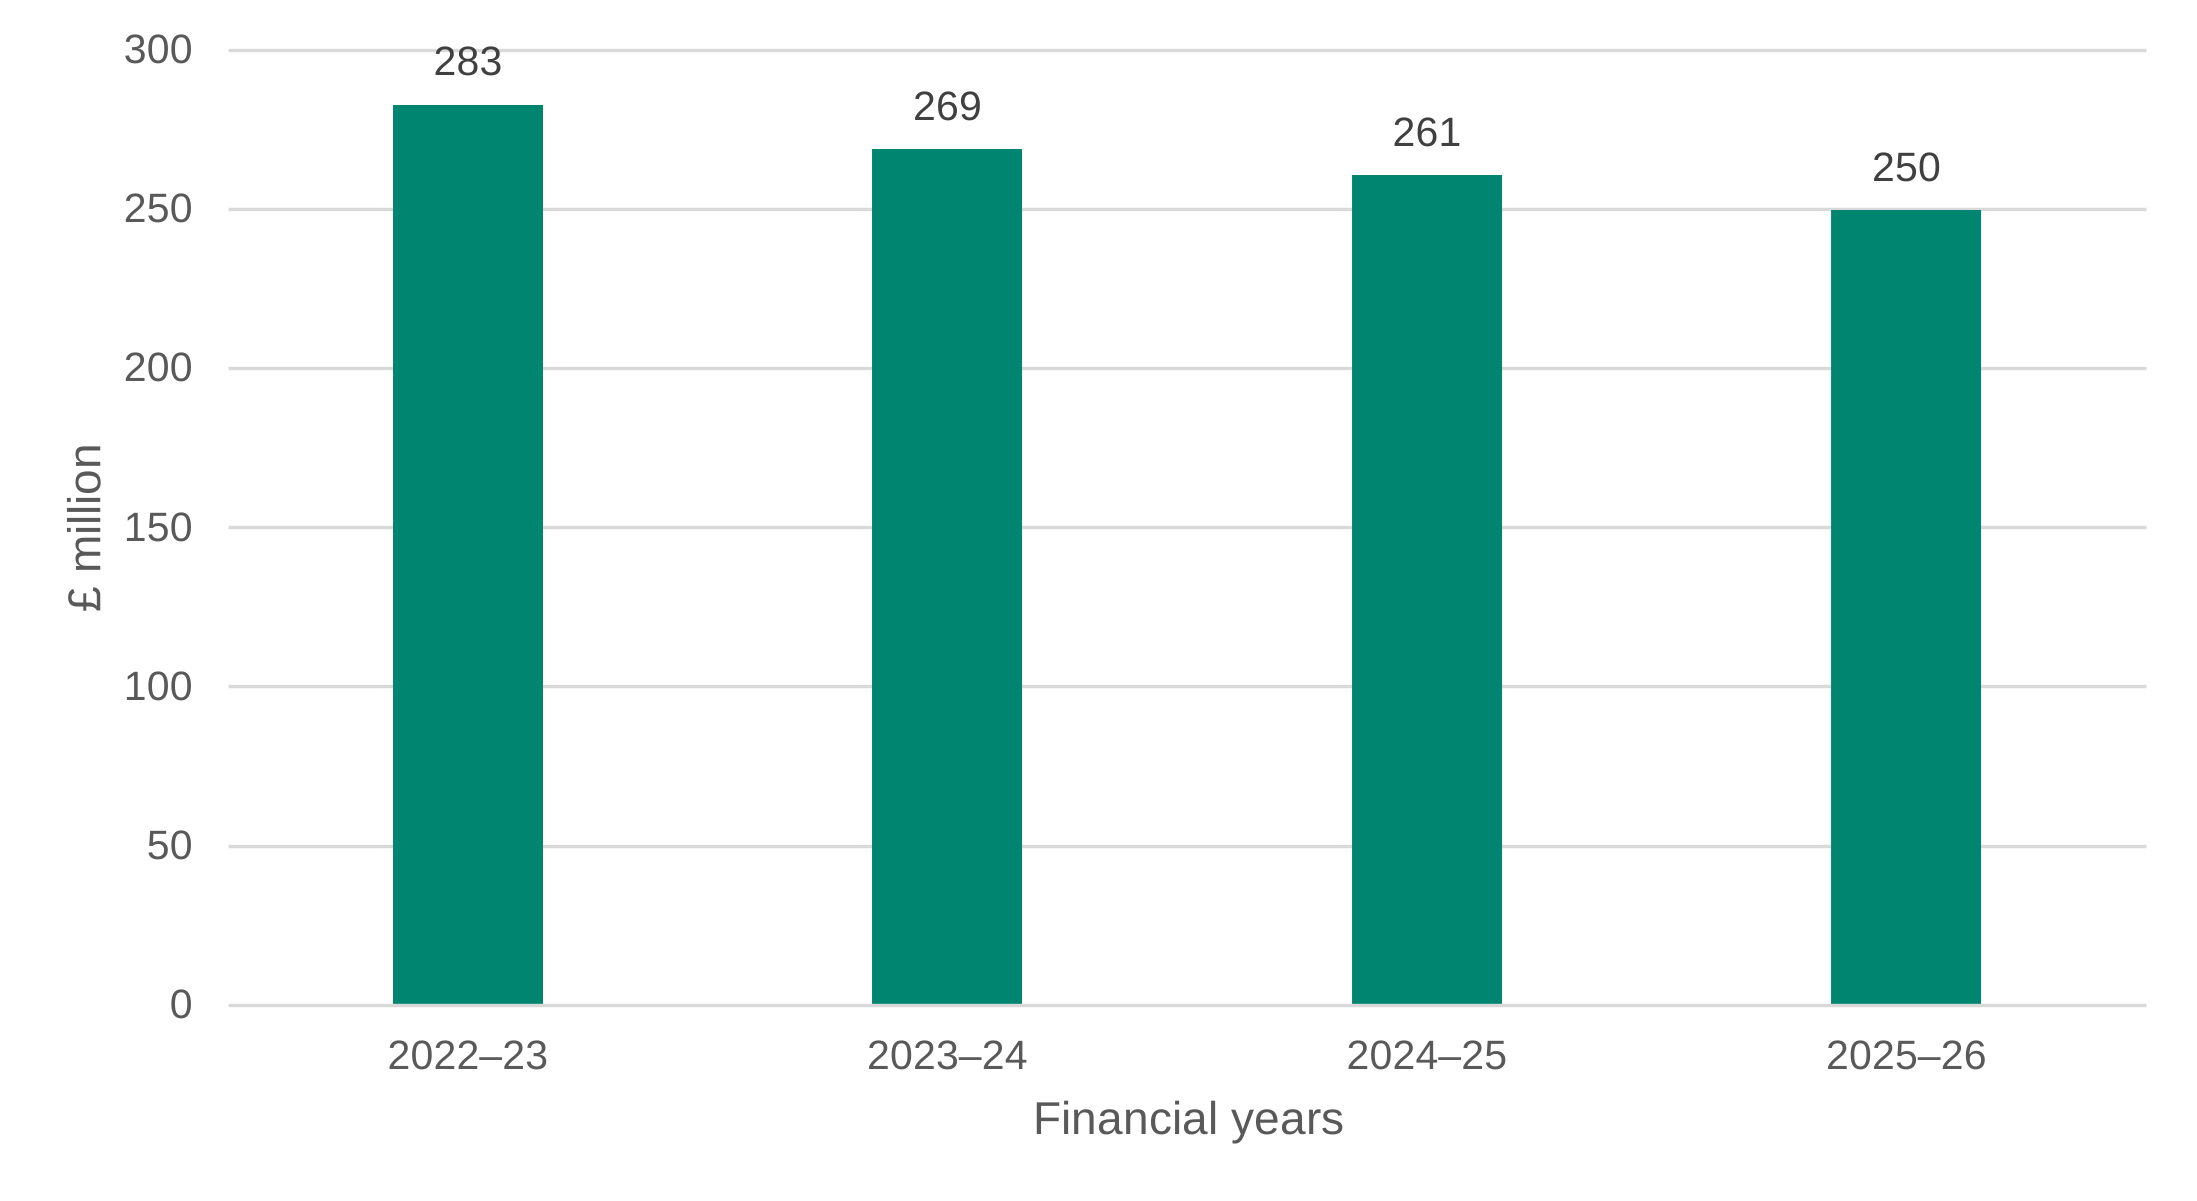
Data for Figure 2.1: PPT accrued revenue, between financial years 2022 to 2023 and 2025 to 2026.
| Financial years | PPT revenue (£ million) |
|---|---|
| 2022–23 | £283 |
| 2023–24 | £269 |
| 2024–25 | £261 |
| 2025–26 | £250 |
While tax revenues have declined over time, this is not necessarily inconsistent with the objectives of the tax. As an environmental tax, lower revenues may reflect businesses increasing the recycled content of their packaging, meaning a greater proportion of plastic packaging meets or exceeds the 30% recycled content threshold, thereby reducing tax liability. This evaluation provides further insight into the factors underlying the decline in tax revenues and the extent to which changes in business behaviour have contributed to this trend.
2.1.2 Background to the tax
The PPT forms part of a broader cross-government approach to reducing plastic waste, including measures set out in the Resources and Waste Strategy for England and the 25 Year Environment Plan. Within the wider policy context, the tax was intended to support the transition towards more resource-efficient and sustainable packaging systems.
The policy rationale that ultimately led to the PPT centred on addressing market failures in the production and use of plastic packaging, primarily single-use plastic waste. A market failure is a situation where the free market, left to its own devices, is unable to achieve an economically efficient allocation of resources. The 2018 Call for Evidence found strong support for using economic instruments, in particular through taxation, to reduce plastic waste and encourage greater use of recycled materials. This report identified concerns that the environmental costs associated with plastic production and disposal were not fully reflected in market prices, while demand for recycled plastic remained relatively weak. PPT was therefore developed to create a stronger economic incentive for businesses to use recycled plastic, increase demand for recycled material, stimulate investment in recycling infrastructure, encourage more sustainable packaging design, and support the transition towards a more circular economy.
The design of the tax was therefore intended to alter the relative costs of using virgin and recycled plastic, encouraging businesses to meet or exceed the 30% recycled content threshold. However, the strength of this incentive is influenced by wider market conditions. In particular, virgin plastic is manufactured from fossil fuel feedstocks and its price is closely linked to global oil prices. As shown in Figure 2.2, fluctuations in crude oil prices can affect the price of virgin plastic, potentially influencing the relative cost advantage of using recycled material, and therefore the strength of the incentive created by PPT.
Figure 2.2: Indexed global oil and plastic prices from January 2023 to April 2026.
Index: January 2023 = 100. Source: Statista, World Bank.
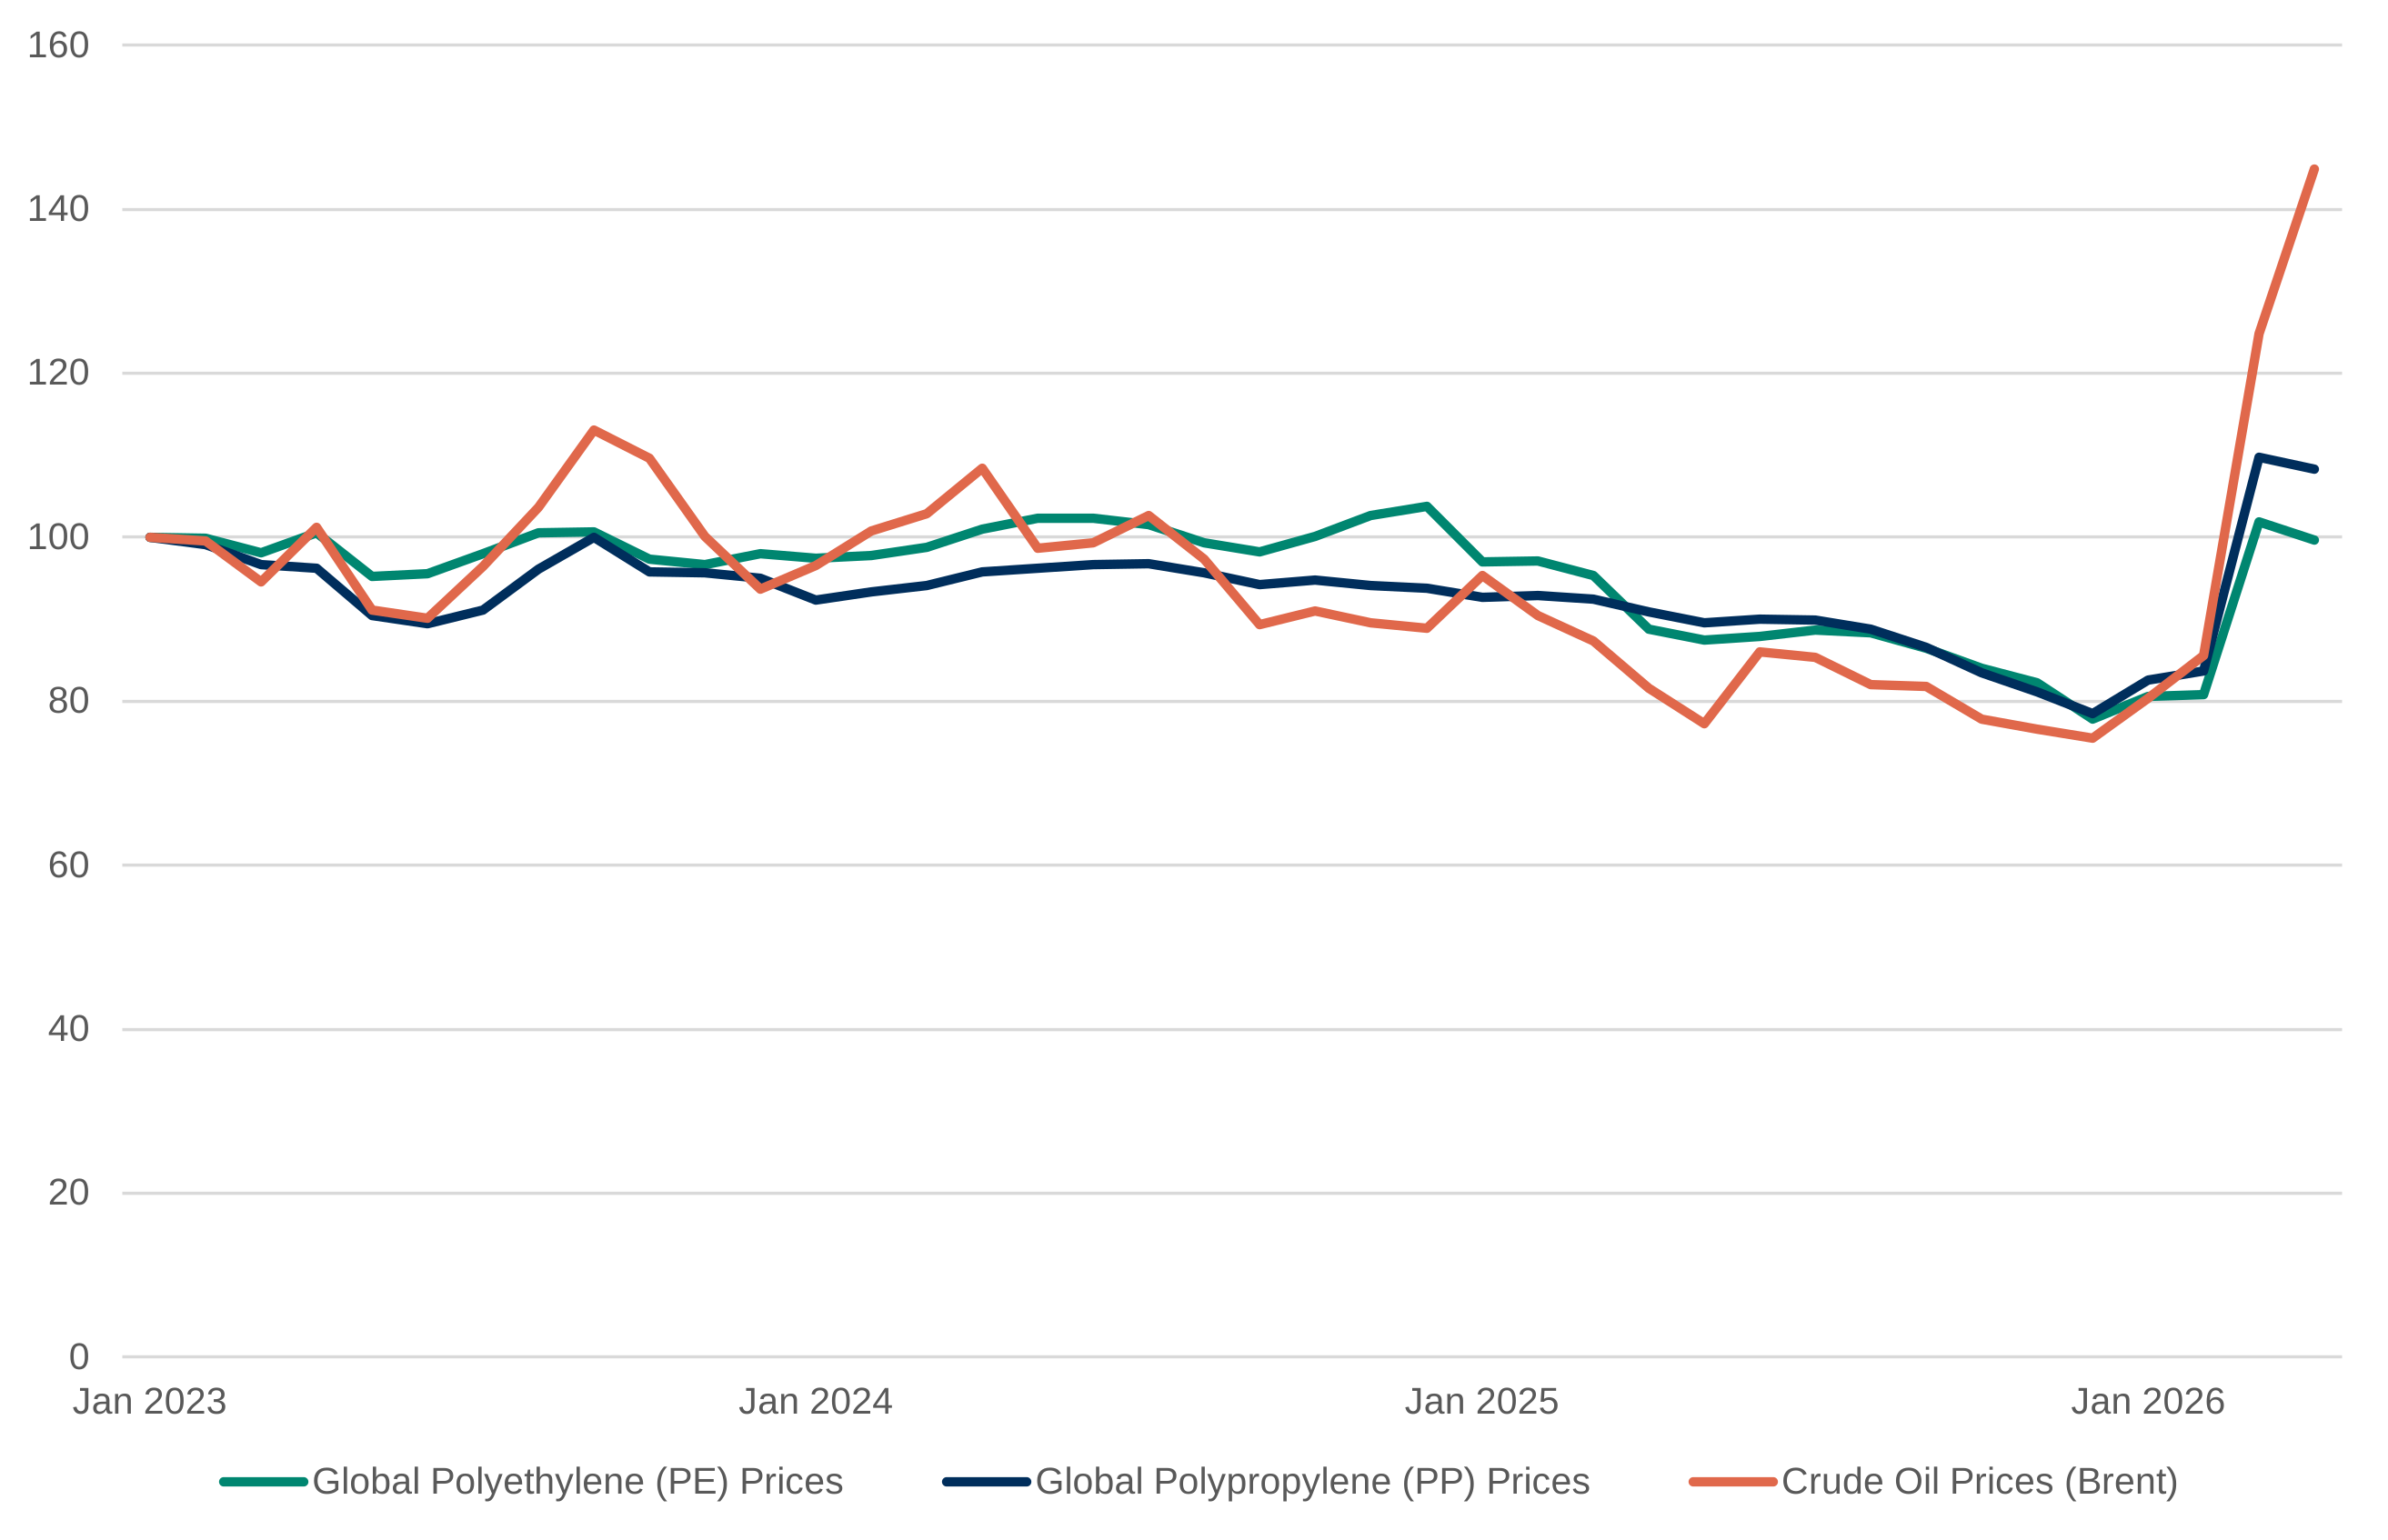
Consequently, while the PPT was designed to provide a consistent economic incentive to use recycled content by increasing the relative cost of using virgin plastic, the extent to which that incentive influences business decisions may vary over time with movements in underlying market prices. While wider market factors may have influenced business responses to the tax, isolating the contribution of these factors is not possible using the available evidence and is therefore outside the scope of this evaluation.
The design of PPT assumes that, if the tax rate provides a sufficient financial incentive, businesses will respond by increasing the recycled content of their packaging where it is feasible and cost-effective to do so, thereby reducing their reliance on virgin plastic. The extent to which these behavioural responses have occurred is assessed in the subsequent chapters of this report.
2.2 Economic overview
2.2.1 Economic rationale
The PPT is an environmental tax intended to correct for the environmental harms associated with the production, use and disposal of single-use plastic packaging. Unlike regulatory approaches such as bans or standards, it preserves consumer and producer choice while shifting incentives through prices. By increasing the cost of plastic packaging that does not meet the recycled content threshold, the tax aims to influence businesses’ production decisions, encouraging substitution away from virgin plastic and towards recycled material. In this context, the primary behavioural response targeted by the tax is at the level of businesses rather than consumers: firms are incentivised to redesign packaging, adjust material inputs, and invest in recycled supply chains to reduce or avoid liability. While some costs may be passed through supply chains and reflected in consumer prices, the policy does not directly target consumer behaviour.
Economically, the effectiveness of the tax depends on a number of factors, including the availability and relative cost of recycled materials, the extent to which recycled substitutes can be adopted within existing production processes, and the degree of pass-through along supply chains. Where recycled materials are readily available and cost-competitive, a tax of this form can create a strong incentive for substitution. Conversely, where technological or supply constraints limit firms’ ability to adjust, behavioural responses may be more limited. More generally, taxes can improve economic efficiency by internalising external costs while allowing firms flexibility in how they respond. This enables abatement and behavioural change to occur where it is least costly, helping to achieve environmental objectives at lower overall cost to the economy.
Plastic packaging is used across a wide range of products and sectors, and the cost of packaging typically represents only a small proportion of the final retail price. As a result, the amount of PPT embedded in individual products is generally very small. Any pass-through of the tax is therefore likely to result in only a very small change in consumer-facing prices, making it difficult to identify and attribute changes in purchasing behaviour directly to the tax. Assessing changes in consumer behaviour is therefore outside the scope of this evaluation, which focuses primarily on business-level packaging and material choices.
By applying a tax to plastic packaging containing less than 30% recycled content, the policy aims to encourage businesses to meet this threshold, thereby increasing demand for recycled plastic and supporting higher levels of plastic waste collection and recycling. Packaging containing less than 30% recycled plastic is liable for the tax, whereas packaging that meets or exceeds the threshold is not. As a result, the policy creates an incentive for businesses to increase recycled content up to the threshold but provides no direct incentive for further increases beyond 30% recycled content. This design may encourage businesses to target compliance with the threshold rather than maximise recycled content beyond it.
Over the evaluation period, the tax liability associated with a packaging component depends on its recycled content, which is not directly observable in the final product and must instead be evidenced through supply chain documentation. This reliance on reported information introduces potential information asymmetries and verification challenges, particularly for imported packaging, and may affect both compliance and the effectiveness of the tax incentive.
These design features imply that the PPT is best understood as a pragmatic, incentive-based policy instrument. Its effectiveness depends on how businesses respond to the threshold-based price signal created by the tax, whereby packaging containing less than 30% recycled plastic is subject to the tax while packaging meeting or exceeding the threshold is not. The effectiveness of the tax also depends on the extent to which costs are transmitted through supply chains and the availability of viable substitutes to virgin plastic. These factors are central to the evaluation of its impacts in subsequent chapters.
2.2.2 Tax incidence
The statutory incidence of PPT falls on businesses that manufacture or import finished plastic packaging, as these are the entities legally responsible for paying the tax to HMRC. However, as with most taxes, the economic incidence — that is, who ultimately bears the cost of the tax — depends on how markets adjust and the extent to which tax is passed through supply chains.
In practice, domestic manufacturers may pass some or all of the cost of the tax onto the businesses that purchase packaging from them, who may in turn pass these costs further along the supply chain to retailers and, ultimately, consumers in the form of higher prices. For imported packaging, the point of taxation occurs at a further stage in the supply chain, and the cost may be passed through more directly to downstream businesses and final consumers.
However, while some degree of pass-through to consumer prices is expected, the primary objective of PPT is to influence business behaviour rather than consumer behaviour. In particular, the tax is designed to affect firms’ demand for inputs — specifically, their choice between virgin and recycled plastic inputs — by altering the relative cost of these materials. Throughout this evaluation, references to changes in demand relate to businesses’ demand for different packaging materials, rather than consumer demand for final goods.
The extent of PPT cost pass-through, and therefore the distribution of the economic burden between firms and consumers, is likely to depend on factors such as market structure, contractual arrangements, and the availability of substitutes. This also has implications for where behavioural responses occur within the supply chain and how strongly businesses respond to the tax.
2.3 Evaluation scope
This evaluation is guided by the HMRC Evaluation Framework and is justified on 3 grounds:
-
it addresses a knowledge gap by enhancing data on PPT beyond administrative returns
-
it assesses the effectiveness of the PPT, a novel and untested policy within the UK; and
-
it supports the continuous improvement of the tax through evidence-based insights that inform future policy development
In April 2023, the government announced that it will evaluate PPT to assess the impacts, customer experience and interaction with wider government policy. The overarching aim of the PPT Evaluation is to assess performance against the stated policy objectives, interactions with wider government policies, unintended consequences (both positive and negative), and impacts on businesses.
The evaluation has been led by HMRC in partnership with HM Treasury. Insights have also been drawn from other government departments given the crosscutting nature of the policy.
The evaluation has considered best practice guidance — including approaches and models outlined in the Magenta Book on designing an evaluation and economic principles in the Green Book on appraisal and evaluation in central government. It also takes into consideration the Ipsos/UCL Environmental Impacts of Tax study produced for HMRC. The evaluation comprises both quantitative and qualitative analysis.
The scoping stage — including development of a Theory of Change in line with the Magenta Book — highlighted several impacts that would be desirable as part of the evaluation. Due to data and information limitations, the evaluation has been refined to focus primarily on the impact the PPT has on the behaviour of businesses and on the environment. The scope of the evaluation focuses on the following theorised impacts:
-
a reduction in plastic waste — resulting from higher rates of collection, recycling and diversion of plastic waste from landfill or incineration
-
a reduction in the overall use of plastic packaging — originating from the price signal on virgin plastic encouraging a reduction in demand for plastic packaging. A price signal on virgin plastic may also encourage switching to other materials for packaging
-
an increase in the use of recycled plastic — the price signal placed on virgin plastic is intended to increase the price competitiveness of recycled plastic (which has typically been more expensive). In turn, an increase in the demand for recycled plastic may therefore lead to an increase in the rate at which plastic is being recycled to match the increased demand
-
an increase in the proportion of recycled plastic in plastic packaging — where plastic packaging continues to be used, the tax aims to increase the proportion of recycled plastic contained within that packaging
2.4 Evaluation objectives and evaluation questions
The scoping stage of the evaluation identified 3 core Critical Success Factors (CSF) of the PPT’s impact that would amount to the policy intervention having its desired impact:
CSF1:
There has been an increase in the proportion of recycled plastic used in plastic packaging attributable to the tax.
CSF2:
There has been a reduction in the amount of virgin plastic (or all plastic) used in packaging attributable to the tax.
CSF3
There has been a positive impact on the environment attributable to the tax (consistent with the wider government’s aims to reduce the environmental impacts associated with plastic packaging).
The following Evaluation Questions (EQs) have been designed so that the answers to these questions determine whether a CSF has been met:
EQ1:
How has the amount of plastic packaging containing at least 30% recycled plastic (domestic or imported) changed over time?
EQ2:
To what extent have businesses changed the proportion of plastic (both virgin and recycled) in their packaging?
EQ3:
To what extent has PPT influenced businesses’ wider packaging choices (for example, design, materials used)?
EQ4:
To what extent have packaging materials changed due to substitution, reduction, or removal of plastic as a material?
EQ5:
Has PPT stimulated demand for recycled plastic and increased recycling rates?
EQ6:
Has PPT reduced plastic waste?
EQ7:
Has PPT had a positive impact on the environment?
Chapter 3 covers the methodological approach and data sources used for the evaluation. The later chapters will focus on the findings related to the evaluation questions outlined.
Chapter 3: Methodology and data overview
This chapter provides an overview of the methodological approach and the data sources underpinning the PPT evaluation.
3.1 Evaluation approach
3.1.1 Limitations
A key challenge for the evaluation of PPT is the absence of suitable pre-intervention data for many outcomes of interest. While counterfactual assumptions can be developed for specific components of the analysis, such as the emissions modelling, the available data does not support the application of robust econometric approaches across the evaluation as a whole. Systematic data on recycled content and plastic packaging behaviour were not collected prior to implementation of the tax in the UK. Moreover, the introduction of the tax was not accompanied by pre-policy data, meaning that there is no comprehensive baseline dataset capturing plastic packaging usage prior to the implementation of the tax. As a result, the evaluation cannot readily apply impact evaluation approaches that rely on pre- and post-intervention comparisons over time, such as those recommended in the Environmental Impacts of Taxes study commissioned by HMRC.
In addition, the PPT applies broadly and uniformly across the UK to all businesses above the registration threshold, limiting the ability to identify a suitable control group. There is no clear untreated population of comparable firms against which the effects of the tax can be isolated, and data on businesses below the de minimis threshold is not systematically collected. This restricts the applicability of quasi-experimental methods, as businesses below the threshold are both difficult to identify and are unlikely to be directly comparable to those within scope of the tax.
More generally, there is no credible source of exogenous variation in exposure to the tax. In other words, no factor external to businesses’ own decisions was identified that would allow the effects of PPT to be distinguished from the influence of broader economic and market conditions. Consequently, the available evidence does not support the application of econometric methods capable of robustly identifying the causal impact of the tax. The tax is determined by policy design rather than by factors plausibly unrelated to the outcomes of interest and therefore does not generate the kind of variation required to support causal identification.
These limitations mean that the evaluation cannot construct a fully credible counterfactual representing what would have happened in the absence of the tax without making assumptions. Consequently, the evaluation primarily relies on a combination of descriptive evidence, comparative analysis across business groups and packaging types (plastic and non-plastic), and corroboration with survey and qualitative data to build an understanding of how the tax has influenced behaviour. This approach allows for a robust assessment of trends and patterns, but results should be interpreted with appropriate caution regarding causal attribution.
3.1.2 Evaluation approach overview
Given the limitations outlined in Section 3.1.1 the evaluation adopts a theory-based approach, drawing on a combination of administrative data, data provided by external organisations (including the Waste and Resources Action Programme (WRAP)), and qualitative and quantitative social research commissioned by HMRC and conducted by Ipsos.
The evaluation assesses whether the behavioural responses expected under the theory of change are being observed in practice. Rather than seeking to estimate a single causal effect of the tax, the evaluation brings together evidence from multiple sources to examine how businesses have responded to PPT and whether these responses are consistent with the policy’s objectives.
The evaluation is structured around a series of research questions outlined in Section 2.4; these cover registration and tax liability, business understanding and responses to the tax, changes in packaging design and material choices, use of recycled plastic, environmental impacts, and wider effects on businesses.
This chapter provides an overview of the methodologies and data used within each chapter.
3.2 Analytical approaches by chapter
This section summarises the methodologies or analytical approaches used in Chapters 4 to 7, which present the main findings of the evaluation. Where appropriate, statistical testing was used to assess whether observed differences between groups were unlikely to have arisen through sampling variation alone. The tests used vary by chapter and are described in Annex B: Technical Methodologies and Annex C: Supporting Analysis for Chapter 5.
3.2.1 Analytical approach for Chapter 4
Chapter 4 uses HMRC administrative data and qualitative and quantitative social research to examine changes in the use of recycled and virgin plastic packaging since the introduction of PPT. The chapter combines statistical analysis of PPT returns data with evidence from businesses on whether, how and why they report changing their behaviour in response to the tax.
The administrative data is used to outline changes over time in reported plastic packaging volumes and in the proportion of packaging meeting the 30% recycled-content threshold. Trends are examined from the introduction of the tax in 2022, using financial years rather than calendar years to remain consistent with how the tax is administered. Where possible, statistical tests have been used to assess whether observed changes over time or differences between groups were statistically significant in order to identify potential behavioural responses consistent with the introduction of the tax. Overviews of these tests are found in Section B.1 of Annex B.
However, as PPT administrative data is only available from the point at which the tax was introduced, the analysis using administrative data cannot fully attribute observed changes to the tax alone. Other factors may also have influenced business behaviour over the same period.
To address this limitation, the commissioned qualitative and quantitative social research explores whether, how and why businesses report changing their behaviour following the introduction of PPT. This research was designed to test the mechanisms through which the tax was expected to operate, by asking businesses about their decision making, motivations and responses. It therefore provides important evidence on whether observed changes are consistent with the tax influencing behaviour, in the absence of a longer pre-policy time series.
Together, the social research and administrative analysis provide complementary evidence. The results in this chapter should therefore not be interpreted as definitive causal estimates of the impact of PPT. Instead, they should be viewed as evidence on how reported plastic packaging volumes and recycled content have changed since the introduction of the tax, and whether these patterns are consistent with the tax’s intended objectives and businesses’ self-reported behavioural responses.
3.2.2 Analytical approach for Chapter 5
Chapter 5 builds on the findings of Chapter 4, exploring variation in the outcomes relevant to EQ1 and EQ2. It breaks the answers and analysis down into identifiable business characteristics, focusing on whether particular business characteristics are associated with particular behavioural changes. Annex C.
The analysis in this section combines administrative data, qualitative and quantitative social research and external data provided by WRAP on UK Plastics Pact (UKPP) members. Each source provides different insights into the characteristics of businesses and the packaging they place on the market. These datasets allow the tax base to be segmented according to a range of observable characteristics that are meaningfully different and enable comparison of outcomes between these groups.
Administrative data from PPT returns are used where characteristics can be directly identified from information collected through the tax system. This includes distinctions between businesses that manufacture plastic packaging, import plastic packaging, or undertake both activities. The returns data also allow businesses to be grouped according to measures of scale, such as packaging handled and tax liability. For these groups, analysis focuses primarily on differences in the proportion of plastic packaging meeting the 30% recycled-content threshold and how these measures have changed over time.
The quantitative social research provides a broader set of business characteristics that are not available in administrative data. Survey responses are used to segment businesses by factors such as plastic types used, packaging product types, economic sector and business size. The survey also provides evidence on self-reported changes in recycled-content use, changes in overall plastic packaging tonnage, and barriers to further increases in recycled content. This enables analysis of both behavioural outcomes and the constraints businesses perceive when responding to PPT.
Additional information supplied by WRAP on members of the UKPP provides complementary evidence that is not observable through PPT returns alone. This data contains information on packaging placed on the market and recycled content by material and packaging type. The WRAP data also enables identification of a subset of PPT-liable businesses in the administrative data that have made voluntary commitments relating to packaging sustainability. This allows the analysis to explore whether outcomes differ between businesses with pre-existing sustainability commitments and those without, while recognising that any observed differences are descriptive and cannot be interpreted as the causal impact of either UKPP membership or PPT.
Across all segmentation exercises, the analysis is primarily descriptive in nature. The objective is not to estimate separate causal effects of PPT for different groups, but to assess whether meaningful variation exists in observed outcomes and to identify potential explanations for these differences. Where appropriate, statistical testing is used to assess whether observed differences between groups are unlikely to have arisen through sampling variation alone. Findings are interpreted alongside evidence on reported business constraints and wider contextual factors to understand how structural, technical and commercial conditions shape the ability of businesses to respond to the incentive created by PPT.
This approach provides a more detailed understanding of how the core behavioural responses to the tax vary across the tax base, helping to identify where changes appear most pronounced, where constraints may limit responsiveness, and the extent to which observed outcomes are associated with broader business characteristics rather than the tax alone.
3.2.3 Analytical approach for Chapter 6
This chapter primarily draws on the quantitative social research, supplemented by findings from the qualitative research. Evidence from these sources is compared with data from the National Packaging Waste Database (NPWD), WRAP, and administrative data from PPT returns. This approach allows findings to be identified directly from businesses within the tax base and then considered alongside wider industry and administrative evidence.
The quantitative research examines the extent to which businesses passed PPT costs on to their customers. Pass-through is an important consideration when interpreting the behavioural effects of the tax. Where businesses absorb the cost of PPT, they may face greater incentives to reduce their tax liability through actions such as increasing recycled content. Conversely, where costs are passed on through higher prices, the direct financial impact on businesses may be reduced. Understanding the degree of pass-through therefore provides important context for assessing how PPT may have influenced business behaviour.
The quantitative social research also explores whether businesses reported that PPT influenced their packaging strategy, the extent of that influence, and how responses varied across different types of business. It also examines other factors shaping packaging decisions, such as material costs and availability. In addition, the research considers wider responses to the tax, including packaging changes, operational adjustments, and investment activity.
The qualitative social research is used throughout the chapter to provide context and explanation for the quantitative findings. It offers additional insight into the factors influencing packaging strategies and the range of business responses to the tax beyond changes in recycled content and plastic use, which are discussed in Chapters 4 and 5.
The NPWD provides evidence on broader packaging trends across the UK market. It is a statutory reporting system for businesses obligated under the Producer Responsibility Regulations, covering approximately 7,000 producers. The scope of NPWD differs from PPT, as reporting obligations are based on business turnover and packaging handled rather than the PPT registration criteria. While this limits direct comparability, the dataset provides valuable evidence on trends in plastic and non-plastic packaging alongside the introduction of PPT.
NPWD data is used to examine changes in packaging materials over time, including trends in the market share of plastic packaging relative to alternative materials. To improve comparability with PPT, transport packaging is excluded where possible. The analysis focuses on market shares and annual changes in packaging volumes, allowing observed trends to be compared with findings from the social research.
The chapter also draws on data published by WRAP through the UKPP. Unlike NPWD, this dataset relates only to UKPP members and therefore represents a subset of the wider market rather than all plastic packaging placed on the UK market. Membership of the UKPP is voluntary and has typically ranged between around 50 and 80 organisations during the evaluation period.
Although more limited in coverage, WRAP data provides detailed information on the composition of plastic packaging and allows longer-term trends to be examined, including the period before PPT was introduced. As such, it provides complementary evidence that can be used to assess whether patterns observed in the social research and NPWD data are consistent with broader developments in the sector.
While the social research provides evidence on whether businesses perceived PPT to have influenced their decisions, the tax should not be considered in isolation. Changes in packaging choices may also reflect wider sustainability commitments, regulatory developments, material costs, supply constraints, and consumer demand. Consequently, findings presented in this chapter are primarily descriptive and should not be interpreted as definitive evidence of causality.
3.2.4 Analytical approach for Chapter 7
This chapter uses a combination of national-level waste statistics, local authority data, WRAP data and an internally produced emissions model to examine how plastic waste, recycling rates and environmental outcomes have changed over time. The analysis primarily draws on Department for Environment, Food and Rural Affairs (Defra) packaging waste statistics and WasteDataFlow data to assess trends in plastic waste arising and recycling across the UK and England, alongside supplementary evidence from WRAP data shared with HMRC.
The analysis focuses on describing changes over time in the volume of plastic packaging waste arising, the amount of plastic sent for recycling, and the proportion of plastic waste that is recycled. Where possible, trends are examined across the years prior to the introduction of PPT in 2022, to provide context on underlying patterns and to assess whether any observable changes coincide with the introduction of the tax. Due to data availability, the analysis is conducted using calendar years for national statistics and financial years for local authority data.
To assess whether increases in recycled content reported by businesses are reflected in the wider recycling system, the chapter compares trends in national recycling rates with changes in the volume of plastic waste collected by local authorities. However, variation in data coverage, alongside differences in how datasets capture waste flows, means that findings across sources should be interpreted with caution. A limitation of this analysis is that the WasteDataFlow data used to examine local authority recycling collections is only available for England, whereas PPT applies across the whole of the UK. Findings based on local authority recycling collections should therefore be interpreted as evidence for England and may not fully reflect recycling activity in Scotland, Wales or Northern Ireland.
The analysis also considers changes in plastic waste relative to other packaging materials and whether these trends are consistent with findings from Chapters 4 and 6 on changes in the amount of plastic packaging used and businesses’ packaging design and material choices. Supplementary evidence from WRAP data is used, where available, to provide additional context on the types of plastic packaging placed on the market and the use of recycled content.
In addition to examining packaging waste tonnages, the analysis considers the share of total packaging waste arising accounted for by plastic packaging. This provides an additional measure of whether plastic packaging has become a smaller component of the wider packaging system over time.
An internal HMRC emissions model is used to estimate the impact of PPT on greenhouse gas emissions associated with plastic packaging. The model compares estimated emissions with PPT in place against a counterfactual scenario without PPT. The counterfactual uses assumptions from the Office for Budget Responsibility (OBR) PPT revenue forecast on how recycled content and plastic packaging volumes would have changed in the absence of the tax. The model combines these assumptions with HMRC PPT returns data and UK government greenhouse gas conversion factors for virgin and recycled plastic. The difference between the estimates with and without PPT provides an estimate of the potential impact of the tax on greenhouse gas emissions. More information on how the model was constructed, including the assumptions used, is provided in Annex B.
3.3 Data sources
This evaluation draws on a combination of HMRC administrative data, data provided by external organisations, social research commissioned by HMRC, and publicly available data. The data sources used within the evaluation are described below.
3.3.1 HMRC administrative data
The evaluation uses PPT returns data collected by HMRC. In producing the evaluation, this data covered the period from the introduction of the tax in April 2022 to the end of the 2025 to 2026 financial year. HMRC also produces a statistical publication which provides an overview of this data.
Businesses submit PPT returns to HMRC on a quarterly basis, covering accounting periods ending in June, September, December and March. PPT applies to businesses that manufacture or import 10 tonnes or more of plastic packaging within a 12‑month period.
The administrative data comprise registration records and information reported through PPT returns. Registration records provide details of businesses registered for PPT, including whether they manufacture plastic packaging, import plastic packaging, or undertake both activities. Across the evaluation period, around 4,500 businesses were registered for PPT in each financial year.
PPT returns record the weight of plastic packaging components manufactured in, or imported into, the UK. They include information on taxable and exempt packaging, packaging containing at least 30% recycled plastic, and resulting tax liabilities. These data are used to examine trends in plastic packaging volumes, the proportion of packaging above and below the recycled content threshold, and differences between groups of businesses.
The administrative data have several limitations. As no PPT data was collected before the tax was introduced, it cannot be used to examine changes in the same businesses prior to April 2022. In addition, returns record only whether packaging is above or below the 30% recycled content threshold, rather than the precise proportion of recycled content. This limits the extent to which changes in recycled content can be measured.
The data also does not capture why businesses changed their packaging or whether changes were made specifically in response to PPT. For this reason, the administrative data is interpreted alongside findings from the social research and other external data sources throughout the evaluation.
3.3.2 Quantitative and qualitative social research
HMRC commissioned Ipsos to undertake qualitative and quantitative research with businesses registered for PPT. The 2 reports, ‘Plastic Packaging Tax: Qualitative Research’ and ‘Plastic Packaging Tax: Quantitative Research’ have been published alongside this evaluation report.
The qualitative research consisted of in-depth interviews with 50 businesses registered for PPT. Fieldwork was conducted between May and July 2025. The quantitative research consisted of a survey of 1,011 businesses registered for PPT. Fieldwork was conducted between January and April 2026. The social research explored business understanding and perception of the tax, reported behavioural responses, barriers to behavioural change, business decision-making, and wider business impacts originating from the tax.
As this data is self-reported rather than directly observed evidence, responses may be affected by recall, interpretation of questions, and businesses’ ability to distinguish the effect of PPT from other factors influencing packaging decisions. To ensure the questions were understood as intended, the survey questionnaire was tested on a smaller number of businesses and questions were amended where needed. Participants were also assured that their responses would be treated confidentially and that individual businesses would not be identifiable to HMRC. This was intended to support businesses’ willingness to share information.
The qualitative research gives more detailed evidence on how and why different PPT-registered businesses responded to the tax, but the findings are not quantifiable, representative or statistically generalisable to the wider tax base.
Percentages shown in the quantitative research are rounded to the nearest whole number. As a result, totals may not sum exactly due to rounding.
3.3.3 Waste and Resources Action Programme (WRAP)
This evaluation uses data provided by WRAP on plastic packaging reported by businesses that are members of the UKPP. The data covers the period 2018 to 2024 and includes information on packaging placed on the market and recycled content, split by plastic type and packaging type. The data is reported in tonnes.
The dataset includes information on primary plastic packaging placed on the market by UKPP members. Primary packaging is packaging used to contain, protect or present the finished product to the end user. The dataset also includes transit packaging, which covers secondary and tertiary packaging used for storage, transport and distribution. The analysis in this evaluation mainly uses the primary packaging data, as this is most consistent with the PPT’s scope.
During the period covered by the analysis, UKPP membership ranged from approximately 50 to 80 members each year. As membership of the UKPP is voluntary, the data relates only to member organisations and does not represent all businesses placing plastic packaging on the UK market. Changes over time may therefore reflect businesses joining or leaving the UKPP, as well as changes in the packaging reported by continuing members.
There are also some limitations when comparing polymer types over time. Some polymer types were reported differently in later years, for example where broader categories were split into more detailed polymer types. Some recycled content categories also combine several polymer types. This means that changes for individual polymer types should be interpreted with some caution.
For these reasons, the WRAP data is used as supplementary evidence alongside HMRC administrative data, social research and other external data sources, rather than as a direct measure of change across the whole PPT tax base.
3.3.4 National Packaging Waste Database (NPWD)
The evaluation uses data from the National Packaging Waste Database (NPWD) to examine wider trends in packaging handled by producers obligated under the Producer Responsibility regulations.
NPWD records information from obligated packaging producers, including manufacturers, converters, importers, pack-fillers and sellers of packaging. Producers are obligated if they have more than £2 million in turnover and handle 50 tonnes or more of packaging in a calendar year. The evaluation uses NPWD data covering the period 2020 to 2024. The data include packaging handled by approximately 7,000 obligated producers and are available by material type, including plastic, paper, glass, wood, steel and aluminium.
NPWD obligations differ from PPT. PPT applies to businesses that manufacture or import 10 tonnes or more of plastic packaging within a 12-month period, whereas NPWD covers obligated packaging producers across all packaging materials. As a result, the businesses covered by NPWD are not the same as those covered by PPT returns, though they may overlap. The NPWD analysis uses total packaging handled, with transport packaging deducted, to better align the data with the PPT tax base. Even with this adjustment, the 2 data sources are not directly comparable because they are collected for different purposes, reported over different time periods, and cover different populations of businesses.
For this reason, NPWD data is used as contextual evidence on wider packaging trends rather than as a direct measure of change in the PPT tax base.
3.3.5 UK statistics on waste
The evaluation uses the UK statistics on waste published by the Department for Environment, Food & Rural Affairs (Defra).
The data provide UK-level annual information on packaging waste arising, packaging waste recovered or recycled, and recycling or recovery rates by material type. The analysis uses data covering the period 2015 to 2024, with material breakdowns including plastic, paper and cardboard, glass, metal, aluminium and steel.
3.3.6 WasteDataFlow
The evaluation uses WasteDataFlow data published by Defra on local authority waste management in England. WasteDataFlow contains information reported by local authorities on waste collection, recycling and disposal.
The analysis uses data covering the period 2019 to 2020 through to 2024 to 2025. The data are reported by financial year and include information on the volume and composition of waste collected by local authorities and sent for recycling. In this evaluation, the data is used to examine trends in plastic waste collected for recycling by local authorities in England, including changes in the types of plastic collected.
WasteDataFlow covers local authority waste collections, which mainly reflect household waste and other waste collected through local authority systems. It does not capture all plastic waste or all recycling activity across the wider UK waste system, such as commercial and industrial waste collected outside local authority routes.
As WasteDataFlow relates to local authority waste collections in England, findings based on this source should be interpreted as evidence for England and may not reflect UK-level trends.
Chapter 4: Change in the use of recycled and virgin plastic packaging
4.1 Introduction
This chapter addresses the evaluation questions:
EQ1:
How has the amount of plastic packaging containing at least 30% recycled plastic (domestic or imported) changed over time?
EQ2:
To what extent have businesses changed the proportion of plastic (both virgin and recycled) in their plastic packaging?
It examines whether the PPT has incentivised changes in the use of plastic packaging at the aggregate level. In particular, it assesses changes over time in the proportion of plastic packaging containing at least 30% recycled plastic, for both domestically produced and imported packaging, and considers the extent to which businesses have adjusted the balance between virgin and recycled plastic in packaging. Chapter 5 addresses heterogeneity in findings.
These findings are based on qualitative and quantitative research commissioned by HMRC and HMRC administrative data.
4.2 Key findings
Key Finding 4.1:
Increases in packaging meeting the 30% recycled content threshold appear to have been driven by threshold-focused responses among a subset of businesses, with limited evidence of widespread behavioural change across the tax base.
Key Finding 4.2:
PPT has led to modest and uneven reductions in overall plastic use. While most businesses report no significant change in the total tonnage of plastic packaging they handle, a minority have reduced usage — typically at a small scale — suggesting the tax influenced behaviour at the margin but has not driven widespread or transformative reductions in plastic volumes.
Key Finding 4.3:
PPT’s effectiveness in increasing recycled content is constrained by supply-side and technical barriers. Despite creating a clear demand-side incentive, the cost of paying the tax may still be the cheaper option. Many firms also face limited availability, quality concerns, and cost pressures around recycled materials, meaning behavioural responses have often occurred through alternative channels (for example, reducing packaging or switching materials) rather than increasing recycled content, with overall responsiveness varying significantly across businesses.
Key Finding 4.4:
PPT returns were intentionally designed to collect the information needed to administer the tax while reducing reporting burdens on businesses. Consequently, administrative data captures whether packaging is above or below the 30% recycled content threshold, but not the precise proportion of recycled content. This limits the ability to monitor changes in recycled content, assess the scale and distribution of behavioural responses, and robustly evaluate the tax’s impact.
4.3 Analytical approach
Using HMRC administrative data, this chapter examines how reported plastic packaging volumes have changed across businesses since the introduction of the tax. Naturally, no administrative data had been collected before the PPT’s introduction. The analysis focuses on describing changes over time in reported plastic packaging volumes and in the proportion of packaging meeting the 30% recycled content threshold. Trends are examined from the introduction of the tax in 2022, using financial years rather than calendar years.
Where possible, statistical tests have been used to assess whether observed changes over time or differences between groups were statistically significant in order to identify potential behavioural responses consistent with the introduction of the tax. However, as PPT administrative data is only available from the point of implementation, the analysis using administrative data cannot fully attribute observed changes to the tax alone, as other contemporaneous factors may also be influencing business behaviour.
To address this limitation, the commissioned qualitative and quantitative social research explores whether, how, and why businesses report changing their behaviour following the introduction of PPT. This research was designed to directly test the mechanisms through which the tax was expected to operate, by asking businesses about their decision‑making, motivations, and responses, and therefore provides the best available evidence to assess causation in the absence of a longer pre‑policy time series.
As the social research is intended to identify whether a subset of businesses self-report behavioural changes due to the tax, we can determine whether these reported changes are also observable in other data sources, particularly the administrative data. Together, the social research and administrative analysis provide complementary perspectives.
The results in this chapter should therefore not be interpreted as definitive causal estimates of the impact of PPT. Instead, they should be viewed as a structured collection of evidence on how reported plastic packaging volumes and recycled content have evolved since the introduction of the tax, and whether observed patterns are consistent with the tax’s intended objectives.
4.4 Supporting evidence
4.4.1 Plastic packaging relative to the 30% recycled content threshold
The PPT returns submitted by businesses were designed to minimise the administrative burden on businesses. As a result, the administrative data collected by HMRC does not capture the actual amount of recycled plastic used within plastic packaging. Instead, businesses record whether their packaging falls above or below the 30% recycled content threshold, which is the basis for determining their tax liability.
The administrative data shown in Figure 4.1 indicates there has been an increase in the amount of plastic packaging containing 30% or more recycled plastic up to financial year 2025 to 2026 since the introduction of the tax in April 2022. In the 2022 to 2023 financial year, approximately 1.3 million tonnes of plastic packaging contained 30% or more recycled plastic, rising to 1.5 million tonnes in 2025 to 2026 — an increase of 16.7%. Moreover, the proportion of overall plastic packaging that is meeting the 30% recycled content threshold has increased from 38% in financial year 2022 to 2023 to 51% in 2025 to 2026. While the administrative data shows a positive trend in packaging meeting the recycled content threshold, it is naturally not sufficient on its own to demonstrate a causal relationship between the PPT and increased use of recycled plastic in packaging.
Figure 4.1: Plastic packaging above the 30% recycled content threshold, packaging otherwise relieved from PPT, and packaging taxable as it falls below the 30% recycled content threshold.
Source: HMRC.
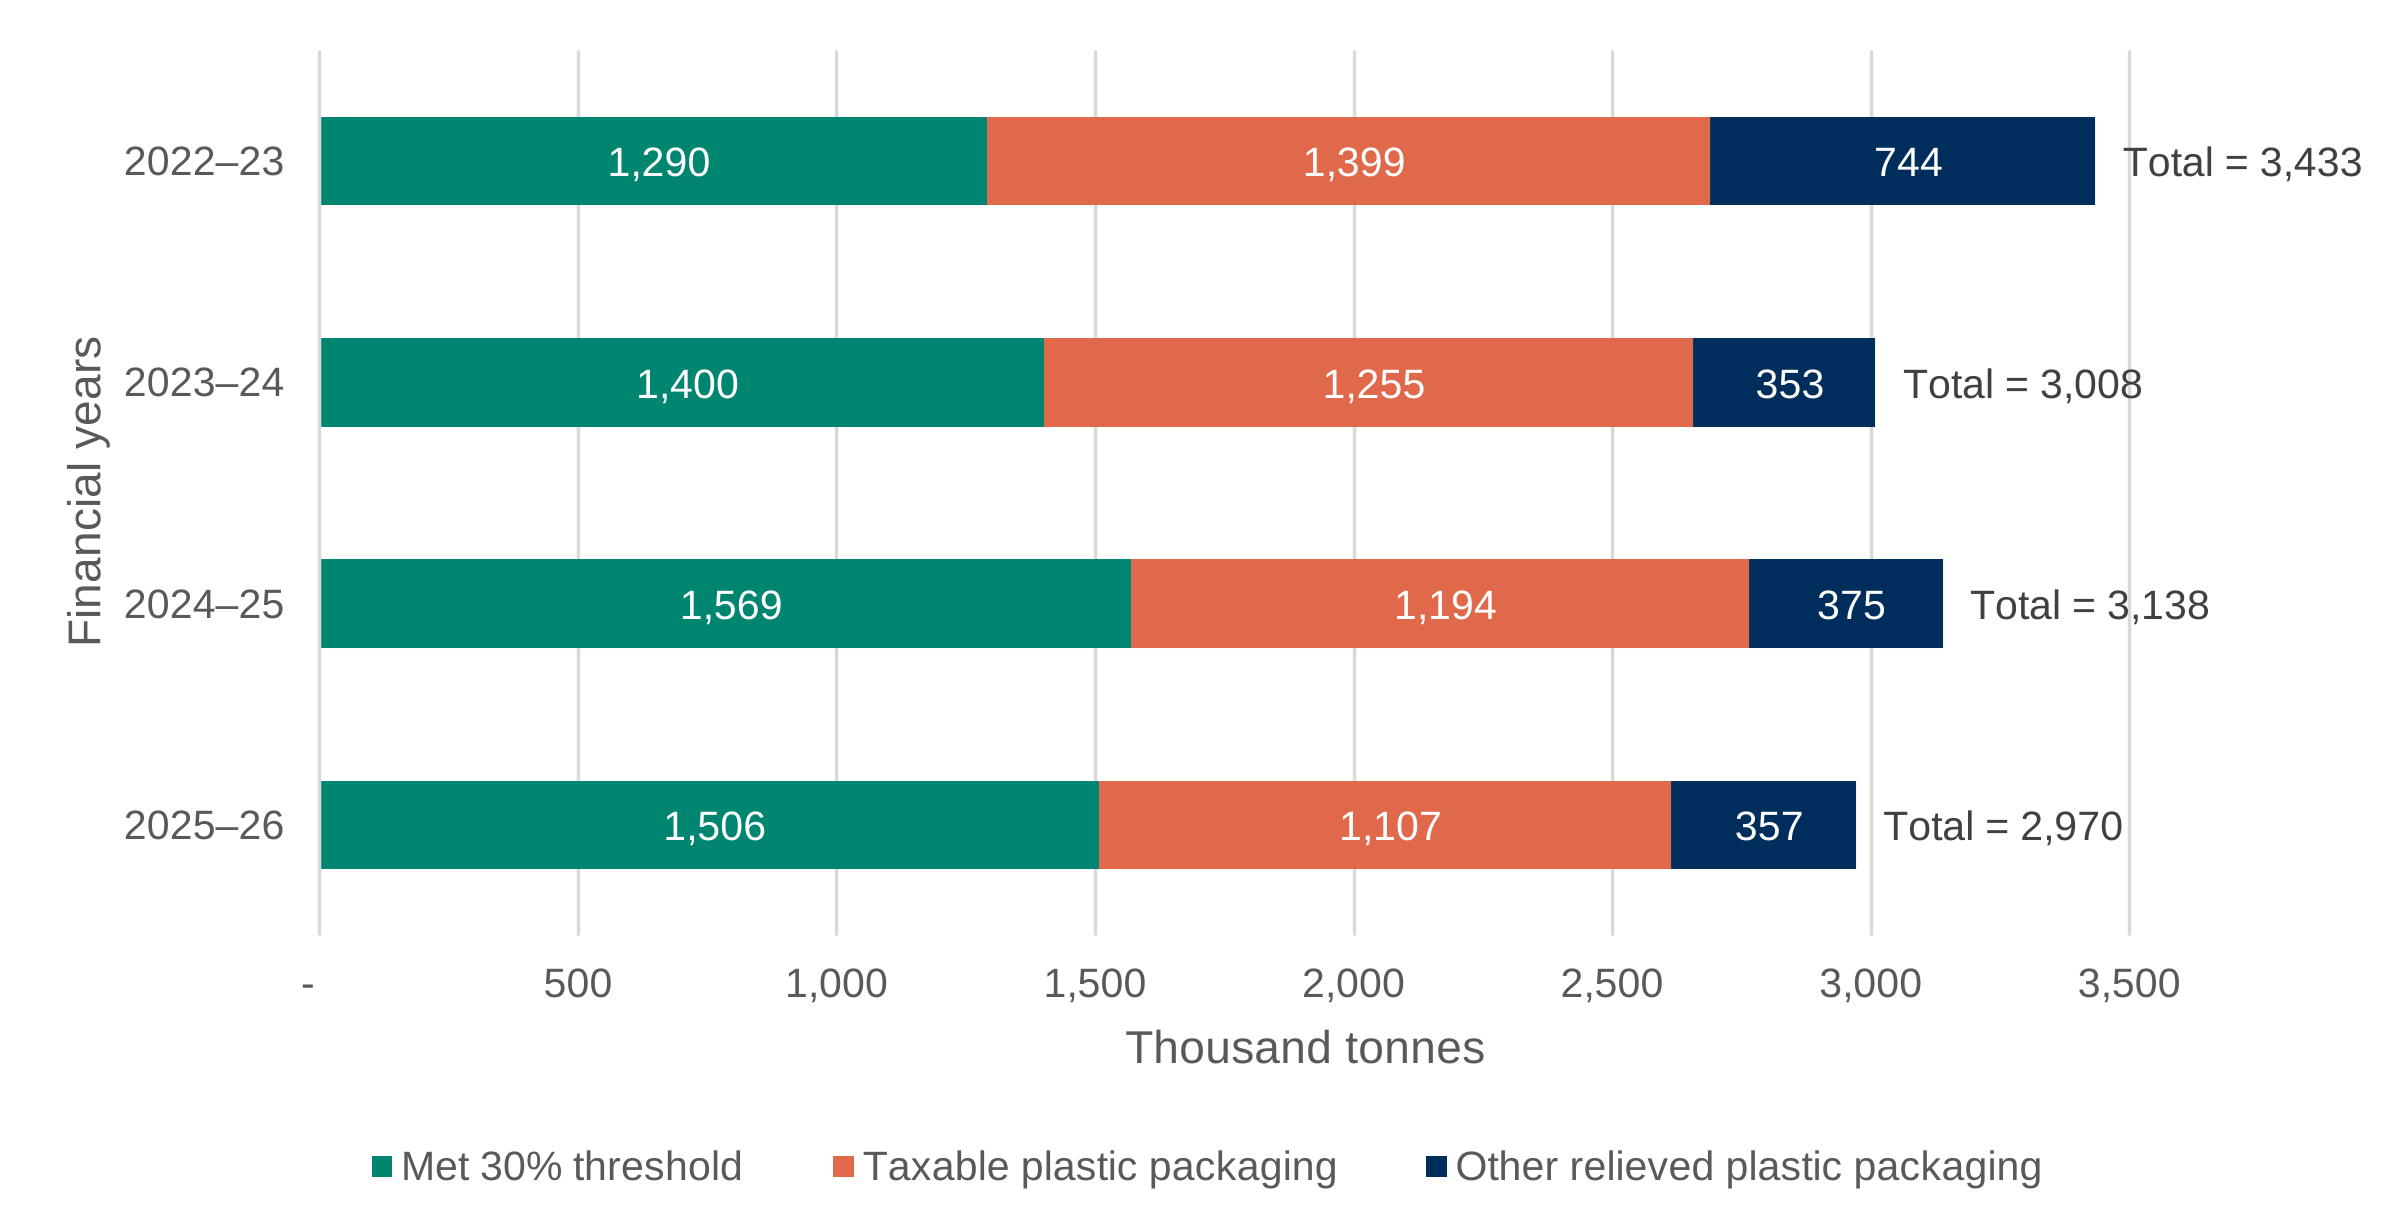
Data for Figure 4.1: Plastic packaging above the 30% recycled content threshold, packaging otherwise relieved from PPT, and packaging taxable as it falls below the 30% recycled content threshold.
Source: HMRC.
| Financial years | Met 30% threshold (thousand tonnes) | Taxable plastic packaging (thousand tonnes) | Other relieved plastic packaging (thousand tonnes) | Total (thousand tonnes) |
|---|---|---|---|---|
| 2022–23 | 1,290 | 1,399 | 744 | 3,433 |
| 2023–24 | 1,400 | 1,255 | 353 | 3,008 |
| 2024–25 | 1,569 | 1,194 | 375 | 3,138 |
| 2025–26 | 1,506 | 1,107 | 357 | 2,970 |
It is plausible that the largest observable change in recycled content occurred shortly after the introduction of PPT as the policy has been designed to create a discrete threshold incentive (the 30% recycled content threshold). In economic terms, thresholds (or ‘notches’) and similar discontinuities are known to generate clustering of behaviour around the cutoff (known as ‘bunching’), as taxpayers or firms adjust just enough to reduce tax liability. Such responses can be concentrated early because many businesses face low‑cost adjustments that can be implemented quickly once the new incentive is introduced and becomes salient. Over time, further changes may slow as the remaining businesses face higher adjustment costs or other optimisation frictions. Moreover, there is no further tax incentive for businesses meeting the threshold to change behaviour.
Qualitative evidence from the social research suggests that, where businesses did change their use of recycled plastic materials, these changes typically increased the volume of recycled plastic in packaging and were implemented around the introduction of the PPT rather than emerging gradually over time. Businesses commonly described the tax as acting as a catalyst that brought forward, formalised, or sharpened existing intentions to increase recycled content, rather than as the sole driver of change. Other influences on packaging decisions are explored in Chapter 6. In this sense, PPT appears to have influenced a subset of businesses in the timing and framing of packaging decisions, accelerating shifts that aligned with wider cost considerations, sustainability objectives, or anticipated regulatory trends.
Figure 4.2: Proportion of businesses reporting no packaging, no packaging above the recycled content threshold, some packaging above the threshold, and all packaging above the threshold.
Totals sum to 100% in each financial year. 2022 to 2023: n = 4,507; 2023 to 2024: n = 4,831; 2024 to 2025: n = 4,641; 2025 to 2026: n = 4,448. Source: HMRC.
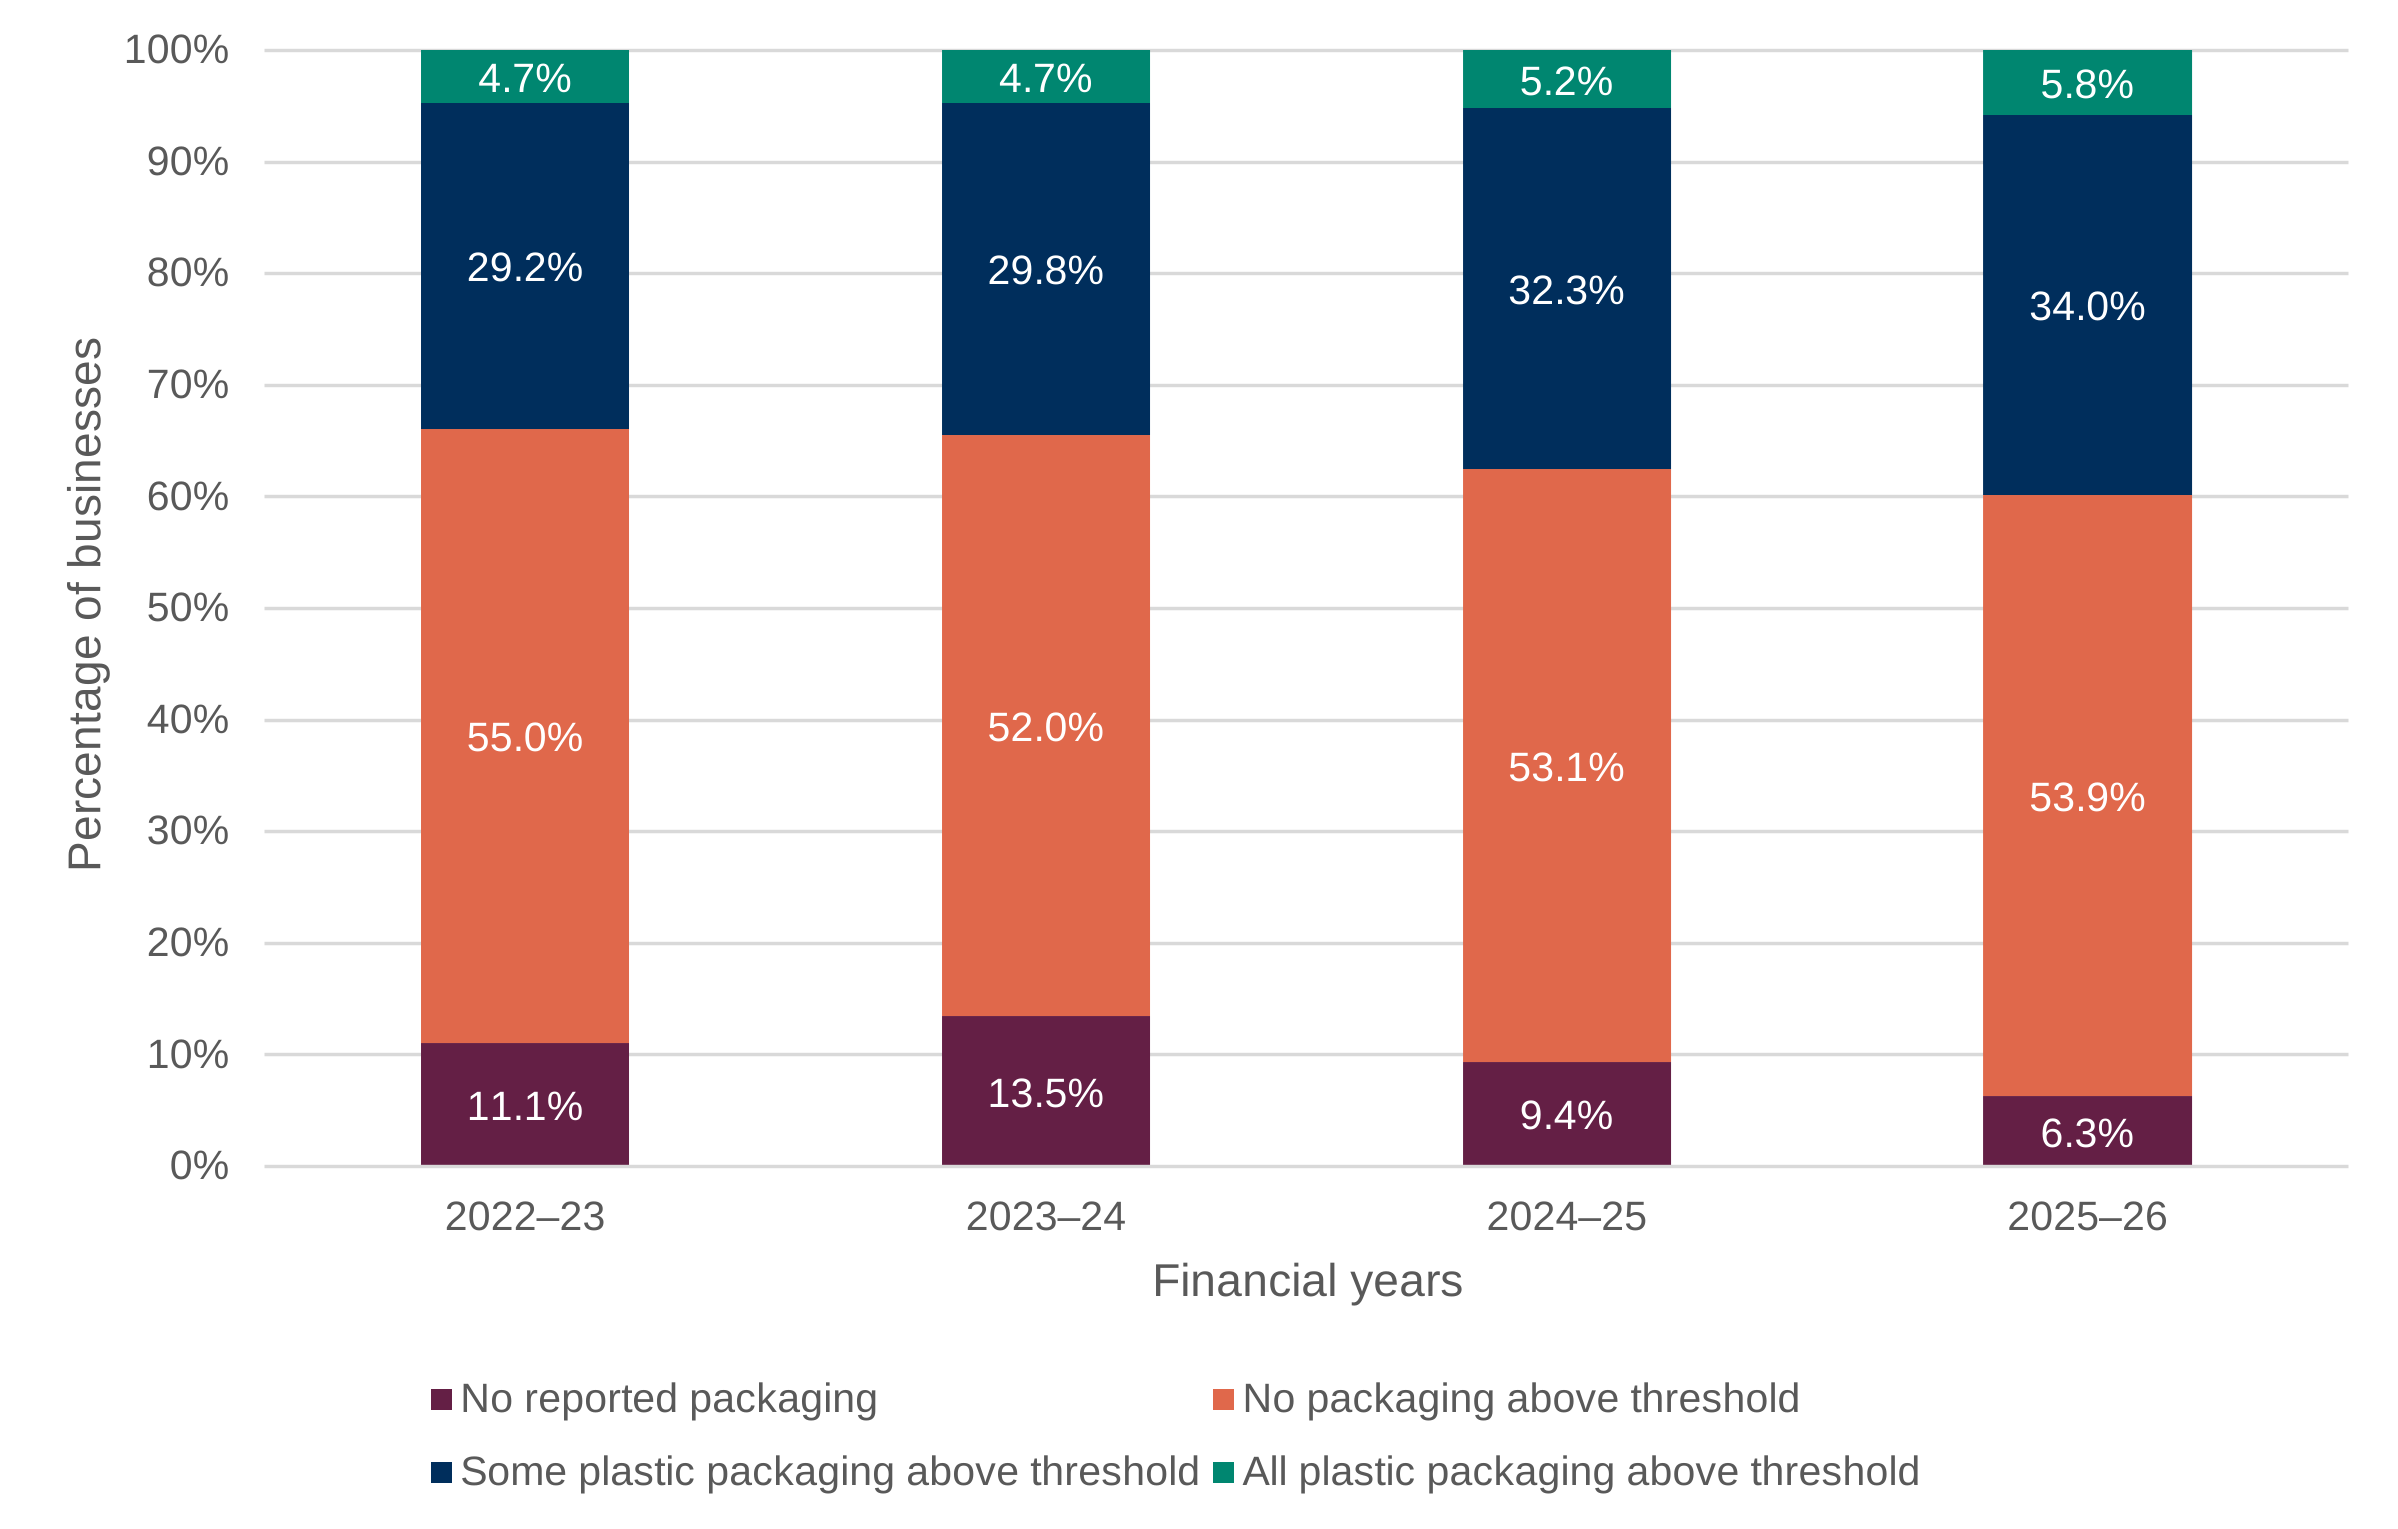
Data for Figure 4.2: Proportion of businesses reporting no packaging, no packaging above the recycled content threshold, some packaging above the threshold, and all packaging above the threshold.
Source: HMRC.
| Financial years | All plastic packaging above threshold | Some plastic packaging above threshold | No packaging above threshold | No reported packaging |
|---|---|---|---|---|
| 2022–23 | 4.7% | 29.2% | 55.0% | 11.1% |
| 2023–24 | 4.7% | 29.8% | 52.0% | 13.5% |
| 2024–25 | 5.2% | 32.3% | 53.1% | 9.4% |
| 2025–26 | 5.8% | 34.0% | 53.9% | 6.3% |
While the proportion of businesses reporting at least some packaging above the recycled content threshold increased over the evaluation period, Figure 4.2 shows that a substantial proportion of businesses continued to report no packaging above the threshold. The share of businesses with some or all packaging containing at least 30% recycled content increased from 34% in 2022 to 2023 to 40% in 2025 to 2026. This increase was driven primarily by growth in the proportion of businesses reporting some packaging above the threshold, although the proportion reporting all packaging above the threshold also increased modestly over time. However, as PPT administrative returns only identify whether packaging is above or below the 30% recycled content threshold, they do not provide information on the actual level of recycled content within plastic packaging.
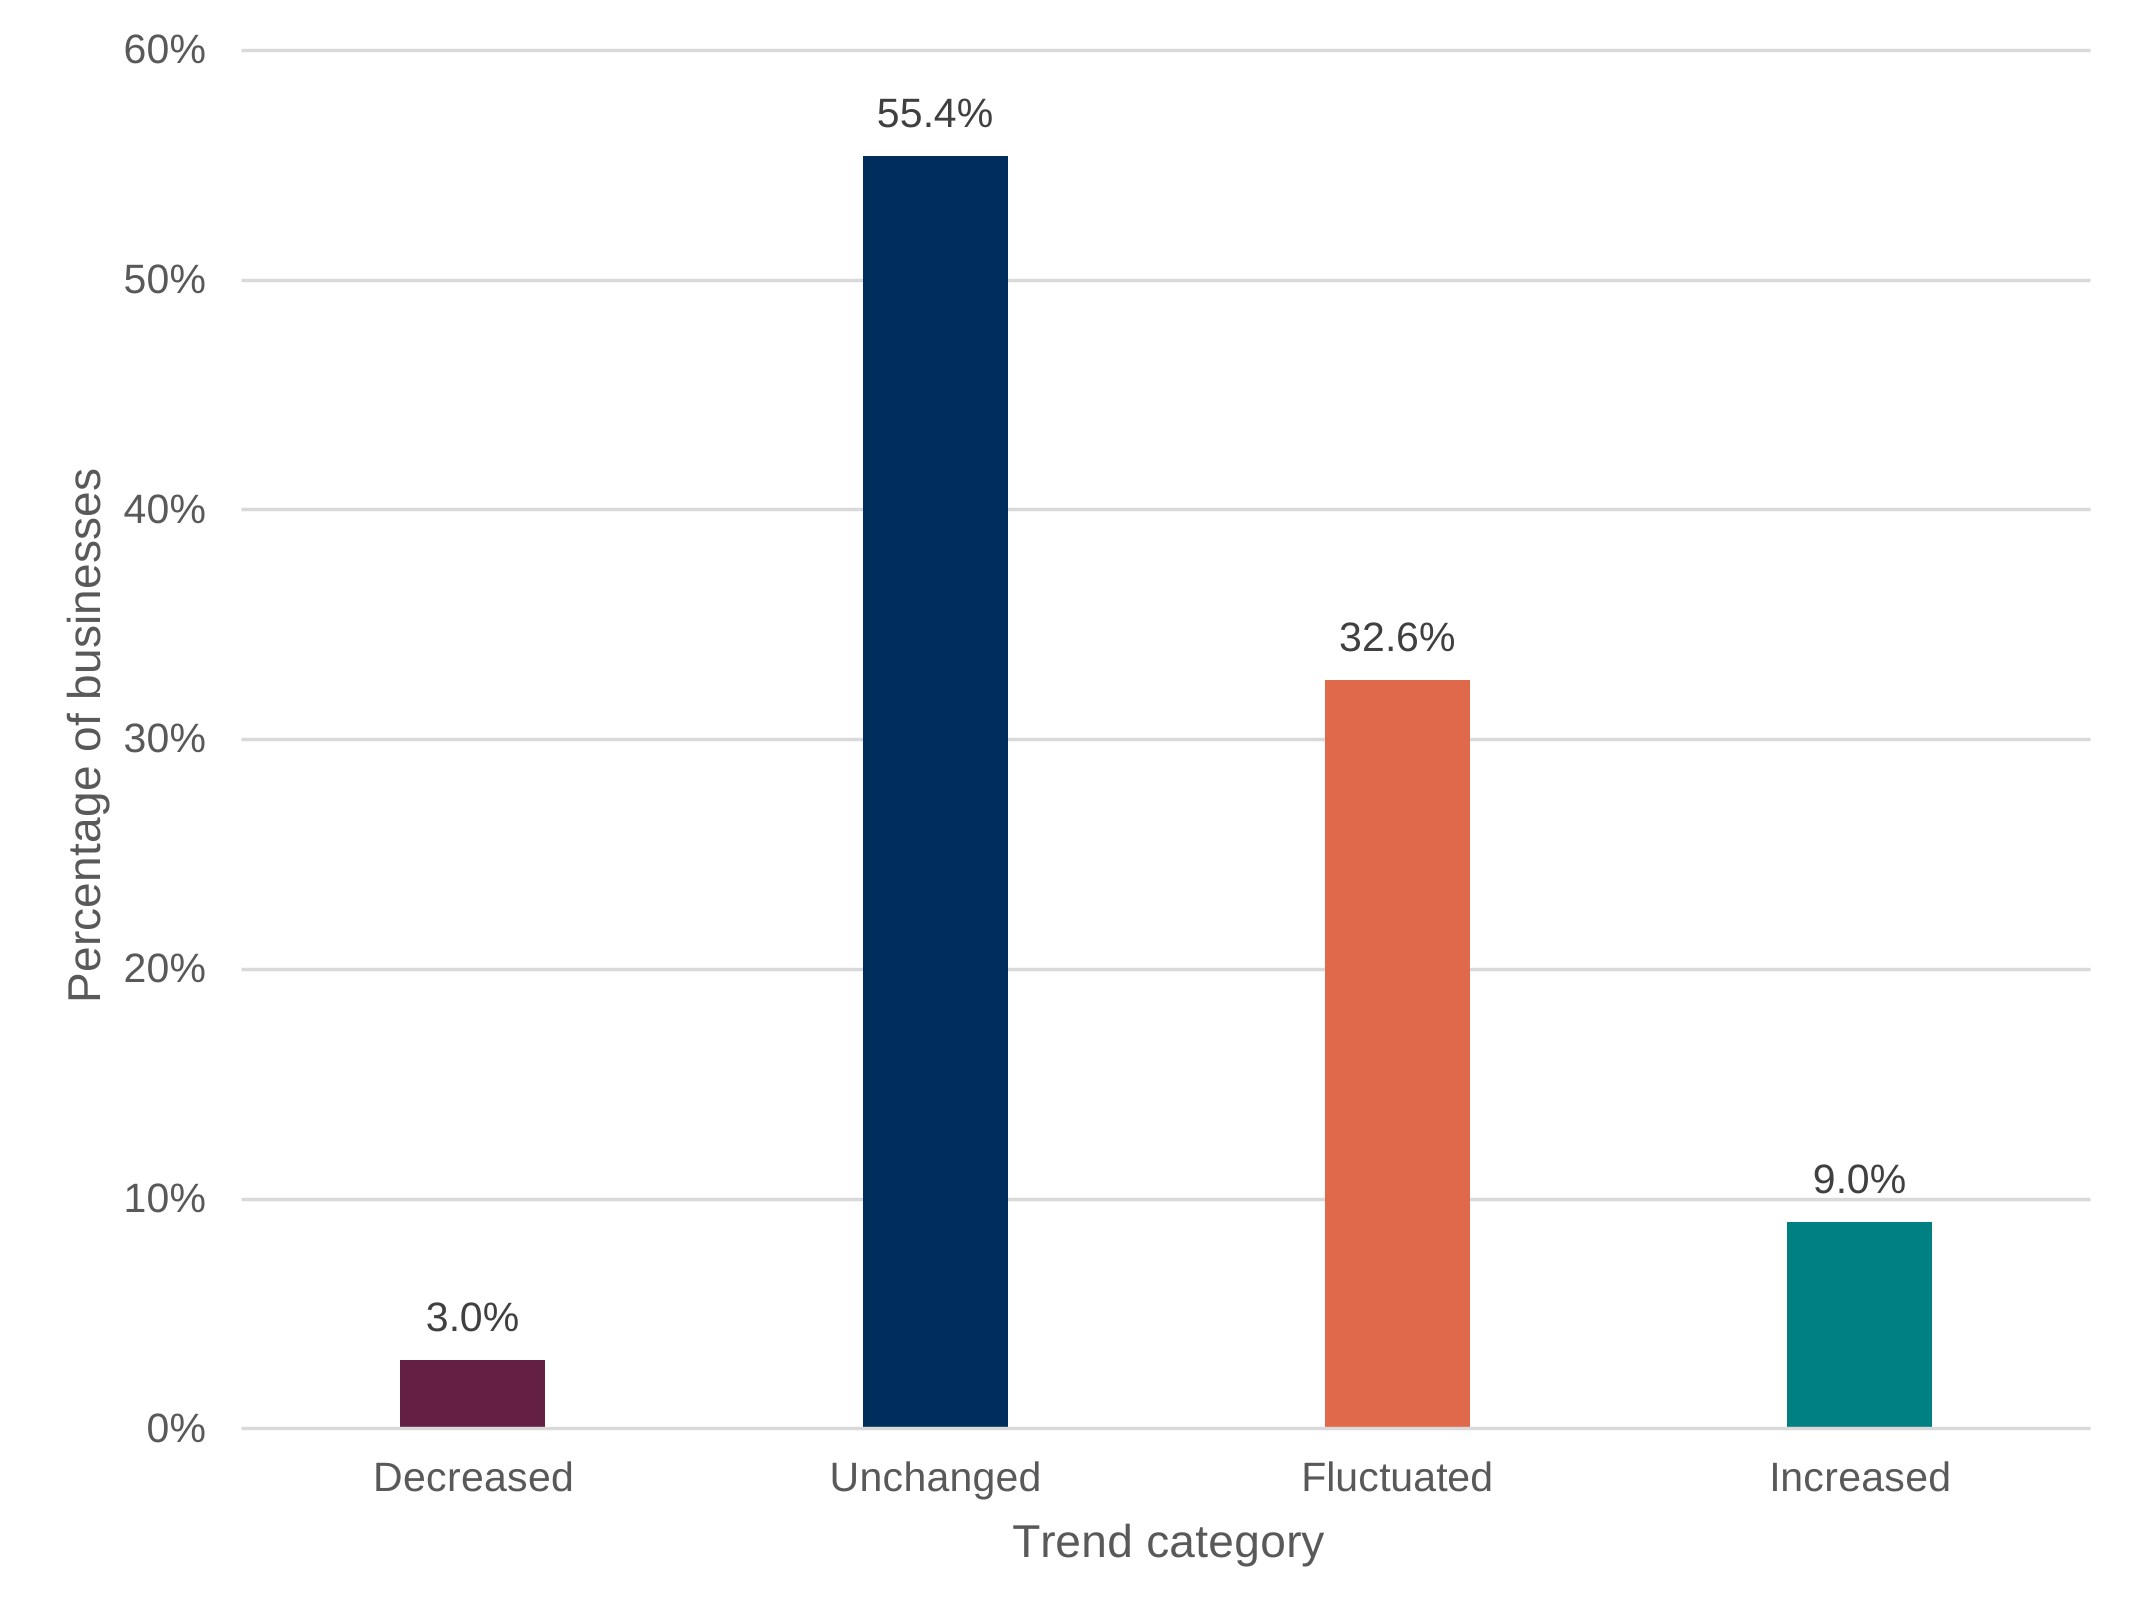
Figure 4.3: Movement in the split of plastic packaging above and below the 30% recycled content threshold for businesses between financial year 2022 to 2023 and 2025 to 2026.
Sample: n = 3,763. Source: HMRC.
Data for Figure 4.3: Movement in the split of plastic packaging above and below the 30% recycled content threshold for businesses between financial year 2022 to 2023 and 2025 to 2026.
Source: HMRC.
| Trend category | Percentage of businesses |
|---|---|
| Decreased | 3.0% |
| Unchanged | 55.4% |
| Fluctuated | 32.6% |
| Increased | 9.0% |
To explore this further, businesses have been grouped according to how the share of their plastic packaging meeting the 30% recycled content threshold changed between financial years 2022 to 2023 and 2025 to 2026. ‘Unchanged’ refers to businesses whose split between packaging above and below the threshold remained stable over time. ‘Increased’ refers to businesses that increased the proportion of their packaging meeting the threshold. ‘Decreased’ refers to businesses where this proportion declined. ‘Fluctuated’ captures businesses where the share meeting the threshold varied over time, increasing in some years and decreasing in others.
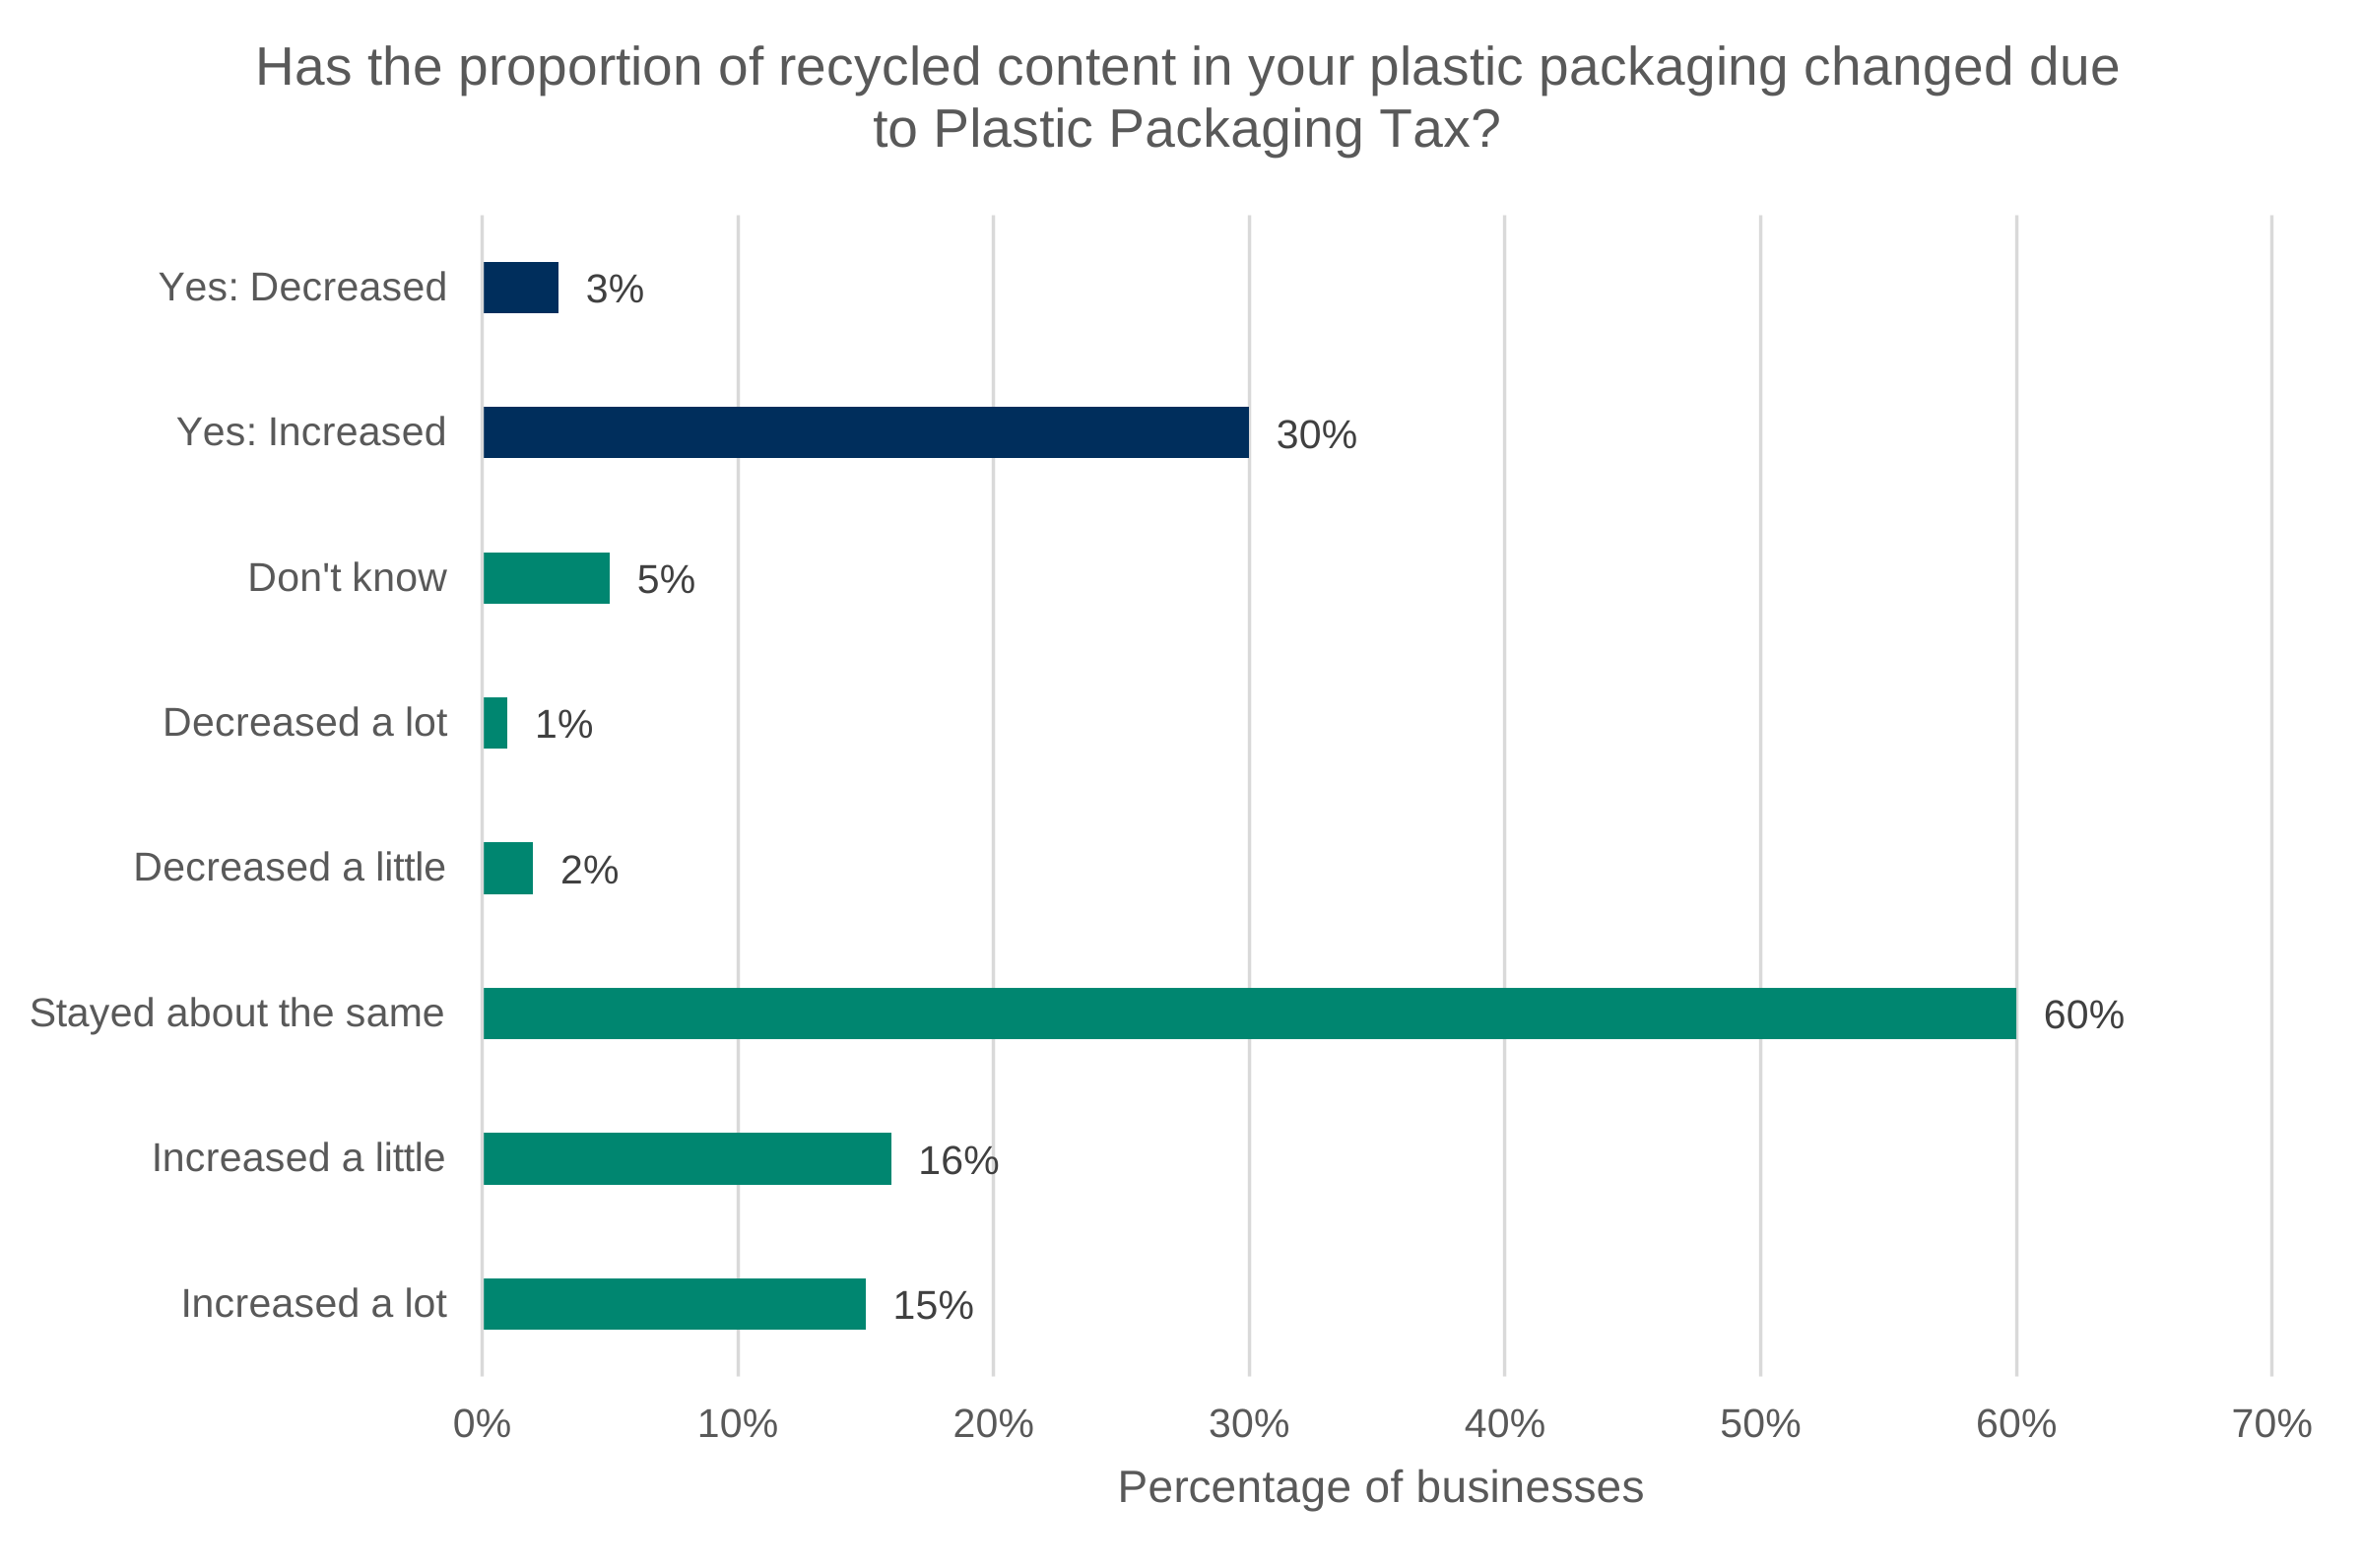
Figure 4.3 shows the results of this categorisation. The analysis shows that 55% of businesses have not changed this split over the period. Among these unchanged businesses, 94.5% consistently report all of their packaging being below the 30% recycled content threshold and therefore showing little sign of changing behaviour. This is broadly consistent with the social research findings in which 60% of businesses surveyed reported the recycled content in their plastic packaging had stayed about the same (Figure 4.4). For this group, there is no evidence that the tax has led to a shift towards packaging meeting the 30% recycled content threshold.
Figure 4.4: Survey results for the question ‘Has the proportion of recycled content in your plastic packaging changed due to the Plastic Packaging Tax?’.
Base: All businesses (1,011). Source: Ipsos.
Data for Figure 4.4: Survey results for the question ‘Has the proportion of recycled content in your plastic packaging changed due to the Plastic Packaging Tax?’.
Base: All businesses (1,011). Source: Ipsos.
| Category | Percentage of businesses |
|---|---|
| Yes: Decreased | 3% |
| Yes: Increased | 30% |
| Don’t know | 5% |
| Decreased a lot | 1% |
| Decreased a little | 2% |
| Stayed about the same | 60% |
| Increased a little | 16% |
| Increased a lot | 15% |
Moreover, the qualitative research highlights that businesses often weighed up the cost of making changes to their supply chain or products versus the cost of paying PPT, where paying the tax was reported as still being the most cost-effective outcome. This research also highlighted that there were concerns around the quality of recycled plastic, which is an important factor in certain sectors that have more stringent regulatory requirements. When little difference in quality between recycled and virgin plastic was observed, businesses reported that they were more likely to make changes.
Where changes are observed, the pattern is mixed. Figure 4.3 shows that a relatively small share of businesses (9.0%) have shown a sustained increase in the proportion of their packaging that meets or exceeds the 30% recycled content threshold across the period, consistent with the objective of the tax. However, Figure 4.4 illustrates that 30% of businesses reported that the recycled content in their plastic packaging had increased, with 15% reporting it had increased a lot and 16% reporting it had increased a little.
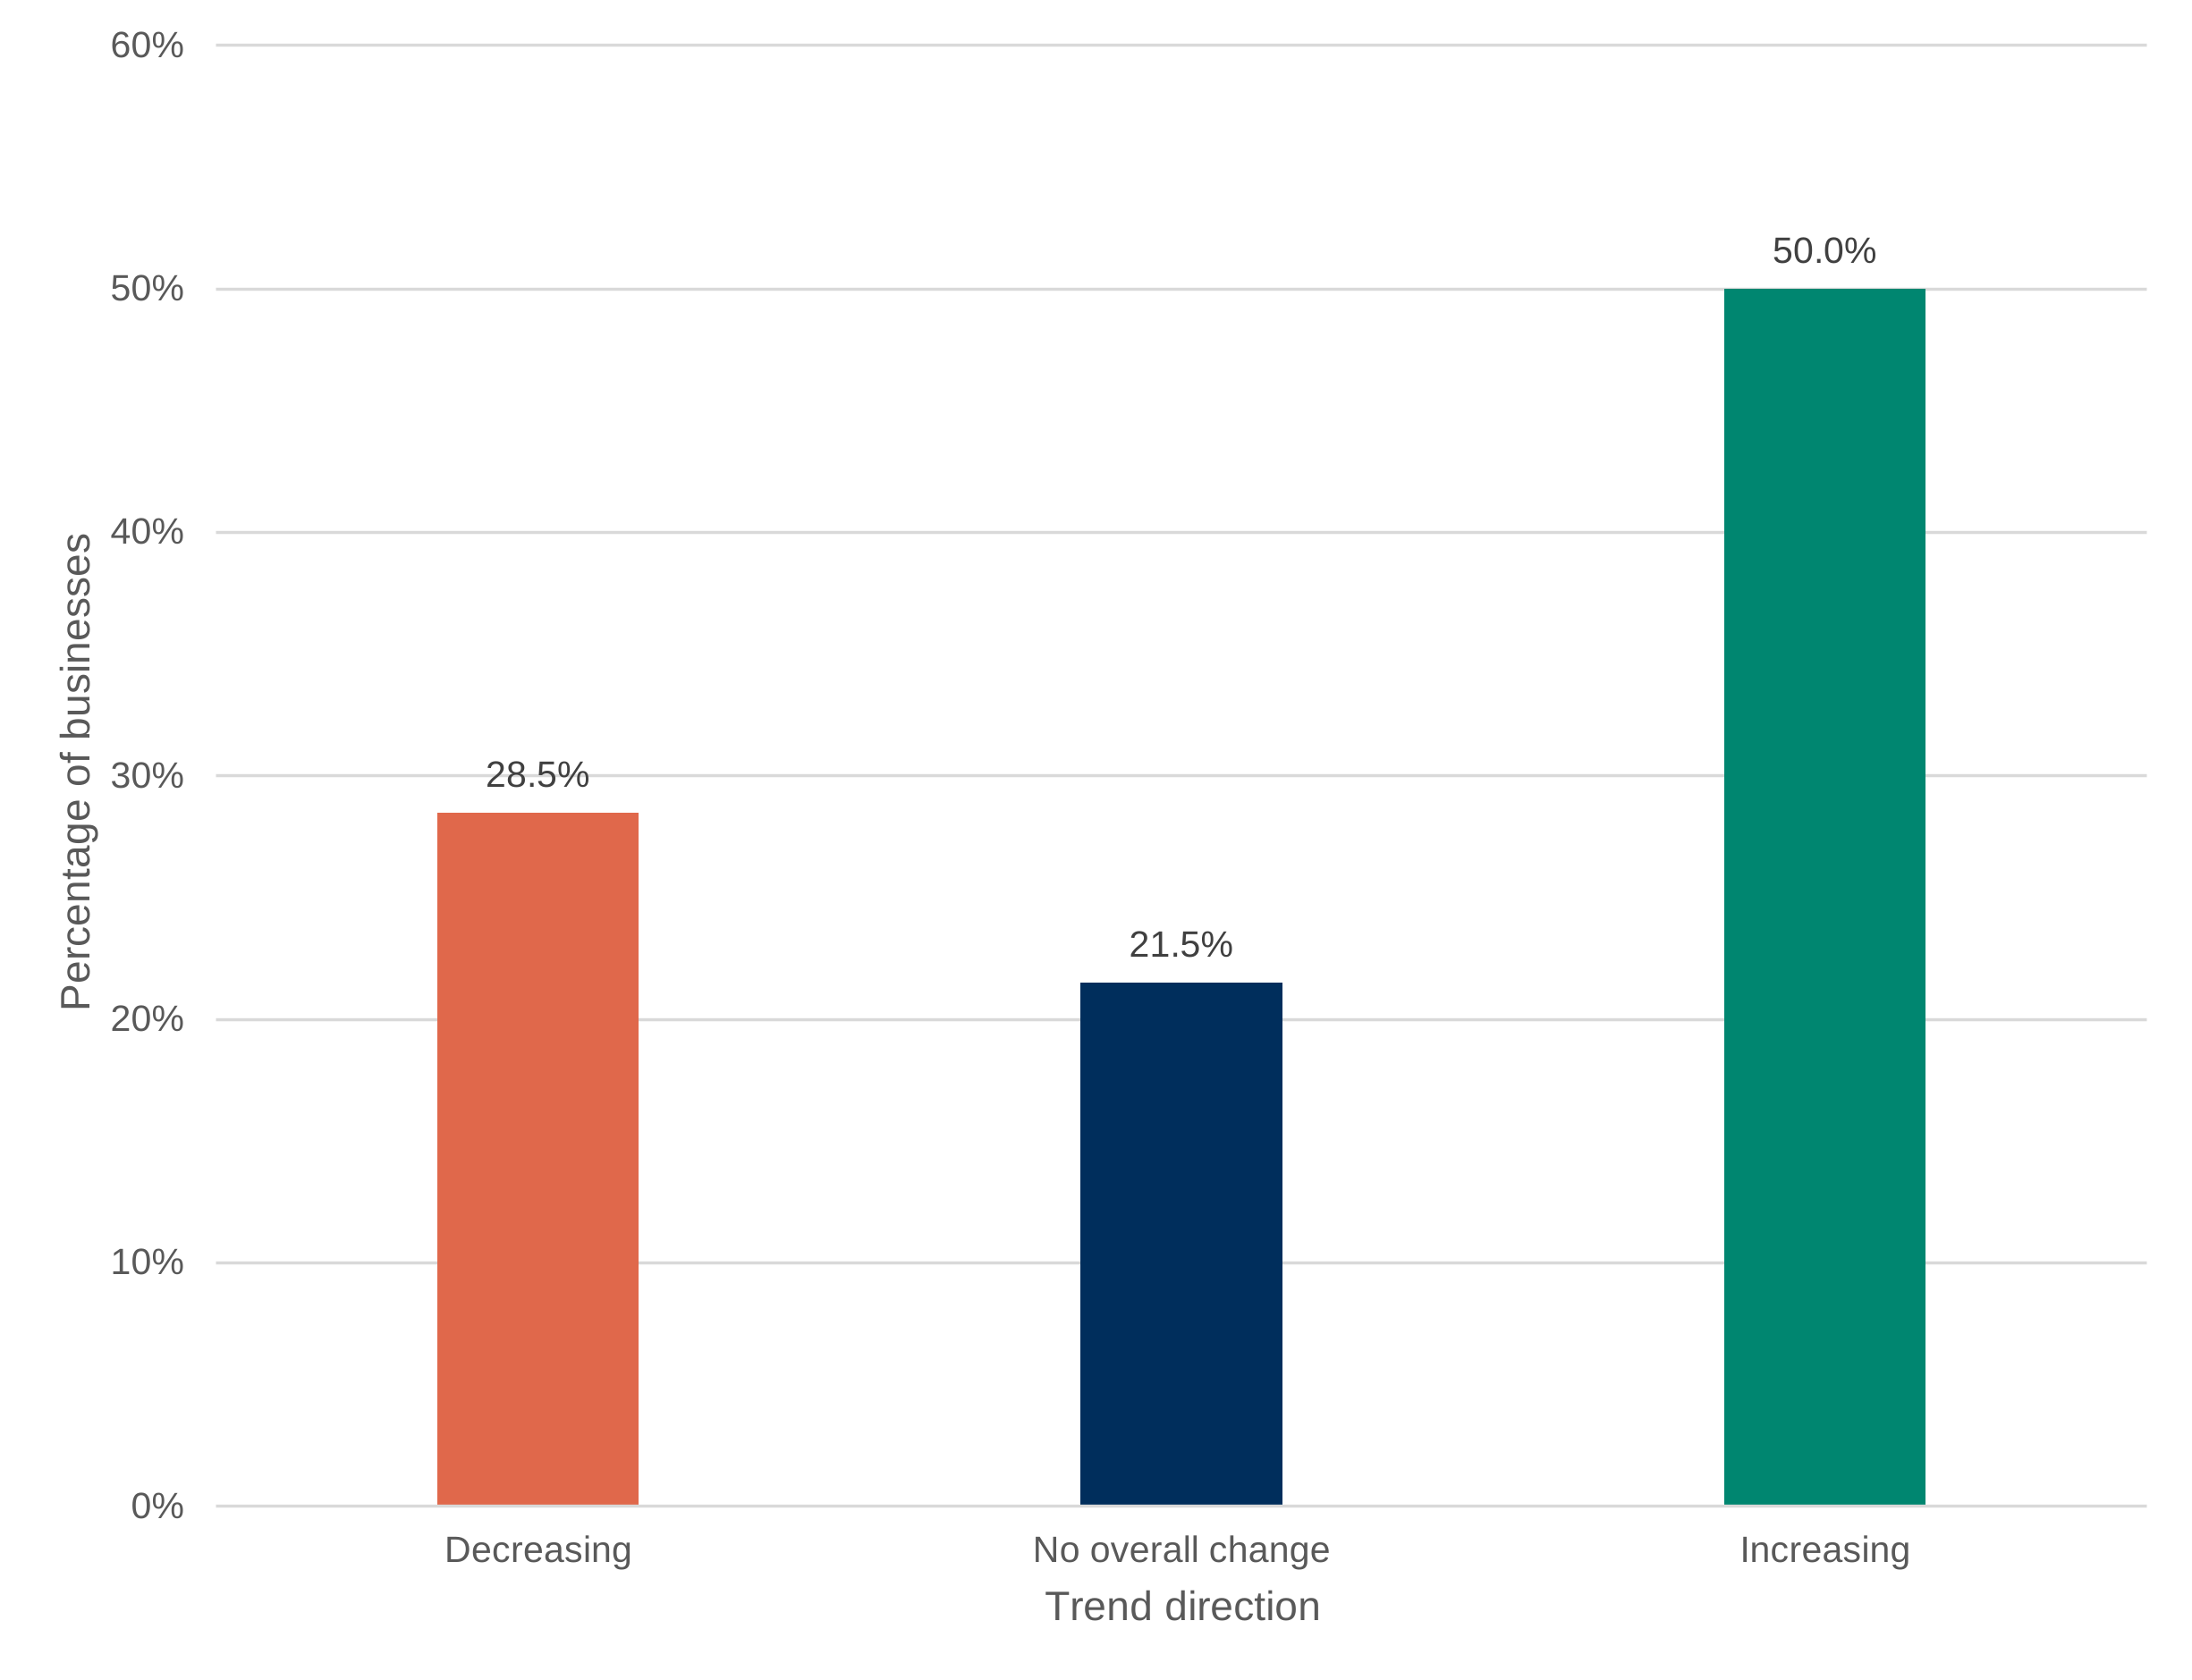
Figure 4.5: Overall direction of change among businesses with fluctuating levels of plastic falling above and below the 30% recycled content threshold between financial years 2022 to 2023 and 2025 to 2026.
Sample: 2022 to 2023, n = 4,507; 2023 to 2024, n = 4,831; 2024 to 2025, n = 4,641; 2025 to 2026, n = 4,448. Source: HMRC.
Data for Figure 4.5: Overall direction of change among businesses with fluctuating levels of plastic falling above and below the 30% recycled content threshold between financial years 2022 to 2023 and 2025 to 2026.
Source: HMRC.
| Trend direction | Percentage of businesses |
|---|---|
| Decreasing | 28.5% |
| No overall change | 21.5% |
| Increasing | 50.0% |
To better understand the disparity between the administrative data and the quantitative research, the ‘Fluctuated’ category in Figure 4.3 is used. This category includes businesses where the proportion of packaging meeting the 30% recycled content threshold increased in some years and decreased in others. Figure 4.5 breaks this group down to determine whether businesses showed an overall increasing or decreasing trend, or remained broadly flat over the period. Within this subset, 50.0% of businesses were classified as showing an overall increasing trend compared to 28.5% of businesses classed as decreasing and 21.5% classed as showing no overall change in their recycled content over the period. This shows that a greater proportion of fluctuating businesses in the administrative data demonstrated an overall increase in the amount of plastic packaging above the 30% recycled content threshold during the lifespan of the tax.
Combining the ‘increasing’ group with businesses that have trended positively in the ‘fluctuated’ group, the administrative data shows that 25.3% of businesses have made positive changes through increasing the proportion of their packaging that is meeting the 30% recycled content threshold. This brings the findings more in line with the quantitative research.
These findings suggest that, while the aggregated administrative data shows an overall increase in recycled plastic usage, this trend is primarily being driven by changes among a subset of businesses rather than a widespread or consistent shift across the tax base. The characteristics of these businesses are explored further in Chapter 5.
4.4.2 Recycled content in plastic packaging
As noted, HMRC administrative returns record only whether packaging is above or below the 30% recycled content threshold, rather than the precise level of recycled content in the packaging. This limits the ability to monitor changes in the underlying composition of plastic packaging.
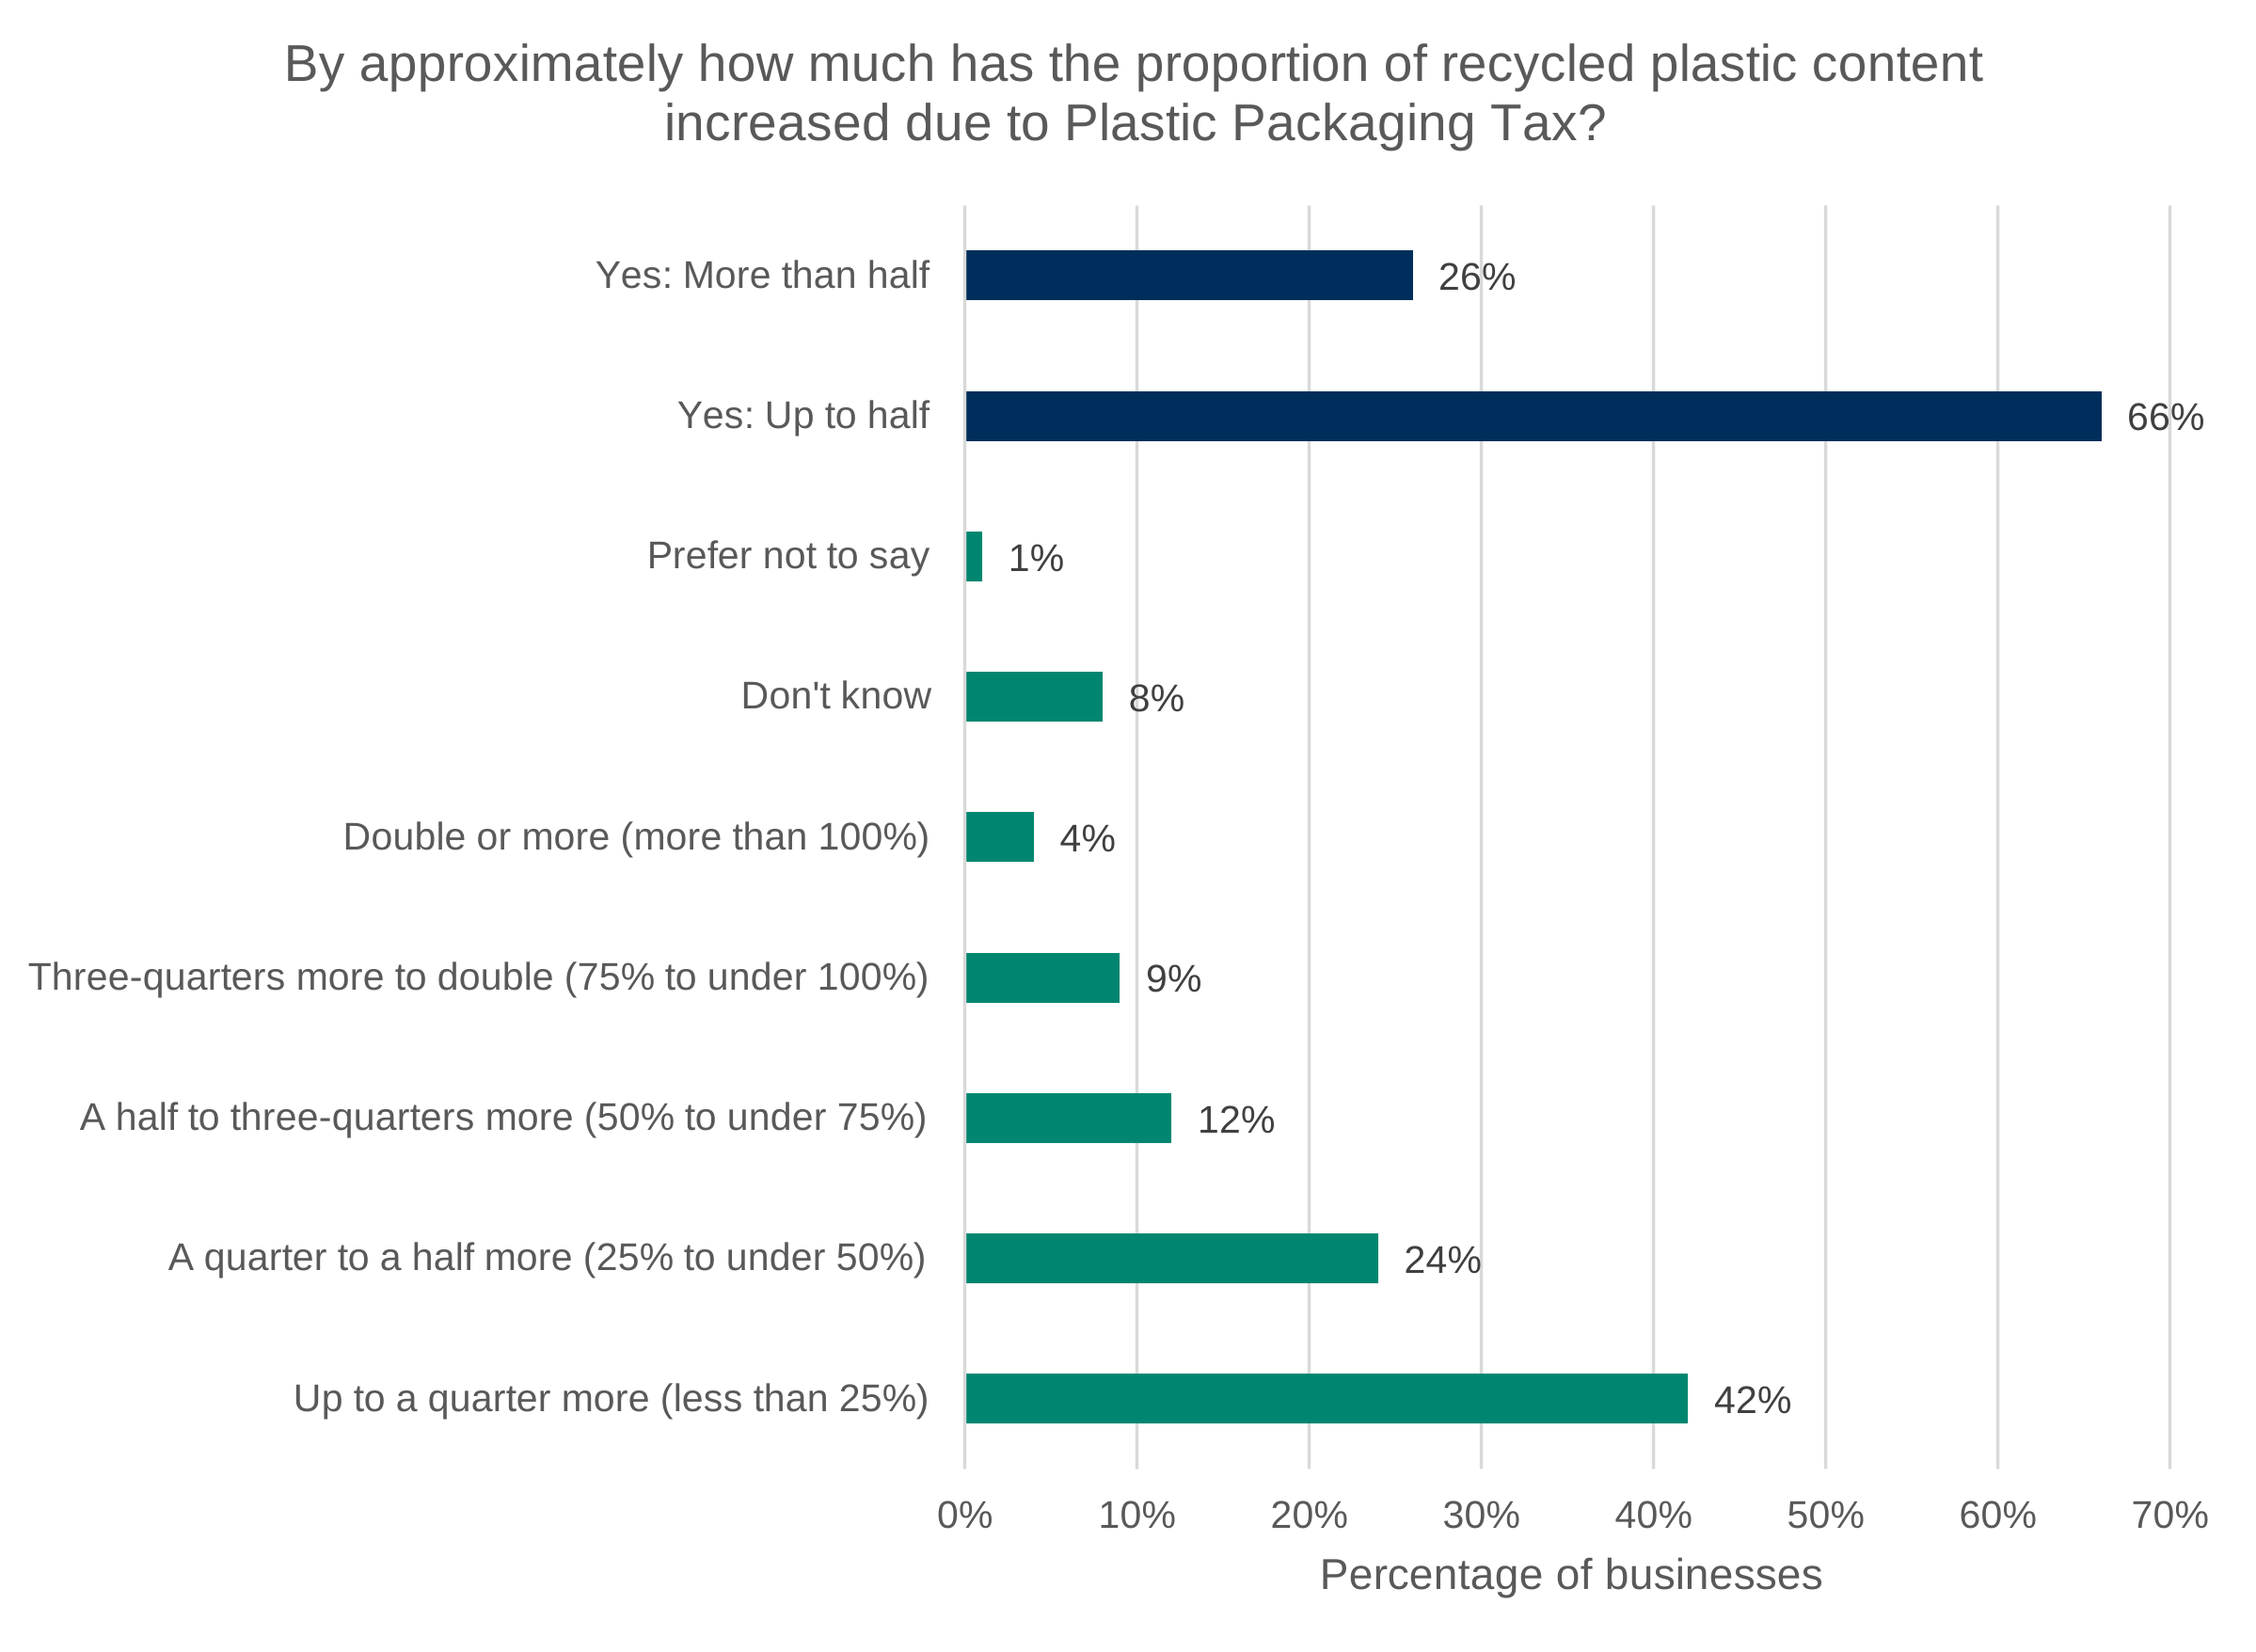
Figure 4.6: Survey results for the question ‘By approximately how much has the proportion of recycled plastic content increased due to Plastic Packaging Tax?’.
Base: All businesses who increased the proportion of recycled plastic content due to PPT (317). Source: Ipsos.
Data for Figure 4.6: Survey results for the question ‘By approximately how much has the proportion of recycled plastic content increased due to Plastic Packaging Tax?’.
Base: All businesses who increased the proportion of recycled plastic content due to PPT (317). Source: Ipsos.
| Category | Percentage of businesses |
|---|---|
| Yes: More than half | 26% |
| Yes: Up to half | 66% |
| Prefer not to say | 1% |
| Don’t know | 8% |
| Double or more (more than 100%) | 4% |
| 3-quarters more to double (75% to under 100%) | 9% |
| A half to 3-quarters more (50% to under 75%) | 12% |
| A quarter to a half more (25% to under 50%) | 24% |
| Up to a quarter more (less than 25%) | 42% |
Among the 317 businesses that reported in the survey that they had increased recycled content as a result of the tax, most changes were relatively modest in scale. Figure 4.6 shows that 66% of these businesses reported increases of up to 50% in recycled plastic content in their packaging, with 42% increasing recycled content by up to a quarter. Larger increases were less common, with only 26% of this subset of businesses reporting an increase in recycled content of more than a half. This is consistent with businesses making targeted adjustments sufficient to meet or move towards the 30% recycled content threshold, rather than undertaking more extensive changes to packaging composition.
Only 3% of businesses reported that they had decreased the proportion of recycled plastic content due to the tax. It is not clear from this evaluation why this small subset of businesses decreased their recycled content due to the tax.
The findings from the social research suggest a moderately positive impact from the tax on increasing the amount of plastic packaging falling above the recycled content threshold. The quantitative survey results indicated that a subset of businesses report increasing recycled content in response to the tax. However, this evidence is self-reported and the scale of these changes cannot be separately verified. If HMRC moved to collecting more granular data on the proportion of recycled content it would enable a more robust assessment of the tax’s impact, allowing HMRC to better understand both the magnitude and distribution of changes in recycled content across the tax base.
4.4.3 Overall plastic use in packaging
As well as increasing the recycled plastic content in plastic packaging, the implementation of PPT may also disincentivise plastic usage in packaging more generally. The PPT applies to businesses that manufacture or import 10 tonnes or more of finished plastic packaging within a 12-month period, meaning not all plastic packaging used within the UK is captured by the tax. For businesses registered for the tax, they report around 3.4 million tonnes of plastic packaging used in financial year 2022 to 2023. In the most recent financial year, 2025 to 2026, this figure is approximately 3 million tonnes. There has been a general decline in reported plastic packaging tonnage over the lifespan of PPT, albeit alongside year-to-year fluctuations, as shown in Figure 4.7.
Figure 4.7: Total plastic packaging (in thousand tonnes) manufactured and imported by businesses registered for PPT.
Source: HMRC.
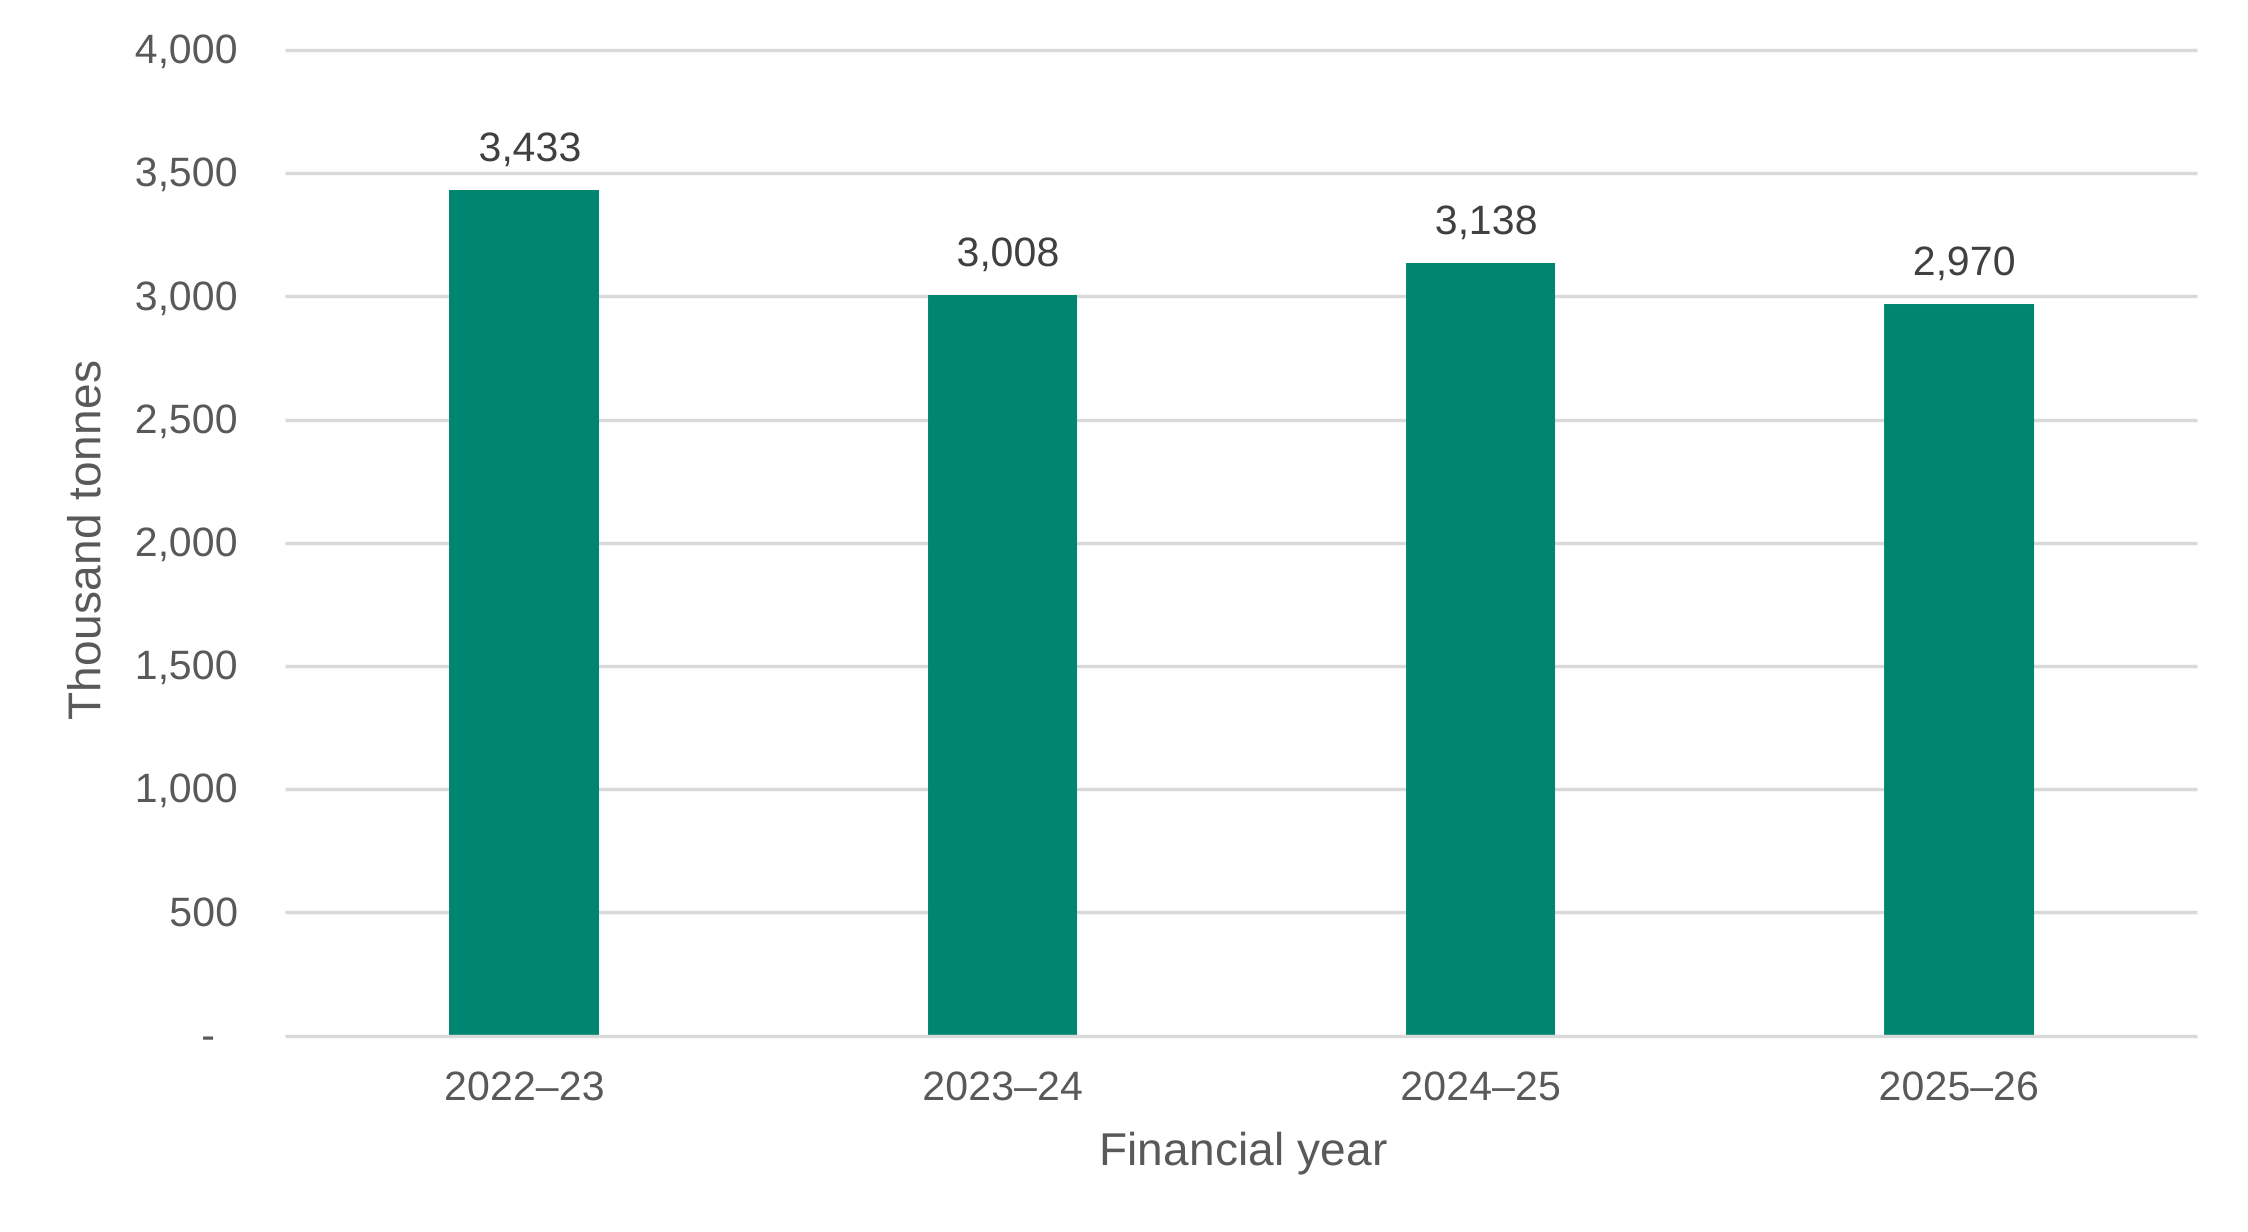
Data for Figure 4.7: Total plastic packaging (in thousand tonnes) manufactured and imported by businesses registered for PPT.
Source: HMRC.
| Financial years | Plastic packaging (thousand tonnes) |
|---|---|
| 2022–23 | 3,433 |
| 2023–24 | 3,008 |
| 2024–25 | 3,138 |
| 2025–26 | 2,970 |
Social research suggests that, for most businesses, the PPT has not led to large changes in the overall quantity of plastic used in packaging but has contributed to a net shift of modest reductions among a subset of businesses. Figure 4.8 demonstrates that 67% of businesses reported that the total tonnage of plastic packaging they handled stayed about the same due to the tax. Evidence from the qualitative research suggests that for some businesses not changing behaviour was the ‘most economical option’, implying that the additional cost of the tax has been cheaper than switching to alternative materials. Businesses also reported other supply-side constraints on changing behaviour, including availability of materials from suppliers and not wanting to harm existing supplier relationships. However, a notable minority reported reducing the amount of plastic packaging used, with 21% of businesses reporting a decrease, compared with only 6% reporting an increase.
Figure 4.8: Survey results for the question ‘Has the total tonnage of plastic packaging you manufacture and/or import changed due to Plastic Packaging Tax?’.
Base: All businesses (1,011). Source: Ipsos.
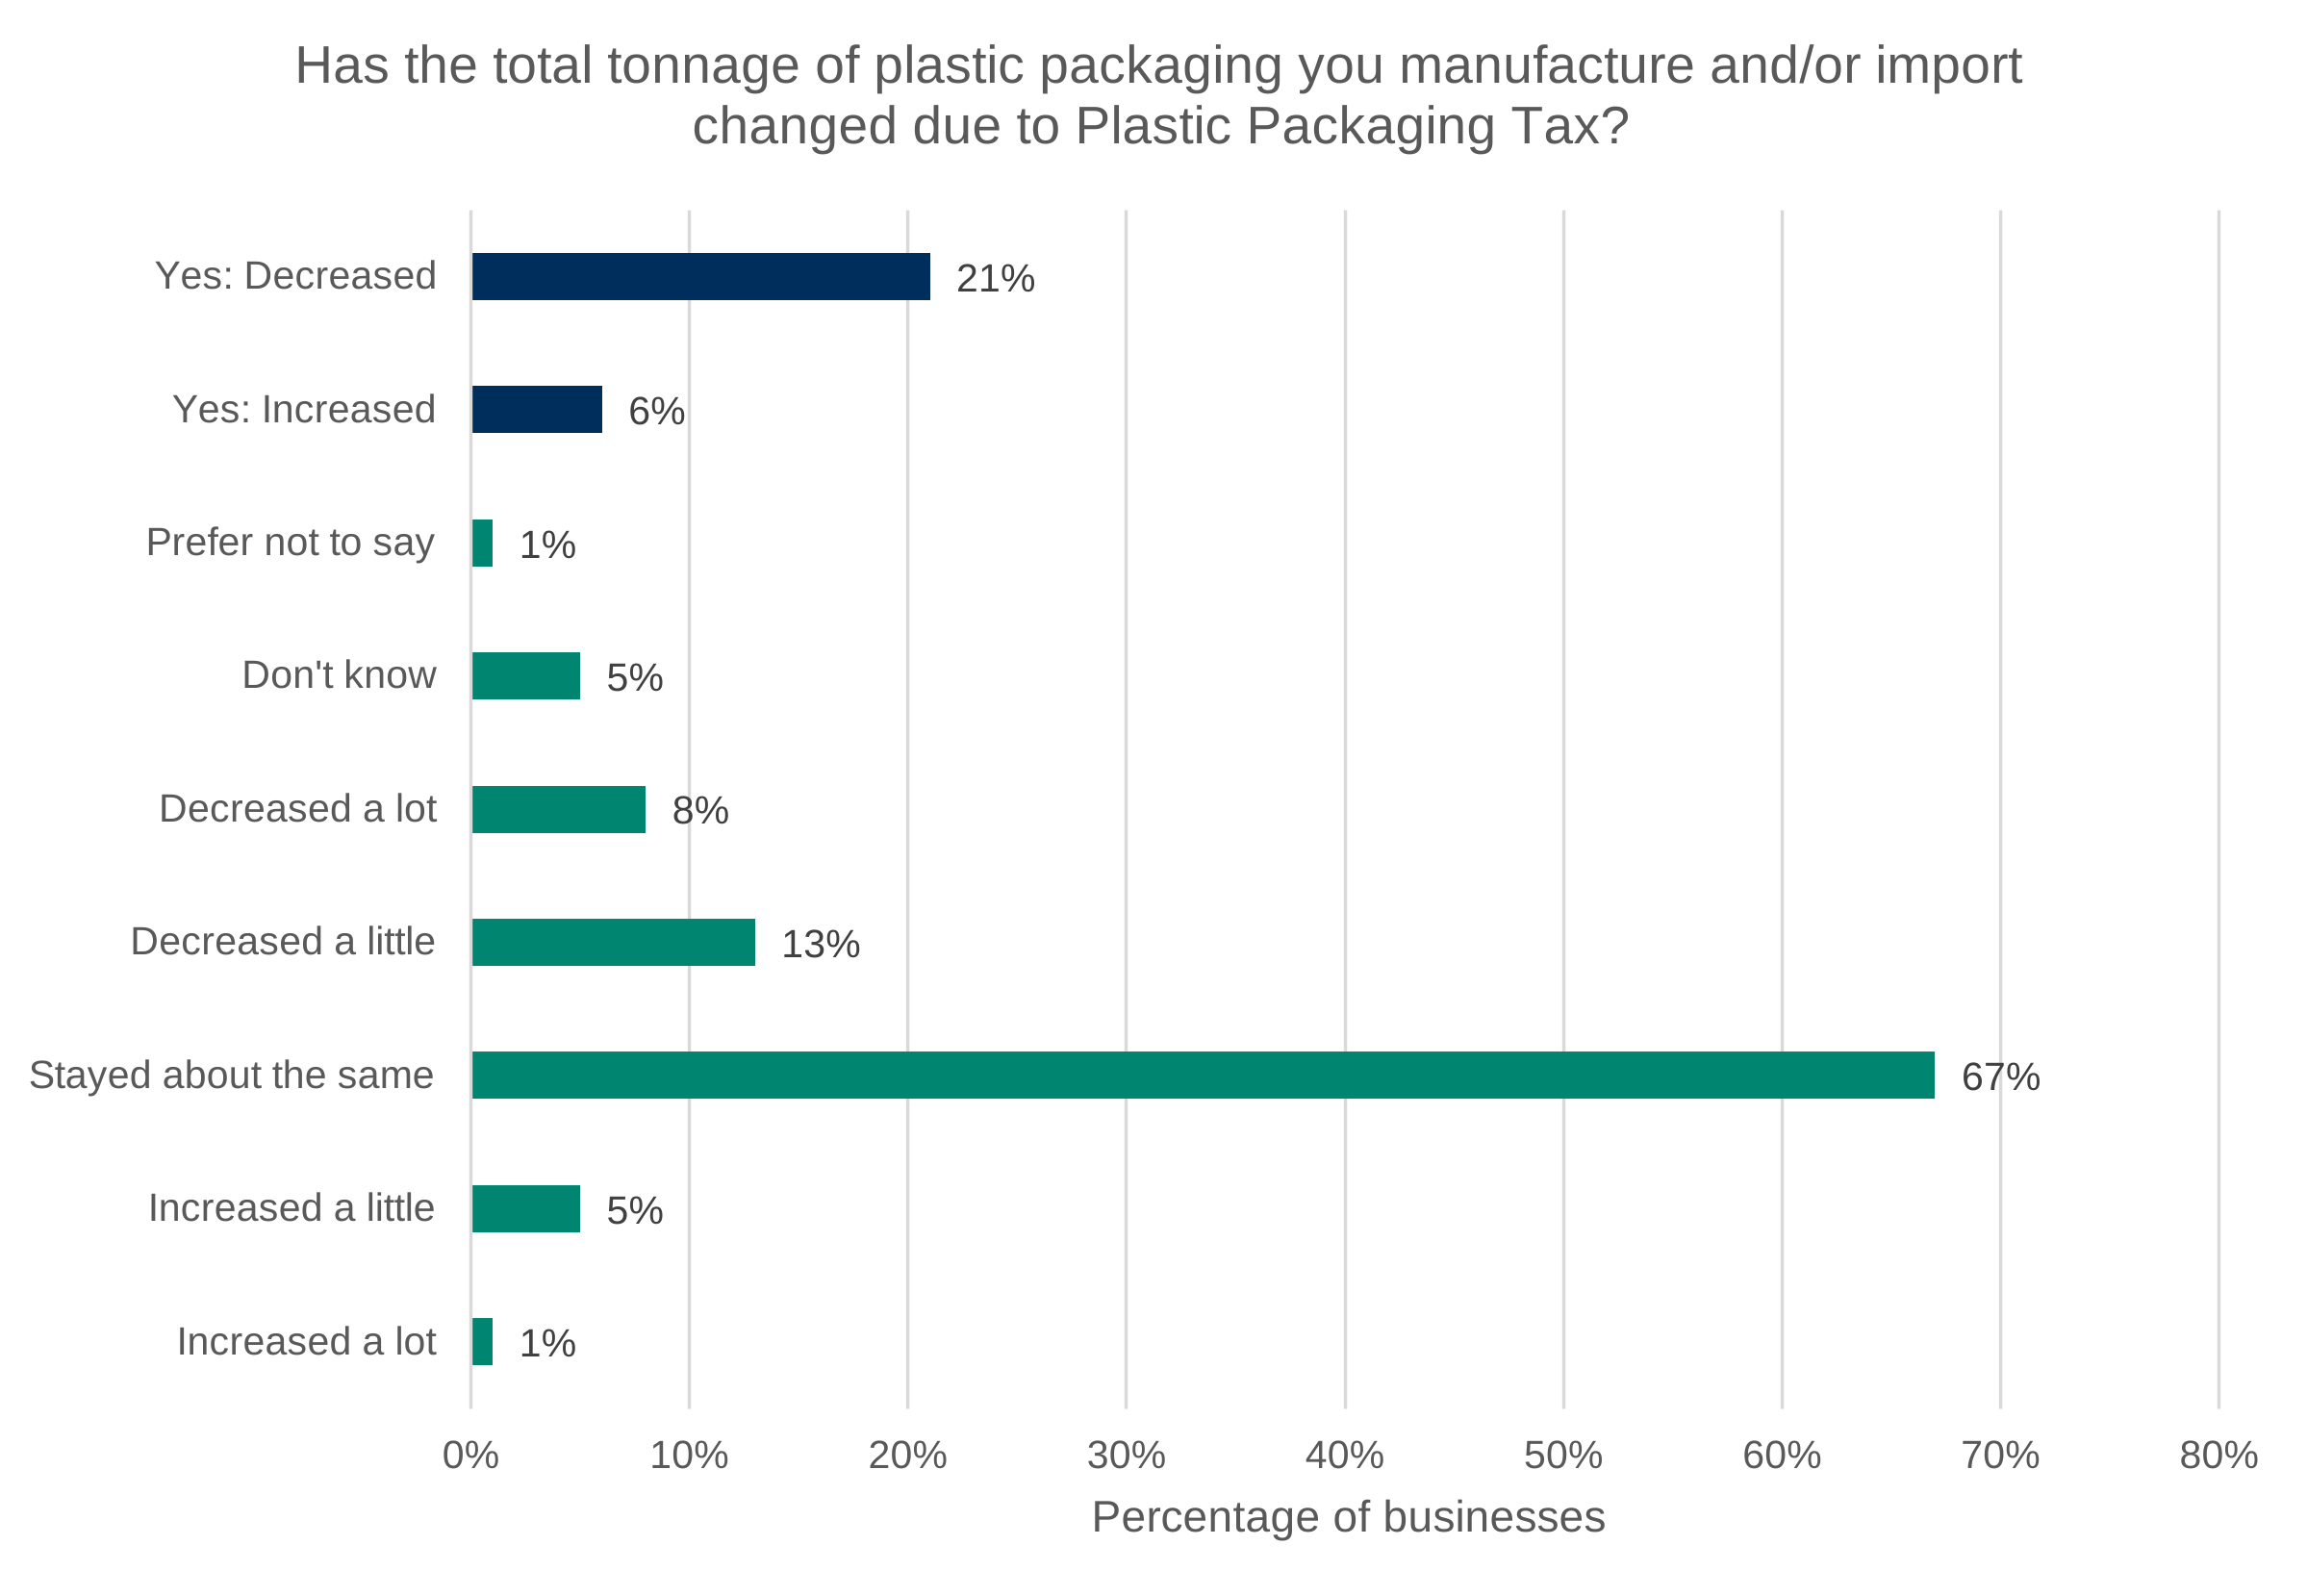
Data for Figure 4.8: Survey results for the question ‘Has the total tonnage of plastic packaging you manufacture and/or import changed due to Plastic Packaging Tax?’.
Base: All businesses (1,011). Source: Ipsos.
| Category | Percentage of businesses |
|---|---|
| Yes: Decreased | 21% |
| Yes: Increased | 6% |
| Prefer not to say | 1% |
| Don’t know | 5% |
| Decreased a lot | 8% |
| Decreased a little | 13% |
| Stayed about the same | 67% |
| Increased a little | 5% |
| Increased a lot | 1% |
Where reductions in plastic packaging were reported, these were most commonly limited in scale. For the 218 businesses reporting a decrease, 53% of them said this amounted to reducing their tonnage usage by up to a quarter, with fewer businesses reporting larger reductions (Figure 4.9).
Figure 4.9: Survey results for the question ‘By approximately how much has your tonnage of plastic packaging decreased due to Plastic Packaging Tax?’.
Base: All businesses who decreased the tonnage of plastic packaging used due to PPT (218). Source: Ipsos.
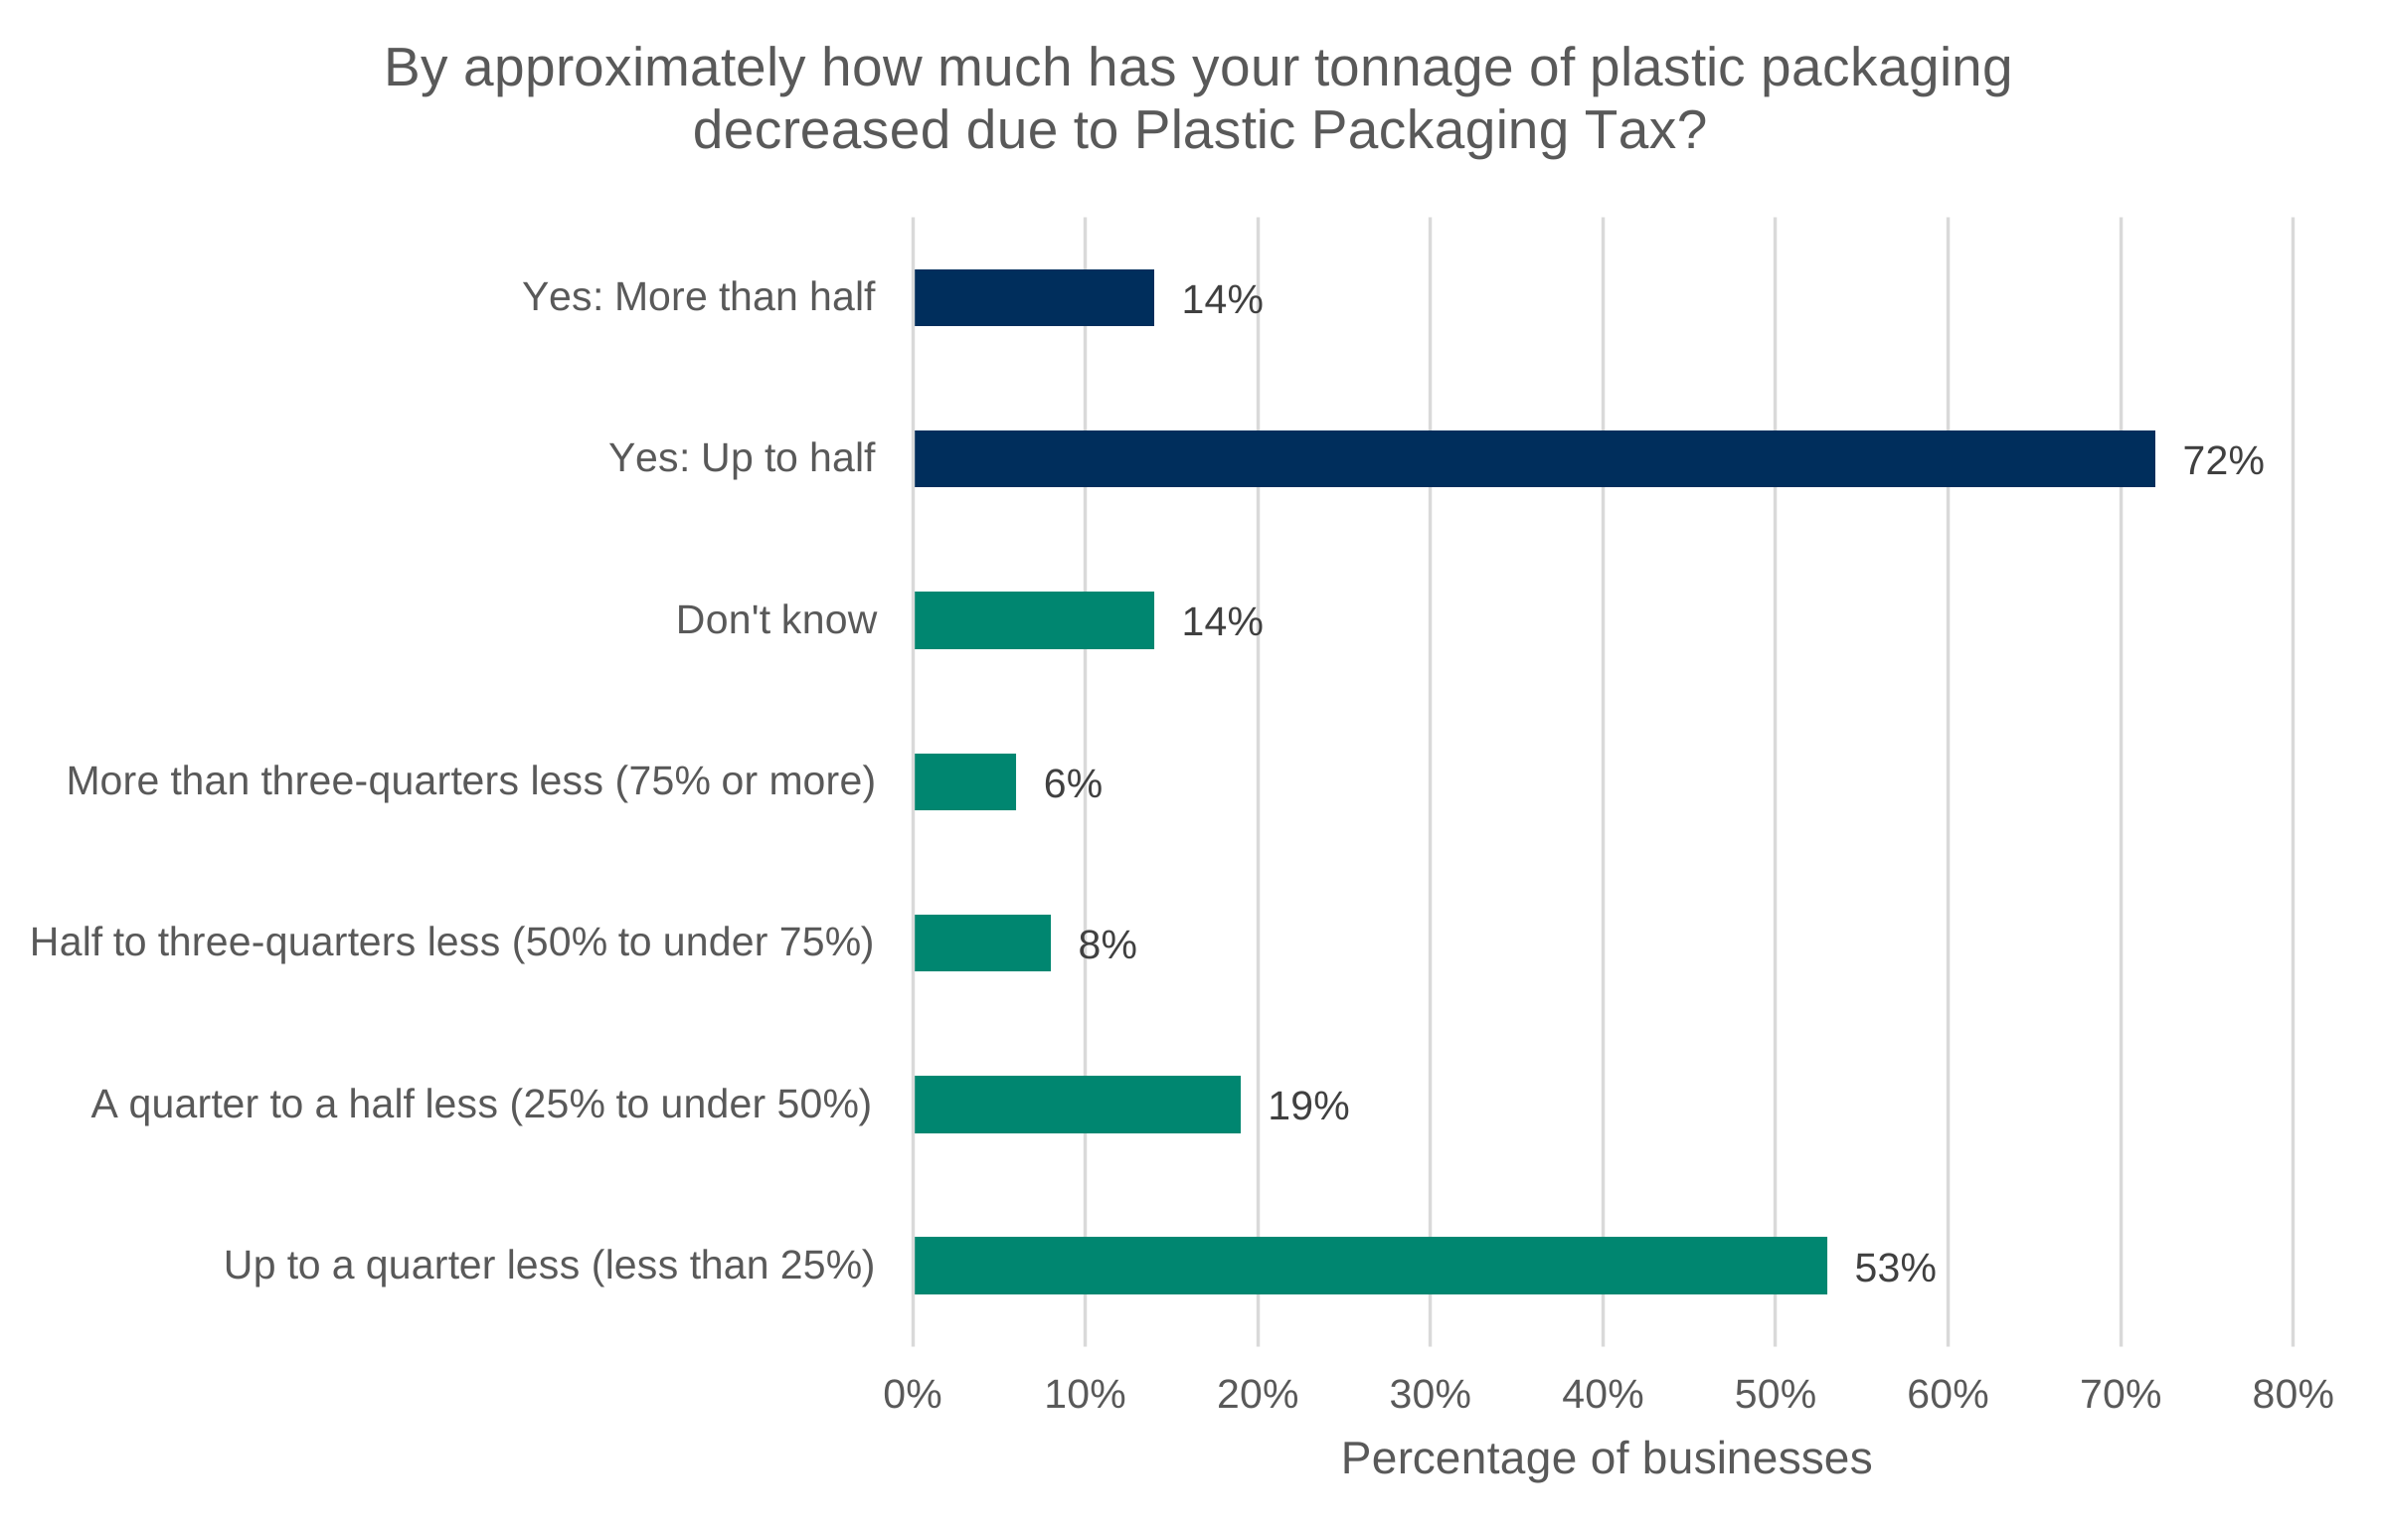
Data for Figure 4.9: Survey results for the question ‘By approximately how much has your tonnage of plastic packaging decreased due to Plastic Packaging Tax?’.
Base: All businesses who decreased the tonnage of plastic packaging used due to PPT (218). Source: Ipsos.
| Category | Percentage of businesses |
|---|---|
| Yes: More than half | 14% |
| Yes: Up to half | 72% |
| Don’t know | 14% |
| More than 3-quarters less (75% or more) | 6% |
| Half to 3-quarters less (50% to under 75%) | 8% |
| A quarter to a half less (25% to under 50%) | 19% |
| Up to a quarter less (less than 25%) | 53% |
In the qualitative research, some businesses were identified as not focusing on recycled content and instead were focused on moving away from plastic as a packaging material altogether (consistent with the design of the tax). Other interviewees described deliberate efforts to reduce the volume of plastic packaging they import or manufacture, either by optimising packaging design, reducing unnecessary components, or exploring non-plastic alternatives. For these businesses, reductions in plastic use were often framed as part of broader packaging or sustainability goals, with PPT acting as a reinforcing factor alongside existing commercial or environmental considerations. The qualitative evidence suggests that PPT has supported reductions in overall plastic usage among some businesses, but that changes in plastic volumes have been less widespread and more heterogeneous than changes in recycled content. Moreover, these findings suggest that, at the aggregate level, changes to overall plastic use have tended to be marginal rather than transformative.
In contrast, increases in plastic packaging were both less common and generally small in magnitude (Figure 4.8). Where increases in plastic packaging were reported by businesses, the qualitative report highlights that this can often be driven by business growth and product mix, rather than an actual increase in the quantity of plastic packaging used per product.
These findings indicate that PPT has been associated with gradual changes in overall plastic packaging use among some businesses, while the majority have maintained broadly stable levels. The characteristics of these businesses are again further explored in Chapter 5.
4.4.4 Constraints and influences on further changes in plastic packaging
The PPT is primarily a demand-side policy instrument, designed to influence business behaviour by increasing the relative cost of virgin plastic packaging and creating an incentive to use less virgin plastic in packaging. In theory, the tax raises the marginal private cost of using virgin plastic, which is reflected in a higher effective price faced by businesses. In doing so, PPT seeks to change material and design decisions for packaging made by firms. Crucially, however, the ability of firms to respond to these demand-side incentives is also conditioned by the responsiveness of supply in the relevant upstream markets — most notably the supply and feasibility of recycled plastic and alternative packaging materials.
Standard tax incidence theory emphasises that the effects of a tax are jointly determined by the relative responsiveness of supply and demand, with the less responsive side of the market bearing a greater share of the adjustment. The same intuition applies here: even if demand shifts away from virgin plastic, the realised adjustment depends on whether the supply of recycled plastic can expand to accommodate that shift. A stated objective of the tax was to directly increase the demand for recycled plastic by increasing the price of virgin plastic, which would then indirectly increase the quantity of plastic being recycled and subsequently the supply of recycled plastic available. The realisation of this effect is a key element of success for the tax.
Figure 4.10: Survey results for the question ‘What, if anything, is preventing your business from increasing recycled content in your plastic packaging?’.
Base: All businesses (1,011). Source: Ipsos.
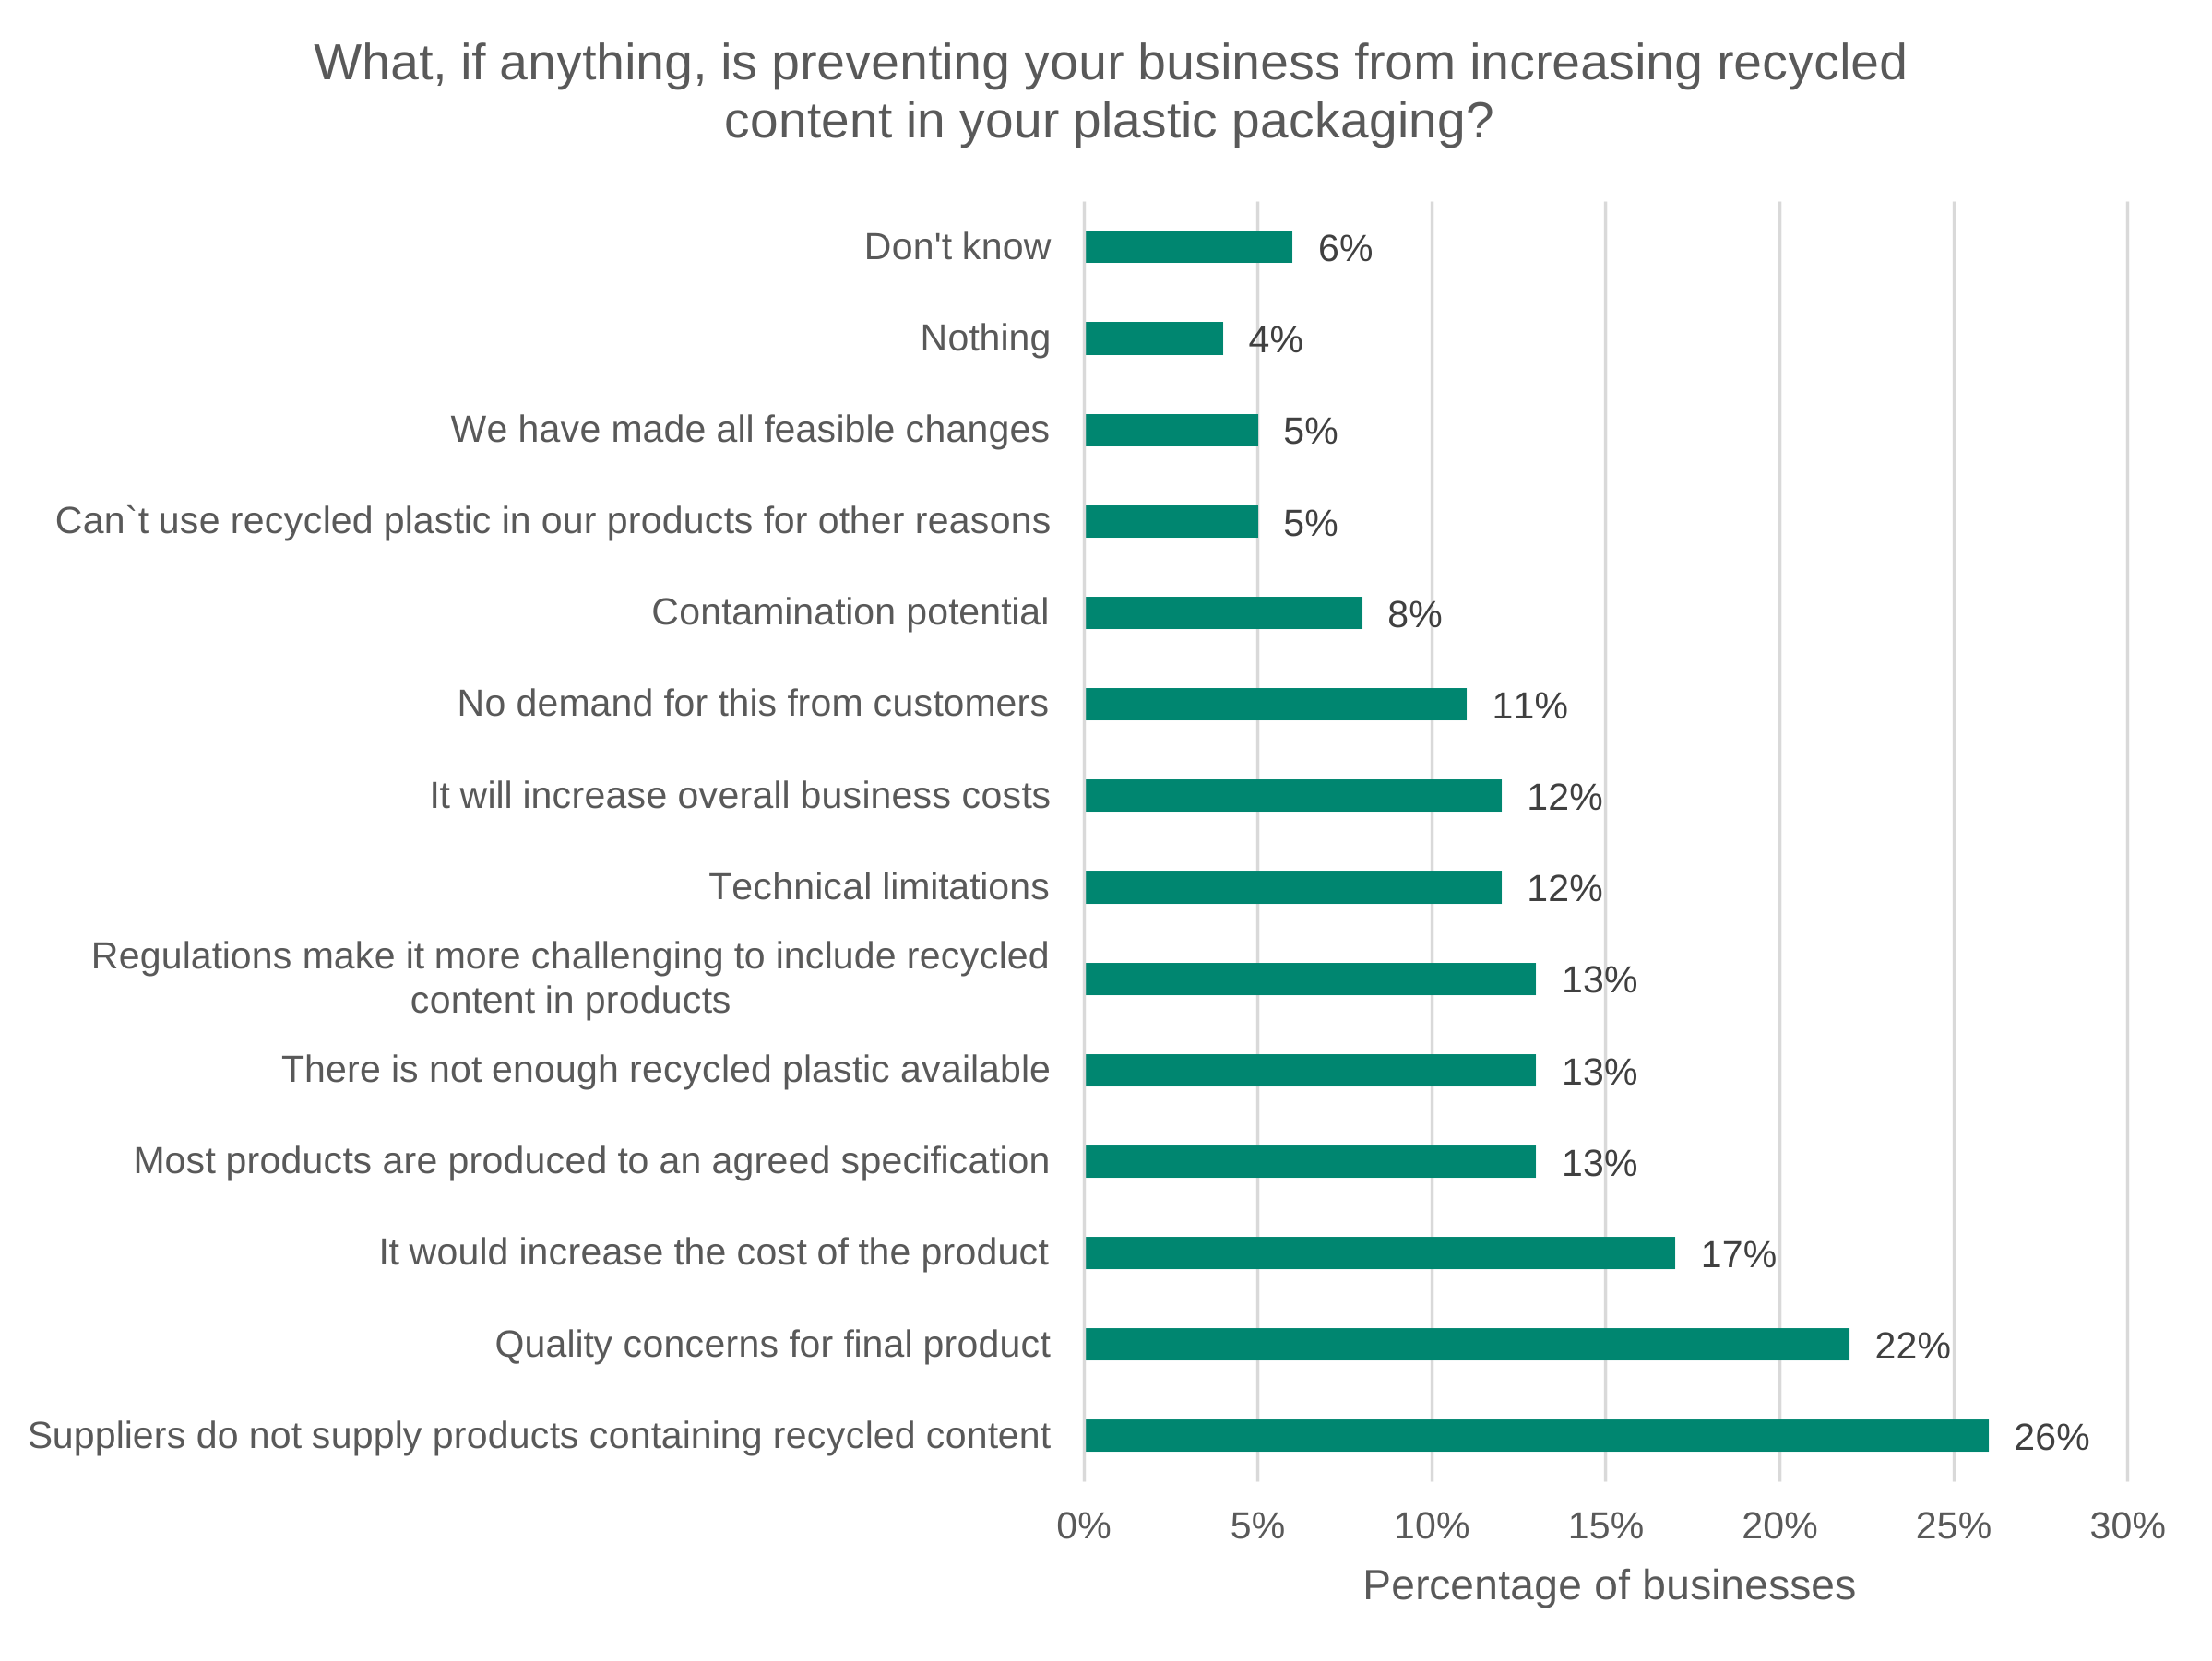
Data for Figure 4.10: Survey results for the question ‘What, if anything, is preventing your business from increasing recycled content in your plastic packaging?’.
Base: All businesses (1,011). Source: Ipsos.
| Category | Percentage of businesses |
|---|---|
| Don’t know | 6% |
| Nothing | 4% |
| We have made all feasible changes | 5% |
| Can`t use recycled plastic in our products for other reasons | 5% |
| Contamination potential | 8% |
| No demand for this from customers | 11% |
| It will increase overall business costs | 12% |
| Technical limitations | 12% |
| Regulations make it more challenging to include recycled content in products | 13% |
| There is not enough recycled plastic available | 13% |
| Most products are produced to an agreed specification | 13% |
| It would increase the cost of the product | 17% |
| Quality concerns for final product | 22% |
| Suppliers do not supply products containing recycled content | 26% |
The survey evidence in Figure 4.10 suggests that, for some firms, the ability to adjust is limited by upstream supply conditions, technical feasibility, and product requirements. Many of the most frequently cited barriers are supply-side in nature. The single most common response — ‘suppliers do not supply products containing recycled content’ (26%) — directly indicates a constraint at the point where firms may seek to substitute inputs. Moreover, ‘there is not enough recycled plastic available’ (13%) reinforces the idea that even where demand exists, it may not be matched by sufficient supply.
Alongside these supply constraints, firms also report quality and technical limitations, which further restrict substitution possibilities. For example, ‘quality concerns for final product’ (22%) and ‘technical limitations’ (12%) suggest that recycled material is not always a perfect substitute for virgin plastic. These constraints are particularly important in markets where packaging performs critical functions (for example, food safety, durability, or compliance with product standards). In such contexts, substitution is not simply a function of relative prices but also of whether recycled inputs meet operational and regulatory requirements. However, the government has stated that keeping packaging subject to these challenges in scope maintains the incentive for these businesses to find new ways to overcome these issues, recognising the negative environmental impact this packaging will still have.
A related set of responses highlights the role of product specifications and downstream requirements. The finding that ‘most products are produced to an agreed specification’ (13%) indicates that firms may be constrained by contractual arrangements or customer-defined standards, which limit scope for design changes. Similarly, ‘no demand for this from customers’ (11%) points to weak or absent pull factors from final consumers, suggesting that firms adopt aligned incentives relative to the demands of their customer base, rather than take the lead on their own sustainability. These features imply that behavioural change often requires consistency across multiple actors, rather than a simple firm-level response to a price signal.
Cost-related barriers also feature in the reported answers. ‘It would increase the cost of the product’ (17%) and ‘it will increase overall business costs’ (12%) indicate that, even with the tax in place, substitution may remain privately costly. This is consistent with a situation in which recycled materials are either more expensive than virgin alternatives (due to limited supply or processing costs) or require additional investment (for example, redesign, retooling, or certification). In such cases, the tax may be too low to fully offset these cost differentials, particularly in the short run.
A non-trivial share of firms reported having already exhausted feasible options, with ‘we have made all feasible changes’ (5%). While smaller in magnitude, this group is analytically important as it suggests that, for some firms, demand-side incentives have already been acted upon, and remaining sustainability improvements are constrained by structural or technological factors. This aligns with there being variation in ability to respond to the tax, further explored in Chapter 5.
Finally, the qualitative report identified a similar range of challenges when trying to improve the sustainability of packaging. An additional concern was the limited control over overseas suppliers. Some importers reported being reliant on supplier-provided information, with limited ability to verify or audit claims about recycled content. This created risks around the credibility of reported figures and potential market distortion if some suppliers misreport. Some businesses also noted that they are often ‘at the mercy’ of available supply, constraining their ability to respond to policy changes. This reliance may also increase exposure to lower-quality materials or non-compliant products.
Figure 4.11: Survey results for the question ‘Has your business made any of the following changes due to Plastic Packaging Tax?’.
Base: All businesses (1,011). Source: Ipsos.
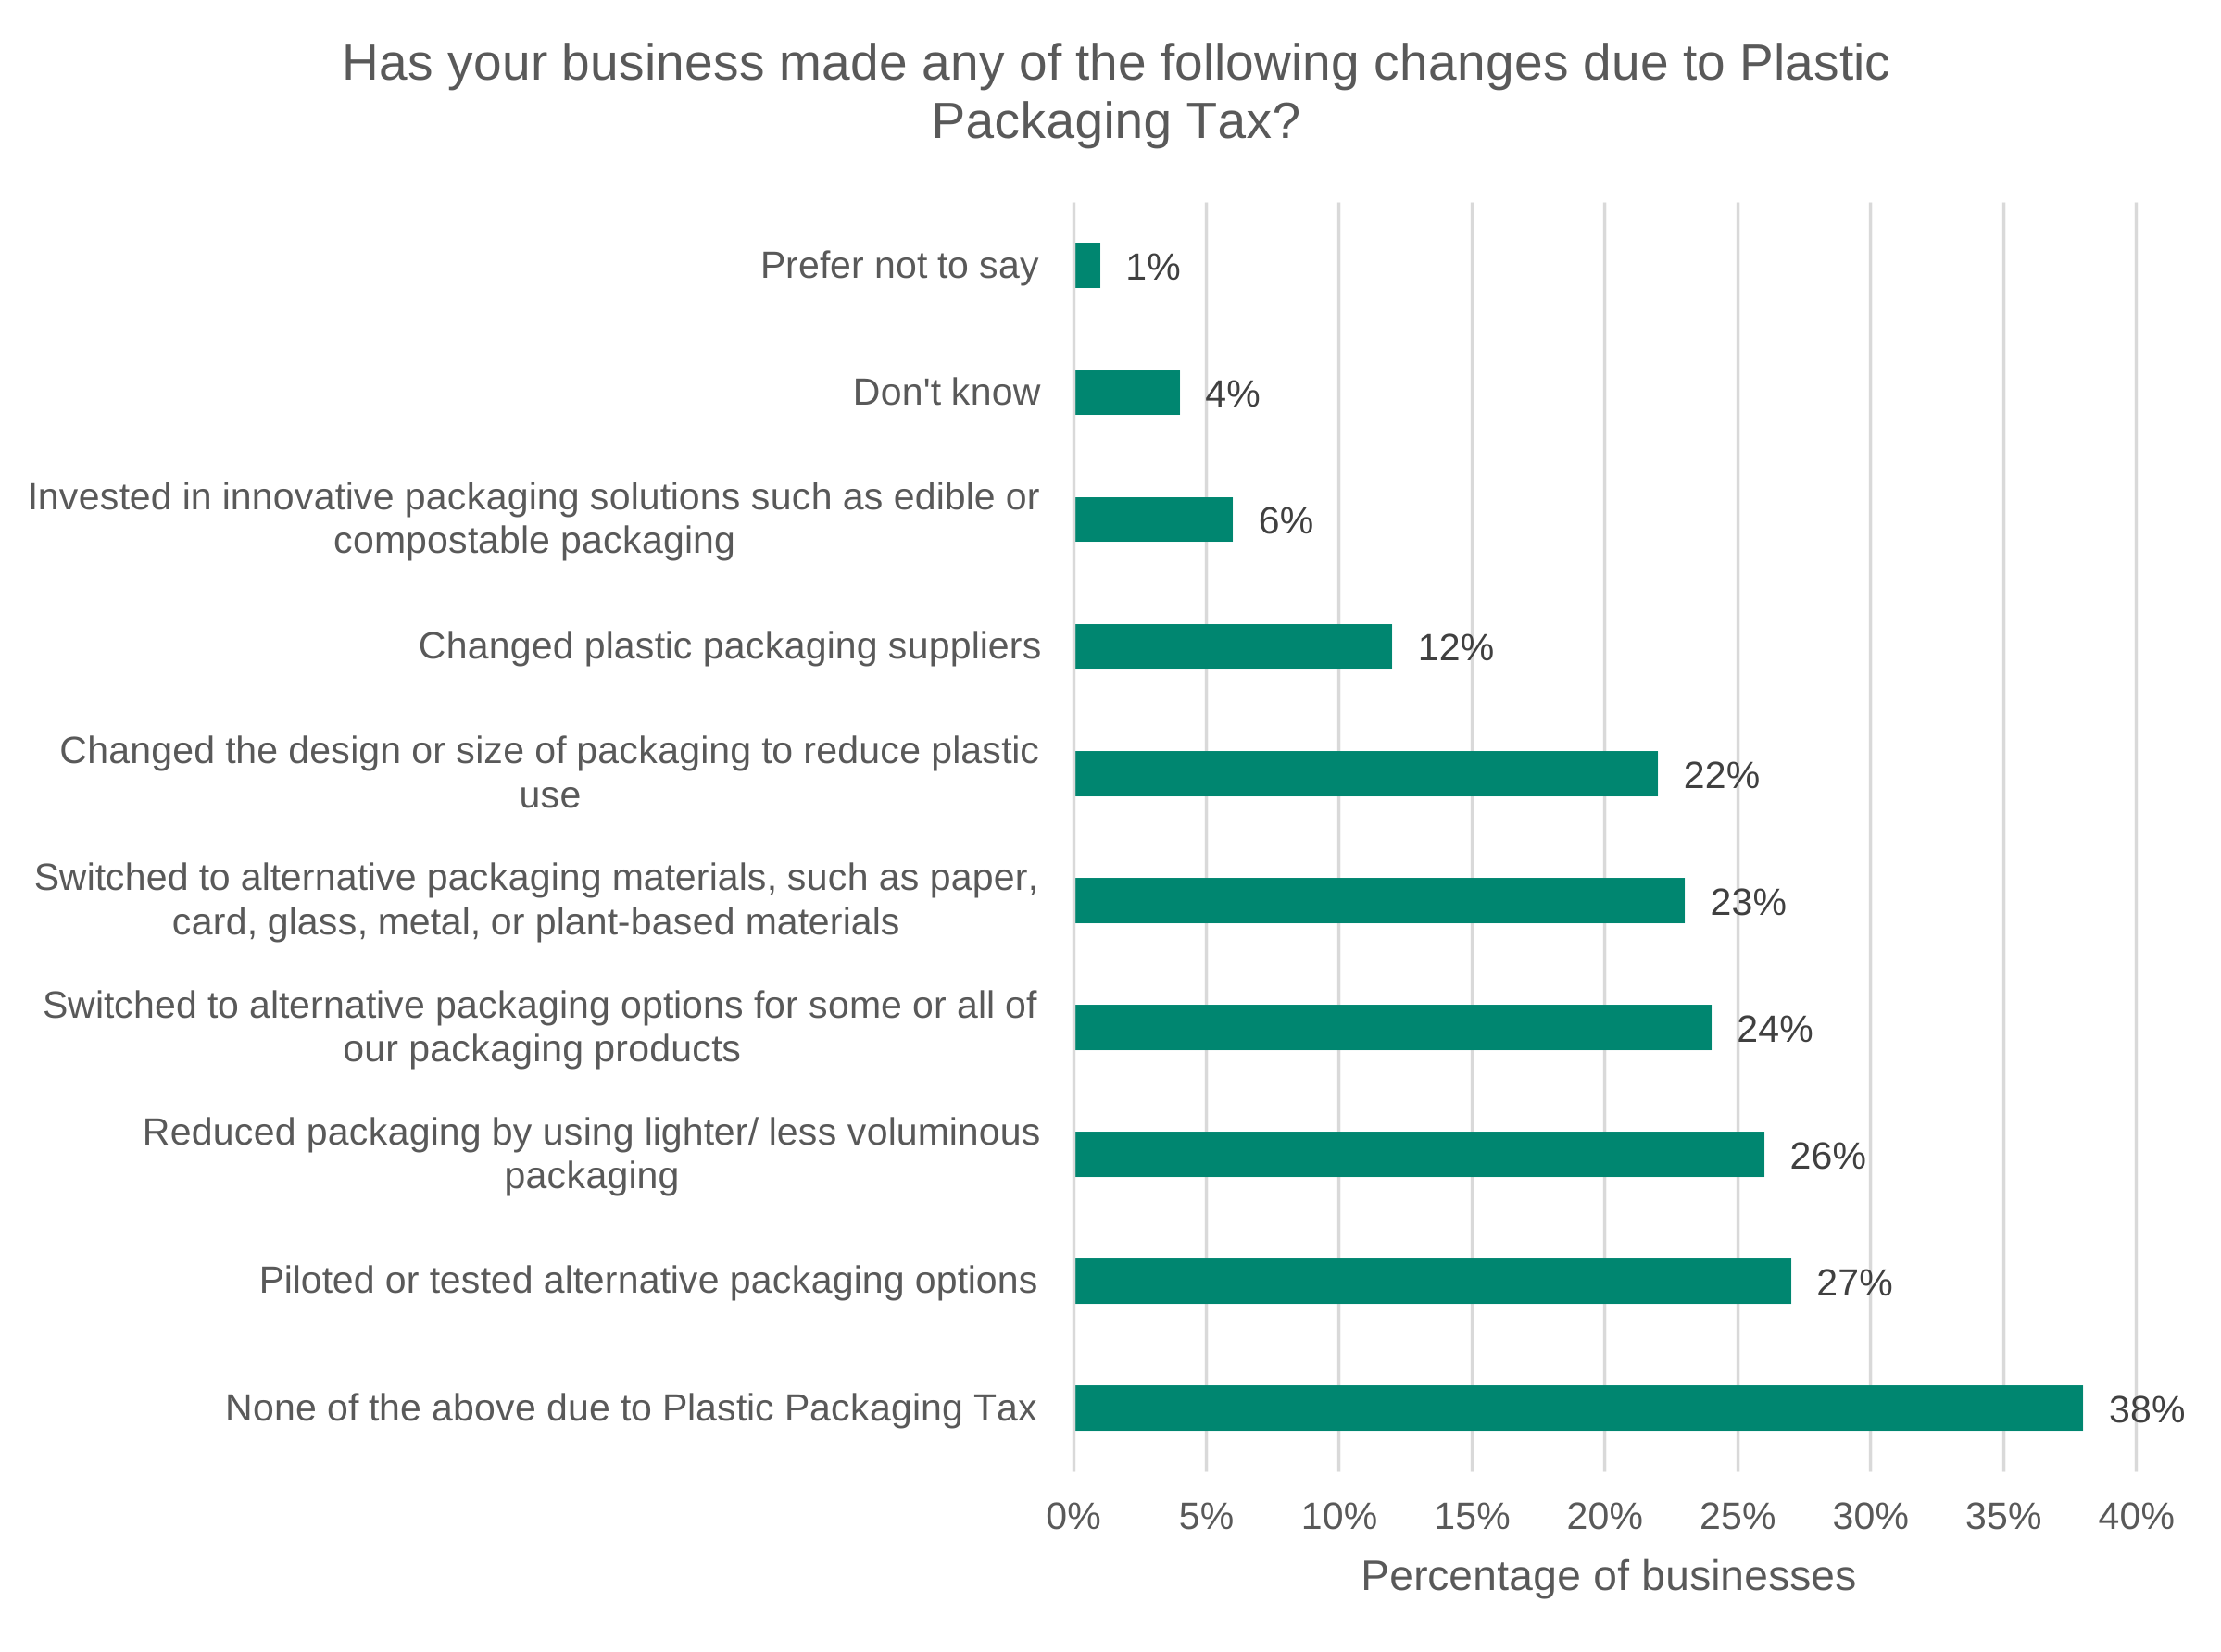
Data for Figure 4.11: Survey results for the question ‘Has your business made any of the following changes due to Plastic Packaging Tax?’.
Base: All businesses (1,011). Source: Ipsos.
| Category | Percentage of businesses |
|---|---|
| Prefer not to say | 1% |
| Don’t know | 4% |
| Invested in innovative packaging solutions such as edible or compostable packaging | 6% |
| Changed plastic packaging suppliers | 12% |
| Changed the design or size of packaging to reduce plastic use | 22% |
| Switched to alternative packaging materials, such as paper, card, glass, metal, or plant-based materials | 23% |
| Switched to alternative packaging options for some or all of our packaging products | 24% |
| Reduced packaging by using lighter/ less voluminous packaging | 26% |
| Piloted or tested alternative packaging options | 27% |
| None of the above due to Plastic Packaging Tax | 38% |
The pattern of constraints identified above is reflected in the types of behavioural responses that firms report having made. Figure 4.11 shows that, while a majority of businesses report undertaking some form of change in response to the tax, these adjustments are unevenly distributed across different margins. The response categories are not mutually exclusive, and businesses could report multiple types of adjustment. However, the finding that adjustments are unevenly distributed is supported by the fact that 38% of businesses selected ‘none of the above’, indicating that a substantial minority reported making no changes in response to the tax.
Notably, a substantial share of firms reported changes that reduced overall plastic use or substituted away from plastic altogether. For example, 26% report reducing packaging through lighter or less voluminous designs, 24% report switching to alternative packaging options for some or all products, and 23% report switching to alternative materials such as paper, glass, or metal. 27% indicate that they have piloted or tested alternative packaging solutions.
This broader pattern of responses is consistent with the supply and technical constraints shown in Figure 4.10, which limit firms’ ability to switch to recycled plastic. Where recycled inputs are unavailable, do not meet quality requirements, or require significant adjustment costs, firms appear more likely to respond along other margins that are less constrained.
More broadly, the distribution of responses highlights that a subset of firms are not passive in the presence of the tax but instead adapt along the set of feasible options available to them. In practice, this means that behavioural change may occur through a combination of material substitution, packaging redesign, and innovation, rather than through increased recycled content alone. While these responses may still lead to reductions in virgin plastic use, they do not always operate through the indirect supply-chain mechanism envisaged in the original policy rationale.
Finally, it is notable that a sizeable proportion of firms (38%) reported that none of the listed changes had been made due to the tax. Moreover, around 28% of businesses made none of the changes listed as well as reported making no change in recycled content and no change in overall plastic packaging used. This finding suggests that businesses face differing circumstances in responding to the tax and supports the interpretation that responsiveness may vary across businesses. While some businesses appear to have made substantial adjustments, the incentive imposed by the tax may not be strong enough to encourage widespread positive change and other businesses may also face factors that limit or delay their ability to respond to the tax.
Figures 4.10 and 4.11 suggest that both the extent and the nature of behavioural change are jointly determined by the interaction between demand-side incentives and supply-side feasibility. Moreover, the responses are consistent with an inelastic (or constrained) short-run supply of recycled material, limiting the extent to which targeting demand in recycled content — induced by the tax — can translate into higher recycled content.
4.5 Interpretation and conclusions
The evidence presented in this chapter provides a consistent but nuanced picture of behavioural change following the introduction of the PPT. The administrative data and social research suggest that PPT has contributed to increases in the proportion of plastic packaging meeting the 30% recycled content threshold, but that these changes have been modest in scale, unevenly distributed, and concentrated among a subset of businesses.
A key finding is that the most substantial changes appear to have occurred early in the life of the tax. This pattern is consistent with behavioural responses to a threshold-based tax design, where firms make relatively low-cost adjustments to meet the threshold, after which further change slows as remaining firms face higher costs or constraints. Qualitative evidence reinforces this interpretation, indicating that PPT often acted to accelerate or formalise pre-existing intentions, rather than generating entirely new behavioural change. At the aggregate level, increases in recycled-content packaging should therefore be interpreted as driven by targeted adjustments among the responsive firms, rather than a broad-based shift across the tax base. This is reflected in the finding that a majority of businesses have not materially changed their packaging composition, with many remaining consistently below the threshold over time. Where changes have occurred, they have typically been incremental, with most firms reporting relatively small increases in recycled content.
Compared to recycled content, the evidence suggests that changes in overall plastic use have been more limited and variable. Administrative data shows a reduction in total plastic packaging over the evaluation period, although the trend is not consistently downward from year-to-year. Survey evidence indicates that most businesses report no change in the tonnage of plastic they handle, with reductions confined to a minority. In Chapter 7, however, there is evidence of a step change in the amount of plastic packaging waste occurring in line with the introduction of PPT. Where reductions are observed, they tend to be small in magnitude and linked to broader packaging or sustainability strategies, rather than a direct and uniform response to the tax.
A further insight from the chapter is that the effectiveness of PPT is somewhat mediated by supply-side, technical, and commercial constraints. While the tax operates as a demand-side incentive, for some firms the ability to respond is shaped by the availability and suitability of recycled materials, as well as product requirements and customer expectations. The most commonly reported barriers — limited supply of recycled-content products, quality concerns, and technical limitations — indicate that recycled plastic is not always a close substitute for virgin material in practice.
In addition, downstream constraints, such as fixed product specifications and weak customer demand for recycled content, further limit incentives for firms to adjust. These findings highlight that behavioural change is often not solely a firm-level decision on sustainability, but depends on alignment across supply chains, including suppliers, customers, and regulatory requirements. This is particularly relevant in sectors where packaging performance is tightly specified or regulated.
The interaction of these constraints helps explain why firms frequently respond to PPT along margins other than increasing recycled content. Reported alternative behaviours such as reducing packaging, switching materials, or redesigning products are common alongside increasing recycled content. This suggests that, in practice, firms respond by optimising within their feasible set of options, rather than strictly following the intended policy mechanism. While these alternative responses may still contribute to reducing virgin plastic use, they imply that the causal pathway through which PPT operates is broader and less direct than originally envisaged.
More broadly, the findings point to substantial variation in responsiveness across the tax base. A minority of firms appear relatively responsive, having made adjustments to recycled content or packaging design, while a sizeable proportion report no change, often reflecting lack of incentive or structural or operational constraints. This variation is consistent with economic theory, where differences in adjustment costs, supply conditions, and production processes result in variation in responsiveness to a common price signal. However, this may also enhance the efficiency of the tax as a policy instrument relative to prescriptive regulation, as firms that can reduce their tax liability at lower cost are incentivised to adjust their behaviour, while those facing higher adjustment costs can continue their activities and pay the tax instead. Variation in responses is explored in Chapter 5.
Finally, it is important to note several key evaluation limitations. A known limitation is the absence of comparable pre-policy baseline data. Economic theory suggests that a threshold-based tax such as PPT creates a strong incentive for businesses to make a one-off adjustment to packaging composition around the point of implementation, moving products above the recycled content threshold to avoid the tax. Without data on packaging composition before the tax was introduced, it is not possible to directly measure the scale of this initial response or to robustly estimate what would have happened in the absence of the policy.
Additionally, administrative data does not record the precise recycled content of packaging, instead only identifying whether packaging is above or below the 30% recycled content threshold. While this still allows the evaluation to observe the key behavioural response that the tax was designed to encourage, namely businesses reformulating packaging from below 30% recycled content to above the threshold, it is not possible to assess the magnitude of those changes. In addition, the reliance on self-reported survey evidence means that causal attribution cannot be established definitively, and some of the observed changes may also reflect wider market developments or the influence of other environmental policies operating alongside PPT.
The combined evidence suggests that PPT has had a moderately positive but constrained impact on its primary objectives of increasing recycled content in plastic packaging and reducing plastic used in packaging — addressing EQ1 and EQ2. The tax has succeeded in generating behavioural change among a subset of businesses, particularly in the early stages of implementation, but its overall effectiveness is limited by supply-side frictions, technical feasibility, and market structure. At the same time, some businesses reported that paying the tax remained less costly than increasing recycled content, suggesting that the incentive effects of the tax vary across firms and that there may be scope to strengthen the behavioural response through a higher tax rate, subject to wider policy objectives and economic considerations.
Chapter 5: How the use of recycled and virgin plastic packaging varies across businesses
5.1 Introduction
This chapter addresses the evaluation questions:
EQ1:
How has the proportion of plastic packaging containing at least 30% recycled plastic (domestic or imported) changed over time?
EQ2:
To what extent have businesses changed the proportion of plastic (both virgin and recycled) in their plastic packaging?
This chapter builds on the findings from Chapter 4 and examines whether changes in recycled plastic use vary systematically across businesses, according to identifiable characteristics such as business activity, types of plastic used, business size, and the presence of wider commitments or strategies to reduce plastic use.
Assessing differences in business behaviour is important when evaluating PPT because the tax applies to a diverse range of firms and sectors. Although the tax is set uniformly in legislative terms, businesses differ markedly in their size, supply‑chain position, sectoral context, production technologies, customer base and degree of control over packaging decisions. These differences shape both exposure to the tax and the capacity to respond to its price signal. Examining aggregate effects alone therefore risks obscuring important variation in how the policy operates in practice, including where behavioural change is more feasible and where responses are constrained. Analysing variation helps to distinguish between outcomes driven by the strength of the incentive itself and those driven by structural or market constraints and is essential for understanding the channels through which PPT affects behaviour, the limits of further change, and the implications for future policy design.
These findings are based on qualitative and quantitative research commissioned by HMRC, administrative data, and additional data sources.
5.2 Key findings
Key Finding 5.1:
Manufacturers have self-reported being more responsive to PPT on average, with higher reported increases in recycled content and reduction in overall plastic usage, reflecting comparatively greater control over production processes — but still facing binding demand-side constraints (for example, customer specifications, quality requirements) that can limit the extent of change.
Key Finding 5.2:
Importers have self-reported being less responsive on average, with persistently lower recycled content and fewer reported increases, reflecting stronger structural constraints — particularly reliance on upstream suppliers and limited ability to influence packaging specifications — meaning behavioural change is more dependent on developments in global supply chains than direct firm-level decisions.
Key Finding 5.3:
Self-reported behavioural responses to PPT show limited variation in overall plastic use by polymer types but clear, systematic differences in how businesses adjust the recycled content. High-Density and Low-Density Polyethylene (HDPE and LDPE) users are more likely to make larger step changes, Polystyrene (PS) users more likely to make smaller increases, and Polypropylene (PP)/Polyethylene Terephthalate (PET) showing more modest, lower-magnitude changes — patterns that align with differences in reported supply constraints, cost pressures, and customer demand across materials.
Key Finding 5.4:
UK Plastic Pact (UKPP) members consistently achieved higher rates of packaging achieving the 30% recycled content threshold than non-members. Their performance suggests that, while genuine barriers to increasing recycled content exist, these constraints are not necessarily insurmountable and that behavioural responses to PPT are also influenced by business priorities and environmental commitments.
Key Finding 5.5:
There is limited evidence that packaging product type significantly drives changes in recycled content, with most variation reported appearing modest and inconsistent; where differences do emerge, these are often linked to underlying material composition rather than product type in isolation.
Key Finding 5.6:
Behavioural responses did not differ substantially across sectors. Where differences were observed, they appeared to be more closely related to businesses’ position in the supply chain than to sector classification itself, with plastic packaging producers reporting larger increases in recycled content than other businesses.
Key Finding 5.7:
Businesses handling larger volumes of plastic packaging were consistently more likely to manufacture or import packaging meeting the 30% recycled content threshold than smaller packaging handlers. This relationship has remained broadly stable over time, suggesting a consistent association between packaging volume and recycled content outcomes.
Key Finding 5.8:
Business location and international footprint also appeared to influence responses to PPT. Businesses headquartered in the UK, and those without overseas manufacturing sites supplying the UK market, were more likely to report substantial increases in recycled content, suggesting that operational and supply-chain structures may affect the ability of businesses to respond to the incentives created by the tax.
5.3 Analytical approach
This chapter builds on the findings of Chapter 4 and uses PPT returns data, survey evidence and WRAP data to examine whether recycled-content outcomes differ across groups of businesses. Findings are descriptive and should not be interpreted as definitive causal estimates of the impact of PPT. Further supporting analysis is covered in Annex C.
5.4 Supporting evidence
5.4.1 Importers vs Manufacturers
Although PPT applies equally to plastic packaging manufactured in the UK and plastic packaging imported into the UK, businesses do not necessarily have the same ability to respond to the incentives created by the tax. Manufacturers typically have greater control over packaging design, material selection and production processes, while importers may be more reliant on upstream suppliers and pre-existing packaging specifications. As a result, the ability to increase recycled content or reduce plastic packaging may differ systematically across these groups. Further detail on the analysis and statistical testing for this section is provided in Annex C.
Importer-only businesses make up around 82% of the tax base on average, and their plastic packaging makes up an average of 42% of plastic packaging in scope of the tax. Manufacturer-only businesses make up approximately only 9% of businesses, covering only 16% of plastic packaging. Businesses that do both activities make up the remaining share, at an average of 9% of the tax base, covering an average of 42% of plastic packaging.
Figure 5.1 shows that throughout the evaluation period, businesses that both manufacture and import plastic packaging reported the highest share of packaging above the threshold, increasing from 57.8% in financial year 2022 to 2023 to 70.4% in financial year 2025 to 2026. In contrast, importer-only businesses consistently reported the lowest share, increasing from 37.7% to 44.6% over the same period. Manufacturer-only businesses fell between these groups, with the proportion of packaging above the threshold increasing from 45.5% to 59.7%.
Figure 5.1: Proportion of total reported plastic packaging above the 30% recycled content threshold, by business type.
Business type: manufacturer only, importer only, or businesses that both manufacture and import. Source: HMRC.
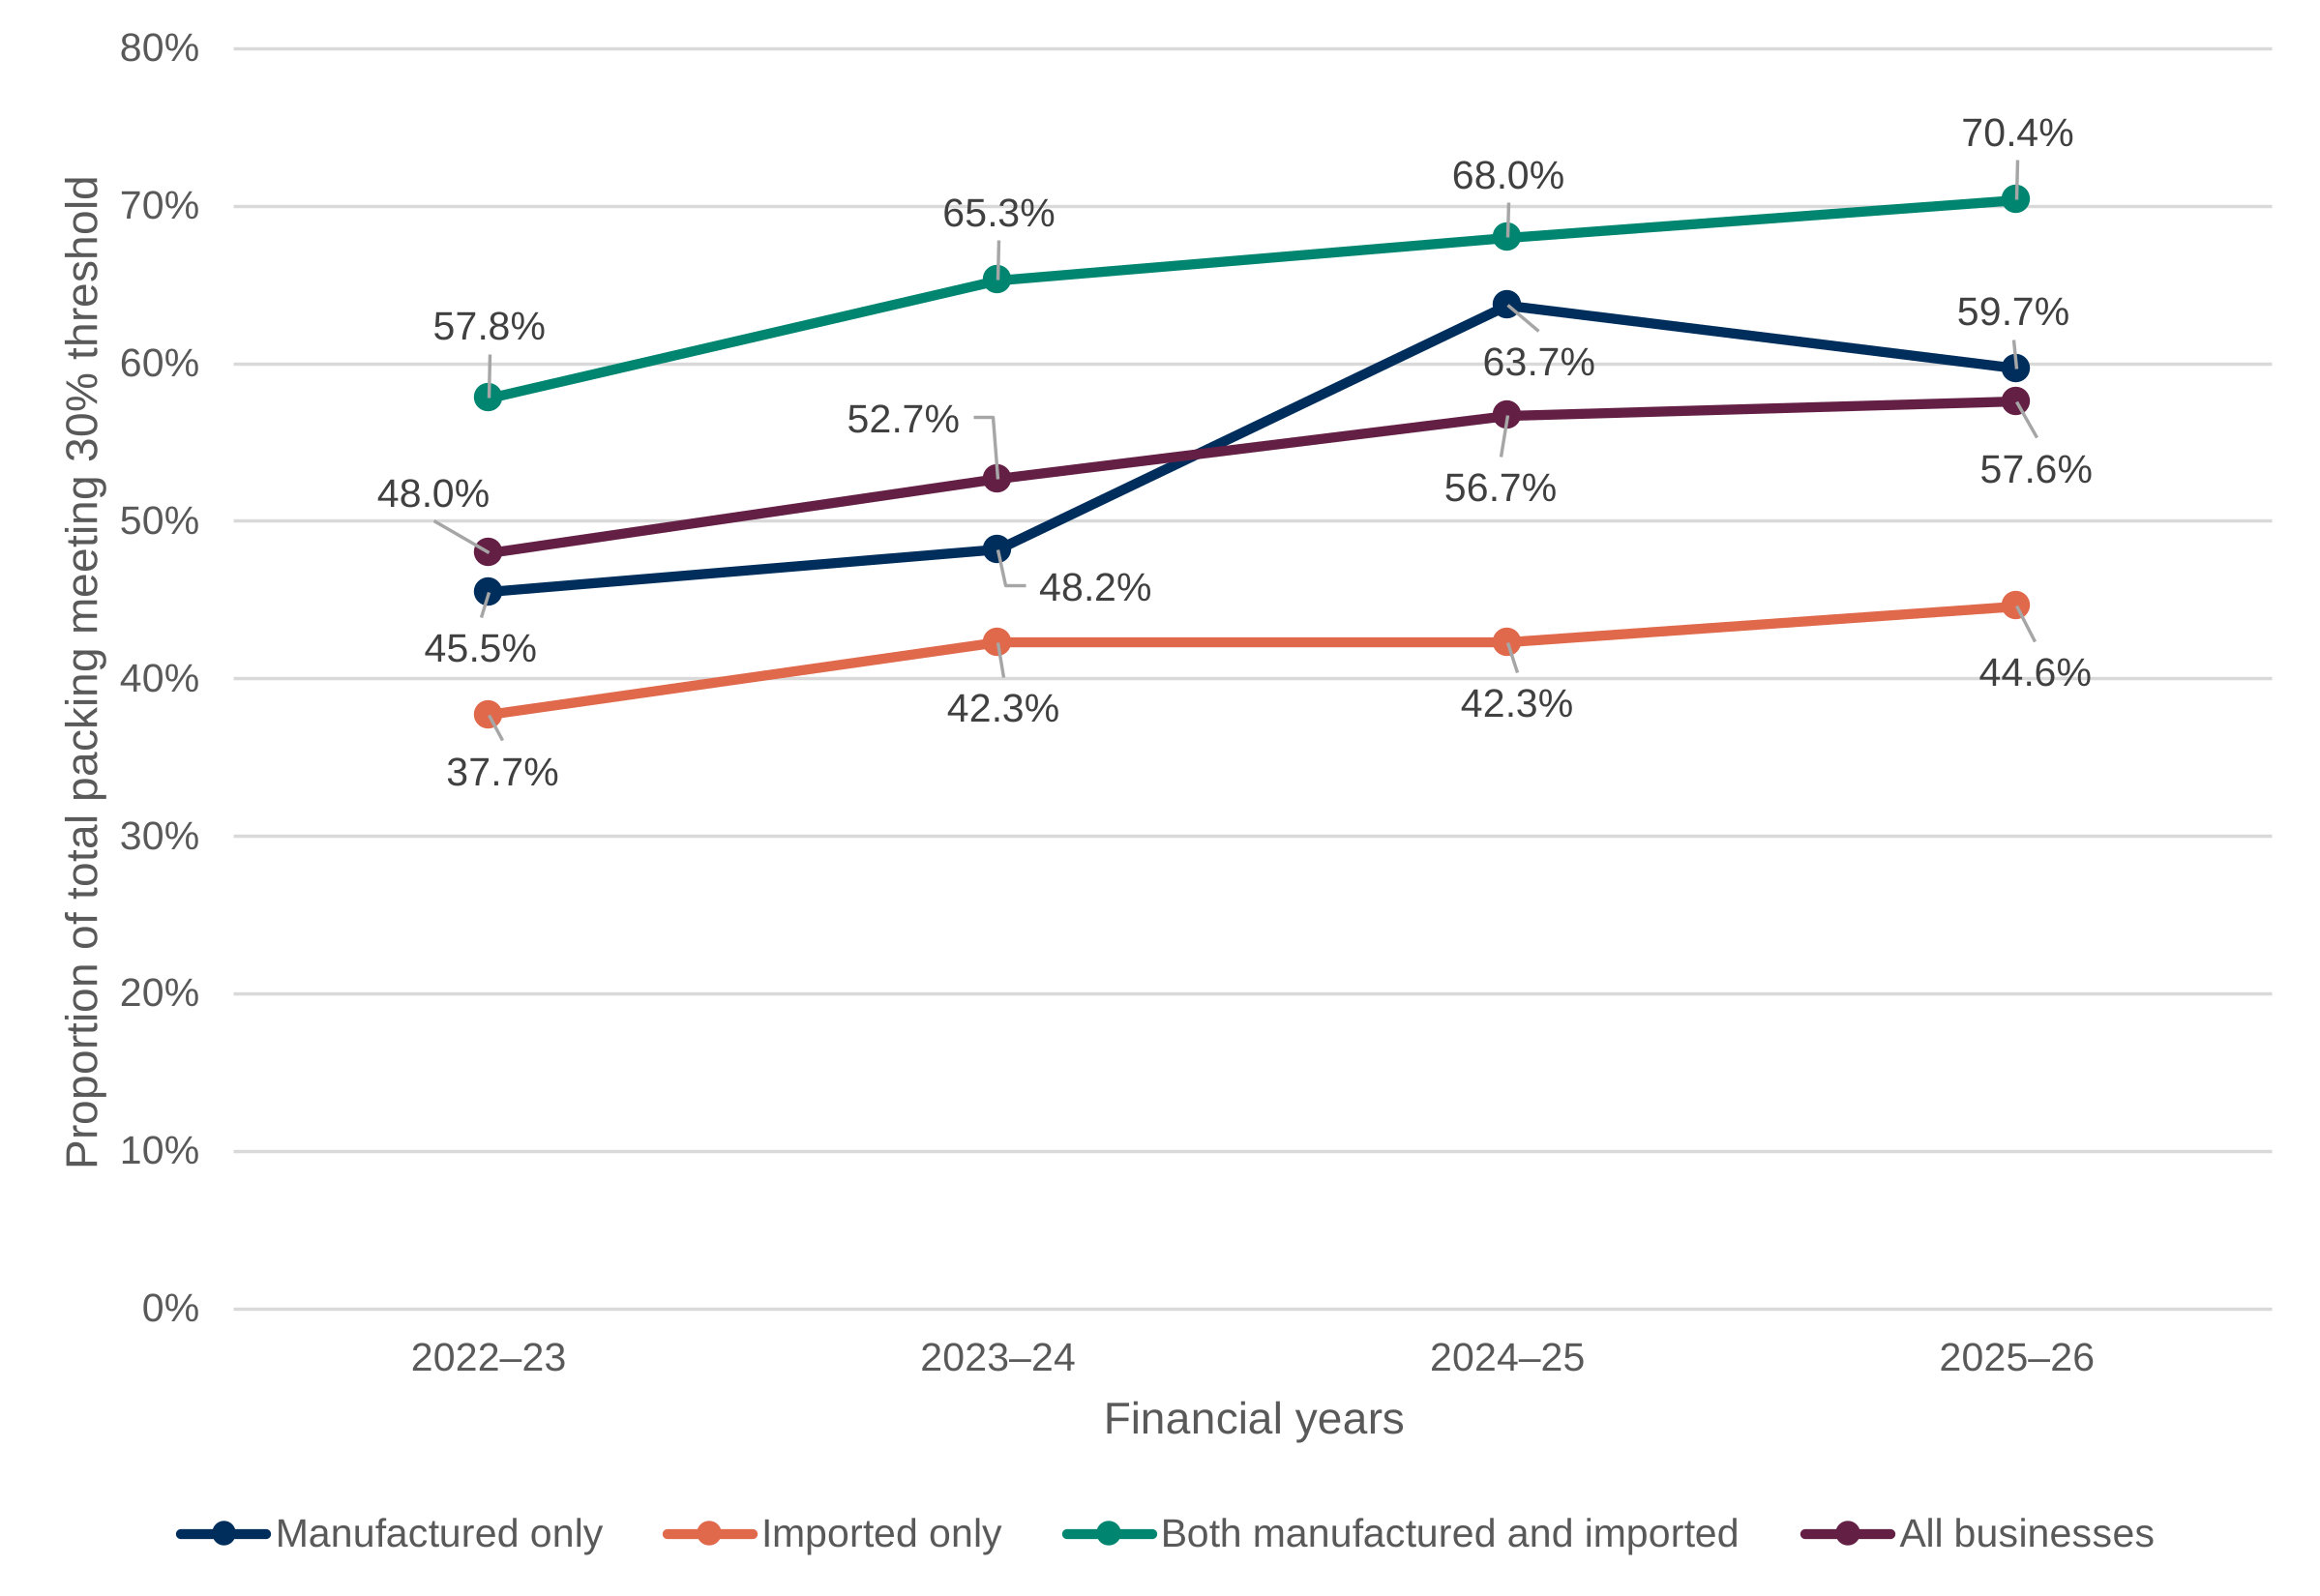
Data for Figure 5.1: Proportion of total reported plastic packaging above the 30% recycled content threshold, by business type.
Business type: manufacturer only, importer only, or businesses that both manufacture and import. Source: HMRC.
| Financial years | Manufactured only | Imported only | Both manufactured and imported | All businesses |
|---|---|---|---|---|
| 2022–23 | 45.5% | 37.7% | 57.8% | 48.0% |
| 2023–24 | 48.2% | 42.3% | 65.3% | 52.7% |
| 2024–25 | 63.7% | 42.3% | 68.0% | 56.7% |
| 2025–26 | 59.7% | 44.6% | 70.4% | 57.6% |
While all business groups showed an increase in the proportion of packaging above the threshold, the distribution of this progress was uneven. Although the total proportion and the average proportion of packaging above the threshold increased across businesses in these categories, the median importer continued to report no packaging above the threshold throughout the evaluation period (shown in Table C.1). This suggests that improvements amongst importers were concentrated amongst a subset of businesses, particularly those reporting larger packaging volumes, rather than being evenly distributed across the importer population. Statistical testing confirms that the differences between businesses that undertake any level of manufacturing and those that import only are significant and are primarily driven by these lower recycled-content outcomes observed amongst importers only (outlined in Section C.2.1 in Annex C).
Survey evidence is consistent with these findings. Manufacturers were more likely than importers to report increases in the proportion of recycled content used in plastic packaging (Figure 5.2). Around 47% of manufacturers reported an increase in recycled content, compared with 28% of importers, although the majority of businesses in all groups reported that recycled content had remained unchanged.
Figure 5.2: Survey results for the question ‘Has the proportion of recycled content in your plastic packaging changed due to Plastic Packaging Tax?’.
Base: Manufacturer (91 — note), Importer (816), Both (104). Source: Ipsos.
Note: Manufacturers only is a relatively small sample, so results should be taken with caution.
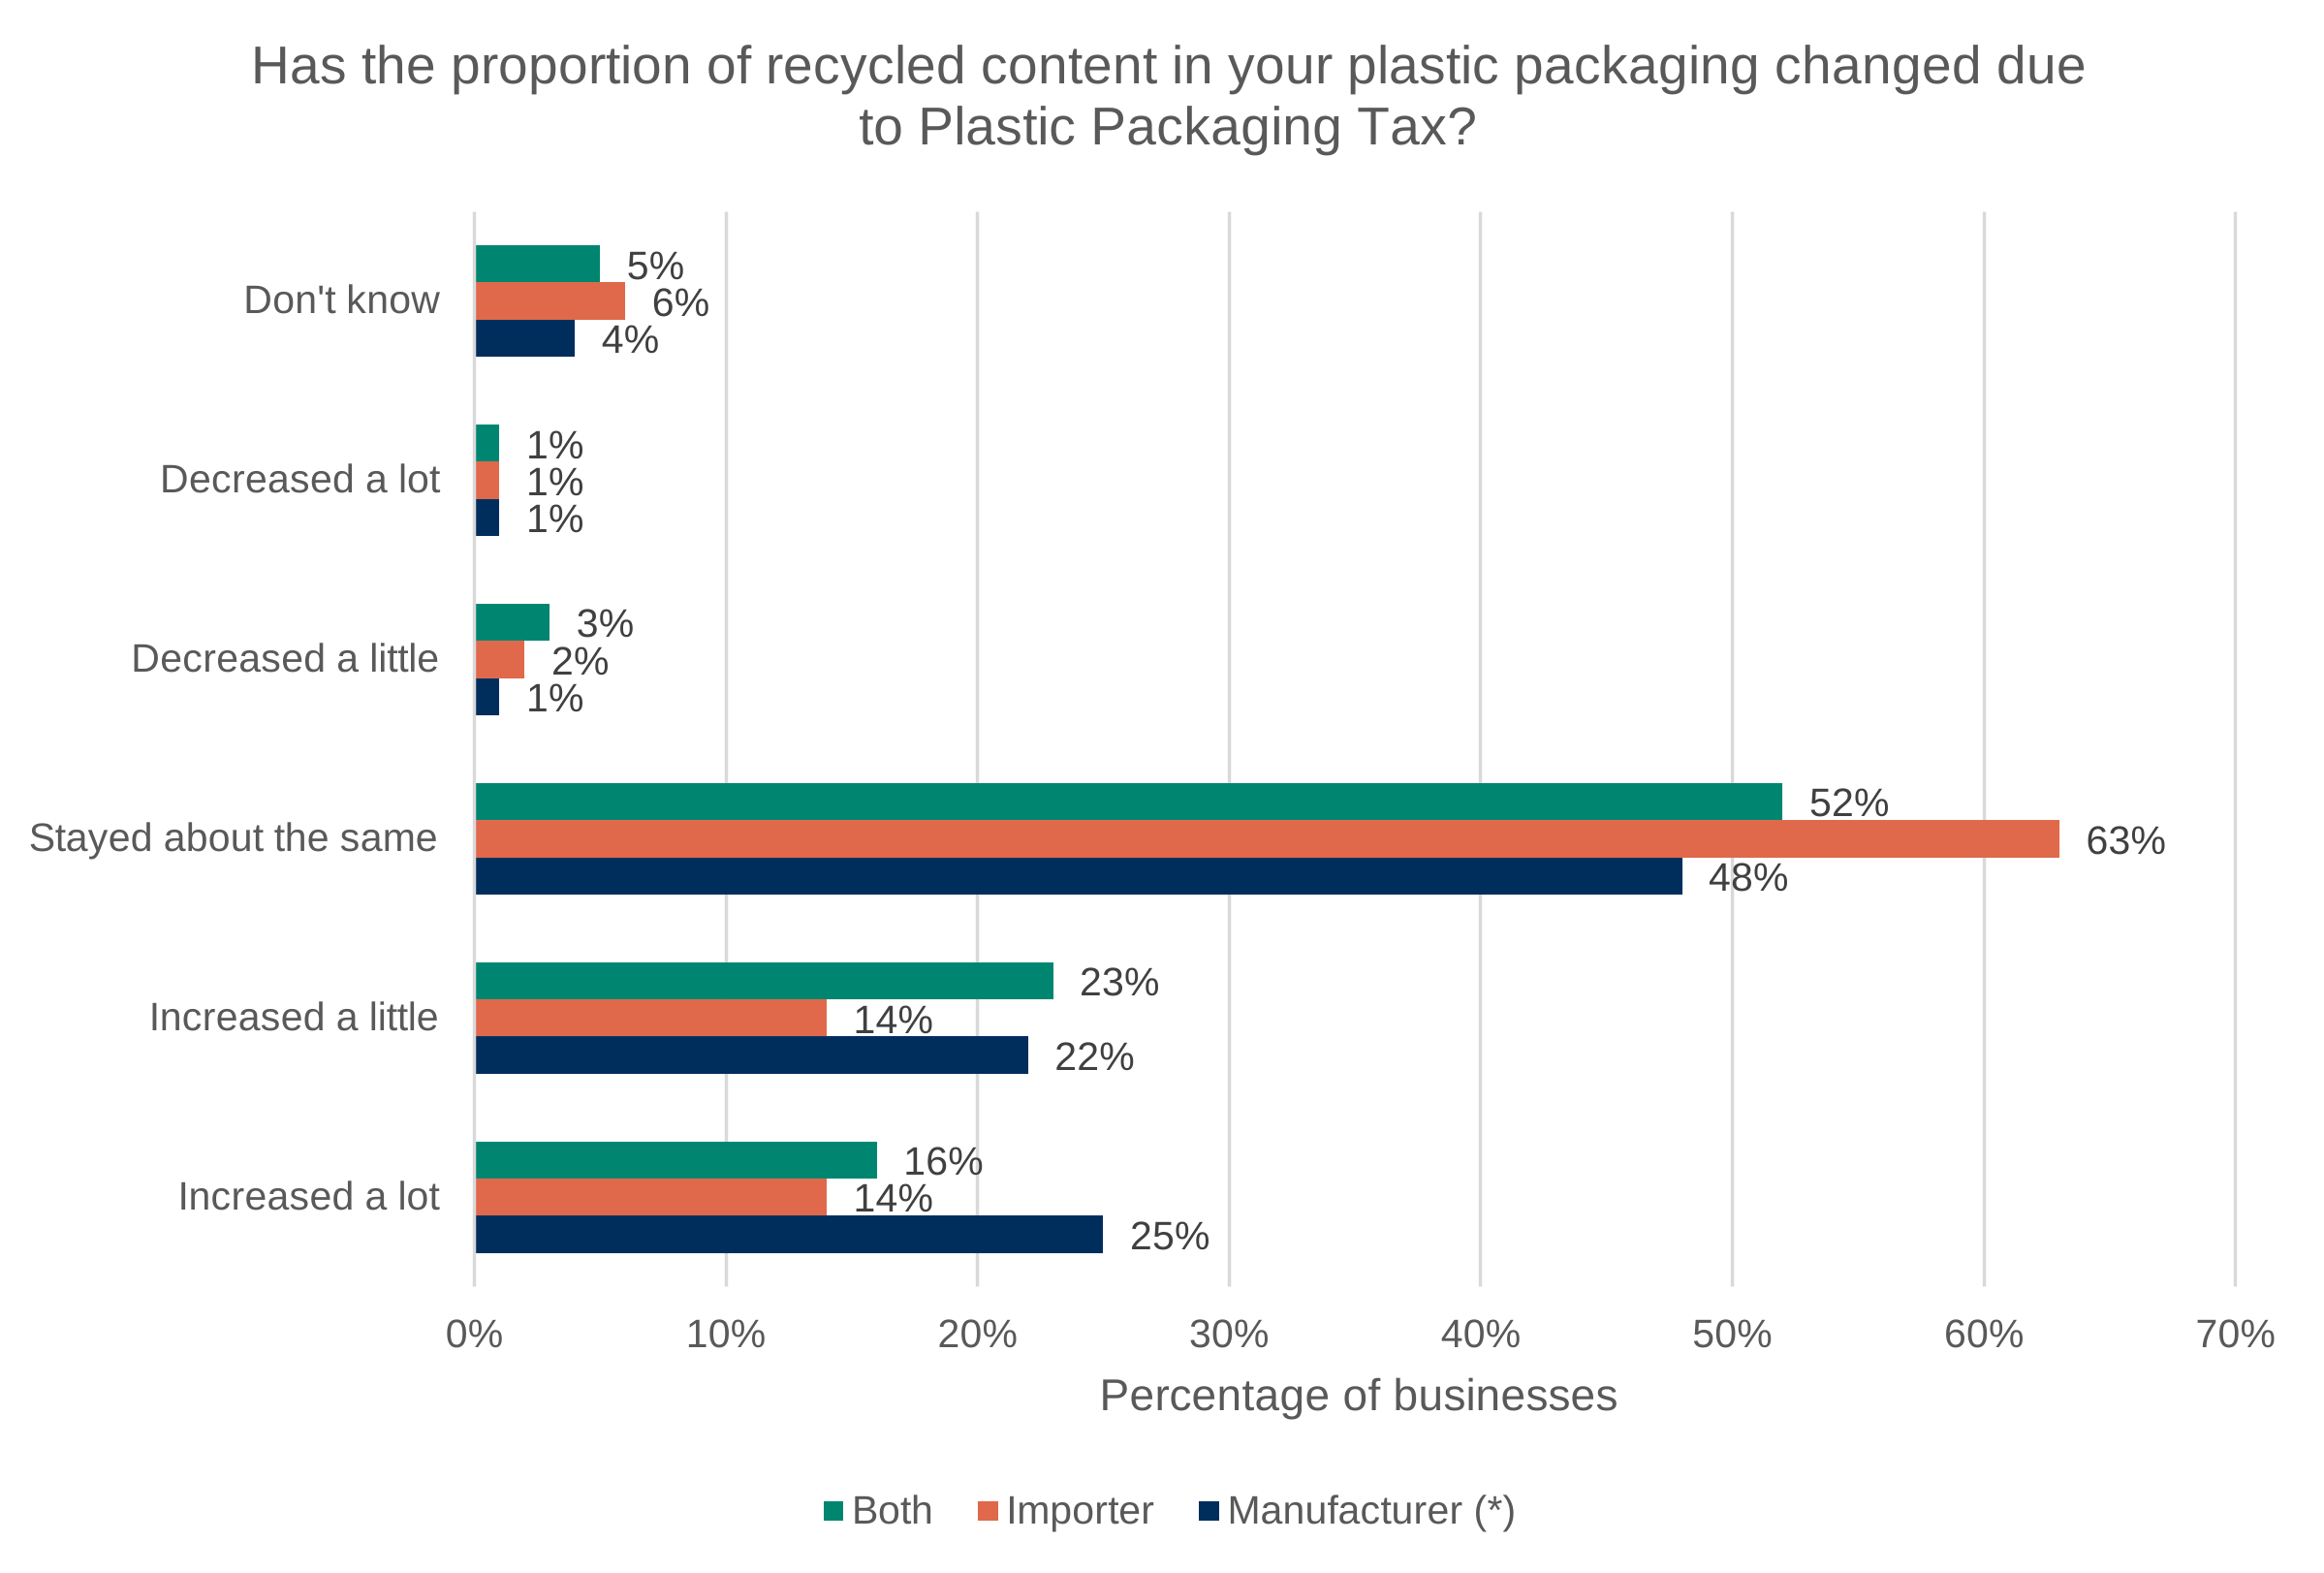
Data for Figure 5.2: Survey results for the question ‘Has the proportion of recycled content in your plastic packaging changed due to Plastic Packaging Tax?’.
Base: Manufacturer (91 — note), Importer (816), Both (104). Source: Ipsos.
Note: Manufacturers only is a relatively small sample, so results should be taken with caution.
| Category | Manufacturer | Importer | Both |
|---|---|---|---|
| Don’t know | 4% | 6% | 5% |
| Decreased a lot | 1% | 1% | 1% |
| Decreased a little | 1% | 2% | 3% |
| Stayed about the same | 48% | 63% | 52% |
| Increased a little | 22% | 14% | 23% |
| Increased a lot | 25% | 14% | 16% |
Survey evidence also suggests that importers and manufacturers may face different constraints when responding to PPT. Importers were more likely to report difficulties obtaining packaging containing recycled content from suppliers, while manufacturers more frequently cited quality considerations, customer requirements and product specifications.
Overall, the evidence suggests that behavioural responses to PPT have not been uniform across the tax base, based on whether businesses manufacture, import, or undertake both activities. Manufacturers and businesses that undertake both activities appear more likely than importers to report increases in recycled content, while importers continue to report lower levels of packaging meeting the 30% recycled content threshold. These findings suggest that a business’s position within the supply chain, and its level of influence over packaging decisions, may affect its ability and willingness to respond to the incentives created by PPT.
5.4.2 Variation by packaging type
Packaging products differ in their technical requirements, regulatory constraints and supply chains, which may affect businesses’ ability to increase recycled content or reduce plastic packaging use. This section examines whether behavioural responses to PPT differ across packaging product types. Further supporting analysis for this section can be found in Section C.2.2 in Annex C.
Survey respondents were asked to identify the types of plastic packaging they manufacture or import. The most commonly reported product categories were packaging films and other flexible packaging, lids, caps and closures, labels and tape, and bulk containers used for transporting and protecting goods. Analysis focuses on the most commonly reported product types for which sufficient sample sizes were available.
Figure 5.3 shows reported changes in recycled content by packaging product type.
Figure 5.3: Survey results for the question ‘Has the proportion of recycled content in your plastic packaging changed due to Plastic Packaging Tax?’.
The base for each product type was as follows: Bottles (160), Food pots, tubs, trays and cups (219), labels and tape (252), lids, caps and closures (261), medical packaging (69 — note), packaging films and other flexible packaging (537), plastic carrier bags or bin liners (131), and bulk containers for transporting and protecting products (237). Source: Ipsos.
Note: The sample for medical packaging is small, and results should be interpreted with caution.
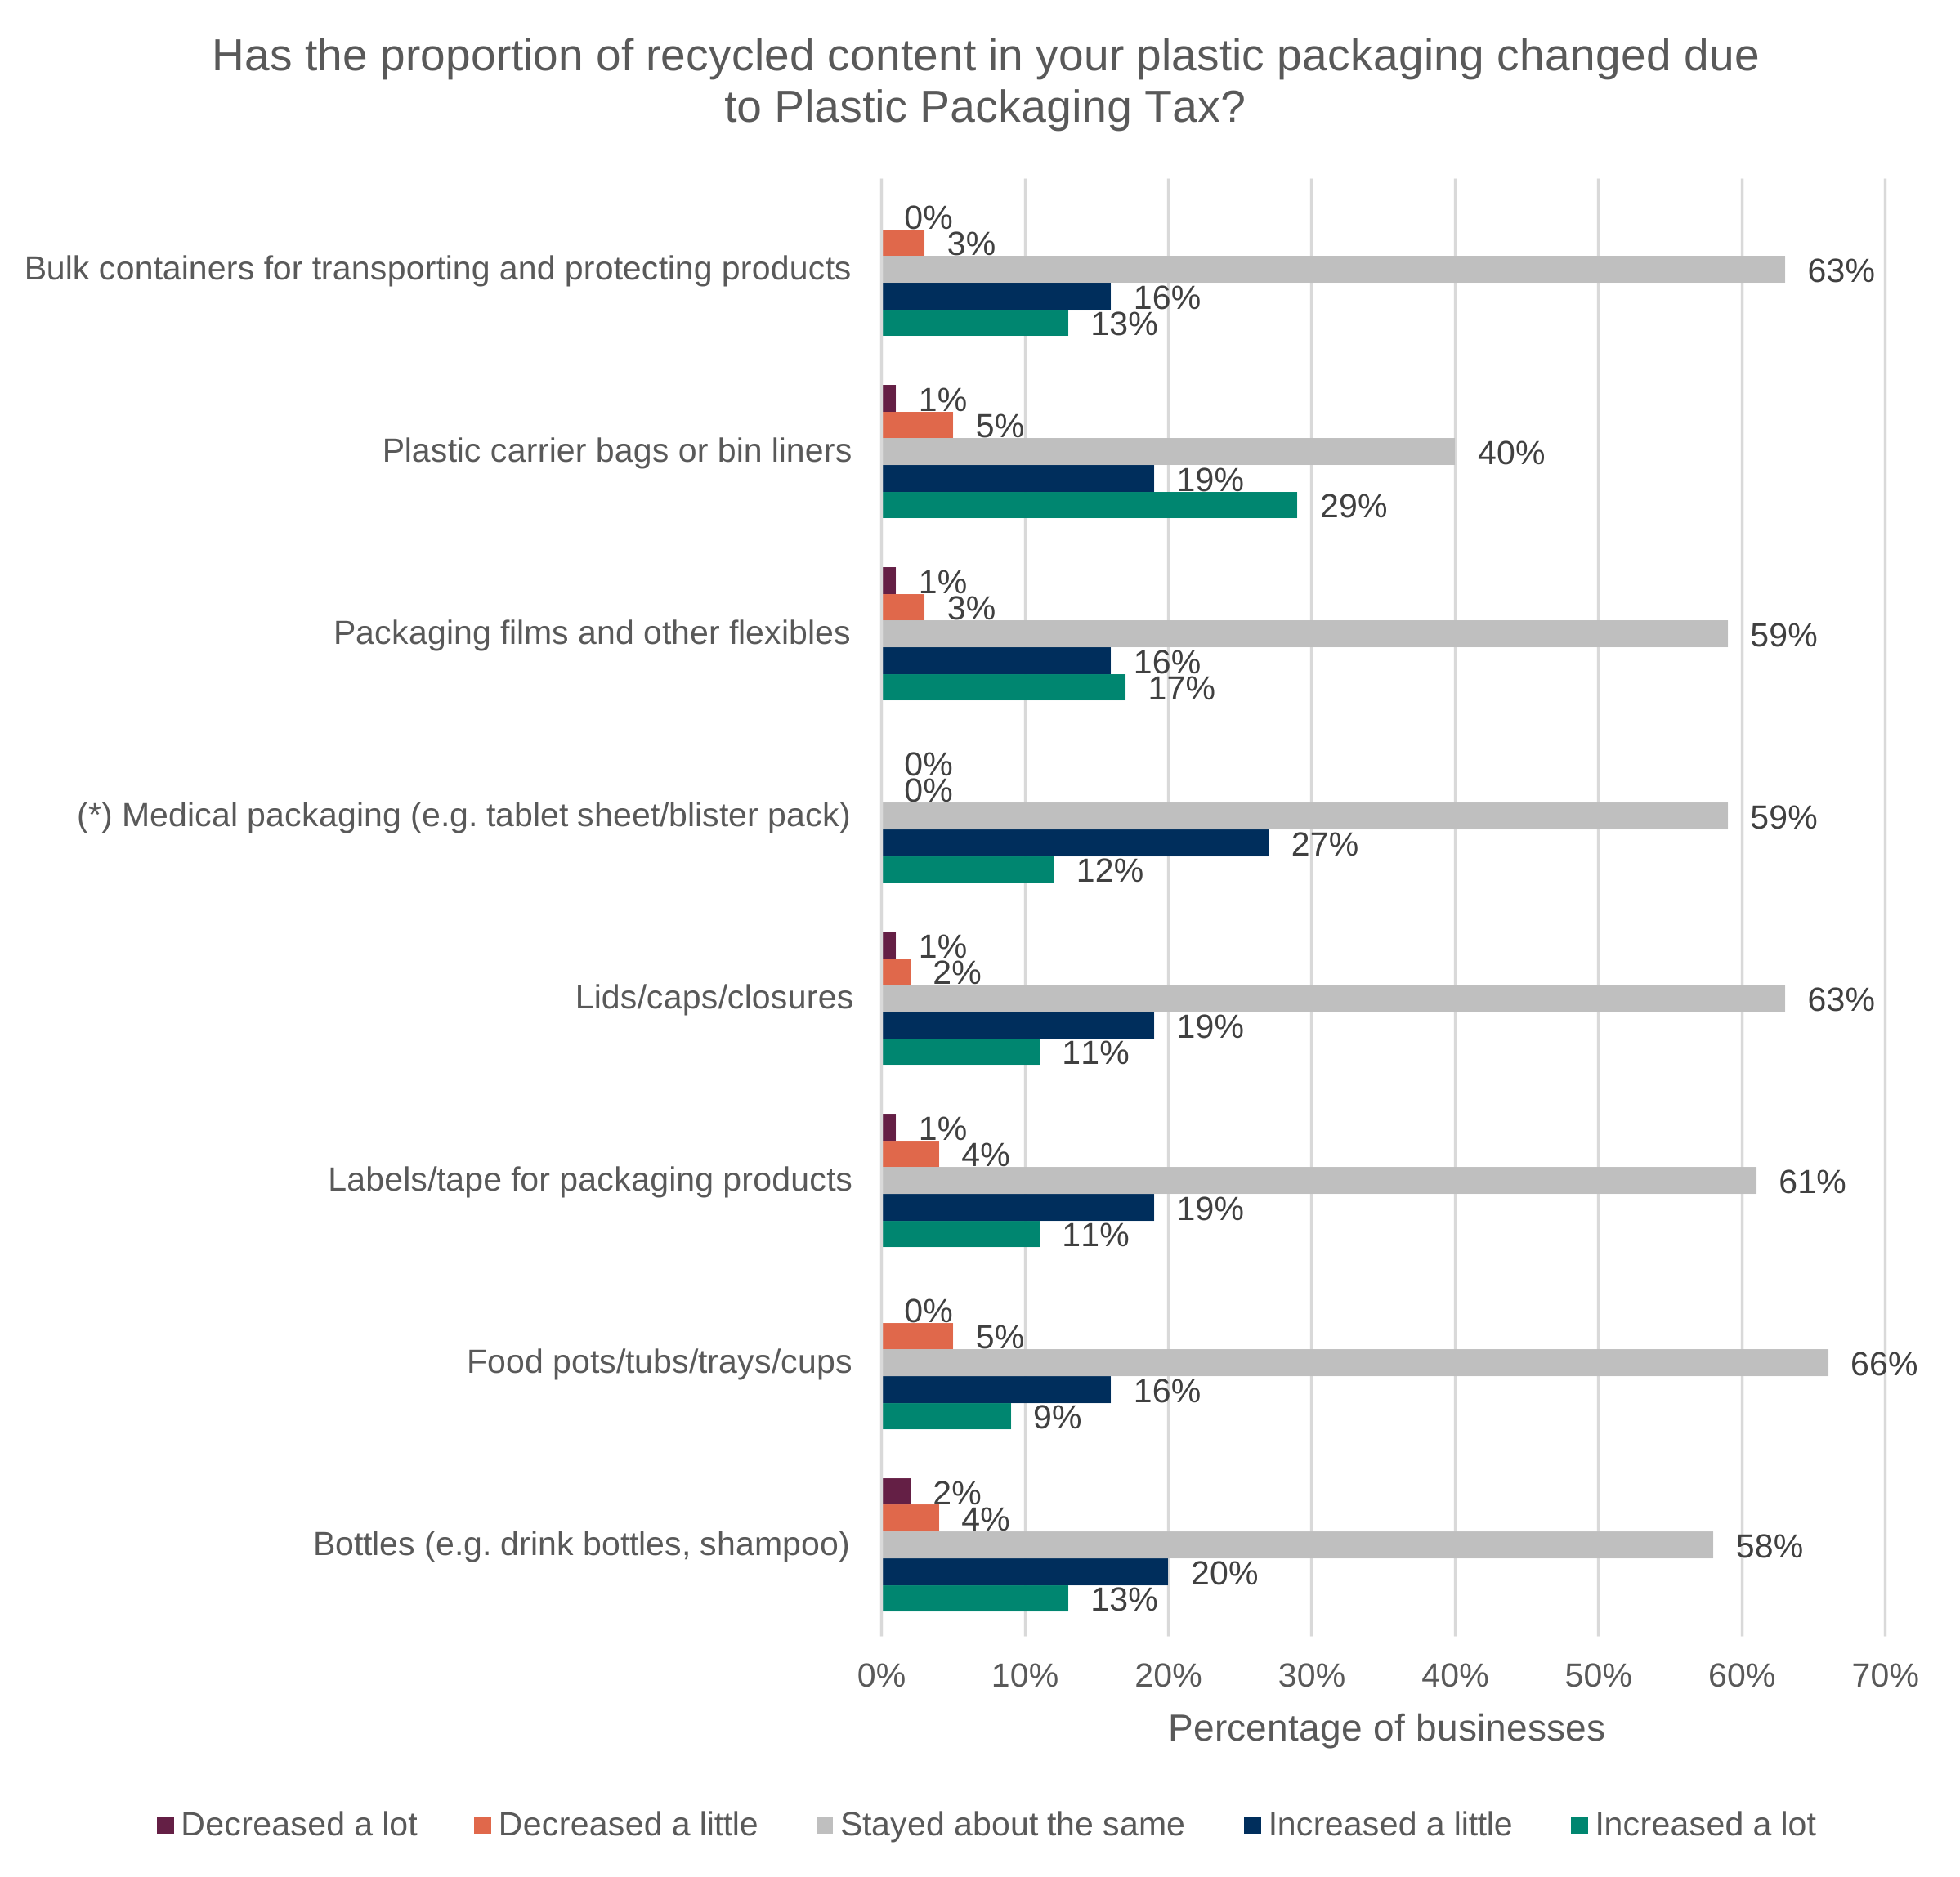
Data for Figure 5.3: Survey results for the question ‘Has the proportion of recycled content in your plastic packaging changed due to Plastic Packaging Tax?’.
The base for each product type was as follows: Bottles (160), Food pots, tubs, trays and cups (219), labels and tape (252), lids, caps and closures (261), medical packaging (69 — note), packaging films and other flexible packaging (537), plastic carrier bags or bin liners (131), and bulk containers for transporting and protecting products (237). Source: Ipsos.
Note: The sample for medical packaging is small, and results should be interpreted with caution.
| Category | Increased a lot | Increased a little | Stayed about the same | Decreased a little | Decreased a lot |
|---|---|---|---|---|---|
| Bulk containers for transporting and protecting products | 13% | 16% | 63% | 3% | 0% |
| Plastic carrier bags or bin liners | 29% | 19% | 40% | 5% | 1% |
| Packaging films and other flexibles | 17% | 16% | 59% | 3% | 1% |
| (Note) Medical packaging (for example, tablet sheet/blister pack) | 12% | 27% | 59% | 0% | 0% |
| Lids/caps/closures | 11% | 19% | 63% | 2% | 1% |
| Labels/tape for packaging products | 11% | 19% | 61% | 4% | 1% |
| Food pots/tubs/trays/cups | 9% | 16% | 66% | 5% | 0% |
| Bottles (for example, drink bottles, shampoo) | 13% | 20% | 58% | 4% | 2% |
Across all product types, the majority of businesses reported that recycled content had remained broadly unchanged following the introduction of PPT. While some differences were observed between categories, there is limited evidence of a consistent pattern across packaging formats.
Plastic carrier bags and bin liners reported the highest levels of behavioural change, with a greater proportion of businesses reporting increases in recycled content than other product categories. Packaging films and other flexible packaging also reported slightly higher levels of change. However, for most packaging types, reported responses were broadly similar, with the majority of businesses reporting either no change or relatively modest increases in recycled content.
Survey evidence on barriers to increasing recycled content also suggests broadly similar constraints across packaging formats. Businesses commonly cited factors such as the availability of suitable recycled material, product specifications, quality requirements and cost considerations. While some statistically significant differences were observed between individual product categories, these differences were generally modest and do not suggest fundamentally different patterns of response.
Evidence from UKPP members provides additional insight into how recycled-content outcomes vary across packaging formats.
Figure 5.4: All UKPP members’ recycled content in plastic packaging split by packaging product type.
Source: WRAP.
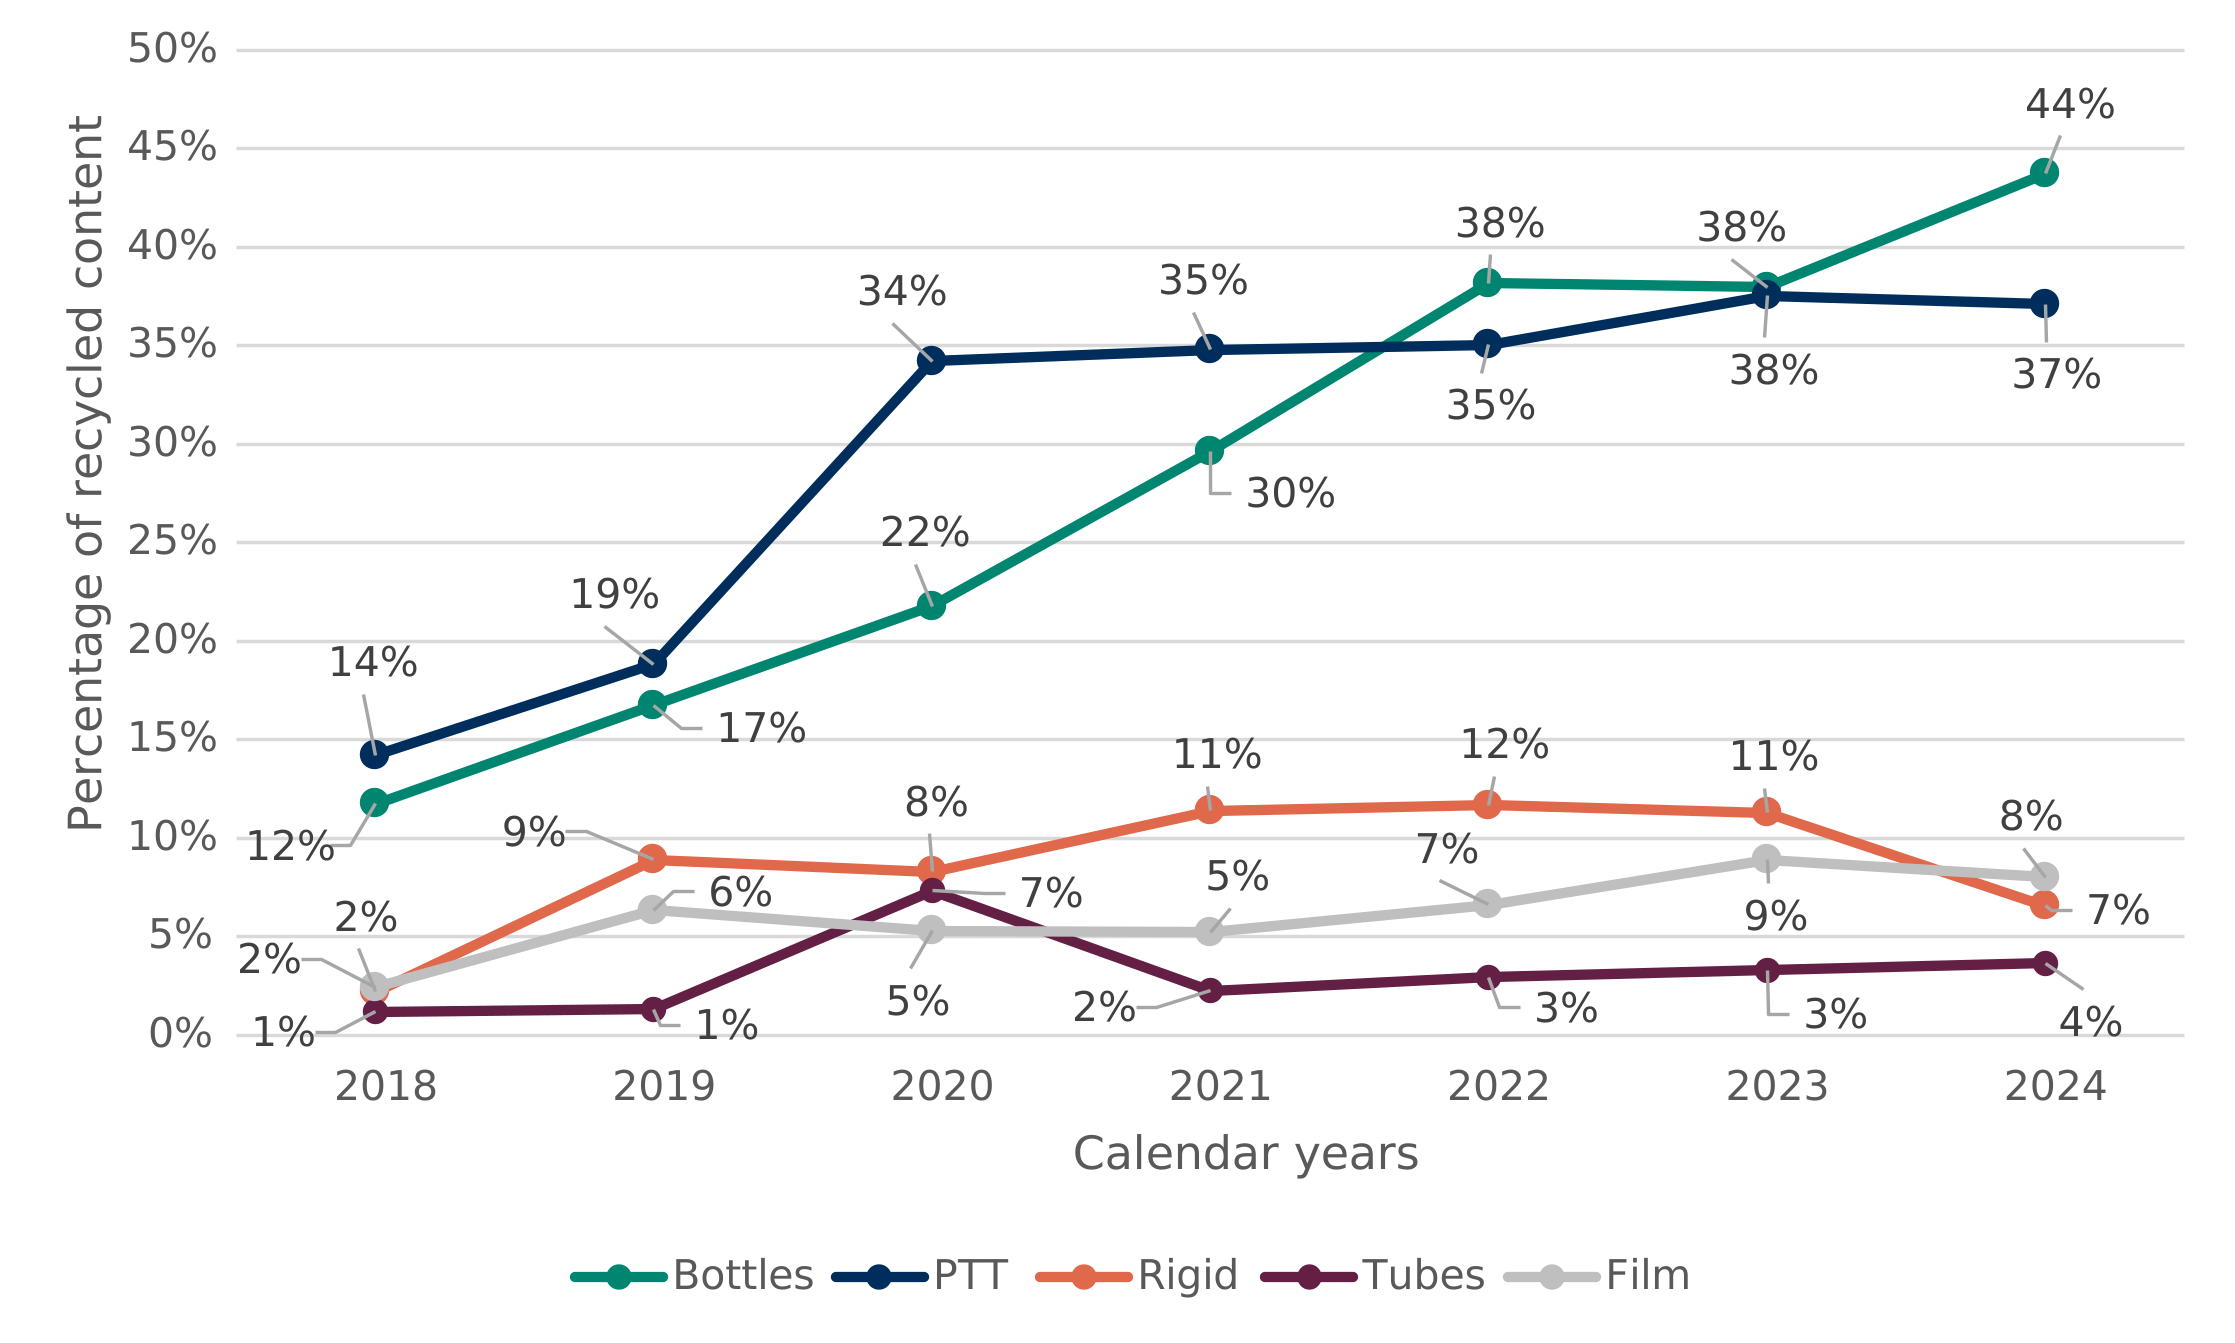
Data for Figure 5.4: All UKPP members’ recycled content in plastic packaging split by packaging product type.
Source: WRAP.
| Packaging product type | 2018 | 2019 | 2020 | 2021 | 2022 | 2023 | 2024 |
|---|---|---|---|---|---|---|---|
| Bottles | 11.7% | 16.7% | 21.8% | 29.6% | 38.2% | 38.0% | 43.7% |
| PTT | 14.2% | 18.8% | 34.2% | 34.8% | 35.0% | 37.5% | 37.1% |
| Rigid | 2.2% | 8.9% | 8.3% | 11.4% | 11.7% | 11.3% | 6.6% |
| Tubes | 1.2% | 1.3% | 7.3% | 2.2% | 2.9% | 3.3% | 3.6% |
| Film | 2.4% | 6.3% | 5.3% | 5.2% | 6.6% | 8.9% | 8.0% |
Figure 5.4 shows that recycled-content levels vary substantially across packaging product types amongst UKPP members. Bottles and pots, tubs and trays (PTT) consistently exhibit higher recycled-content levels than other packaging formats, while films and tubes remain at comparatively low levels throughout the period.
These differences appear closely linked to the underlying materials used within each packaging format. Product types such as bottles and PTT make greater use of PET, which benefits from more established recycling streams and higher availability of recycled material (explored further in Section 5.4.3). Conversely, packaging formats such as films and tubes make more limited use of PET and may face greater technical and commercial constraints when incorporating recycled content.
Overall, there is limited evidence that behavioural responses to PPT differ materially according to packaging product type, despite the variation in recycled content observed. Survey results suggest broadly similar patterns of behavioural change across packaging formats, while UKPP data indicates that differences in recycled-content outcomes are more closely associated with underlying material composition than packaging format itself. This suggests that structural factors such as material properties, recycling infrastructure and the availability of recycled inputs are likely to play a more important role in determining recycled-content outcomes than packaging product type alone.
5.4.3 Variation by plastic types used
This section builds on the findings of Section 5.4.2, which suggested that changes in recycled content in packaging have been more closely associated with the type of plastic used rather than the type of packaging. Administrative data collected through PPT does not record polymer type, meaning this analysis relies primarily on the survey evidence provided. The qualitative and quantitative research has suggested that the technical feasibility, availability and cost of incorporating recycled material can vary across polymers, potentially affecting businesses’ ability to respond to the tax.
Further supporting analysis for this section can be found in Section C.2.3 in Annex C.
Different plastic polymers are used for different packaging applications because they provide different combinations of strength, flexibility, durability and barrier properties. Survey evidence suggests that a relatively small number of polymers dominate across most packaging formats.
Polypropylene (PP) was commonly used across nearly all packaging formats and appeared to be one of the most versatile polymers, being widely used in products ranging from food packaging and labels to lids, closures and flexible packaging. Polyethylene terephthalate (PET) was most commonly associated with bottles and rigid food packaging, reflecting its suitability for transparent and lightweight containers. High-density polyethylene (HDPE) was frequently used in bottles, closures and rigid containers where greater strength and durability are required, while low-density polyethylene (LDPE) was most commonly used in packaging films, flexible packaging and carrier bags due to its flexibility and resistance to tearing. Polystyrene (PS) was used less frequently overall but was more commonly reported in protective and transport packaging applications. Polyvinyl chloride (PVC) was used in a relatively small number of packaging types, including medical packaging and labels.
Businesses also reported using compostable and bio-based plastics, although these materials were considerably less common than conventional polymers. Multi-layer materials such as polyamide-polyethylene (PA/PE or PAPE) and other specialist plastics may be used where packaging requires a combination of strength, flexibility or barrier protection that cannot be achieved with a single polymer.
Figures 5.5 and 5.6 demonstrate that across both manufacturers and importers, PP, PET, HDPE and LDPE were consistently the most commonly reported polymers, although their prevalence varied by packaging type. These patterns suggest that polymer choice is driven in part by the functional requirements of different packaging applications, which may in turn influence businesses’ ability to increase recycled content. As a result, the subsequent analysis focuses on these polymer types, alongside PS, where sample sizes were sufficient for comparison.
Figure 5.5: Survey results for the question ‘Which of the following types of plastic do you use in the plastic packaging that you manufacture?’.
The base for this question was 195 and includes all businesses who reported they manufacture plastic packaging. Source: Ipsos.
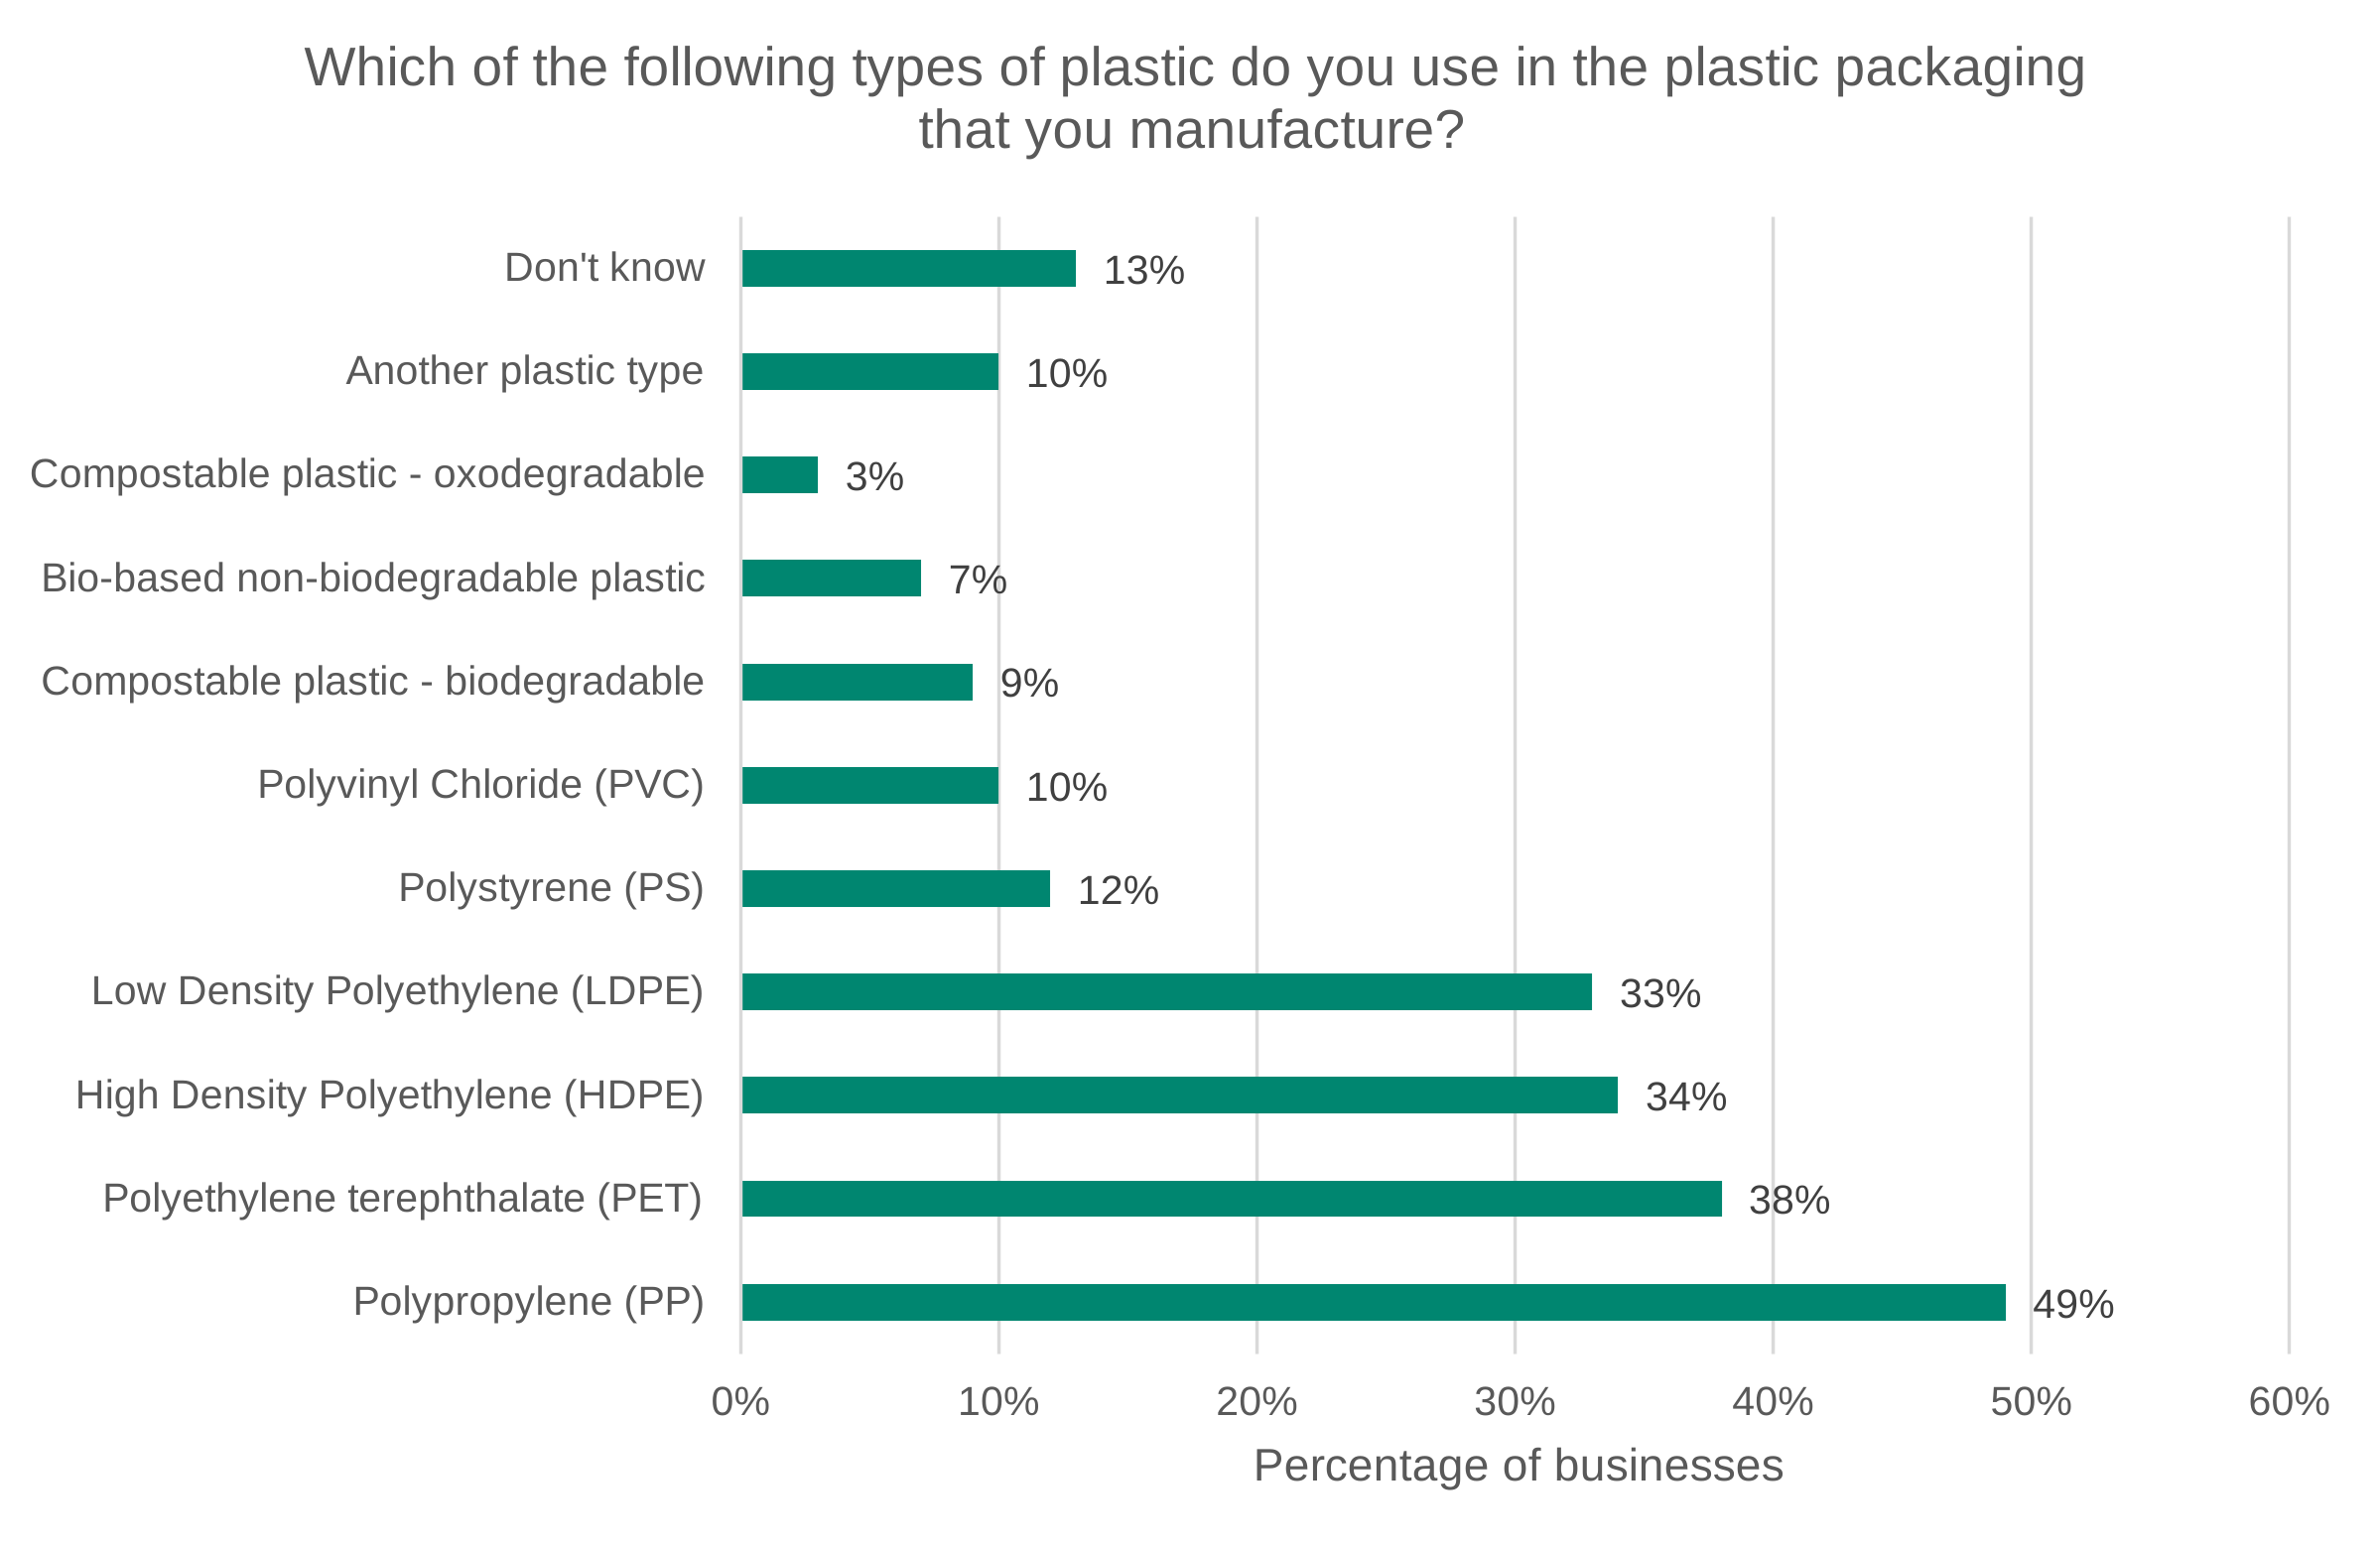
Data for Figure 5.5: Survey results for the question ‘Which of the following types of plastic do you use in the plastic packaging that you manufacture?’.
The base for this question was 195 and includes all businesses who reported they manufacture plastic packaging. Source: Ipsos.
| Category | Percentage of businesses |
|---|---|
| Don’t know | 13% |
| Another plastic type | 10% |
| Compostable plastic - oxodegradable | 3% |
| Bio-based non-biodegradable plastic | 7% |
| Compostable plastic - biodegradable | 9% |
| Polyvinyl Chloride (PVC) | 10% |
| Polystyrene (PS) | 12% |
| Low Density Polyethylene (LDPE) | 33% |
| High Density Polyethylene (HDPE) | 34% |
| Polyethylene terephthalate (PET) | 38% |
| Polypropylene (PP) | 49% |
Figure 5.6: Survey results for the question ‘Which of the following types of plastic are used in the plastic packaging your business imports into the UK?’.
The base for this question was 920 and includes all businesses who reported they import plastic packaging. Source: Ipsos.
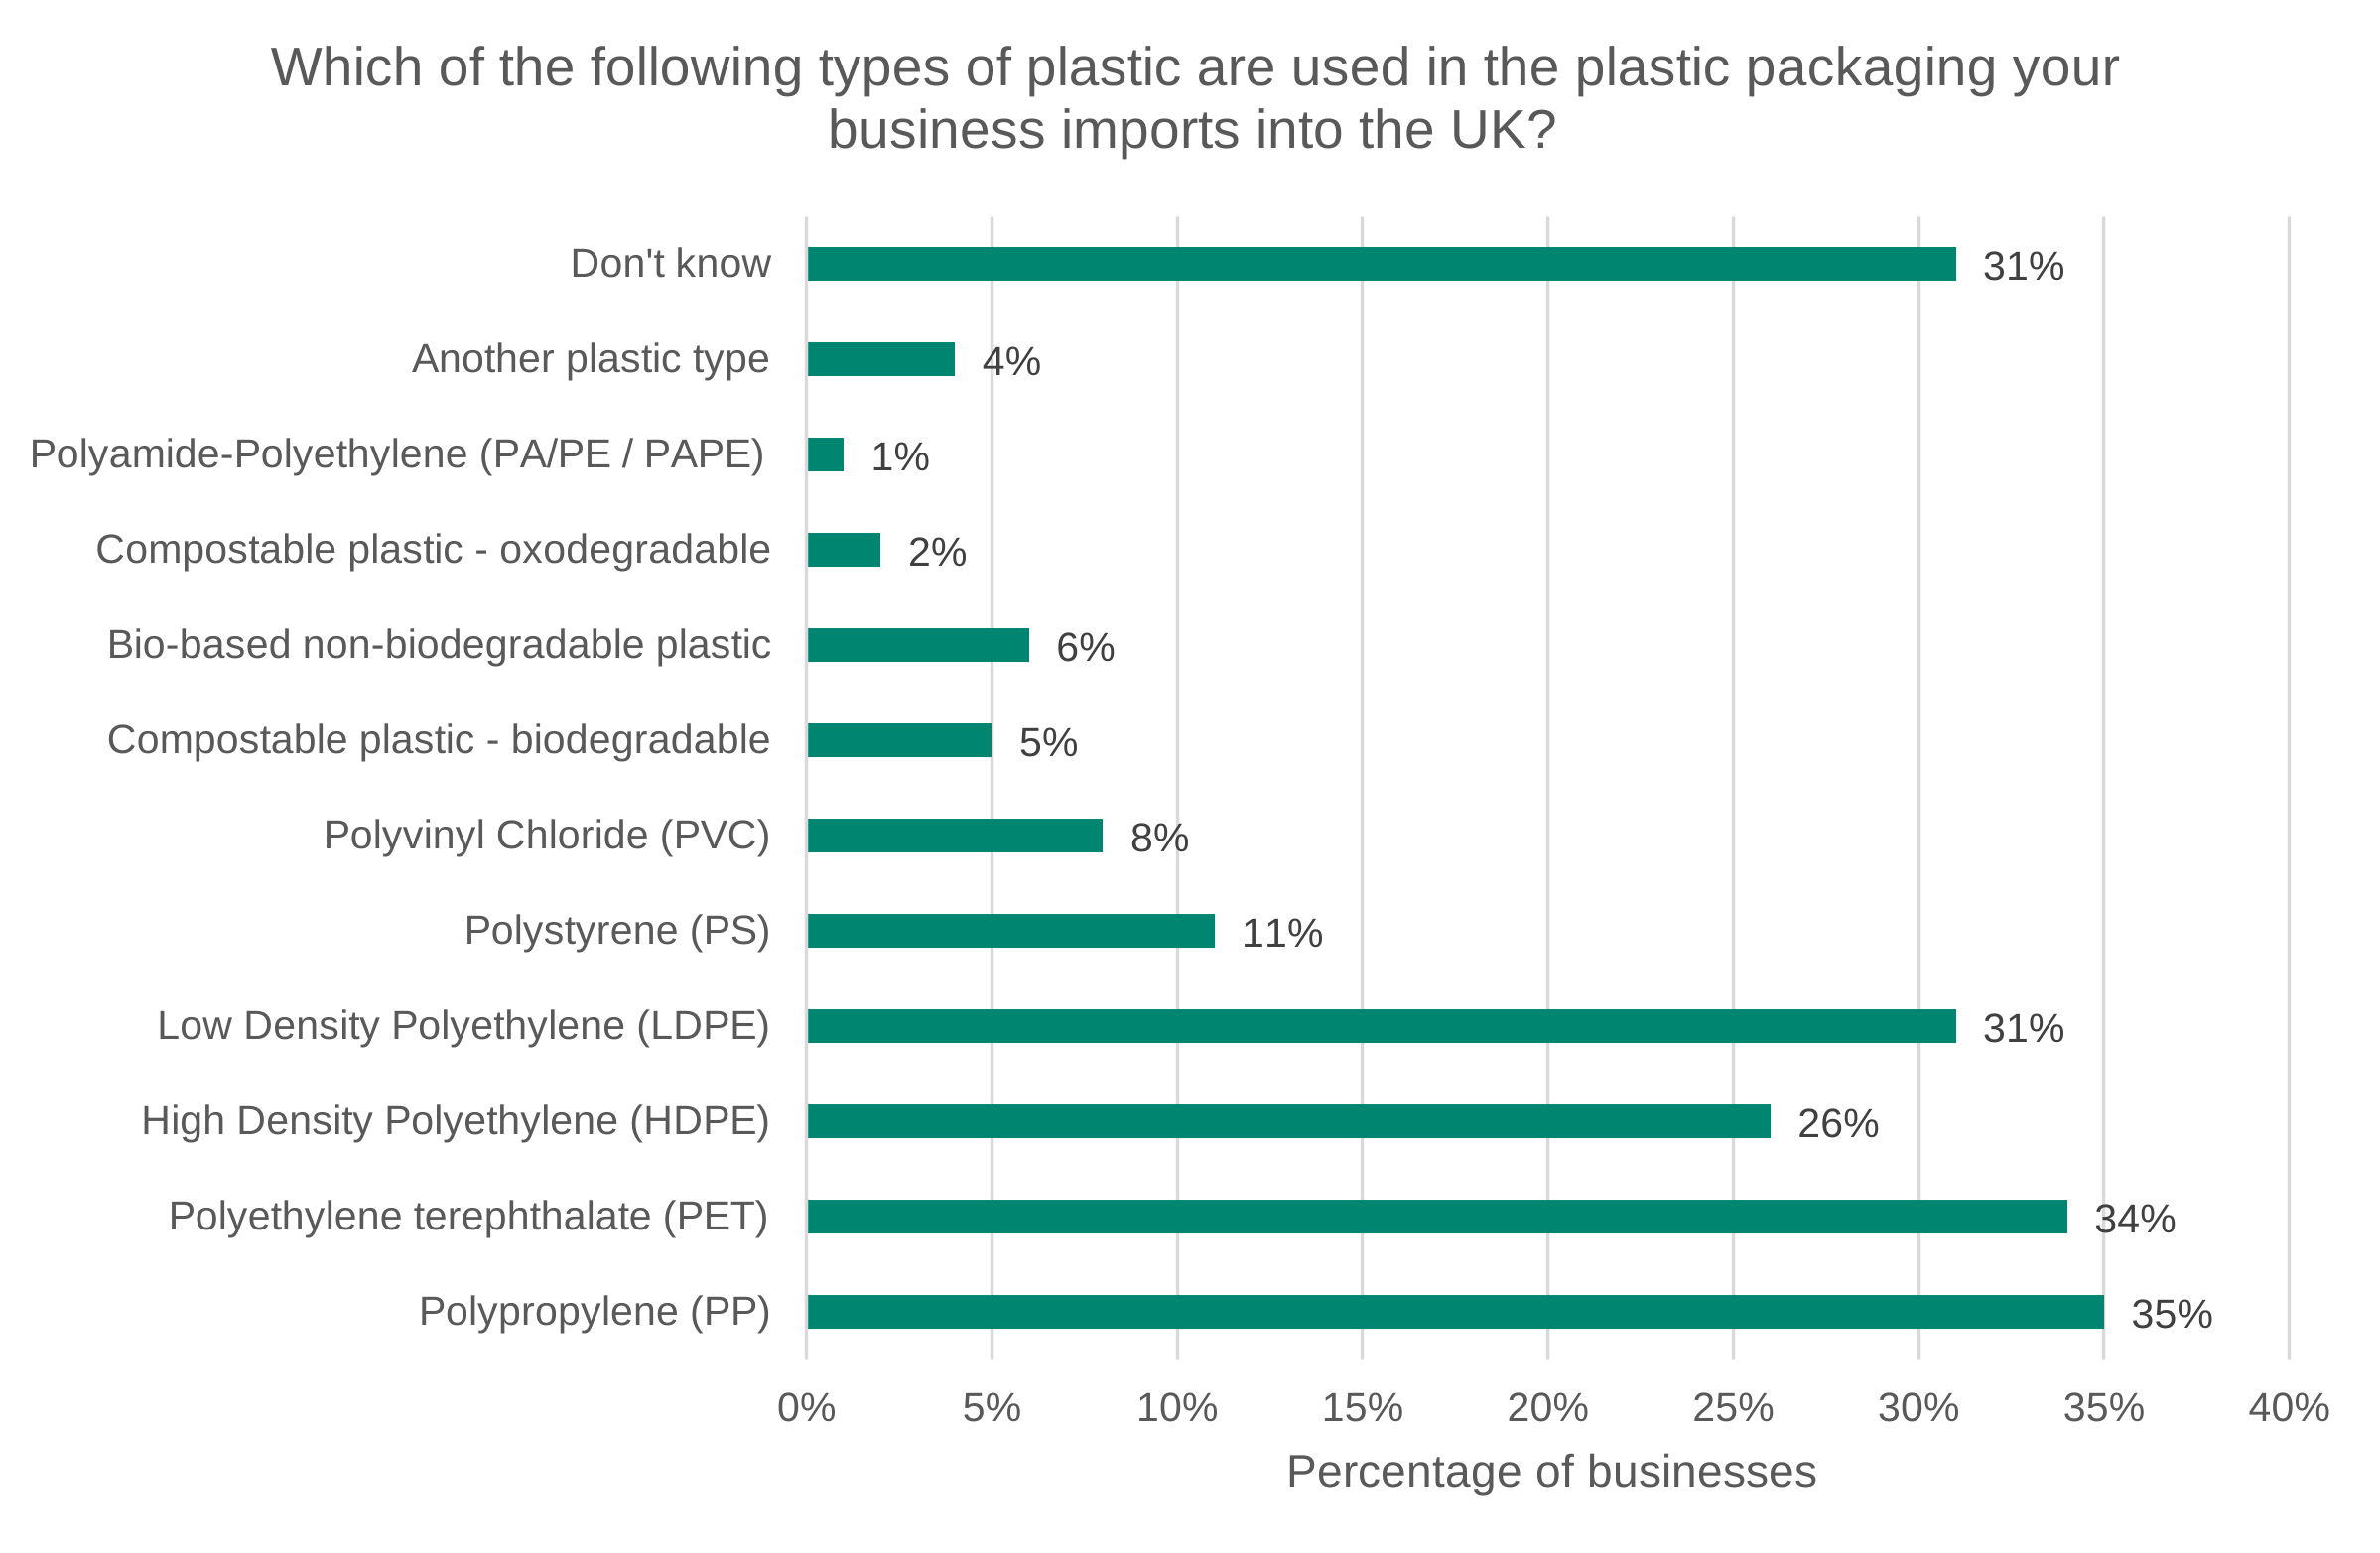
Data for Figure 5.6: Survey results for the question ‘Which of the following types of plastic are used in the plastic packaging your business imports into the UK?’.
The base for this question was 920 and includes all businesses who reported they import plastic packaging. Source: Ipsos.
| Category | Percentage of businesses |
|---|---|
| Don’t know | 31% |
| Another plastic type | 4% |
| Polyamide-Polyethylene (PA/PE / PAPE) | 1% |
| Compostable plastic - oxodegradable | 2% |
| Bio-based non-biodegradable plastic | 6% |
| Compostable plastic - biodegradable | 5% |
| Polyvinyl Chloride (PVC) | 8% |
| Polystyrene (PS) | 11% |
| Low Density Polyethylene (LDPE) | 31% |
| High Density Polyethylene (HDPE) | 26% |
| Polyethylene terephthalate (PET) | 34% |
| Polypropylene (PP) | 35% |
Figure 5.7 presents reported changes in recycled content by the most commonly used polymer types, as these account for the majority of plastic packaging placed on the market and are supported by sufficiently large sample sizes. Across these polymers, the most common response was that recycled content had remained broadly unchanged following the introduction of PPT. However, there is evidence that the scale of behavioural response differed across materials.
Figure 5.7: Survey results for the question ‘Has the proportion of recycled content in your plastic packaging changed due to Plastic Packaging Tax?’ broken down by type of plastic used in packaging.
The base for HDPE or LDPE was 430, for PET it was 346, for PP it was 376, and for PS it was 114. Source: Ipsos.
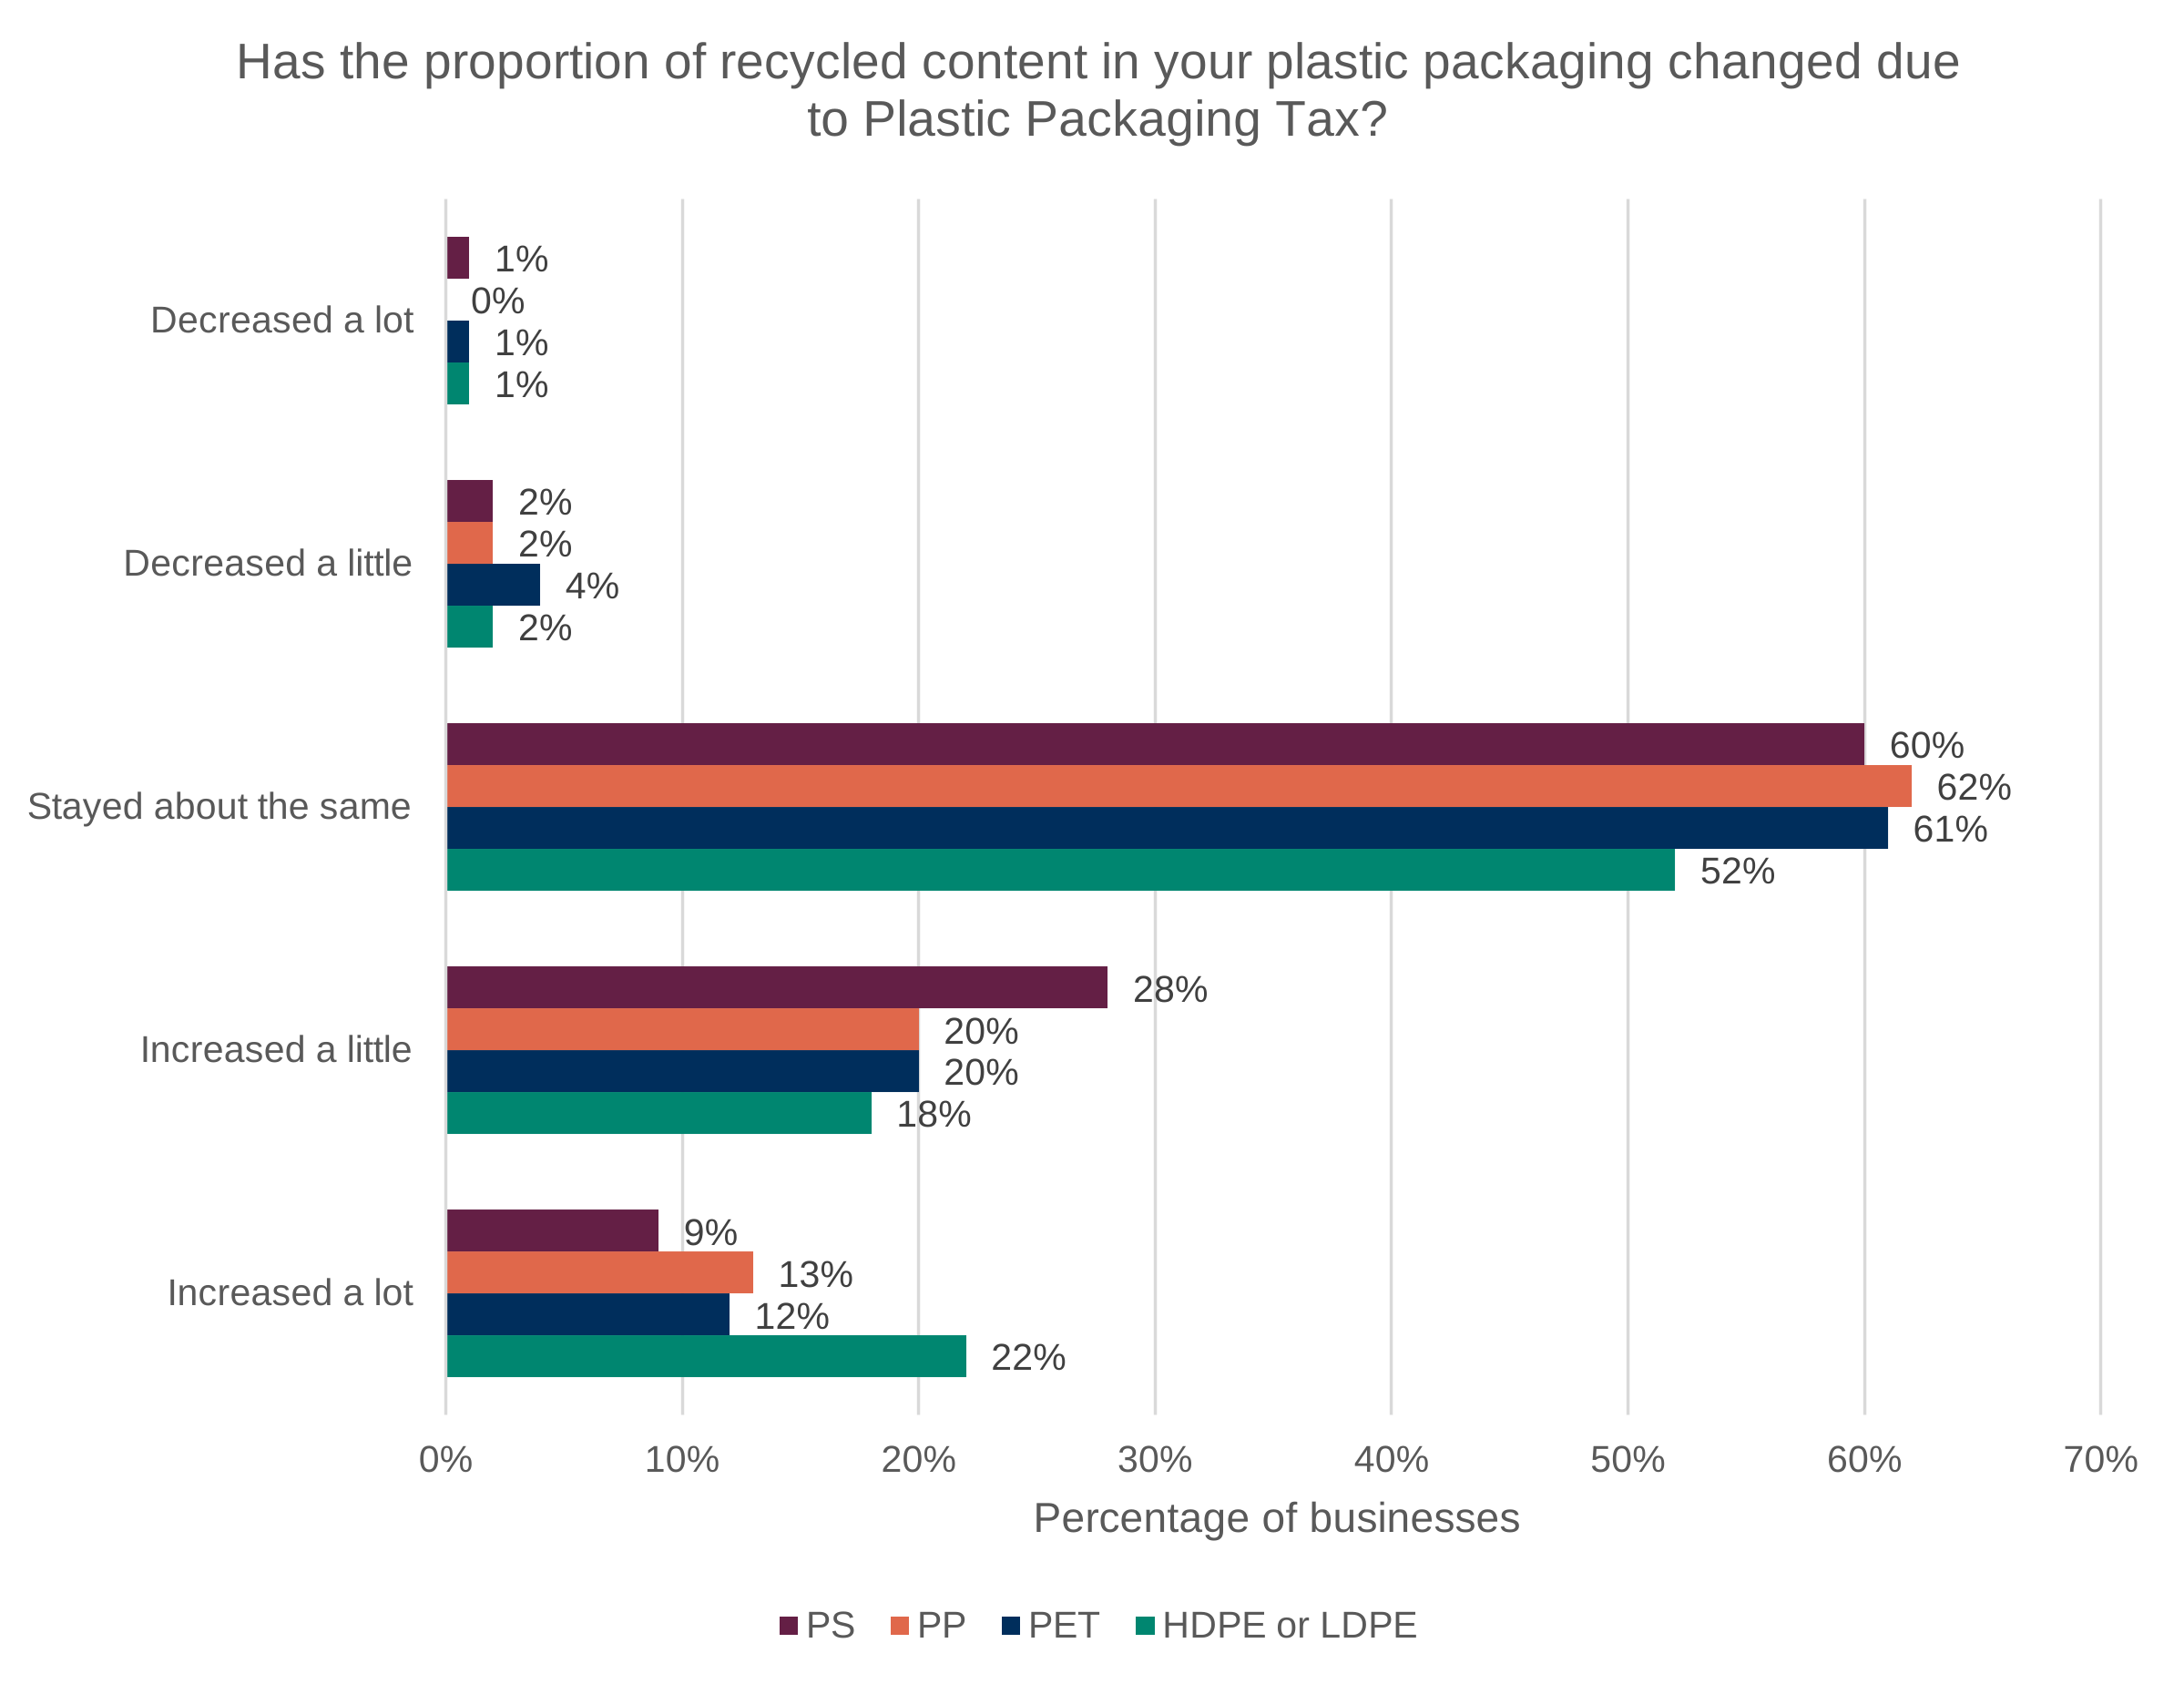
Data for Figure 5.7: Survey results for the question ‘Has the proportion of recycled content in your plastic packaging changed due to Plastic Packaging Tax?’ broken down by type of plastic used in packaging.
The base for HDPE or LDPE was 430, for PET it was 346, for PP it was 376, and for PS it was 114. Source: Ipsos.
| Category | HDPE or LDPE | PET | PP | PS |
|---|---|---|---|---|
| Decreased a lot | 1% | 1% | 0% | 1% |
| Decreased a little | 2% | 4% | 2% | 2% |
| Stayed about the same | 52% | 61% | 62% | 60% |
| Increased a little | 18% | 20% | 20% | 28% |
| Increased a lot | 22% | 12% | 13% | 9% |
Businesses using HDPE or LDPE were less likely to report no change in recycled content and more likely to report larger increases in the proportion of recycled content than businesses using PET, PP or PS. Around 22% of businesses using HDPE or LDPE reported that recycled content had increased ‘a lot’, compared with between 9 and 13% for businesses using the other major polymer groups. Around 40% of HDPE and LDPE users reported some increase in recycled content, whereas for the other core plastic types it ranged between 33% and 37%. By comparison, businesses using PS were more likely to report smaller increases in recycled content than larger step changes. PET and PP generally sat between these 2 patterns, with increases reported less frequently and more often concentrated in smaller adjustments.
Survey evidence on barriers suggests that differences in behavioural responses may partly reflect differences in the constraints faced by businesses using different materials. For example, PS users were more likely to report supply-related barriers and cost pressures, while PP users were somewhat more likely to report limited customer demand for increased recycled content. However, these findings should be interpreted cautiously (with further details included in Section C.2.3 in Annex C).
Overall, there is stronger evidence that behavioural responses to PPT vary more by polymer type than by packaging type, although these differences relate primarily to changes to the proportion of recycled content in packaging rather than movements away from using plastic altogether. Businesses using HDPE and LDPE appear more likely to report larger increases in recycled content, while businesses using PS, PP and PET tend to report more limited or incremental changes to their recycled content. These findings suggest that the effectiveness of PPT may be influenced by factors such as material properties, supply-chain conditions and the availability of suitable recycled inputs. However, the overall direction of response is broadly similar across polymer types, and the findings are based on self-reported survey evidence rather than direct measures of behavioural change.
5.4.4 UK Plastic Pact
Data collected by WRAP on members of the UK Plastic Pact (UKPP) provides a complementary source of evidence to both the survey and PPT administrative data. UKPP members are businesses that have made voluntary commitments to improve the environmental sustainability of their plastic packaging, including increasing recycled content and improving recyclability. As a result, UKPP membership provides a useful way of exploring whether businesses with pre-existing sustainability commitments exhibit different outcomes to the wider PPT population.
Further supporting analysis for this section can be found in Section C.2.4 in Annex C.
The UKPP analysis is descriptive and should not be interpreted as identifying the causal impact of PPT. UKPP members may differ from non-members in ways that influence packaging decisions independently of the tax, including business strategies, sustainability objectives, supply-chain relationships and technical capabilities.
Figure 5.8: All UKPP members’ recycled content in plastic packaging split by plastic type.
Source: WRAP.
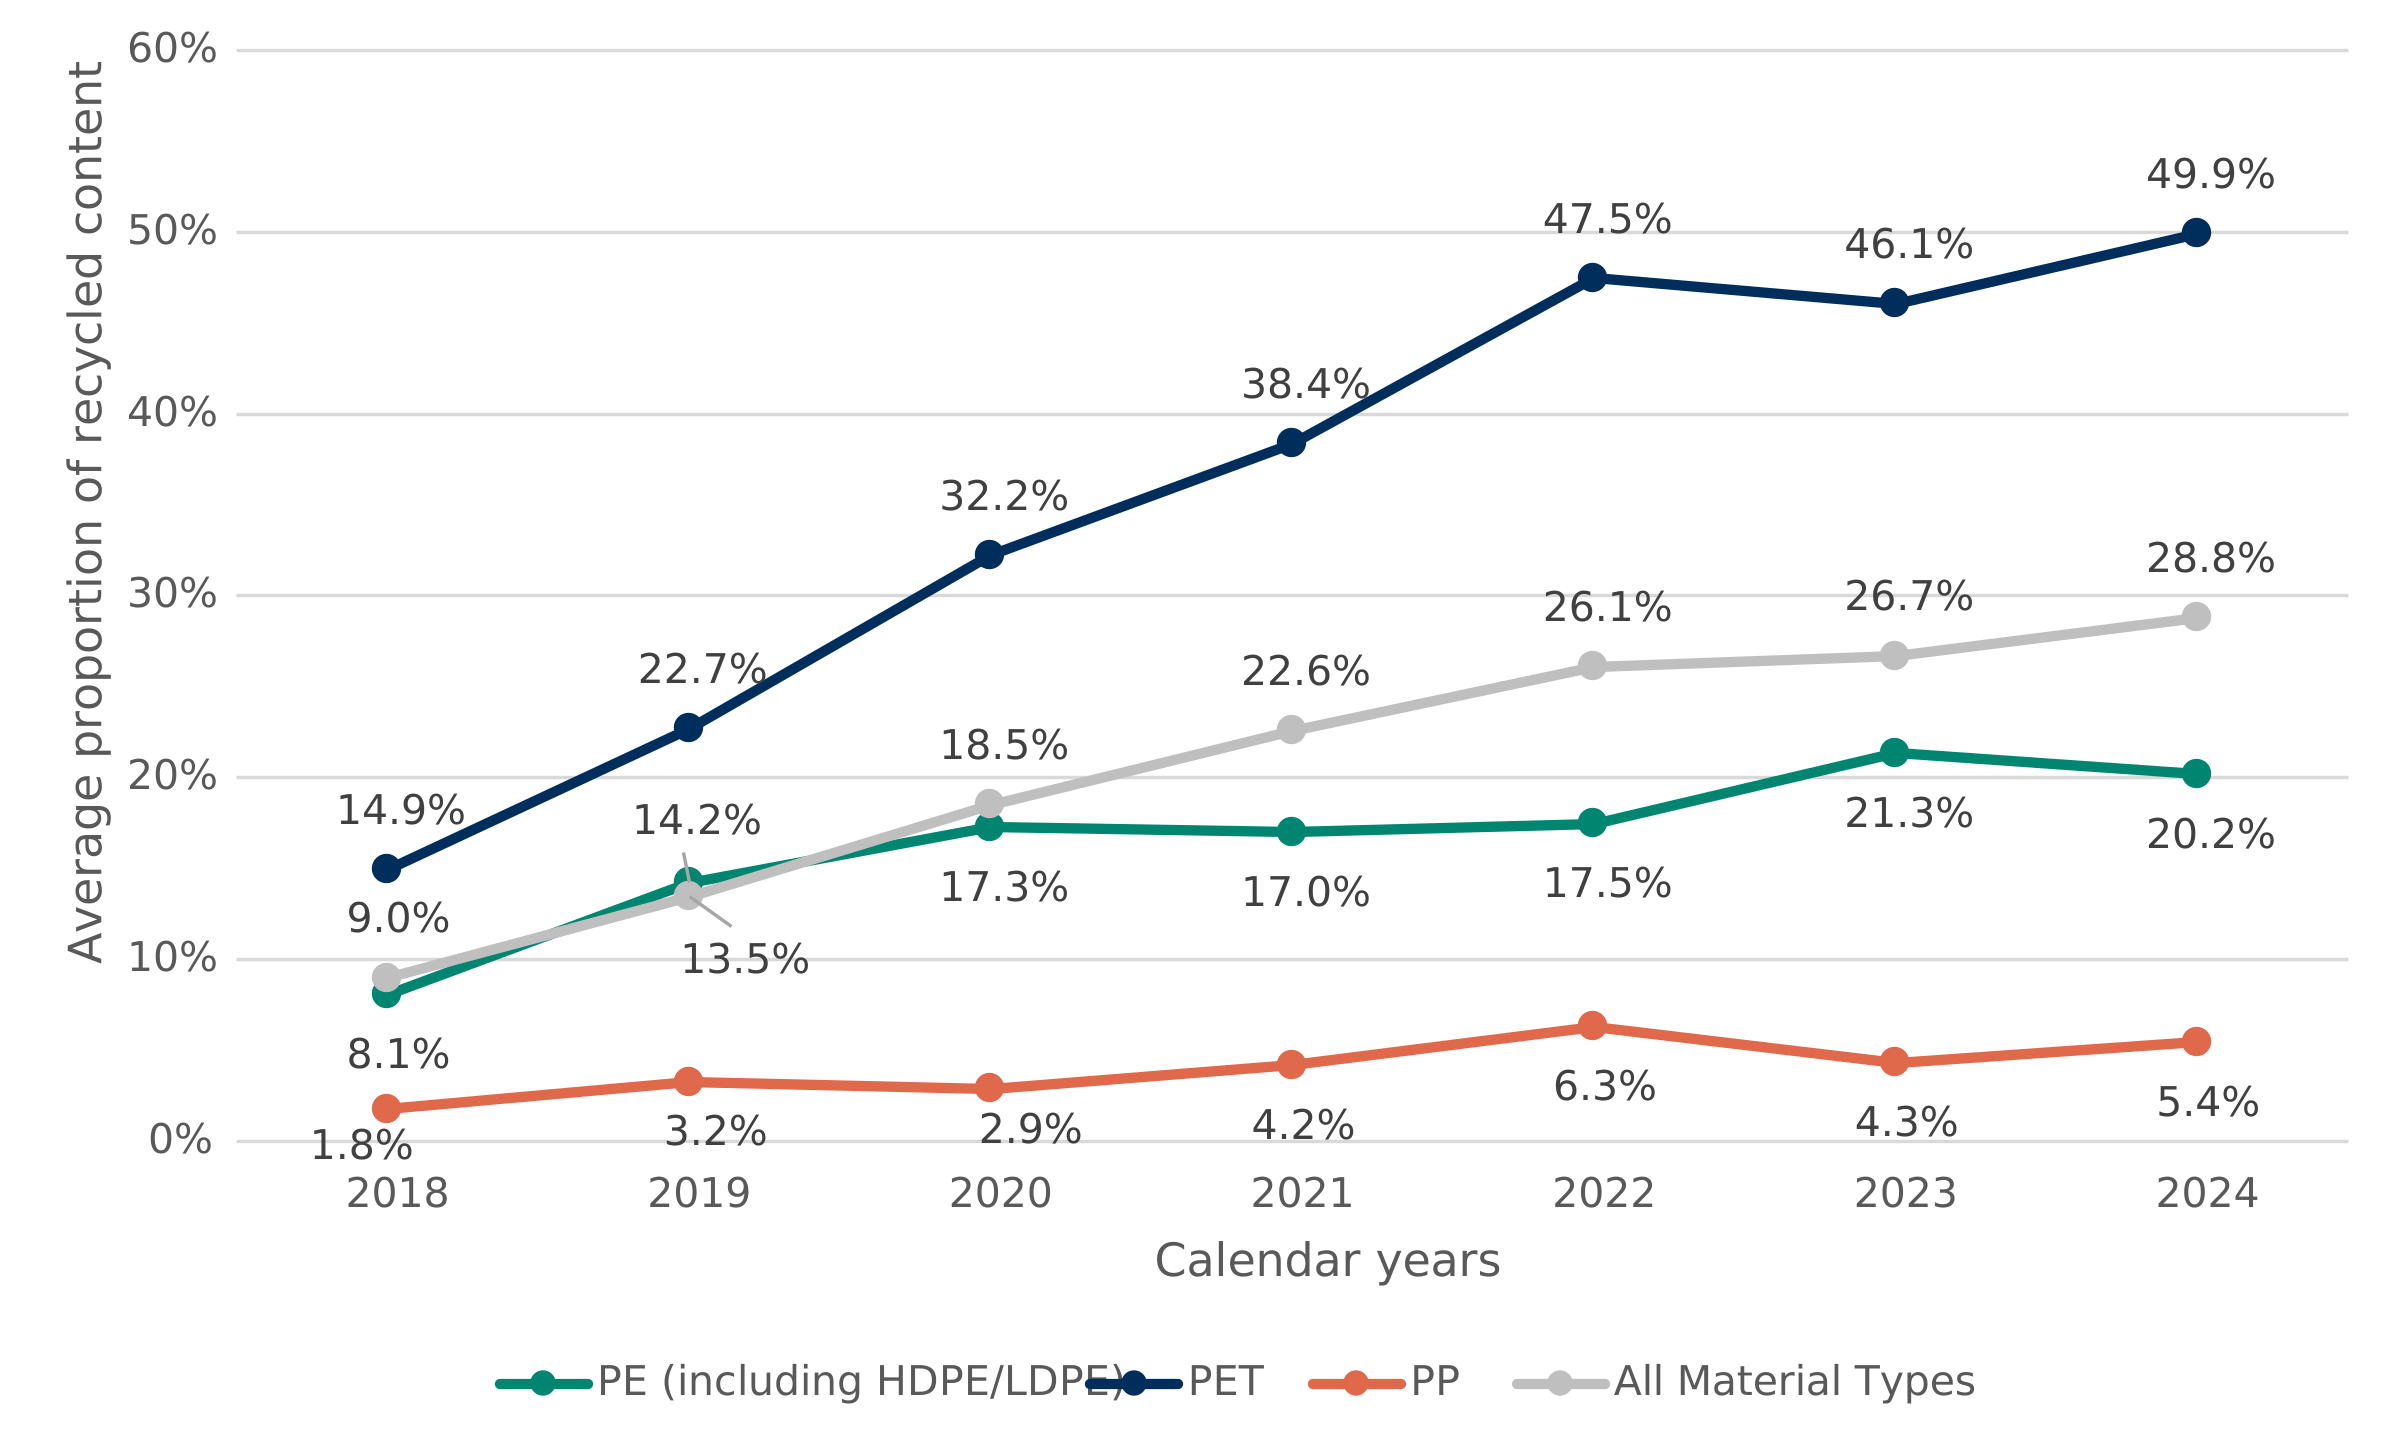
Data for Figure 5.8: All UKPP members’ recycled content in plastic packaging split by plastic type.
Source: WRAP.
| Plastic type | 2018 | 2019 | 2020 | 2021 | 2022 | 2023 | 2024 |
|---|---|---|---|---|---|---|---|
| PE (including HDPE/LDPE) | 8.1% | 14.2% | 17.3% | 17.0% | 17.5% | 21.3% | 20.2% |
| PET | 14.9% | 22.7% | 32.2% | 38.4% | 47.5% | 46.1% | 49.9% |
| PP | 1.8% | 3.2% | 2.9% | 4.2% | 6.3% | 4.3% | 5.4% |
| All Material Types | 9.0% | 13.5% | 18.5% | 22.6% | 26.1% | 26.7% | 28.8% |
Figure 5.8 shows that recycled-content levels amongst UKPP members increased substantially between 2018 and 2024. Across all material types, the average proportion of recycled content increased from 9.0% in 2018 to 28.8% in 2024. Growth was particularly strong for PET packaging, where recycled content increased from 14.9% to 49.9% over the same period. PE also demonstrated sustained growth, while progress for PP was more limited. These trends suggest that significant increases in recycled-content use were already occurring amongst UKPP members before, and alongside, the introduction of PPT.
To explore whether these businesses also exhibit different outcomes within the PPT population, UKPP membership was matched to businesses identified in HMRC’s administrative data. Although not all UKPP members could be matched, over 100 businesses were identified, allowing comparison with the wider tax base.
Figure 5.9 compares the proportion of packaging meeting the 30% recycled-content threshold for UKPP-linked businesses and all other businesses.
Figure 5.9: The proportion of plastic packaging that met and did not meet the 30% recycled content threshold, comparing UKPP members and associates and non-member businesses across financial years.
Source: HMRC.
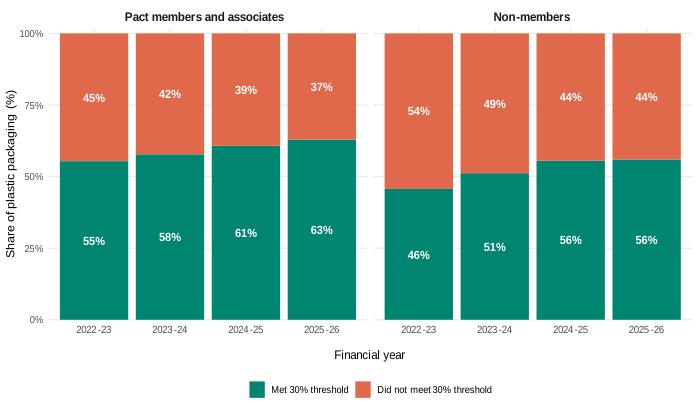
Data for Figure 5.9: The proportion of plastic packaging that met and did not meet the 30% recycled content threshold, comparing UKPP members and associates and non-member businesses across financial years.
Source: HMRC.
| Financial year | Pact status | Percentage of businesses that met 30% threshold | Percentage of businesses that did not meet 30% threshold |
|---|---|---|---|
| 2022-23 | Pact members and associates | 55.4% | 44.6% |
| 2023-24 | Pact members and associates | 57.8% | 42.2% |
| 2024-25 | Pact members and associates | 60.8% | 39.2% |
| 2025-26 | Pact members and associates | 62.9% | 37.1% |
Data for Figure 5.9: The proportion of plastic packaging that met and did not meet the 30% recycled content threshold, comparing UKPP members and associates and non-member businesses across financial years.
Source: HMRC.
| Financial year | Pact status | Percentage of businesses that met 30% threshold | Percentage of businesses that did not meet 30% threshold |
|---|---|---|---|
| 2022-23 | Non-members | 45.7% | 54.3% |
| 2023-24 | Non-members | 51.2% | 48.8% |
| 2024-25 | Non-members | 55.5% | 44.5% |
| 2025-26 | Non-members | 56.0% | 44.0% |
UKPP members and associates consistently reported a higher proportion of packaging meeting the 30% recycled-content threshold than non-members. The share of packaging meeting the threshold increased from 55% in financial year 2022 to 2023 to 63% in financial year 2025 to 2026 and remained consistently above that observed for non-members throughout the period. Statistical testing confirms that the difference between the 2 groups is significant.
The WRAP and administrative data provide consistent evidence that businesses participating in the UKPP have historically demonstrated higher levels of recycled content use than businesses outside of the UKPP. While this is likely to reflect differences in business characteristics, capabilities and pre-existing sustainability commitments, the findings also have broader implications for understanding the factors shaping behavioural responses to PPT. UKPP members had already signalled a stronger commitment to improving the environmental performance of their packaging before the introduction of the tax and therefore represent a distinct subset of the business population. Their consistently higher rates of achieving the recycled content threshold suggest that, although businesses may face genuine supply-side, technical and commercial constraints, these barriers are not necessarily insurmountable. The fact that a substantial proportion of UKPP members have been able to source and use recycled plastic at scale indicates that there is scope for greater adoption among some businesses outside the scheme.
The findings suggest that differences in outcomes may reflect not only the presence of constraints, but also differences in the willingness or incentive to overcome them. This is consistent with the wider earlier evidence presented, which indicates that while constraints can increase the cost of substituting to recycled plastic, many businesses appear to judge those costs as greater than the tax liability itself. The evidence therefore suggests that behavioural outcomes under PPT are shaped by both external constraints and business motivations, helping to explain why progress towards the recycled-content threshold has been uneven across the tax base.
5.4.5 Sector variation
This section examines whether behavioural responses to PPT differ across sectors. While businesses operating in different sectors may face different regulatory, technical and commercial constraints, the survey evidence suggests that sector alone is not a major factor in explaining variation in responses to the tax.
Further supporting analysis for this section can be found in Section C.2.5 in Annex C.
Survey respondents were primarily concentrated within manufacturing and wholesale and retail trade. Analysis therefore focuses on these sectors, alongside a more detailed assessment of businesses involved in the production of plastic packaging.
Figure 5.10 compares changes in recycled content across the 2 largest sectors represented in the survey.
Figure 5.10: Survey results for the question ‘Has the proportion of recycled content in your plastic packaging changed due to Plastic Packaging Tax?’ broken down by main economic sector.
The base for Manufacturing is 426 and for Wholesale and Retail Trade it is 481. Source: Ipsos.
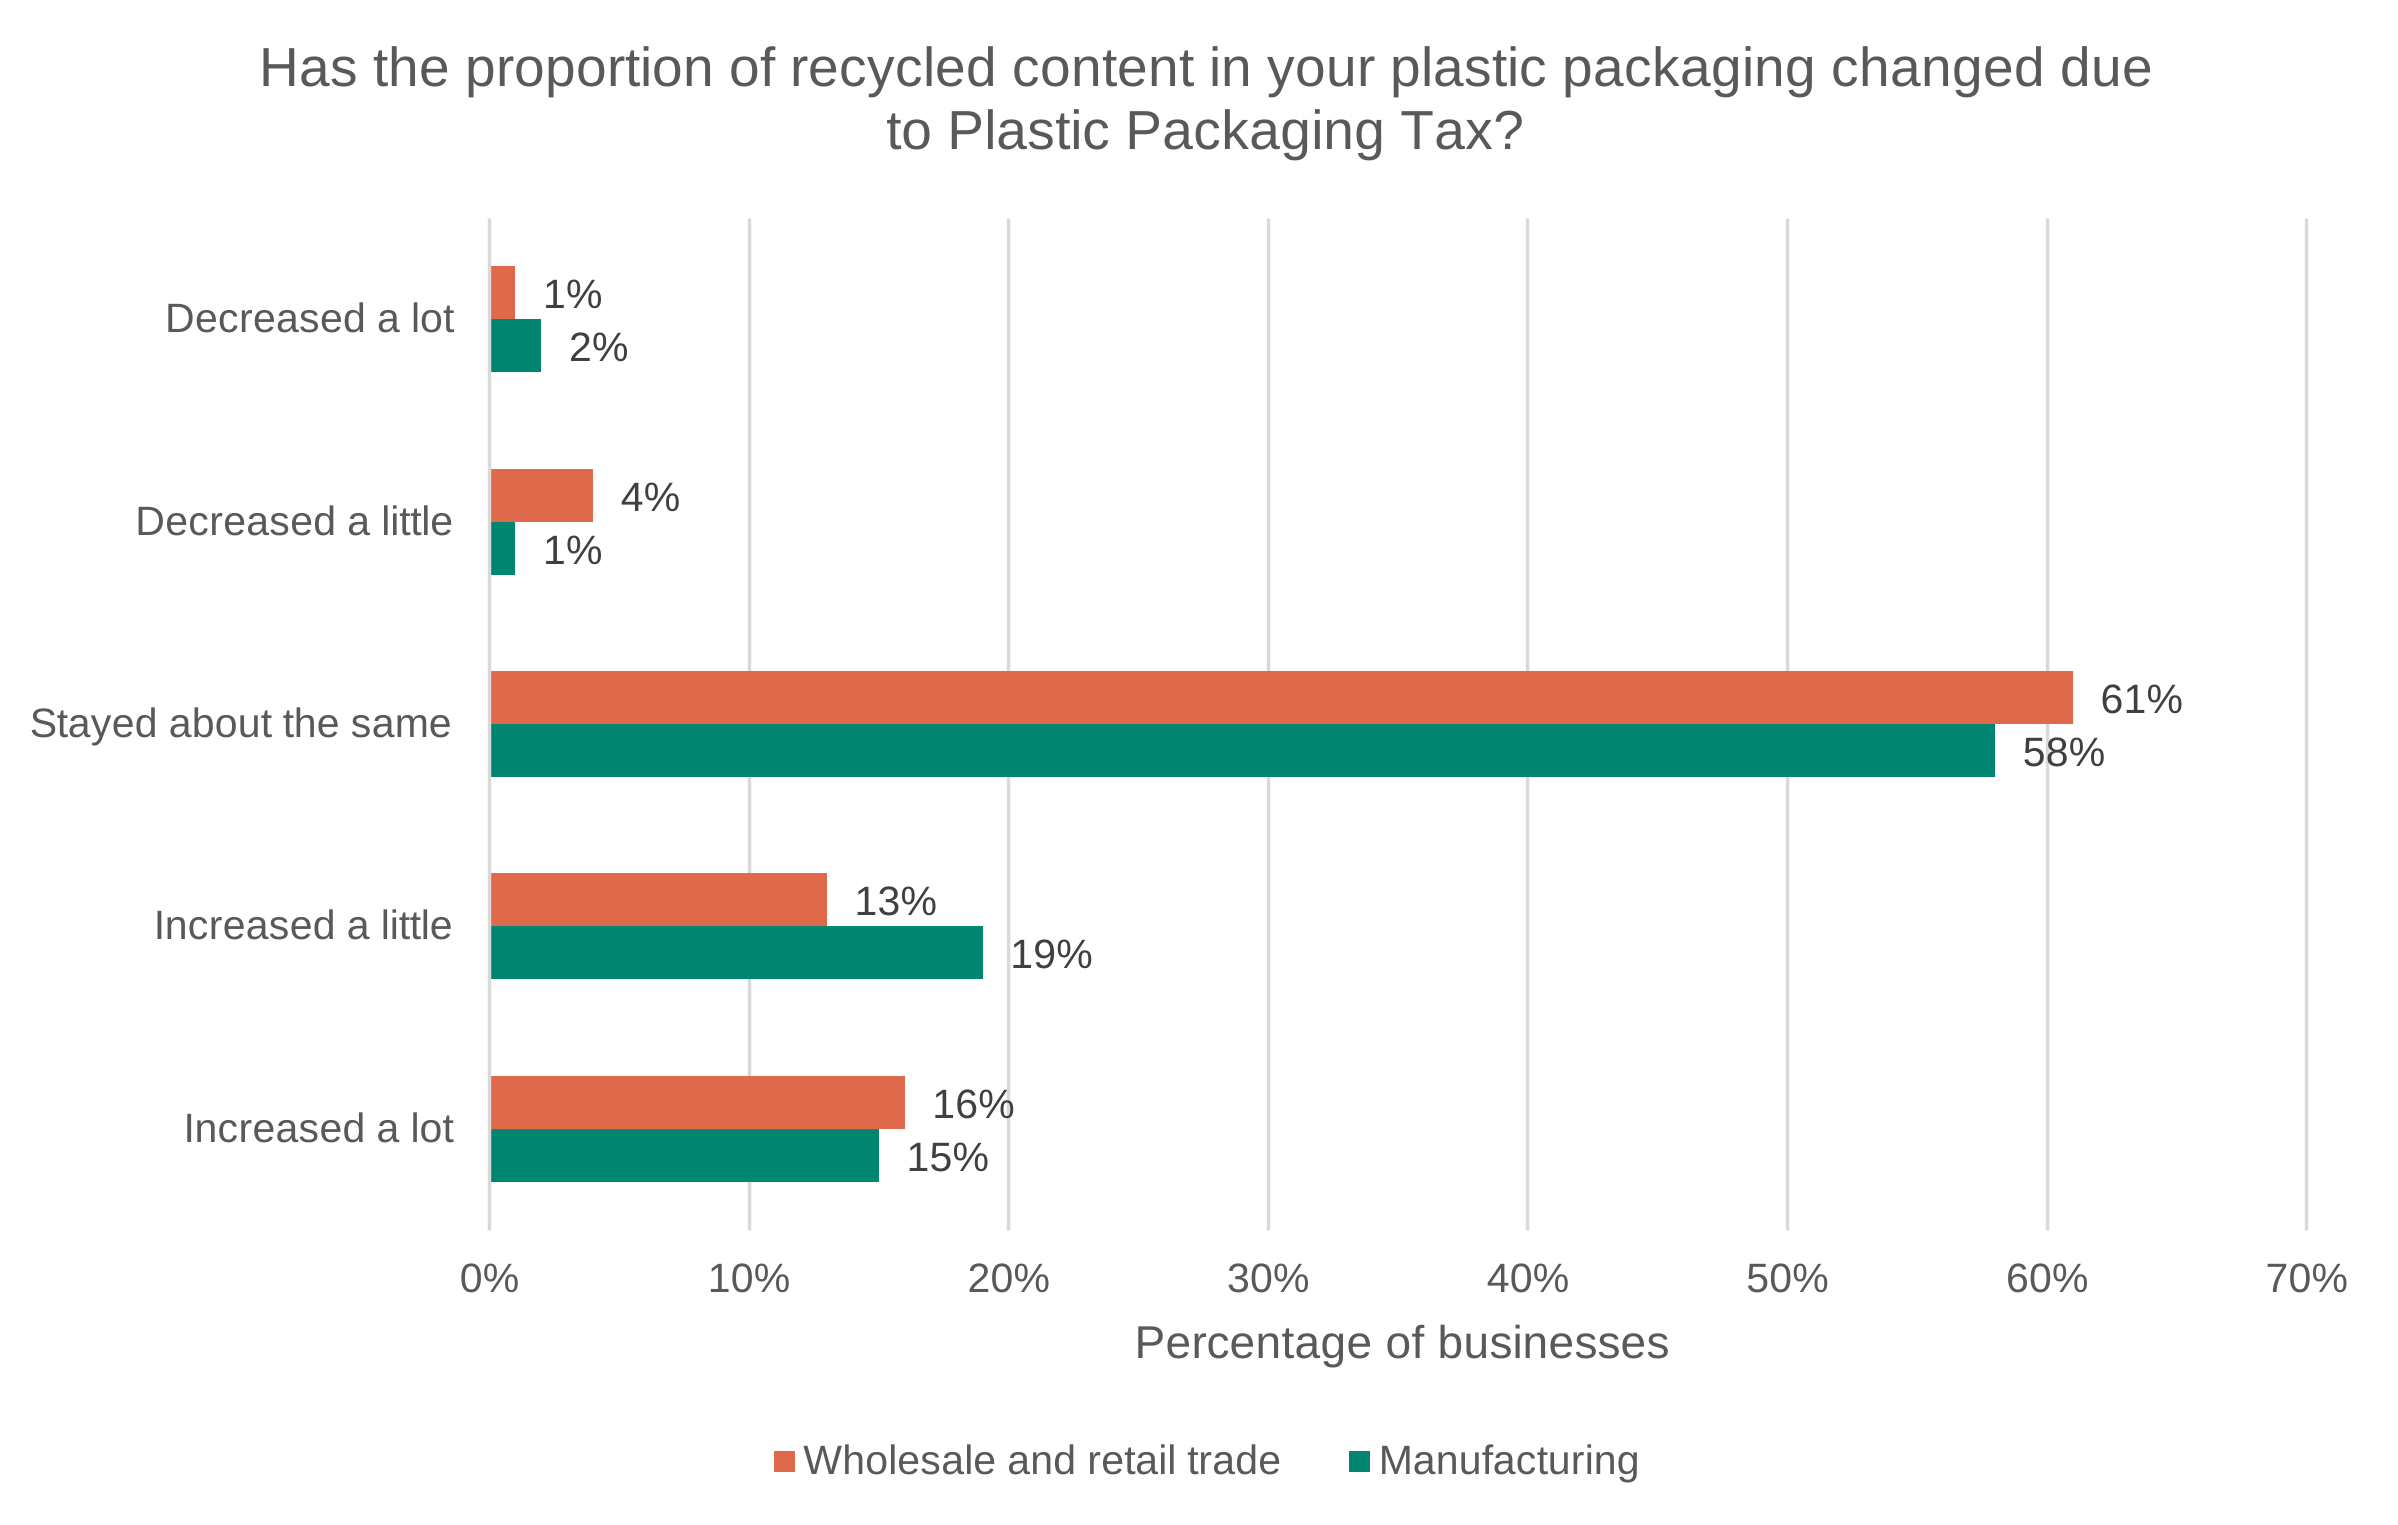
Data for Figure 5.10: Survey results for the question ‘Has the proportion of recycled content in your plastic packaging changed due to Plastic Packaging Tax?’ broken down by main economic sector.
The base for Manufacturing is 426 and for Wholesale and Retail Trade it is 481. Source: Ipsos.
| Category | Manufacturing | Wholesale and retail trade |
|---|---|---|
| Decreased a lot | 2% | 1% |
| Decreased a little | 1% | 4% |
| Stayed about the same | 58% | 61% |
| Increased a little | 19% | 13% |
| Increased a lot | 15% | 16% |
Across both manufacturing and wholesale and retail businesses, the most common response was that recycled content had remained broadly unchanged following the introduction of PPT. Around 3 in 5 businesses in each sector reported no change, while a sizeable minority reported increases in recycled content. Overall, there is limited evidence of substantial differences between these broad sector groupings.
More noticeable differences emerge when examining businesses directly involved in the production of plastic packaging. Businesses operating in the plastic-packaging sector were significantly more likely to report increases in recycled content than businesses in the food and beverage industries and other sectors. Around half of plastic-packaging businesses reported some increase in recycled content, compared with around one-fifth of businesses in the other sector groupings. At the same time, plastic-packaging businesses were less likely to report that recycled content had remained unchanged.
These findings are consistent with earlier results in the chapter which suggest that businesses with greater control over packaging design, material selection and production processes are more able to respond to the incentives created by PPT. This may help explain why businesses directly involved in manufacturing plastic packaging reported stronger behavioural responses than businesses further downstream in the supply chain.
Differences in reported barriers also support this interpretation. Businesses in wholesale and retail activities were more likely to report supply-related constraints, while manufacturers more frequently reported technical, commercial and customer-demand barriers. However, these differences appear more closely related to businesses’ roles within the supply chain than to sector classification itself. Detailed results on barriers are provided in Section C.2.5 in Annex C.
Overall, there is limited evidence that sector is a major determinant of behavioural response to PPT. Businesses across sectors reported broadly similar changes in both plastic packaging use and recycled-content levels. Where more substantial differences emerge, these are concentrated amongst businesses directly involved in producing plastic packaging. Taken together, the findings suggest that variation in response to PPT is better explained by businesses’ level of control over packaging decisions and their position within the supply chain than by sectoral characteristics alone.
5.4.6 Other variation
Additional analysis was undertaken to explore whether recycled-content outcomes differed according to a range of business characteristics, including the volume of packaging handled, business size and business location. These characteristics provide further insight into how different businesses have responded to PPT and whether certain groups appear better positioned to increase recycled content in plastic packaging.
Section C.2.6 in Annex C covers a more comprehensive overview of other characteristics and variation, covering variation by volume of packaging handled, business size (revenue and number of employees), and business location.
Businesses were grouped into quintiles based on the volume of plastic packaging they handled overall. These quintiles are constructed separately for each financial year and ordered from the lowest 20% of businesses to the highest 20%, such that each group represents approximately one fifth of businesses. As a result, the quintiles provide a consistent way of comparing the observable changes in businesses relative to how much packaging they handle.
Figure 5.11 shows that businesses handling larger volumes of plastic packaging were more likely to have packaging meeting the 30% recycled content threshold, whereas businesses handling smaller volumes of packaging were less likely to do so. The proportion of businesses handling any packaging meeting the 30% recycled content threshold in the highest quintile also increased by more percentage points across the period of evaluation than any of the other quintiles, suggesting a greater response to the tax for businesses handling the most packaging.
Figure 5.11: Proportion of businesses meeting the 30% recycled content threshold to any degree, by volume of plastic packaging handled quintiles.
Source: HMRC.
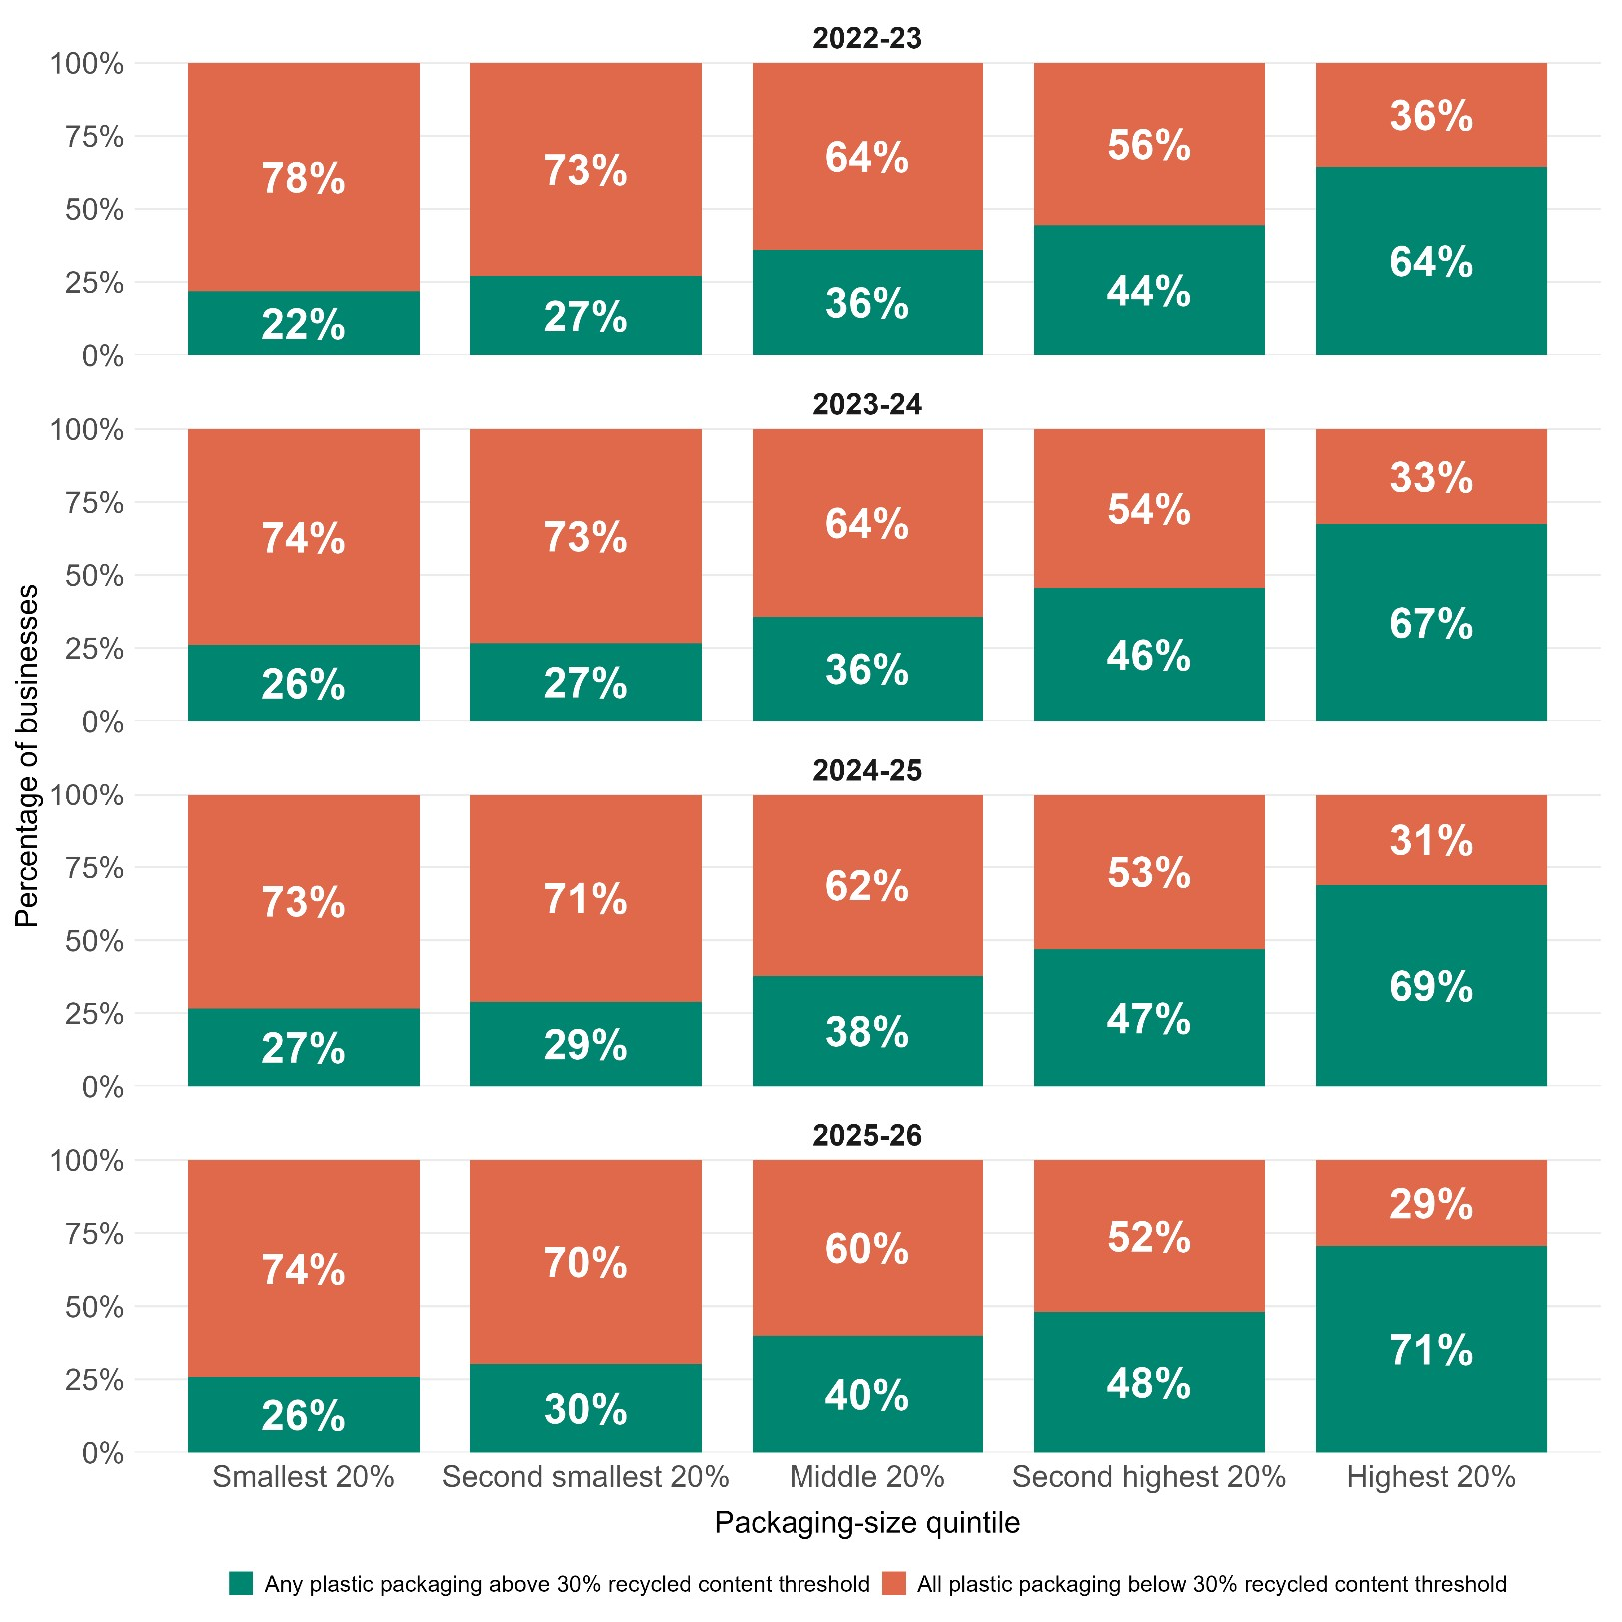
Data for Figure 5.11 (2022–23): Proportion of businesses meeting the 30% recycled content threshold to any degree, by volume of plastic packaging handled quintiles.
Source: HMRC.
| Packaging-size quintile (2022–23) | Percentage of businesses with any plastic packaging above 30% recycled content threshold | Percentage of businesses with all plastic packaging below 30% recycled content threshold |
|---|---|---|
| Smallest 20% | 21.8% | 78.2% |
| Second smallest 20% | 27.0% | 73.0% |
| Middle 20% | 36.0% | 64.0% |
| Second highest 20% | 44.4% | 55.6% |
| Highest 20% | 64.3% | 35.7% |
Data for Figure 5.11 (2023–24): Proportion of businesses meeting the 30% recycled content threshold to any degree, by volume of plastic packaging handled quintiles.
Source: HMRC.
| Packaging-size quintile (2023–24) | Percentage of businesses with any plastic packaging above 30% recycled content threshold | Percentage of businesses with all plastic packaging below 30% recycled content threshold |
|---|---|---|
| Smallest 20% | 26.0% | 74.0% |
| Second smallest 20% | 26.6% | 73.4% |
| Middle 20% | 35.8% | 64.2% |
| Second highest 20% | 45.6% | 54.4% |
| Highest 20% | 67.5% | 32.5% |
Data for Figure 5.11 (2024–25): Proportion of businesses meeting the 30% recycled content threshold to any degree, by volume of plastic packaging handled quintiles.
Source: HMRC.
| Packaging-size quintile (2024–25) | Percentage of businesses with any plastic packaging above 30% recycled content threshold | Percentage of businesses with all plastic packaging below 30% recycled content threshold |
|---|---|---|
| Smallest 20% | 26.7% | 73.3% |
| Second smallest 20% | 29.0% | 71.0% |
| Middle 20% | 37.7% | 62.3% |
| Second highest 20% | 46.8% | 53.2% |
| Highest 20% | 69.0% | 31.0% |
Data for Figure 5.11 (2025–26): Proportion of businesses meeting the 30% recycled content threshold to any degree, by volume of plastic packaging handled quintiles.
Source: HMRC.
| Packaging-size quintile (2025–26) | Percentage of businesses with any plastic packaging above 30% recycled content threshold | Percentage of businesses with all plastic packaging below 30% recycled content threshold |
|---|---|---|
| Smallest 20% | 25.8% | 74.2% |
| Second smallest 20% | 30.3% | 69.7% |
| Middle 20% | 39.9% | 60.1% |
| Second highest 20% | 47.9% | 52.1% |
| Highest 20% | 70.6% | 29.4% |
While Figure 5.11 examines the proportion of businesses meeting the threshold, it does not show how much packaging is represented by those businesses. Additional analysis therefore examined the distribution of packaging quantities across the packaging-volume quintiles, shown in Figure 5.12.
Figure 5.12: Percentage of total annual packaging handled by businesses in each volume of plastic packaging handled quintiles.
Source: HMRC.
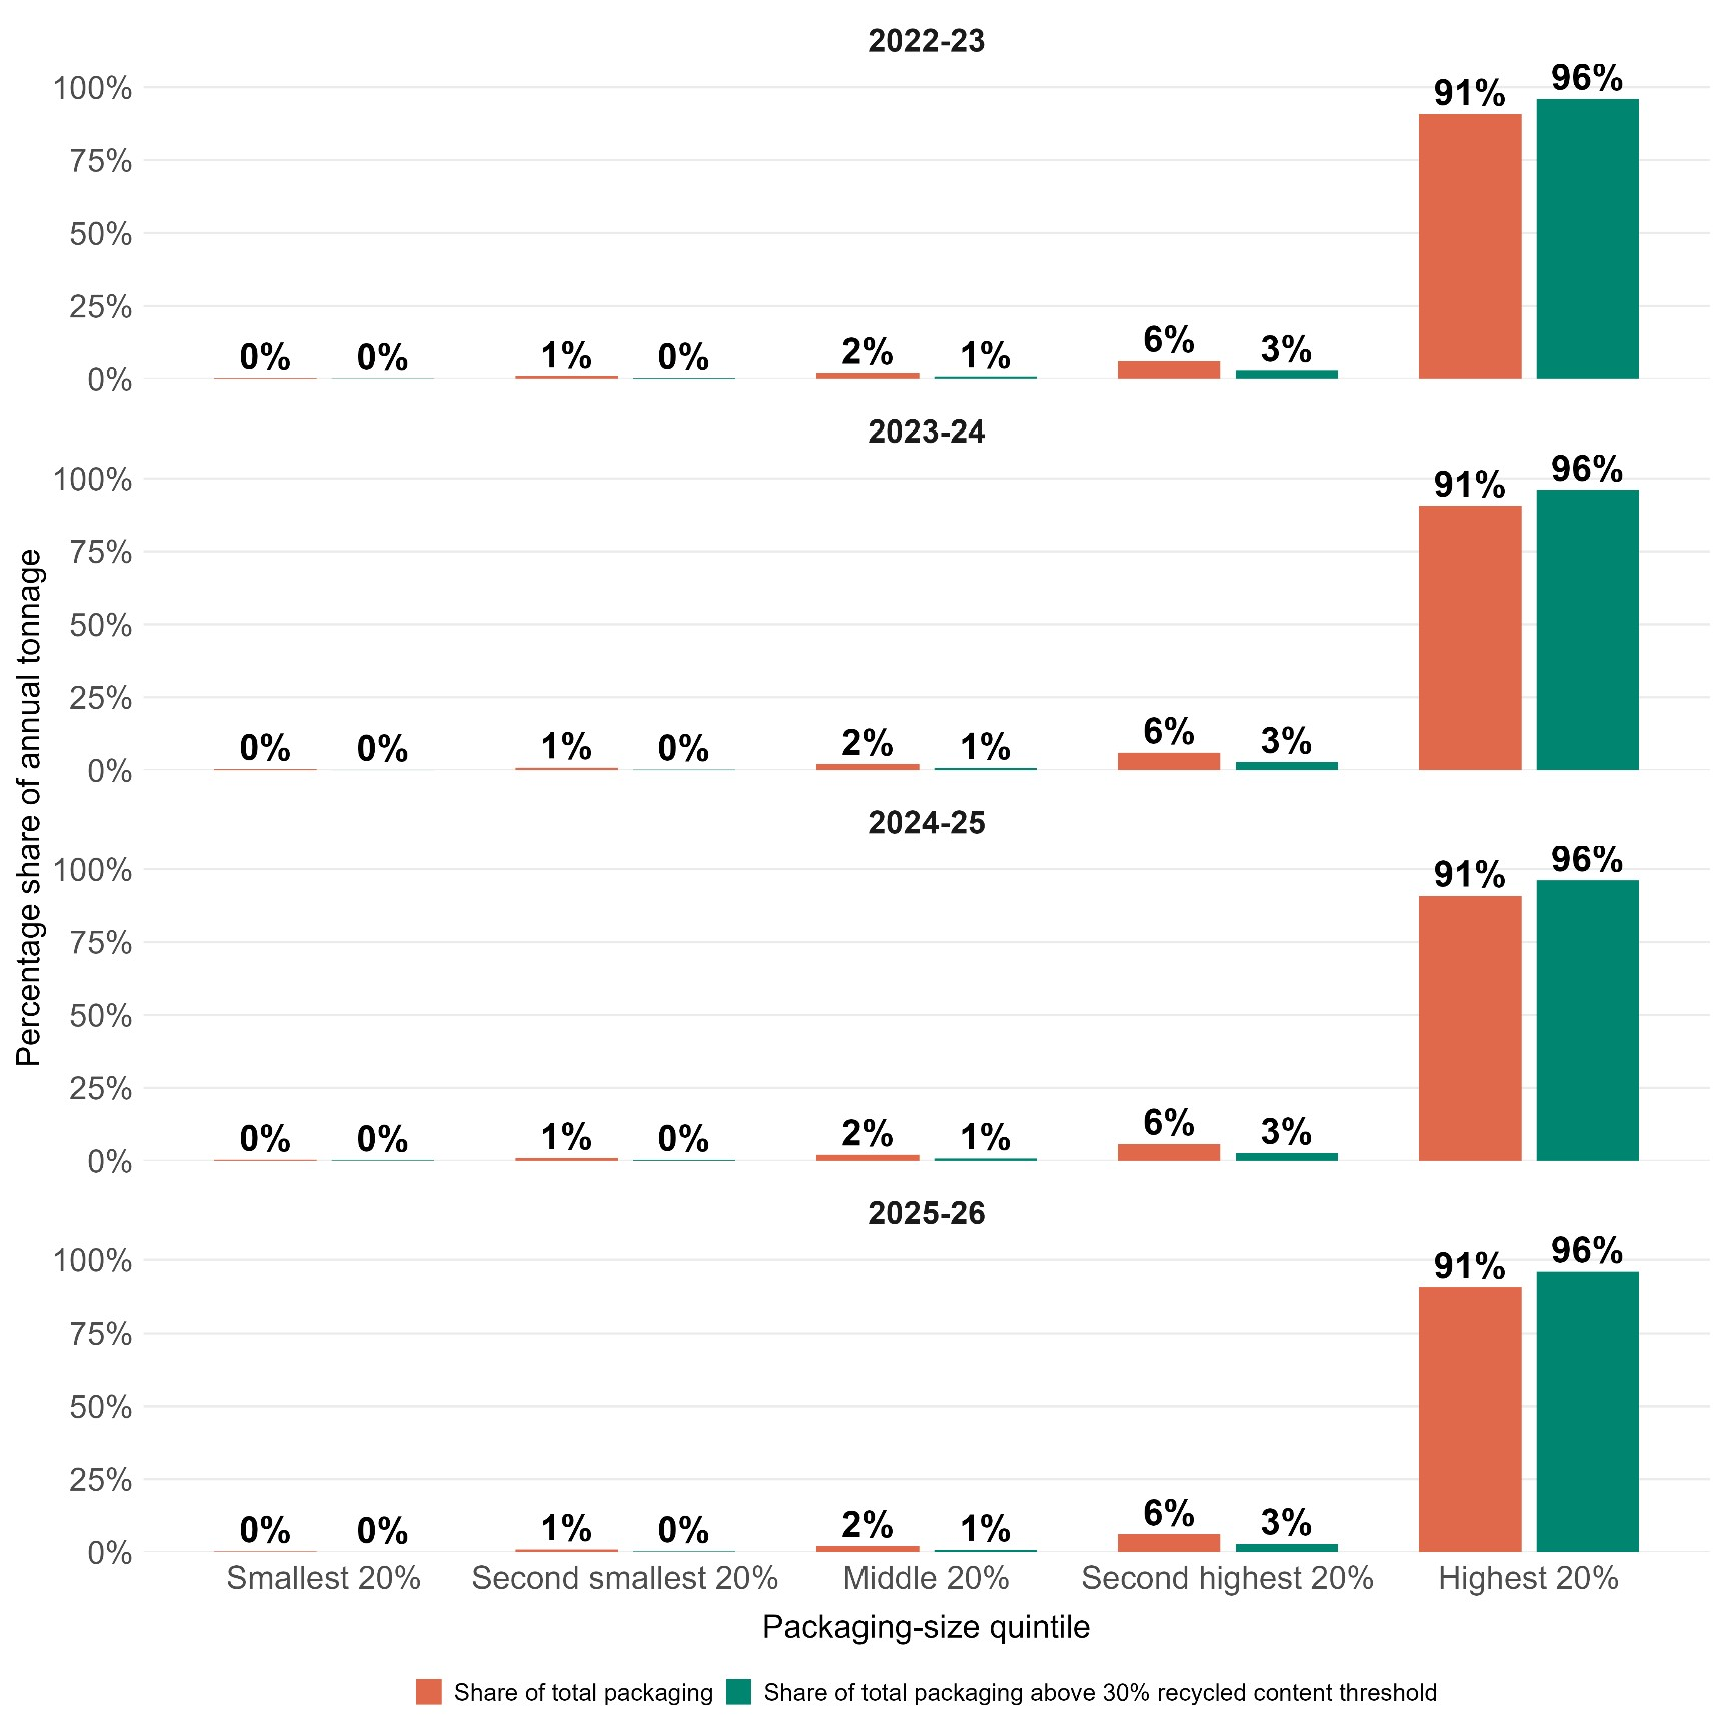
Data for Figure 5.12 (2022–23): Percentage of total annual packaging handled by businesses in each volume of plastic packaging handled quintiles.
Source: HMRC.
| Packaging-size quintile (2022–23) | Share of total packaging | Share of total packaging above 30% recycled content threshold |
|---|---|---|
| Smallest 20% | 0% | 0% |
| Second smallest 20% | 1% | 0% |
| Middle 20% | 2% | 1% |
| Second highest 20% | 6% | 3% |
| Highest 20% | 91% | 96% |
Data for Figure 5.12 (2023–24): Percentage of total annual packaging handled by businesses in each volume of plastic packaging handled quintiles.
Source: HMRC.
| Packaging-size quintile (2023–24) | Share of total packaging | Share of total packaging above 30% recycled content threshold |
|---|---|---|
| Smallest 20% | 0% | 0% |
| Second smallest 20% | 1% | 0% |
| Middle 20% | 2% | 1% |
| Second highest 20% | 6% | 3% |
| Highest 20% | 91% | 96% |
Data for Figure 5.12 (2024–25): Percentage of total annual packaging handled by businesses in each volume of plastic packaging handled quintiles.
Source: HMRC.
| Packaging-size quintile (2024–25) | Share of total packaging | Share of total packaging above 30% recycled content threshold |
|---|---|---|
| Smallest 20% | 0% | 0% |
| Second smallest 20% | 1% | 0% |
| Middle 20% | 2% | 1% |
| Second highest 20% | 6% | 3% |
| Highest 20% | 91% | 96% |
Data for Figure 5.12 (2025–26): Percentage of total annual packaging handled by businesses in each volume of plastic packaging handled quintiles.
Source: HMRC.
| Packaging-size quintile (2025–26) | Share of total packaging | Share of total packaging above 30% recycled content threshold |
|---|---|---|
| Smallest 20% | 0% | 0% |
| Second smallest 20% | 1% | 0% |
| Middle 20% | 2% | 1% |
| Second highest 20% | 6% | 3% |
| Highest 20% | 91% | 96% |
Figure 5.12 shows that 91% of all plastic packaging in the tax base is handled by businesses in the highest quintile. This share remained broadly stable throughout the evaluation period, varying by only 0.4 percentage points. The highest quintile was the only group whose share of packaging meeting the threshold exceeded its share of packaging overall. This suggests that packaging meeting the threshold is disproportionately concentrated among businesses handling the largest volumes of plastic packaging. This finding is consistent with the observation in Figure 5.11 and reinforces evidence that suggests larger packaging handlers are more likely to use relatively more packaging which meets the 30% threshold.
Figure 5.13: Proportion of packaging meeting the 30% recycled content threshold to any degree, by volume of plastic packaging handled quintiles.
Source: HMRC.
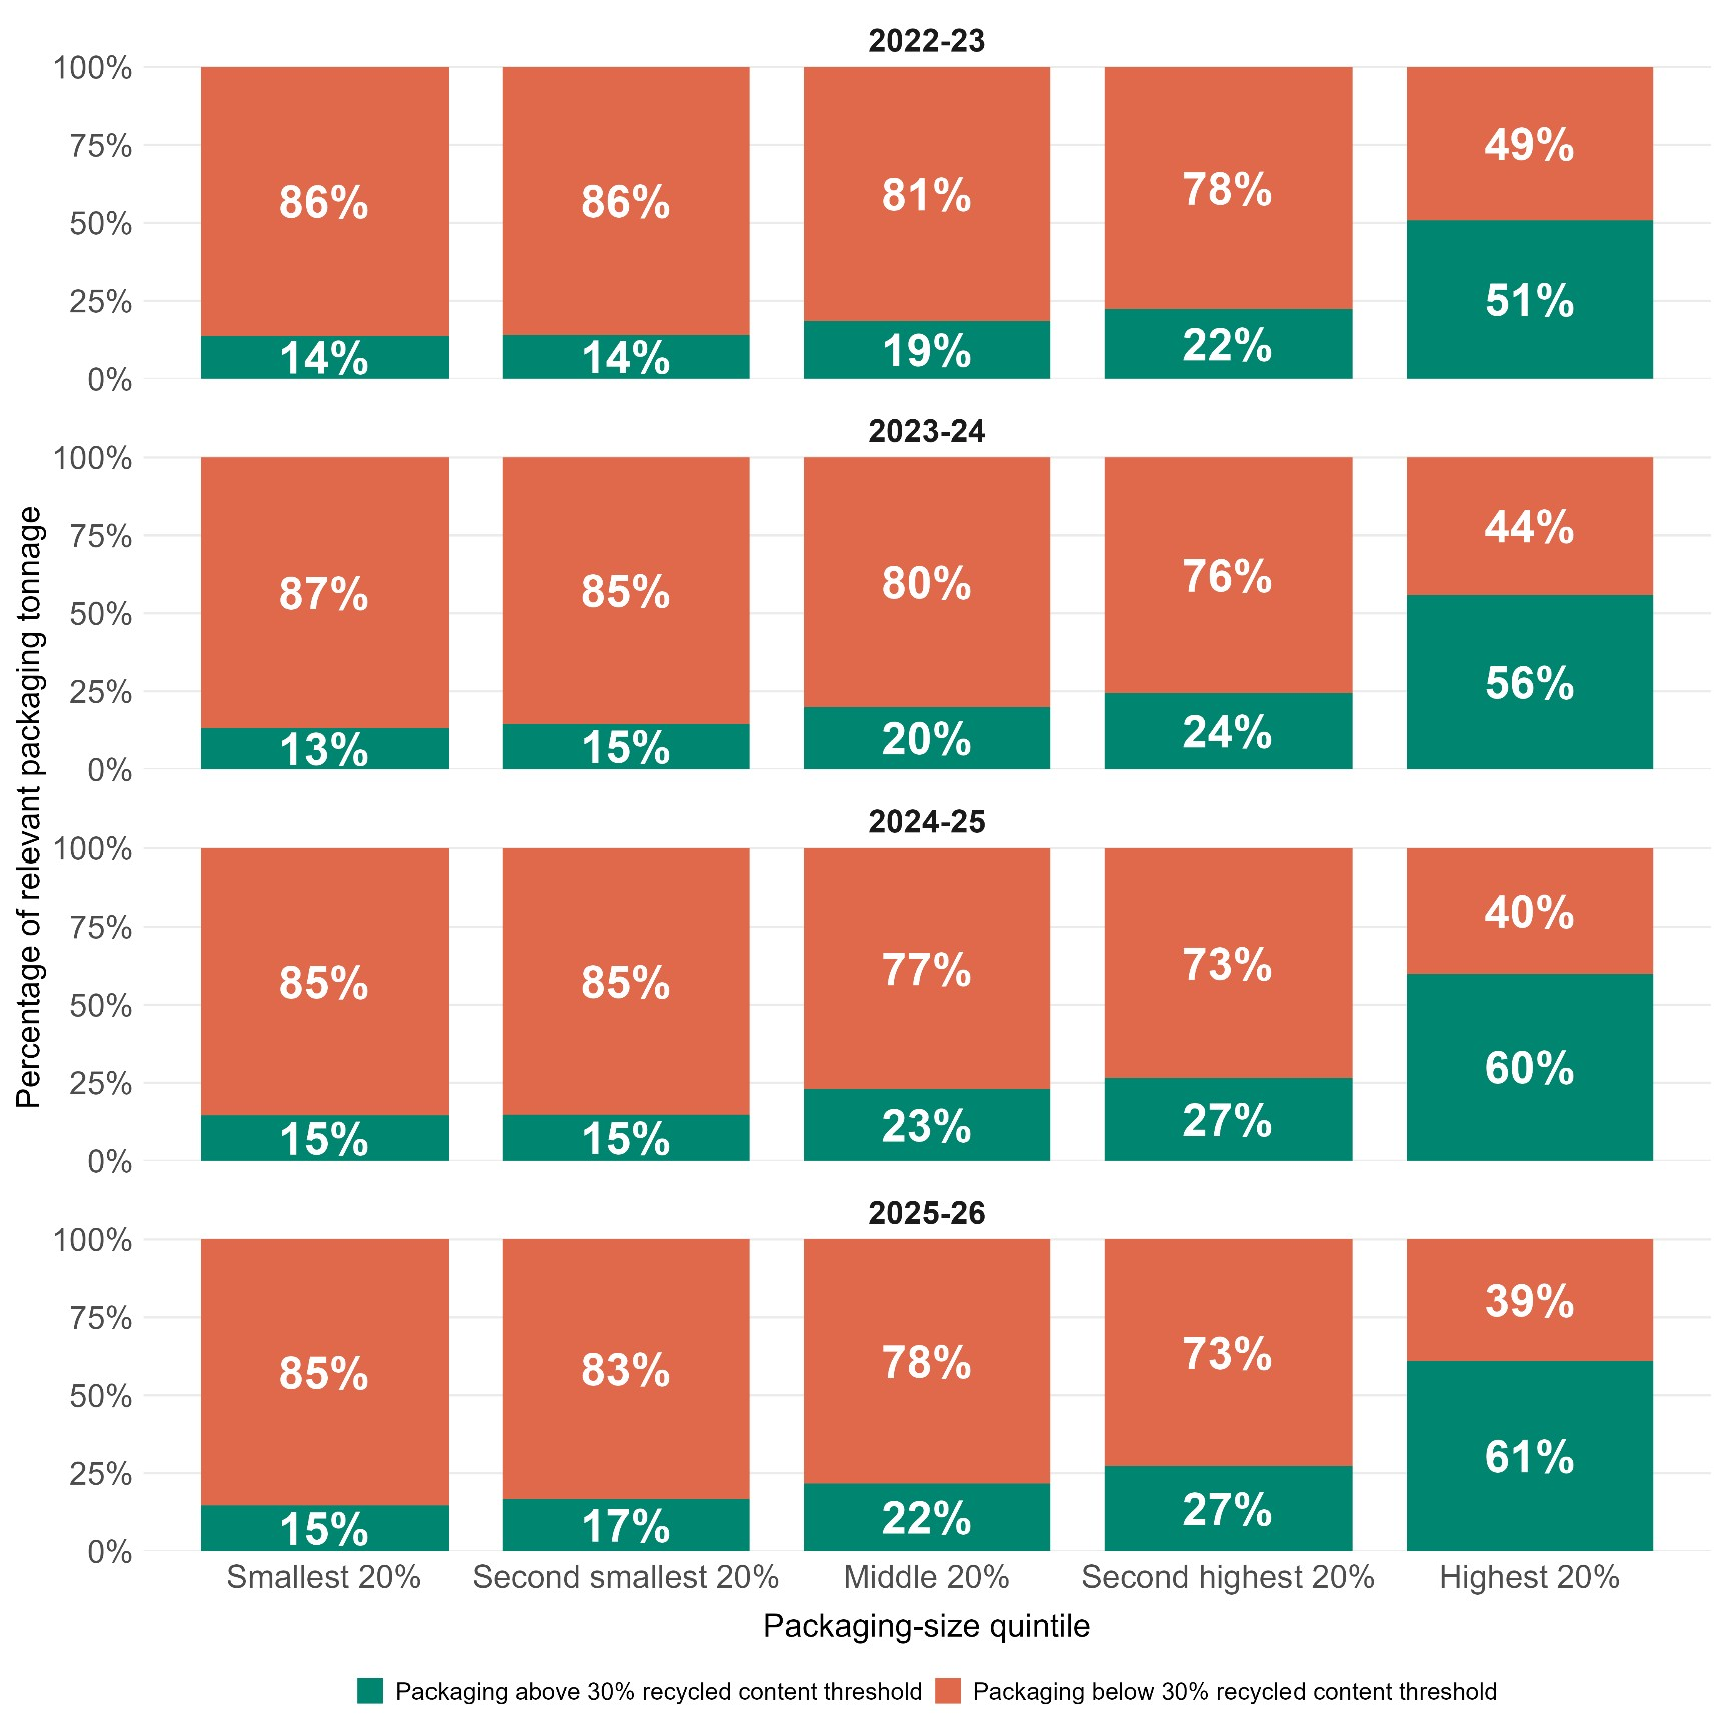
Data for Figure 5.13 (2022-23): Proportion of packaging meeting the 30% recycled content threshold to any degree, by volume of plastic packaging handled quintiles.
Source: HMRC.
| Packaging-size quintile (2022–23) | Percentage packaging above 30% recycled content threshold | Percentage packaging below 30% recycled content threshold |
|---|---|---|
| Smallest 20% | 13.8% | 86.2% |
| Second smallest 20% | 14.0% | 86.0% |
| Middle 20% | 18.5% | 81.5% |
| Second highest 20% | 22.2% | 77.8% |
| Highest 20% | 50.8% | 49.2% |
Data for Figure 5.13 (2023-24): Proportion of packaging meeting the 30% recycled content threshold to any degree, by volume of plastic packaging handled quintiles.
Source: HMRC.
| Packaging-size quintile (2023–24) | Percentage packaging above 30% recycled content threshold | Percentage packaging below 30% recycled content threshold |
|---|---|---|
| Smallest 20% | 13.2% | 86.8% |
| Second smallest 20% | 14.5% | 85.5% |
| Middle 20% | 20.0% | 80.0% |
| Second highest 20% | 24.5% | 75.5% |
| Highest 20% | 55.9% | 44.1% |
Data for Figure 5.13 (2024-25): Proportion of packaging meeting the 30% recycled content threshold to any degree, by volume of plastic packaging handled quintiles.
Source: HMRC.
| Packaging-size quintile (2024–25) | Percentage packaging above 30% recycled content threshold | Percentage packaging below 30% recycled content threshold |
|---|---|---|
| Smallest 20% | 14.5% | 85.5% |
| Second smallest 20% | 14.8% | 85.2% |
| Middle 20% | 22.9% | 77.1% |
| Second highest 20% | 26.5% | 73.5% |
| Highest 20% | 60.0% | 40.0% |
Data for Figure 5.13 (2025-26): Proportion of packaging meeting the 30% recycled content threshold to any degree, by volume of plastic packaging handled quintiles.
Source: HMRC.
| Packaging-size quintile (2025–26) | Percentage packaging above 30% recycled content threshold | Percentage packaging below 30% recycled content threshold |
|---|---|---|
| Smallest 20% | 14.6% | 85.4% |
| Second smallest 20% | 16.8% | 83.2% |
| Middle 20% | 21.7% | 78.3% |
| Second highest 20% | 27.2% | 72.8% |
| Highest 20% | 61.1% | 38.9% |
While the previous chart showed where threshold-meeting packaging is located across the quintiles, Figure 5.13 shows what share of packaging in each quintile meets the threshold. Businesses in the highest quintile consistently had the largest proportion of packaging meeting the threshold. These businesses also increased their percentage by 10 percentage points between financial year 2022 to 2023 and 2025 to 2026. This is a greater increase than the lower quintiles, suggesting that the volume of packaging being handled may be associated with a business’ ability to change recycled content. This adds to the findings shown in the previous 2 charts and reinforces the conclusion that recycled content outcomes have improved most amongst those businesses which handle the largest volume of plastic packaging.
Although the absence of pre-implementation data prevents causal attribution, the evidence presented by analysis of the packaging volume quintiles is consistent in showing that businesses which handle greater volumes of packaging are more likely to have packaging that meets the recycled content threshold. This packaging is disproportionately concentrated in the highest quintile, those businesses handle a higher proportion of recycled packaging, and they have increased that proportion falling above the threshold more than the other quintiles since the implementation of PPT.
Larger businesses may be more likely to meet or exceed the recycled content threshold because they have stronger financial incentives in absolute terms, greater influence over packaging supply chains, and more resources to invest in packaging redesign and procurement changes. While PPT may therefore have a greater behavioural effect among large packaging handlers, pre-existing differences in sustainability practices and recycled-content usage mean the findings should not be interpreted as evidence that volume of packaging handled alone leads to higher recycled content.
Analysis by PPT tax liability shows businesses with the lowest PPT liabilities were substantially more likely to have packaging meeting the 30% recycled-content threshold than businesses with higher liabilities. Although lower liabilities are partly associated with simply handling smaller quantities of packaging, businesses in the lowest liability quintile are drawn from all packaging volume quintiles, suggesting that greater use of recycled content is equally important. However, as tax liability is determined by whether packaging meets the recycled-content threshold, these results only demonstrate association rather than any causal relationship.
Survey evidence indicates more limited variation in behavioural responses by business size. Most businesses, regardless of employee numbers or turnover, reported that the proportion of recycled content in their packaging had remained broadly unchanged following the introduction of PPT. While some statistically significant differences were observed between specific size categories, there is limited evidence of a clear or consistent relationship between business size and the likelihood of increasing recycled content.
However, businesses of different sizes reported different barriers to increasing recycled content. Larger businesses were more likely to report supply-chain constraints relating to the availability of suitable recycled-content packaging, whereas smaller businesses more frequently cited cost pressures and weaker customer demand. This suggests that the constraints affecting behavioural change may vary across the business population even where behavioural outcomes are similar.
Analysis of business location and international footprint also identified some differences in reported responses to PPT. Businesses headquartered in the UK, and businesses without overseas manufacturing operations supplying the UK market, were more likely to report substantial increases in recycled content than internationally headquartered businesses and those operating overseas manufacturing sites. Although most businesses reported no change in recycled content regardless of location, these findings suggest that businesses with greater control over packaging decisions and supply chains may have greater capacity to respond to the incentives created by the tax. This interpretation is consistent with the findings presented earlier in the chapter regarding the differing experiences of manufacturers and importers.
Overall, the evidence suggests that recycled-content outcomes vary across a range of business characteristics. The clearest relationships are observed for packaging volume, with businesses handling larger volumes of packaging more likely to have packaging meeting the 30% recycled-content threshold. By contrast, behavioural responses appear to vary less by business size. There is also evidence that business location and international supply-chain structures influence the extent to which businesses are able to respond to PPT. These findings reinforce the wider conclusion that the effectiveness of PPT depends not only on the tax incentive itself, but also on the characteristics, capabilities and constraints of the businesses to which it applies.
5.5 Interpretation and conclusions
Overall, the evidence presented in this chapter demonstrates that behavioural responses to PPT have not been uniform across the tax base. While many businesses report little or no change in their use of recycled content or overall plastic packaging, there is clear evidence of variation in outcomes between different groups of businesses and the influence PPT has had on them. This variation appears to be associated with a range of business characteristics, including position within the supply chain, pre-existing environmental commitments, plastic types used, packaging volumes handled, business location, and operational structure.
Several characteristics are consistently associated with higher levels of recycled content, though the influence of the tax on these levels is less clear. These include domestic manufacturing rather than importing, larger volumes of packaging handled, and business structures that provide greater control over packaging decisions and material selection. Participation in voluntary environmental schemes, such as the UKPP, may further distort the effect that the PPT is having on plastic usage in packaging. However, the higher performance of businesses in the UKPP in terms of meeting the 30% recycled content threshold suggests there may be further scope for other businesses to improve outcomes if they are sufficiently incentivised. Conversely, businesses that are more reliant on upstream suppliers, international supply chains, or externally determined packaging specifications generally appear less able to increase recycled content in response to the incentives created by PPT.
The findings also suggest that differences in behavioural outcomes are not driven solely by the existence of the tax incentive itself, but by differences in businesses’ willingness and ability to act upon that incentive. Across the groups examined, businesses reported varying combinations of supply-side constraints, technical limitations, quality requirements, customer demand considerations, product specifications, and cost pressures. In many cases, these factors appear to shape the extent to which recycled content can be increased, regardless of the financial incentive created by PPT, yet other evidence suggests that these barriers are not insurmountable. It has been reported that paying the tax is often the more cost-effective outcome.
The evidence indicates that the effectiveness of PPT is influenced not only by the strength of the tax signal, but also by the characteristics of the businesses to which it applies. Businesses differ considerably in their capability, flexibility, and opportunity to adjust packaging composition, meaning that similar incentives can result in markedly different behavioural outcomes. Understanding this heterogeneity is therefore important for interpreting the overall impact of PPT and for understanding the circumstances in which the tax is most likely to encourage increased use of recycled plastic packaging.
Chapter 6: Wider influence of the Plastic Packaging Tax
6.1 Introduction
This chapter addresses the evaluation questions:
EQ3:
To what extent has PPT influenced businesses’ wider packaging choices (for example, design, materials used)?
EQ4:
To what extent have packaging materials changed due to substitution, reduction or removal of plastic as a material?
It examines the extent to which, and the ways in which, the introduction of PPT has influenced businesses in ways that are distinct from increasing the proportion of recycled content in packaging. The chapter explores the pass-through of the tax to determine how much of the economic burden sits on businesses. It analyses how businesses choose, design and invest in packaging, focusing on changes in manufacturing processes and the use of plastic relative to alternative packaging materials and formats. In particular, the chapter explores trends over time in the materials used in packaging placed on the UK market, including whether reductions in plastic are observed alongside changes in other packaging materials that may be consistent with substitution away from plastic packaging. In doing so, the chapter assesses how businesses responded to the cost signal created by PPT while also recognising that pass-through may have been just one component of a wider range of strategic responses adopted by businesses in scope of the tax.
6.2 Key findings
Key Finding 6.1:
Tax pass-through was a significant response to PPT. Of the businesses surveyed, 50% reported passing on the costs of PPT to customers, while 37% reported passing on none of the cost.
Key Finding 6.2:
Pass-through varied significantly across business characteristics. Manufacturers were substantially more likely than importers to pass through costs, while smaller and lower-turnover businesses were more likely to do so than larger businesses.
Key Finding 6.3:
Businesses that appeared more responsive to PPT were also more likely to pass through costs. UK-headquartered businesses, businesses reporting that PPT influenced their packaging strategy, and businesses that increased recycled content were all more likely to report passing on some or all PPT costs.
Key Finding 6.4:
Pass-through appears to have formed part of a wider response to PPT rather than a substitute for packaging changes. Businesses reporting packaging changes or increases in recycled content were also more likely to report pass-through, suggesting that pricing responses often occurred alongside operational changes in response to the tax.
Key Finding 6.5:
PPT influenced packaging strategy for many businesses, but its impact was typically moderate rather than transformative. Sixty per cent of businesses reported that PPT influenced their packaging strategy to some degree, although only 9% reported a significant influence, suggesting the tax often contributed to decisions rather than acting as the primary driver.
Key Finding 6.6:
Packaging decisions were shaped by a range of factors beyond PPT. Customer requirements, businesses’ own sustainability objectives, and other government policies and environmental regulations were among the most cited influences on packaging strategy, indicating that PPT operated within a broader commercial, environmental and regulatory landscape.
Key Finding 6.7:
Businesses reporting that PPT influenced their packaging strategy were more likely to be aware of changes in the cost and availability of recycled and virgin plastic. This suggests that awareness of plastic market conditions is associated with greater responsiveness to the incentive created by the tax.
Key Finding 6.8:
Price and availability signals were not highly salient across much of the tax base. Large proportions of businesses reported that they did not know whether the price or availability of virgin or recycled plastic had changed since the introduction of PPT, indicating that these market signals may not be visible to many businesses.
Key Finding 6.9:
The availability and cost of recycled plastic may constrain behavioural responses to PPT. Businesses influenced by PPT were more likely to identify recycled plastic market conditions as important considerations, highlighting that the tax’s effectiveness partly depends on the supply and affordability of recycled material.
Key Finding 6.10:
PPT appears to have influenced a range of packaging-related decisions beyond increasing recycled content. Businesses reported responses including testing alternative packaging options, reducing packaging weight or volume, adopting alternative materials, redesigning packaging, and changing suppliers, suggesting the tax has encouraged wider consideration of packaging choices.
Key Finding 6.11:
Among manufacturers, PPT was associated with investment in packaging innovation and production processes. Almost half of manufacturers reporting PPT influence identified at least one investment response, suggesting that in some cases the tax may be supporting longer-term changes in packaging design and production.
6.3 Analytical approach
This chapter primarily draws on quantitative and qualitative social research, supplemented by administrative data from PPT returns and external data sources including the NPWD and WRAP. The analysis explores whether businesses reported passing on the costs of PPT, changing their packaging strategies, or responding through other packaging-related actions. It also examines broader trends in packaging materials and plastic packaging to assess whether patterns in external data are consistent with findings from the social research.
Findings should be interpreted with caution. Social research provides evidence on businesses’ perceptions and reported behaviours, while observed changes in packaging trends may reflect a range of factors beyond PPT, including wider sustainability commitments, regulatory developments, cost pressures and changes in consumer demand. As a result, the analysis is descriptive and cannot isolate the definitive causal impact of the tax.
6.4 Supporting evidence
6.4.1 Pass-through
Pass-through is the extent to which businesses pass increased costs on to their customers through higher prices. The decision to pass through all or part of the cost of PPT is one measure of the influence of the tax and an indicator of how businesses may respond to it. In this chapter, pass-through is considered first because businesses may respond to PPT in commercial as well as operational ways. Pass-through may occur where businesses choose to reflect PPT costs in prices rather than fully absorbing them, and may be used either instead of, or alongside, other responses such as changing packaging design, material use, or recycled content.
Businesses that are unable to change the composition of their packaging may not pass through PPT costs if their ability to do so is constrained by limited bargaining power within the supply chain. Alternatively, some businesses may be in a stronger position to pass on the cost of PPT, such as in cases where competitors face the same tax shock, or where their customers are unwilling or unable to switch away from affected products, meaning demand may not fall substantially when prices rise.
Business responses, and the reasons for them, vary across products, sectors, business type, business size, headquarters location, and the influence of the tax in decisions around packaging strategy. The headline figures derived from quantitative research are shown in Figure 6.1, where 50% of surveyed businesses reported passing on all or part of the cost of PPT to their customers, while 37% passed on none of the cost.
Figure 6.1: Survey results for the question ‘To what extent has Plastic Packaging Tax affected your pricing for customers?’.
Base: All businesses (1,011). Source: Ipsos.
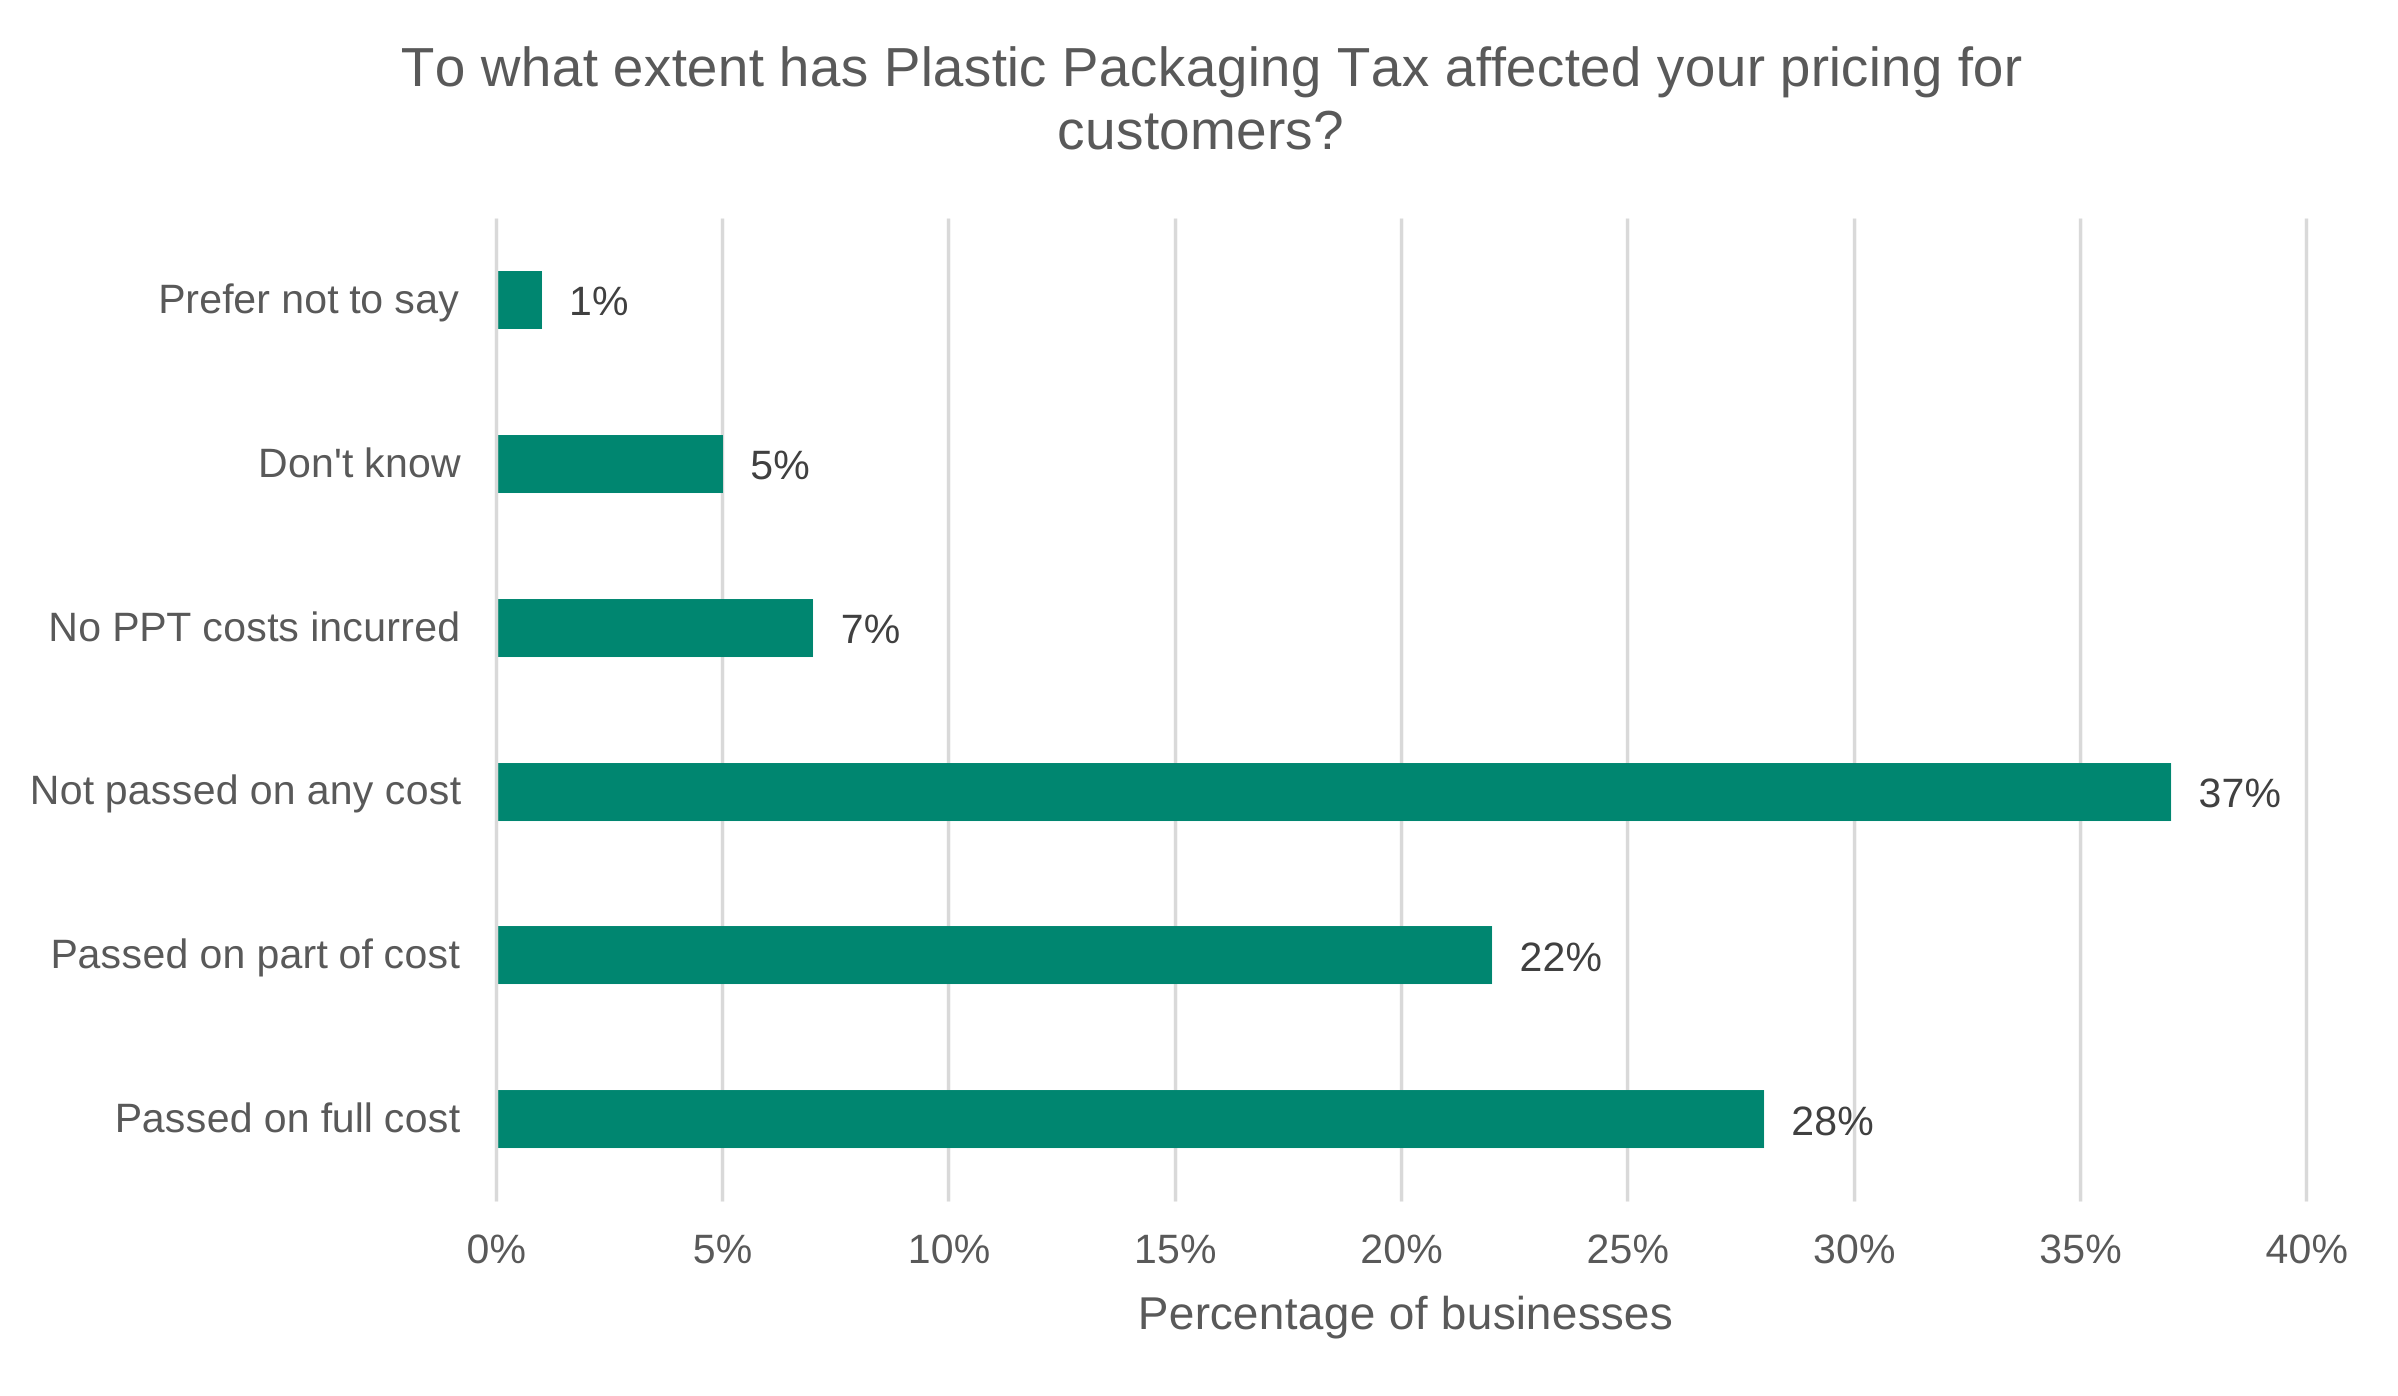
Data for Figure 6.1: Survey results for the question ‘To what extent has Plastic Packaging Tax affected your pricing for customers?’.
Base: All businesses (1,011). Source: Ipsos.
| Category | Percentage |
|---|---|
| Prefer not to say | 1% |
| Don’t know | 5% |
| No PPT costs incurred | 7% |
| Not passed on any cost | 37% |
| Passed on part of cost | 22% |
| Passed on full cost | 28% |
Figure 6.2 shows that manufacturers were the business type most likely to say they had passed through PPT costs to customers. 80% of manufacturers reported passing through some or all of the cost, compared with 44% of importers and 66% of businesses that both manufactured and imported plastic packaging. All pairwise differences between these 3 groups on this measure are statistically significant.
Figure 6.2: Survey results for the question ‘To what extent has Plastic Packaging Tax affected your pricing for customers?’.
Base: Manufacturers (91 — note), Importers (816), Both (104). Source: Ipsos.
Note: Manufacturers only is a relatively small sample, so results should be taken with caution.
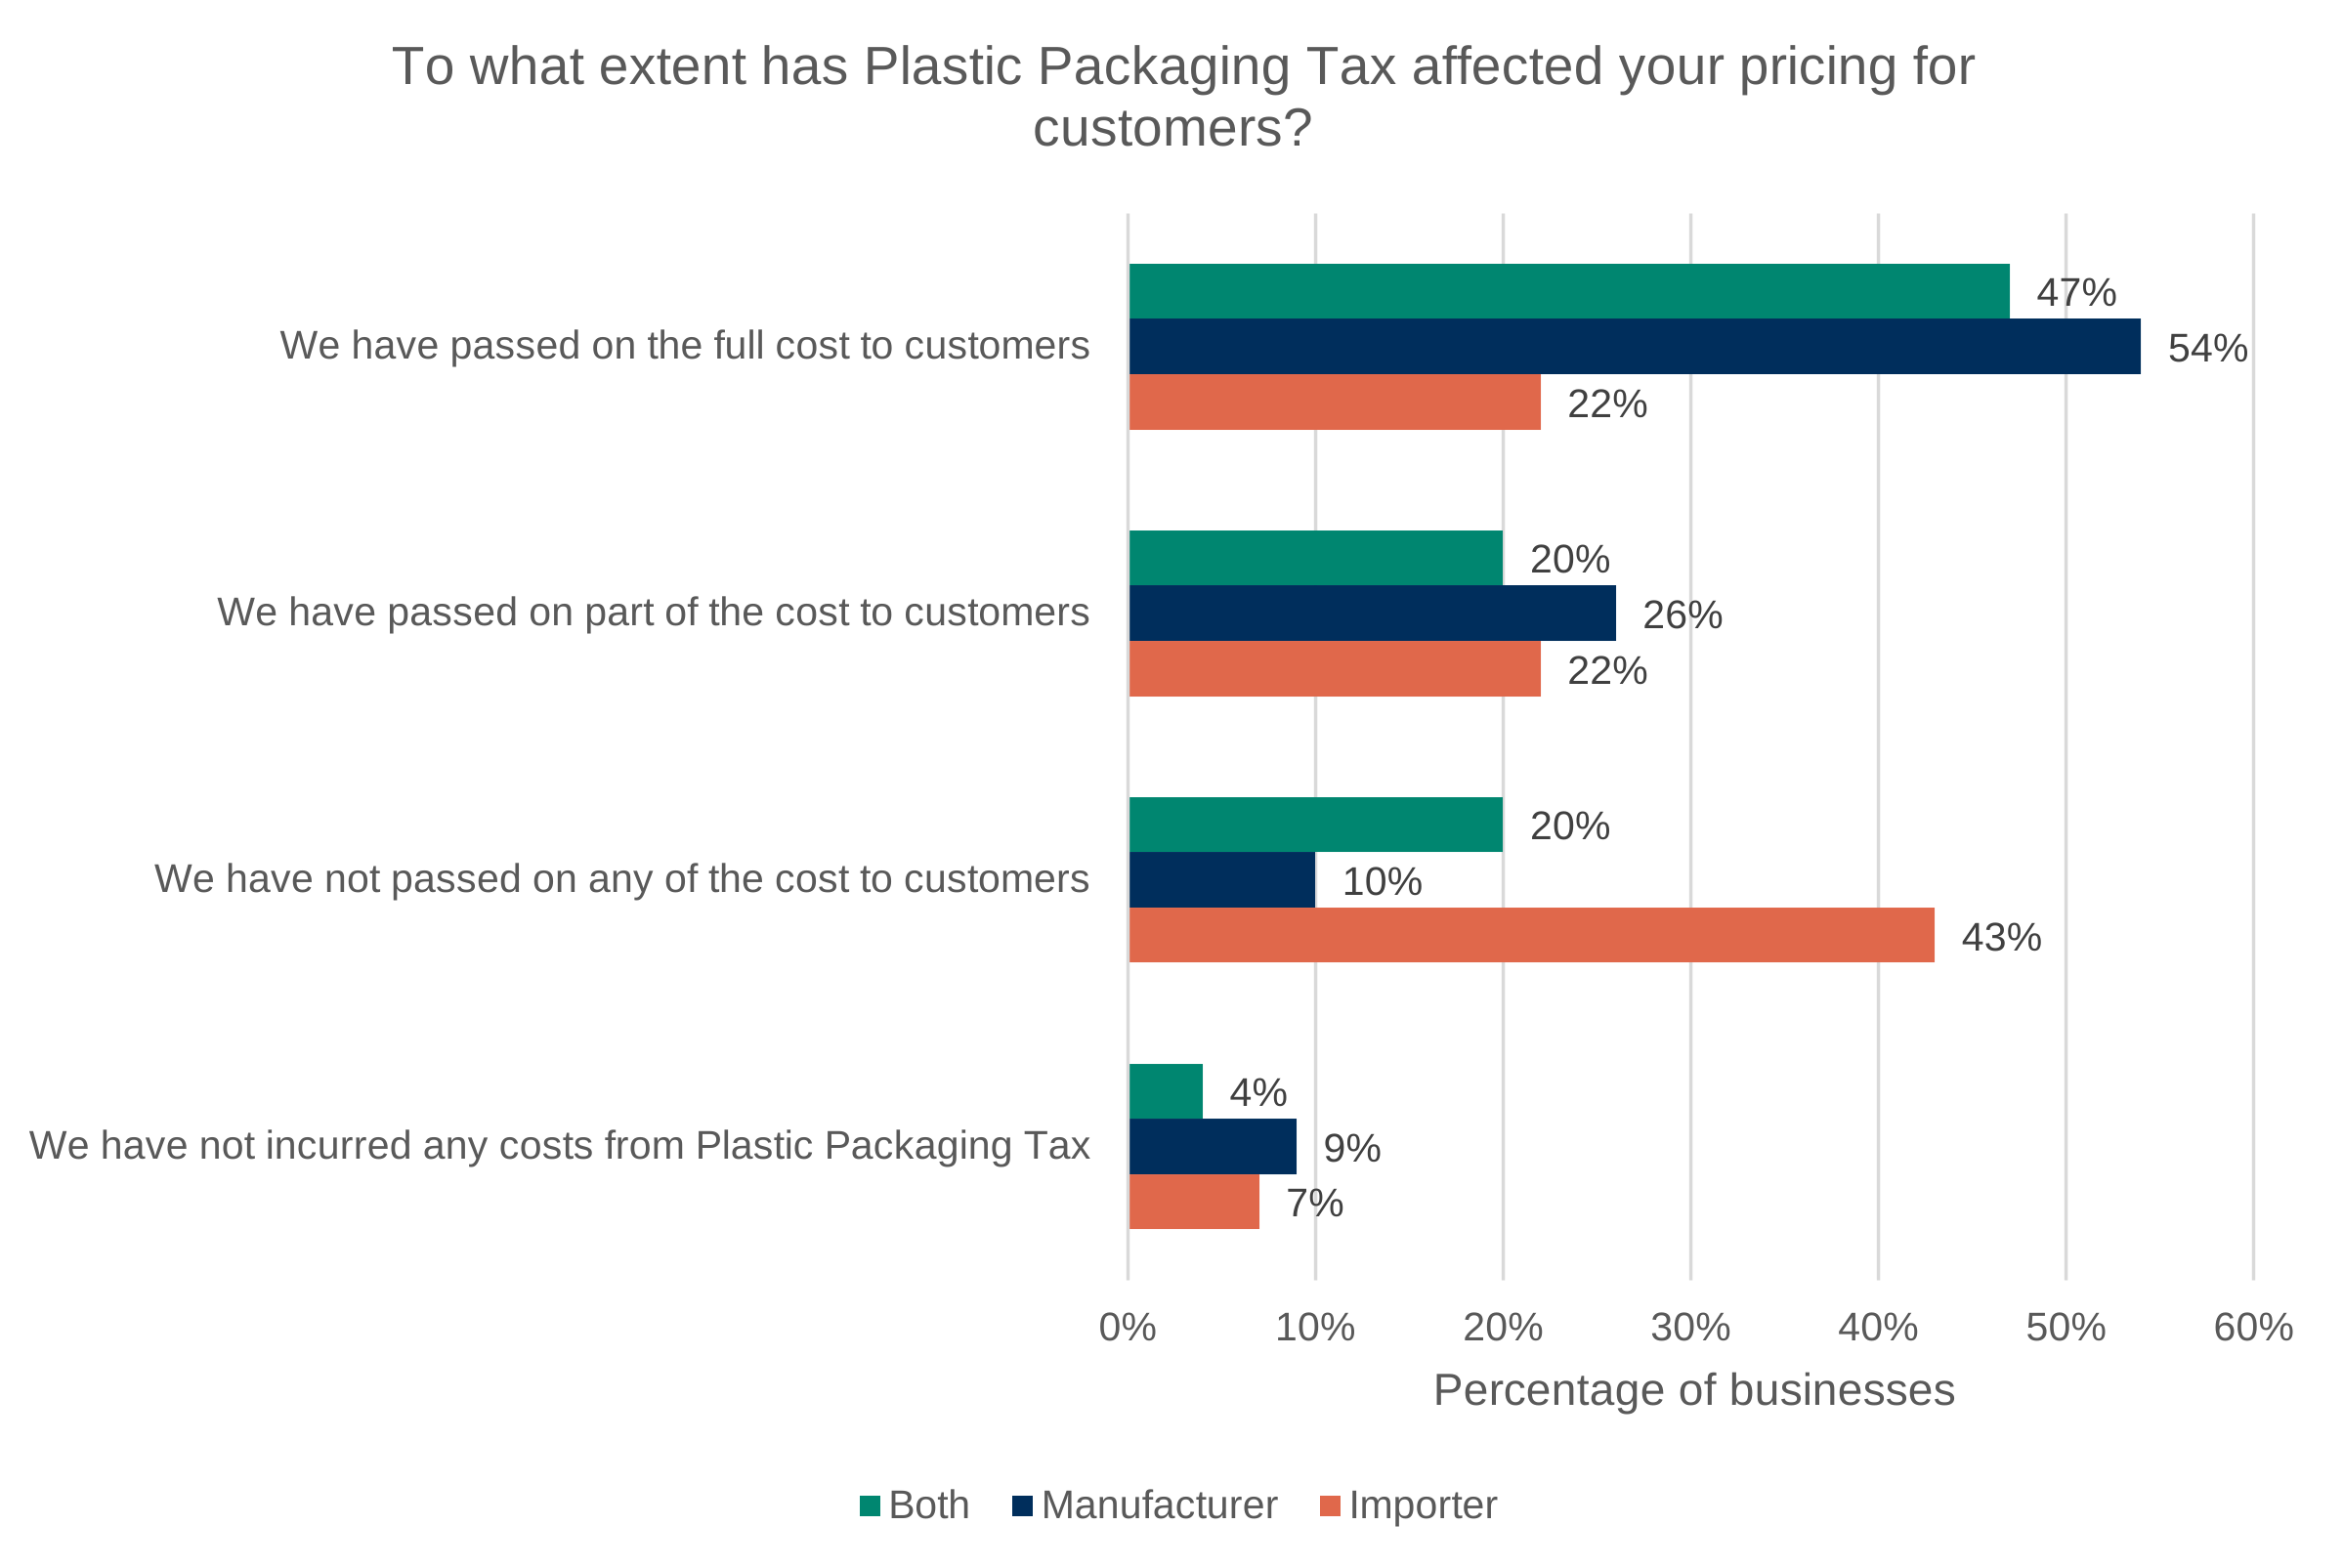
Data for Figure 6.2: Survey results for the question ‘To what extent has Plastic Packaging Tax affected your pricing for customers?’.
Base: Manufacturers (91 — note), Importers (816), Both (104). Source: Ipsos.
Note: Manufacturers only is a relatively small sample, so results should be taken with caution.
| Category | Both | Manufacturer | Importer |
|---|---|---|---|
| We have passed on the full cost to customers | 47% | 54% | 22% |
| We have passed on part of the cost to customers | 20% | 26% | 22% |
| We have not passed on any of the cost to customers | 20% | 10% | 43% |
| We have not incurred any costs from Plastic Packaging Tax | 4% | 9% | 7% |
Importers were the most likely business type to say they had not passed through any of the cost to customers. The difference between importers and the other 2 categories is statistically significant which suggests a meaningful difference between these groups. Figure 6.2 shows that 10% of manufacturers said they did not pass any costs through to customers, as opposed to 20% of businesses which both manufacture and import plastic packaging, and 43% of importers.
As manufacturers were also the business type most likely to say they had increased the recycled content of their packaging due to PPT, this suggests that as a group they may have more available response options, stronger incentives to pass through costs, or different cost structures from importers in their responses to PPT. This may reflect their position in the packaging supply chain and their greater ability to implement changes to the design and composition of their packaging products. While the quantitative research does not establish why manufacturers are more likely to pass through costs, this pattern is consistent with evidence elsewhere in the evaluation, with Section 5.4.1 in Chapter 5 containing further findings supporting this.
The earlier findings suggest that businesses that manufacture plastic packaging in any capacity have been more responsive to the tax when it comes to improving the recycled content in packaging (see Figure 5.1) and in response to the survey questions businesses that manufactured typically self-reported being more responsive to PPT (see Figure 5.2), reflecting greater control over production processes when compared to importers, who are more reliant on upstream suppliers. This does not imply that pass-through substituted for packaging changes as a response. Rather, manufacturers may have had greater scope to deploy more than one response to PPT, including both pricing changes and other operational changes related to packaging design.
There are also differences between the responses of businesses of different sizes. Large businesses (250 or more employees) were less likely to report passing through PPT costs to customers when compared to medium (50 to 249 employees), small (10 to 49 employees), and micro (1 to 9 employees) businesses. Figure 6.3 shows that 32% of large businesses passed through some or all of the PPT costs to customers as opposed to 48% of medium, 54% of small and 63% of micro businesses. The difference between the large category and the other 3 categories is statistically significant, as is the difference between the micro and medium categories.
Figure 6.3: Survey results for the question ‘To what extent has Plastic Packaging Tax affected your pricing for customers?’.
Base: Businesses of each of the following sizes: Micro (192), Small (334), Medium (303), Large (151). Source: Ipsos.
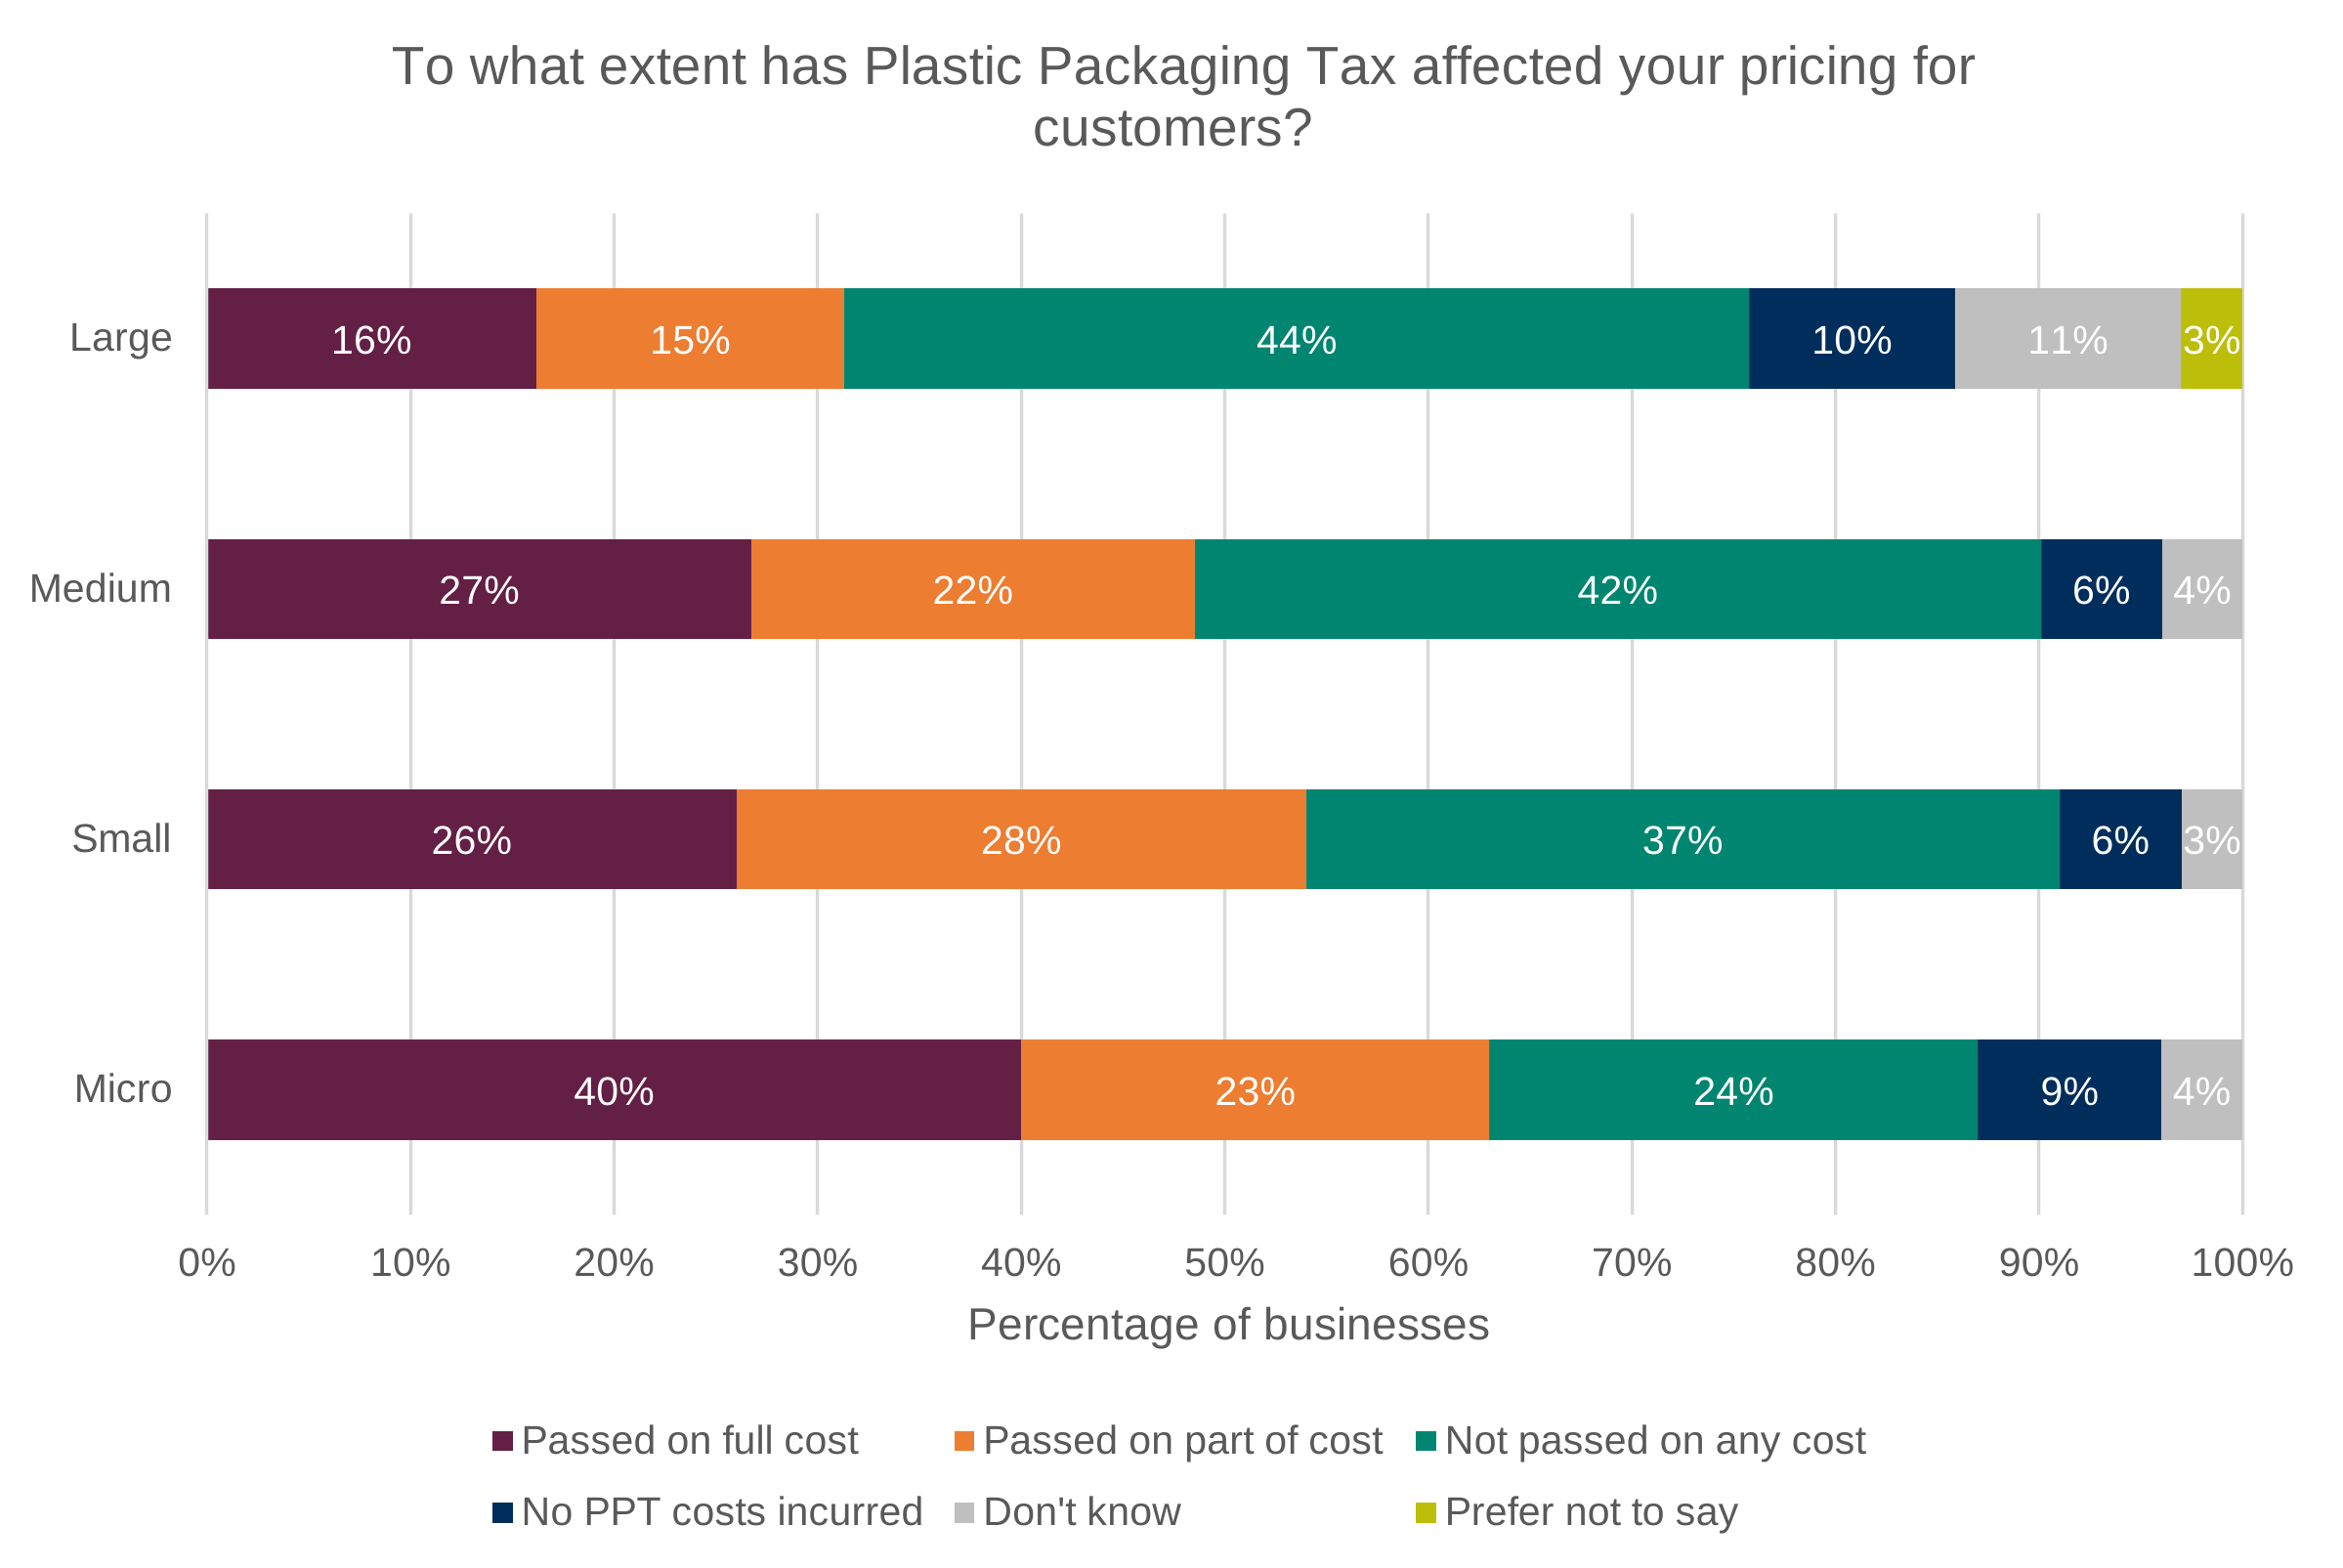
Data for Figure 6.3: Survey results for the question ‘To what extent has Plastic Packaging Tax affected your pricing for customers?’.
Base: Businesses of each of the following sizes: Micro (192), Small (334), Medium (303), Large (151). Source: Ipsos.
| Category | Passed on full cost | Passed on part of cost | Not passed on any cost | No PPT costs incurred | Don’t know | Prefer not to say |
|---|---|---|---|---|---|---|
| £100 million or more | 16% | 16% | 47% | 10% | 8% | 3% |
| £50 million to below £99.9 million | 19% | 27% | 48% | 1% | 6% | 0% |
| £10 million to below £49.9 million | 29% | 22% | 41% | 6% | 2% | 0% |
| £5 million to below £9.9 million | 28% | 26% | 34% | 9% | 3% | 0% |
| Less than £4.9 million | 44% | 24% | 19% | 11% | 2% | 0% |
This pattern is also visible when turnover is considered instead of number of employees. In general, lower turnover is associated with a greater percentage of businesses reporting passing through some or all of the costs of PPT to customers. The difference between the less than £5 million category and all other categories is statistically significant, as is the difference between the £100 million or more category and all other categories. Figure 6.4 shows that businesses in the less than £5 million category were more than twice as likely as those with a turnover of £100 million or more to report that they passed on some or all of the cost of PPT to their customers, at 69% and 32% respectively.
Figure 6.4: Survey results for the question ‘To what extent has Plastic Packaging Tax affected your pricing for customers?’.
Base: Businesses reporting a turnover of less than £5 million (183), £5 million to below £10 million (109), £10 million to below £50 million (354), £50 million to below £100 million (97), or £100 million or more (147). Source: Ipsos.
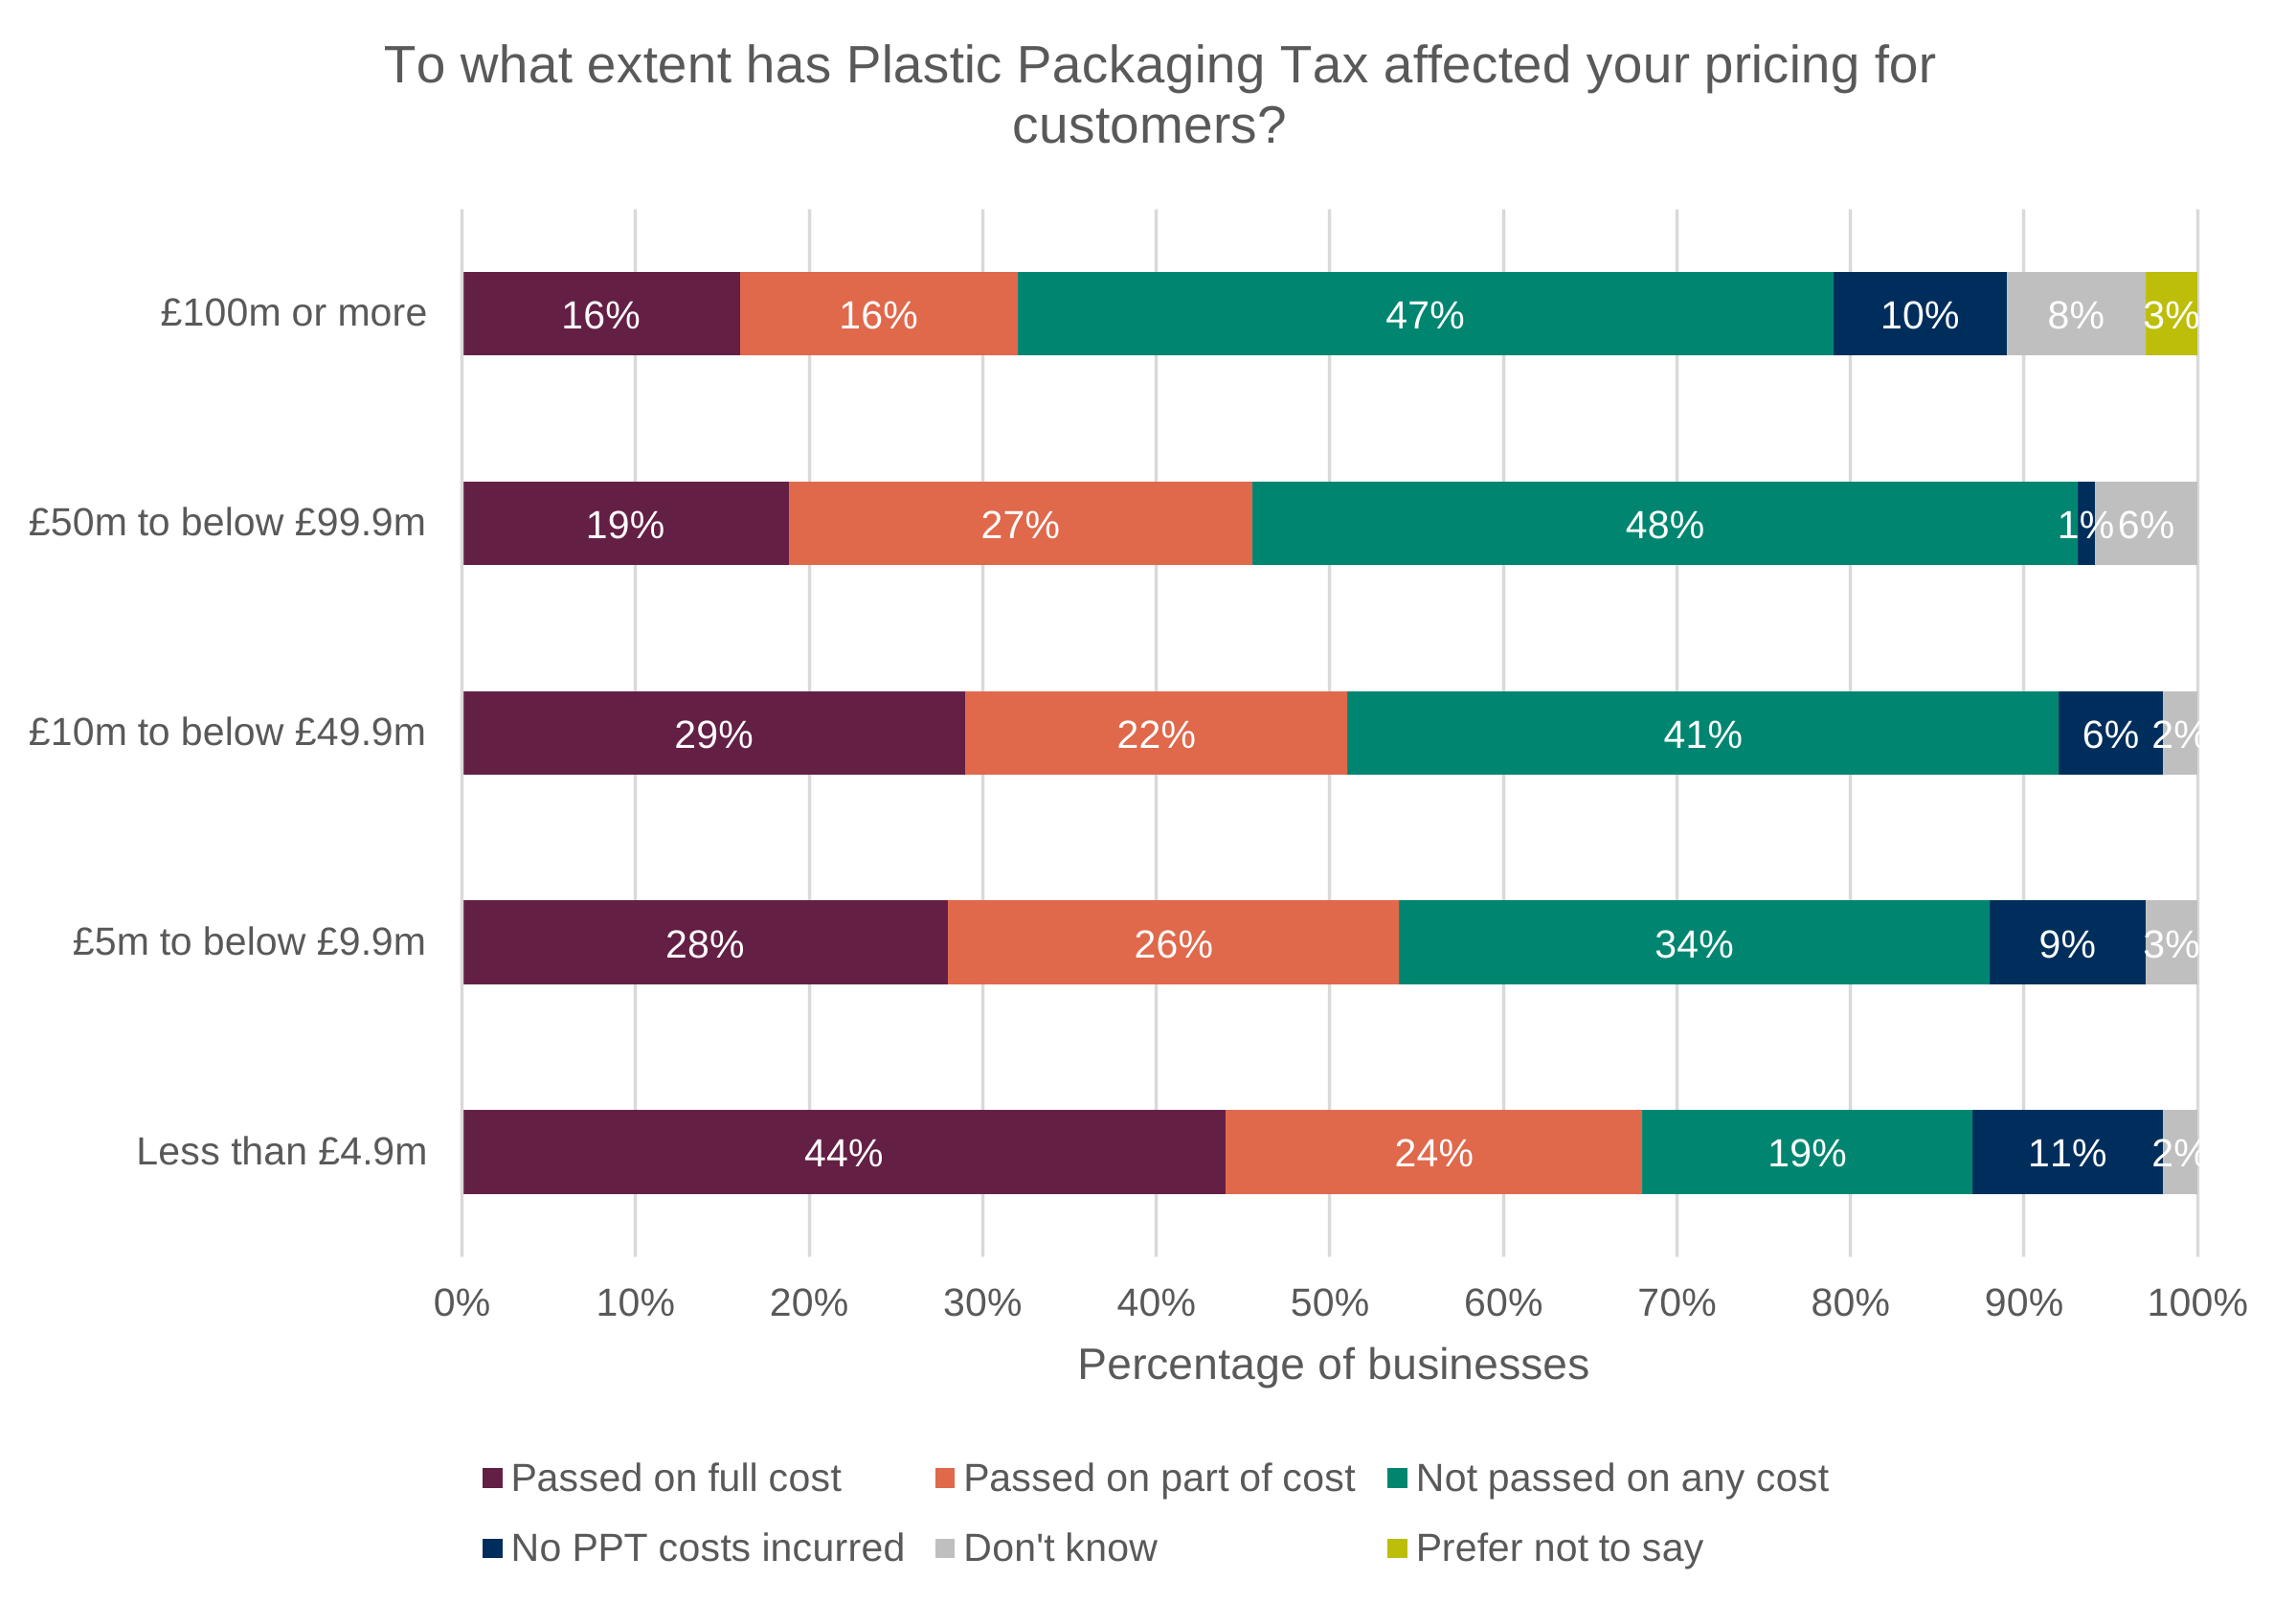
Data for Figure 6.4: Survey results for the question ‘To what extent has Plastic Packaging Tax affected your pricing for customers?’.
Base: Businesses reporting a turnover of less than £5 million (183), £5 million to below £10 million (109), £10 million to below £50 million (354), £50 million to below £100 million (97), or £100 million or more (147). Source: Ipsos.
| Category | Passed on full cost | Passed on part of cost | Not passed on any cost | No PPT costs incurred | Don’t know | Prefer not to say |
|---|---|---|---|---|---|---|
| £100 million or more | 16% | 16% | 47% | 10% | 8% | 3% |
| £50 million to below £99.9 million | 19% | 27% | 48% | 1% | 6% | 0% |
| £10 million to below £49.9 million | 29% | 22% | 41% | 6% | 2% | 0% |
| £5 million to below £9.9 million | 28% | 26% | 34% | 9% | 3% | 0% |
| Less than £4.9 million | 44% | 24% | 19% | 11% | 2% | 0% |
In the (weighted) survey sample, 15% of importers were large businesses as opposed to 4% of manufacturers, so it is possible that this may partly reflect the previously identified finding that importers were less likely to pass through costs to customers. Importers were also disproportionately more likely than manufacturers to turn over more than £50 million per year, with 28% of importers in that bracket compared with 1% of manufacturers. It may be the case that small and micro businesses, and those with lower turnover, are less able to accommodate or offset the cost of the tax elsewhere. Conversely, they may have more flexible arrangements with their customers which enable them to increase prices. In any case, because business type, size, and turnover are likely related in the context of this evaluation, these descriptive differences should be interpreted as overlapping patterns rather than isolated effects.
Having examined how pass-through is affected by business characteristics, including business type, size, and turnover, the remainder of this section considers whether similar patterns are visible for other business characteristics, including whether businesses’ pricing responses differed depending on the extent to which PPT influenced their packaging strategy.
Businesses headquartered in the UK were more likely to respond that they passed on some or all of their PPT costs to customers, with 53% doing so compared to 43% of businesses headquartered outside of the UK. This difference is statistically significant and may suggest that PPT is more salient for businesses based in the UK, which is consistent with earlier findings in Section 5.4.6 UK-based businesses have been more likely to report that they altered their recycled content in packaging. However, the survey evidence does not by itself establish why UK-headquartered businesses are more likely to report passing on costs.
Two further points may be consistent with this interpretation. Firstly, businesses that said that PPT had influenced their plastic packaging strategies (to any extent) were more likely (56%) to respond that they had passed on some or all of the associated costs to their customers, compared to those who said that it had not (42%). This difference is statistically significant and also holds when the ‘any influence’ category is split into significant and moderate or slight influence, as can be seen in Figure 6.5 below.
Figure 6.5: Survey results for the question ‘To what extent has Plastic Packaging Tax affected your pricing for customers?’.
Base: Businesses for whom PPT had the following levels of influence on their plastic packaging strategy: Any influence (615), Significant Influence (90), Moderate or slight influence (525), No influence (357). Source: Ipsos.
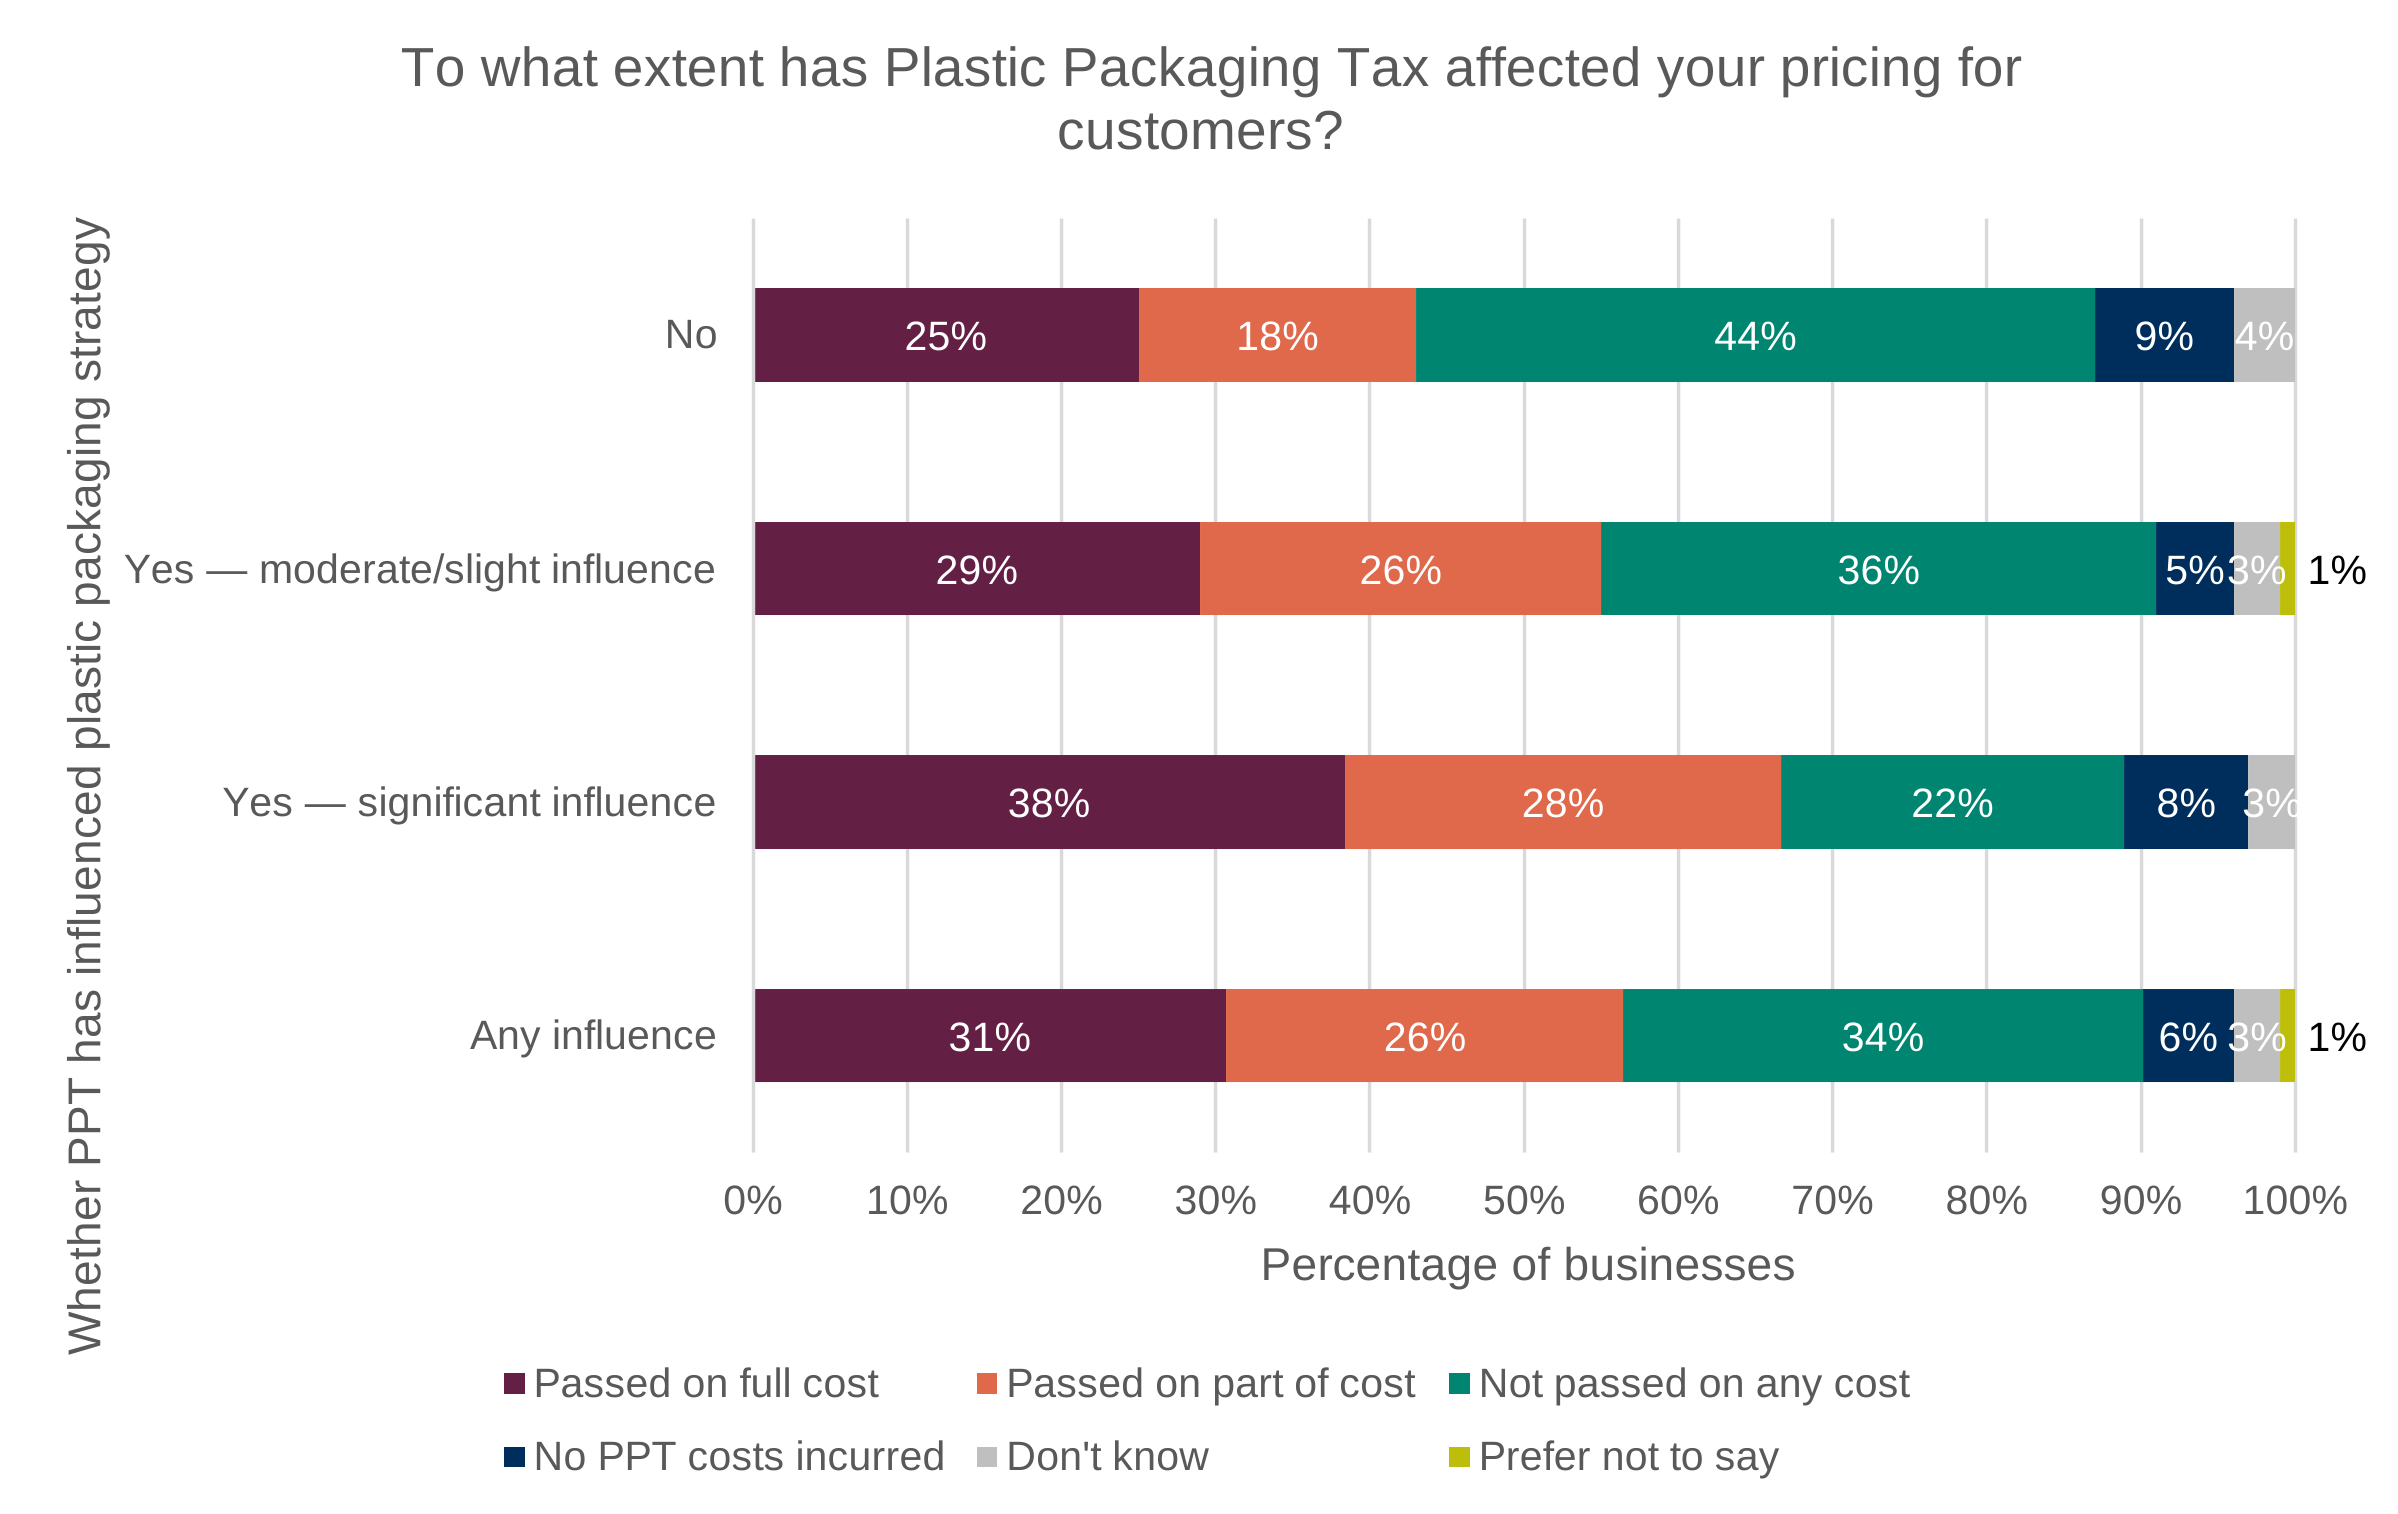
Data for Figure 6.5: Survey results for the question ‘To what extent has Plastic Packaging Tax affected your pricing for customers?’.
Base: Businesses for whom PPT had the following levels of influence on their plastic packaging strategy: Any influence (615), Significant Influence (90), Moderate or slight influence (525), No influence (357). Source: Ipsos.
| Category | Passed on full cost | Passed on part of cost | Not passed on any cost | No PPT costs incurred | Don’t know | Prefer not to say |
|---|---|---|---|---|---|---|
| No | 25% | 18% | 44% | 9% | 4% | 0% |
| Yes — moderate/slight influence | 29% | 26% | 36% | 5% | 3% | 1% |
| Yes — significant influence | 38% | 28% | 22% | 8% | 3% | 0% |
| Any influence | 31% | 26% | 34% | 6% | 3% | 1% |
Secondly, businesses which increased the proportion of recycled content in their packaging were more likely to respond that they passed on some or all of their PPT costs, at 62%, compared with 46% who had not changed their recycled content and 41% who had decreased it. The difference between the increased and no change categories is statistically significant, but the decreased category has too small a sample size to draw firm conclusions. These 2 points perhaps suggest that businesses which consider the tax in their packaging strategies make the decision to pass on some or all of the costs of PPT as part of a wider set of behaviours designed to mitigate the cost of the tax.
Overall, the quantitative research suggests that pass-through was an important response to PPT for a substantial proportion of businesses, although pricing responses varied according to business type and activity, size, turnover, location of headquarters, and the salience of the tax. Manufacturers, smaller businesses, lower-turnover businesses, and businesses reporting other changes to their packaging strategies were more likely to report passing on some or all of their PPT costs to customers. This pattern further suggests the tax is having different effects depending on a business’ position in packaging supply chains, their wider ability to absorb or offset costs, and the extent to which PPT has informed wider decisions on packaging strategy. Although the available evidence does not establish the cause or direction of these relationships, it is broadly supported by the analysis and findings contained in the other chapters of the evaluation.
6.4.2 Influence of PPT versus other factors
Understanding whether PPT has influenced packaging design choices first requires understanding the extent to which businesses consider the tax to have caused changes in their packaging strategy. The quantitative social research enables this to be explored, asking businesses directly whether PPT influenced their packaging strategy.
Figure 6.6: Survey results for the question ‘To what extent, if at all, has Plastic Packaging Tax influenced your business’ plastic packaging strategy, including any changes you may have made?’.
Base: All businesses (1,011). Source: Ipsos.
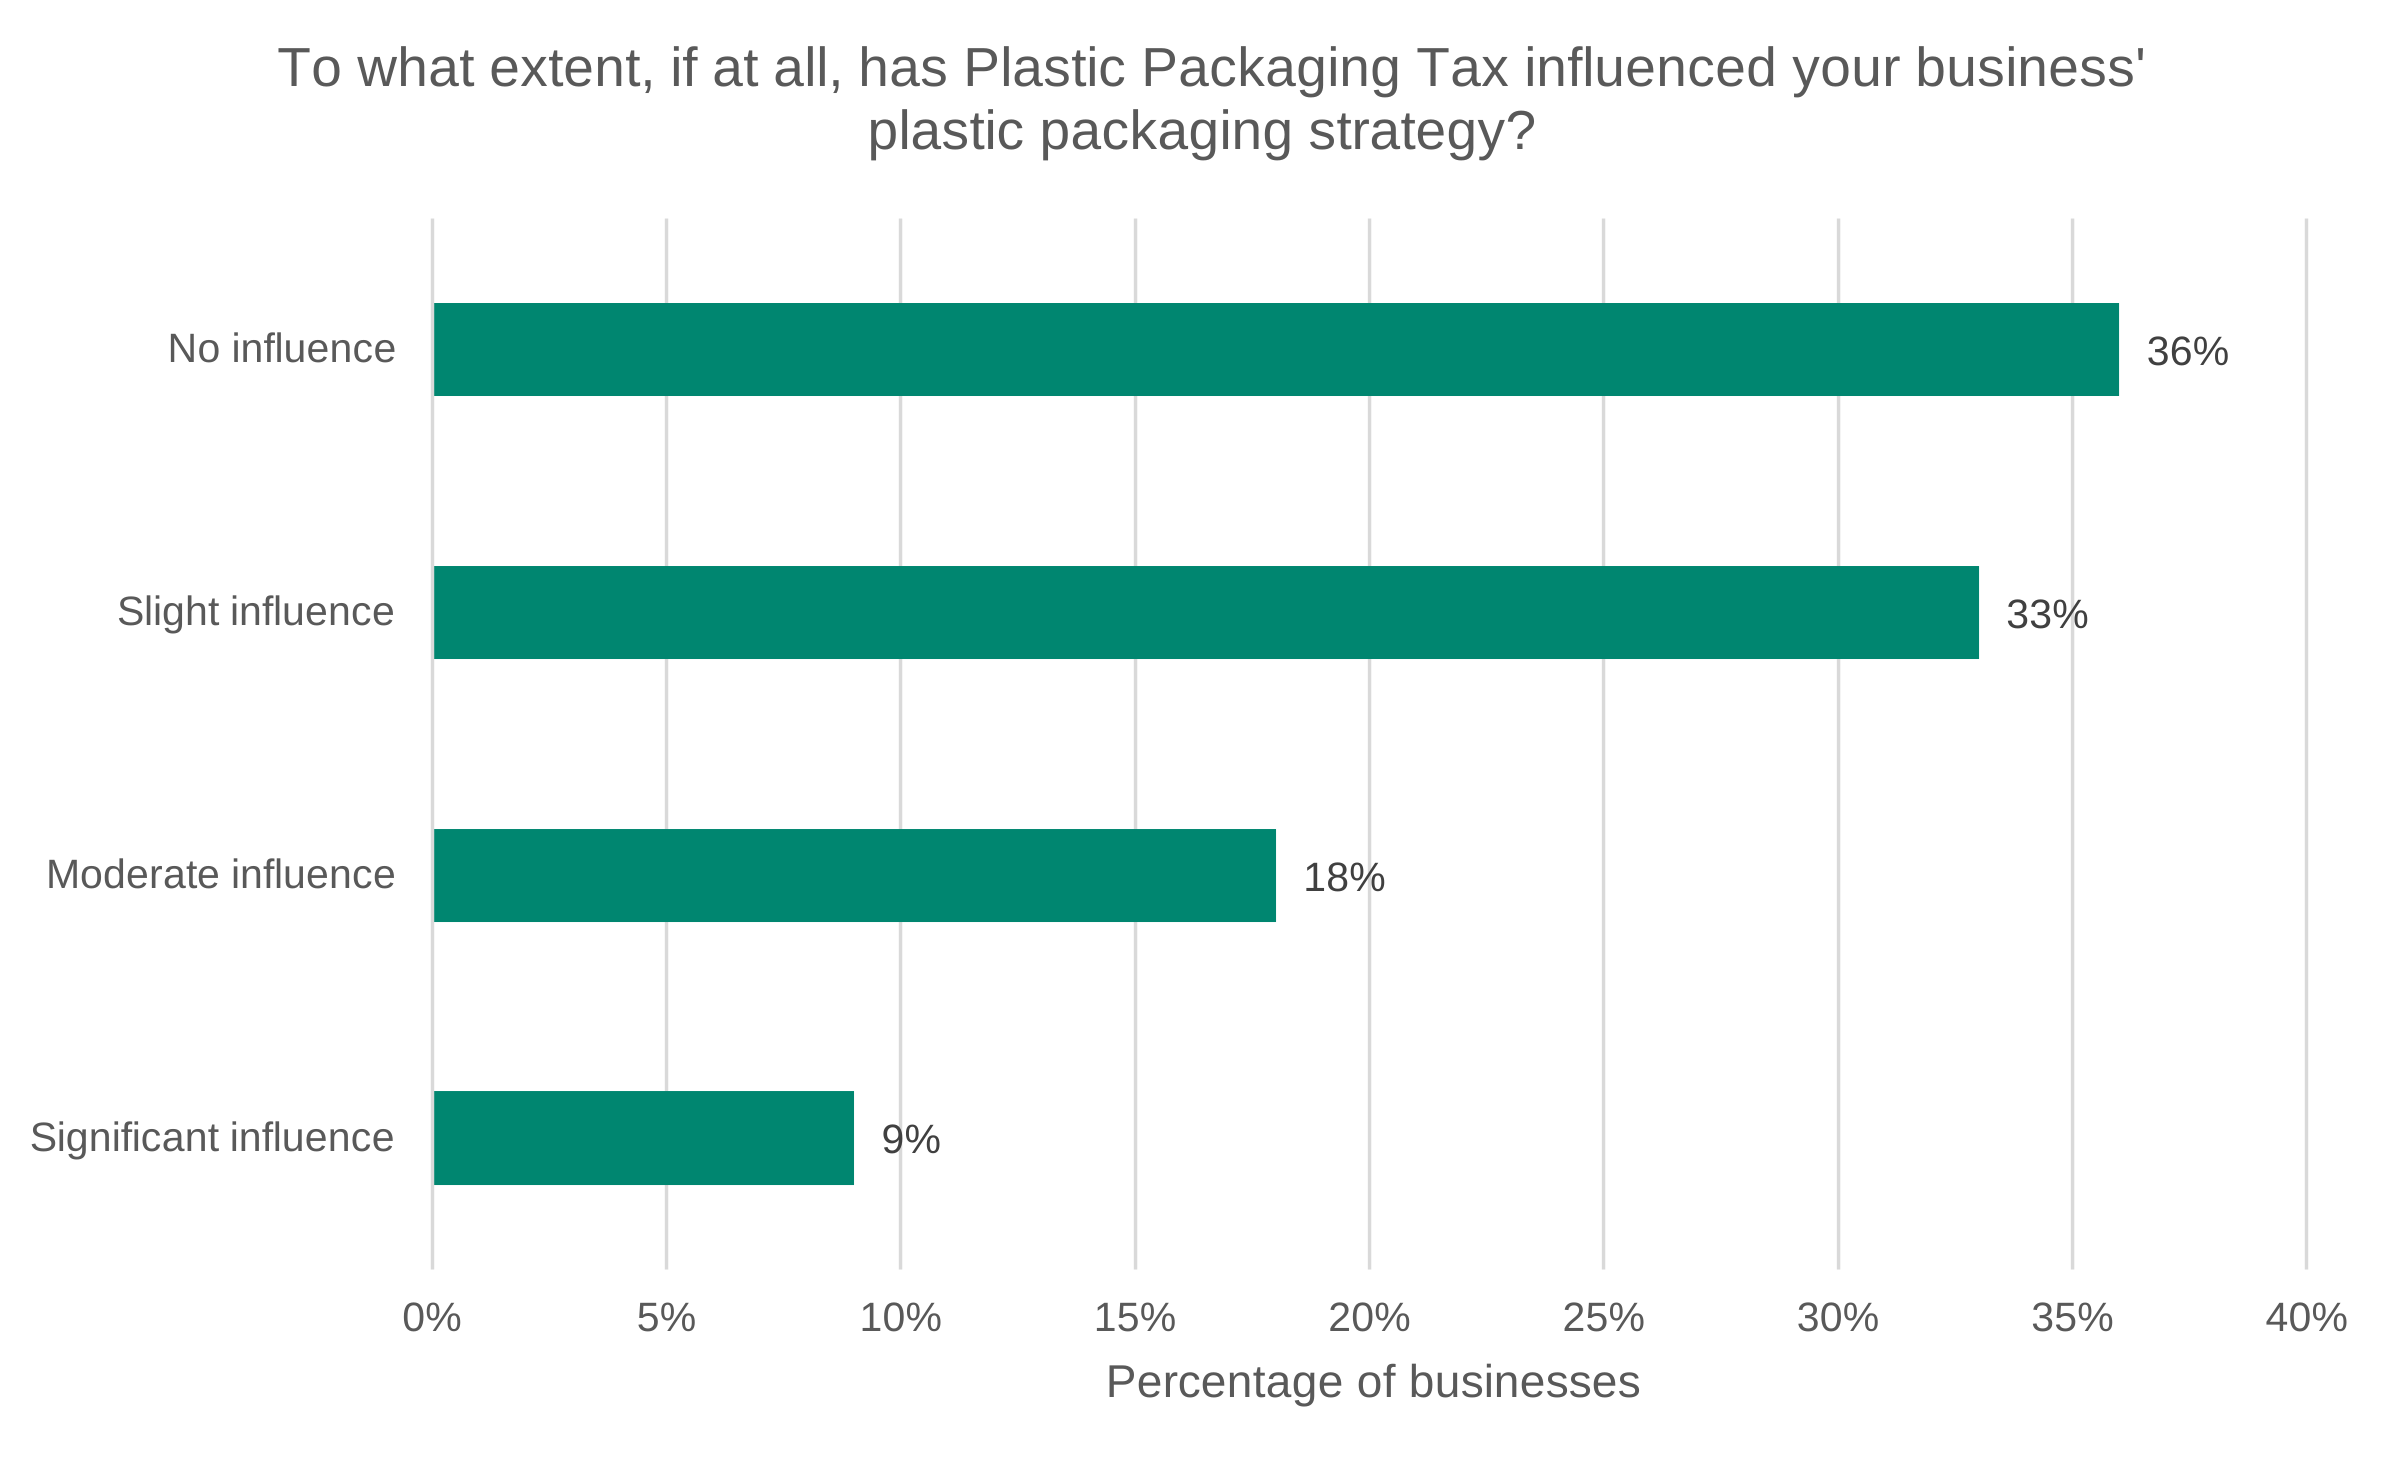
Data for Figure 6.6: Survey results for the question ‘To what extent, if at all, has Plastic Packaging Tax influenced your business’ plastic packaging strategy, including any changes you may have made?’.
Base: All businesses (1,011). Source: Ipsos.
| Category | Percentage of businesses |
|---|---|
| No influence | 36% |
| Slight influence | 33% |
| Moderate influence | 18% |
| Significant influence | 9% |
Figure 6.6 shows that businesses were divided on the extent to which PPT influenced their packaging strategy. Overall, 60% of businesses reported that PPT had some degree of influence on their packaging strategy; comprising 9% reporting a significant influence, 18% with a moderate influence and 33% with a slight influence. In contrast, 36% reported that the PPT had no influence on their plastic packaging strategy. Although this suggests that PPT influenced packaging decisions for many businesses, only a relatively small proportion reported a significant influence. Furthermore, there were few statistically significant differences by business characteristics, indicating that the subset of businesses who reported a significant influence did not meaningfully vary by characteristics.
Figure 6.7 explores the other factors that have been reported by businesses as influencing their plastic packaging strategy, split by whether PPT has influenced their behaviour. Businesses that reported any influence from PPT were significantly more likely to also identify each of these other factors, compared to businesses reporting no influence from PPT. A similar pattern was observed across both groups, though to a different extent, with customer preferences or sustainability requirements, businesses’ own sustainability goals, and other government policies or environmental regulations being the most reported influences overall. This suggests that PPT operated within a wider set of commercial, environmental and regulatory drivers rather than acting as the sole determinant of packaging decisions.
Figure 6.7: Survey results for the question ‘To what extent, if any, have each of the following factors influenced your plastic packaging strategy, including any changes to this, since the introduction of Plastic Packaging Tax?’.
Base: businesses reporting PPT influence on their plastic packaging strategy (615) and businesses reporting no influence (357). Source: Ipsos.
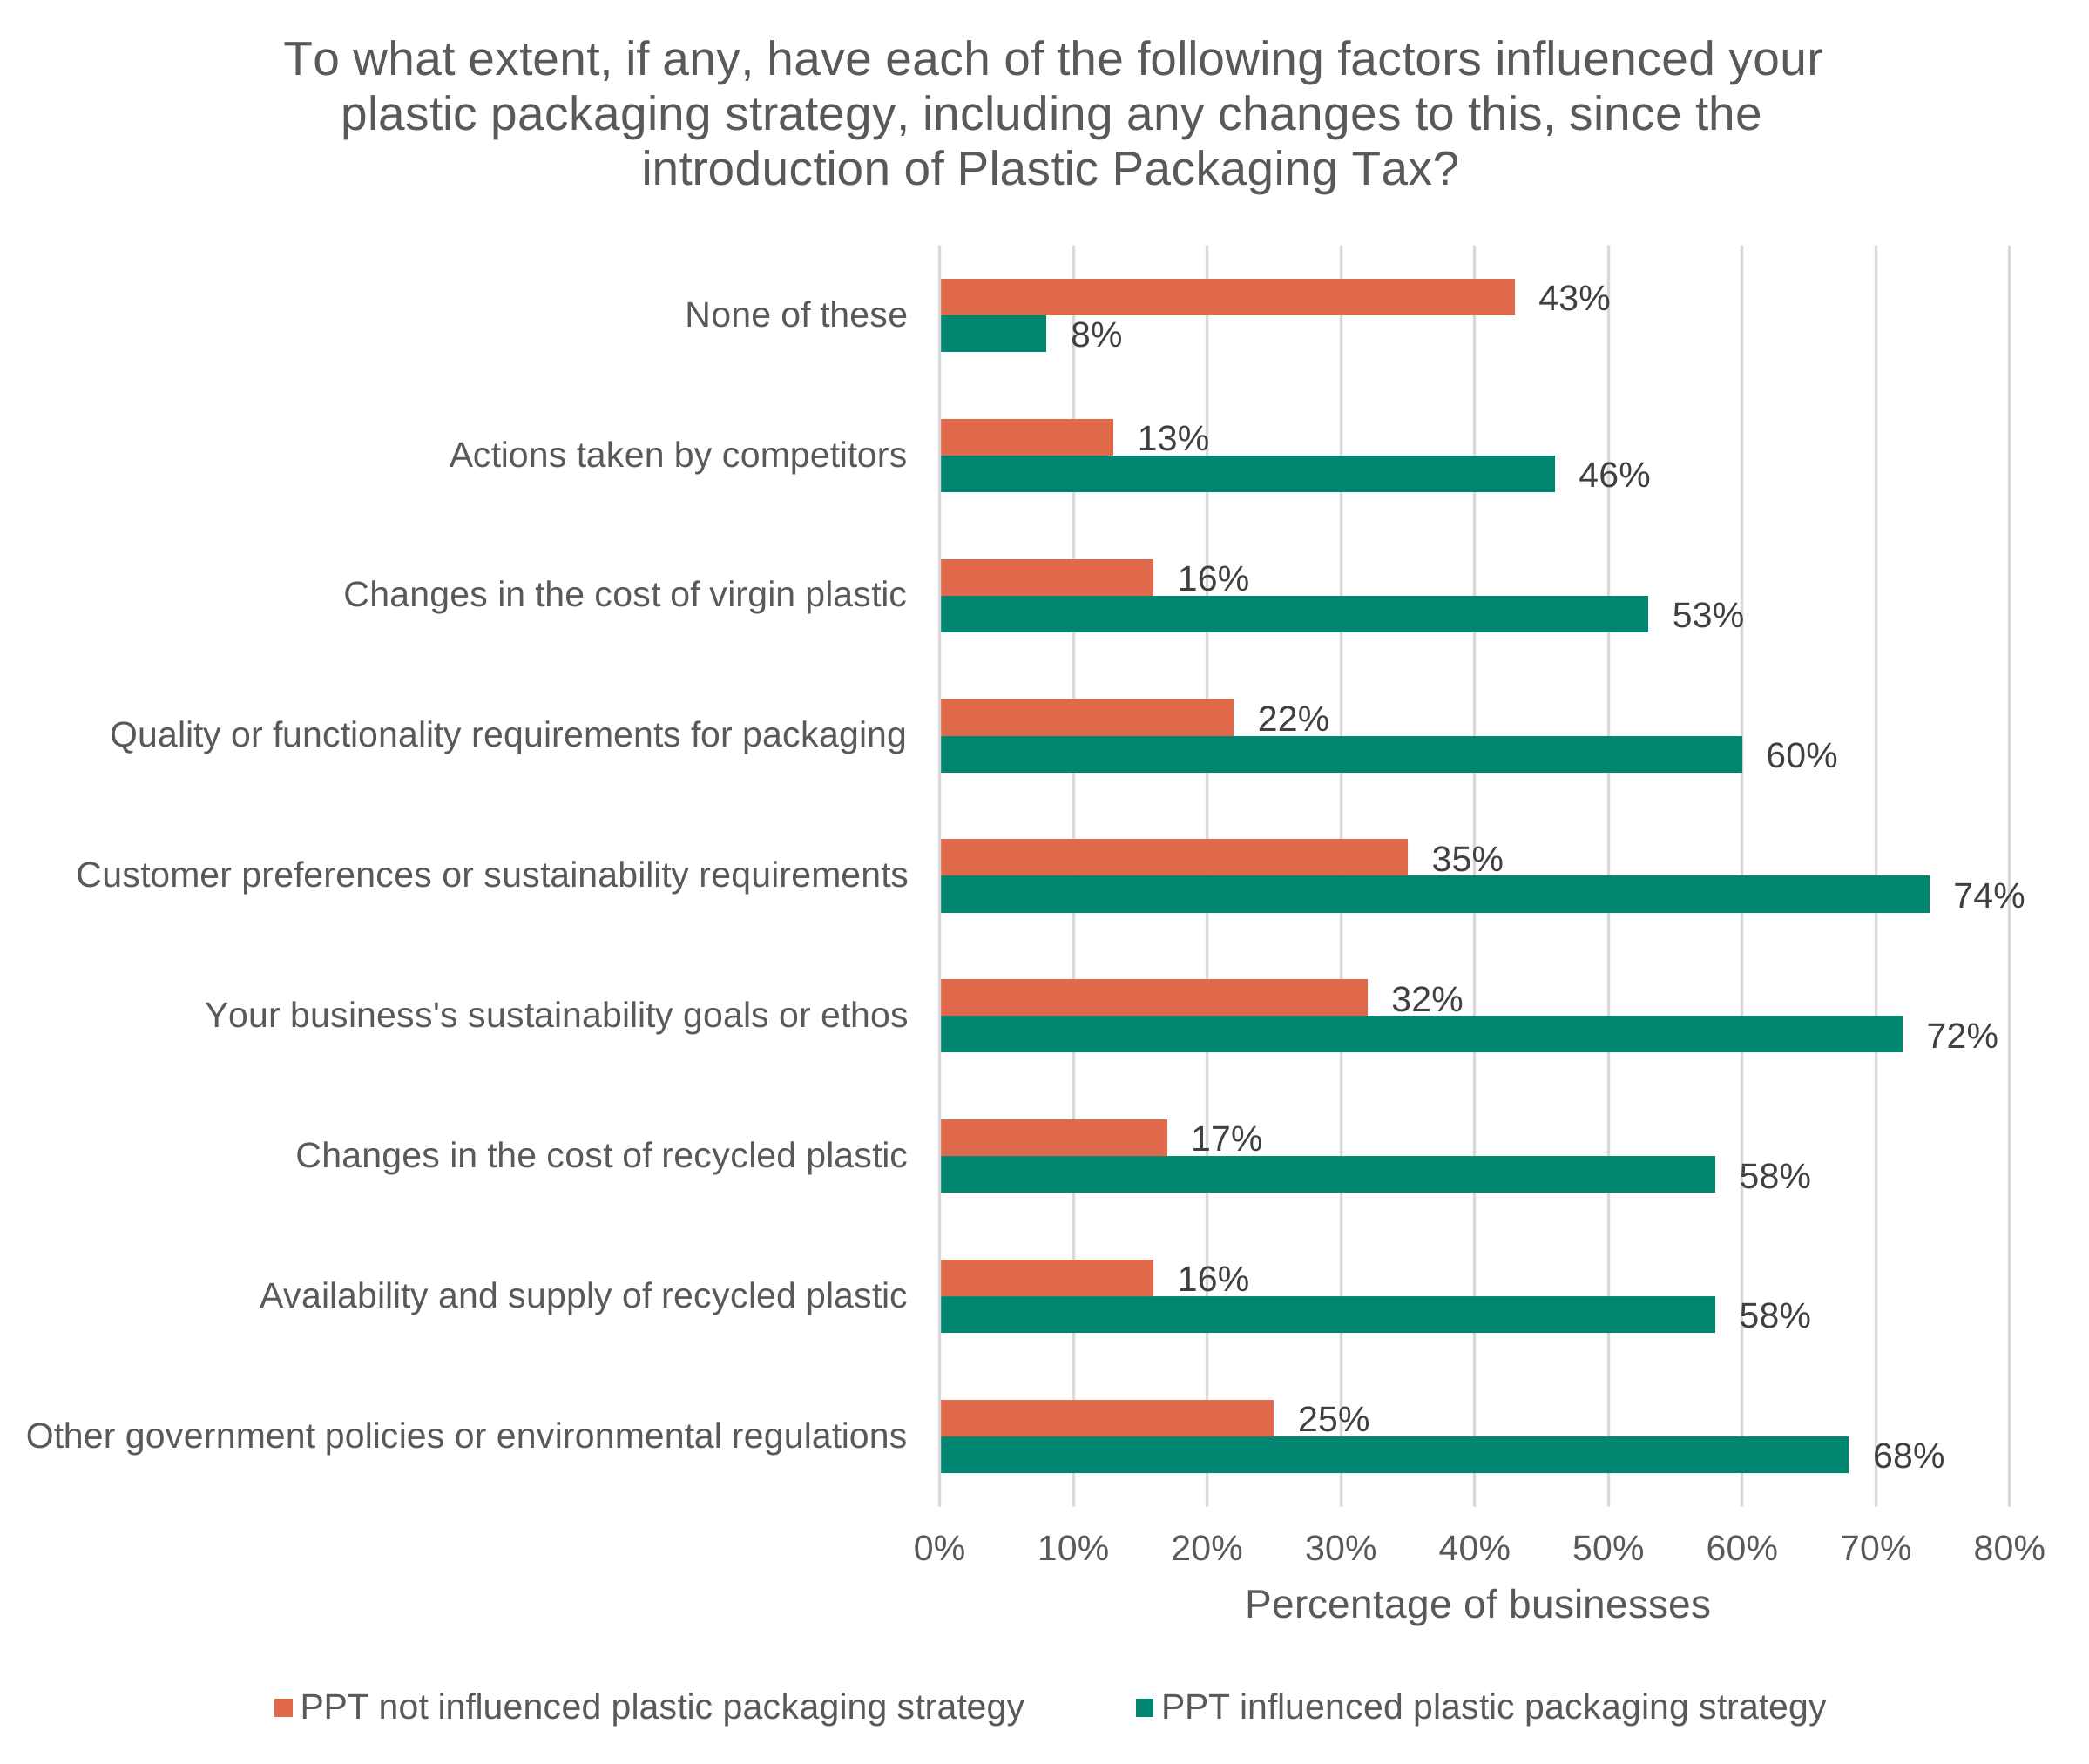
Data for Figure 6.7: Survey results for the question ‘To what extent, if any, have each of the following factors influenced your plastic packaging strategy, including any changes to this, since the introduction of Plastic Packaging Tax?’.
Base: businesses reporting PPT influence on their plastic packaging strategy (615) and businesses reporting no influence (357). Source: Ipsos.
| Category | PPT influenced plastic packaging strategy | PPT not influenced plastic packaging strategy |
|---|---|---|
| None of these | 8% | 43% |
| Actions taken by competitors | 46% | 13% |
| Changes in the cost of virgin plastic | 53% | 16% |
| Quality or functionality requirements for packaging | 60% | 22% |
| Customer preferences or sustainability requirements | 74% | 35% |
| Your business’s sustainability goals or ethos | 72% | 32% |
| Changes in the cost of recycled plastic | 58% | 17% |
| Availability and supply of recycled plastic | 58% | 16% |
| Other government policies or environmental regulations | 68% | 25% |
The largest difference between these 2 groups related to ‘other government policies or environmental regulations’. This category included the Extended Producer Responsibility for Packaging (pEPR) as an example, a UK scheme that makes packaging producers responsible for the costs of collecting, sorting, recycling and disposing of packaging waste, encouraging more sustainable packaging design and use. Therefore, while it is not possible to determine the extent to which responses reflected pEPR rather than other regulatory influences, the findings suggest that wider packaging regulation may have influenced business decision-making alongside PPT, especially in cases where businesses were more sensitive to market conditions. Qualitative research supports this interpretation, with pEPR being discussed as an important influence on packaging decisions, and even perhaps a greater concern than PPT because of its expected cost and operational implications.
Businesses reporting PPT influence were substantially more likely to identify the availability and cost of recycled plastic as important considerations, suggesting they were more exposed to recycled plastic market conditions. This indicates that, although PPT may have encouraged businesses to consider increasing recycled content, the availability and relative cost of recycled plastic may limit their willingness or ability to make sustainable changes to their packaging.
Figure 6.8: Summarised survey results of the percentage of businesses reporting that the following factors influenced their plastic packaging strategy.
Base: All businesses (1,011). Source: Ipsos.
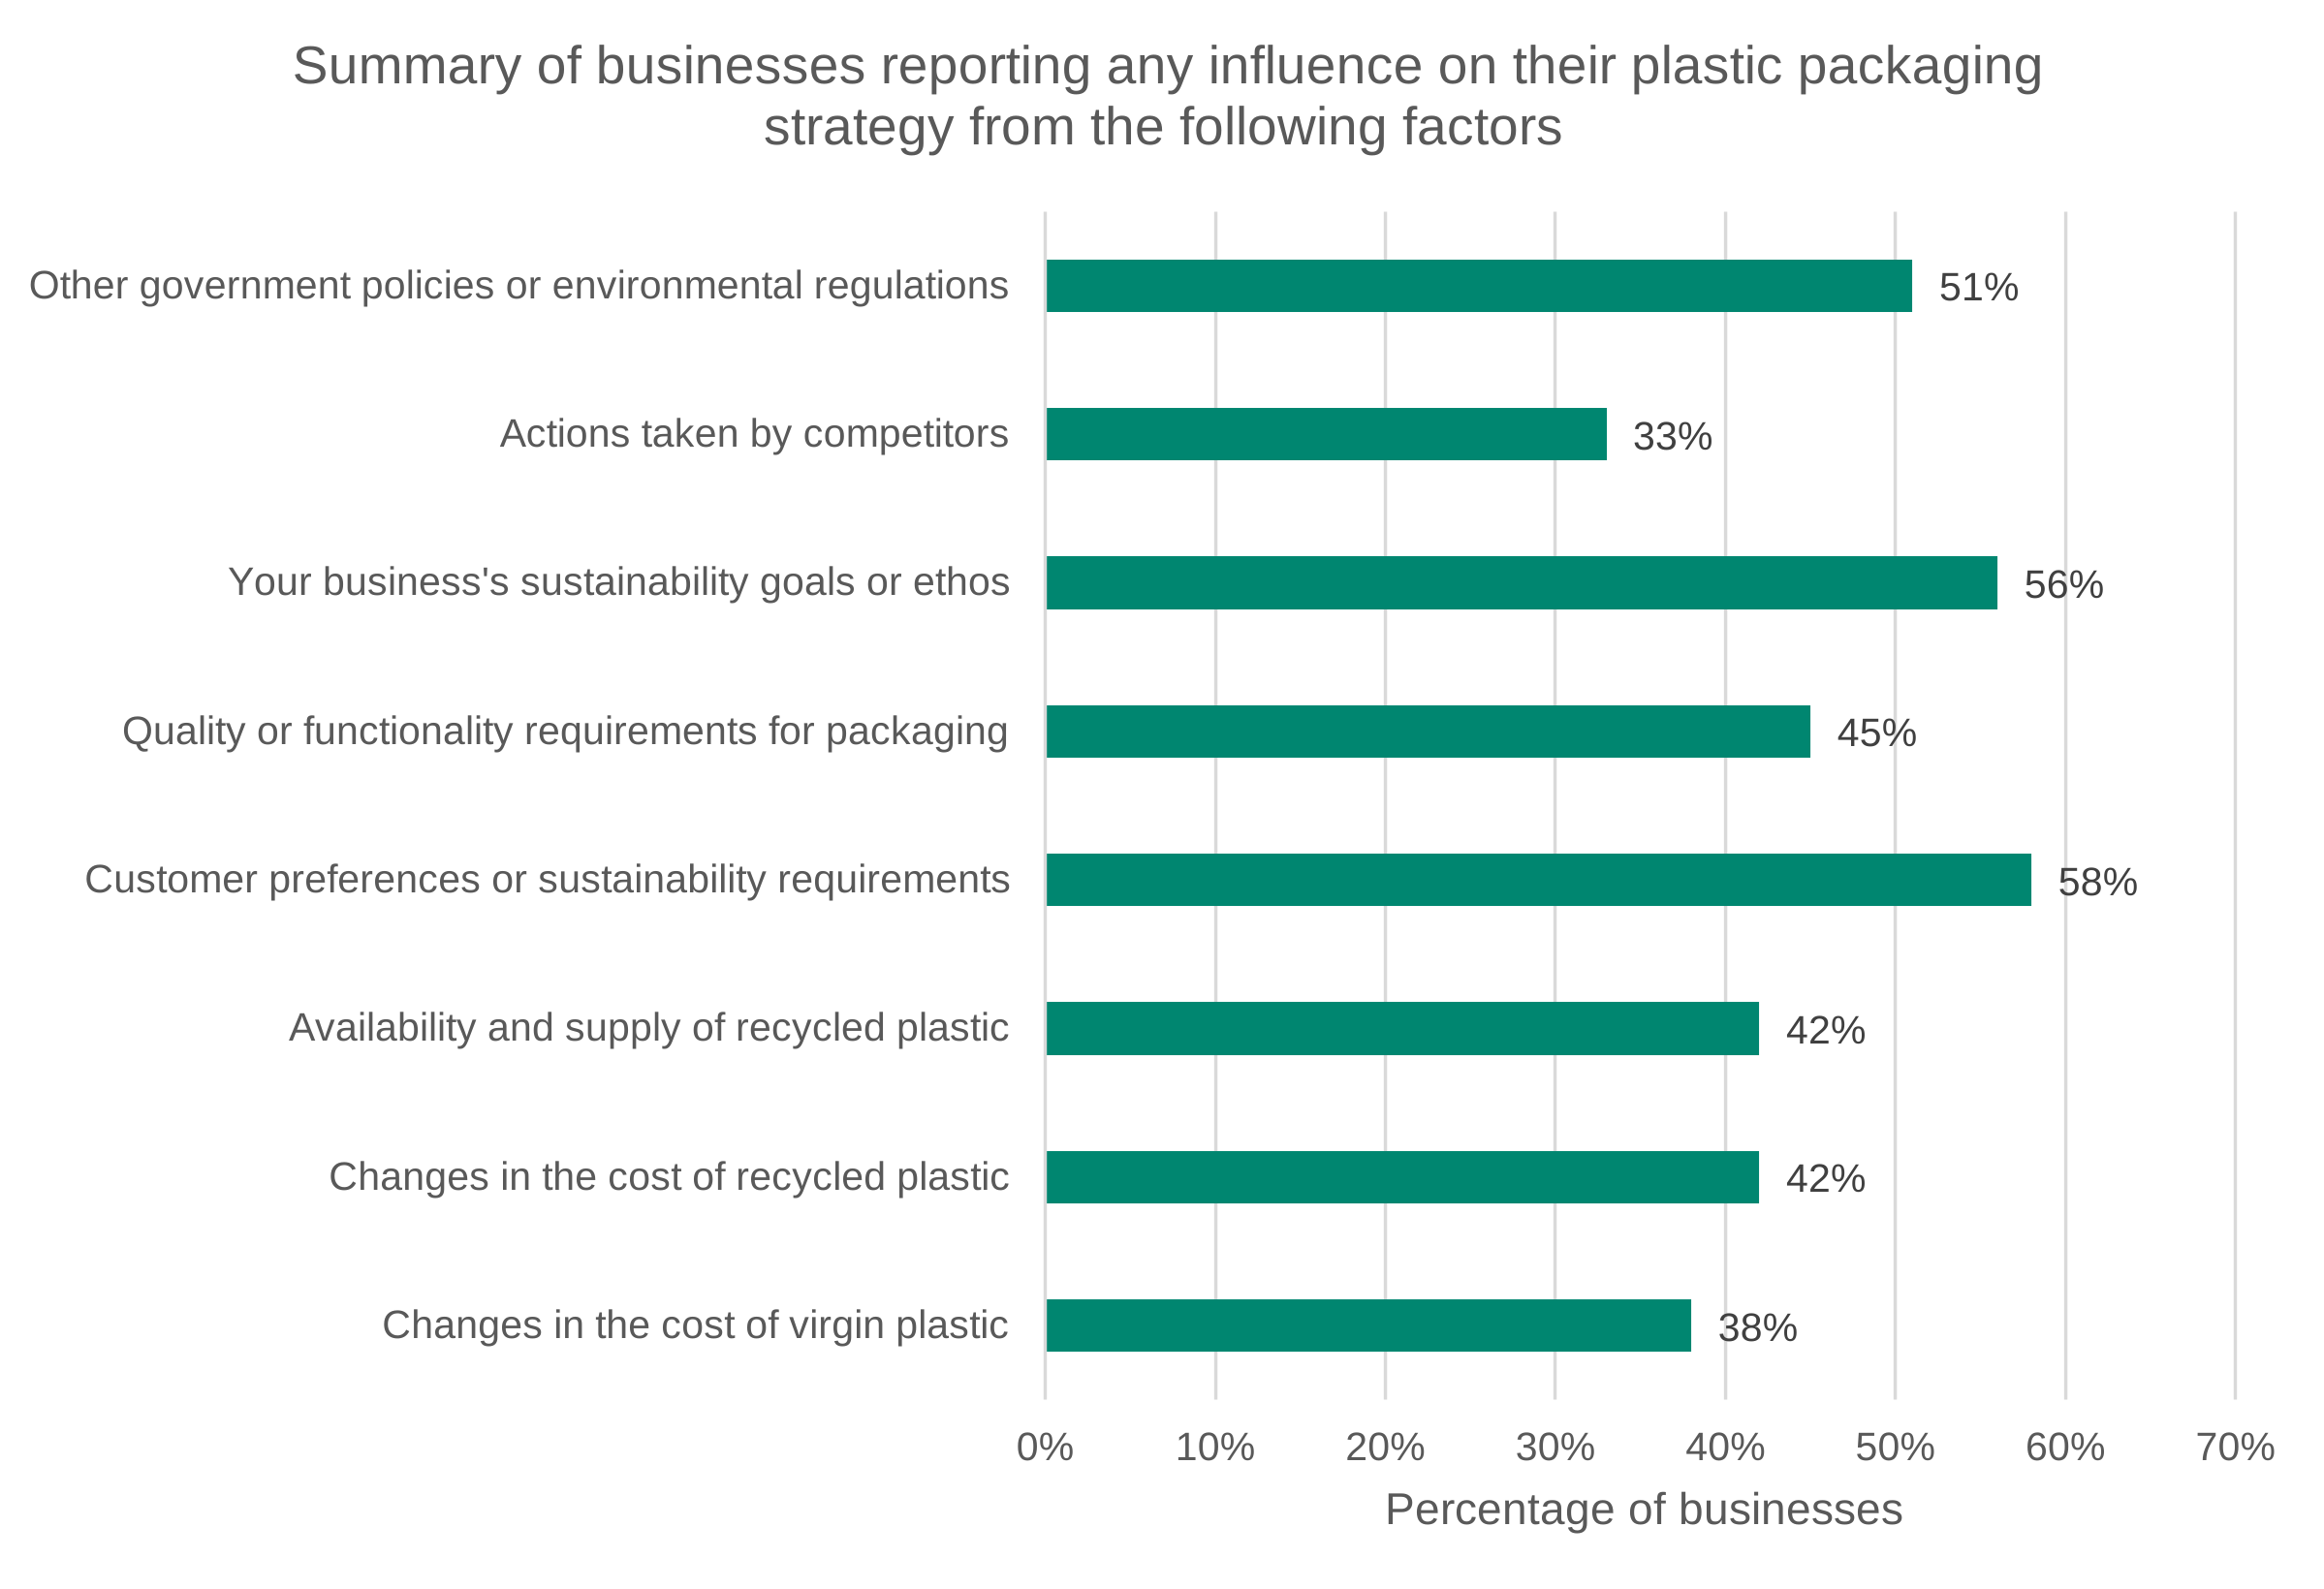
Data for Figure 6.8: Summarised survey results of the percentage of businesses reporting that the following factors influenced their plastic packaging strategy.
Base: All businesses (1,011). Source: Ipsos.
| Category | Percentage of businesses |
|---|---|
| Other government policies or environmental regulations | 51% |
| Actions taken by competitors | 33% |
| Your business’s sustainability goals or ethos | 56% |
| Quality or functionality requirements for packaging | 45% |
| Customer preferences or sustainability requirements | 58% |
| Availability and supply of recycled plastic | 42% |
| Changes in the cost of recycled plastic | 42% |
| Changes in the cost of virgin plastic | 38% |
More generally, Figure 6.8 shows that businesses most commonly reported that their plastic packaging strategy was influenced by customer preferences or sustainability requirements (58%) and their own sustainability goals or ethos (56%). Around half of businesses also reported influence from other government policies or environmental regulations (51%). Packaging quality or functionality requirements (45%), the availability and supply of recycled plastic (42%), and changes in the cost of recycled plastic (42%) were also commonly cited. Fewer businesses reported influences from changes in the cost of virgin plastic (38%) or actions taken by competitors (33%).
Figure 6.9: Summarised survey results of businesses reporting any influence on their plastic packaging strategy to the listed factors.
Base: Manufacturer (91 — note), Importer (816), Both (104). Source: Ipsos.
Note: Manufacturers only is a relatively small sample, so results should be taken with caution.
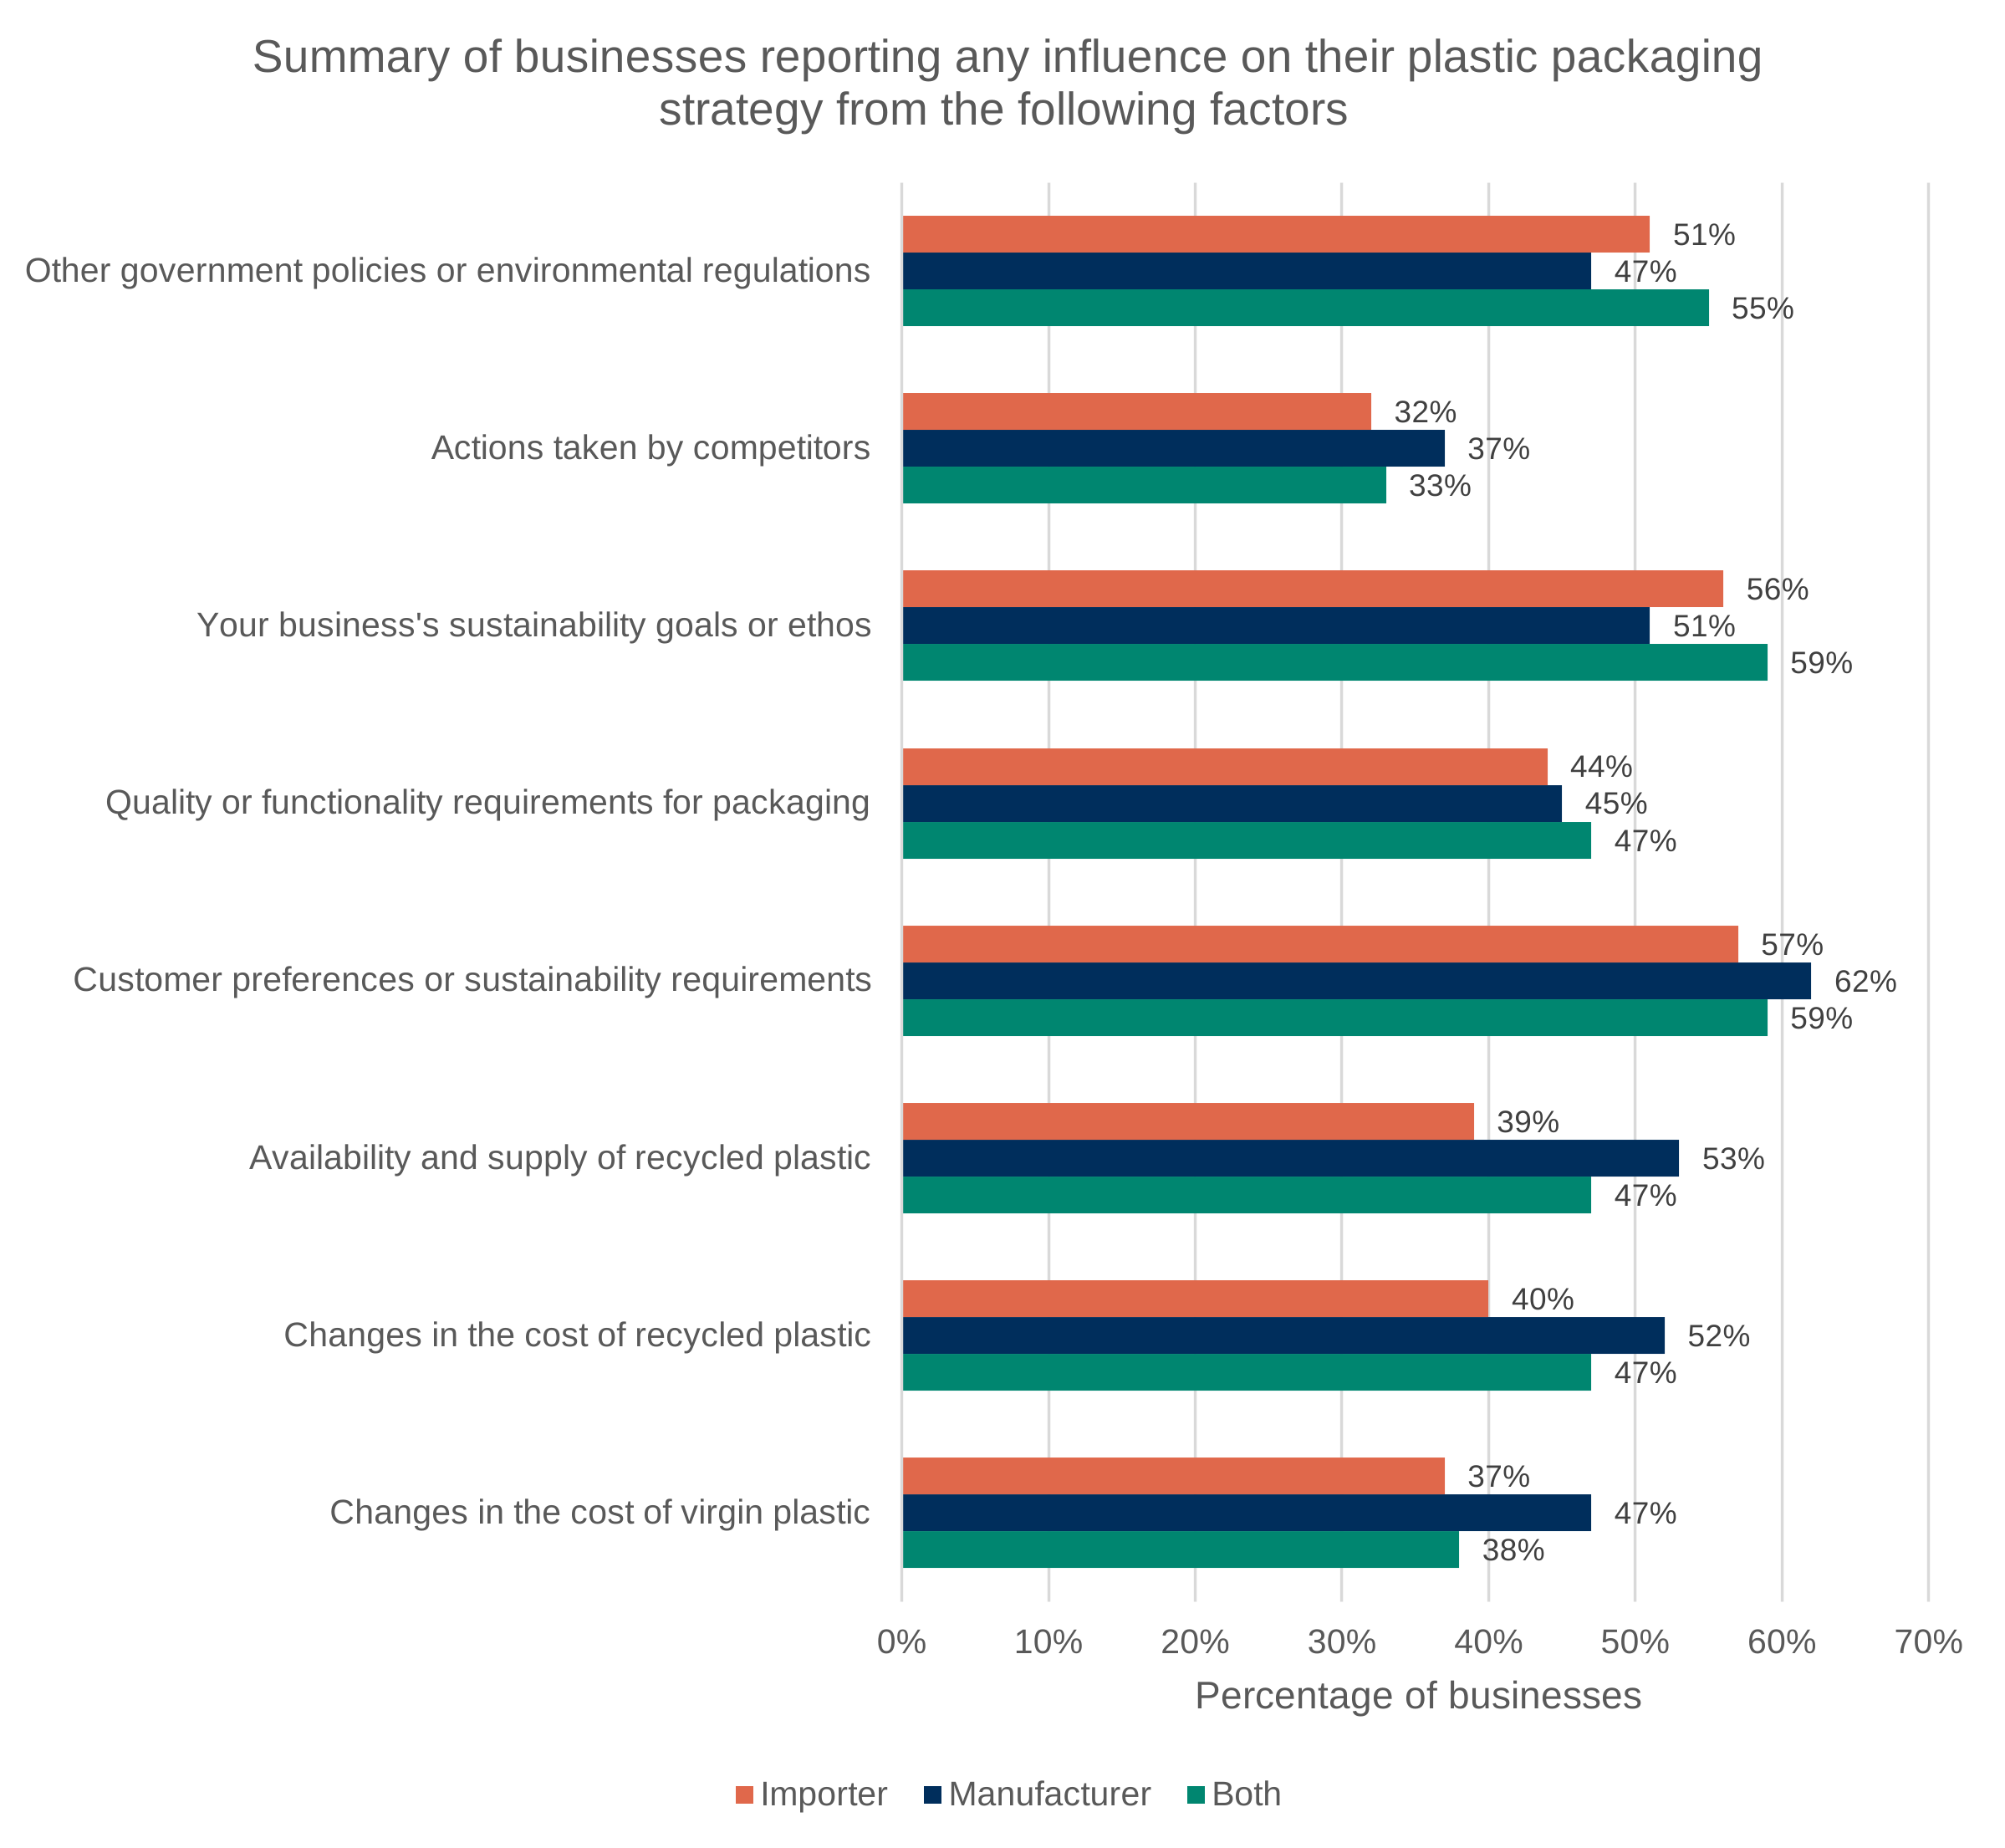
Data for Figure 6.9: Summarised survey results of businesses reporting any influence on their plastic packaging strategy to the listed factors.
Base: Manufacturer (91 — note), Importer (816), Both (104). Source: Ipsos.
Note: Manufacturers only is a relatively small sample, so results should be taken with caution.
| Category | Both | Manufacturer | Importer |
|---|---|---|---|
| Other government policies or environmental regulations | 55% | 47% | 51% |
| Actions taken by competitors | 33% | 37% | 32% |
| Your business’s sustainability goals or ethos | 59% | 51% | 56% |
| Quality or functionality requirements for packaging | 47% | 45% | 44% |
| Customer preferences or sustainability requirements | 59% | 62% | 57% |
| Availability and supply of recycled plastic | 47% | 53% | 39% |
| Changes in the cost of recycled plastic | 47% | 52% | 40% |
| Changes in the cost of virgin plastic | 38% | 47% | 37% |
When looking at the wider influences, further differences are apparent when results are examined by business characteristics. Manufacturers were statistically significantly more likely to report that the ‘availability and supply of recycled plastic’ was a core consideration in their packaging strategy when compared to importers, at 53% for manufacturers versus 39% for importers. This is consistent with earlier findings showing manufacturers have demonstrated they are more adaptable to changes in recycled content and are likely to be more susceptible to other influences.
The quantitative research demonstrates that many businesses have reported PPT has influenced their plastic packaging strategy to some extent, yet it was rarely reported as the sole driver of decision-making. While 60% of businesses reported some degree of influence from the tax, relatively few reported a significant influence, indicating that its effect on packaging choices has generally been moderate or incremental, suggesting the tax may have scope to play a stronger role.
The findings also show that packaging decisions are made within a wider commercial, environmental and regulatory context. Customer requirements, businesses’ own sustainability objectives, and other government policies and regulations were among the most cited influences. In particular, the prominence of pEPR and other regulatory measures suggests that businesses are responding to a broader policy landscape rather than to PPT in isolation.
The availability and cost of recycled plastic appear to be important constraints on behavioural change. Businesses that reported being influenced by PPT were more likely to identify recycled plastic market conditions as important considerations, highlighting how the tax’s impact may depend on the availability of affordable recycled material. This effect appears particularly relevant for manufacturers, who were more likely than importers to report that recycled plastic supply influenced their packaging strategy. These findings suggest that PPT has influenced changes in packaging decision-making, but that the extent of these changes is additionally shaped by wider market conditions and complementary regulatory drivers.
6.4.3 Plastic pricing and availability
PPT was intended to increase demand for recycled plastic by placing a tax on plastic packaging that fell below the 30% recycled content threshold. If businesses sought to increase recycled content in their plastic packaging to reduce tax liabilities, the influence of the cost and availability of recycled plastic would become increasingly relevant to packaging decisions and the ability for the tax to deliver its objectives. In other words, the success of the tax depends on the responsiveness of supply to PPT’s introduction. Businesses reporting influence from PPT were significantly more likely to consider pricing and availability as factors in the plastic packaging strategy. To further understand the influence of PPT, the quantitative research further explored whether businesses had observed changes in the cost and availability of virgin and recycled plastic.
Figure 6.10: Survey results for the question ‘Compared to before Plastic Packaging Tax was introduced in 2022, have you noticed that the cost of recycled plastic has…?’.
Base: All businesses (1,011), PPT has influenced plastic packaging strategy (615), and PPT has not influenced plastic packaging strategy (357). Source: Ipsos.
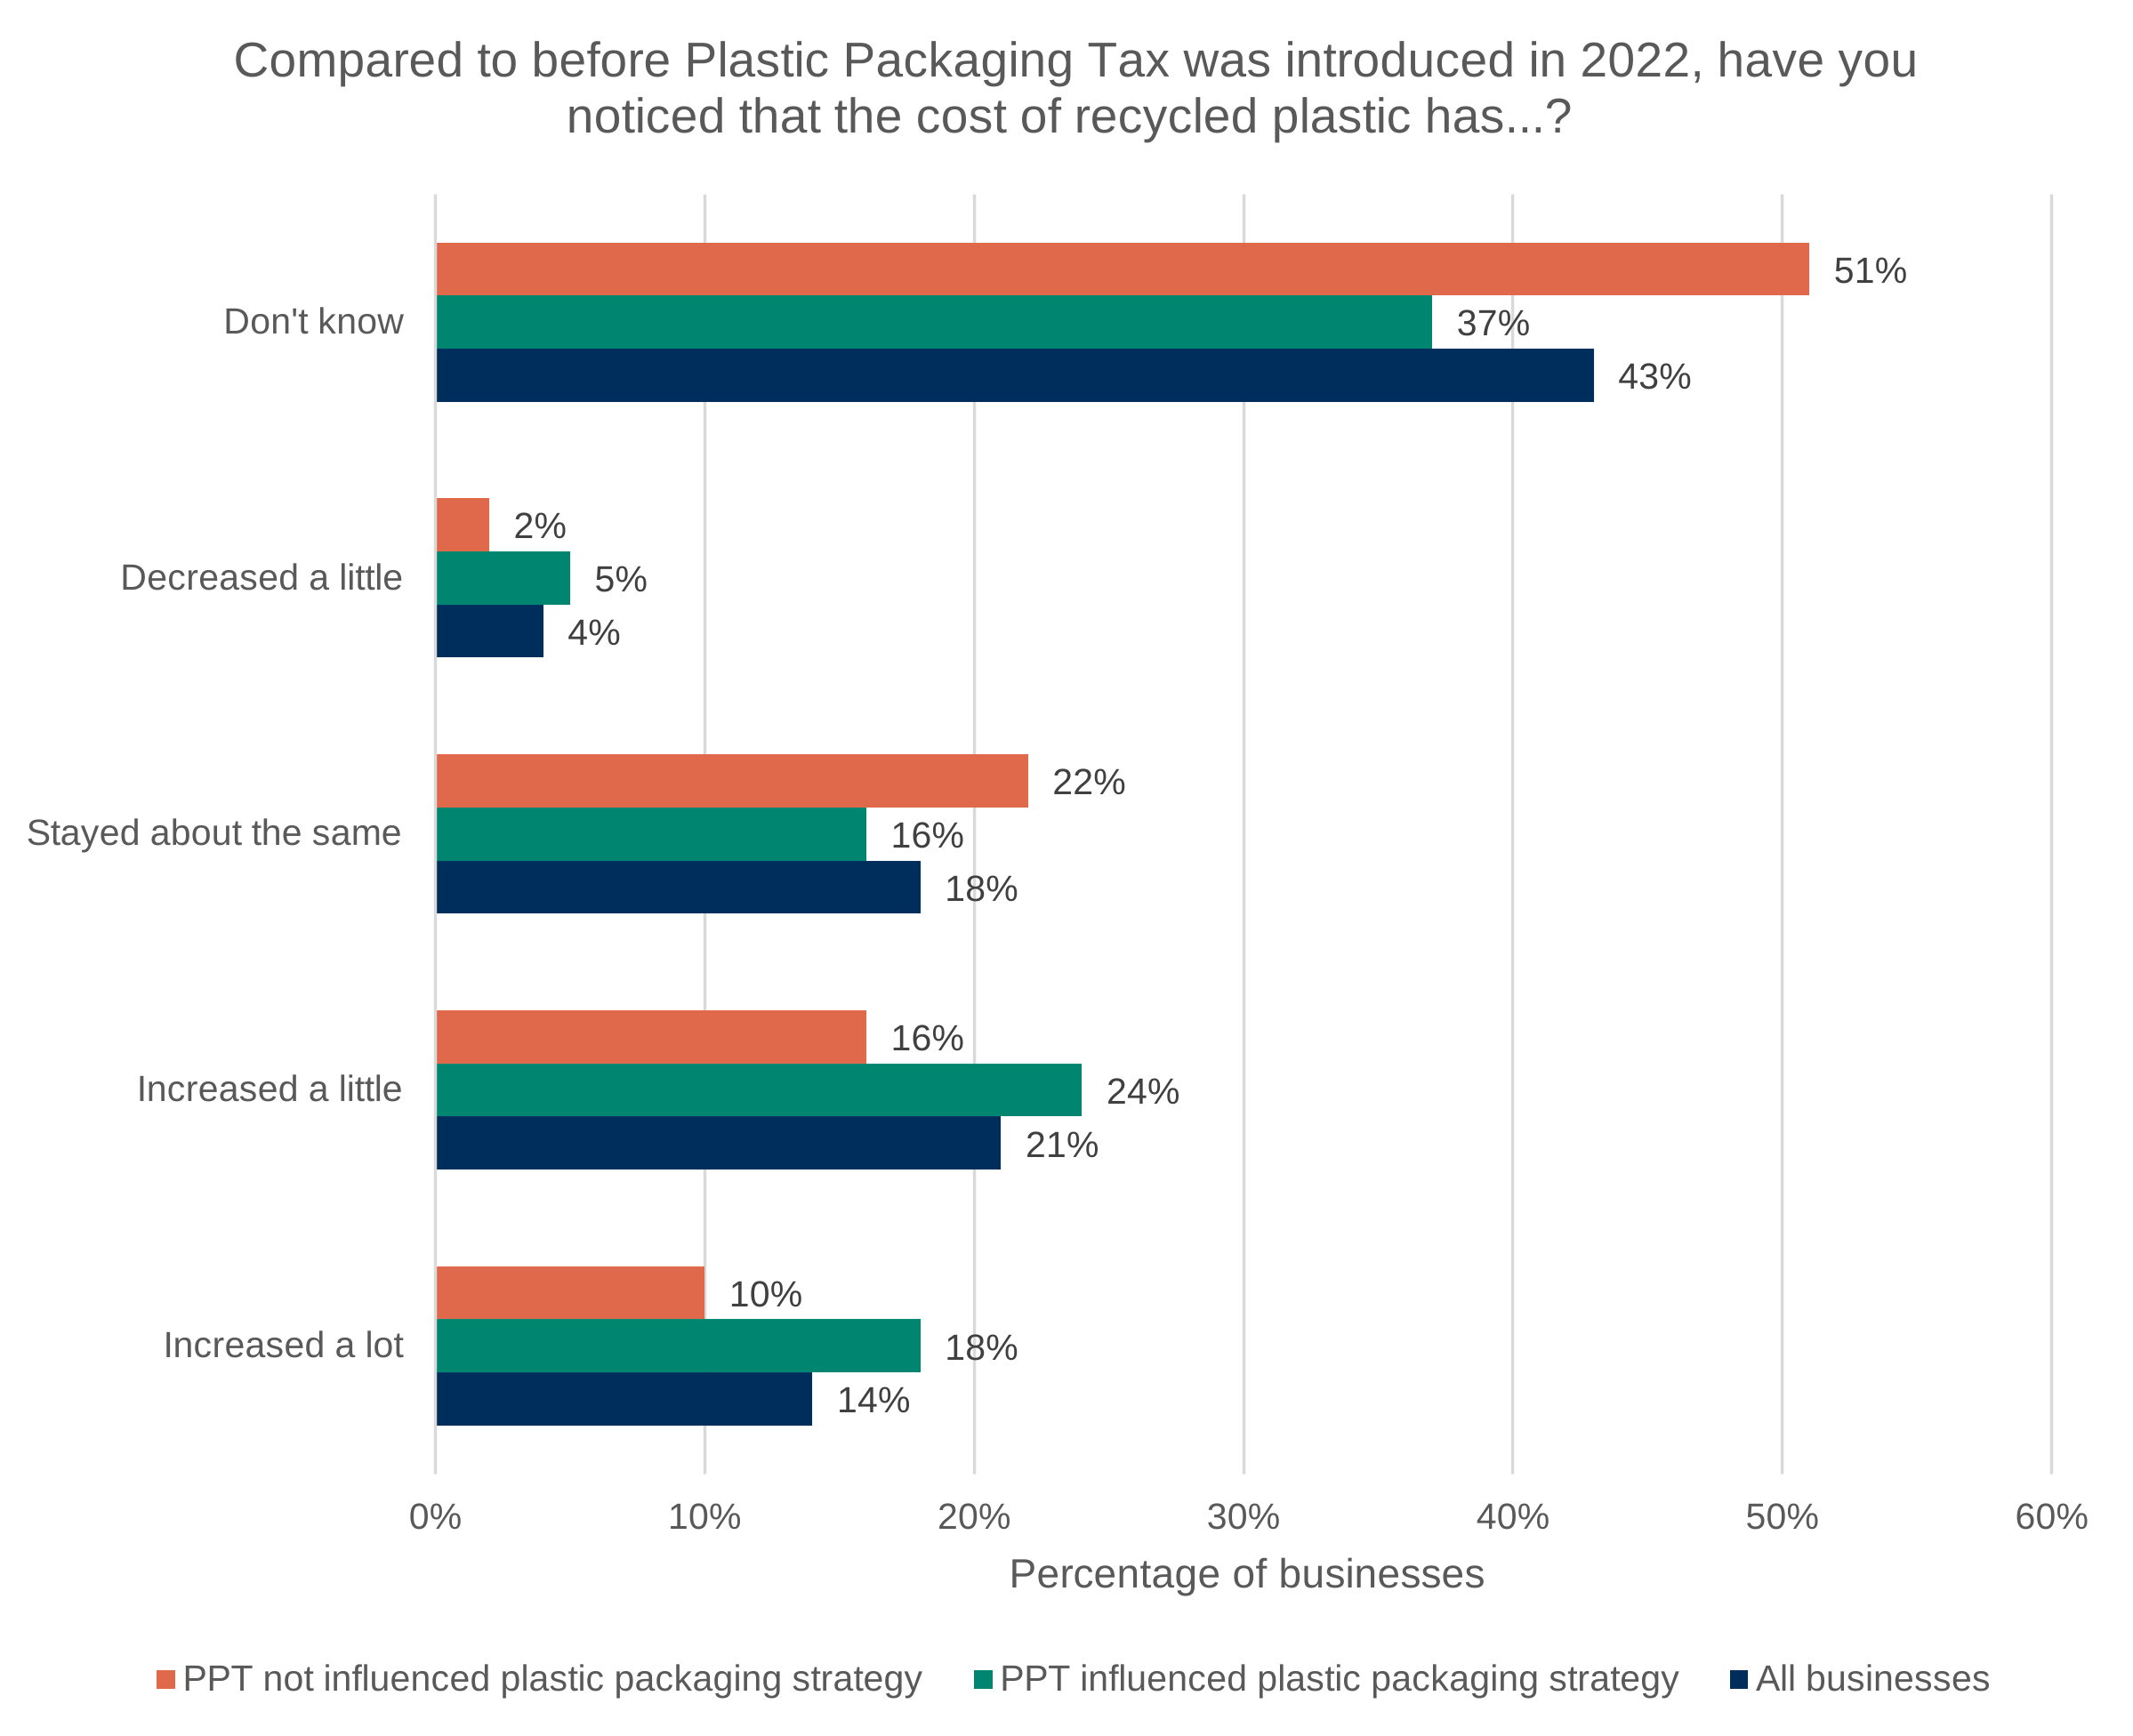
Data for Figure 6.10: Survey results for the question ‘Compared to before Plastic Packaging Tax was introduced in 2022, have you noticed that the cost of recycled plastic has…?’.
Base: All businesses (1,011), PPT has influenced plastic packaging strategy (615), and PPT has not influenced plastic packaging strategy (357). Source: Ipsos.
| Category | All businesses | PPT influenced plastic packaging strategy | PPT not influenced plastic packaging strategy |
|---|---|---|---|
| Don’t know | 43% | 37% | 51% |
| Decreased a little | 4% | 5% | 2% |
| Stayed about the same | 18% | 16% | 22% |
| Increased a little | 21% | 24% | 16% |
| Increased a lot | 14% | 18% | 10% |
Figure 6.10 explores whether businesses have reported observing a change in the cost of recycled plastic since the introduction of the tax. Businesses who reported PPT had influenced their plastic packaging strategy were significantly more likely to report observing changes in prices, in either direction, than businesses that weren’t influenced by PPT in their strategy. Moreover, businesses reporting PPT influence on their plastic packaging strategy were statistically significantly more likely to report increases in the cost of recycled plastic than businesses reporting no PPT influence (42% compared to 26%).
However, Figure 6.10 shows that the most common answer reported regarding changes in the price of recycled plastic was ‘Don’t know’. Businesses reporting PPT influence on their plastic packaging strategy were significantly less likely to report they didn’t know. The results show that 37% selected ‘Don’t know’ compared with 51% from businesses who reported that PPT had not influenced their packaging strategy. This may be important for understanding the influence of PPT because for PPT to act as an effective behavioural incentive, businesses need to be aware of the relative costs of virgin and recycled plastic.
Figure 6.11: Survey results for the question ‘Compared to before Plastic Packaging Tax was introduced in 2022, have you noticed that the cost of virgin plastic has…?’.
Base: All businesses (1,011), PPT has influenced plastic packaging strategy (615), and PPT has not influenced plastic packaging strategy (357). Source: Ipsos.
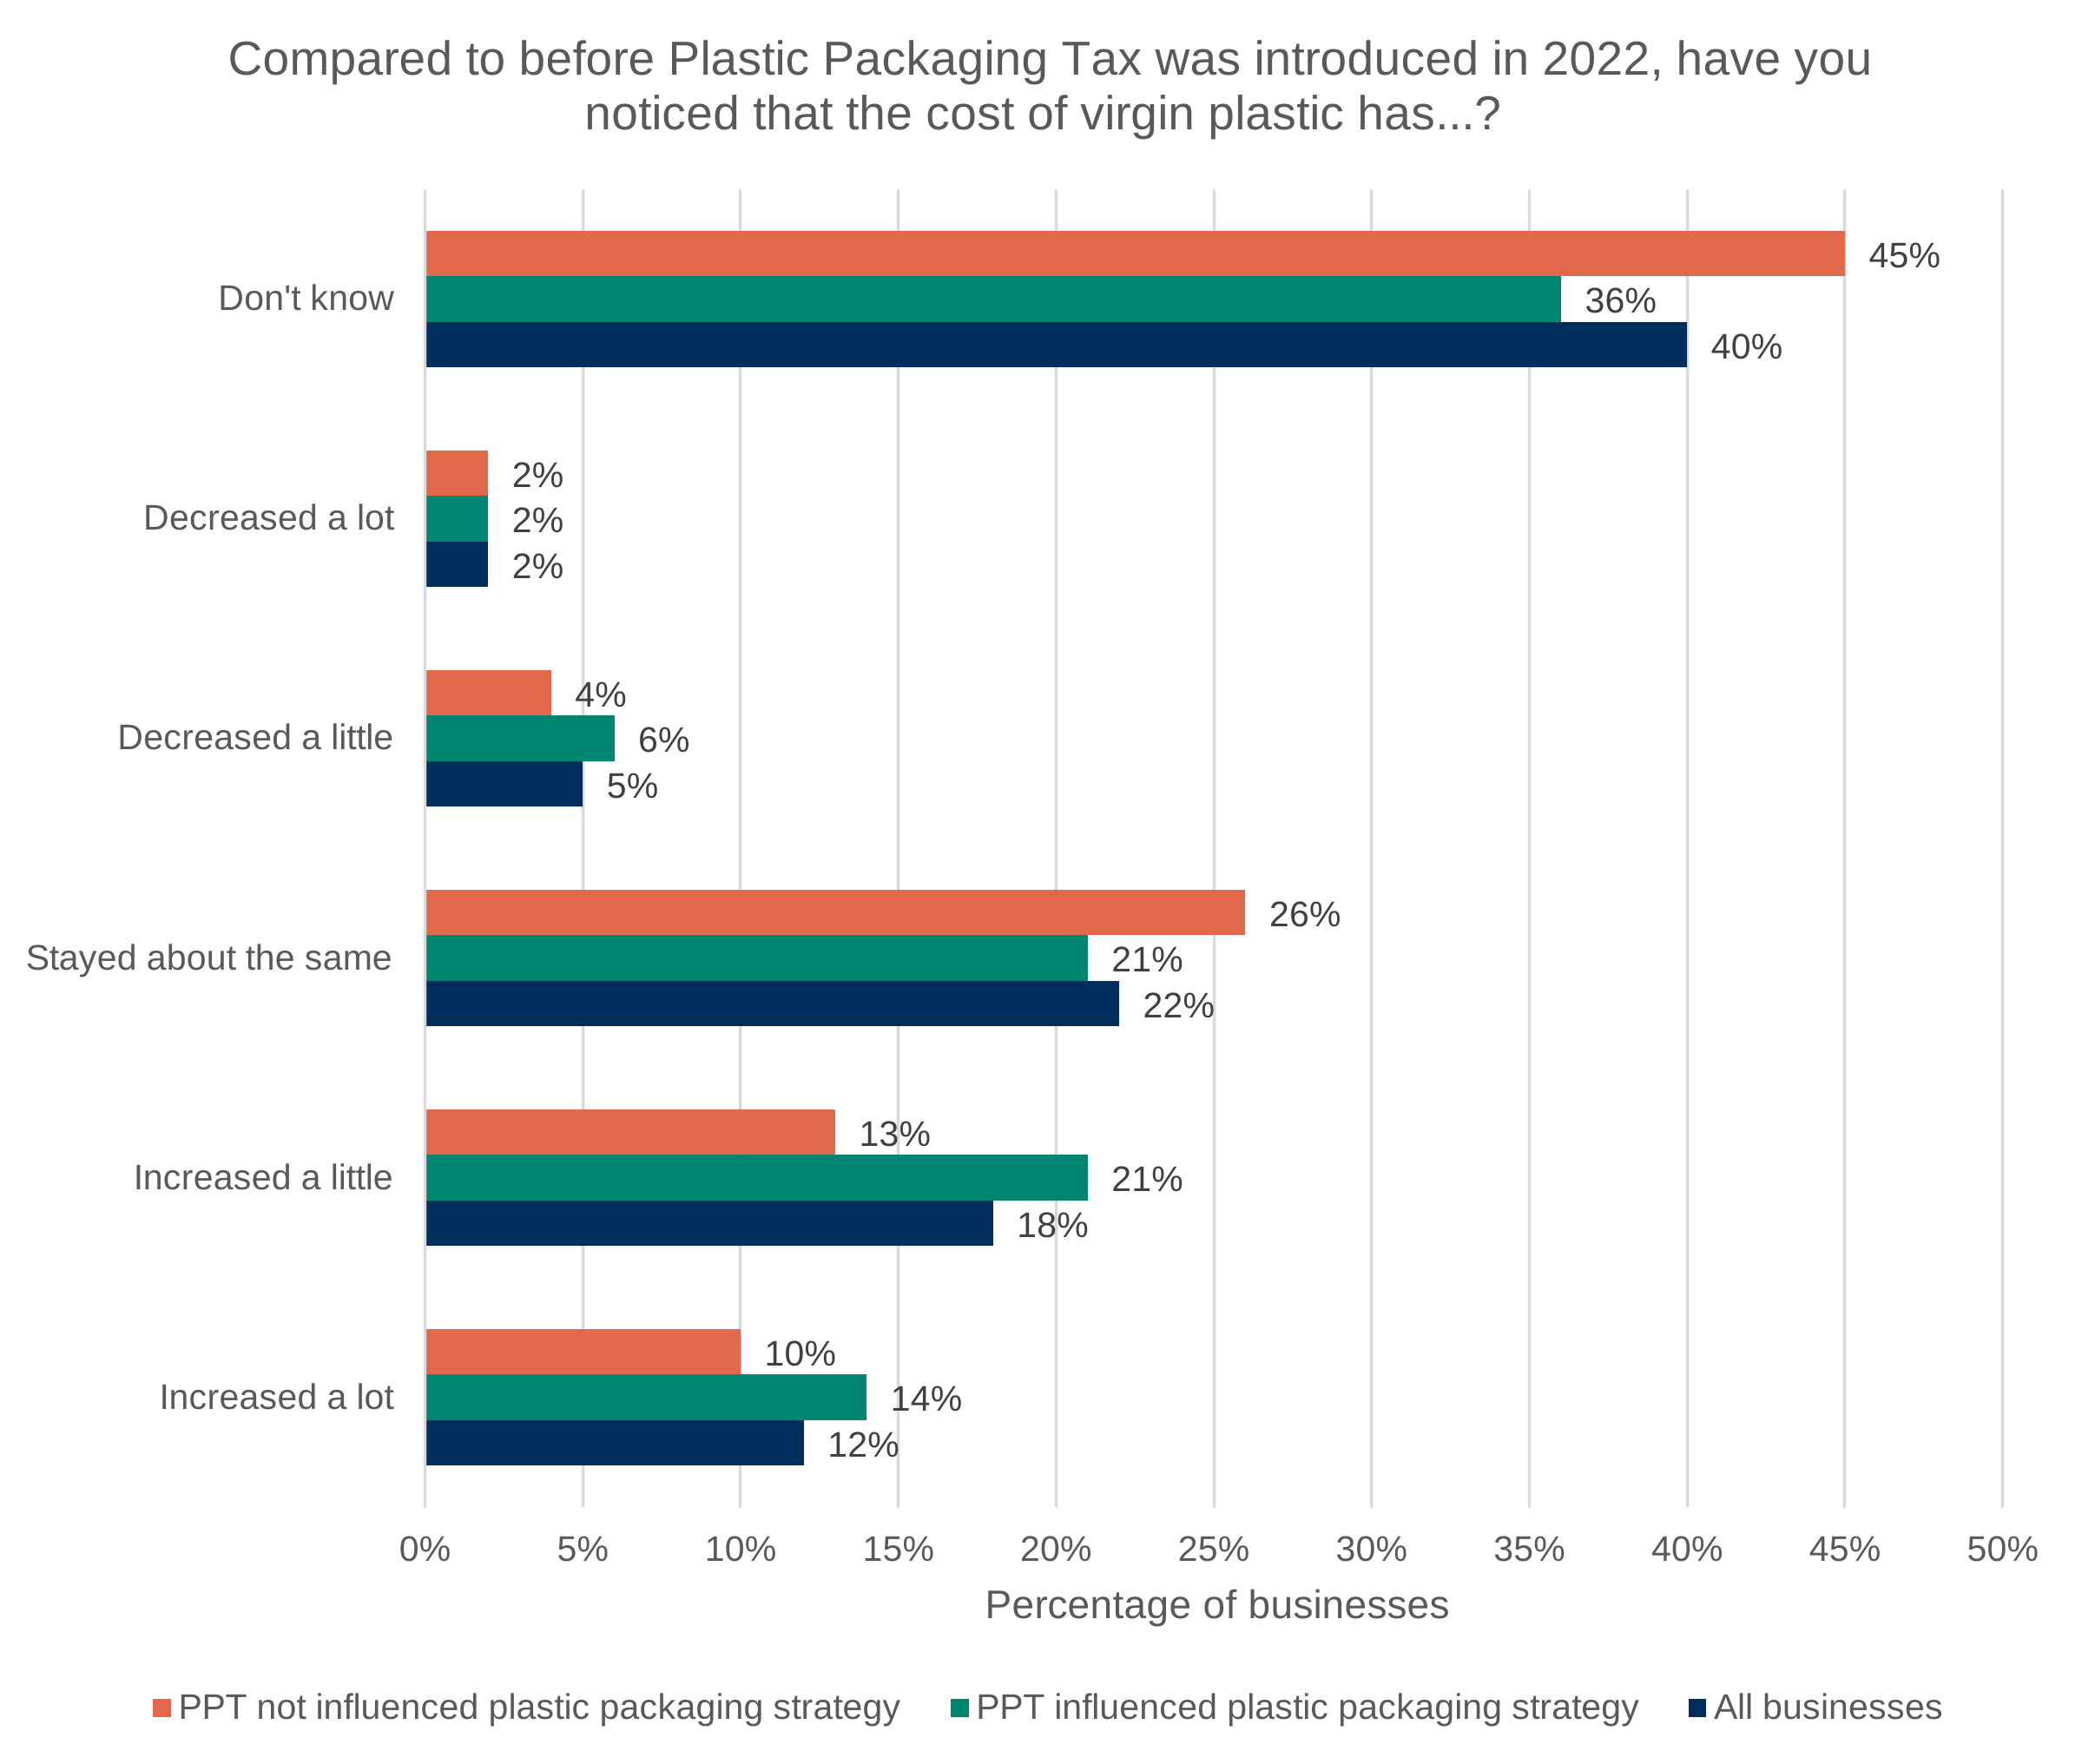
Data for Figure 6.11: Survey results for the question ‘Compared to before Plastic Packaging Tax was introduced in 2022, have you noticed that the cost of virgin plastic has…?’.
Base: All businesses (1,011), PPT has influenced plastic packaging strategy (615), and PPT has not influenced plastic packaging strategy (357). Source: Ipsos.
| Category | All businesses | PPT influenced plastic packaging strategy | PPT not influenced plastic packaging strategy |
|---|---|---|---|
| Don’t know | 40% | 36% | 45% |
| Decreased a lot | 2% | 2% | 2% |
| Decreased a little | 5% | 6% | 4% |
| Stayed about the same | 22% | 21% | 26% |
| Increased a little | 18% | 21% | 13% |
| Increased a lot | 12% | 14% | 10% |
A similar trend is found with the cost of virgin plastic, shown in Figure 6.11, with ‘Don’t know’ the most common answer reported, by 40% of businesses. The differences between influence on strategy are similarly statistically significant. This shows that understanding of plastic prices within businesses, whether recycled or virgin plastic, is not always salient and the price signal created by the tax may be less visible and less likely to influence decision-making.
However, the direction of this relationship cannot be established from the survey data. It is not possible to determine whether greater awareness of plastic prices increased the likelihood that PPT influenced packaging decisions, or whether businesses that were already intending to respond to PPT subsequently became more aware of plastic pricing. A substantial proportion of businesses reporting PPT influence on their plastic packaging strategy still selected they didn’t know if prices had changed. Overall, this highlights that the lack of salience surrounding plastic pricing may limit businesses’ ability to be influenced by PPT.
Figure 6.12: Survey results for the question ‘Compared to before Plastic Packaging Tax was introduced in 2022, have you noticed that the availability of virgin plastic has…?’.
Base: All businesses (1,011), PPT has influenced plastic packaging strategy (615), and PPT has not influenced plastic packaging strategy (357). Source: Ipsos.
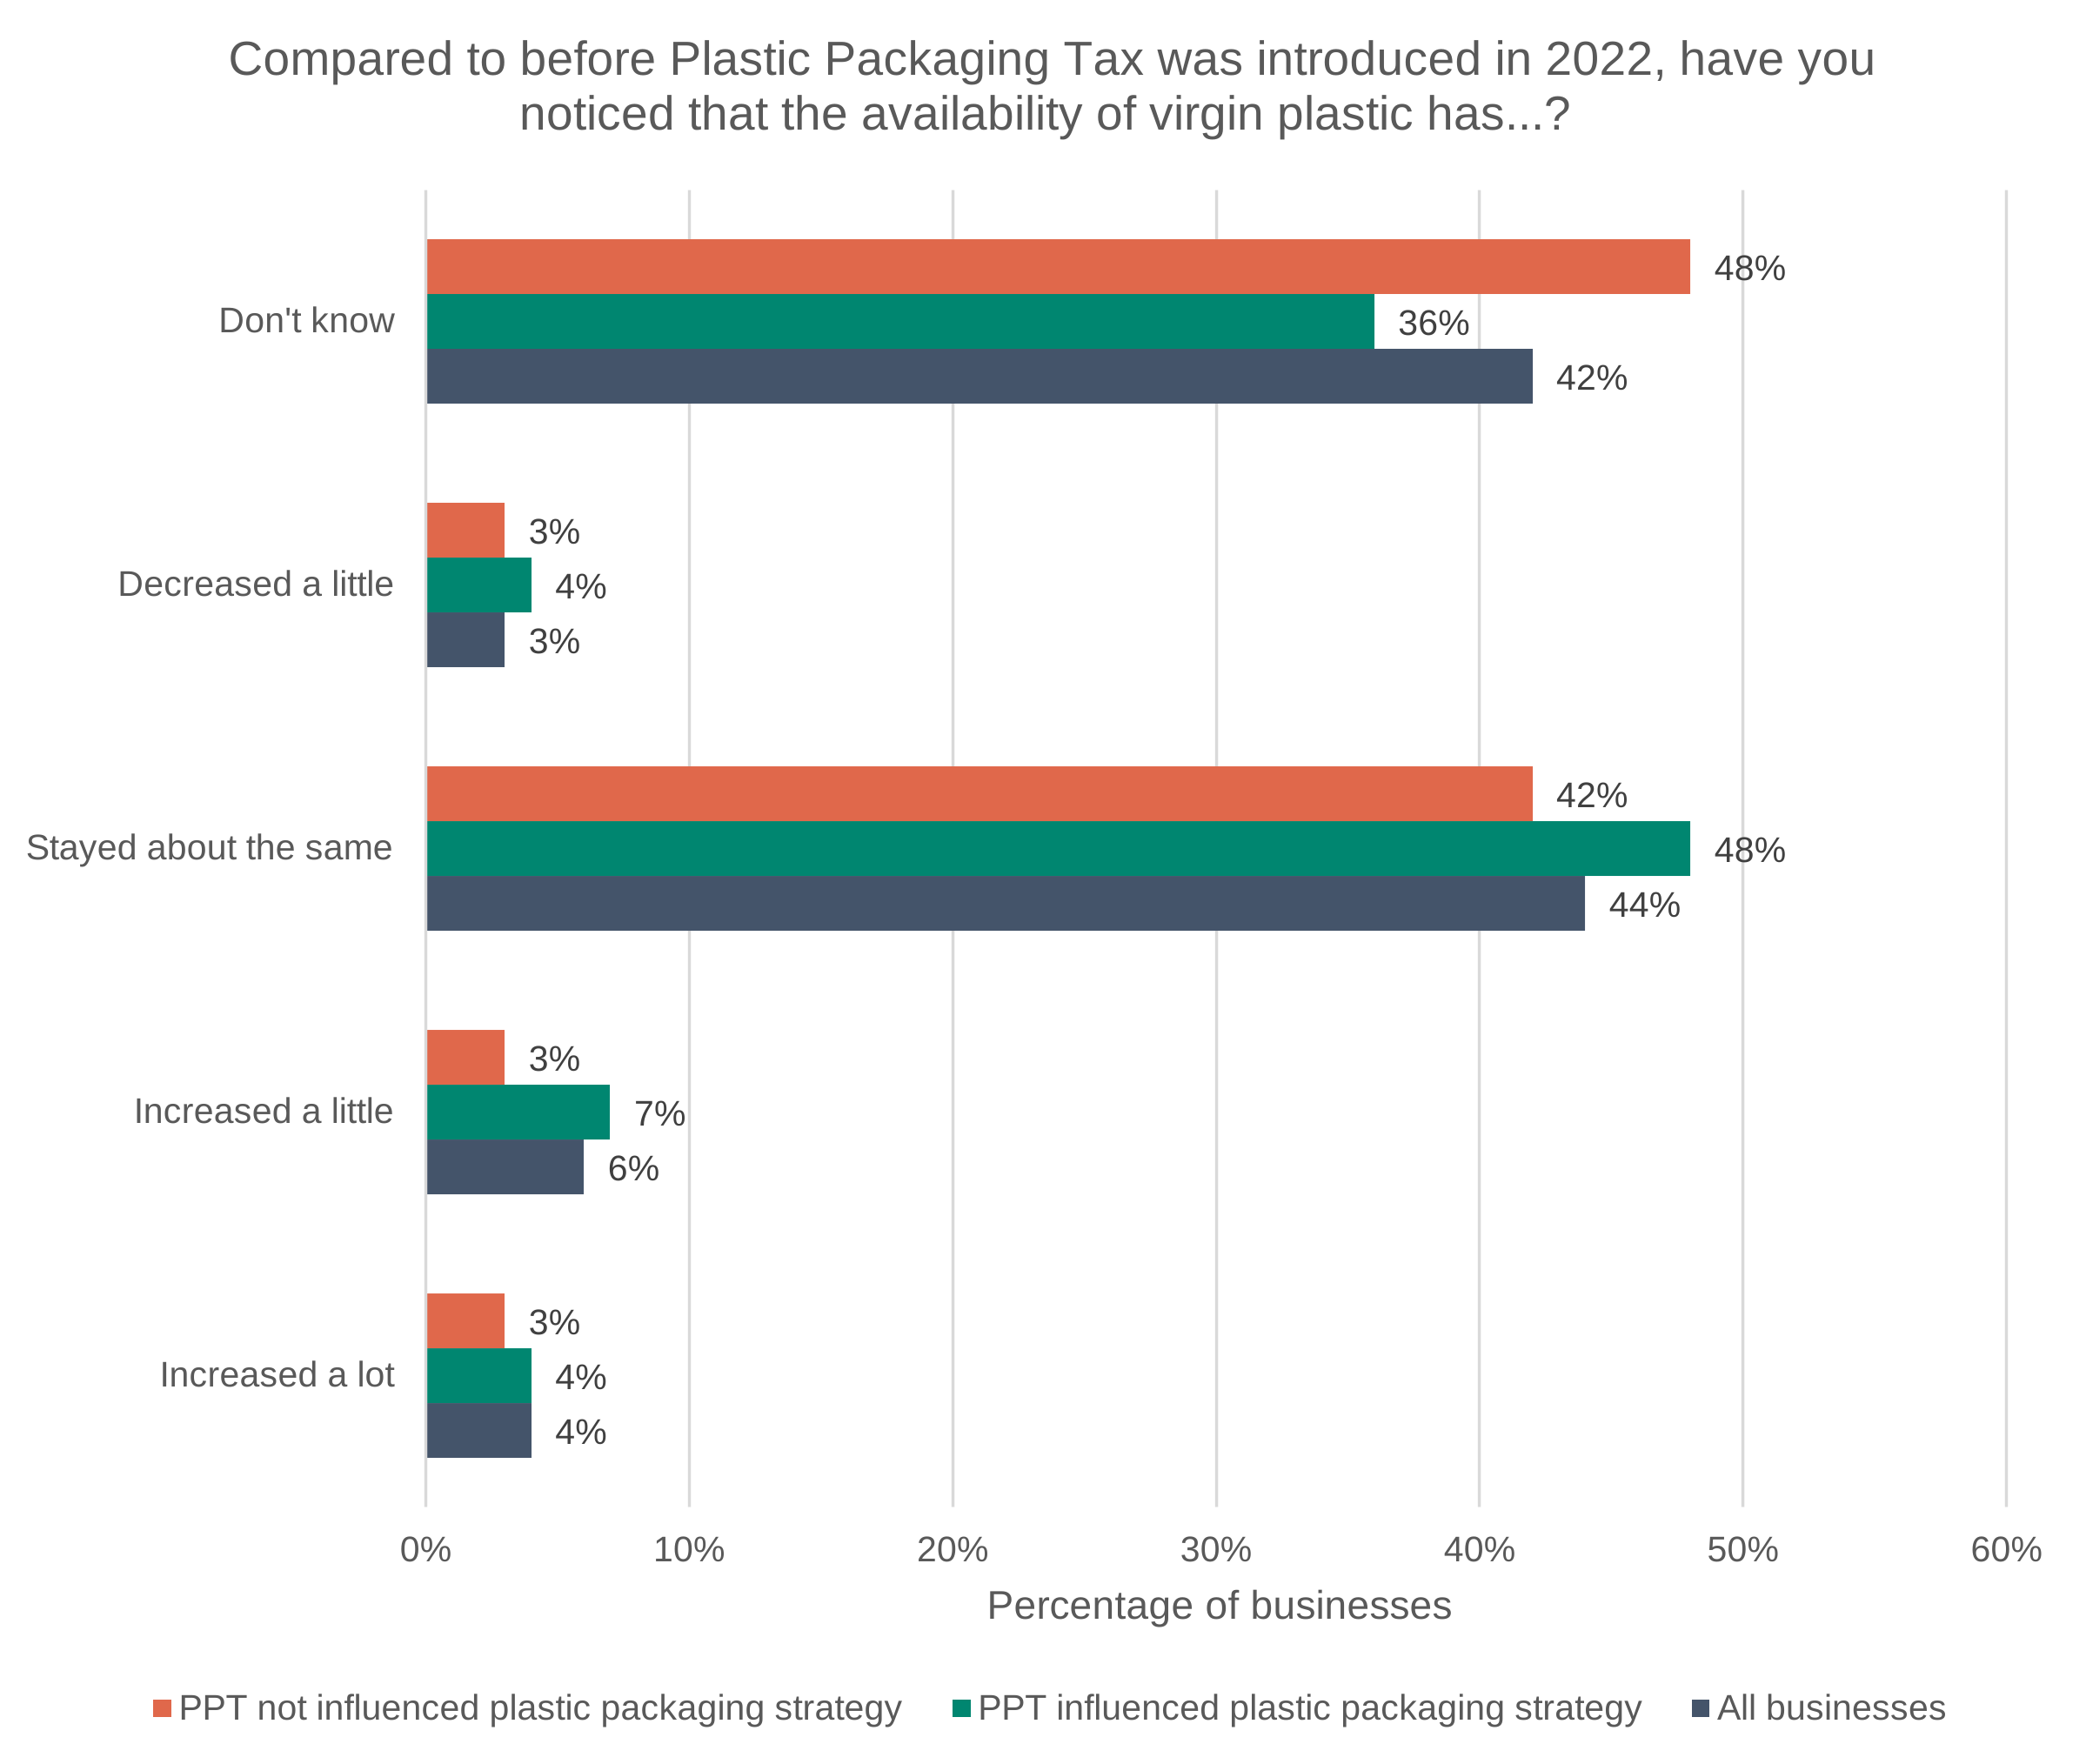
Data for Figure 6.12: Survey results for the question ‘Compared to before Plastic Packaging Tax was introduced in 2022, have you noticed that the availability of virgin plastic has…?’.
Base: All businesses (1,011), PPT has influenced plastic packaging strategy (615), and PPT has not influenced plastic packaging strategy (357). Source: Ipsos.
| Category | All businesses | PPT influenced plastic packaging strategy | PPT not influenced plastic packaging strategy |
|---|---|---|---|
| Don’t know | 42% | 36% | 48% |
| Decreased a little | 3% | 4% | 3% |
| Stayed about the same | 44% | 48% | 42% |
| Increased a little | 6% | 7% | 3% |
| Increased a lot | 4% | 4% | 3% |
Figure 6.13: Survey results for the question ‘Compared to before Plastic Packaging Tax was introduced in 2022, have you noticed that the availability of recycled plastic has…?’.
Base: All businesses (1,011), PPT has influenced plastic packaging strategy (615), and PPT has not influenced plastic packaging strategy (357). Source: Ipsos.
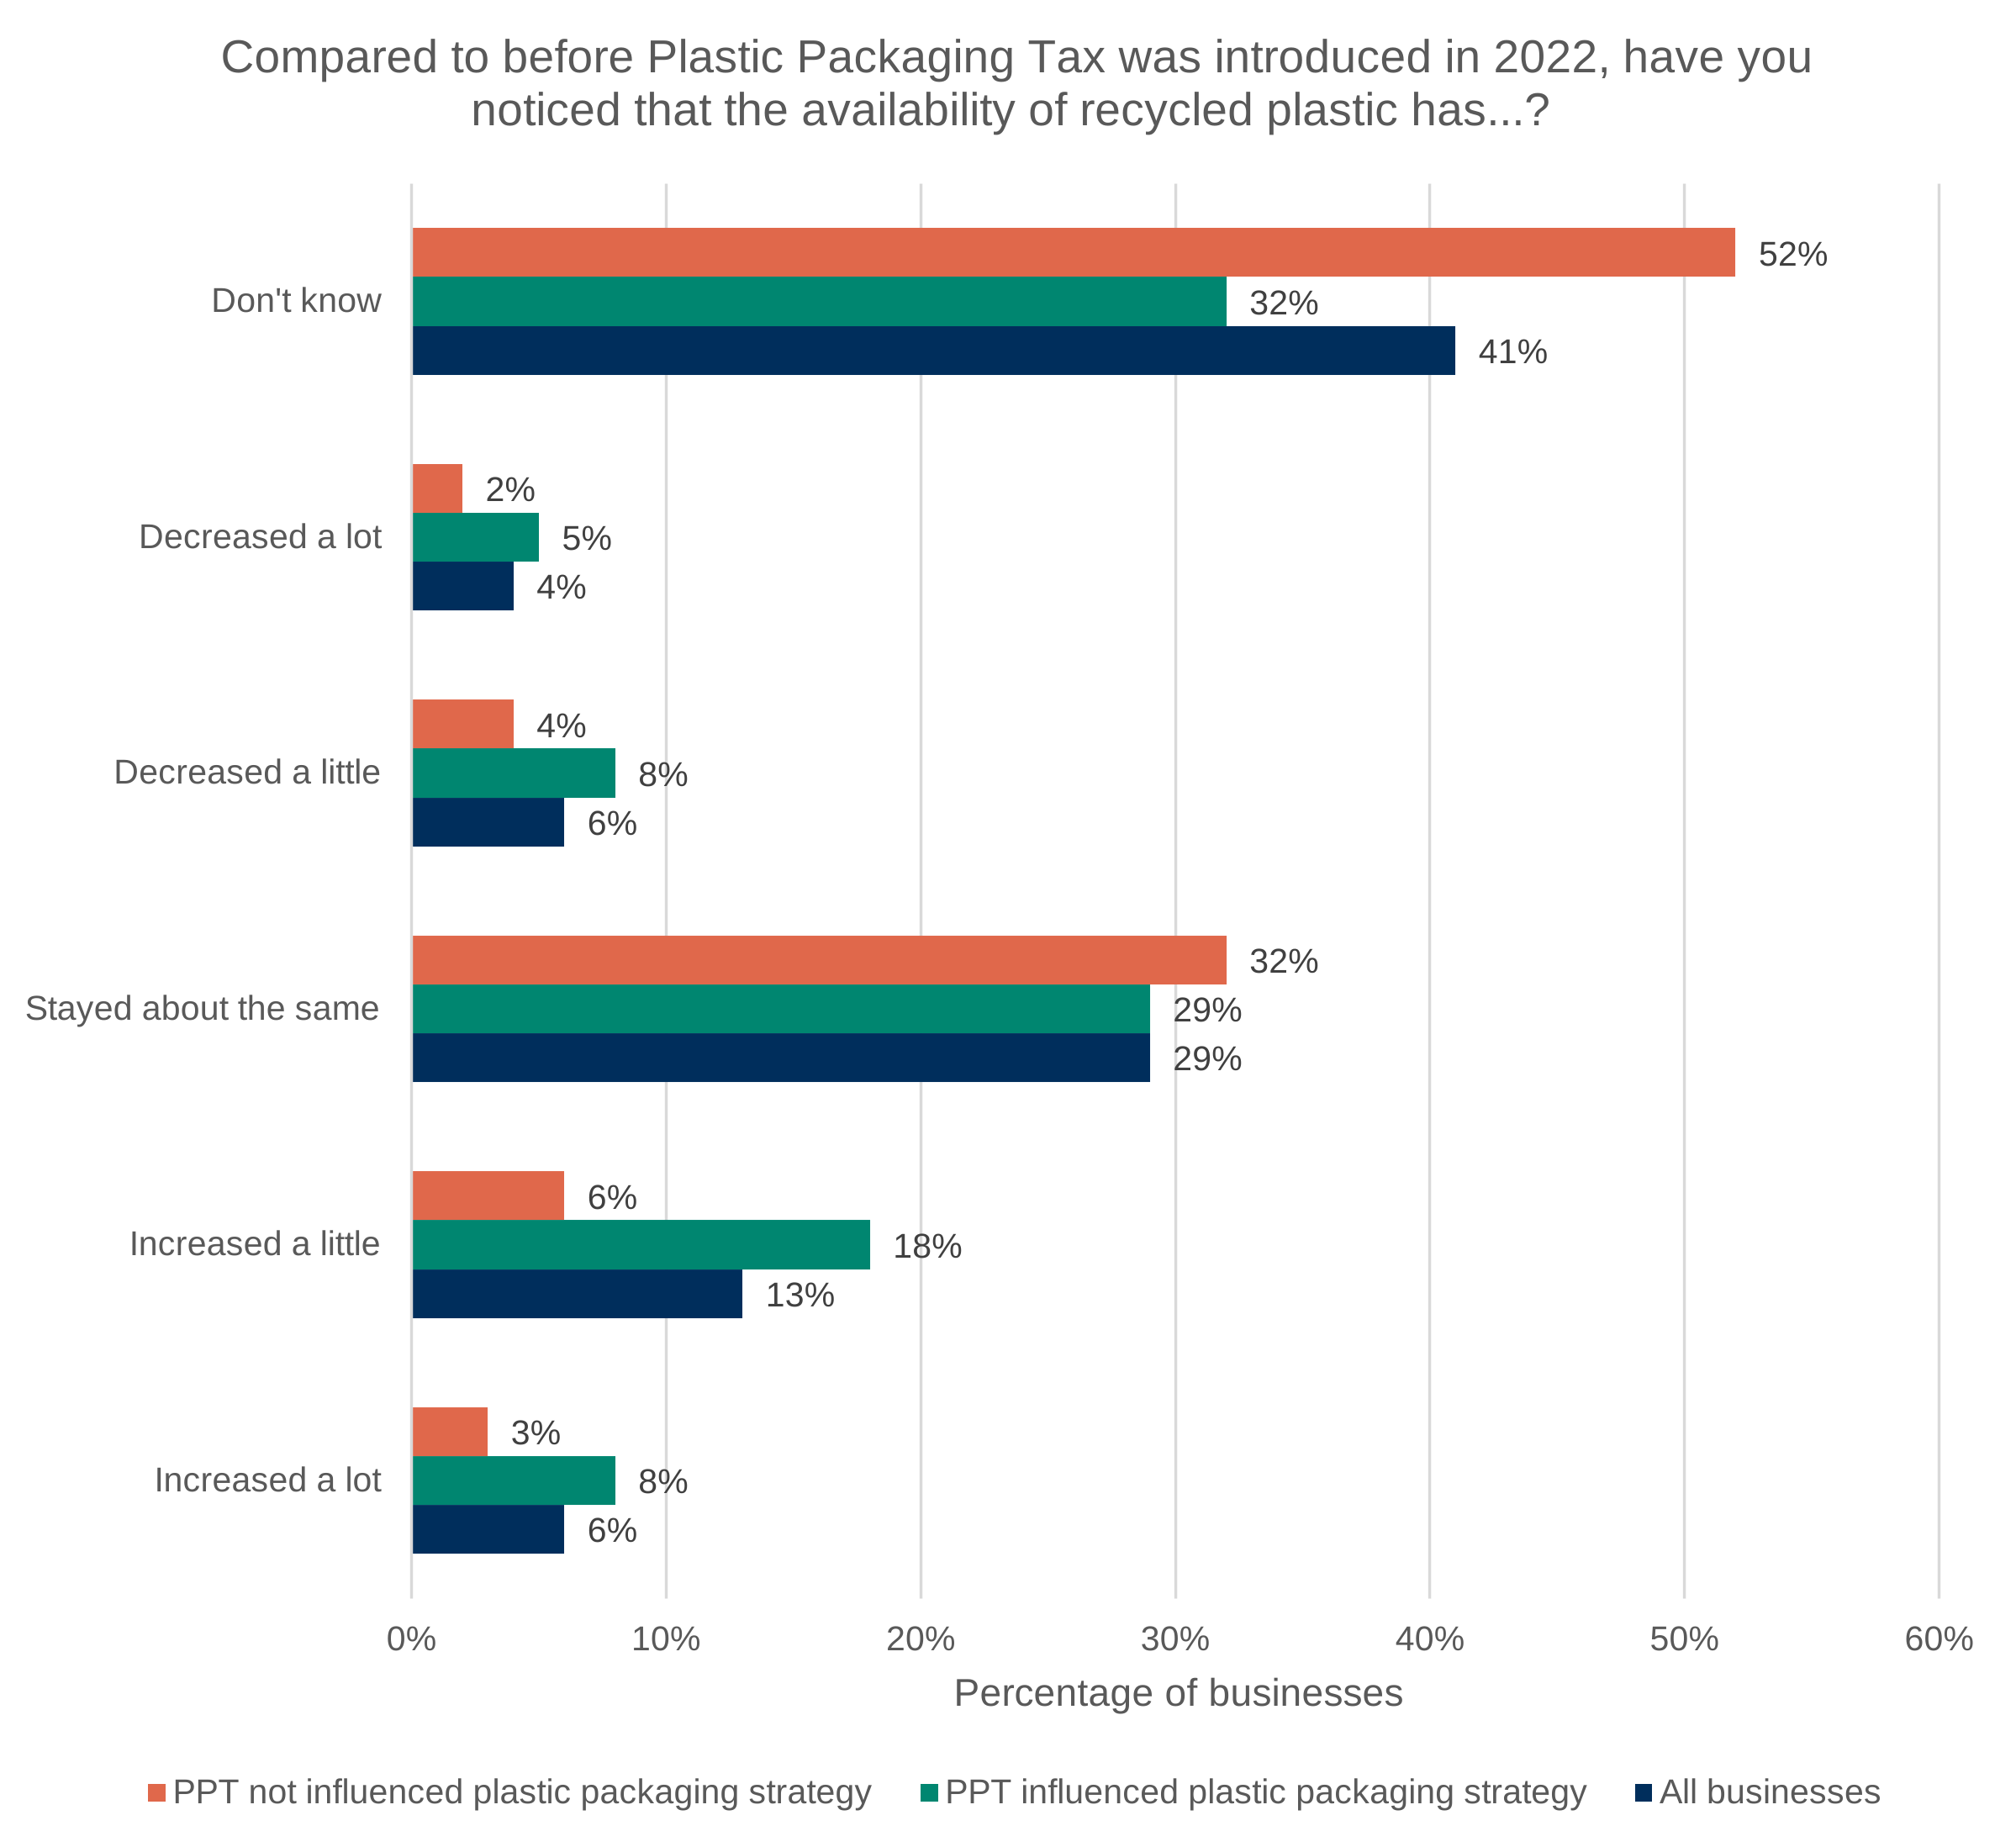
Data for Figure 6.13: Survey results for the question ‘Compared to before Plastic Packaging Tax was introduced in 2022, have you noticed that the availability of recycled plastic has…?’.
Base: All businesses (1,011), PPT has influenced plastic packaging strategy (615), and PPT has not influenced plastic packaging strategy (357). Source: Ipsos.
| Category | All businesses | PPT influenced plastic packaging strategy | PPT not influenced plastic packaging strategy |
|---|---|---|---|
| Don’t know | 41% | 32% | 52% |
| Decreased a lot | 4% | 5% | 2% |
| Decreased a little | 6% | 8% | 4% |
| Stayed about the same | 29% | 29% | 32% |
| Increased a little | 13% | 18% | 6% |
| Increased a lot | 6% | 8% | 3% |
Perceptions of the availability of plastic show similarities to the salience of pricing for plastic feedstock, as shown in Figure 6.12 and Figure 6.13. Businesses reporting that PPT had influenced their plastic packaging strategy were statistically significantly more likely to report noticing the availability of recycled plastic increasing since the introduction of the tax. However, the majority of businesses reported that they didn’t know if the availability had changed or that availability had stayed about the same. Given the effectiveness of an environmental tax depends in part on the salience of the tax, the results of these findings suggest that the influence of PPT is being limited by this salience issue.
The qualitative research provides further context for these findings. Some businesses described the cost of recycled plastic relative to virgin plastic as an important consideration in packaging decisions. Consequently, lack of pricing salience across the tax base may limit the ability of businesses to respond via this mechanism. Moreover, some firms with awareness of pricing noted in the qualitative research that recycled materials were often more expensive, making it more cost effective to pay the tax rather than change their packaging. In this case, the tax rate would need to be increased to deliver its stated objective of making virgin plastic the less economic choice.
The qualitative research also highlighted quality concerns and sector-specific regulatory requirements that limited some businesses’ ability to respond to changes in plastic market conditions and adopt packaging changes, making knowledge of pricing between virgin and recycled plastic less relevant to the way these businesses operate. This was particularly relevant in sectors such as food, pharmaceuticals and medical products, where safety and product performance requirements were a stronger consideration than the use of recycled materials.
Overall, the findings suggest that businesses reporting PPT had influenced their packaging strategy were more likely to notice changes in the cost and availability of both recycled and virgin plastic. This is consistent with the idea that awareness of plastic market conditions may be associated with greater responsiveness to the incentive created by the tax. However, a substantial proportion of businesses were unable to identify whether prices or availability had changed, indicating that these factors are not highly salient across much of the tax base.
The qualitative evidence further suggests that market conditions can both enable and constrain behavioural change. For some businesses, the relative cost and availability of recycled plastic are important considerations when making packaging decisions. For others, recycled plastic remains more expensive than virgin plastic, while quality requirements, regulatory standards and operational constraints limit the scope for packaging changes regardless of price. These findings suggest that the influence of PPT is shaped not only by the tax itself, but also by businesses’ awareness of plastic market conditions and their ability to respond to them. As a result, uncertainty over prices and availability, alongside wider technical and regulatory constraints, may limit the extent to which PPT can drive behavioural change across all businesses.
6.4.4 Further packaging changes and investment in packaging
Section 6.4.2 showed that 60% of businesses reported PPT influenced their plastic packaging strategy. These businesses were also found to be significantly more likely to identify wider market conditions and regulatory factors as shaping their packaging strategy. As a result, this section further explores the reported changes that businesses have made to either achieve an increase in their packaging’s recycled content or to improve their sustainability efforts more generally.
Figure 6.14: Survey results for the question ‘Has your business made any of the following changes due to Plastic Packaging Tax?’.
Base: All businesses (1,011). Source: Ipsos.
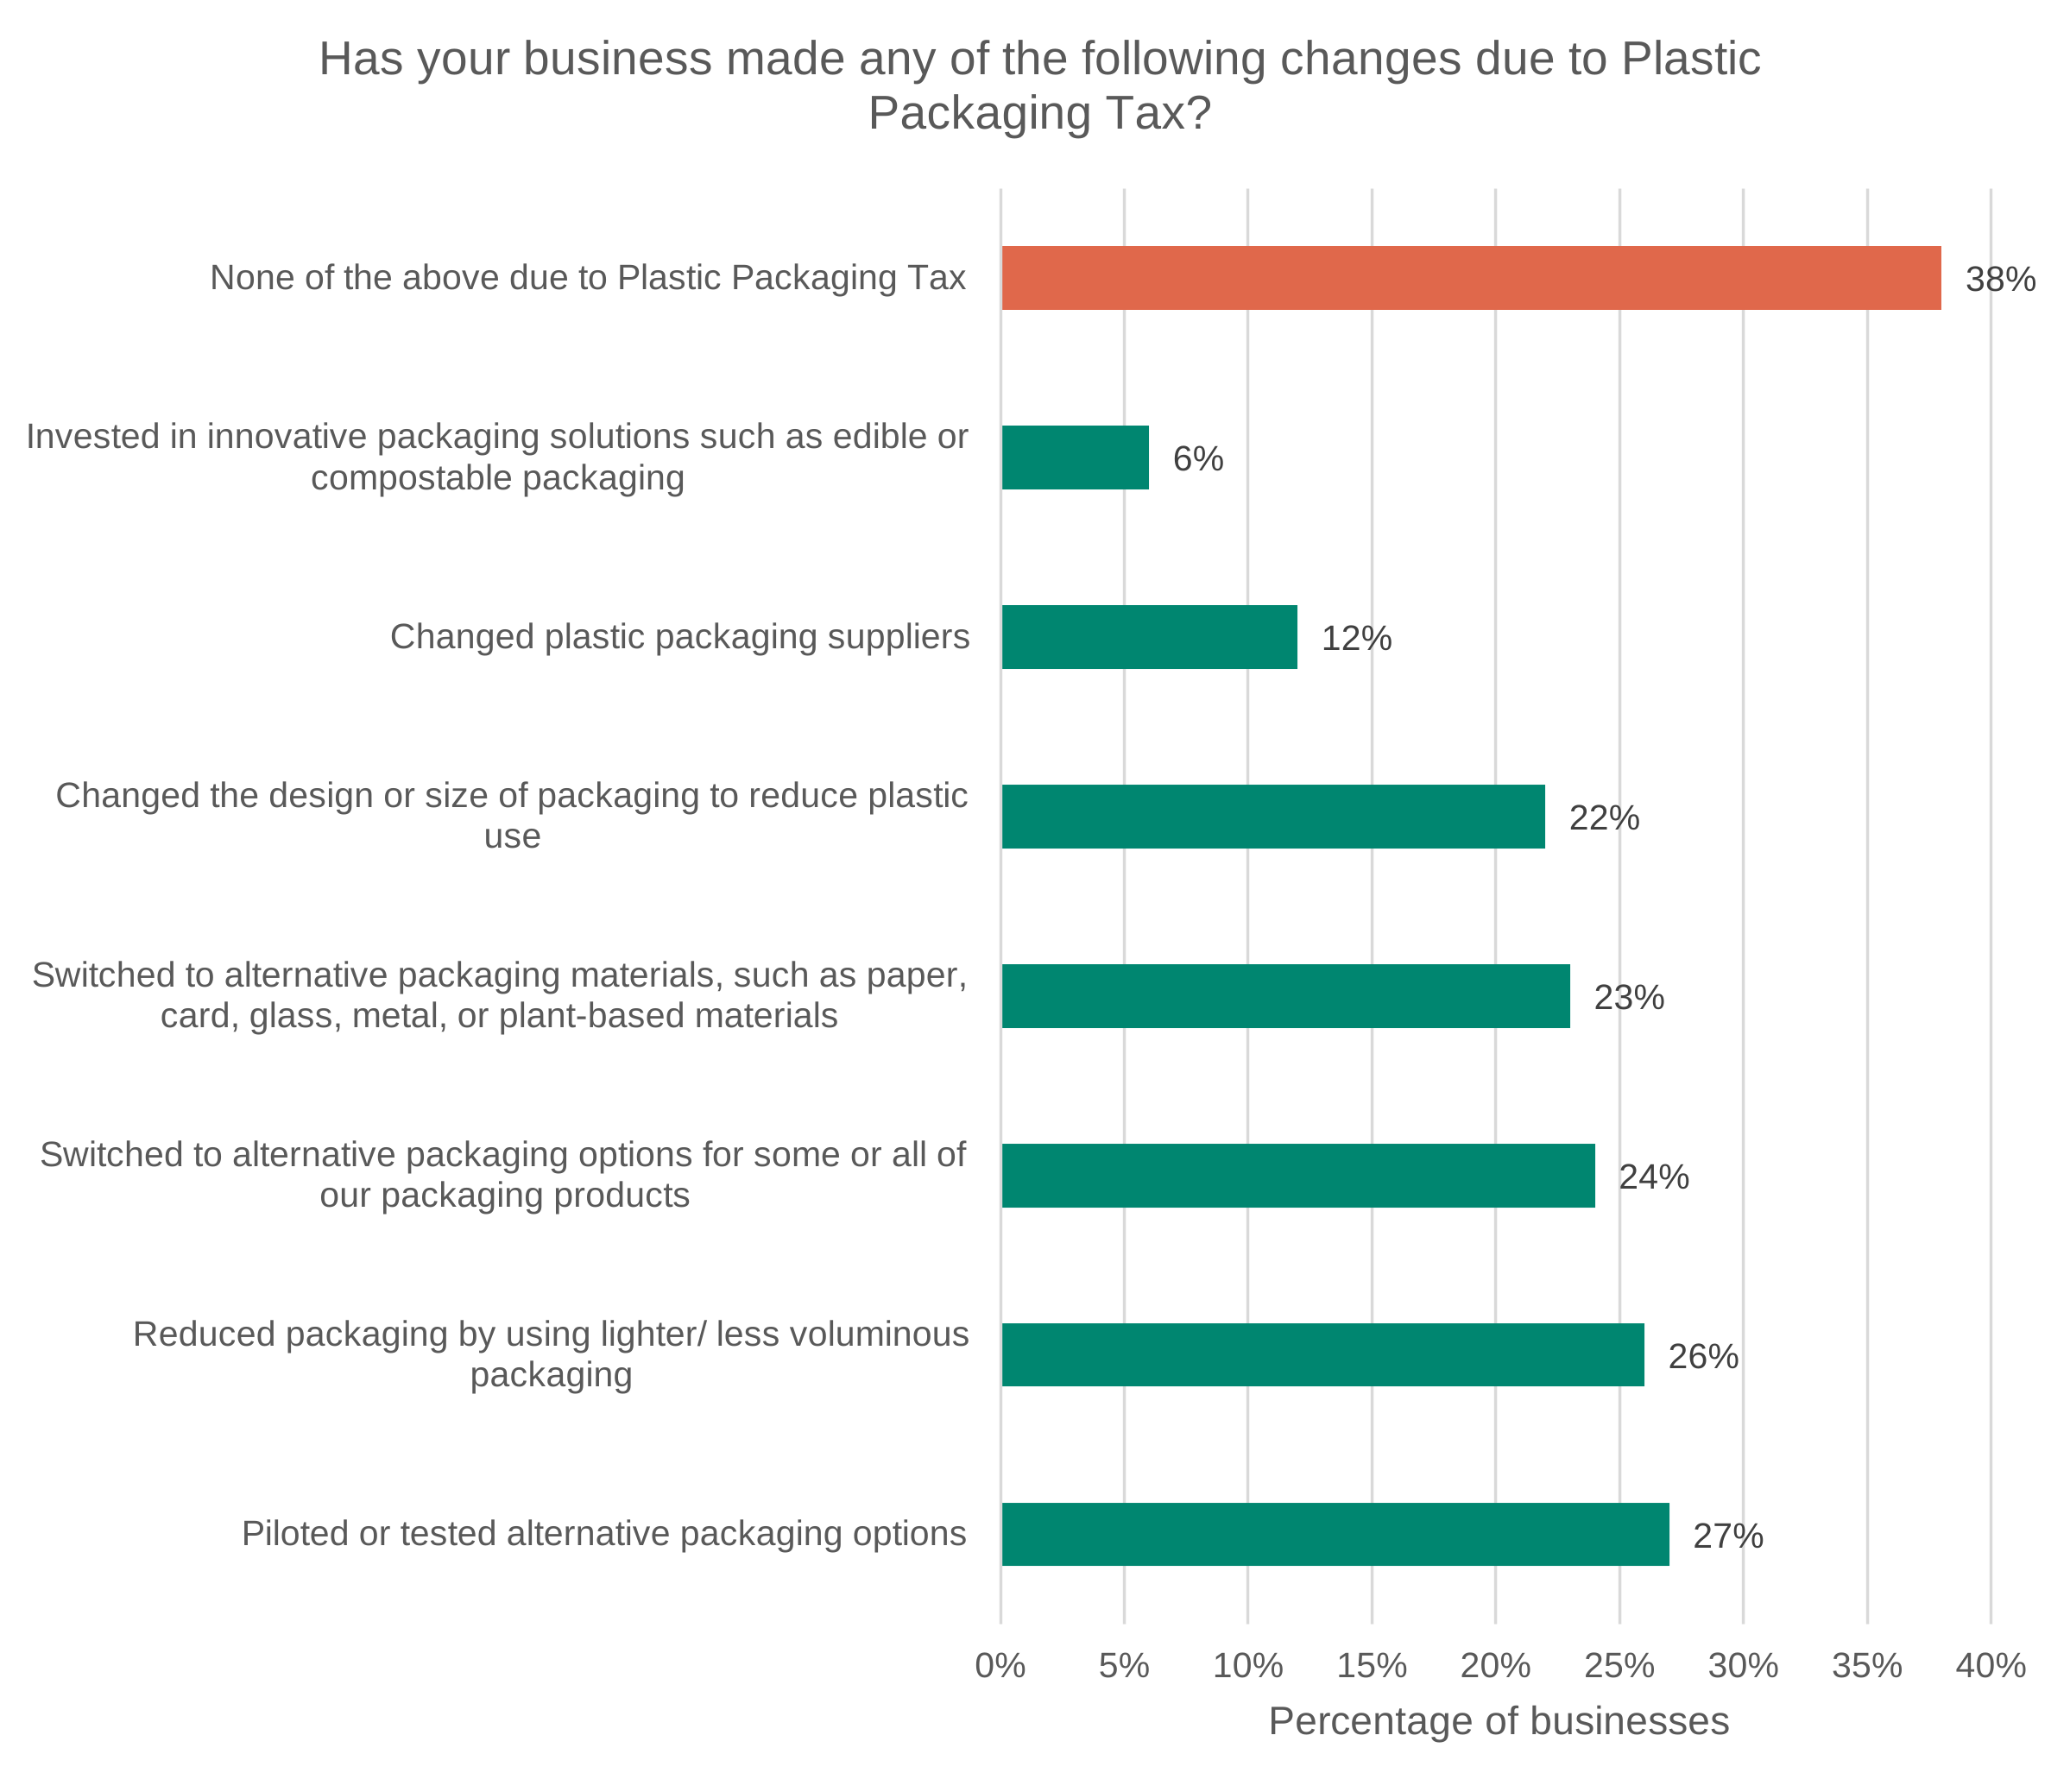
Data for Figure 6.14: Survey results for the question ‘Has your business made any of the following changes due to Plastic Packaging Tax?’.
Base: All businesses (1,011). Source: Ipsos.
| Category | All businesses |
|---|---|
| None of the above due to Plastic Packaging Tax | 38% |
| Invested in innovative packaging solutions such as edible or compostable packaging | 6% |
| Changed plastic packaging suppliers | 12% |
| Changed the design or size of packaging to reduce plastic use | 22% |
| Switched to alternative packaging materials, such as paper, card, glass, metal, or plant-based materials | 23% |
| Switched to alternative packaging options for some or all of our packaging products | 24% |
| Reduced packaging by using lighter/ less voluminous packaging | 26% |
| Piloted or tested alternative packaging options | 27% |
Figure 6.14 shows other packaging-related changes reported by businesses, separate from changes to recycled plastic content and overall plastic packaging tonnage (which is covered in Chapter 4). The survey suggests that businesses have responded to PPT through a range of packaging changes, although no single response was dominant. Around a quarter of businesses reported piloting or testing alternative packaging options (27%), reducing packaging through lighter or less voluminous designs (26%), switching to alternative packaging options (24%), or adopting non-plastic materials such as paper, card, glass or metal (23%). Similar proportions reported changing the design or size of packaging to reduce plastic use (22%). Less common responses included changing plastic packaging suppliers (12%) and investing in innovative packaging solutions (6%). However, 38% of businesses reported making none of these changes due to PPT, further indicating that while the tax has influenced packaging decisions for many businesses, its behavioural impact has not been universal.
Figure 6.15: Survey results for the question ‘Has your business made any of the following changes due to Plastic Packaging Tax?’.
Base: PPT has influenced plastic packaging strategy (615) and PPT has not influenced plastic packaging strategy (357). Source: Ipsos.
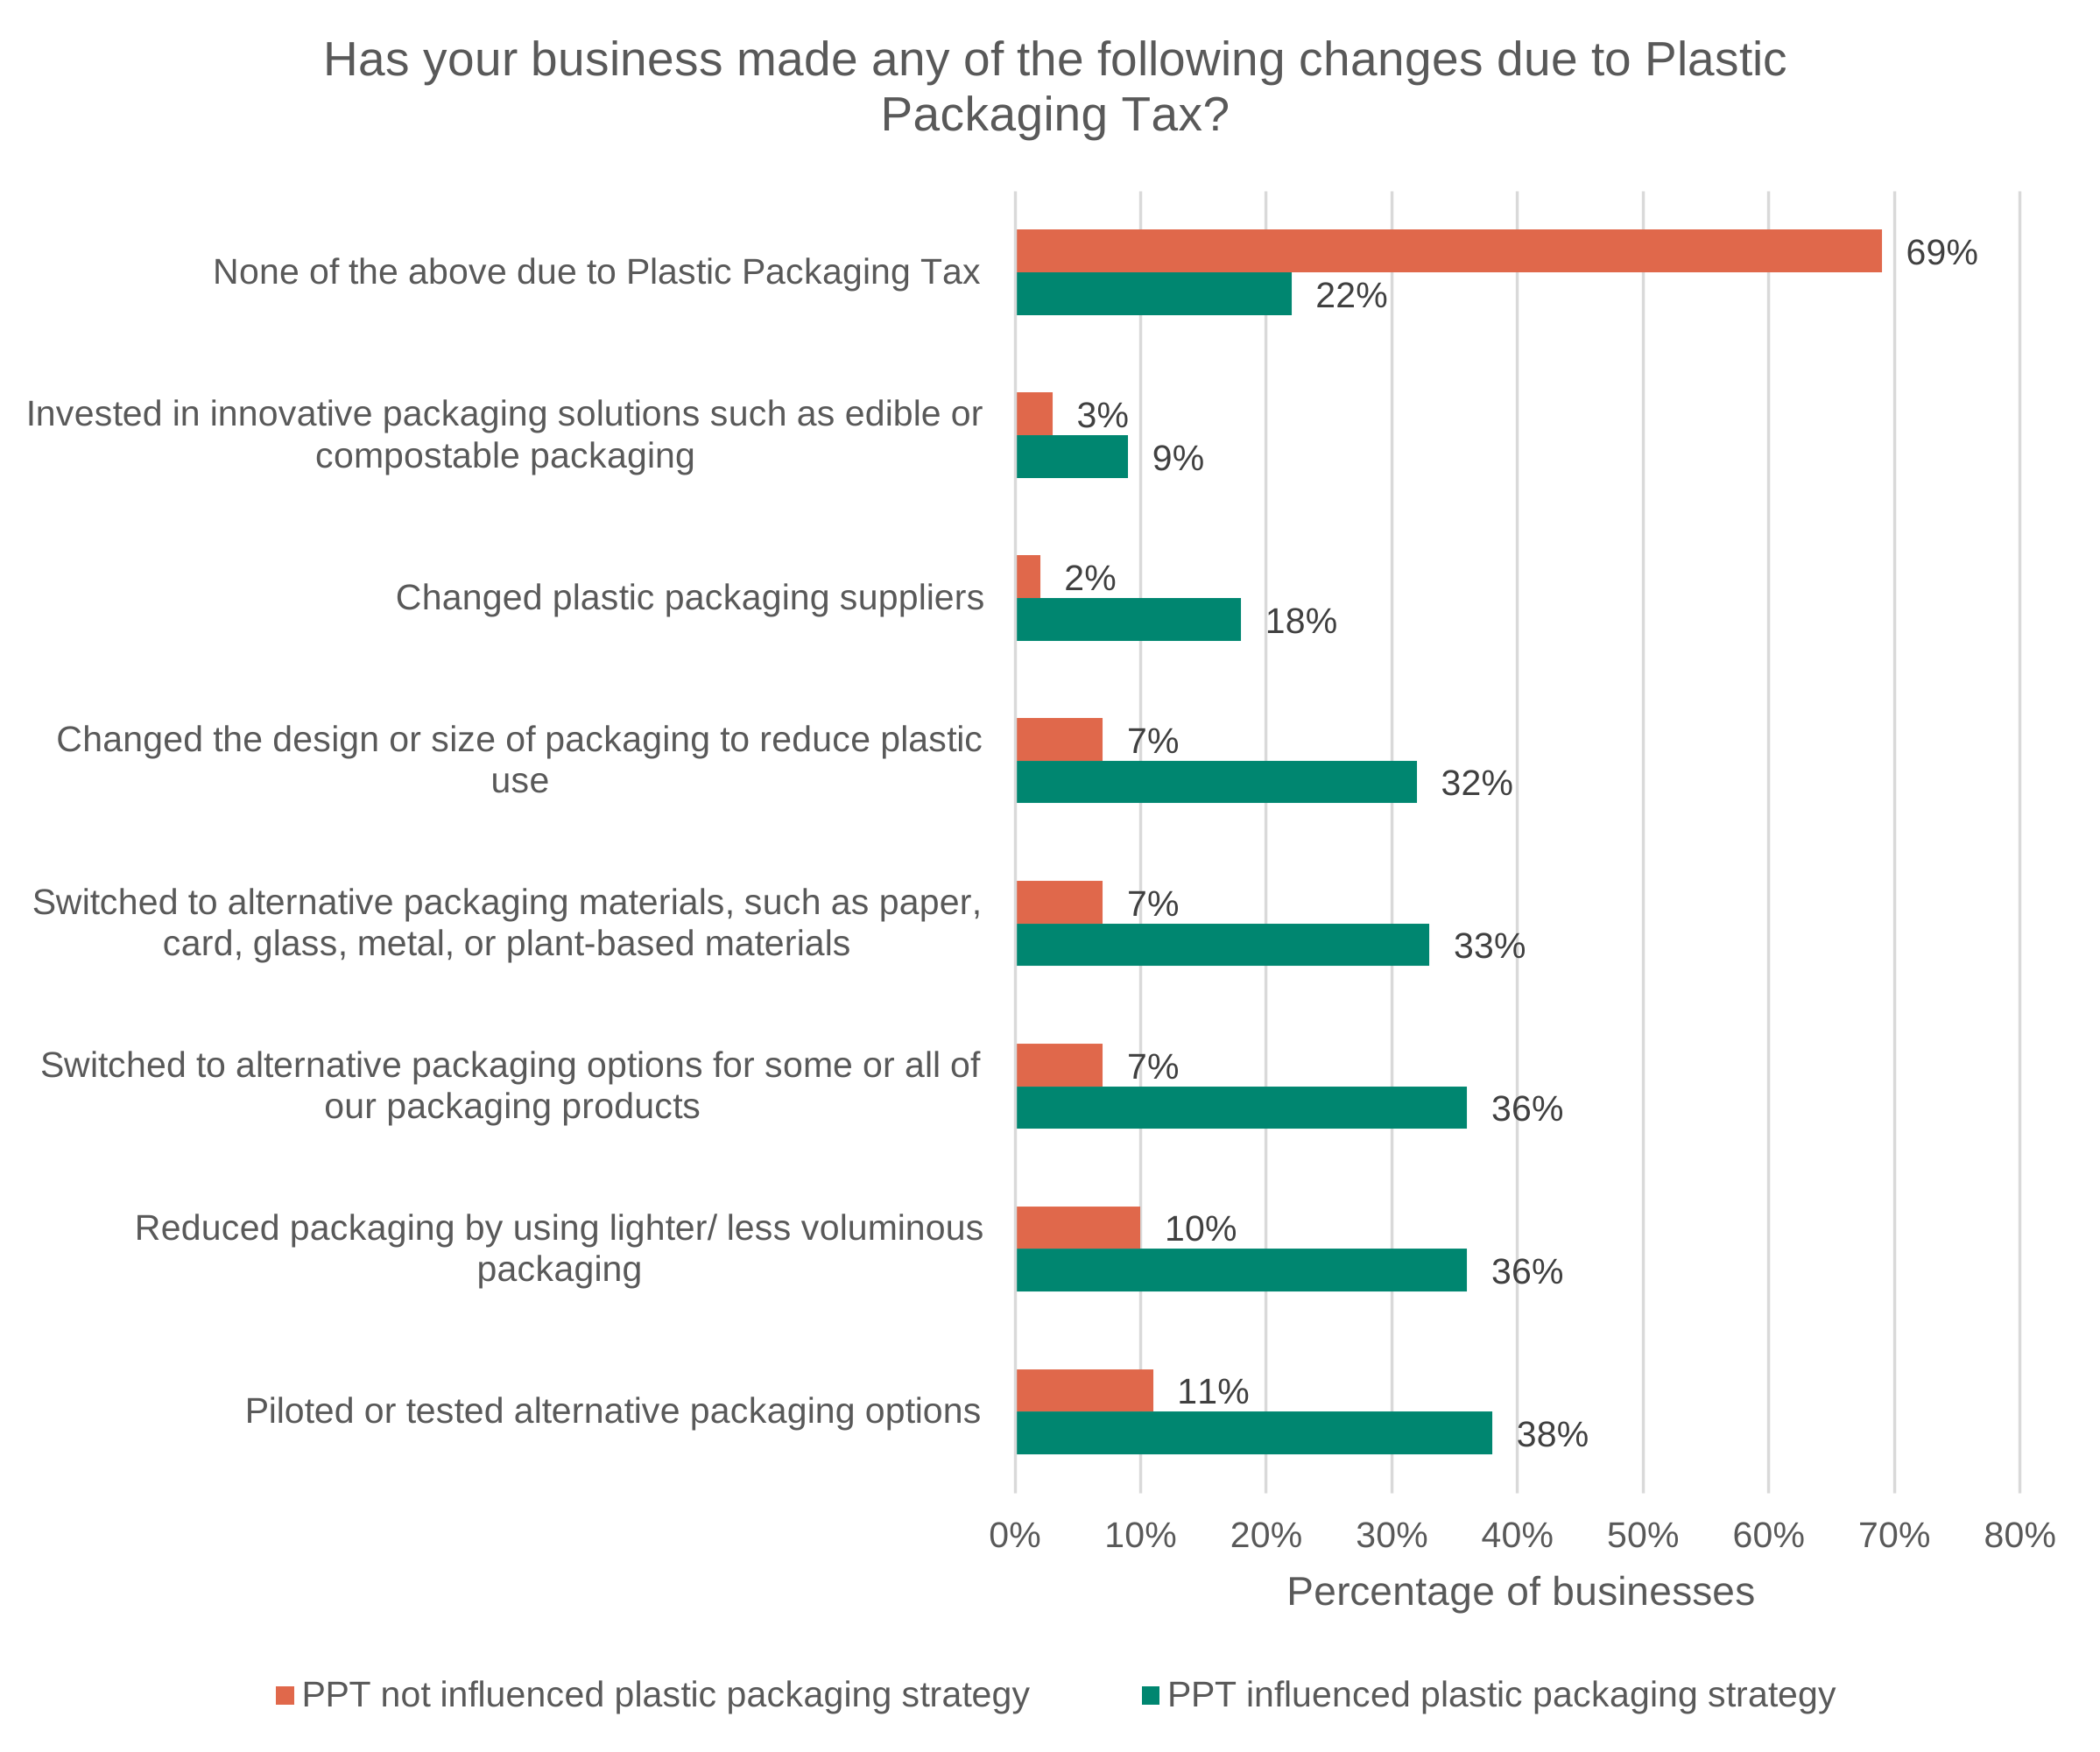
Data for Figure 6.15: Survey results for the question ‘Has your business made any of the following changes due to Plastic Packaging Tax?’.
Base: PPT has influenced plastic packaging strategy (615) and PPT has not influenced plastic packaging strategy (357). Source: Ipsos.
| Category | PPT influenced plastic packaging strategy | PPT not influenced plastic packaging strategy |
|---|---|---|
| None of the above due to Plastic Packaging Tax | 22% | 69% |
| Invested in innovative packaging solutions such as edible or compostable packaging | 9% | 3% |
| Changed plastic packaging suppliers | 18% | 2% |
| Changed the design or size of packaging to reduce plastic use | 32% | 7% |
| Switched to alternative packaging materials, such as paper, card, glass, metal, or plant-based materials | 33% | 7% |
| Switched to alternative packaging options for some or all of our packaging products | 36% | 7% |
| Reduced packaging by using lighter/ less voluminous packaging | 36% | 10% |
| Piloted or tested alternative packaging options | 38% | 11% |
Figure 6.15 suggests that businesses reporting PPT had influenced their plastic packaging strategy were statistically significantly more likely to report taking a range of packaging-related actions than businesses reporting no influence from the tax. For example, businesses reporting PPT influence were more likely to have piloted or tested alternative packaging options (38% compared with 11%); reduced packaging through lighter or less voluminous designs (36% compared with 10%); switched to alternative packaging options (36% compared with 7%); adopted alternative packaging materials (33% compared with 7%); or changed the design or size of packaging to reduce plastic use (32% compared with 7%). They were also statistically significantly more likely to report changing suppliers (18% compared with 2%) or investing in innovative packaging solutions (9% compared with 3%).
Conversely, businesses reporting no influence from PPT were far more likely to report that they had made none of the listed changes due to the tax (69% compared with 22% among businesses reporting any influence). These findings provide further evidence that reported influence from PPT is associated with a greater likelihood of businesses taking action to alter their packaging strategy. However, the results reflect self-reported behaviour and cannot establish the extent to which these changes were directly attributable to PPT, rather than wider commercial, environmental or regulatory pressures that may have influenced packaging decisions alongside the tax.
There was also meaningful variation based on the plastic type used for packaging. Businesses handling polystyrene (PS) were significantly more likely than average to report switching to alternative packaging materials (44% compared to 23% for all businesses). Second to this, businesses handling polyvinyl chloride (PVC) were also significantly more likely than average to report switching to alternative packaging materials (39% compared to 23% for all businesses), although the base size for this group was 91 so should be treated with caution.
For packaging type, businesses with labels and tape for packaging products were significantly more likely than average to report switching to alternative packaging materials (38% compared to 23% for all businesses), suggesting there is variability in the level of substitution possible between packaging types. Similarly, businesses handling PVC, PS or labels and tapes were significantly more likely than average to report changing packaging design to reduce plastic use (41%, 40% and 31% respectively, compared to 22% for all businesses). Qualitative research contextualises these findings, describing a similar array of material substitution and packaging reduction, with one instance specifically using paper-based tape rather than plastic, further supporting that constraints across the tax base are not consistent.
Figure 6.14 also shows the least common change to be investing in innovative packaging solutions, with only 6% of businesses reporting this. Whilst considerably lower than the rates reported for material substitution, packaging redesign and packaging reduction, investment activity is most relevant for manufacturers, who represent a smaller proportion of the PPT population. As a result, the quantitative social research included additional manufacturer-specific questions to explore whether PPT influenced packaging-related investment activity.
Figure 6.16: Survey results for the question ‘Which, if any, of the following has your business invested in due to Plastic Packaging Tax?’.
Base: All manufacturers (169), manufacturers reporting PPT influence on their plastic packaging strategy (107), and manufacturers reporting no influence from PPT on their plastic packaging strategy (57 — note). Source: Ipsos.
Note: this is a relatively small sample, so results should be taken with caution.
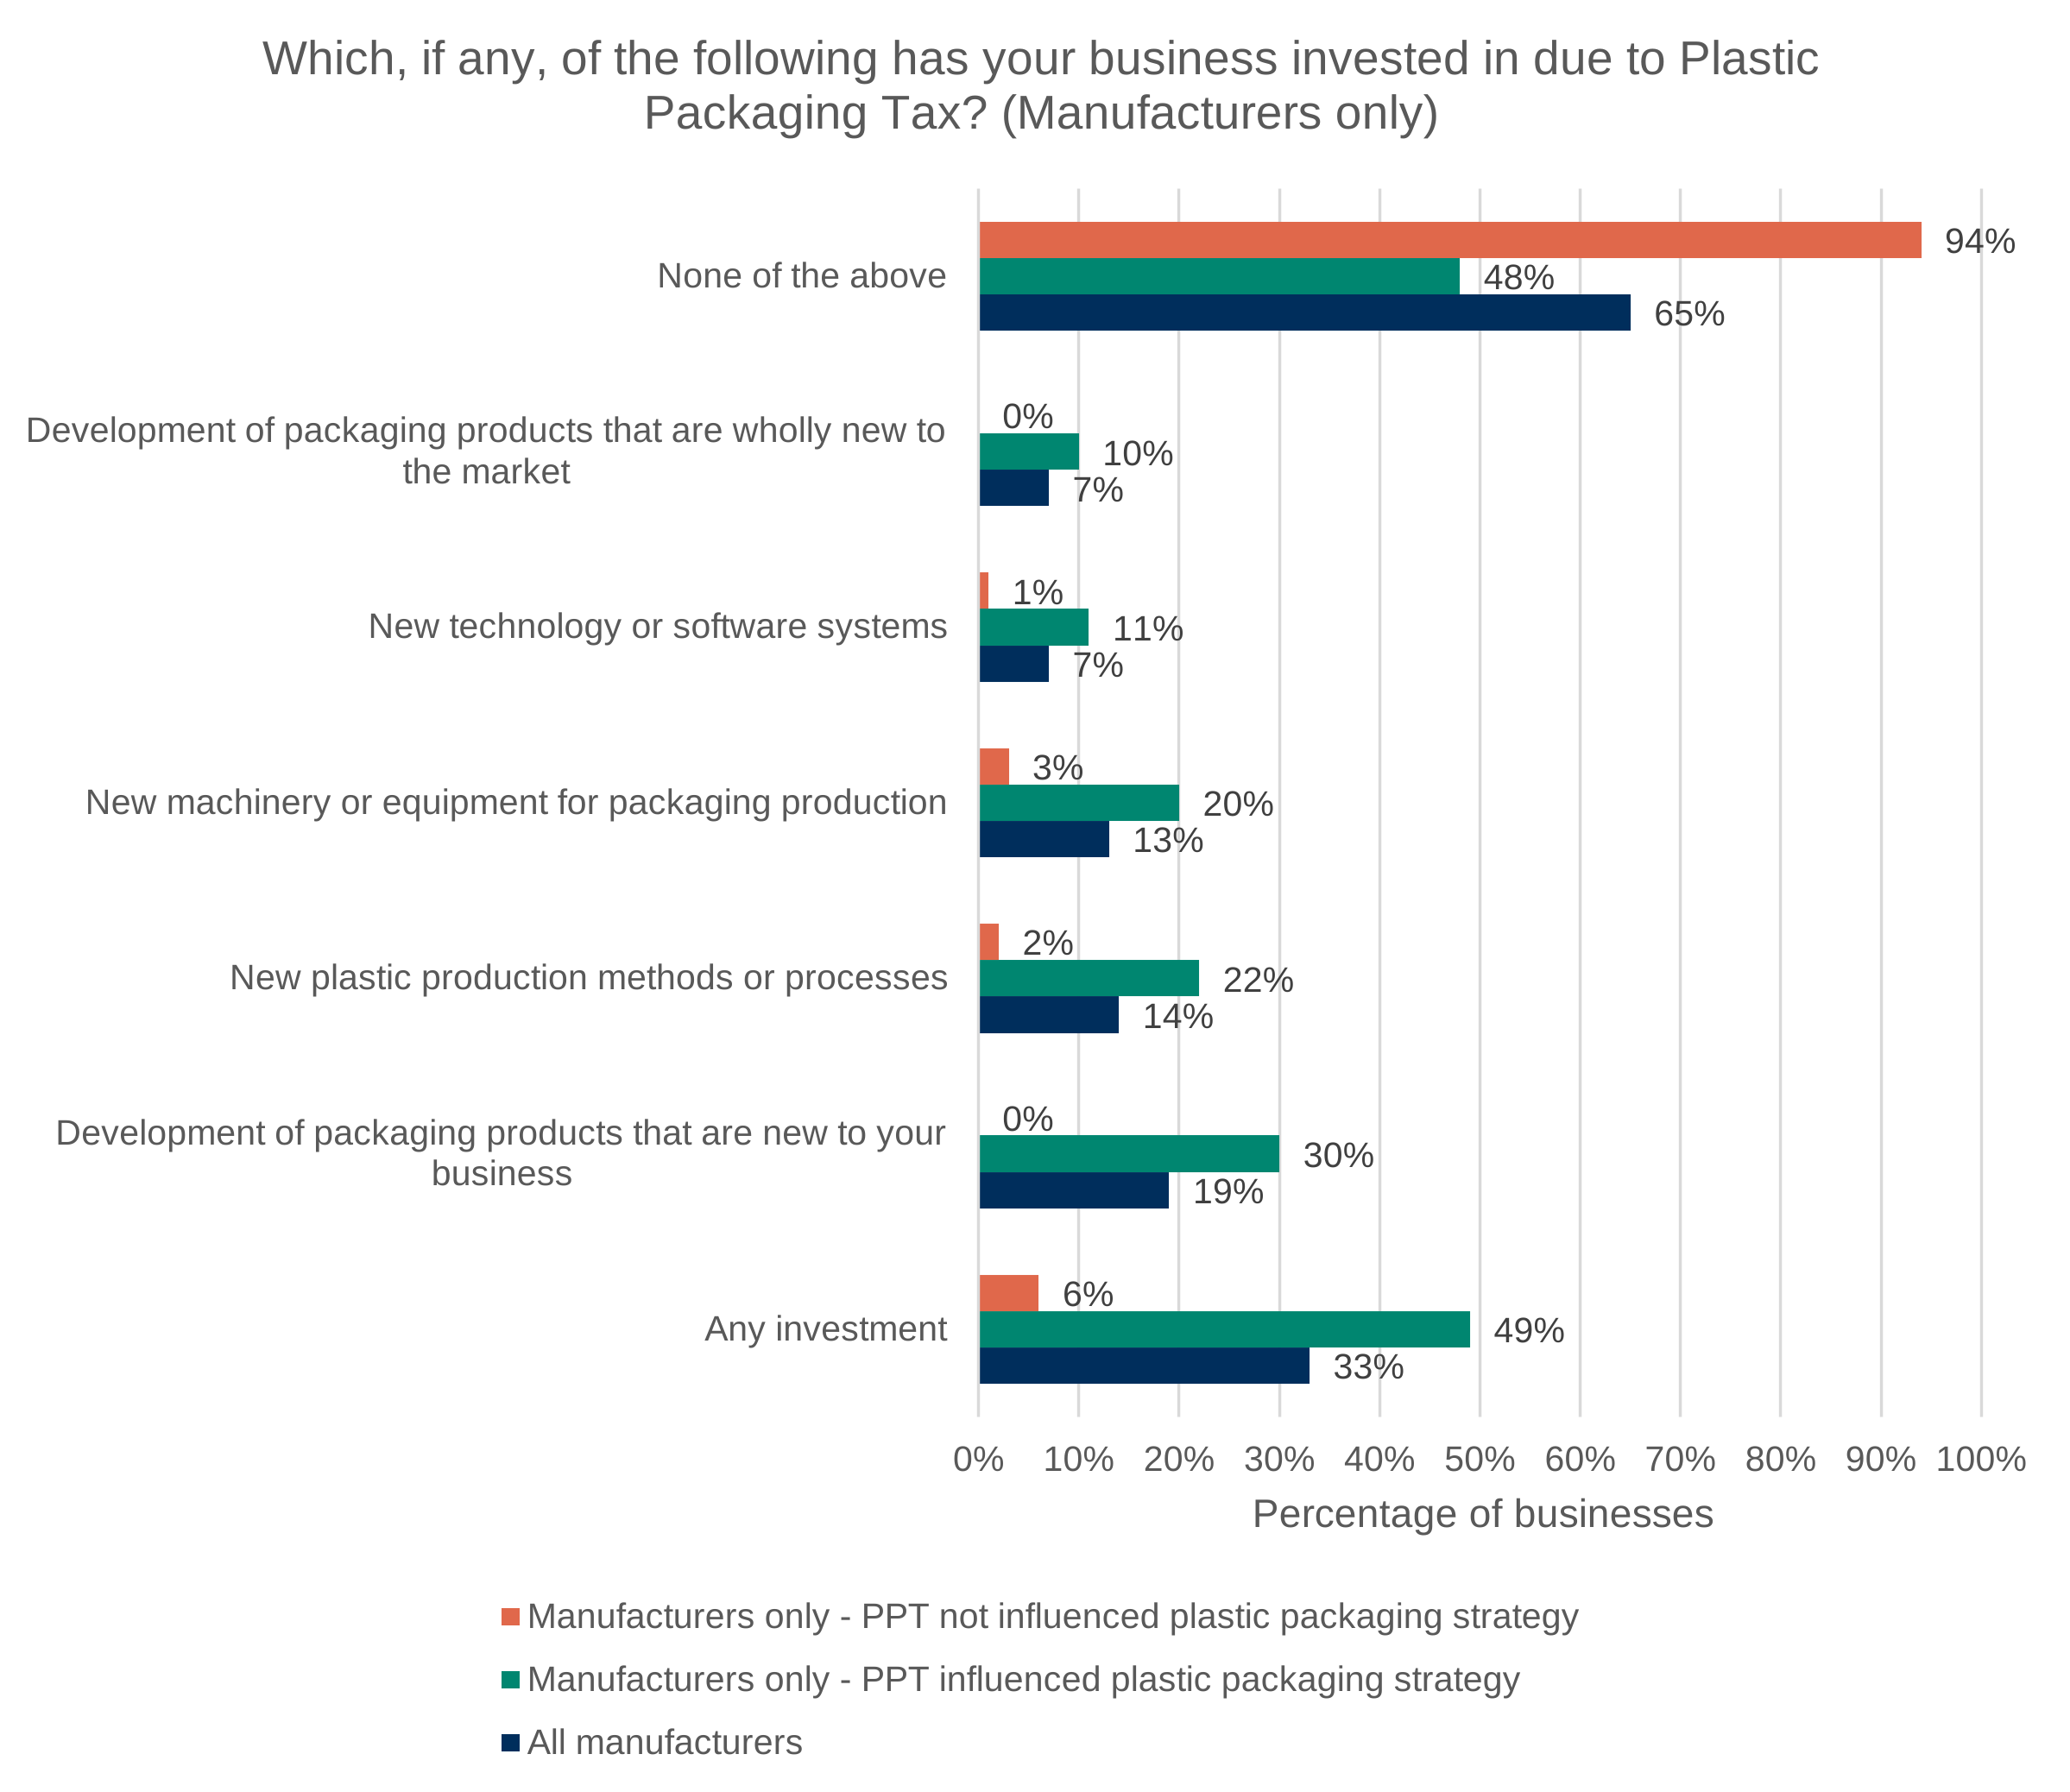
Data for Figure 6.16: Survey results for the question ‘Which, if any, of the following has your business invested in due to Plastic Packaging Tax?’.
Base: All manufacturers (169), manufacturers reporting PPT influence on their plastic packaging strategy (107), and manufacturers reporting no influence from PPT on their plastic packaging strategy (57 — note). Source: Ipsos.
Note: this is a relatively small sample, so results should be taken with caution.
| Category | All manufacturers | Manufacturers only - PPT influenced plastic packaging strategy | Manufacturers only - PPT not influenced plastic packaging strategy |
|---|---|---|---|
| None of the above | 65% | 48% | 94% |
| Development of packaging products that are wholly new to the market | 7% | 10% | 0% |
| New technology or software systems | 7% | 11% | 1% |
| New machinery or equipment for packaging production | 13% | 20% | 3% |
| New plastic production methods or processes | 14% | 22% | 2% |
| Development of packaging products that are new to your business | 19% | 30% | 0% |
| Any investment | 33% | 49% | 6% |
Figure 6.16 shows that almost half (49%) of manufacturers who reported that PPT had influenced their plastic packaging strategy also reported at least one form of investment as a result of the tax. Further to this, businesses reporting PPT influence were statistically significantly more likely to self-report undertaking each of the investments listed as a result of the tax. Despite this difference between these groups, around half of manufacturers who reported that PPT had influenced their plastic packaging strategy still reported no investment activity, suggesting these businesses may have responded in alternative ways.
Among manufacturers reporting PPT influence, the most common investment involved developing packaging products that were new to the business (30%), followed by new plastic production methods or processes (22%) and new machinery or equipment for packaging production (20%). Smaller proportions reported developing packaging products that were wholly new to the market (10%) or investing in new technology or software systems (11%).
Overall, the evidence suggests that PPT has influenced a range of packaging-related decisions beyond increasing recycled plastic content alone, providing evidence relevant to both EQ3 and EQ4. Around 60% of businesses reported that the tax had influenced their plastic packaging strategy, and these businesses were significantly more likely to report actions such as testing alternative packaging options, reducing packaging weight or volume, switching packaging formats, adopting non-plastic materials, changing packaging design, or changing suppliers. This indicates that the influence of PPT extends beyond compliance with the recycled content threshold and has, for some businesses, prompted wider consideration of packaging choices and sustainability objectives.
The findings also suggest that PPT has contributed to changes in packaging materials through substitution, reduction and redesign, directly addressing EQ4. However, these responses were not universal, with over a third of businesses reporting none of the listed changes due to the tax. There was also considerable variation across material and packaging types, indicating that opportunities for substitution or plastic reduction are greater in some parts of the tax base than others. Qualitative evidence further suggests that practical, commercial and technical constraints continue to shape the extent to which businesses can move away from plastic or reduce its use.
Among manufacturers, the evidence indicates that PPT has also been associated with investment in packaging innovation, product development and production processes. While investment activity was less common across the wider population, almost half of manufacturers reporting PPT influence identified at least one investment response. This suggests that, in some cases, the tax may be supporting longer-term changes in packaging production and design.
The findings suggest that PPT has influenced packaging choices for many businesses and has contributed to some degree of material substitution, packaging reduction and innovation. However, the scale and nature of these changes vary considerably across businesses, and the evidence indicates that PPT operates alongside wider market, regulatory and sustainability drivers rather than acting as the sole determinant of packaging decisions.
6.4.5 Other evidence on packaging material substitution
So far, the quantitative research has suggested that the influence of PPT beyond changing the recycled content of plastic packaging centred primarily on material substitution, redesigning packaging, and reducing packaging volumes. HMRC administrative data cannot identify whether PPT caused changes beyond moving above and below the 30% recycled content threshold. However, other data can be used to assess whether the reported influence of PPT is observable in other areas of the wider packaging system. This section therefore examines trends in packaging materials and formats using NPWD and WRAP data, with some comparisons to HMRC administrative data, although these are limited given these data sources measure packaging in different ways.
The NPWD is a regulatory dataset that records packaging placed on the UK market by obligated packaging producers, broken down by material, hence it can provide insight into the findings of the quantitative research. Table 6.1 shows the market share for each packaging material handled, allowing changes in plastic packaging to be compared to other materials.
Table 6.1: Market share for each packaging material handled between years 2020 to 2024. Percentages add to 100%.
Source: NPWD.
| Material | 2020 | 2021 | 2022 | 2023 | 2024 |
|---|---|---|---|---|---|
| Paper | 37.56% | 38.48% | 38.70% | 38.79% | 39.68% |
| Glass | 26.33% | 26.60% | 26.26% | 26.30% | 25.38% |
| Plastic | 20.33% | 19.63% | 19.31% | 19.13% | 18.40% |
| Wood | 9.03% | 8.40% | 8.89% | 8.87% | 9.68% |
| Steel | 4.49% | 4.46% | 4.35% | 4.38% | 4.14% |
| Aluminium | 2.00% | 2.18% | 2.24% | 2.26% | 2.45% |
| Other | 0.26% | 0.26% | 0.26% | 0.27% | 0.27% |
Table 6.1 demonstrates that paper, glass and plastic are respectively the most common materials used in packaging among businesses reporting to the NPWD. Plastic packaging experienced the largest decrease in market share of all materials, from 20.33% in 2020 to 18.40% in 2024, the only material with sustained decreases in each year. Compared with the other materials, the market share of paper increased from 37.56% to 39.68%. This pattern is consistent with the material substitution reported in the quantitative and qualitative social research, particularly given plastic market share decreased by around 2 percentage points while paper increased by a broadly similar amount. However, the data cannot determine whether reductions in plastic packaging were directly replaced by increases in paper or other materials, nor the extent to which these changes were attributable to PPT rather than wider market, regulatory or sustainability-related factors.
Figure 6.17: Primary packaging reported by plastic type placed on the market by UKPP members.
Source: WRAP.
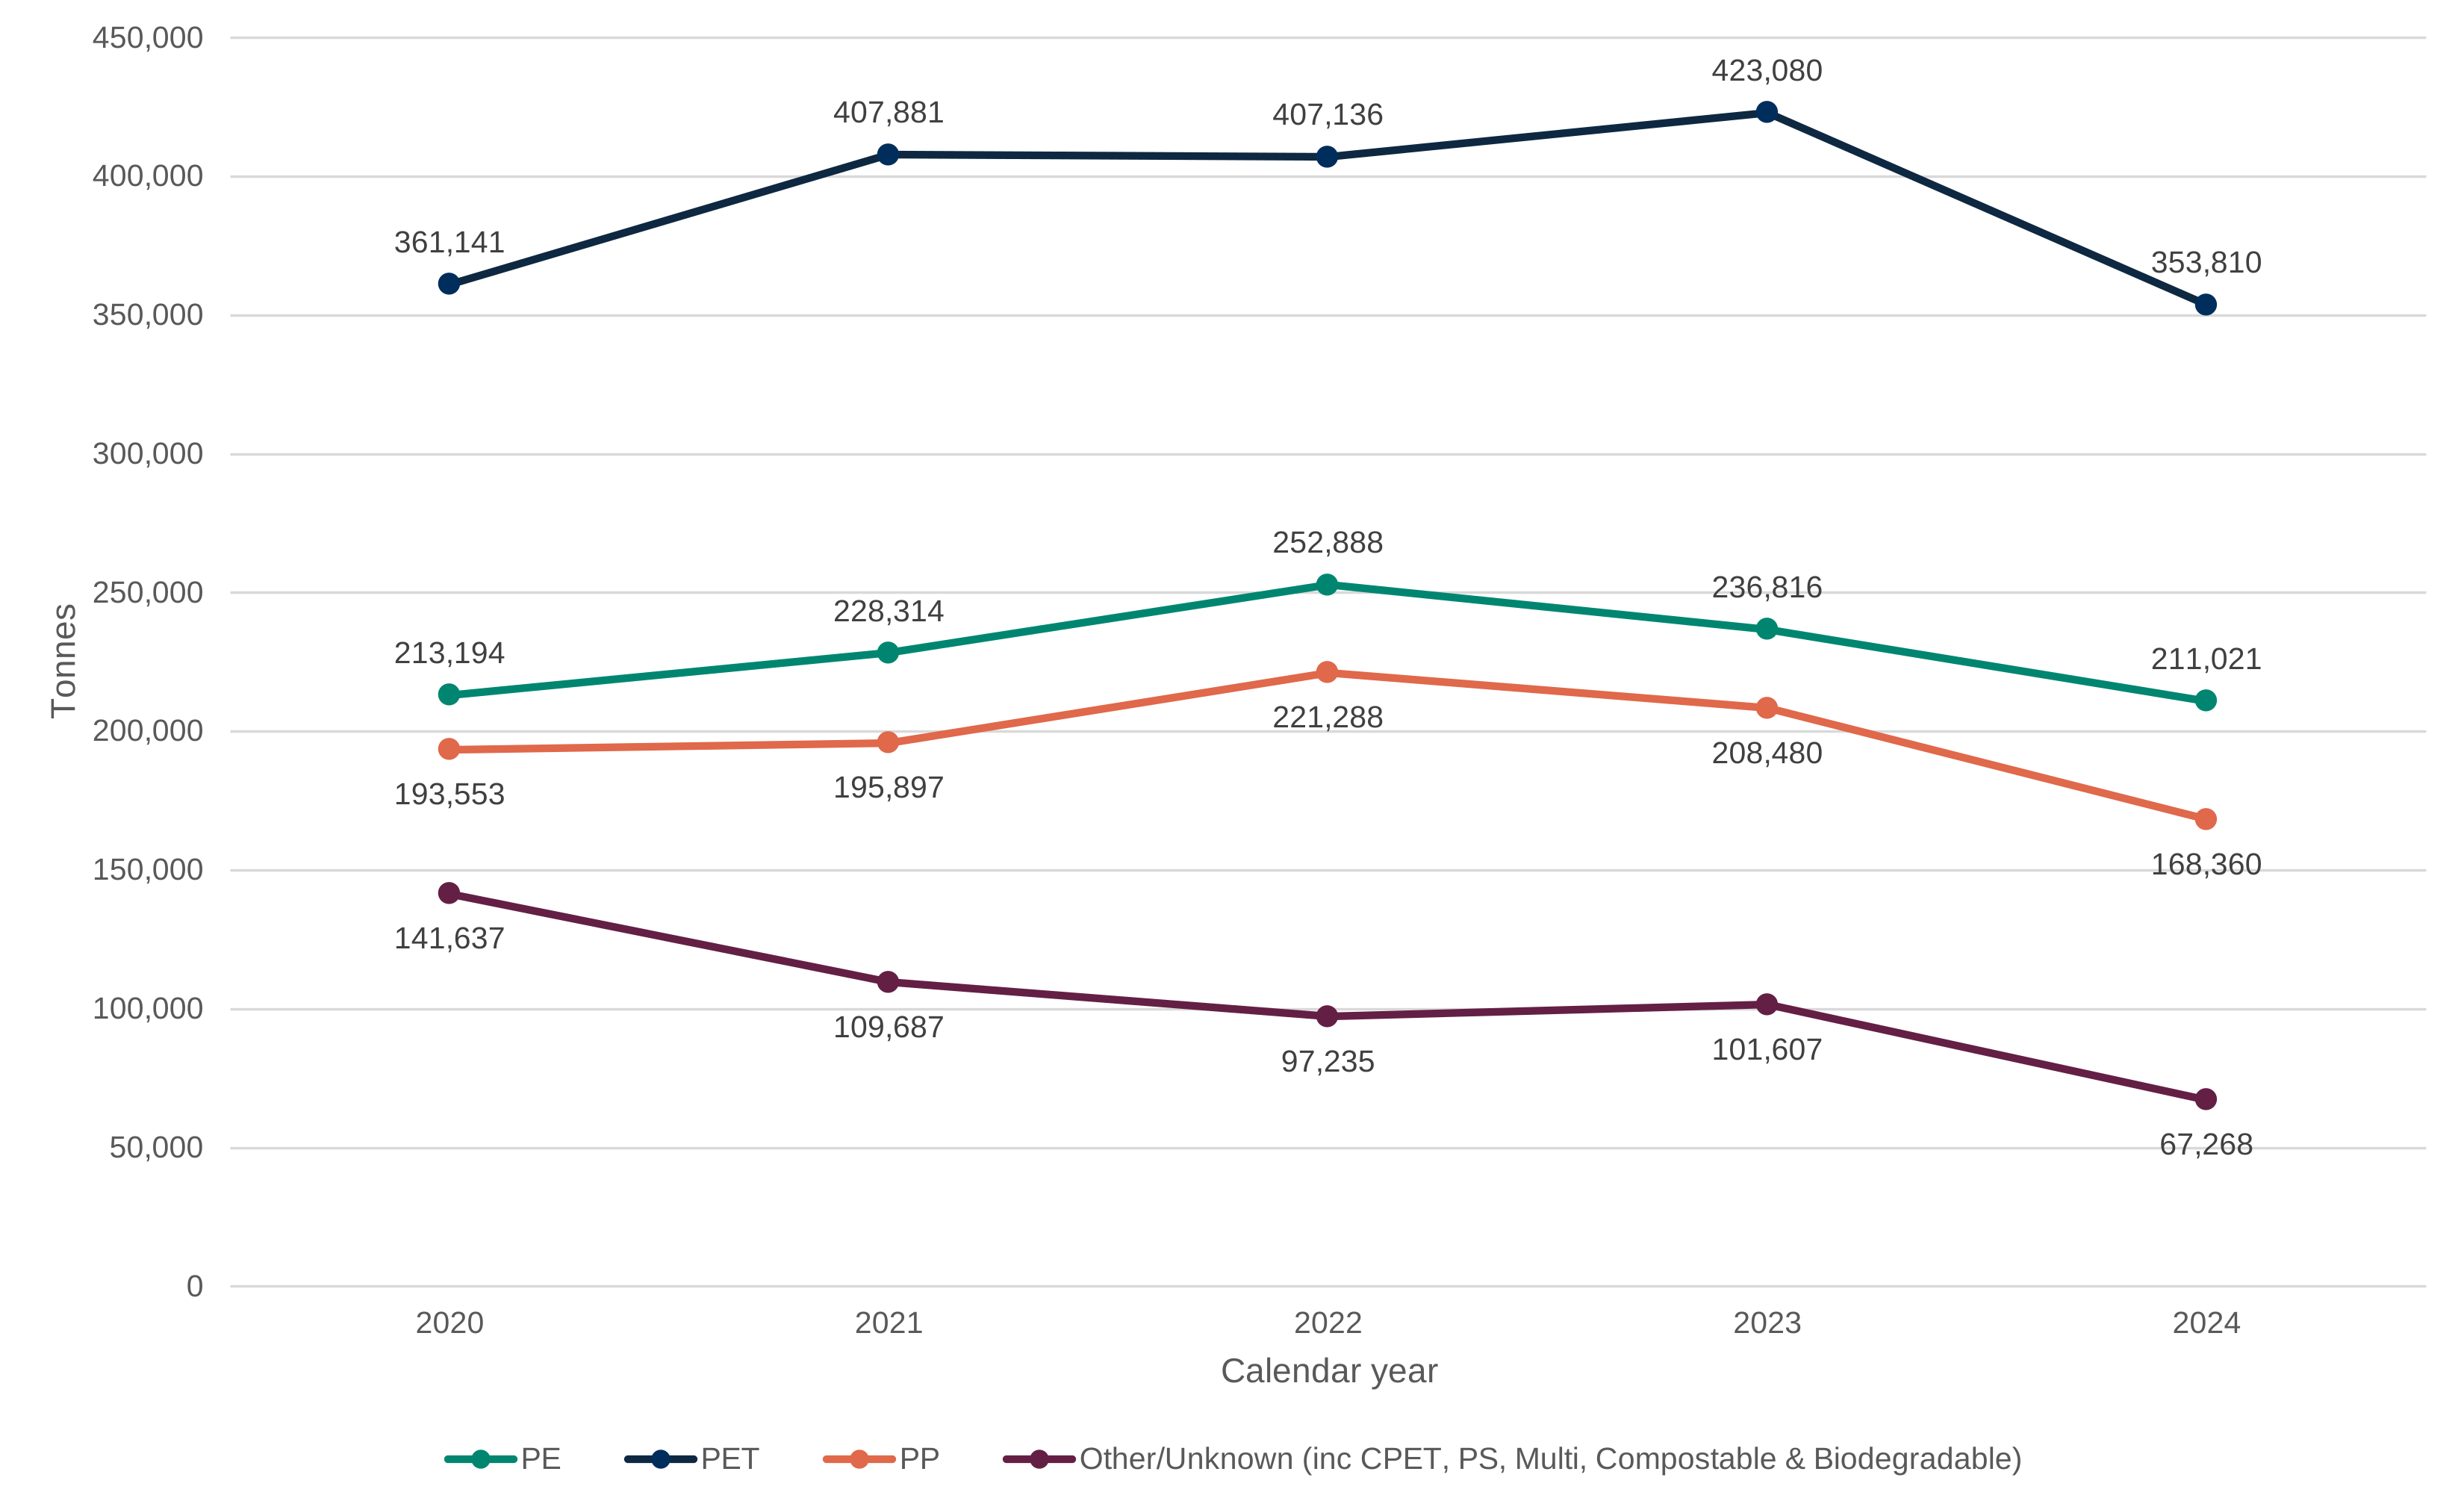
Data for Figure 6.17: Primary packaging reported by plastic type placed on the market by UKPP members.
Source: WRAP.
| Plastic type | 2020 | 2021 | 2022 | 2023 | 2024 |
|---|---|---|---|---|---|
| PE | 213,194 | 228,314 | 252,888 | 236,816 | 211,021 |
| PET | 361,141 | 407,881 | 407,136 | 423,080 | 353,810 |
| PP | 193,553 | 195,897 | 221,288 | 208,480 | 168,360 |
| Other/Unknown (inc CPET, PS, Multi, Compostable & Biodegradable) | 141,637 | 109,687 | 97,235 | 101,607 | 67,268 |
The data provided to HMRC by WRAP concerns only plastic packaging placed on the market by the members of the UKPP, hence its data is impacted by businesses entering and leaving UKPP membership. As shown in Figure 6.17, the tonnage of plastic packaging by plastic type is decreasing over time for UKPP members. This supports the observations that have been reported in the quantitative research and the decline in share of plastic packaging reported through the NPWD (though there is naturally overlap).
As outlined in Section 4.4.3, the HMRC administrative data on PPT similarly demonstrates an overall reduction in plastic packaging since the introduction of the tax, despite fluctuations between years, providing further evidence of the direction of travel for plastic packaging volume. However, neither dataset can determine the extent to which these trends can be attributed to PPT.
The available evidence is largely consistent on substitution. External data sources show a decline in the share and tonnage of plastic packaging over time, alongside increases in market share of some alternative materials, particularly paper.
However, the available data cannot establish a causal relationship between these trends and the introduction of PPT. Changes in packaging practices are likely to have been influenced by a range of factors, including wider sustainability commitments, evolving consumer preferences, and other regulatory developments affecting packaging. While the evidence points to a reduction in plastic packaging and supports the reported direction of behavioural change, the extent to which these changes can be attributed specifically to PPT cannot be determined from the available data.
This suggests that PPT may have contributed to wider changes in packaging strategies beyond increasing recycled content, but its role should be considered alongside other influences shaping the packaging market during the evaluation period.
6.5 Interpretation and conclusions
The evidence presented in this chapter suggests that PPT influenced businesses through a combination of commercial and packaging-related responses. Half of surveyed businesses reported passing on some or all PPT costs to customers, while 60% reported that the tax had influenced their plastic packaging strategy to some degree. However, only 9% reported a significant influence on their strategy. This indicates that PPT was a relevant cost or strategic consideration for many businesses but generally contributed to packaging decisions rather than acting as their sole or primary driver.
Pass-through was an important response to the cost of the tax, although it varied across the business population. Manufacturers, smaller and lower-turnover businesses, UK-headquartered businesses, and businesses reporting wider influence from PPT were more likely to pass on some or all costs. These differences are likely to reflect overlapping characteristics, including businesses’ positions in packaging supply chains, their capacity to absorb or offset additional costs, and their ability to reflect those costs in customer prices. The available evidence does not isolate the effect of each characteristic, but it demonstrates that the commercial incidence of PPT has not been uniform across businesses. This reinforces the findings in Chapter 5 that the influence of PPT may depend on a wide range of characteristics in the tax base.
Pass-through, however, does not appear to have been an alternative to making changes to packaging. Businesses reporting that PPT influenced their packaging strategy, or that they had increased recycled content, were also more likely to report passing on costs. This suggests that businesses often used a combination of responses to manage the costs and incentives created by PPT, with pricing changes taking place alongside adjustments to packaging composition, design, material use or supply arrangements.
The influence of PPT should also be understood within the broader context in which packaging decisions are made. Customer requirements, businesses’ own sustainability objectives, and other government policies and environmental regulations were among the most commonly reported influences on packaging strategy. Businesses reporting influence from PPT were also more likely to report influence from these other factors, suggesting that responsiveness to the tax formed part of a wider engagement with packaging costs, regulation and sustainability rather than occurring in isolation. Qualitative evidence similarly identified pEPR, quality requirements and sector-specific regulation as important considerations.
Conditions in the plastic market also appear to have shaped businesses’ ability to respond. Businesses reporting that PPT influenced their packaging strategy were more likely to identify the cost and availability of recycled plastic as important and to report awareness of changes in plastic market conditions. However, substantial proportions of businesses did not know whether the price or availability of virgin or recycled plastic had changed. This indicates that these market signals were not highly visible across much of the tax base. In addition, qualitative evidence suggests that the comparative cost of recycled plastic, quality requirements, technical limitations and product regulation constrained some businesses’ ability to change materials even where they were aware of the tax incentive.
In relation to EQ3, the evidence indicates that PPT influenced a range of packaging choices beyond changing recycled content or total plastic packaging tonnage. Businesses reported testing and adopting alternative packaging options, reducing packaging weight or volume, substituting non-plastic materials, redesigning packaging and changing suppliers. Manufacturers also reported investment in new packaging products, production methods, machinery and technology. These responses were not universal, and no single response dominated, but the findings suggest that PPT prompted some businesses to consider a broader range of changes to their packaging and production processes.
The available response options varied across the tax base. Businesses handling PS or PVC were more likely than average to report material substitution and packaging redesign, while businesses handling labels and tape were also more likely to report these changes. Although the PVC findings should be treated with caution because of the smaller sample, the overall pattern suggests that opportunities to redesign packaging, reduce plastic or switch materials depend partly on the plastic and packaging formats used. The influence of PPT was therefore constrained or enabled by the technical, commercial and regulatory circumstances facing individual businesses, again supporting earlier findings.
In relation to EQ4, the social research provides evidence that PPT contributed to material substitution, reductions in plastic use and reductions in packaging more generally. External evidence is consistent with the direction of these reported changes. NPWD data show that plastic’s share of packaging declined between 2020 and 2024 while the share of paper increased, and WRAP and HMRC data also indicate reductions in plastic packaging volumes over time. These sources provide a consistent picture of reduced plastic packaging and some movement towards alternative materials during the evaluation period.
However, the external data cannot identify whether reductions in plastic packaging were directly replaced by increases in particular alternative materials, nor can they establish the extent to which the observed trends were caused by PPT. Changes occurred alongside wider developments in packaging markets, business sustainability commitments, consumer requirements and the regulatory landscape. The evidence therefore supports an association between the introduction of PPT and wider changes in packaging behaviour, but it cannot isolate the tax’s independent causal contribution.
Overall, the evaluation concludes that PPT influenced packaging choices for many businesses, although its influence was generally moderate and operated alongside other commercial, environmental and regulatory drivers. The evidence suggests that businesses responded through a combination of pass-through and operational changes, rather than relying on a single response. It is also consistent with PPT having contributed to material substitution, packaging redesign and reductions in plastic and overall packaging. However, the extent and form of these responses depended on the options and constraints facing different businesses, and the available evidence cannot quantify how much of the observed change in packaging materials was attributable specifically to PPT.
Chapter 7: Environmental impact
7.1 Introduction
This chapter addresses the evaluation questions:
EQ5:
Has PPT stimulated demand for recycled plastic and increased recycling rates?
EQ6:
Has PPT reduced plastic waste?
EQ7:
Has PPT had a positive impact on the environment?
It examines whether the PPT has contributed to changes in plastic waste generation, recycling, and broader environmental outcomes. It analyses the amount of plastic waste arising, the proportion of that waste that is recycled, and the composition of plastic entering the recycling system. The chapter considers whether the increases in recycled content reported by businesses are reflected in changes within the wider waste and recycling system, including both national recycling rates and household waste collections. The chapter also estimates the emissions impact of PPT.
The findings in this chapter are based on analysis of published statistics on waste data, data provided by WRAP, and commissioned social research. The chapter also uses an emissions model produced by HMRC to estimate greenhouse gas emissions associated with the tax base.
7.2 Key findings
Key Finding 7.1:
Plastic packaging waste arising decreased in the year the PPT was introduced and has remained at a broadly lower level since.
Key Finding 7.2:
The proportion of plastic waste recycled or recovered increased in the year the tax was introduced and then remained broadly stable at this new level. This appears to be driven by a reduction in plastic packaging waste arising, rather than an increase in the amount of plastic packaging waste recycled.
Key Finding 7.3:
Plastic packaging waste was the only packaging material to show a notable reduction in the year PPT was introduced, similarly making up a smaller share of overall packaging waste.
Key Finding 7.4:
HMRC’s modelling indicates that greenhouse gas emissions associated with the tax base were lower than would have been expected in the absence of the tax, with estimated emissions reductions increasing from around 0.09 MtCO₂e in financial year 2022 to 2023 to around 0.41 MtCO₂e in financial year 2025 to 2026 under the central scenario.
7.3 Analytical approach
This chapter examines trends in plastic packaging waste, recycling, and environmental outcomes using national waste statistics, local authority data, WRAP data, and an HMRC emissions model. The analysis explores changes in plastic waste arising, recycling volumes and rates, packaging composition, and greenhouse gas emissions before and after the introduction of PPT, providing context on how outcomes have evolved over time.
National and local authority data are used to assess trends in waste generation and recycling, while WRAP data provides supplementary evidence on packaging composition and recycled content. An internal HMRC emissions model combines PPT returns data, recycled content estimates, greenhouse gas conversion factors, and assumptions from the OBR-certified PPT revenue forecasting model to estimate emissions under the observed position, in which PPT is active, and a counterfactual scenario, in which PPT was not introduced.
Where possible, trends are examined in the years before and after the introduction of PPT to assess whether any observable changes coincide with the introduction of the tax. The analysis also considers whether these trends are consistent with findings from earlier chapters on recycled content, plastic packaging volumes, and businesses’ packaging design and material choices.
Findings should be interpreted with caution. Differences in data coverage and methodology limit comparability across sources, local authority recycling data is only available for England, and it is not possible to isolate the impact of PPT from other factors affecting plastic use, waste generation, recycling, and emissions over the period considered.
7.4 Supporting evidence
7.4.1 Plastic packaging recycling rates
Chapter 4 showed that the proportion of recycled content in plastic packaging has increased since the introduction of the tax, with PPT reported to have made a modest contribution to this change. One of the intended mechanisms through which PPT is expected to achieve its objectives is by encouraging businesses to use more recycled plastic in their packaging, which in turn was intended to increase demand for recycled plastic more widely and consequently the supply of recycled plastic. If this mechanism works as intended, PPT may contribute to a more circular plastics economy by reducing reliance on virgin plastic and reducing the environmental impacts associated with its production and disposal.
For the tax to remain effective over time, the supply of recycled plastic available for packaging will need to respond to this increased demand. Assessing trends in the recycling and recovery of plastic packaging waste is therefore important for understanding whether this part of the policy mechanism is being observed in practice. This includes exploring whether the tax has influenced recycling and recovery rates, increased the use of recycled content in packaging, or increased wider demand for recycled plastic materials.
To assess this, the analysis uses Defra’s packaging waste data from the UK Statistics on Waste publication, covering the period 2015 to 2024. This data provides UK-level estimates of plastic packaging waste arising and recycled. By examining trends before and after the introduction of PPT in 2022, the analysis assesses whether observed changes in recycling activity are consistent with the increased use of recycled content and demand for recycled plastic identified in earlier chapters.
Figure 7.1 shows trends in plastic packaging waste arising and recycled in the UK between 2015 and 2024. Following the introduction of PPT in 2022, a downward level shift in the amount of plastic packaging waste arising occurred. Plastic packaging waste arising increased between 2017 and 2021, from 2,260 thousand tonnes to 2,514 thousand tonnes, before decreasing by approximately 269 thousand tonnes in 2022, the year the PPT was introduced. From 2022 onwards, the average level of plastic packaging waste arising remained broadly flat after the tax at around 2,256 thousand tonnes, compared with an average of 2,374 thousand tonnes between 2015 and 2021.
Figure 7.1: Trends in plastic packaging waste arising and plastic packaging waste recycled in the UK, 2015 to 2024.
Source: Defra.
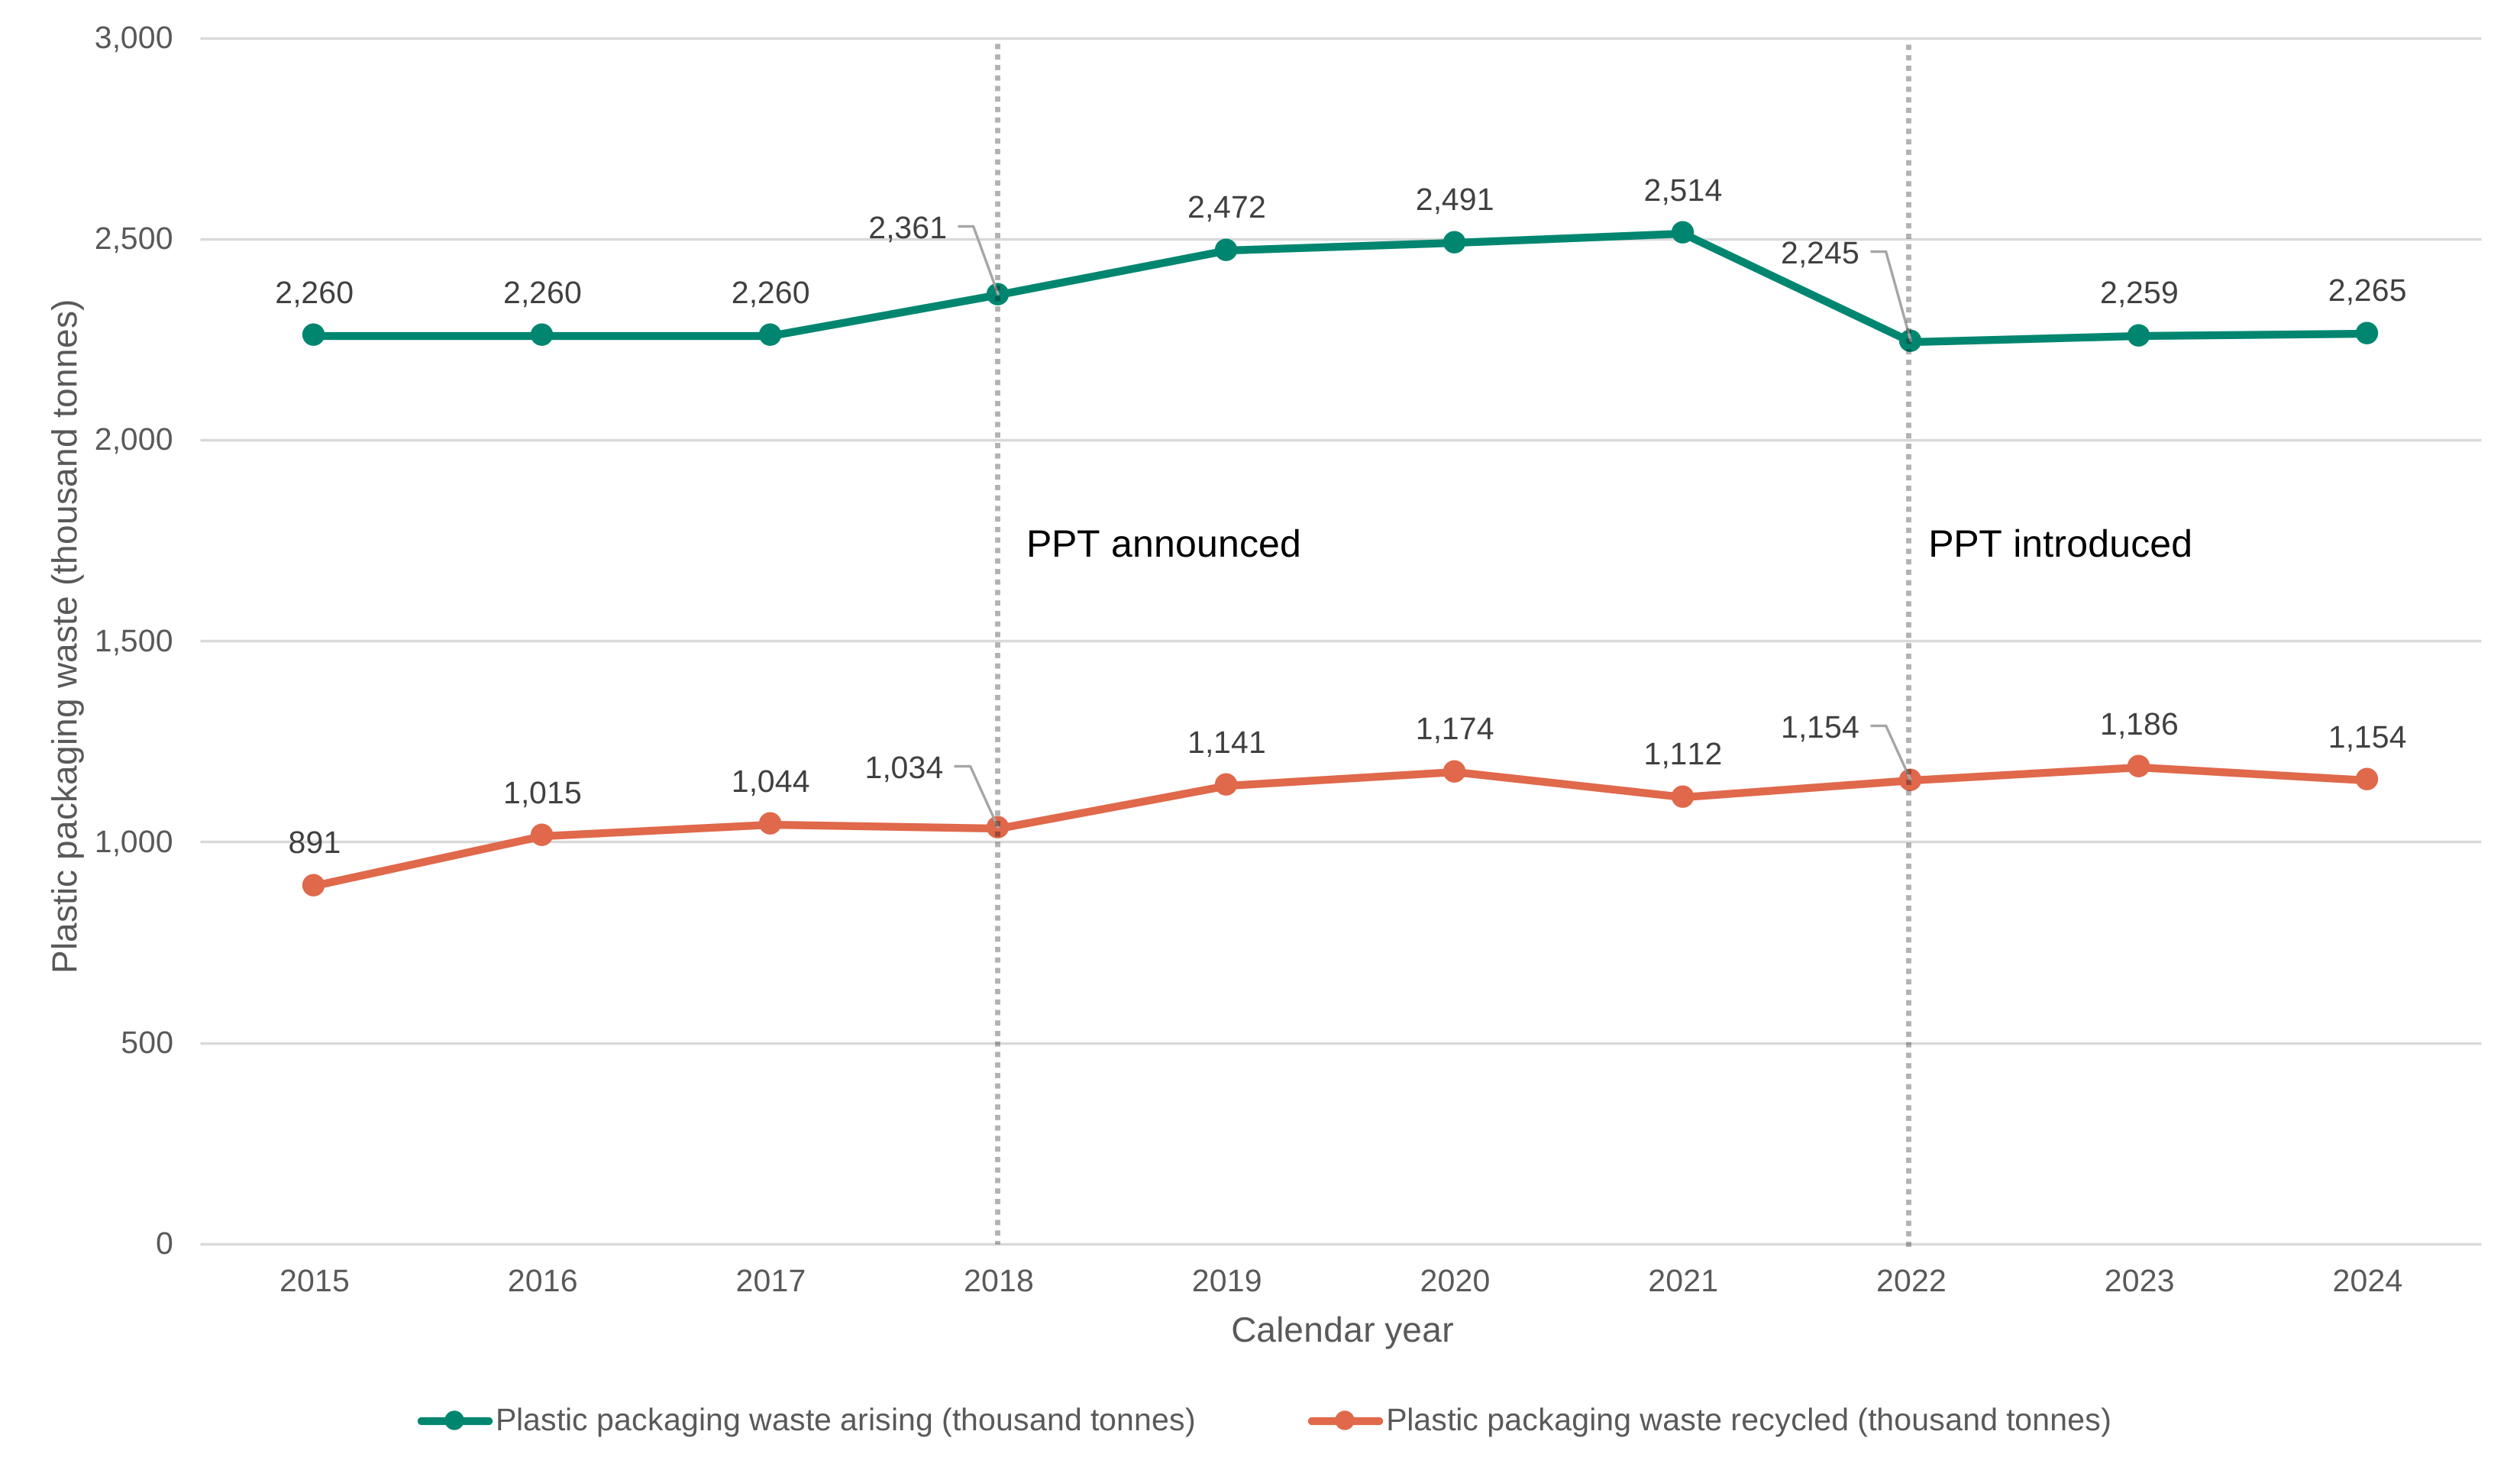
Data for Figure 7.1: Trends in plastic packaging waste arising and plastic packaging waste recycled in the UK, 2015 to 2024.
Source: Defra.
| Year | Plastic packaging waste arising (thousand tonnes) | Plastic packaging waste recycled (thousand tonnes) |
|---|---|---|
| 2015 | 2,260 | 891 |
| 2016 | 2,260 | 1,015 |
| 2017 | 2,260 | 1,044 |
| 2018 | 2,361 | 1,034 |
| 2019 | 2,472 | 1,141 |
| 2020 | 2,491 | 1,174 |
| 2021 | 2,514 | 1,112 |
| 2022 | 2,245 | 1,154 |
| 2023 | 2,259 | 1,186 |
| 2024 | 2,265 | 1,154 |
In contrast, the volume of plastic packaging waste recycled remained broadly higher after 2022 than in the preceding period. Over the period shown, the volume of plastic packaging waste recycled increased from around 891 thousand tonnes in 2015 to 1,154 thousand tonnes in 2024. While most of this increase occurred before the introduction of PPT, average levels of plastic packaging waste recycled between 2022 and 2024 remained higher at 1,165 thousand tonnes, compared with 1,059 thousand tonnes before 2022. This means average levels of plastic packaging waste arising between 2022 and 2024 were around 5% lower than before 2022, while average levels of plastic packaging waste recycled were around 10% higher. This pattern is consistent with the increased proportion of recycled content falling above the threshold reported in Chapter 4 and the alternative ways businesses have changed their packaging in response to the tax, reported in Chapter 6. However, the changes outlined here cannot be attributed directly to the tax from this data alone.
Figure 7.2: Proportion of plastic packaging waste recycled in the UK, 2015 to 2024.
Source: Defra.
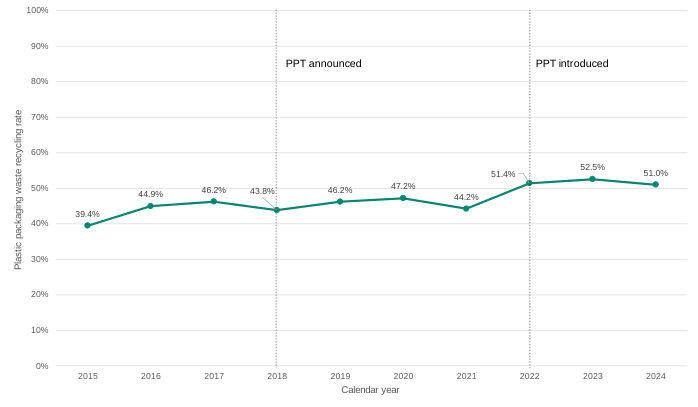
Data for Figure 7.2: Proportion of plastic packaging waste recycled in the UK, 2015 to 2024.
Source: Defra.
| Year | Plastic packaging waste recycling rate |
|---|---|
| 2015 | 39.4% |
| 2016 | 44.9% |
| 2017 | 46.2% |
| 2018 | 43.8% |
| 2019 | 46.2% |
| 2020 | 47.2% |
| 2021 | 44.2% |
| 2022 | 51.4% |
| 2023 | 52.5% |
| 2024 | 51.0% |
Figure 7.2 shows trends in the proportion of plastic packaging waste that is recycled in the UK between 2015 and 2024. The proportion of recycled plastic packaging waste shows a general upward trend over this time period, though there is a noticeable step change in the year the PPT was introduced. Following the introduction of PPT in 2022, the proportion of plastic packaging waste that was recycled remained broadly stable, averaging 51.6% between 2022 and 2024. Compared to before 2022, the chart shows a higher proportion of plastic packaging waste being recycled after the tax was introduced. However, as shown in Figure 7.1, this increase appears to reflect both the reduction in plastic packaging waste arising and the relatively stable volume of plastic packaging waste recycled after 2022. This similarly does not imply a causal link between the 2 phenomena.
Figure 7.3: Businesses’ responses to the question, ‘Compared with before Plastic Packaging Tax was introduced in 2022, have you noticed the availability of virgin and recycled plastic increased, stayed about the same or decreased?’.
Base: All businesses (1,011). Source: Ipsos.
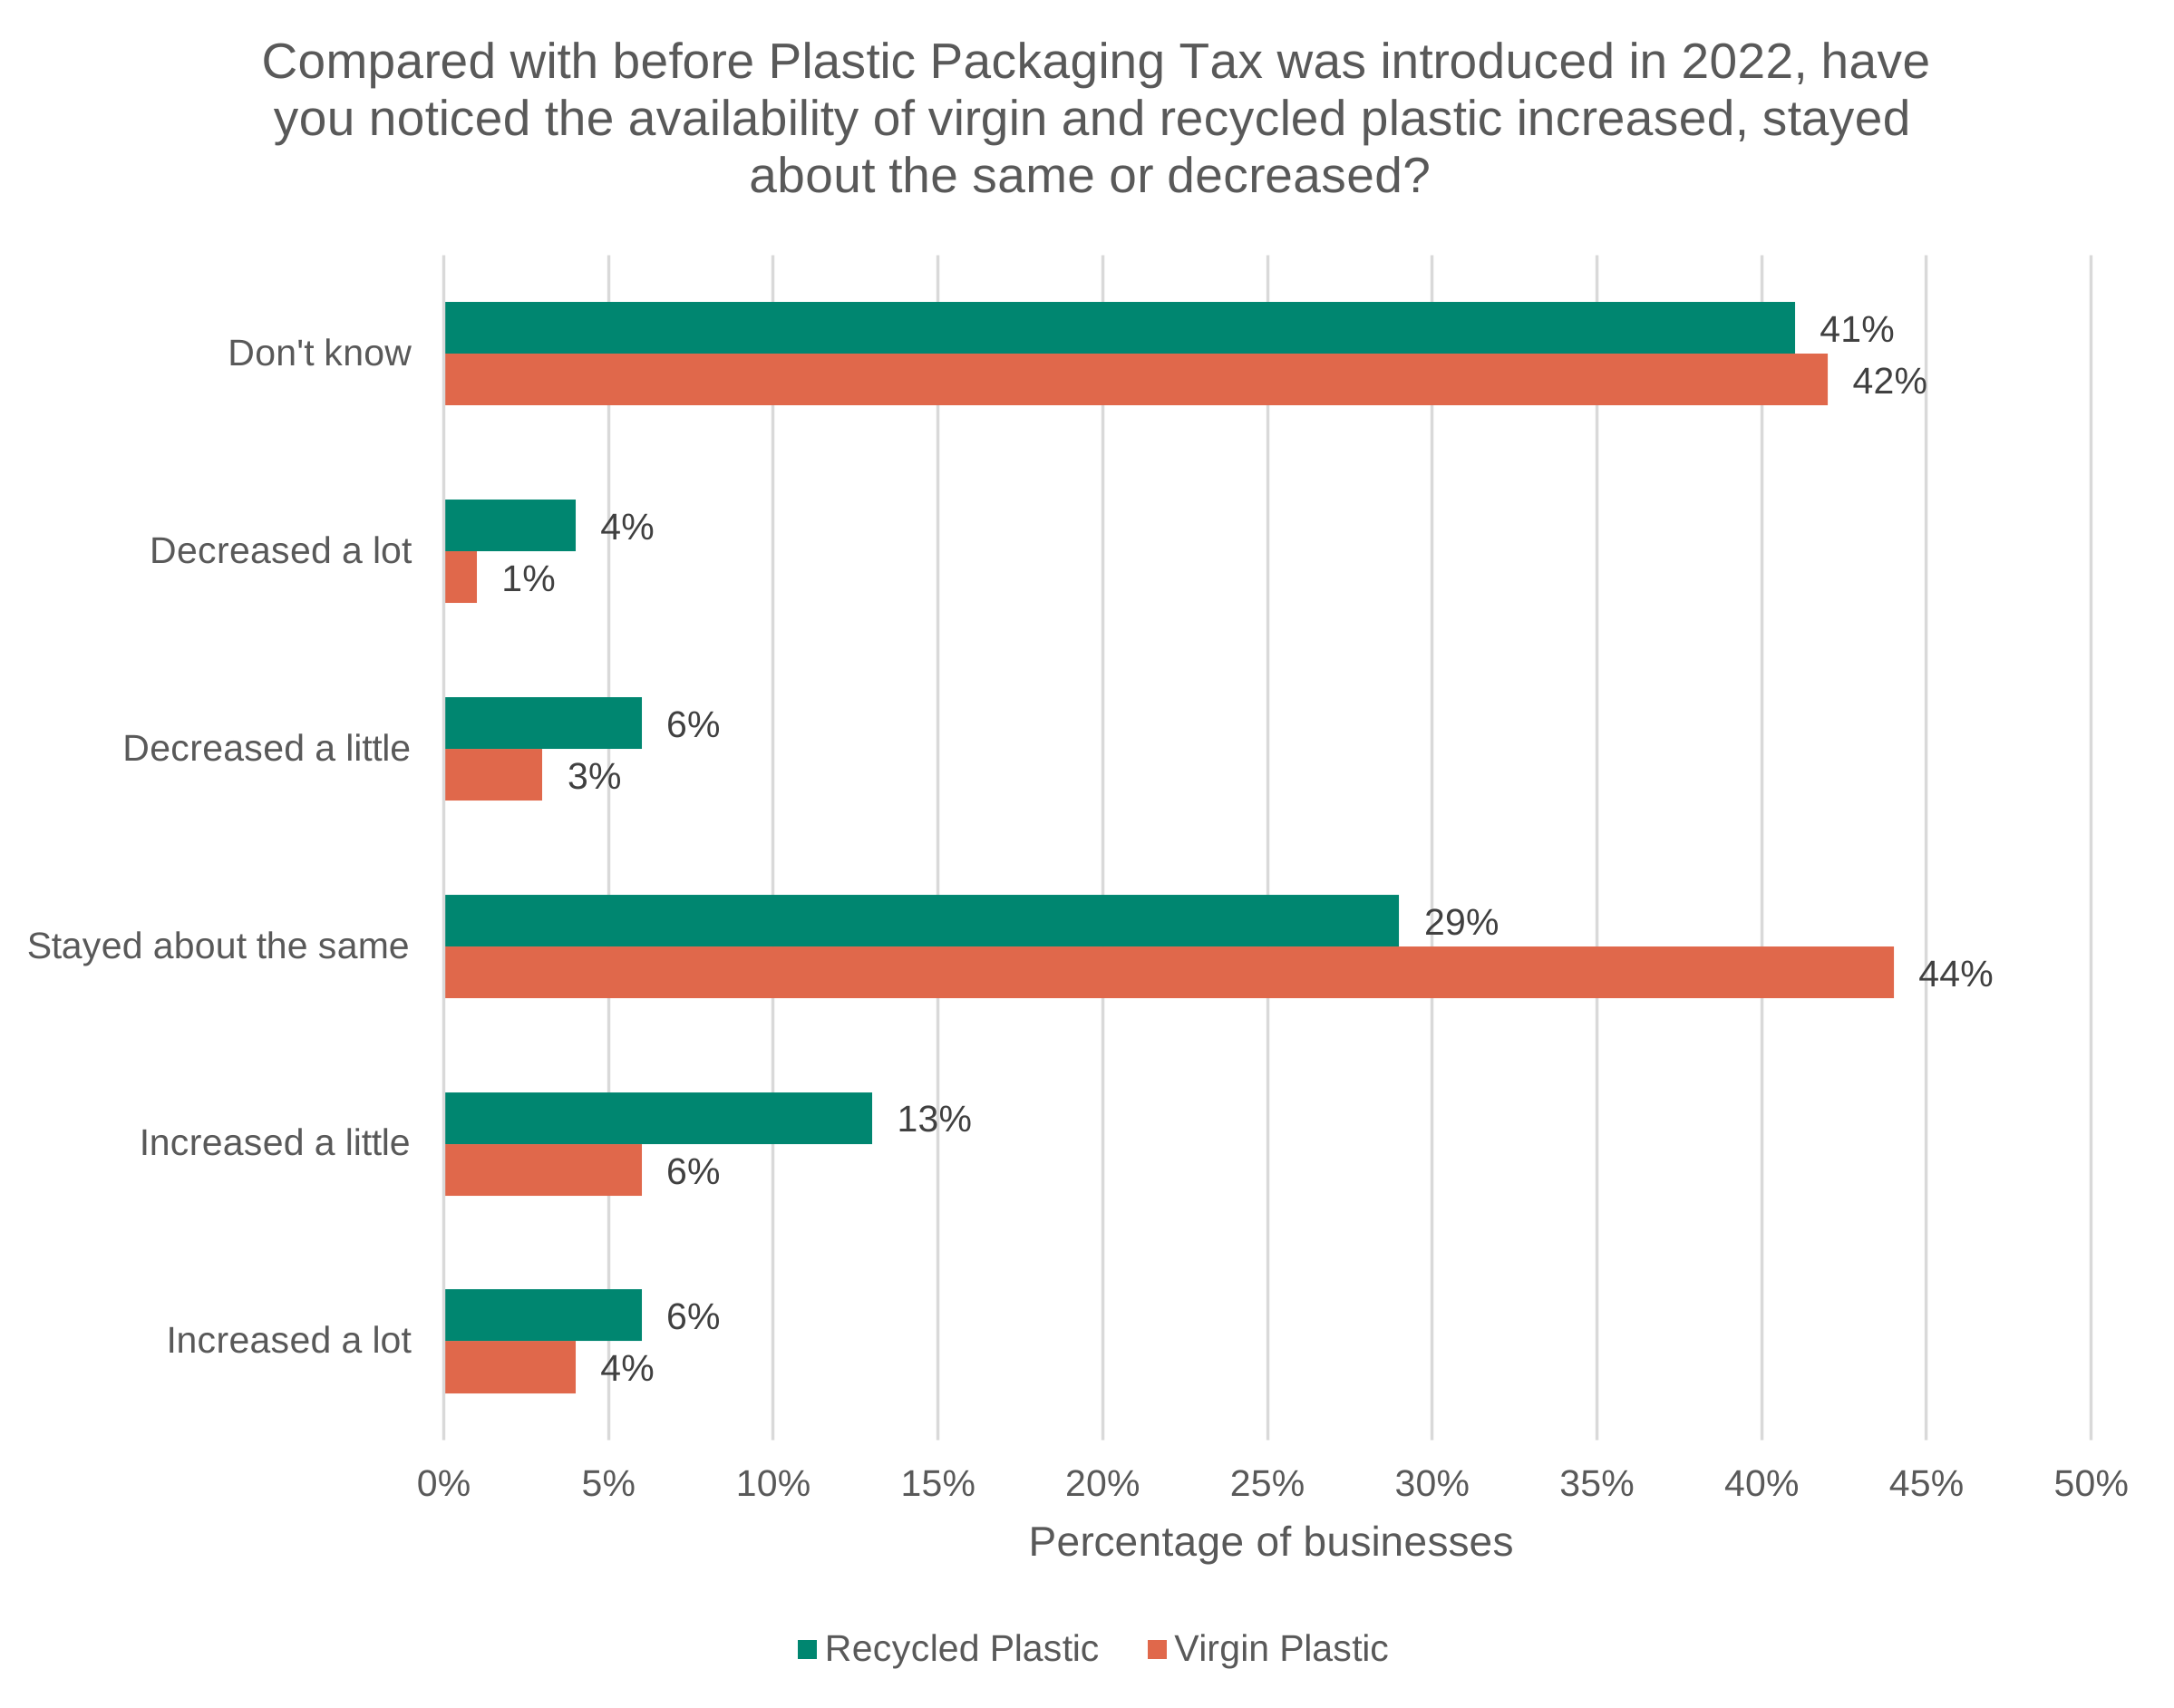
Data for Figure 7.3: Businesses’ responses to the question, ‘Compared with before Plastic Packaging Tax was introduced in 2022, have you noticed the availability of virgin and recycled plastic increased, stayed about the same or decreased?’.
Base: All businesses (1,011). Source: Ipsos.
| Category | Virgin Plastic | Recycled Plastic |
|---|---|---|
| Don’t know | 42% | 41% |
| Decreased a lot | 1% | 4% |
| Decreased a little | 3% | 6% |
| Stayed about the same | 44% | 29% |
| Increased a little | 6% | 13% |
| Increased a lot | 4% | 6% |
In response, 20% of businesses reported that the availability of recycled plastic had increased, while 10% reported that it had decreased. However, the most frequent responses reported were that availability of recycled plastics had stayed about the same with 29% or that they did not know whether availability had changed with 41%. This suggests that businesses did not generally report a clear increase in the availability of recycled plastic following the introduction of PPT. This is consistent with the moderate increase in recycling rates highlighted in Figure 7.2, where the higher recycling rate after 2022 appears to be driven more by the reduction in plastic packaging waste arising than by an increase in the volume of plastic packaging waste recycled.
However, the analysis above does not show whether plastic packaging has become a smaller component of the wider packaging system. If businesses are responding to PPT by reducing their use of plastic packaging, this would be expected to be reflected in a decline in the share of total packaging waste accounted for by plastic. Therefore, examining the relative contribution of plastic packaging to total packaging waste can provide information on whether changes in packaging use are occurring following the introduction of the tax.
Figure 7.4: Share of total packaging waste arising in the UK accounted for by plastic packaging, 2015 to 2024.
Source: Defra.
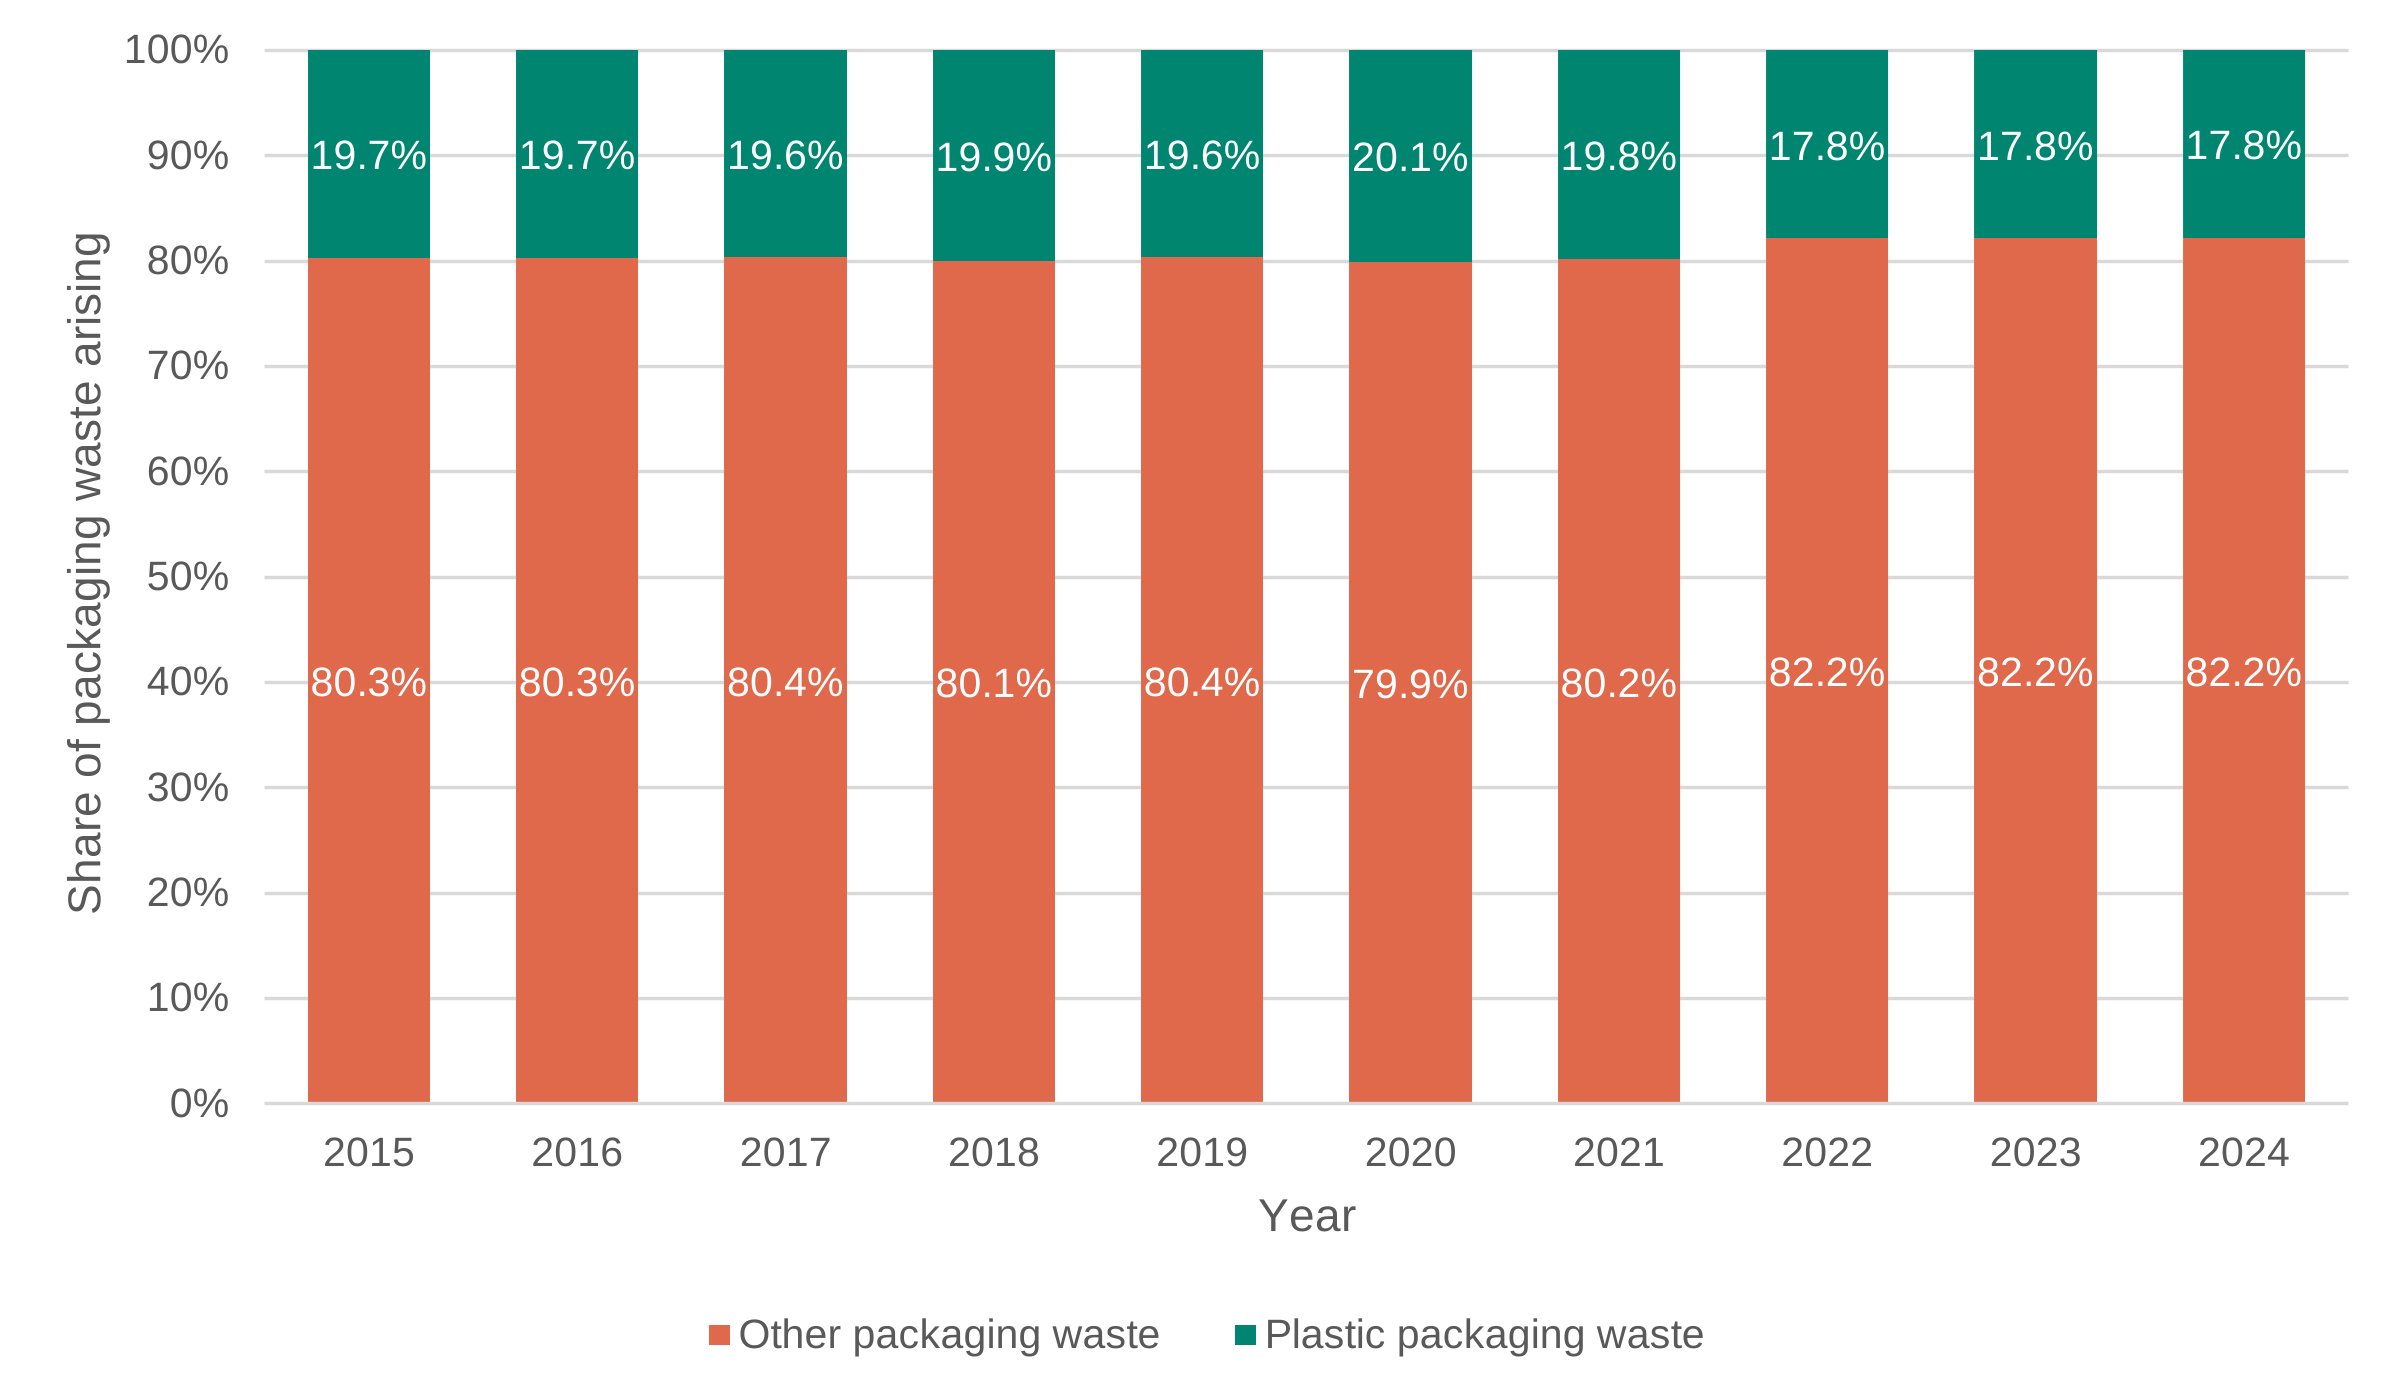
Data for Figure 7.4: Share of total packaging waste arising in the UK accounted for by plastic packaging, 2015 to 2024.
Source: Defra.
| Year | Other packaging waste | Plastic packaging waste |
|---|---|---|
| 2015 | 80.3% | 19.7% |
| 2016 | 80.3% | 19.7% |
| 2017 | 80.4% | 19.6% |
| 2018 | 80.1% | 19.9% |
| 2019 | 80.4% | 19.6% |
| 2020 | 79.9% | 20.1% |
| 2021 | 80.2% | 19.8% |
| 2022 | 82.2% | 17.8% |
| 2023 | 82.2% | 17.8% |
| 2024 | 82.2% | 17.8% |
Figure 7.4 shows the share of total packaging waste arising in the UK accounted for by plastic packaging between 2015 and 2024. Between 2015 and 2021, plastic packaging consistently accounted for around one fifth of total packaging waste arising, averaging around 19.8%. However, from 2022 the share of packaging waste arising accounted for by plastic packaging decreased to around 17.8% and remained broadly stable through to 2024. This indicates a small shift in the share of total packaging waste arising accounted for by plastic packaging following the introduction of PPT.
Therefore, alongside the reduction in plastic packaging waste tonnages, there was also a reduction in the share of total packaging waste accounted for by plastic packaging. This suggests that the change observed following 2022 may be specific to plastic packaging, rather than reflecting broader changes across packaging waste as a whole. This is consistent with the expected behavioural response to PPT, as the tax applies specifically to plastic packaging. However, while the timing of this change coincides with the introduction of PPT, it is not possible to determine whether the changes observed are attributable to the tax alone or to other factors affecting packaging demand over the same period.
Overall, the evidence is consistent with PPT contributing to some of the changes expected through its theory of change. Following the introduction of the tax, plastic packaging waste arising fell, the volume of plastic packaging recycled remained at a higher level than before 2022, and the proportion of plastic packaging waste recycled or recovered increased. These findings are consistent with the increase in recycled content reported in Chapter 4 and the packaging changes reported by businesses in Chapter 6.
In relation to EQ5, the findings provide some evidence that PPT may have stimulated demand for recycled plastic and contributed to higher recycling rates, although businesses generally did not report a clear increase in the availability of recycled plastic. In relation to EQ6, the reduction in both plastic packaging waste arising and plastic’s share of total packaging waste is consistent with PPT contributing to a reduction in plastic waste. Finally, in relation to EQ7, these changes are consistent with the environmental objectives of the tax, including supporting a more circular use of plastic materials and reducing reliance on virgin plastic. However, the available data does not allow the contribution of PPT to be isolated from other factors influencing waste generation, recycling and packaging choices.
7.4.2 Local Authority waste collection
This section examines trends in the volume and composition of plastic waste collected for recycling by local authorities (LAs) in England. To note, the quantities in Figure 7.5 are greater than in Figure 7.1 as ‘plastic’ waste in this instance includes all plastic waste, not only plastic waste which is derived from plastic packaging. While PPT does not directly affect households’ incentives to recycle, one of the tax’s stated objectives is to indirectly increase the supply of recycled plastic available for use in packaging. Alongside encouraging businesses to incorporate recycled content, PPT may incentivise packaging designs that are easier to recycle. As a large proportion of consumer packaging is likely to enter household waste streams, changes in packaging may be reflected in the volume and composition of waste collected by local authorities. Over time, this can increase the amount of plastic packaging successfully collected and recycled, helping to expand the supply of recycled plastic and potentially contributing to higher levels of household recycling. Trends in local authority waste collections may also provide an indication of the availability of plastic waste as a potential feedstock for recycling. Understanding Defra’s WasteDataFlow data therefore provides an additional source of evidence on whether PPT may be associated with changes across the wider waste and recycling system.
Figure 7.5: Plastic waste collected by local authorities in England and sent for recycling.
Source: Defra.
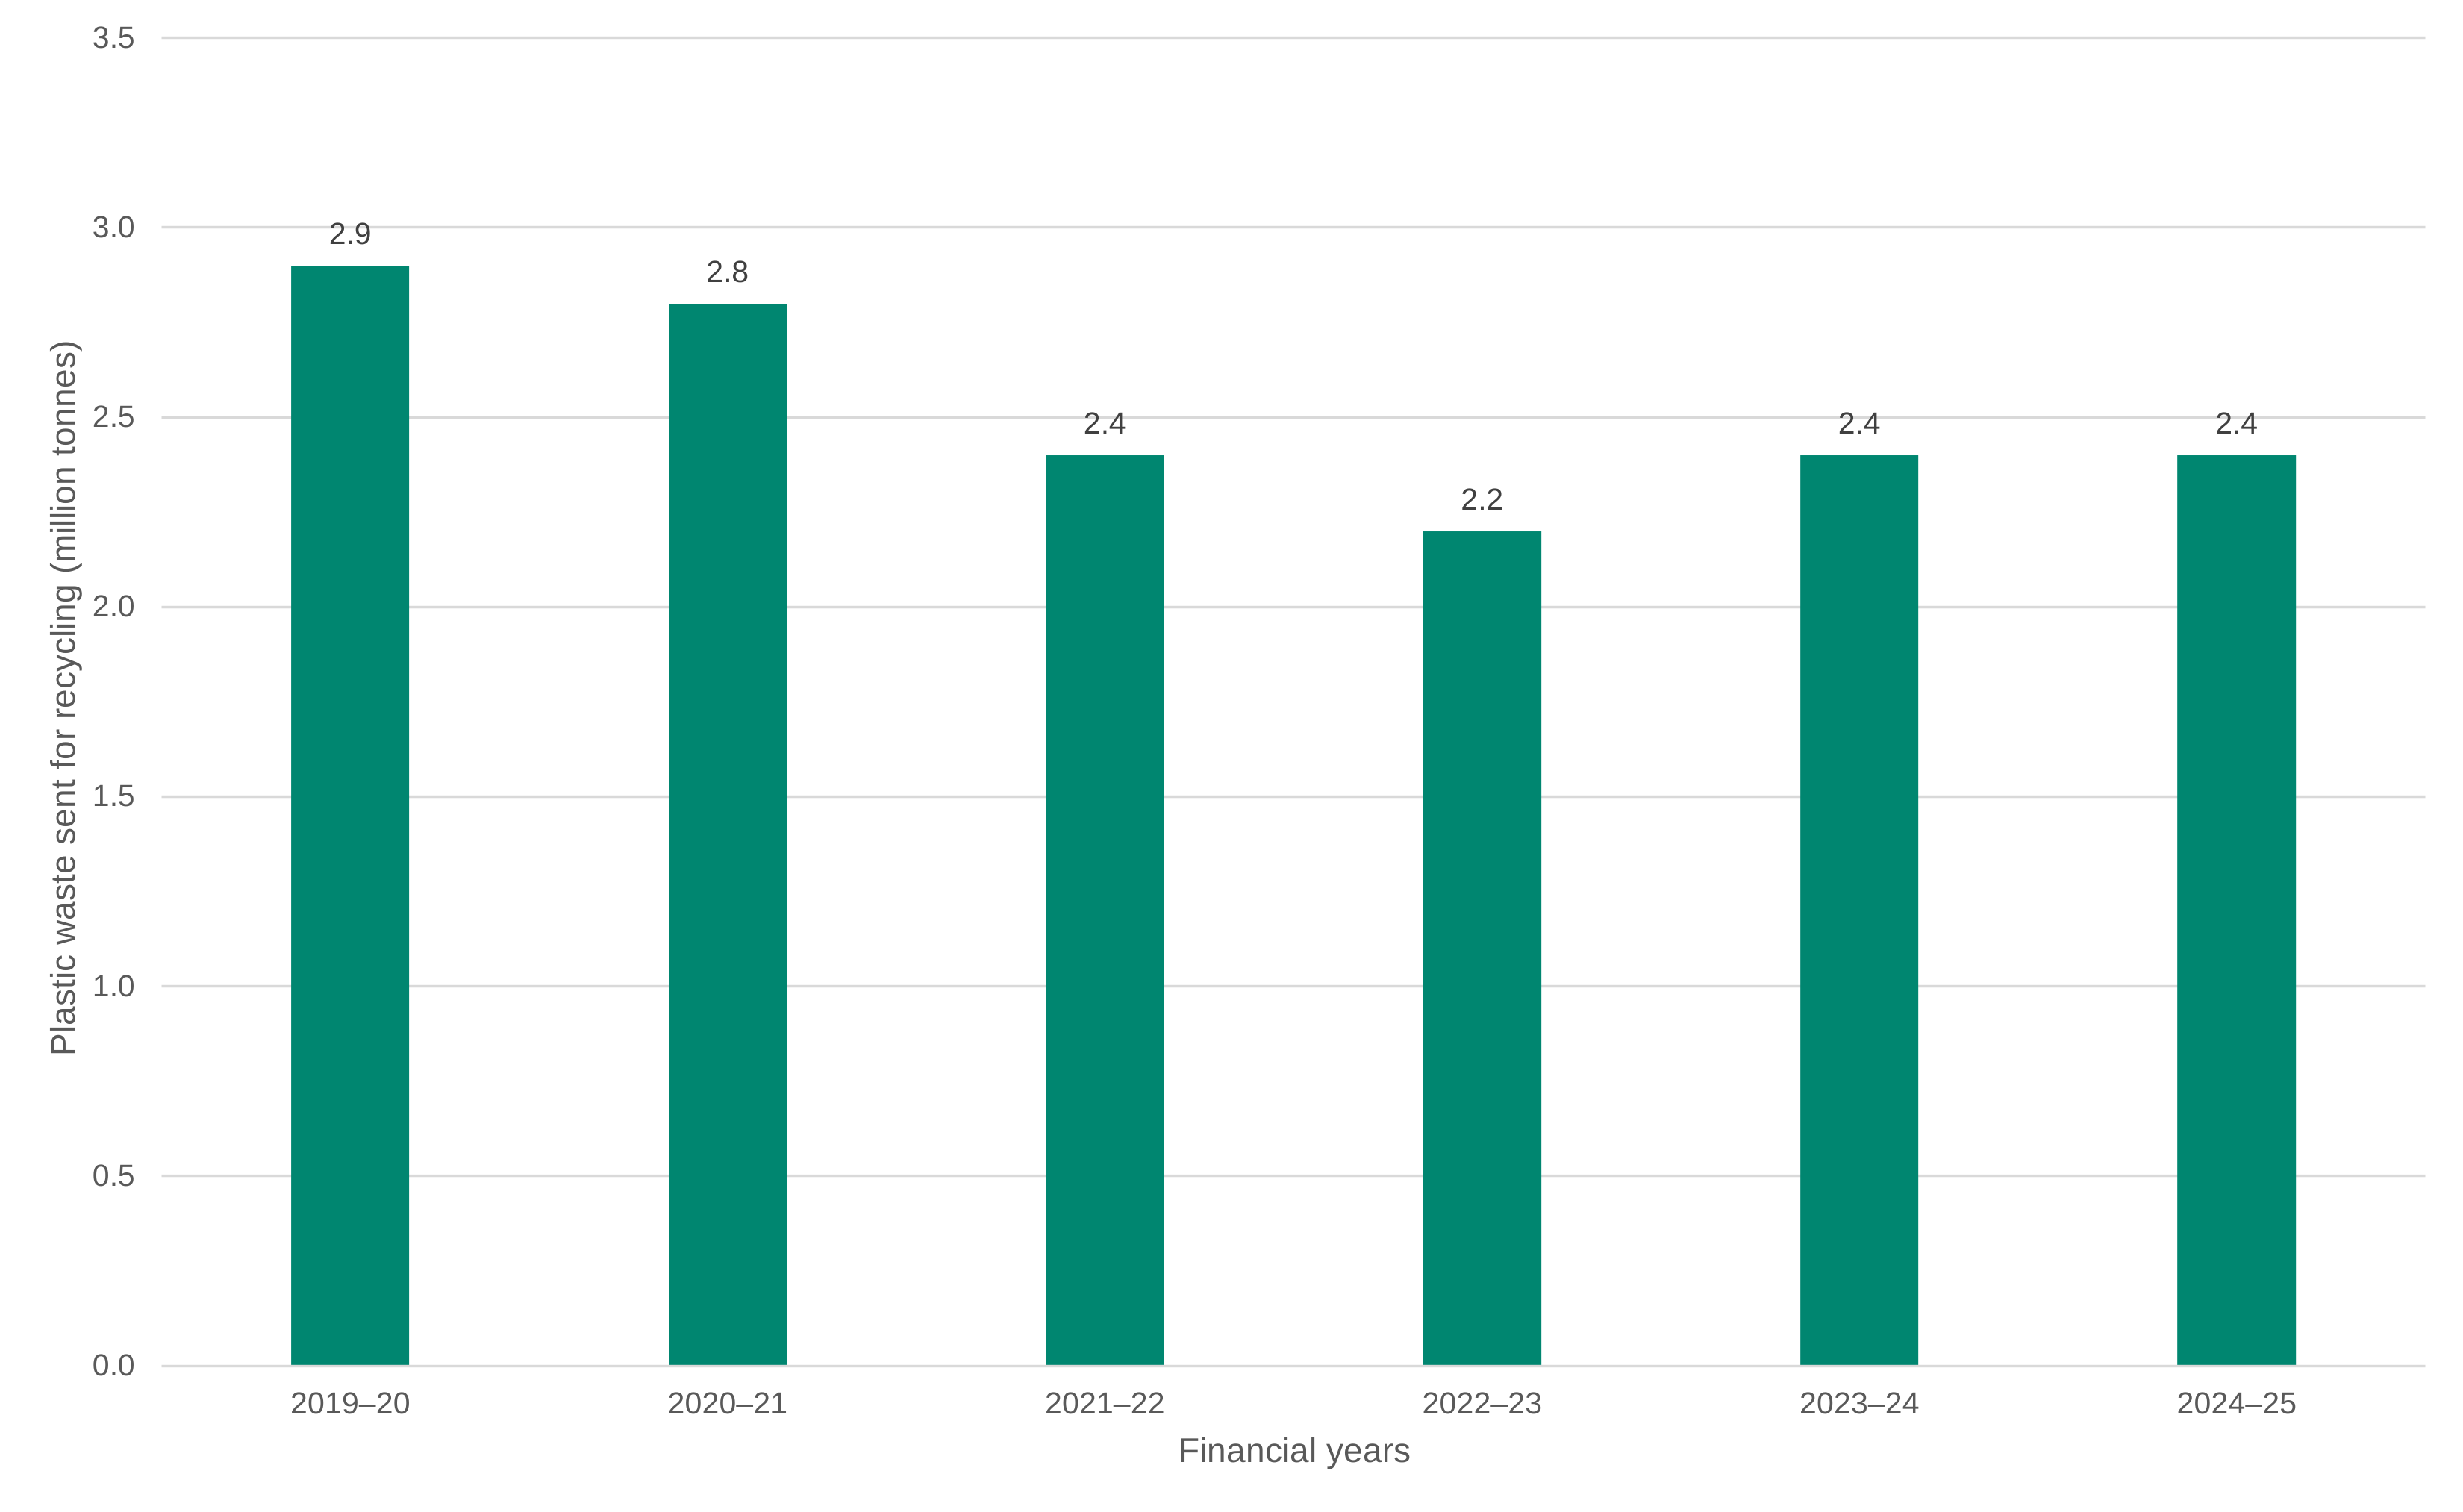
Data for Figure 7.5: Plastic waste collected by local authorities in England and sent for recycling.
Source: Defra.
| Financial years | Plastic waste sent for recycling (million tonnes) |
|---|---|
| 2019–20 | 2.9 |
| 2020–21 | 2.8 |
| 2021–22 | 2.4 |
| 2022–23 | 2.2 |
| 2023–24 | 2.4 |
| 2024–25 | 2.4 |
Figure 7.5 shows total plastic waste collected by local authorities in England and sent for recycling between financial year 2019 to 2020 and 2024 to 2025. The total tonnage decreased between 2019 to 2020 and 2022 to 2023 by around 25.8%, before increasing in the following 2 financial years by around 7.6%.
Following the introduction of PPT in 2022 to 2023, the volume of plastic waste collected by LAs in England increased from 2.2 million tonnes to 2.4 million tonnes and remained at this level in 2024 to 2025. This is consistent with the timing of packaging changes reported by businesses in Chapter 6 of the report, though the data does not reveal how much of this is driven by plastic packaging. The data alone does not allow the contribution of PPT to these trends to be isolated from other factors affecting household recycling behaviour and waste collection volumes. As local authority collection data is only available for England, it is not possible to assess whether similar trends occurred across the UK.
Household collections represent only one part of the recycling system, while UK level recycling figures reflect all sources of recyclable plastic, including commercial and industrial waste and material reprocessed overseas. Building on this, looking at whether there have been changes in the composition of plastic waste collected for recycling by local authorities could provide additional evidence on how the types of plastic packaging entering the recycling system may be changing following the introduction of PPT. To assess this, the same WasteDataFlow dataset is used to analyse the composition of household plastic waste collected by local authorities and sent for recycling. The purpose of this analysis is to examine whether the mix of plastic materials has changed following the introduction of PPT, and whether these changes are consistent with the shifts in packaging reported by businesses earlier in the evaluation.
Understanding changes in composition is important when interpreting environmental impacts. A shift towards plastic materials that are more widely recyclable, or contain higher levels of recycled content, would reflect improvements in how plastic waste is managed within the waste hierarchy, even where overall plastic waste volumes remain unchanged.
Figure 7.6: Composition of plastic waste collected by local authorities in England and sent for recycling.
Source: Defra.
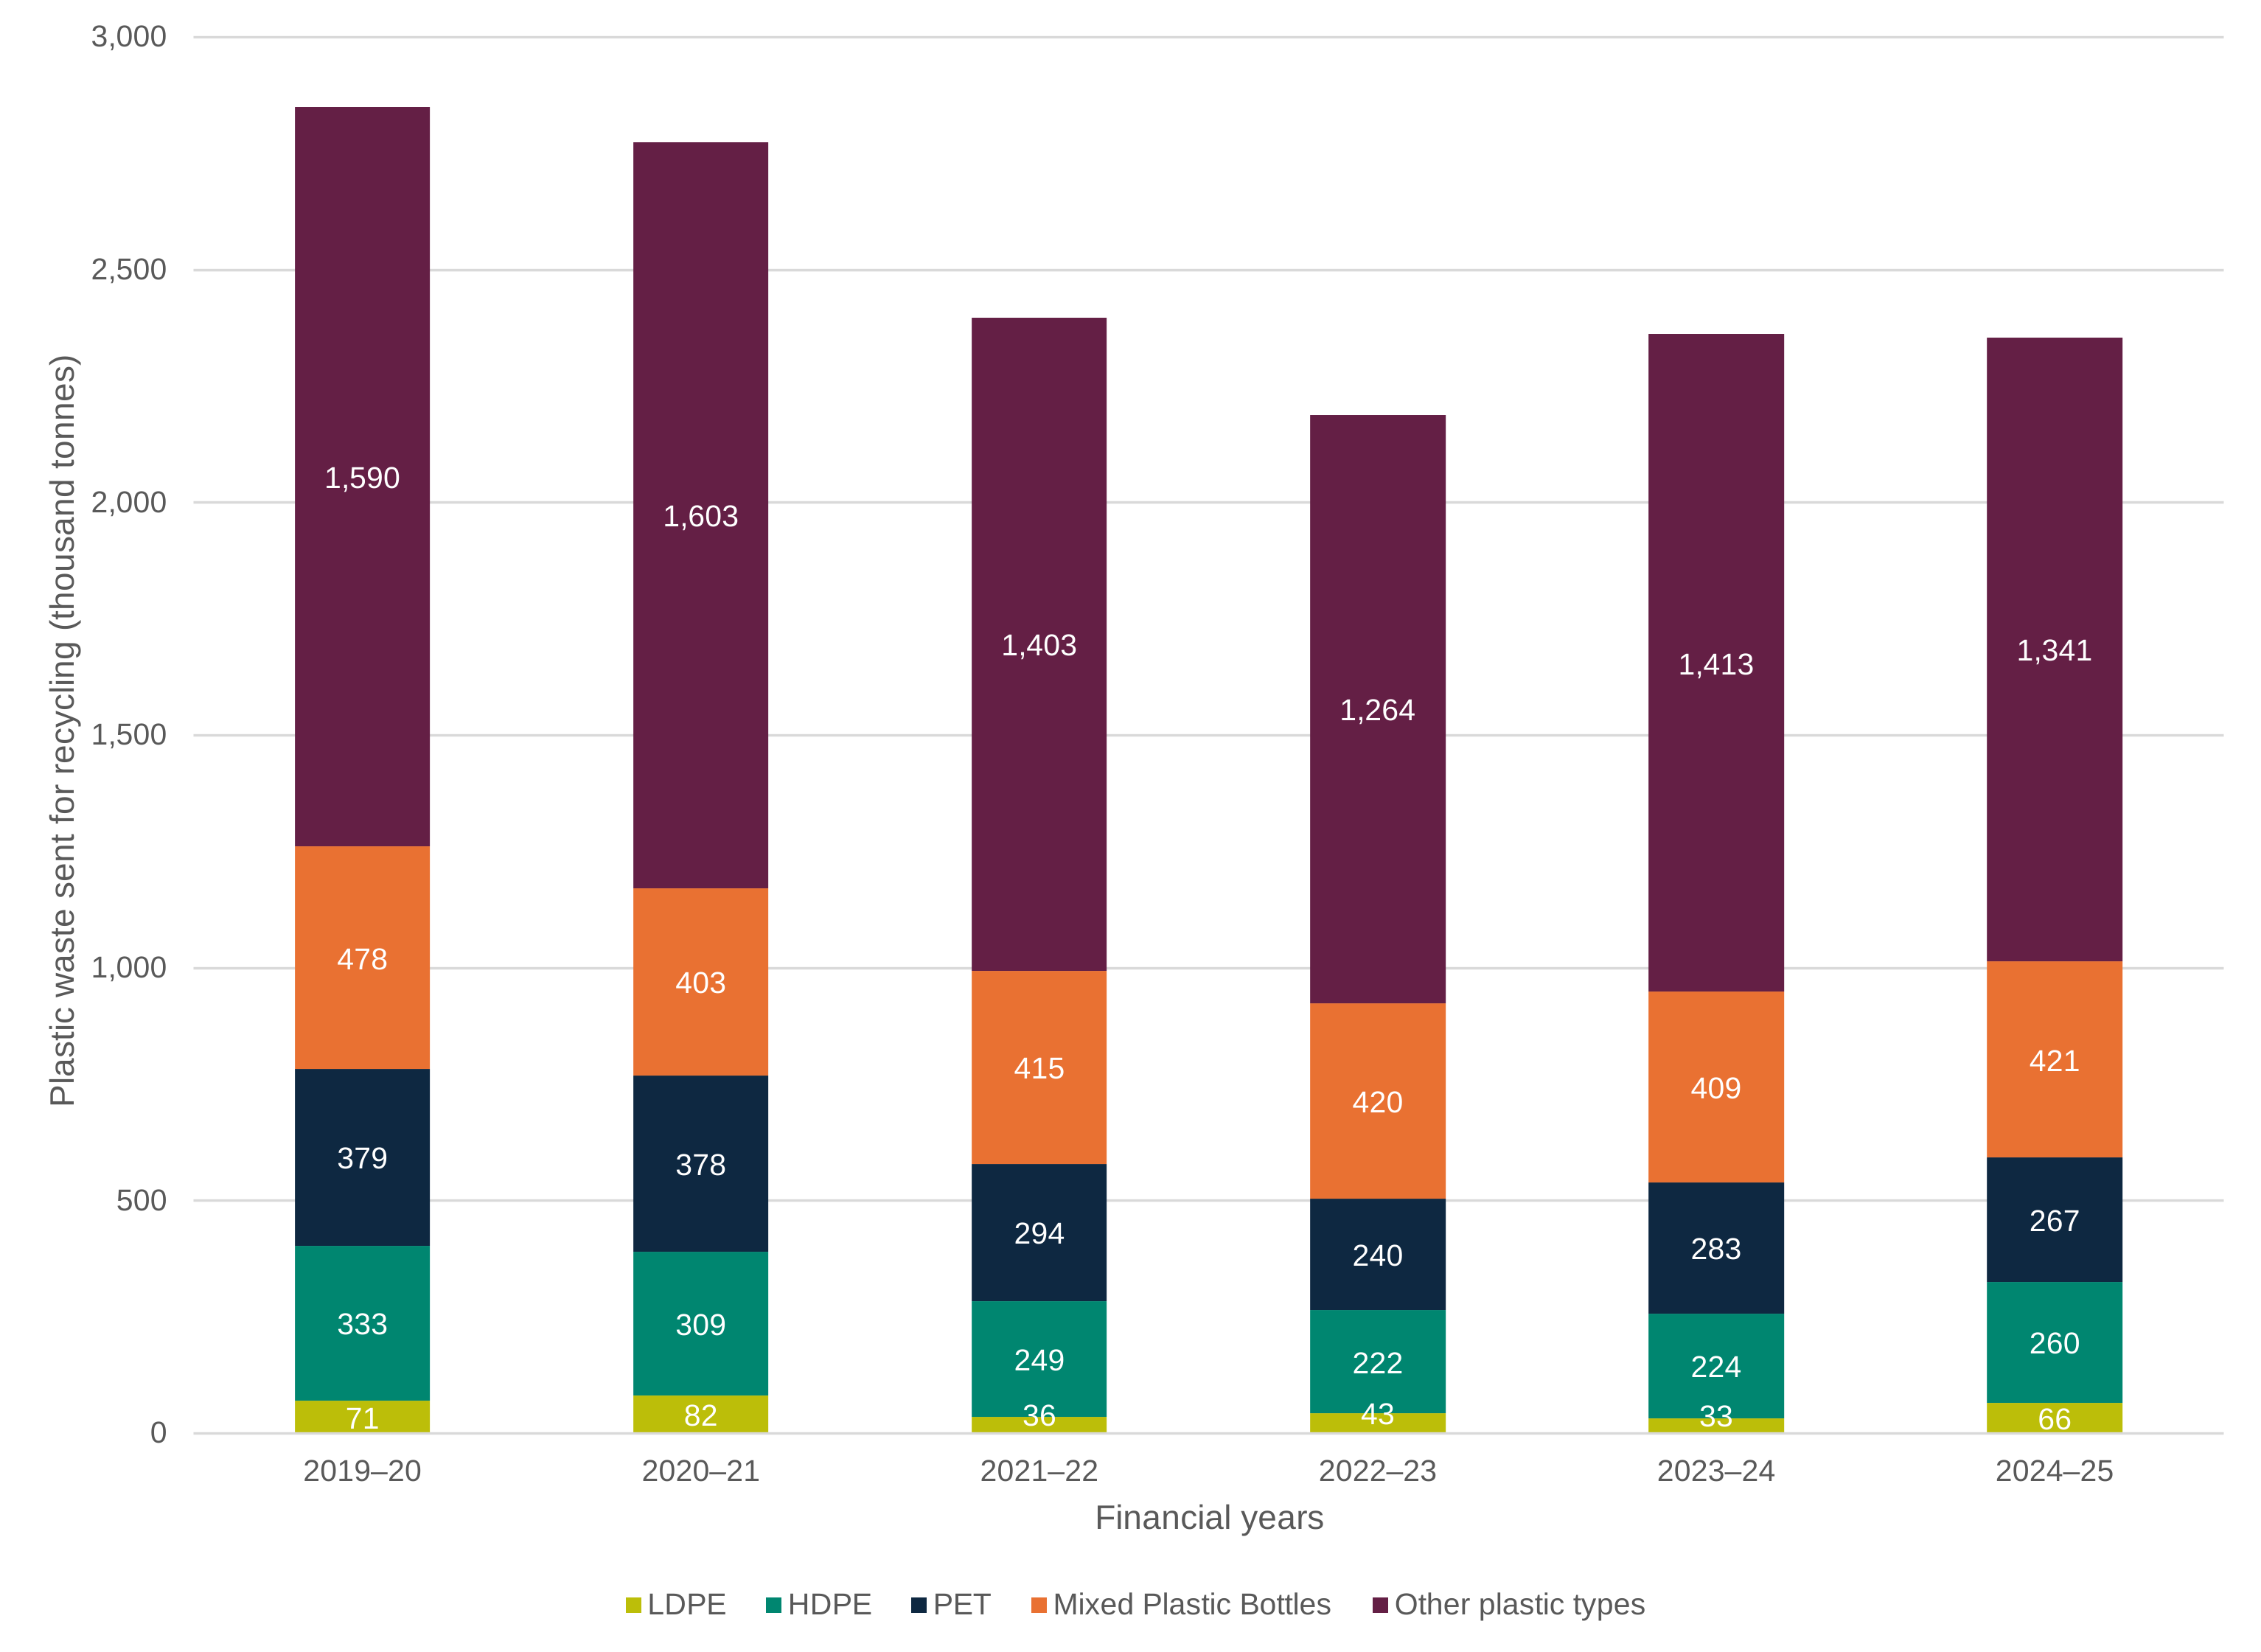
Data for Figure 7.6: Composition of plastic waste collected by local authorities in England and sent for recycling.
Source: Defra.
| Financial years | LDPE | HDPE | PET | Mixed Plastic Bottles | Other plastic types |
|---|---|---|---|---|---|
| 2019–20 | 71 | 333 | 379 | 478 | 1,590 |
| 2020–21 | 82 | 309 | 378 | 403 | 1,603 |
| 2021–22 | 36 | 249 | 294 | 415 | 1,403 |
| 2022–23 | 43 | 222 | 240 | 420 | 1,264 |
| 2023–24 | 33 | 224 | 283 | 409 | 1,413 |
| 2024–25 | 66 | 260 | 267 | 421 | 1,341 |
Figure 7.6 shows the composition of plastic waste collected by local authorities for recycling in England between 2019 to 2020 and 2024 to 2025, broken down by material type. Following the introduction of PPT in 2022 to 2023, there is a small decrease in the volume of mixed plastic bottles, from 420 thousand tonnes in 2022 to 2023 to 409 thousand tonnes in 2023 to 2024. Between 2023 to 2024 and 2024 to 2025, the volume of mixed plastic bottles and HDPE plastics increases slightly to 421 thousand tonnes and 260 thousand tonnes respectively. Over the same period, the volume of low-density polyethylene (LDPE) plastics, which are commonly used in plastic bags and packaging films, increased from 33 thousand tonnes in 2023 to 2024 to 66 thousand tonnes in 2024 to 2025, having remained broadly unchanged between 2021 to 2022 and 2023 to 2024. As the figure shows, these changes are relatively small, and the composition of plastic waste collected by local authorities for recycling remains broadly similar over time.
The available evidence suggests that the volume of plastic waste collected by local authorities in England and sent for recycling increased following the introduction of PPT, after a period of decline between 2019 to 2020 and 2022 to 2023. This pattern is broadly consistent with the timing of packaging changes reported by businesses elsewhere in the evaluation and may indicate an increase in the supply of plastic waste available for recycling. However, the data does not allow the contribution of PPT to be isolated from other factors affecting waste generation, collection and recycling behaviours.
Regarding the evaluation questions, these findings provide limited evidence that increased demand for recycled plastic has translated into greater volumes of plastic waste collected for recycling, or substantial changes to the composition of plastic waste collected by local authorities in England.
7.4.3 Packaging waste
To assess whether changes in plastic packaging waste reflect broader shifts in material use, trends in plastic packaging waste arising are compared with those of other packaging materials, including paper and cardboard, glass, and metal. This comparison is important in the context of PPT and builds on the substitution explored in Chapter 6, as the tax applies specifically to plastic packaging. If businesses respond by reducing their use of plastic or substituting towards alternative materials, this would be expected to be reflected in changes in the share of plastic packaging relative to other materials in total packaging waste arising.
Figure 7.7: Packaging waste arising in the UK by material type, 2015 to 2024.
Source: Defra.
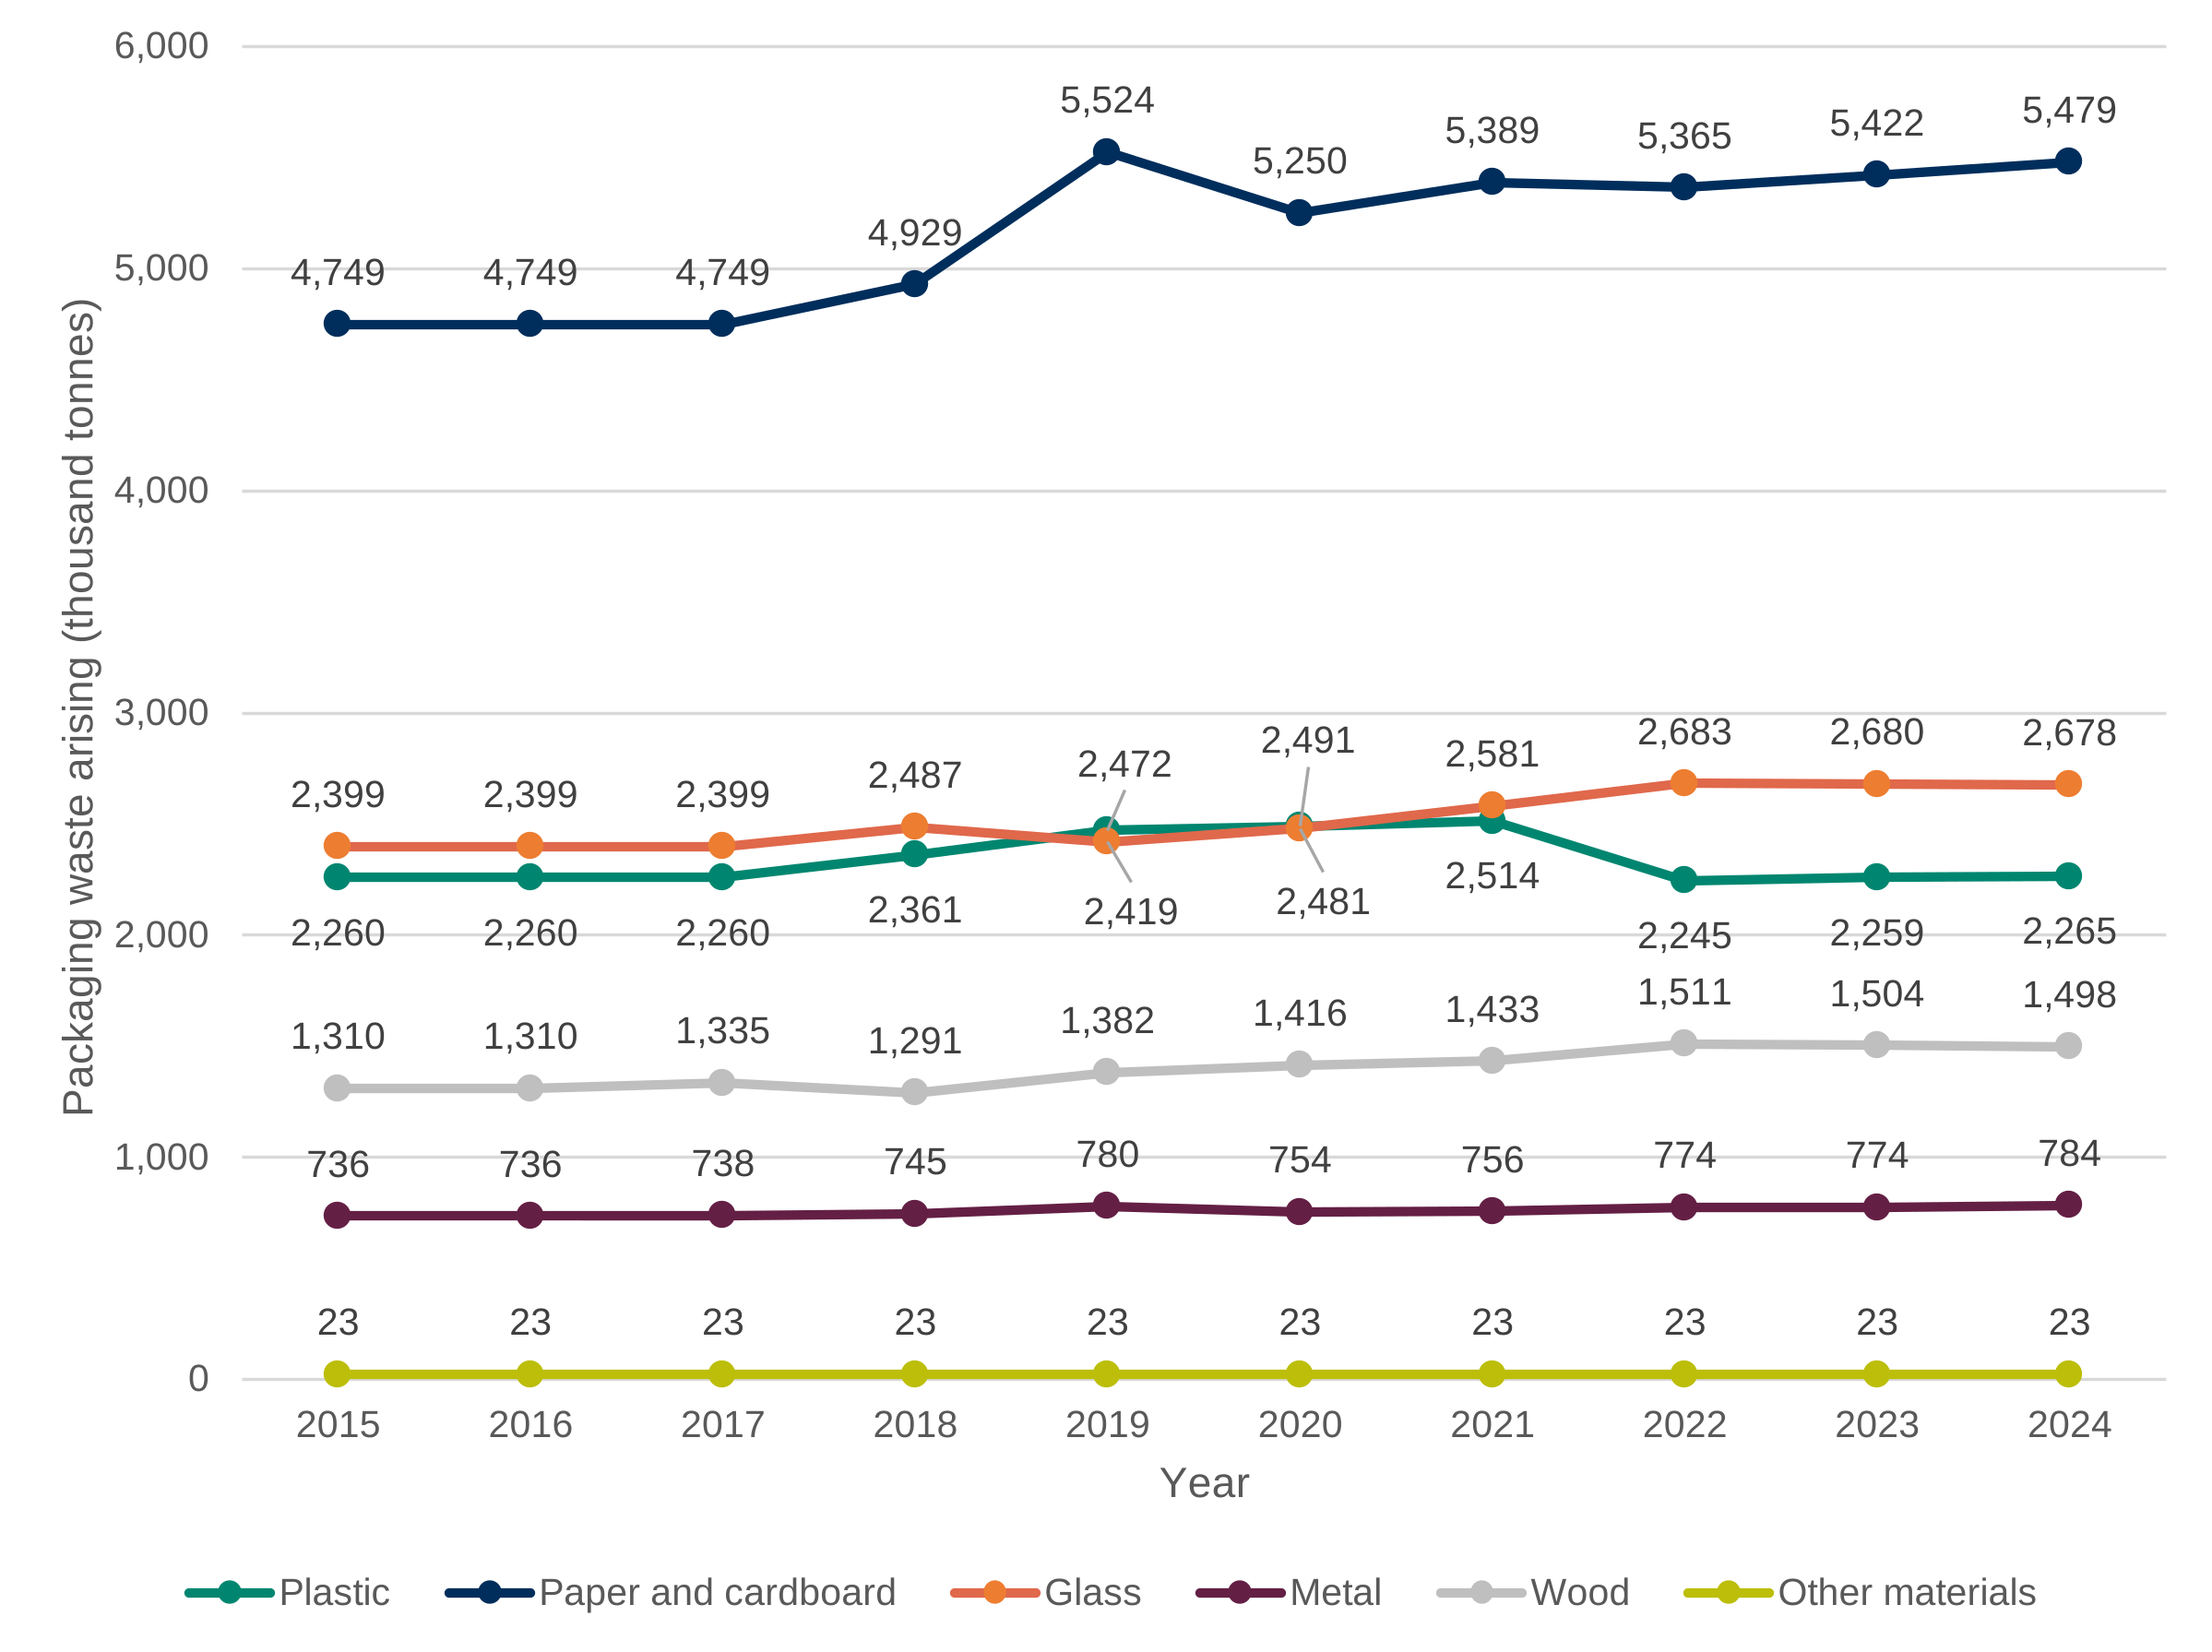
Data for Figure 7.7: Packaging waste arising in the UK by material type, 2015 to 2024.
Source: Defra.
| Year | Plastic | Paper and cardboard | Glass | Metal | Wood | Other materials |
|---|---|---|---|---|---|---|
| 2015 | 2,260 | 4,749 | 2,399 | 736 | 1,310 | 23 |
| 2016 | 2,260 | 4,749 | 2,399 | 736 | 1,310 | 23 |
| 2017 | 2,260 | 4,749 | 2,399 | 738 | 1,335 | 23 |
| 2018 | 2,361 | 4,929 | 2,487 | 745 | 1,291 | 23 |
| 2019 | 2,472 | 5,524 | 2,419 | 780 | 1,382 | 23 |
| 2020 | 2,491 | 5,250 | 2,481 | 754 | 1,416 | 23 |
| 2021 | 2,514 | 5,389 | 2,581 | 756 | 1,433 | 23 |
| 2022 | 2,245 | 5,365 | 2,683 | 774 | 1,511 | 23 |
| 2023 | 2,259 | 5,422 | 2,680 | 774 | 1,504 | 23 |
| 2024 | 2,265 | 5,479 | 2,678 | 784 | 1,498 | 23 |
Figure 7.7 shows that between 2021 and 2022, plastic packaging is the only material to show a notable decrease in the amount of packaging waste arising, while other materials show smaller changes. In following years up to 2024, levels of packaging waste arising across all materials remain broadly stable, with relatively small year to year changes. There is a slight increase in paper and cardboard packaging, while other materials, including plastic, show limited variation over this period.
This indicates a small level shift in plastic packaging waste arising relative to other packaging materials which coincides with the introduction of PPT. Plastic packaging was the only material to show a notable reduction between 2021 and 2022, while other materials showed relatively small changes over the same period. Combined with the reduction in plastic’s share of total packaging waste arising, this suggests that the change observed following the introduction of PPT was specific to plastic packaging rather than reflecting broader changes in packaging waste as a whole. While it is not possible to determine whether these changes were attributable to PPT alone, the timing of the change is consistent with the expected behavioural response to the tax.
Regarding the evaluation questions, these findings provide some evidence that plastic packaging waste declined following the introduction of PPT. Plastic packaging was the only material to show a notable reduction in packaging waste arising between 2021 and 2022, and plastic’s share of total packaging waste arising also decreased over the same period. While the timing of these changes is consistent with the expected behavioural response to PPT, it is not possible to determine the extent to which they were attributable to the tax alone.
7.4.4 Emissions impact
The evaluation has found evidence that businesses increased their use of recycled content in their plastic packaging following the introduction of PPT. As recycled plastic is generally associated with lower greenhouse gas emissions than virgin plastic, increases in recycled content and reductions in plastic packaging waste have the potential to reduce the emissions associated with plastic packaging production.
To assess whether changes in recycled content associated with PPT are likely to have affected greenhouse gas emissions from plastic packaging, HMRC developed a model for estimating the greenhouse gas emissions (GHG) associated with the tax base. The model converts plastic packaging volumes into estimated GHG emissions using HMRC data on plastic packaging volumes and emissions conversion factors applied to packaging falling above and below the 30% recycled content threshold. The model compares estimated emissions with PPT in place against a counterfactual scenario in which the tax was not introduced. The counterfactual is derived using assumptions from the PPT forecasting model and evidence from administrative data and social research on the proportion of businesses that changed their recycled-content tonnages following the introduction of the tax. This enables an estimate of whether changes in the amount of packaging falling above and below the recycled content threshold have resulted in lower greenhouse gas emissions than would otherwise have occurred without the tax. The model covers between financial years 2022 to 2023 and 2025 to 2026. Further detail on the model and its assumptions is outlined in Section B.2 of Annex B.
Table 7.1: Estimated greenhouse gas emissions associated with the tax base for PPT.
Emissions under observed and the central counterfactual scenario, in million tonnes of CO2e. Figures are rounded to 2 decimal places. Source: HMRC.
| Financial year | Estimated emissions (MtCO2e) | Counterfactual emissions (MtCO2e) | Estimated emissions impact of PPT (MtCO2e) | Percentage reduction in tax base emissions |
|---|---|---|---|---|
| 2022-23 | 8.06 | 8.15 | -0.09 | -1.10% |
| 2023-24 | 7.86 | 8.06 | -0.19 | -2.40% |
| 2024-25 | 8.00 | 8.36 | -0.37 | -4.40% |
| 2025-26 | 7.54 | 7.95 | -0.41 | -5.10% |
Table 7.1 presents the estimated emissions associated with plastic packaging under the observed scenario and the counterfactual scenario, in which PPT hadn’t been introduced. Given the greater level of packaging falling below the 30% recycled content threshold and the higher overall tonnage in the counterfactual, the model naturally suggests that emissions associated with the tax base are lower as a result of the tax. Under the central scenario, the estimated emissions impact associated with PPT is a reduction of around 0.09 million tonnes of carbon dioxide equivalent (MtCO2e) in financial year 2022 to 2023, increasing to around 0.41 MtCO2e in 2025 to 2026. This is equivalent to reductions of around 1.1% and 5.1% respectively relative to the central counterfactual scenario. The original forecasted estimate that was included in the Tax Information and Impact Notes (TIIN) on the Introduction of Plastic Packaging Tax from April 2022 stated there would be an estimated carbon saving of nearly 200,000 tonnes in 2022 to 2023. The revised estimate is now lower than this original estimate, though the cumulative impact increases over time.
The larger estimated impact in subsequent financial years reflects the cumulative nature of the counterfactual. The counterfactual estimates a scenario in which PPT was not introduced, meaning the difference between observed and counterfactual emissions would be expected to widen over time as the behavioural effects of the tax are cumulative.
Table 7.2: Estimated greenhouse gas emissions associated with plastic packaging above and below the 30% recycled content threshold.
Source: HMRC.
| Packaging category | Emissions (2022-23, MtCO2e) | Emissions (2023-24, MtCO2e) | Emissions (2024-25, MtCO2e) | Emissions (2025-26, MtCO2e) |
|---|---|---|---|---|
| Below 30% recycled content threshold | 4.35 | 3.91 | 3.78 | 3.50 |
| Above 30% recycled content threshold | 3.71 | 3.95 | 4.21 | 4.04 |
| All packaging (excluding human medicine and exported) | 8.06 | 7.86 | 8.00 | 7.54 |
Table 7.2 provides additional context for the emissions impact shown in Table 7.1 by presenting estimated greenhouse gas emissions split by packaging falling above and below the 30% recycled content threshold. The model excludes emissions from exported plastic packaging and medically exempt plastic packaging given they are relieved from the tax.
Table 7.2 shows that estimated emissions associated with packaging below the 30% recycled content threshold decreased from approximately 4.4 MtCO2e in 2022 to 2023 to 3.5 MtCO2e in 2025 to 2026. Over the same period, emissions associated with packaging above the threshold increased from 3.7 MtCO2e to 4.0 MtCO2e. This reflects a decline in the amount of packaging falling below the threshold, from 1.4 million tonnes to 1.1 million tonnes, and an increase in the amount of packaging meeting the threshold compared with the start of the evaluation period. Packaging above the threshold contains a higher proportion of recycled plastic and is therefore associated with lower emissions per tonne of packaging than packaging below the threshold. As a result, overall emissions from taxable plastic packaging fell modestly, from 8.1 MtCO2e to 7.5 MtCO2e across the period.
Table 7.3: Emissions intensity associated with plastic packaging in scope of the tax (above and below the recycled content threshold).
Source: HMRC.
| Financial year | Emissions (MtCO2e) | Packaging tonnages (thousand tonnes) | Emissions intensity (tCO2e per tonne) |
|---|---|---|---|
| 2022-23 | 8.06 | 2,688 | 3.00 |
| 2023-24 | 7.86 | 2,655 | 2.96 |
| 2024-25 | 8.00 | 2,763 | 2.89 |
| 2025-26 | 7.54 | 2,604 | 2.89 |
Table 7.3 shows that emissions intensity fell from approximately 3.00 tCO2e per tonne of plastic packaging in 2022 to 2023 to 2.96 tCO2e per tonne in 2023 to 2024 and around 2.89 tCO2e per tonne in both 2024 to 2025 and 2025 to 2026. Emissions intensity is calculated as estimated actual emissions associated with the tax base divided by actual plastic packaging tonnage in scope. The reduction in emissions intensity is consistent with an increasing share of packaging falling above the 30% recycled content threshold and the emissions conversion factors applied within the model.
This analysis indicates that greenhouse gas emissions from plastic packaging were lower than would have been expected in the absence of PPT’s estimated behavioural impact. It also shows a shift towards packaging meeting the 30% recycled content threshold, reflected in an increase in the amount of packaging falling above the threshold and a reduction in the amount falling below it. The findings are consistent with a positive environmental impact originating from PPT encouraging a greater use of recycled content in plastic packaging.
However, the analysis relies on modelled assumptions about the underlying trend in plastic packaging and the proportion of businesses whose changes in recycled-content tonnages were attributable to PPT. Low, central and high scenarios are included in Section B.2 in Annex B to reflect uncertainty around these assumptions. The findings should therefore be interpreted as indicative evidence of the potential emissions impact of PPT, rather than a definitive estimate of its environmental impact.
The available evidence suggests that PPT has had a positive environmental impact by contributing to reductions in greenhouse gas emissions associated with plastic packaging. The modelling indicates that emissions were lower than would have been expected without the tax, reflecting increased use of recycled content and a greater share of packaging exceeding the 30% recycled content threshold. Although the estimates should be treated as indicative given the reliance on modelling assumptions and the limited post-implementation period available for analysis, the findings are consistent with PPT achieving its intended environmental objective of encouraging the substitution of virgin plastic with recycled plastic and reducing the emissions intensity of the tax base.
7.5 Interpretation and conclusions
Overall, the evidence suggests that PPT has been associated with several positive environmental outcomes, although the strength of the evidence varies across different parts of its theory of change.
The clearest evidence relates to the increased use of recycled content in plastic packaging, which businesses reported following the introduction of the tax and which is reflected in PPT administrative data. This appears to have been accompanied by a reduction in plastic packaging waste arising and a decline in plastic packaging’s share of total packaging waste. Plastic packaging was the only major packaging material to show a notable reduction in waste arising between 2021 and 2022, suggesting that the change observed following the introduction of PPT was specific to plastic packaging rather than part of a broader shift across packaging materials. These findings are consistent with the tax influencing packaging choices and reducing reliance on virgin plastic.
The evidence is more mixed in relation to recycling outcomes. While the proportion of plastic packaging waste recycled or recovered increased following the introduction of PPT, this appears to have been driven primarily by a reduction in plastic packaging waste arising rather than a substantial increase in recycling volumes. Similarly, local authority data provides limited evidence of significant changes in either the volume or composition of plastic waste collected for recycling. These findings suggest that, while PPT may have increased demand for recycled plastic, there is currently limited evidence that this has translated into substantial changes in recycling activity across the wider waste and recycling system.
The emissions analysis provides further evidence of positive environmental impacts. The modelling suggests that greenhouse gas emissions associated with plastic packaging were lower than would have been expected in the absence of PPT. The central estimates suggest emissions reductions of an average of 260,000 tCO2e between financial year 2022 to 2023 and 2025 to 2026.
The findings indicate that PPT has contributed to environmental improvements principally through encouraging greater use of recycled content, reducing plastic packaging waste arising, and lowering the greenhouse gas emissions associated with plastic packaging. However, there is currently less evidence that these changes have resulted in substantial impacts on recycling volumes or the composition of material entering the recycling system. As with previous chapters, these findings should be interpreted with caution, as it is not possible to isolate the impact of PPT from other factors affecting packaging use, waste generation, recycling activity and environmental outcomes over the same period.
Annex A: Glossary of Terms
Evaluation terminology
| Term | Definition |
|---|---|
| Critical Success Factor (CSF) | A key condition that must be achieved for a policy to be considered successful. In this evaluation, the CSFs represent the intended outcomes that PPT was designed to deliver. |
| Evaluation Question (EQ) | A question that an evaluation seeks to answer in order to assess whether a policy has achieved its objectives. Evaluation questions provide the framework for the analysis and evidence presented in the evaluation. |
| Theory of Change | A description of how and why a policy is expected to produce its intended outcomes. It sets out the causal pathways linking policy activities and interventions to behavioural changes, intermediate outcomes, and ultimate impacts. |
| Counterfactual | An estimate of what would have happened in the absence of a policy intervention. Counterfactuals are used in impact evaluation to assess how observed outcomes differ from those that would have occurred if the policy had not been introduced. |
| Green Book | Guidance issued by HMT on how to appraise policies, programmes and projects. It also provides guidance on the design and use of monitoring and evaluation before, during and after implementation. |
| Magenta Book | Guidance issued by HMT on what to consider when designing an evaluation. |
Plastic Packaging Tax terminology
| Term | Definition |
|---|---|
| PPT | Plastic Packaging Tax. Introduced in April 2022, it is an environmental tax designed to incentivise the use of recycled plastic in packaging and consequently reduce the use of new materials to maximise environmental benefits. |
| Plastic packaging | For the purpose of PPT, plastic packaging refers to finished packaging components that are manufactured in, or imported into, the UK and placed on the UK market. A packaging component is generally considered plastic if plastic is the predominant material by weight. |
| Environmental tax | A tax that is designed, at least in part, to encourage behavioural change that reduces environmental harm or improves environmental outcomes. |
| Tax base | The amount of economic activity upon which a tax is levied. For PPT, the tax base is the volume of in-scope plastic packaging manufactured in or imported into the UK that is liable to be declared under the tax. |
| Circular economy | An economic system that aims to minimise waste and maximise the reuse, repair, refurbishment and recycling of materials and products. |
| Economic incentive | A financial reward or cost that influences the decisions and behaviour of individuals or businesses. In the context of environmental taxes, economic incentives encourage less harmful behaviours by making more harmful activities less financially attractive. |
| Economic incidence | The individuals, businesses, or groups that ultimately bear the cost of a tax, regardless of who is legally responsible for paying it. |
| Statutory incidence | The individual or organisation that is legally responsible for paying a tax. |
| Pass-through | The extent to which a business transfers the cost of a tax to other businesses or consumers through higher prices. |
| Market failure | A situation where market prices do not fully reflect the social costs or benefits associated with an activity, leading to inefficient outcomes. |
| Tax rate | The amount of PPT charged per tonne of chargeable plastic packaging. The tax rate is set by the government and determines the cost applied to plastic packaging that falls below the recycled content threshold. |
| Recycled content threshold | The minimum proportion of recycled plastic required in a plastic packaging component to avoid a PPT charge. Under PPT, plastic packaging containing at least 30 per cent recycled plastic is not chargeable to the tax. |
| De minimis threshold | A minimum activity level below which a business is not required to register for or pay a tax. For PPT, businesses only need to register if they manufacture or import 10 tonnes or more of plastic packaging within a 12-month period. |
| Virgin plastic | Plastic made from new, raw materials rather than recycled material. Virgin plastic is typically produced from fossil fuel feedstocks. |
| Recycled plastic | Plastic made from material that has previously been used and has been recovered and reprocessed for further use. |
| Single-use plastic | A plastic product or packaging item that is designed to be used once, or for a short period of time, before being discarded or recycled. Single-use plastics include many forms of plastic packaging used to contain, protect, or transport goods. |
| Manufacturer | A business that produces finished plastic packaging components in the UK. |
| Importer | A business that imports finished plastic packaging components, or goods containing plastic packaging components, into the UK. |
| Supply chain | The network of businesses involved in producing, transporting and selling a good or service, from raw materials to the final consumer. |
| Recycling rate | The proportion of waste material that is collected and processed for reuse rather than being disposed of through landfill, incineration or other methods. |
| Recycled content | The proportion of a plastic packaging component that is made from recycled plastic material, expressed as a percentage of the total plastic content. |
| Polymer | A material made up of long chains of repeating molecular units. Common plastic polymers used in packaging include polyethylene terephthalate (PET), polypropylene (PP), high-density polyethylene (HDPE), low-density polyethylene (LDPE), and polystyrene (PS). |
| High-Density Polyethylene (HDPE) | A commonly used plastic polymer that is widely used in packaging applications such as bottles and containers. HDPE can be manufactured using recycled material and is often recycled through established collection systems. |
| Low-Density Polyethylene (LDPE) | A plastic polymer commonly used in flexible packaging, films, and bags. The technical and economic feasibility of incorporating recycled content may differ from other polymer types. |
| Polyethylene Terephthalate (PET) | A plastic polymer widely used in products such as drinks bottles and food packaging. PET typically has relatively well-established recycling streams and a greater availability of recycled material than some other polymers. |
| Polypropylene (PP) | A widely used plastic polymer found in a variety of packaging applications. The availability and use of recycled polypropylene can vary depending on product requirements and recycling infrastructure. |
| Polystyrene (PS) | A plastic polymer used in a range of packaging applications. Businesses using PS may face technical, cost, or supply constraints when incorporating recycled material. |
| UK Plastics Pact (UKPP) | A voluntary initiative coordinated by WRAP that brings together businesses, governments and organisations to improve the sustainability of plastic packaging, including increasing recycled content, improving recyclability and reducing plastic waste. |
| Extended Producer Responsibility for Packaging (pEPR) | A UK packaging regulation that requires producers to fund the costs of managing packaging waste, including its collection, sorting, recycling and disposal. The scheme aims to encourage businesses to reduce packaging waste and use packaging that is easier to recycle. |