Plastic Packaging Tax Evaluation: technical annexes
Published 28 October 2026

© Crown copyright 2026
This publication is licensed under the terms of the Open Government Licence v3.0 except where otherwise stated. To view this licence, visit nationalarchives.gov.uk/doc/open-government-licence/version/3 or write to the Information Policy Team, The National Archives, Kew, London TW9 4DU, or email: psi@nationalarchives.gov.uk.
Where we have identified any third party copyright information you will need to obtain permission from the copyright holders concerned.
This publication is available at https://www.gov.uk/government/publications/plastic-packaging-tax-evaluation/plastic-packaging-tax-evaluation-technical-annexes
Annex B: Technical methodologies
This annex provides further technical detail on the analytical approaches used in Chapter 4 and Chapter 7 of the PPT evaluation. It sets out any analytical methods or statistical tests and modelling assumptions used to support the findings in the main report.
The annex is intended to provide additional transparency on how the analysis was undertaken. The methods set out below should not be interpreted as producing definitive causal estimates of the impact of PPT. As stated throughout the evaluation, observed changes may also reflect wider market conditions, business-specific environmental commitments, wider government policy and other factors affecting business behaviour over the same period.
Where statistical testing is used, this is intended to assess whether observed differences between groups are unlikely to have arisen through sampling variation alone. Statistical significance does not, on its own, demonstrate that PPT caused the observed differences. The statistical analysis primarily uses non-parametric methods because the distribution of recycled-content measures was highly skewed and did not meet the assumptions required for parametric tests. Statistical significance was assessed at the 5% level throughout, with results considered statistically significant where p-values were below 0.05.
The supporting analysis for Chapter 5 is included in Annex C.
B.1 Chapter 4: Change in the use of recycled and virgin plastic packaging
Chapter 4 uses HMRC administrative data to examine how reported plastic packaging volumes have changed since the introduction of PPT. The analysis focuses on the proportion of plastic packaging reported as containing at least 30% recycled content and the overall amount of plastic packaging manufactured or imported by businesses registered for PPT.
PPT administrative returns record whether plastic packaging is above or below the 30% recycled content threshold. They do not require recording the precise level of recycled content in finished plastic packaging components. This limits the extent to which the analysis can observe actual changes in recycled content, whether below or above the threshold.
The proportion of plastic packaging reported above the 30% recycled content threshold was calculated for each business in each financial year. The analysis was restricted to businesses that reported handling plastic packaging in both financial year 2022 to 2023 and financial year 2025 to 2026, allowing changes to be assessed across the full observation period.
The proportion of plastic packaging reported above the 30% recycled content threshold varied across financial years, with the main difference observed between 2022 to 2023 and the later years, while levels were broadly stable thereafter. Statistical testing also indicated differences between years; however, as the same businesses were observed across financial years, the independence assumption underlying these tests is unlikely to be met. The results of the statistical tests should therefore be interpreted with caution and are treated as supporting, rather than conclusive, evidence of differences over time.
When trying to determine if businesses had changed their position over time, the analysis classified each business according to the direction of change in the proportion of packaging reported above the threshold between financial years 2022 to 2023 and 2025 to 2026. Businesses were categorised into the 4 groups:
-
increased: the proportion above the threshold increased in each successive financial year
-
decreased: the proportion above the threshold decreased in each successive financial year
-
unchanged: the proportion remained constant throughout the observation period (most likely remaining at 0%)
-
fluctuated: the proportion both increased and decreased across different financial years
For businesses classified as Fluctuated, a straight-line slope was calculated using the annual proportion of the business’s plastic packaging meeting the 30% recycled content threshold. This was used to identify the overall direction of change across the period rather than relying only on a comparison between the first and final financial years. Fluctuating businesses were classified as:
-
overall increase where the slope was greater than +0.5 percentage points per year
-
overall decrease where the slope was less than -0.5 percentage points per year
-
no overall change where the slope was between -0.5 and +0.5 percentage points per year
The tolerance was used so that very small positive or negative movements were treated as showing no meaningful overall change. This classification distinguishes businesses with an overall increasing or decreasing trend from those whose annual values fluctuated but remained broadly flat across the period. The results were considered alongside survey findings on businesses’ self-reported changes in recycled content.
B.2 Chapter 7: Environmental impacts
Chapter 7 uses Defra packaging waste statistics, WasteDataFlow data, WRAP data and an emissions model to examine whether changes in recycled content and plastic packaging use are associated with wider environmental outcomes. The analysis focuses on recycling rates, plastic waste collected for recycling, plastic packaging waste arising, the composition of plastic waste and estimated greenhouse gas emissions.
The emissions analysis used a model developed by HMRC to estimate the greenhouse gas emissions associated with plastic packaging in scope of PPT. HMRC’s administrative data provides information on packaging volumes falling above and below the 30% recycled content threshold. The emissions model combines these volumes with emissions conversion factors for primary material production and closed-loop recycling systems. Different factors are applied to packaging reported above and below the threshold, alongside assumptions about the average recycled content within each group. This allows an estimate of the greenhouse gas emissions associated with upstream material production for plastic packaging in scope of the tax.
The model includes plastic packaging reported to HMRC that falls above and below the 30% recycled content threshold. Medically exempt packaging and exported plastic packaging are excluded from the emissions analysis as they are outside the scope of PPT.
The UK government’s Greenhouse gas reporting: conversion factors were used to convert packaging volumes into estimated emissions. The model applies an average plastics material production conversion factor to packaging falling below the 30% recycled content threshold and a weighted conversion factor to packaging falling above the threshold. These factors measure the cradle-to-gate emissions associated with producing materials, including extraction, processing, manufacturing and transport to the point of sale. For recycled materials, the conversion factors capture emissions associated with the collection, sorting, reprocessing and manufacture of recycled inputs.
The counterfactual scenario is based on the parameters of the PPT revenue forecasting model developed and maintained by the Office for Budget Responsibility (OBR) and HMRC. The model is driven by Real Consumer Expenditure (CREAL) and an underlying trend term intended to capture broader changes in packaging composition over time. To estimate the impact of PPT, this underlying trend is adjusted to isolate behavioural changes that can reasonably be attributed to the tax.
As discussed in Chapter 4, administrative data indicates that around one quarter of businesses showed signs of increasing recycled content following the introduction of PPT. Similarly, quantitative survey findings suggest that between a quarter and a third of businesses increased recycled content or reduced the amount of plastic packaging they placed on the market as a result of the tax. These findings were used to inform the scaling of the underlying trend assumption and derive an estimate of the behavioural change attributable to PPT.
Central, low and high scenarios are used to reflect uncertainty around the scale of this behavioural response. These scenarios provide a range of estimates for the amount of plastic packaging that would have fallen above and below the recycled-content threshold, and for the overall level of plastic packaging that would have been placed on the market in the absence of PPT.
The analysis captures both increased recycled content and a small reduction in plastic packaging use resulting from substitution away from plastic. Specifically, emissions savings are estimated by comparing the emissions associated with recycled plastic used in packaging with the emissions that would have occurred had the equivalent quantity of virgin plastic been used instead.
These estimates relate to upstream material production emissions only and do not capture downstream impacts associated with the use, disposal or recycling of packaging at end of life. The results should therefore be interpreted as an estimate of changes in embodied production emissions arising from increased recycled content, rather than a measure of the total lifecycle emissions impact of plastic packaging.
The emissions model is sensitive to assumptions regarding the underlying trend in plastic packaging and the proportion of businesses whose behavioural changes are attributable to PPT. The low, central and high scenarios are intended to reflect uncertainty around these assumptions. The results therefore provide HMRC’s best estimate of the potential emissions impact associated with observed changes in packaging composition. However, a definitive emissions impact is not possible to demonstrate.
Table B.1 presents the low, central and high emissions scenarios used in the analysis.
Table B.1: Counterfactual emissions scenarios used in the emissions analysis.
Numbers are rounded to 2 decimal places. MtCO2e stands for million tonnes of carbon dioxide equivalent. Source: HMRC.
Table B.1.1: Emissions above 30% threshold
| Counterfactual emissions scenarios (MtCO2e) | 2022-23 | 2023-24 | 2024-25 | 2025-26 |
|---|---|---|---|---|
| Low | 3.49 | 3.50 | 3.43 | 3.40 |
| Central | 3.51 | 3.51 | 3.45 | 3.41 |
| High | 3.53 | 3.53 | 3.47 | 3.43 |
Table B.1.2: Emissions below 30% threshold
| Counterfactual emissions scenarios (MtCO2e) | 2022-23 | 2023-24 | 2024-25 | 2025-26 |
|---|---|---|---|---|
| Low | 4.62 | 4.47 | 4.80 | 4.37 |
| Central | 4.65 | 4.54 | 4.92 | 4.53 |
| High | 4.67 | 4.61 | 5.03 | 4.68 |
Table B.1.3: Total emissions
| Counterfactual emissions scenarios (MtCO2e) | 2022-23 | 2023-24 | 2024-25 | 2025-26 |
|---|---|---|---|---|
| Low | 8.11 | 7.97 | 8.23 | 7.77 |
| Central | 8.15 | 8.06 | 8.36 | 7.95 |
| High | 8.20 | 8.14 | 8.50 | 8.11 |
Table B.1.4: Emissions impact
| Counterfactual emissions scenarios (MtCO2e) | 2022-23 | 2023-24 | 2024-25 | 2025-26 |
|---|---|---|---|---|
| Low | -0.05 | -0.11 | -0.23 | -0.23 |
| Central | -0.09 | -0.19 | -0.37 | -0.41 |
| High | -0.13 | -0.28 | -0.50 | -0.58 |
Annex C: Supporting analysis for Chapter 5
C.1 Overview
This annex provides the detailed analysis underpinning the findings presented in Chapter 5. It supports EQ1 and EQ2 by presenting the full methodological approach, additional statistical outputs, supplementary figures, and detailed findings that have been summarised in the main report.
This annex provides a more comprehensive examination of how patterns of change vary across different types of characteristics within the tax base. The analysis explores differences according to business characteristics, packaging types, plastic material types, and wider business strategies relating to plastic use, helping to explain the factors associated with behavioural responses to PPT.
The analysis covered draws on quantitative and qualitative research commissioned by HMRC, administrative data, and other supporting evidence. It is intended to provide greater transparency regarding the evidence base and analytical methods used to assess changes in the use of recycled and virgin plastic packaging.
C.2 Supporting evidence
C.2.1 Importers vs Manufacturers
In legislative terms, the PPT applies equally to finished plastic packaging manufactured in the UK and to packaging imported into the UK. Liability is determined by whether packaging is placed on the UK market, rather than where it is produced. Despite this symmetry in statutory design, the distinction between importers and domestic manufacturers of plastic packaging is analytically important because the incidence and salience of the PPT can differ across these 2 groups.
Domestic manufacturers may produce plastic packaging components but not necessarily for use in their own products. Instead, they may supply packaging to other UK businesses, which themselves do not directly incur PPT liability when sourcing packaging domestically. In such cases, the behavioural response to the tax depends on the extent to which domestic manufacturers are able to pass the tax on through prices or contractual terms, rather than on direct changes to packaging use by downstream firms.
By contrast, businesses that import packaged goods from overseas are more likely to face the PPT charge directly but may face more limited scope to adjust packaging specifications in the short run due to reliance on overseas suppliers and pre-specified packaging formats. Moreover, there may be greater informational asymmetries when using an overseas supplier, particularly around recycled content. These differences in where liability falls and how adjustment can occur suggest that importers and domestic manufacturers may respond differently to the PPT, making this distinction a meaningful dimension along which to assess heterogeneity in behavioural responses.
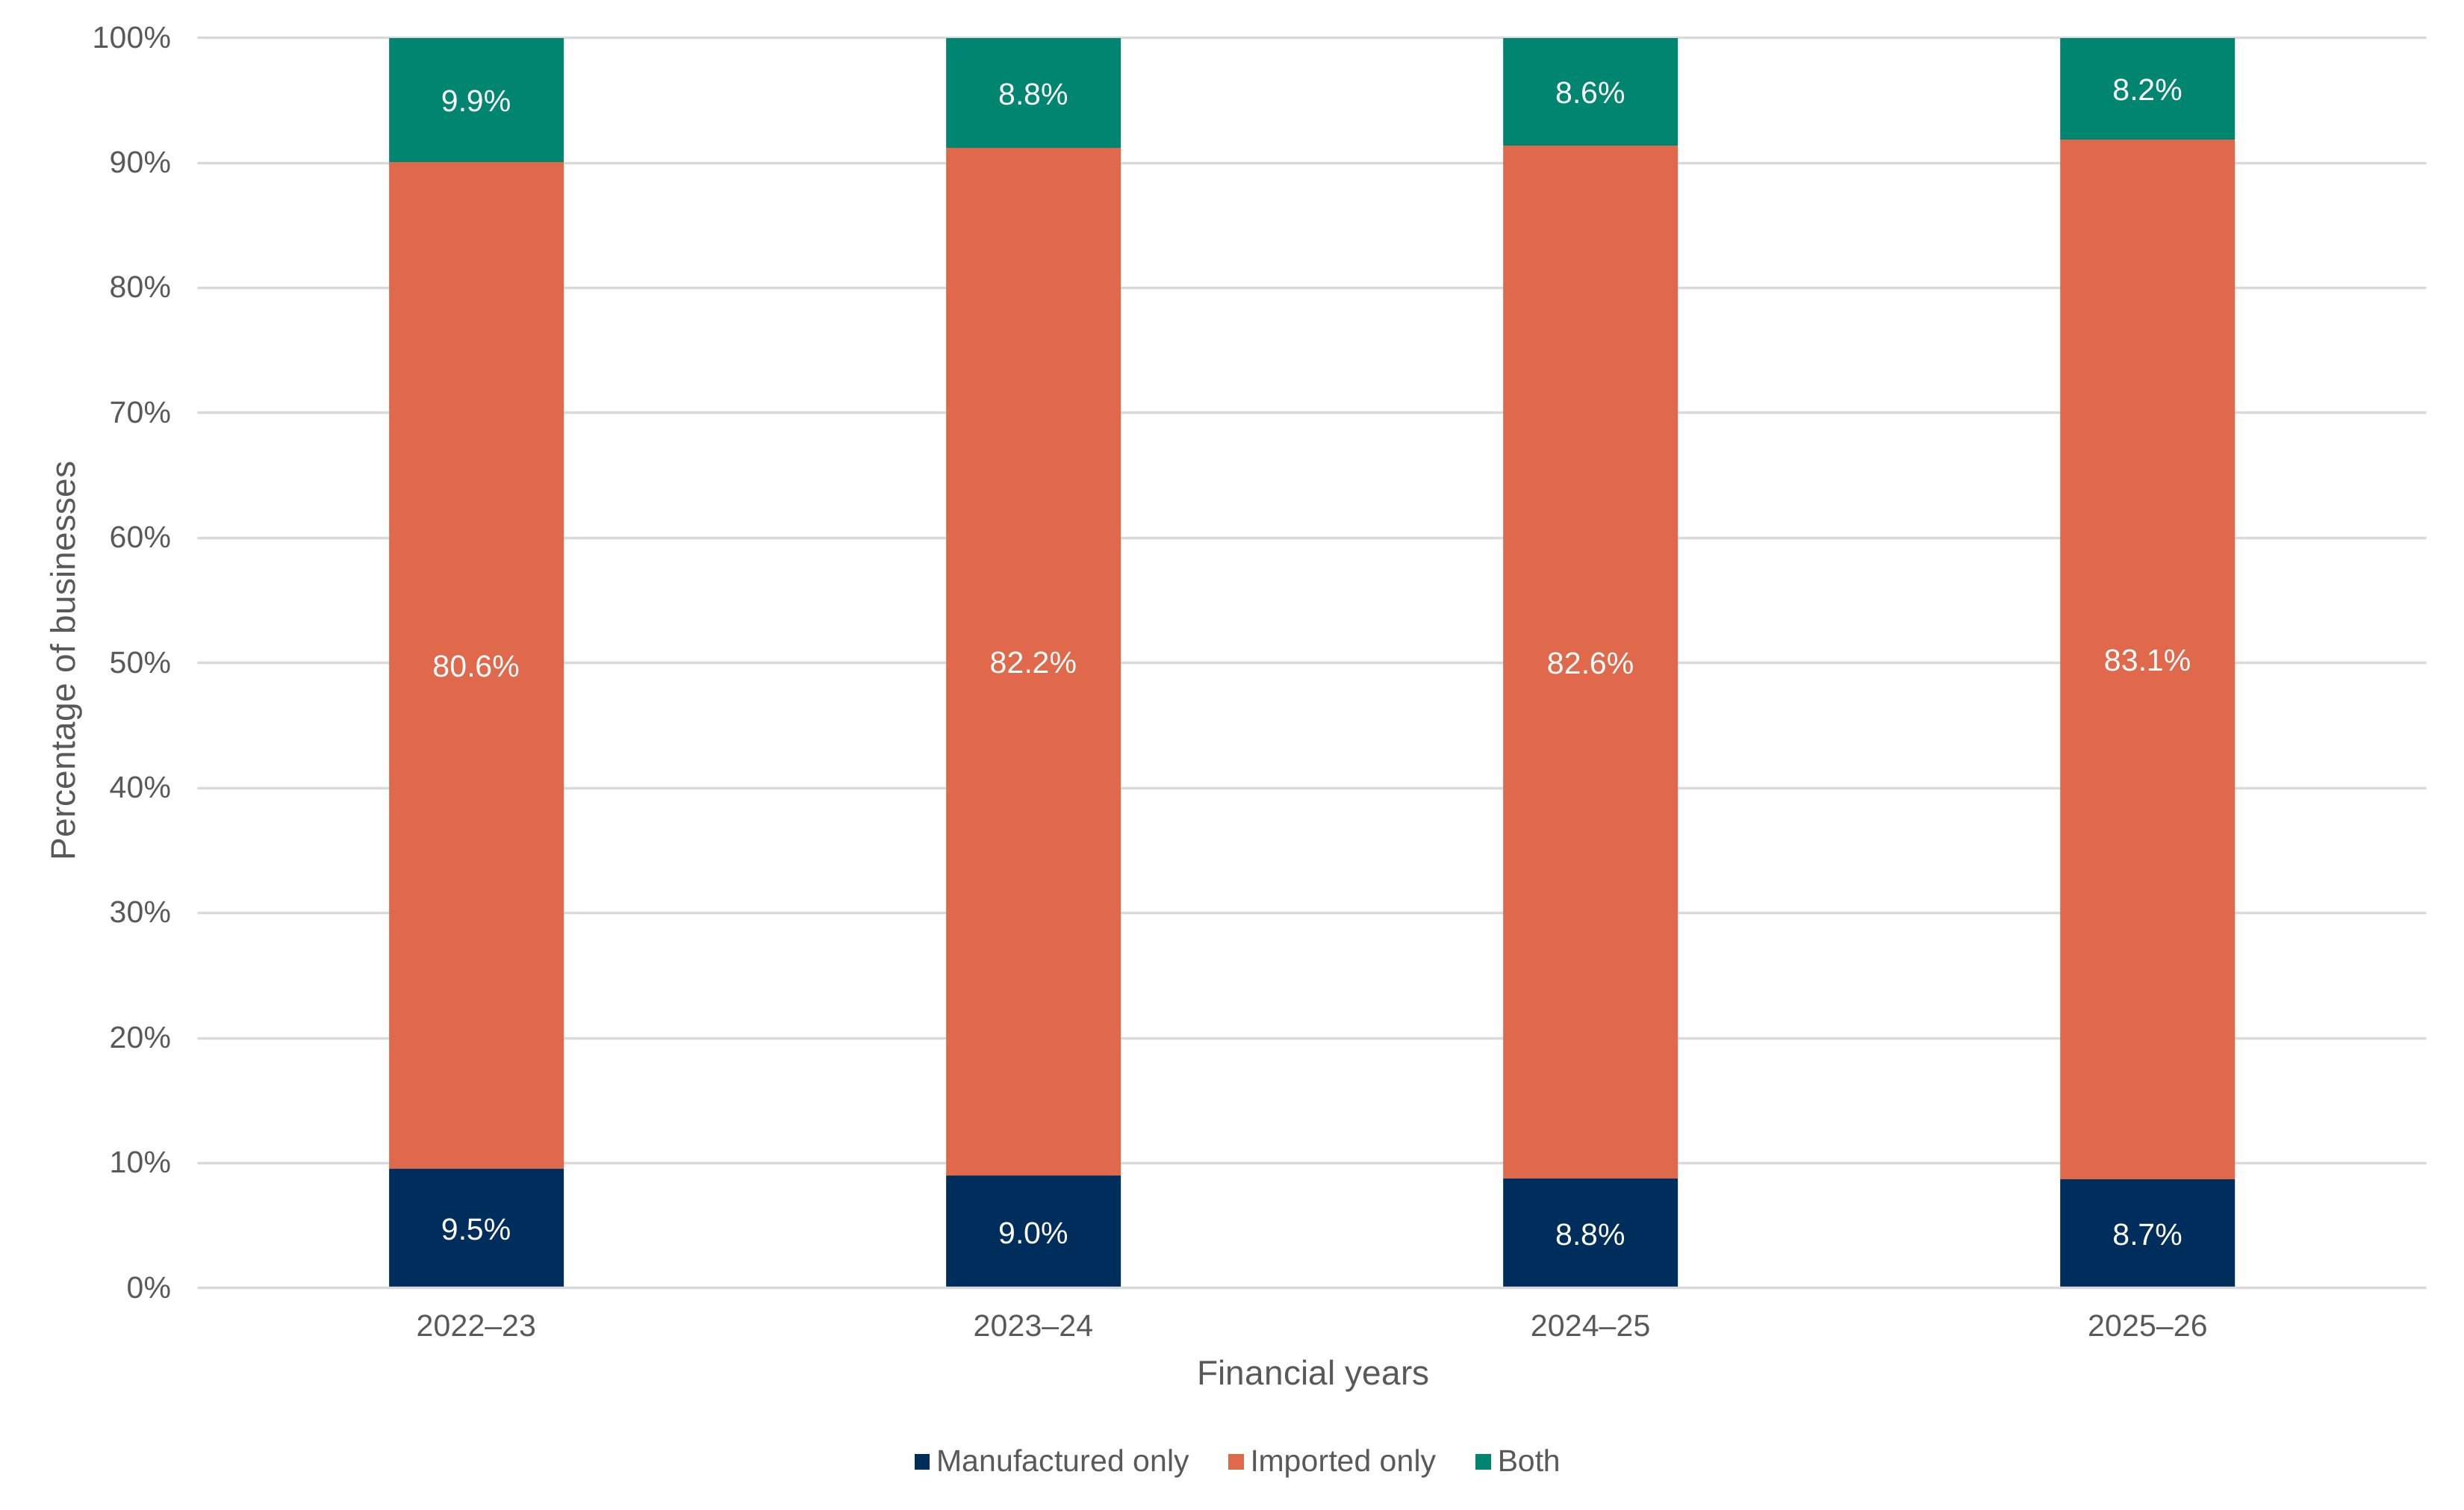
PPT returns require registered businesses to report whether plastic packaging is manufactured in the UK or imported, allowing businesses to be categorised as manufacturers, importers, or both. This provides a basis for assessing whether trends in packaging meeting the 30% recycled content threshold vary across these characteristics. Figure C.1 shows that the registered tax base is predominantly composed of businesses importing plastic packaging.
Figure C.1: Distribution of the PPT tax base by business type.
Manufacturer only, importer only, or businesses that both manufacture and import. Source: HMRC.
Data for Figure C.1: Distribution of the PPT tax base by business type.
Manufacturer only, importer only, or businesses that both manufacture and import). Source: HMRC.
| Financial years | Manufactured only | Imported only | Both |
|---|---|---|---|
| 2022–23 | 9.5% | 80.6% | 9.9% |
| 2023–24 | 9.0% | 82.2% | 8.8% |
| 2024–25 | 8.8% | 82.6% | 8.6% |
| 2025–26 | 8.7% | 83.1% | 8.2% |
Moreover, in the quantitative social research undertaken, the sample was made up of 81% importers, aligning closely with the tax base (highlighted in Figure C.1). Given the central role of importers within the tax base, the characteristics of these businesses are likely to play a particularly important role in determining the aggregate behavioural response to the tax. As a result, the extent to which PPT incentivises increased use of recycled content will depend to a large degree on how importers are able and willing to adjust their packaging choices in response to the tax.
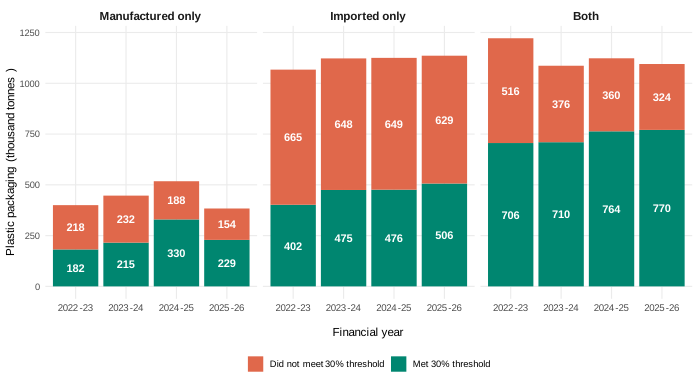
Figure C.2: Plastic packaging handled above and below the 30% recycled content threshold, by business type.
Manufacturer only, importer only, or businesses that both manufacture and import. Source: HMRC.
Data for Figure C.2: Plastic packaging handled above and below the 30% recycled content threshold, for manufacturers only.
| Business type | Financial year | Met 30% threshold (million tonnes) | Did not meet 30% threshold (million tonnes) |
|---|---|---|---|
| Manufactured only | 2022–23 | 181.9 | 218.1 |
| Manufactured only | 2023–24 | 215.4 | 231.5 |
| Manufactured only | 2024–25 | 329.7 | 188.0 |
| Manufactured only | 2025–26 | 229.0 | 154.5 |
Data for Figure C.2: Plastic packaging handled above and below the 30% recycled content threshold, for importers only.
| Business type | Financial year | Met 30% threshold (million tonnes) | Did not meet 30% threshold (million tonnes) |
|---|---|---|---|
| Imported only | 2022–23 | 401.8 | 665.4 |
| Imported only | 2023–24 | 474.7 | 647.8 |
| Imported only | 2024–25 | 476.1 | 649.0 |
| Imported only | 2025–26 | 506.4 | 629.4 |
Data for Figure C.2: Plastic packaging handled above and below the 30% recycled content threshold, for both only.
| Business type | Financial year | Met 30% threshold (million tonnes) | Did not meet 30% threshold (million tonnes) |
|---|---|---|---|
| Both | 2022–23 | 705.8 | 515.9 |
| Both | 2023–24 | 709.9 | 376.5 |
| Both | 2024–25 | 763.5 | 359.5 |
| Both | 2025–26 | 770.5 | 324.4 |
Figure C.2 presents the tonnage of plastic packaging above and below the 30% recycled content threshold, by the manufacturer-importer split. Despite only 8 to 10% of businesses being both manufacturers and importers, these types of businesses account for 49 to 55% of plastic packaging that contains 30% or more recycled plastic. Manufacture-only businesses make up 9 to 10% of businesses and produce around 14 to 21% of plastic packaging over the 30% recycled content threshold. Import-only businesses, which make up 80 to 83% of registered businesses account for 30 to 34% of plastic packaging with at least 30% recycled content.
Table C.1: Business-level and packaging-level measures of packaging above the 30% recycled content threshold, by business type.
Manufacturer only, importer only, or businesses that both manufacture and import). Source: HMRC.
| Business Category | Measure | 2022-23 | 2023-24 | 2024-25 | 2025-26 |
|---|---|---|---|---|---|
| All | Number of businesses in category | 3,944 | 4,136 | 4,158 | 4,121 |
| All | Average proportion of packaging above the threshold across businesses in category | 20.6% | 22.2% | 23.6% | 24.5% |
| All | Median proportion of packaging above the threshold across businesses in category | 0.0% | 0.0% | 0.0% | 0.0% |
| All | Proportion of total packaging in category above the threshold | 48.0% | 52.7% | 56.7% | 57.6% |
| Manufacturer | Number of businesses in category | 376 | 373 | 366 | 360 |
| Manufacturer | Average proportion of packaging above the threshold across businesses in category | 30.7% | 31.8% | 32.4% | 34.0% |
| Manufacturer | Median proportion of packaging above the threshold across businesses in category | 0.0% | 0.3% | 0.6% | 2.2% |
| Manufacturer | Proportion of total packaging in category above the threshold | 45.5% | 48.2% | 63.7% | 59.7% |
| Importer | Number of businesses in category | 3,177 | 3,400 | 3,433 | 3,425 |
| Importer | Average proportion of packaging above the threshold across businesses in category | 18.5% | 20.4% | 22.0% | 22.9% |
| Importer | Median proportion of packaging above the threshold across businesses in category | 0.0% | 0.0% | 0.0% | 0.0% |
| Importer | Proportion of total packaging in category above the threshold | 37.7% | 42.3% | 42.3% | 44.6% |
| Both Manufacturer and Importer | Number of businesses in category | 391 | 363 | 359 | 336 |
| Both Manufacturer and Importer | Average proportion of packaging above the threshold across businesses in category | 28.0% | 28.4% | 29.8% | 30.7% |
| Both Manufacturer and Importer | Median proportion of packaging above the threshold across businesses in category | 3.1% | 2.1% | 5.5% | 7.0% |
| Both Manufacturer and Importer | Proportion of total packaging in category above the threshold | 57.8% | 65.3% | 68.0% | 70.4% |
Table C.1 presents complementary business-level and packaging-level measures of plastic packaging reported above the 30% recycled content threshold, split by whether registered businesses reported manufacturing plastic packaging, importing plastic packaging, or both activities. While the main chapter focuses on the proportion of total packaging moving above the threshold, the additional measures presented here provide further insight into how these outcomes are distributed across businesses within each category.
Three measures are presented. First, the average proportion of packaging above the threshold across businesses in a category, which gives equal weight to each business irrespective of the volume of packaging it handles. Second, the median proportion above the threshold, which represents the middle business in the distribution and is therefore less affected by a small number of businesses reporting particularly high proportions of packaging above the threshold. Third, the proportion of total packaging in a category above the threshold, which gives greater weight to businesses reporting larger packaging volumes and therefore reflects the composition of packaging rather than the distribution of outcomes across businesses.
The comparison between these measures provides insight into whether packaging meeting the recycled content threshold is broadly distributed across businesses or concentrated amongst a subset of firms. Large differences between the business-level measures and the packaging-level measure indicate that businesses reporting larger packaging volumes account for a disproportionate share of packaging above the threshold. Conversely, where all 3 measures are more closely aligned, reported packaging above the threshold is likely to be more evenly distributed across the business population.
The results suggest that outcomes vary considerably by business type. Businesses undertaking both manufacturing and importing activities consistently reported the highest proportion of packaging above the threshold, while importer-only businesses reported the lowest. The divergence between the business-level and packaging-level measures is particularly pronounced for importer-only businesses. Although the proportion of total packaging above the threshold increased over the evaluation period, the median importer continued to report no packaging above the threshold throughout. This suggests that improvements within the importer population were concentrated amongst a subset of businesses, particularly those handling larger volumes of packaging, rather than being evenly distributed across the importer population.
These findings highlight the importance of distinguishing between changes occurring at the level of packaging volumes and changes occurring across the wider business population. While aggregate measures indicate a growing share of packaging above the recycled content threshold, business-level measures suggest that progress has been uneven, with substantial variation in outcomes across different groups of liable businesses.
Further analysis was undertaken to explore whether increases in recycled plastic packaging were consistent across business types, by comparing volumes handled and proportions recycled among importers, manufacturers, and businesses undertaking both activities.
A Kruskal–Wallis test indicated statistically significant differences in the distribution of recycled content above the threshold across business types (χ2(2) = 247.64, p < 0.001). To identify where these differences occurred, Dunn’s post‑hoc tests with Bonferroni adjustment were conducted. These showed that importers have statistically significantly lower proportions of packaging above the threshold compared with both manufacturers (Z = -11.52, p < 0.001) and businesses that both import and manufacture (Z = -11.80, p < 0.001). There was no statistically significant difference between manufacturers and businesses that both import and manufacture (Z = 0.27, p = 1.00). This indicates that differences in recycled content above the threshold are driven primarily by lower levels among importers, rather than differences between other business types.
Consequently, the analysis suggests that importers are statistically significantly more likely to report lower proportions of packaging meeting the recycled content threshold compared with manufacturers and businesses that both import and manufacture. There is no clear difference between manufacturers and businesses that both import and manufacture, indicating that these groups share similar patterns in packaging falling above or below the threshold.
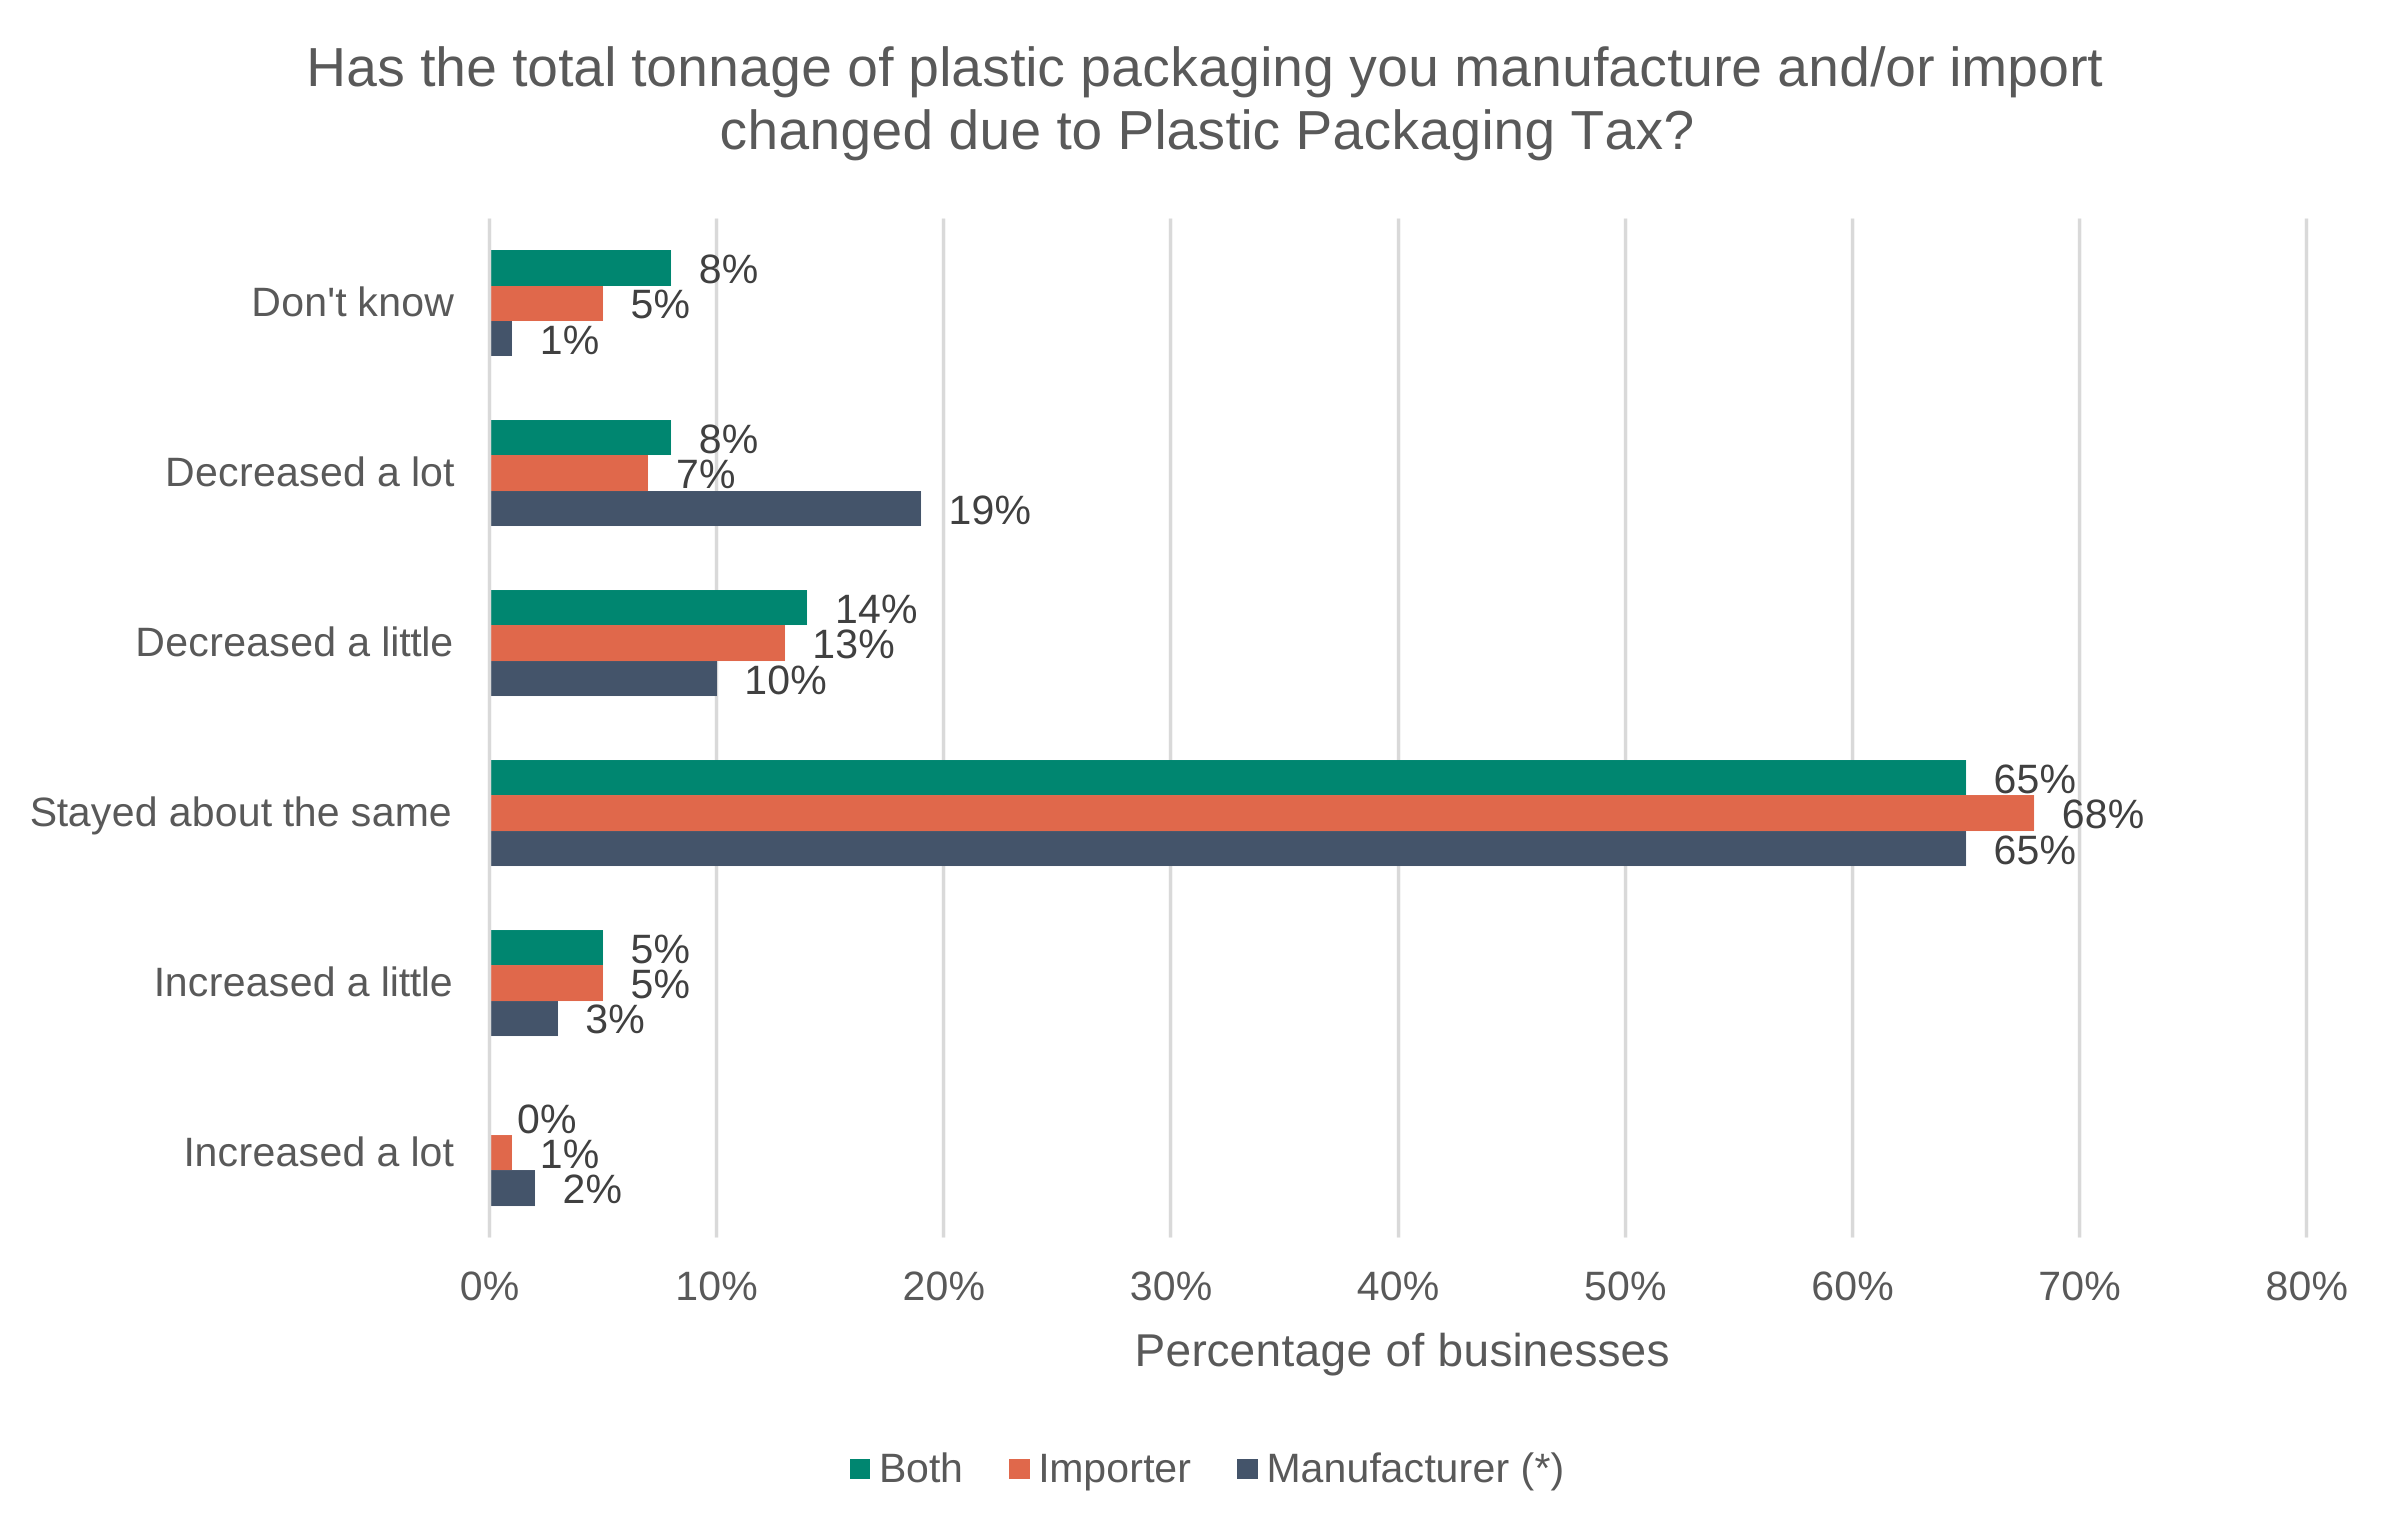
Figure C.3: Survey results for the question ‘Has the total tonnage of plastic packaging you manufacture and/or import changed due to Plastic Packaging Tax?’.
Base: Manufacturer (91 — note), Importer (816), Both (104). Source: Ipsos.
Note: Manufacturers only is a relatively small sample, so results should be taken with caution.
Data for Figure C.3: Survey results for the question ‘Has the total tonnage of plastic packaging you manufacture and/or import changed due to Plastic Packaging Tax?’.
Base: Manufacturer (91 — note), Importer (816), Both (104). Source: Ipsos.
Note: Manufacturers only is a relatively small sample, so results should be taken with caution.
| Category | Manufacturer | Importer | Both |
|---|---|---|---|
| Don’t know | 1% | 5% | 8% |
| Decreased a lot | 19% | 7% | 8% |
| Decreased a little | 10% | 13% | 14% |
| Stayed about the same | 65% | 68% | 65% |
| Increased a little | 3% | 5% | 5% |
| Increased a lot | 2% | 1% | 0% |
There is no strong evidence of systematic differences across business types in the overall direction of change, with manufacturers, importers, and businesses that both manufacture and import all showing similar headline patterns. Figure C.3 shows that, in each group, the majority of respondents reported that total plastic packaging tonnage had stayed about the same (around 2-thirds), and relatively small proportions reported increases.
However, manufacturers only were notably more likely to report large decreases in total tonnage of plastic packaging than other groups. In particular, 19% of manufacturers reported that tonnage had ‘decreased a lot’, compared with 7% and 8% to importers and businesses that do both, respectively. This difference is statistically significant and indicates that, while overall patterns are similar, manufacturers appear more likely to be able to make substantial adjustments to overall amount of plastic packaging used.
Moreover, manufacturers were also somewhat more likely to report any decrease (29%) than importers (21%), although this difference is less pronounced and is not statistically significant. These findings are consistent with those identified in Section 4.4.4 in which businesses that rely on importing plastic packaging ultimately are less willing to change behaviour as they have lower influence over their supply chain.
In Chapter 5, Figure 5.2 demonstrates that manufacturers were more likely than importers to report an increase in the proportion of packaging that was made up of recycled plastic. Almost half of manufacturers (47%) said this proportion had increased (‘a little’ or ‘a lot’), compared with only 28% of importers. Businesses that undertook both manufacturing and importing sat between these 2 groups. Around 2 in 5 (39%) reported an increase overall, while just over half (52%) said the proportion had stayed about the same.
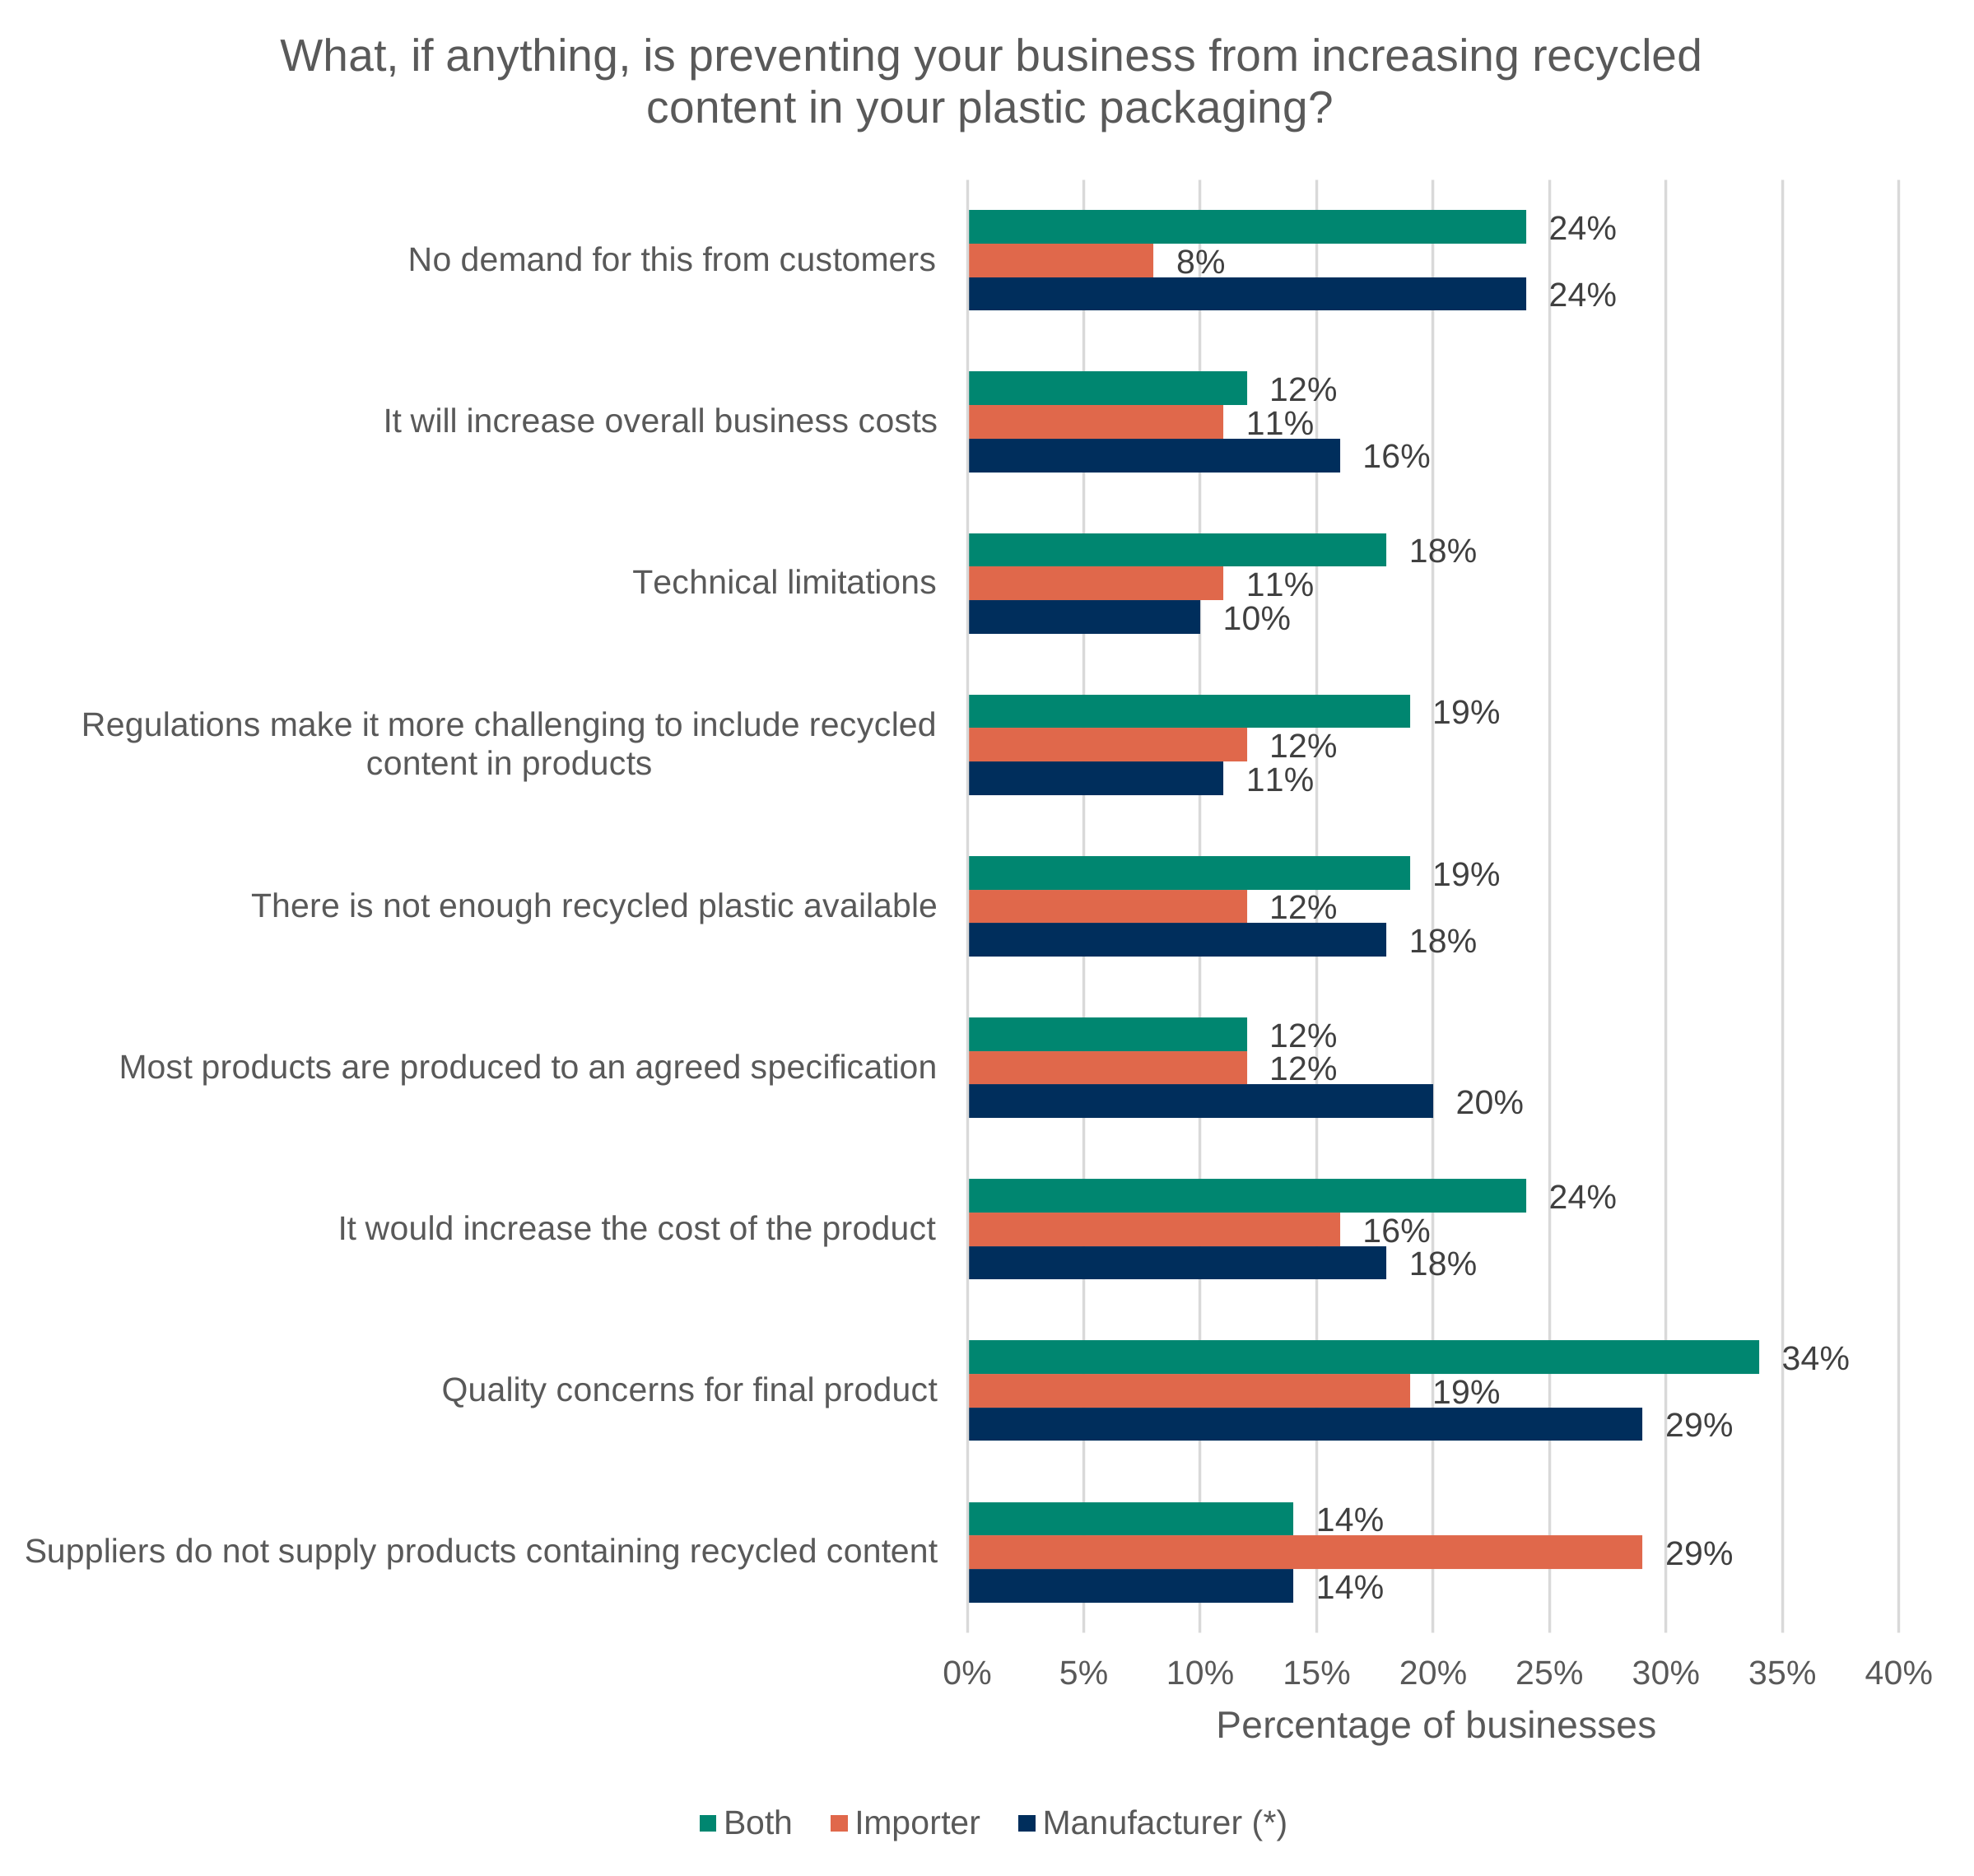
Figure C.4: Most common answers in the survey results for the question ‘What, if anything, is preventing your business from increasing recycled content in your plastic packaging?’.
Base: Manufacturer (91 — note), Importer (816), Both (104). Source: Ipsos.
Note: Manufacturers only is a relatively small sample, so results should be taken with caution.
Data for Figure C.4: Most common answers in the survey results for the question ‘What, if anything, is preventing your business from increasing recycled content in your plastic packaging?’.
Base: Manufacturer (91 — note), Importer (816), Both (104). Source: Ipsos.
Note: Manufacturers only is a relatively small sample, so results should be taken with caution.
| Category | Manufacturer | Importer | Both |
|---|---|---|---|
| No demand for this from customers | 24% | 8% | 24% |
| It will increase overall business costs | 16% | 11% | 12% |
| Technical limitations | 10% | 11% | 18% |
| Regulations make it more challenging to include recycled content in products | 11% | 12% | 19% |
| There is not enough recycled plastic available | 18% | 12% | 19% |
| Most products are produced to an agreed specification | 20% | 12% | 12% |
| It would increase the cost of the product | 18% | 16% | 24% |
| Quality concerns for final product | 29% | 19% | 34% |
| Suppliers do not supply products containing recycled content | 14% | 29% | 14% |
The results of the survey in Figure C.4 demonstrate that the nature and intensity of the most prevalent constraints faced by manufacturers and importers are systematically different within the tax base. Importers were significantly more likely than manufacturers to report that suppliers do not provide products containing recycled content (29% vs 14%). This further suggests that importers’ ability to respond to the tax is more dependent on upstream supply conditions and their willingness to change their supply chain.
Manufacturers were more likely to cite demand-side and specification constraints than supply-side issues. For example, they were more likely to report that there is no demand from customers to use more recycled plastic packaging (24% vs 8% for importers), and that products are produced to fixed specifications (20% vs 12%). This suggests that manufacturers face downstream constraints, where customer requirements and contractual specifications restrict the extent to which recycled content can be incorporated. The higher prevalence of ‘no demand’ among manufacturers also may indicate that, for some firms, the price signal created by PPT may be insufficient to overcome commercial or contractual rigidities in their markets and take the lead in moving to more sustainable packaging.
Quality concerns were more prominent among manufacturers and mixed businesses. Concerns about final product quality were more frequently reported by manufacturers (29%) and businesses involved in both activities (34%), compared to importers alone (19%). This observation suggests that firms with greater involvement in production of plastic packaging are more exposed to technical and reputational risks associated with using recycled materials compared to businesses who depend on other firms for production. These risks may include product performance, safety, or regulatory compliance requirements (for example in food or medical applications), which have similarly been identified in qualitative research as key barriers to substitution.
Cost-related factors (for example ‘increasing product cost’ or ‘overall business costs’) are reported at similar levels across groups, suggesting that cost pressures are broadly shared across the tax base. Moreover, it demonstrates that continuing to use virgin material may still be the most cost-effective approach for some businesses even with the inclusion of the tax, suggesting the price signal may not be strong enough. This was similarly identified in the qualitative research, where some businesses stated that paying the tax was less than the cost of changing their operations.
Overall, the evidence demonstrates that behavioural responses to the PPT are not uniform across the tax base and that the distinction between importers and manufacturers is an important driver of this variation. Statistical testing of the administrative data confirms that these differences are meaningful, with importers having significantly lower proportions of recycled packaging than both manufacturers and businesses undertaking both activities. In contrast, the quantitative research shows that manufacturers are more likely to report increases in recycled content and, to a lesser extent, reductions in overall plastic packaging tonnage, suggesting they are relatively better able to adjust their production processes and material inputs.
These differences appear to be underpinned by structural asymmetries in how firms interact with supply chains and customers. Importers face more upstream constraints, particularly the availability of plastic packaging meeting the recycled content threshold from overseas suppliers and suggesting limited autonomy over packaging specifications. This difference appears to limit their ability to respond to the tax in the short run, even where incentives are present. By contrast, manufacturers face more downstream and production-related constraints, including customer demand, product specifications, and quality considerations, which can limit the extent of change but still allow greater scope for adjustment through redesign or process changes.
Importantly, while cost pressures are widely reported across both groups, they do not appear to be the primary factor differentiating behaviour. Instead, the findings suggest that non-price constraints — particularly supply availability, technical feasibility, and demand-side rigidities — play a central role in shaping responses to the tax. This implies that the effectiveness of the PPT as a behavioural lever depends not only on the strength of the price signal, but also on the extent to which businesses are able, or are willing, to act on that signal within their operating environment.
Given that importers make up the majority of the tax base, these findings are particularly consequential for the overall effectiveness of the policy. The aggregate impact of the PPT on increasing recycled content is therefore likely to be heavily influenced by the extent to which supply-side conditions evolve, including the availability of recycled-content packaging and the responsiveness of global supply chains.
C.2.2 Variation by packaging type
Variation in the type of plastic packaging products manufactured or imported by businesses may be an important factor in understanding behavioural responses to PPT. Different product categories are subject to distinct technical, regulatory and commercial constraints, which may affect the feasibility, cost, and speed of increasing recycled content or reducing overall plastic usage. Some packaging types may face higher quality or safety requirements, limiting the availability of suitable recycled material, while others may have greater flexibility to substitute materials or redesign products.
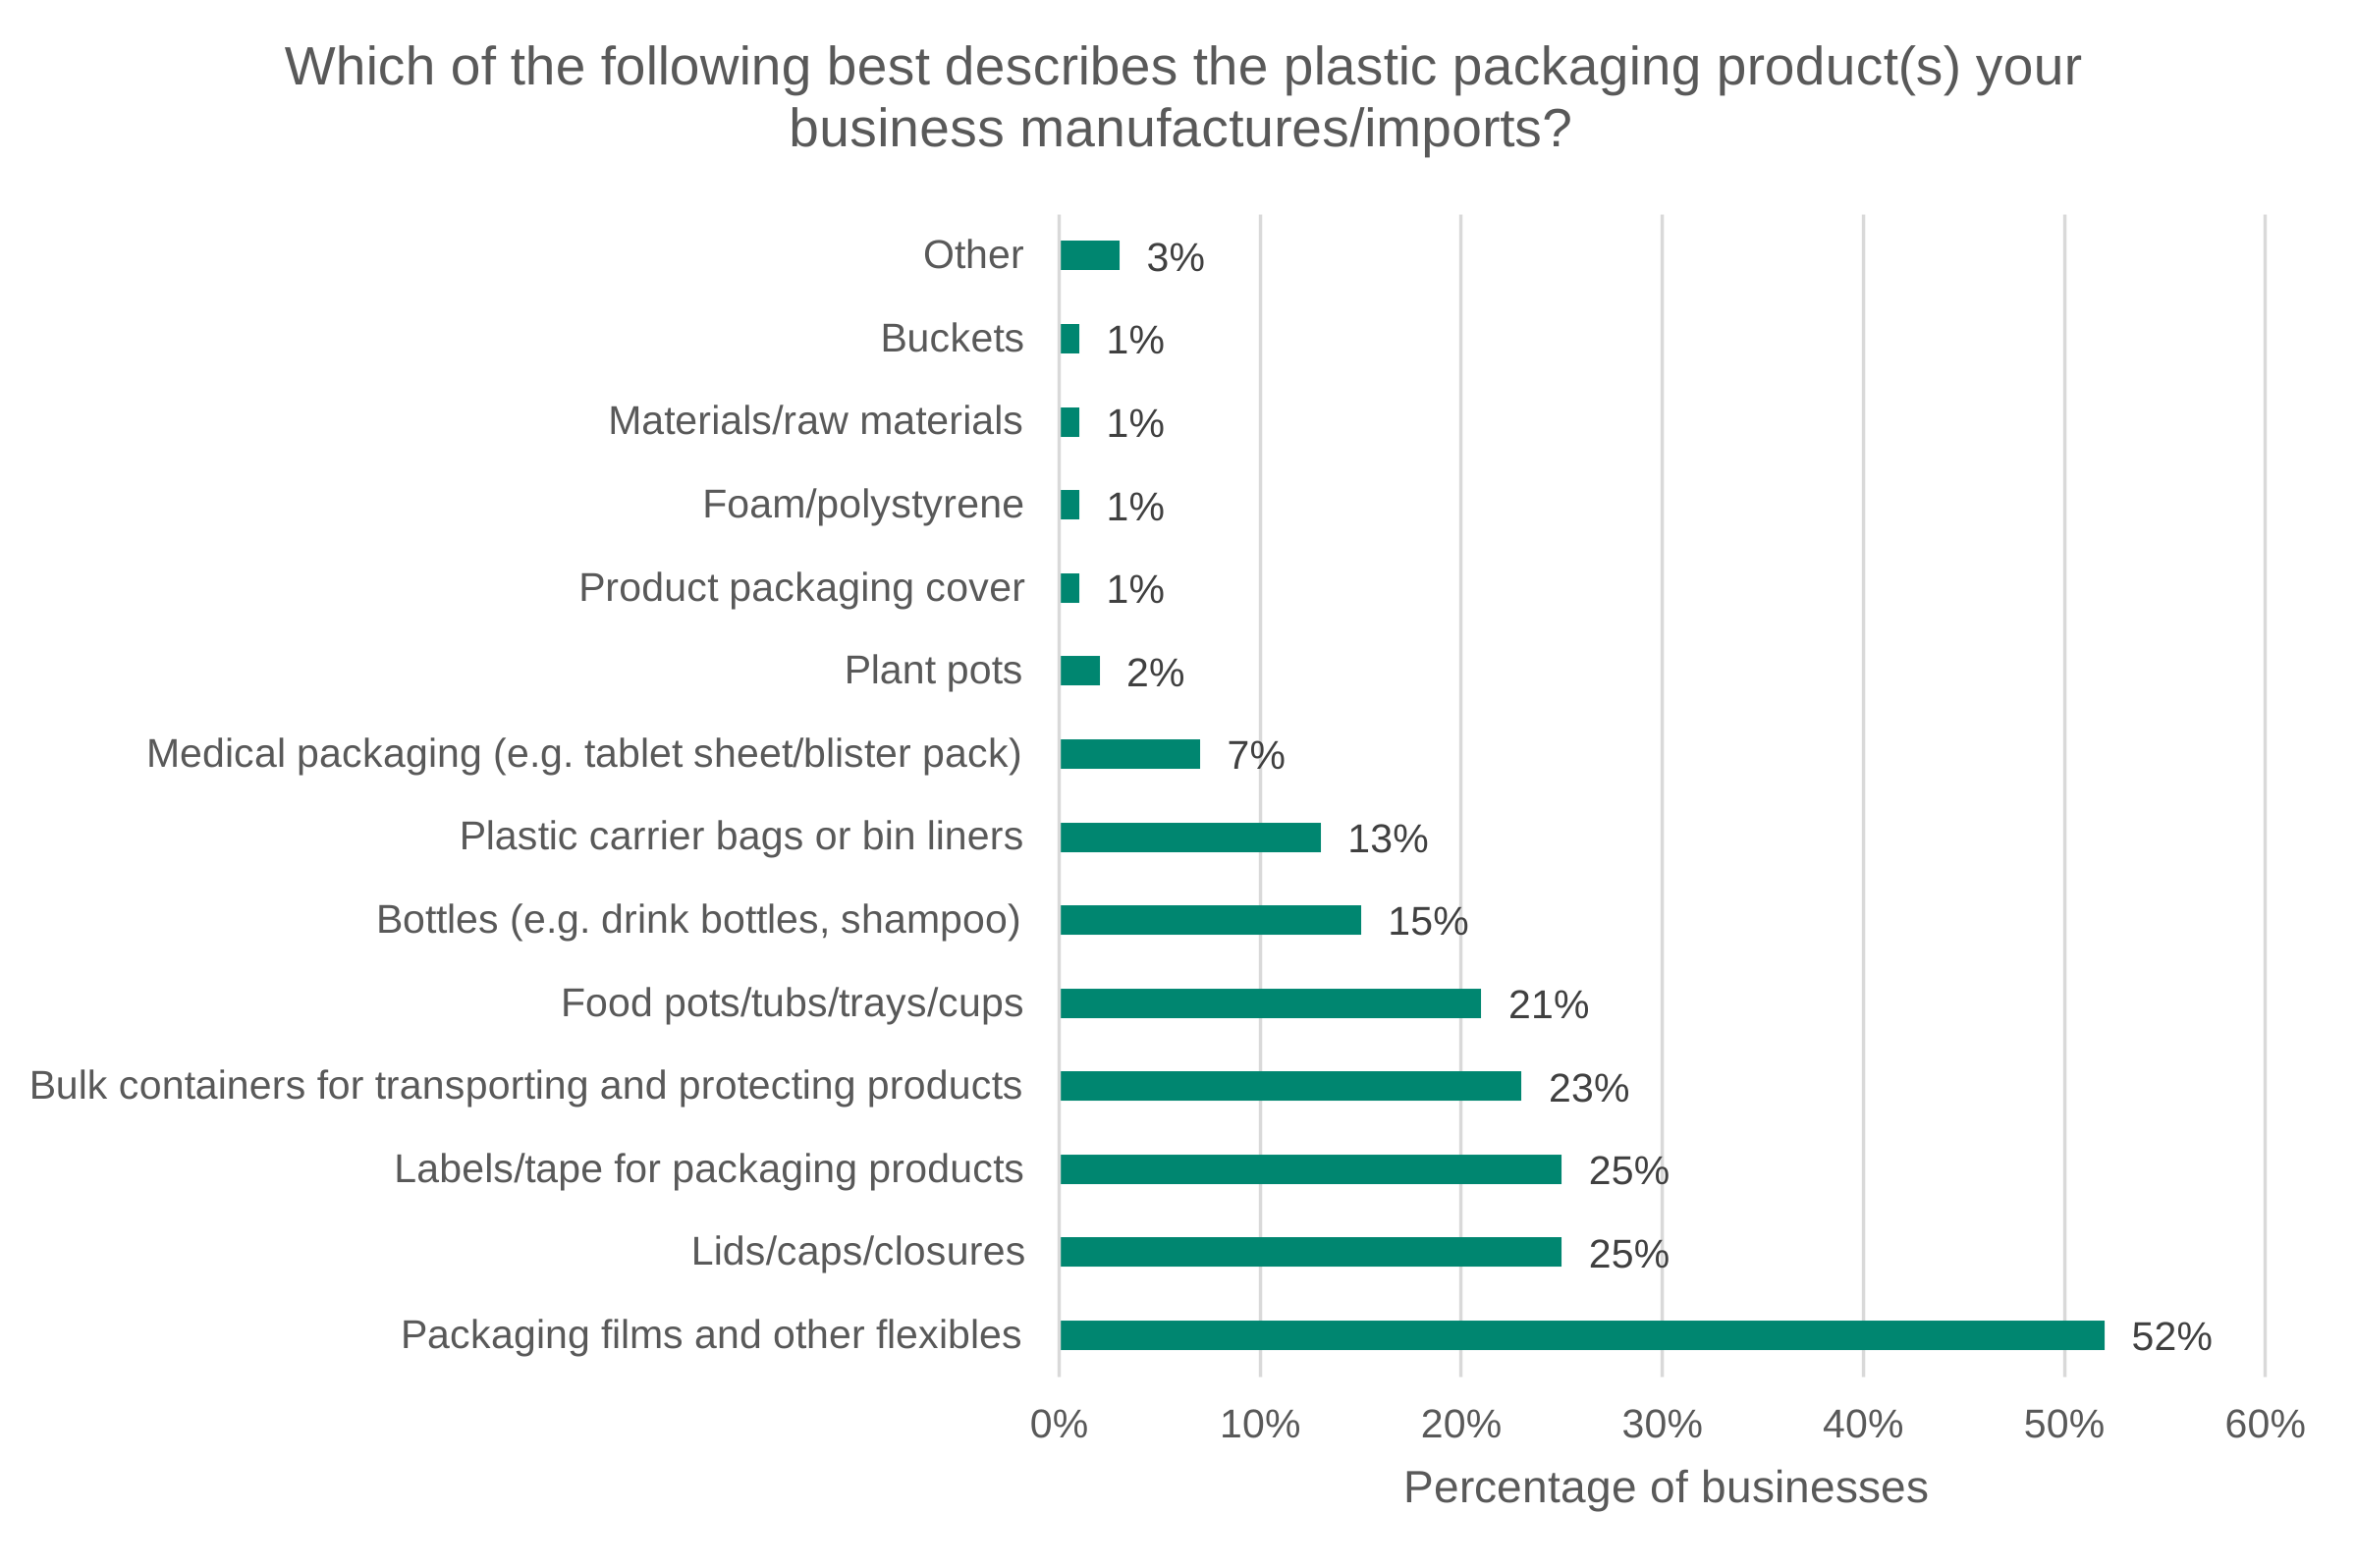
Figure C.5: Survey results for the question ‘Which of the following best describes the plastic packaging product(s) your business manufactures/imports?’.
The base for this question was 1,011. Source: Ipsos.
Data for Figure C.5: Survey results for the question ‘Which of the following best describes the plastic packaging product(s) your business manufactures/imports?’.
The base for this question was 1,011. Source: Ipsos.
| Category | Percentage of businesses |
|---|---|
| Other | 3% |
| Buckets | 1% |
| Materials/raw materials | 1% |
| Foam/polystyrene | 1% |
| Product packaging cover | 1% |
| Plant pots | 2% |
| Medical packaging (for example tablet sheet/blister pack) | 7% |
| Plastic carrier bags or bin liners | 13% |
| Bottles (for example drink bottles, shampoo) | 15% |
| Food pots/tubs/trays/cups | 21% |
| Bulk containers for transporting and protecting products | 23% |
| Labels/tape for packaging products | 25% |
| Lids/caps/closures | 25% |
| Packaging films and other flexibles | 52% |
Figure C.5 shows the distribution of self-reported plastic packaging product types among surveyed businesses. The most commonly reported category is packaging films and other flexible packaging, reported by 52% of businesses. Other widely represented categories include lids, caps and closures (25%), labels and tape (25%), and bulk containers used for transporting and protecting goods (23%).
The distribution suggests that the surveyed population is concentrated in flexible packaging and associated components, with a longer tail of more specialised product types. This variation is likely to be relevant when interpreting differences in behaviour across businesses, as the opportunities to increase recycled content or reduce plastic usage may differ across these product categories. Moreover, some of the smaller product types produce subsets too small to determine meaningful results from.
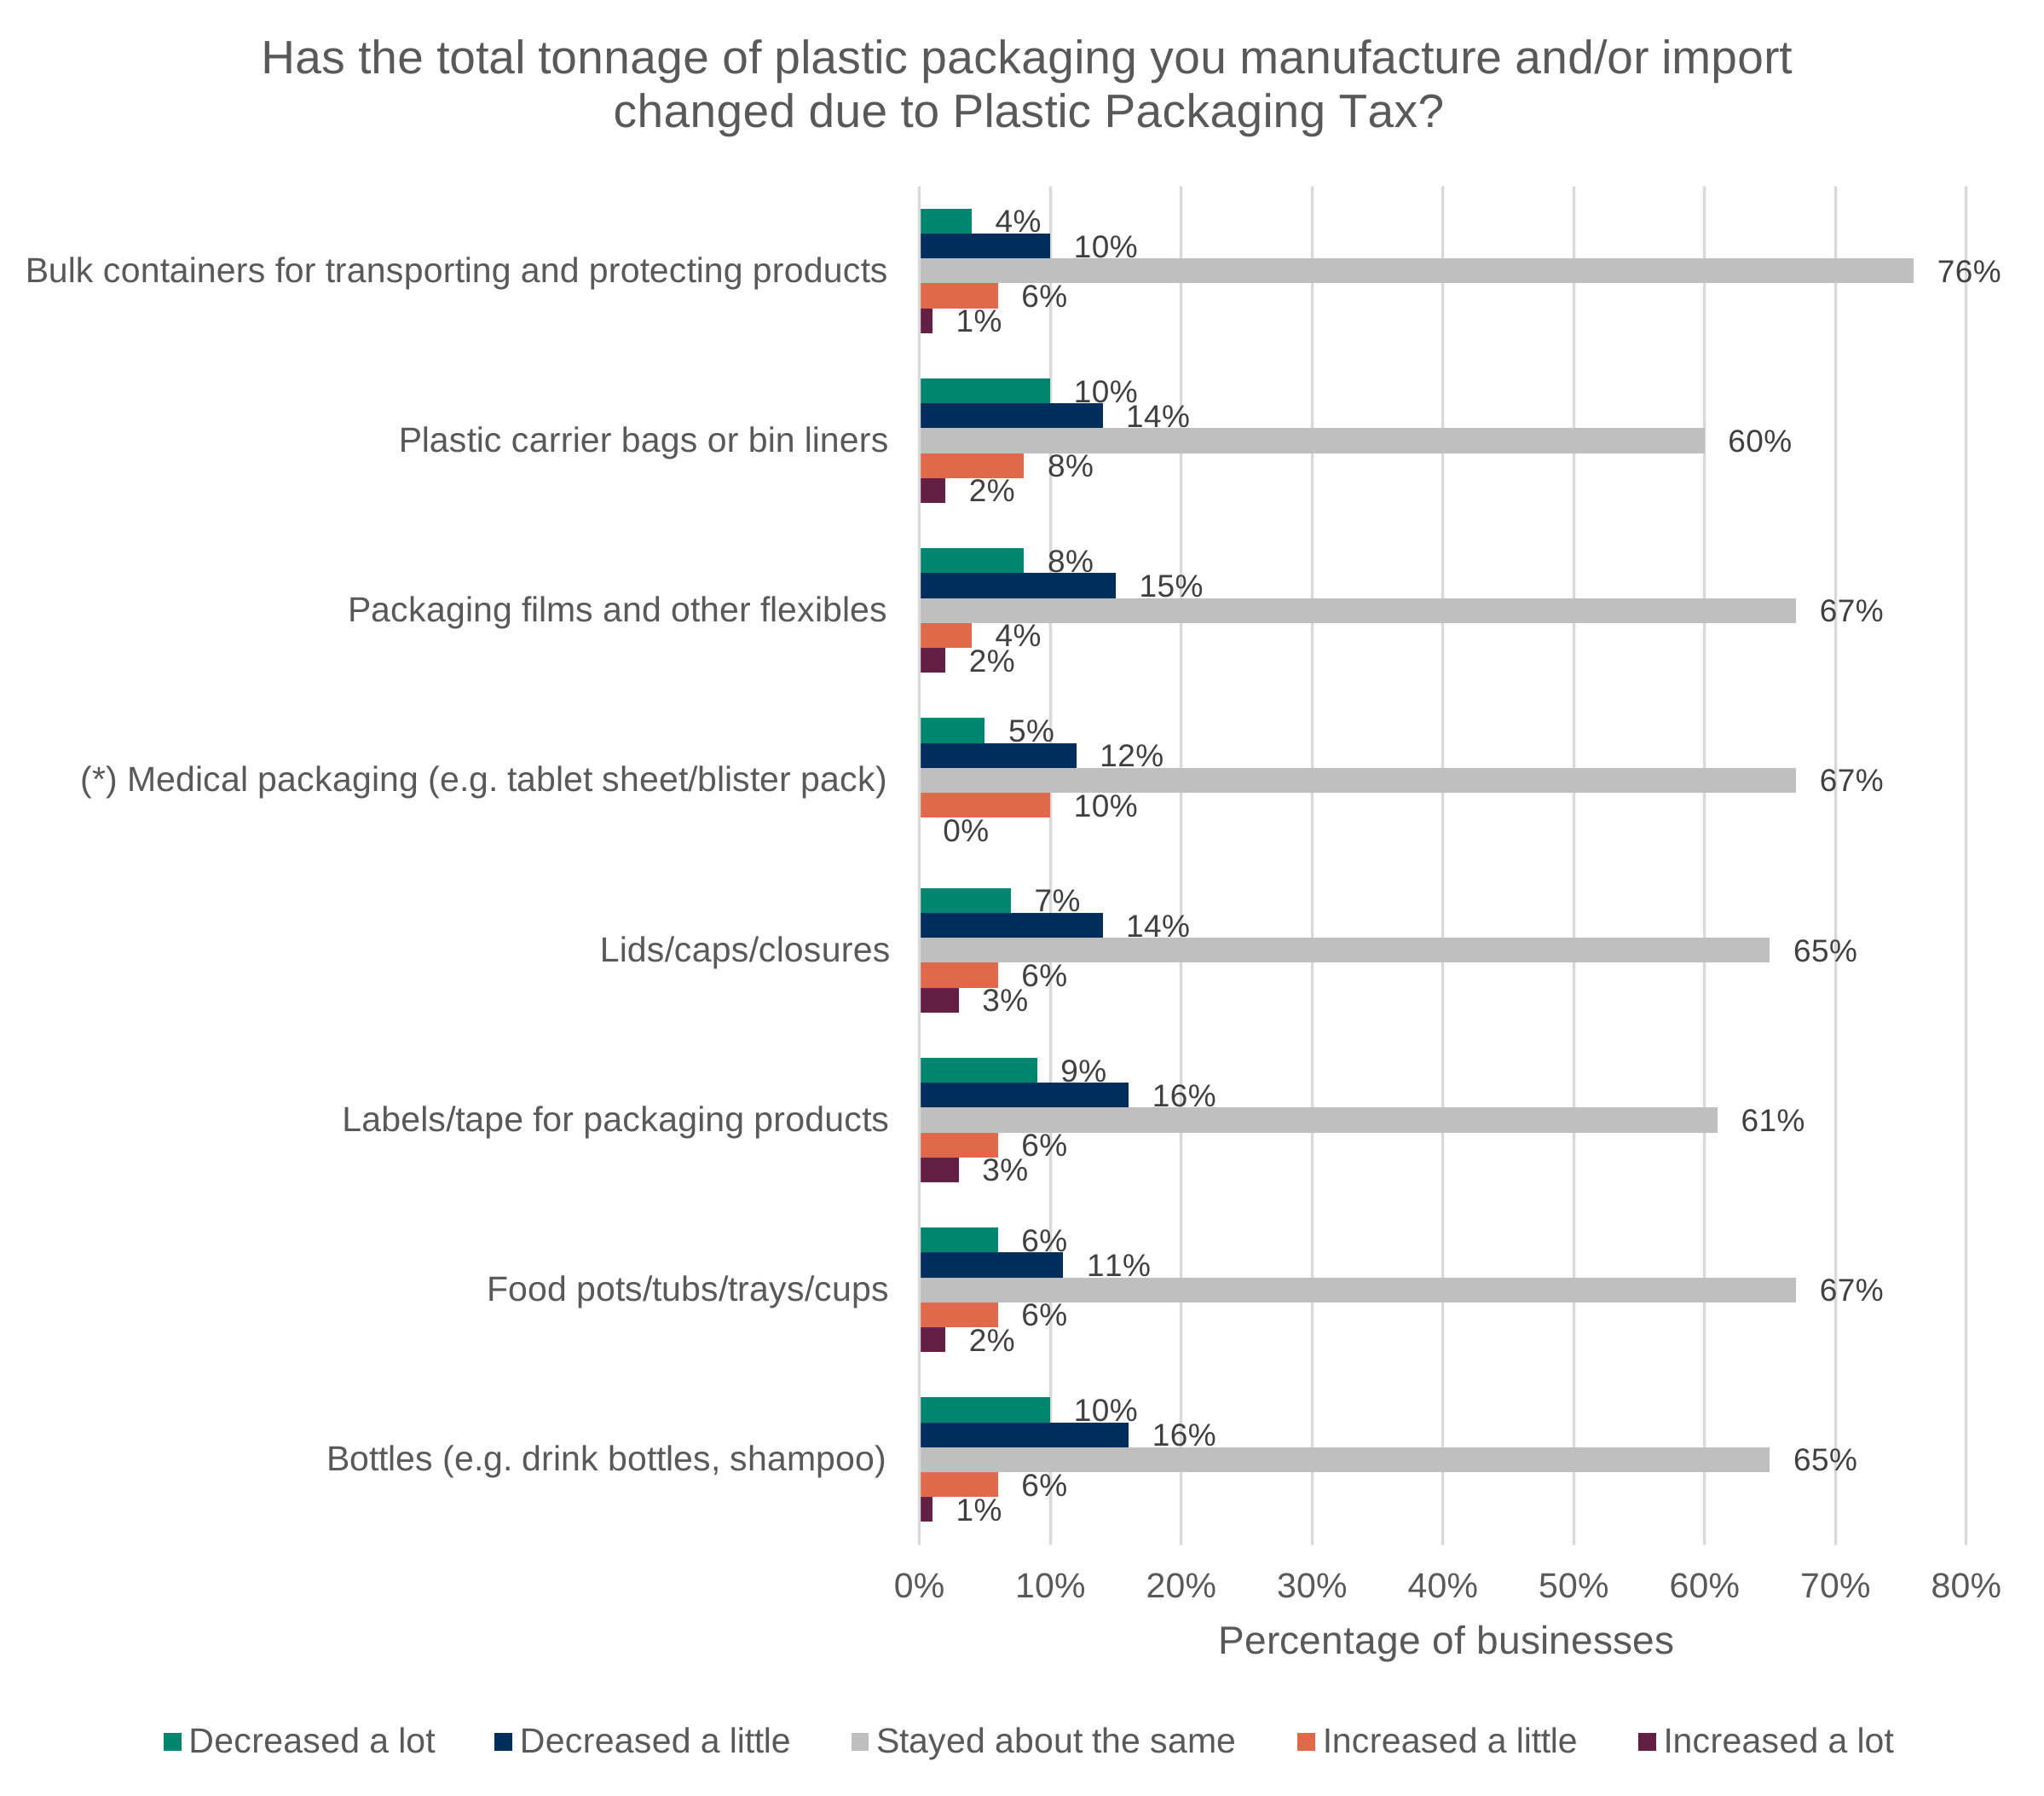
Figure C.6: Survey results for the question ‘Has the total tonnage of plastic packaging you manufacture and/or import changed due to Plastic Packaging Tax?’.
The base for each product type was as follows: Bottles (160), Food pots, tubs, trays and cups (219), labels and tape (252), lids, caps and closures (261), medical packaging (69 — note), packaging films and other flexible packaging (537), plastic carrier bags or bin liners (131), and bulk containers for transporting and protecting products (237). Source: Ipsos.
Note: The sample for medical packaging is small, and results should be interpreted with caution.
Data for Figure C.6: Survey results for the question ‘Has the total tonnage of plastic packaging you manufacture and/or import changed due to Plastic Packaging Tax?’.
The base for each product type was as follows: Bottles (160), Food pots, tubs, trays and cups (219), labels and tape (252), lids, caps and closures (261), medical packaging (69 — note), packaging films and other flexible packaging (537), plastic carrier bags or bin liners (131), and bulk containers for transporting and protecting products (237). Source: Ipsos.
Note: The sample for medical packaging is small, and results should be interpreted with caution.
| Product type | Increased a lot | Increased a little | Stayed about the same | Decreased a little | Decreased a lot |
|---|---|---|---|---|---|
| Bulk containers for transporting and protecting products | 1% | 6% | 76% | 10% | 4% |
| Plastic carrier bags or bin liners | 2% | 8% | 60% | 14% | 10% |
| Packaging films and other flexibles | 2% | 4% | 67% | 15% | 8% |
| (Note) Medical packaging (for example tablet sheet/blister pack) | 0% | 10% | 67% | 12% | 5% |
| Lids/caps/closures | 3% | 6% | 65% | 14% | 7% |
| Labels/tape for packaging products | 3% | 6% | 61% | 16% | 9% |
| Food pots/tubs/trays/cups | 2% | 6% | 67% | 11% | 6% |
| Bottles (for example drink bottles, shampoo) | 1% | 6% | 65% | 16% | 10% |
Across all product types, most businesses reported that total plastic packaging tonnage had stayed about the same following the introduction of the PPT, with proportions ranging from 60% to 76%. Reported decreases were more common than reported increases across all product categories, although the scale of this difference was relatively modest.
While some statistically significant differences are observed between product types, these differences are generally small in magnitude and do not indicate a consistent pattern of variation. For example, bulk containers and plant pots show higher proportions reporting no change, while other product types such as bottles, labels and tape, and plastic carrier bags show slightly higher proportions reporting decreases. However, these differences may reflect underlying product characteristics and constraints, rather than materially different behavioural responses to the tax. Moreover, packaging for licensed human medicines currently has an exemption in place, while still requiring businesses to report to HMRC if the businesses fall above the de minimis threshold.
Data from UKPP members shows more pronounced and consistent variation in recycled content by packaging product type, shown in Figure 5.4 in Chapter 5. These differences are persistent over time and suggest that the ability to incorporate recycled content varies systematically across packaging formats. In particular, formats such as bottles appear to have benefited from more established recycling streams and greater technical feasibility, while films and tubes remain constrained by material properties, contamination risks, and product design requirements.
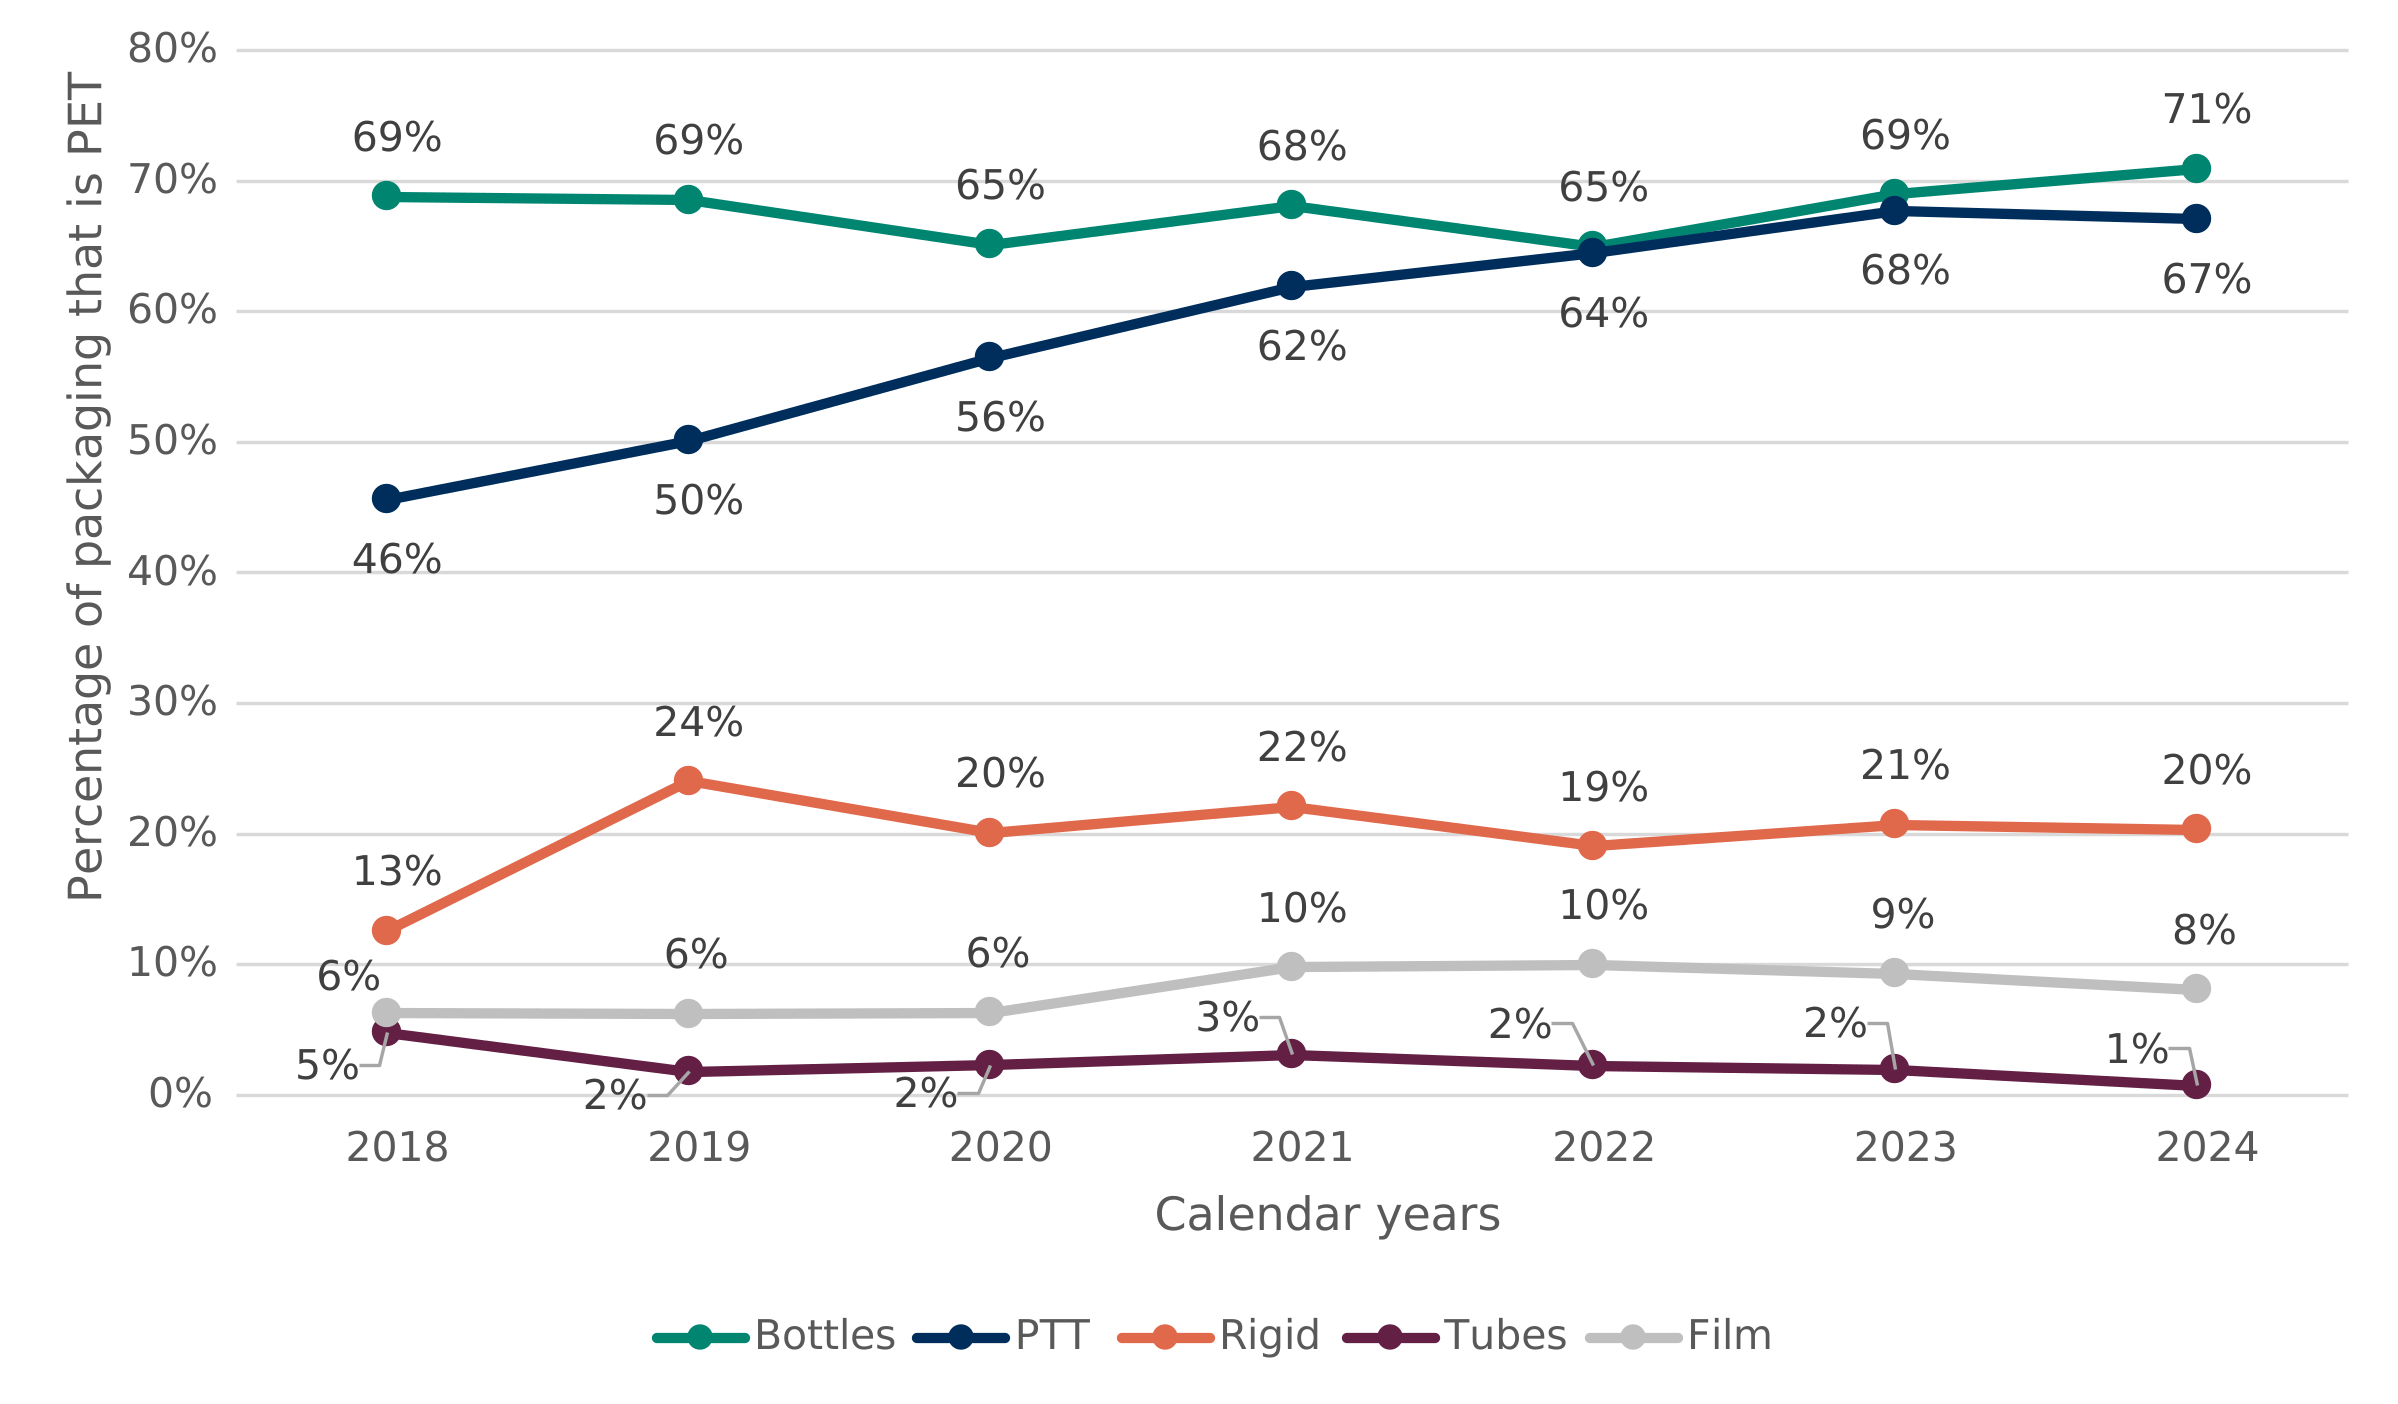
Figure C.7: All UKPP members’ PET usage in plastic packaging split by packaging product type.
Source: WRAP.
Data for Figure C.7: All UKPP members’ PET usage in plastic packaging split by packaging product type.
Source: WRAP.
| Year | Bottles | PTT | Rigid | Tubes | Film |
|---|---|---|---|---|---|
| 2018 | 68.8% | 45.6% | 12.6% | 4.8% | 6.3% |
| 2019 | 68.5% | 50.1% | 24.1% | 1.8% | 6.2% |
| 2020 | 65.1% | 56.5% | 20.1% | 2.3% | 6.3% |
| 2021 | 68.1% | 61.9% | 22.1% | 3.1% | 9.8% |
| 2022 | 65.0% | 64.5% | 19.1% | 2.3% | 10.0% |
| 2023 | 69.0% | 67.7% | 20.7% | 2.0% | 9.3% |
| 2024 | 70.9% | 67.1% | 20.3% | 0.7% | 8.1% |
Further evidence from UKPP members shown in Figure C.7 indicates that the differences in recycled content by packaging type are closely associated with variation in the type of plastic used across packaging formats. Bottles and pots/tubs/trays have a high and increasing share of both recycled and virgin PET throughout the period, reaching 71% and 67% in 2024 respectively, whereas films and tubes contain very little PET. Given that PET has more established and mature recycling pathways, this suggests that the ability to incorporate recycled content varies more systematically with material type (explored further in Section 5.4.3).
The evidence indicates that while outcomes vary across packaging product types, these differences are not primarily driven by distinct behavioural responses of businesses within each category. Survey evidence shows that businesses across product types report broadly similar patterns of change and face comparable constraints when attempting to increase recycled content or reduce plastic packaging usage. In part, this could also be because businesses could select multiple packaging types and plastic types as part of the survey. Any observed variation in responses is generally limited in scale and does not form a consistent pattern across categories.
In contrast, external evidence from UKPP demonstrates more substantial and persistent differences in recycled content across packaging formats. When considered alongside evidence on material composition, these differences appear closely linked to the types of plastics used within each product category — particularly the prevalence of PET, which benefits from more established and mature recycling pathways. Product types with higher shares of PET, such as bottles and pots/tubs/trays, exhibit higher levels of recycled content in UKPP members, whereas formats such as films and tubes, which make limited use of PET, remain more constrained.
Overall, this suggests that differences in outcomes across product types are better understood as reflecting variation in the technical and economic feasibility of using recycled materials, rather than product type in isolation. Product categories therefore act primarily as a proxy for underlying material composition and supply chain characteristics. This indicates that the effectiveness of the PPT is mediated by these structural factors, with greater responsiveness where established recycling streams and suitable materials are available, and more limited change where these conditions are absent.
C.2.3 Variation by plastic types used
This section expands on the supporting evidence outlined in Section 5.4.2.
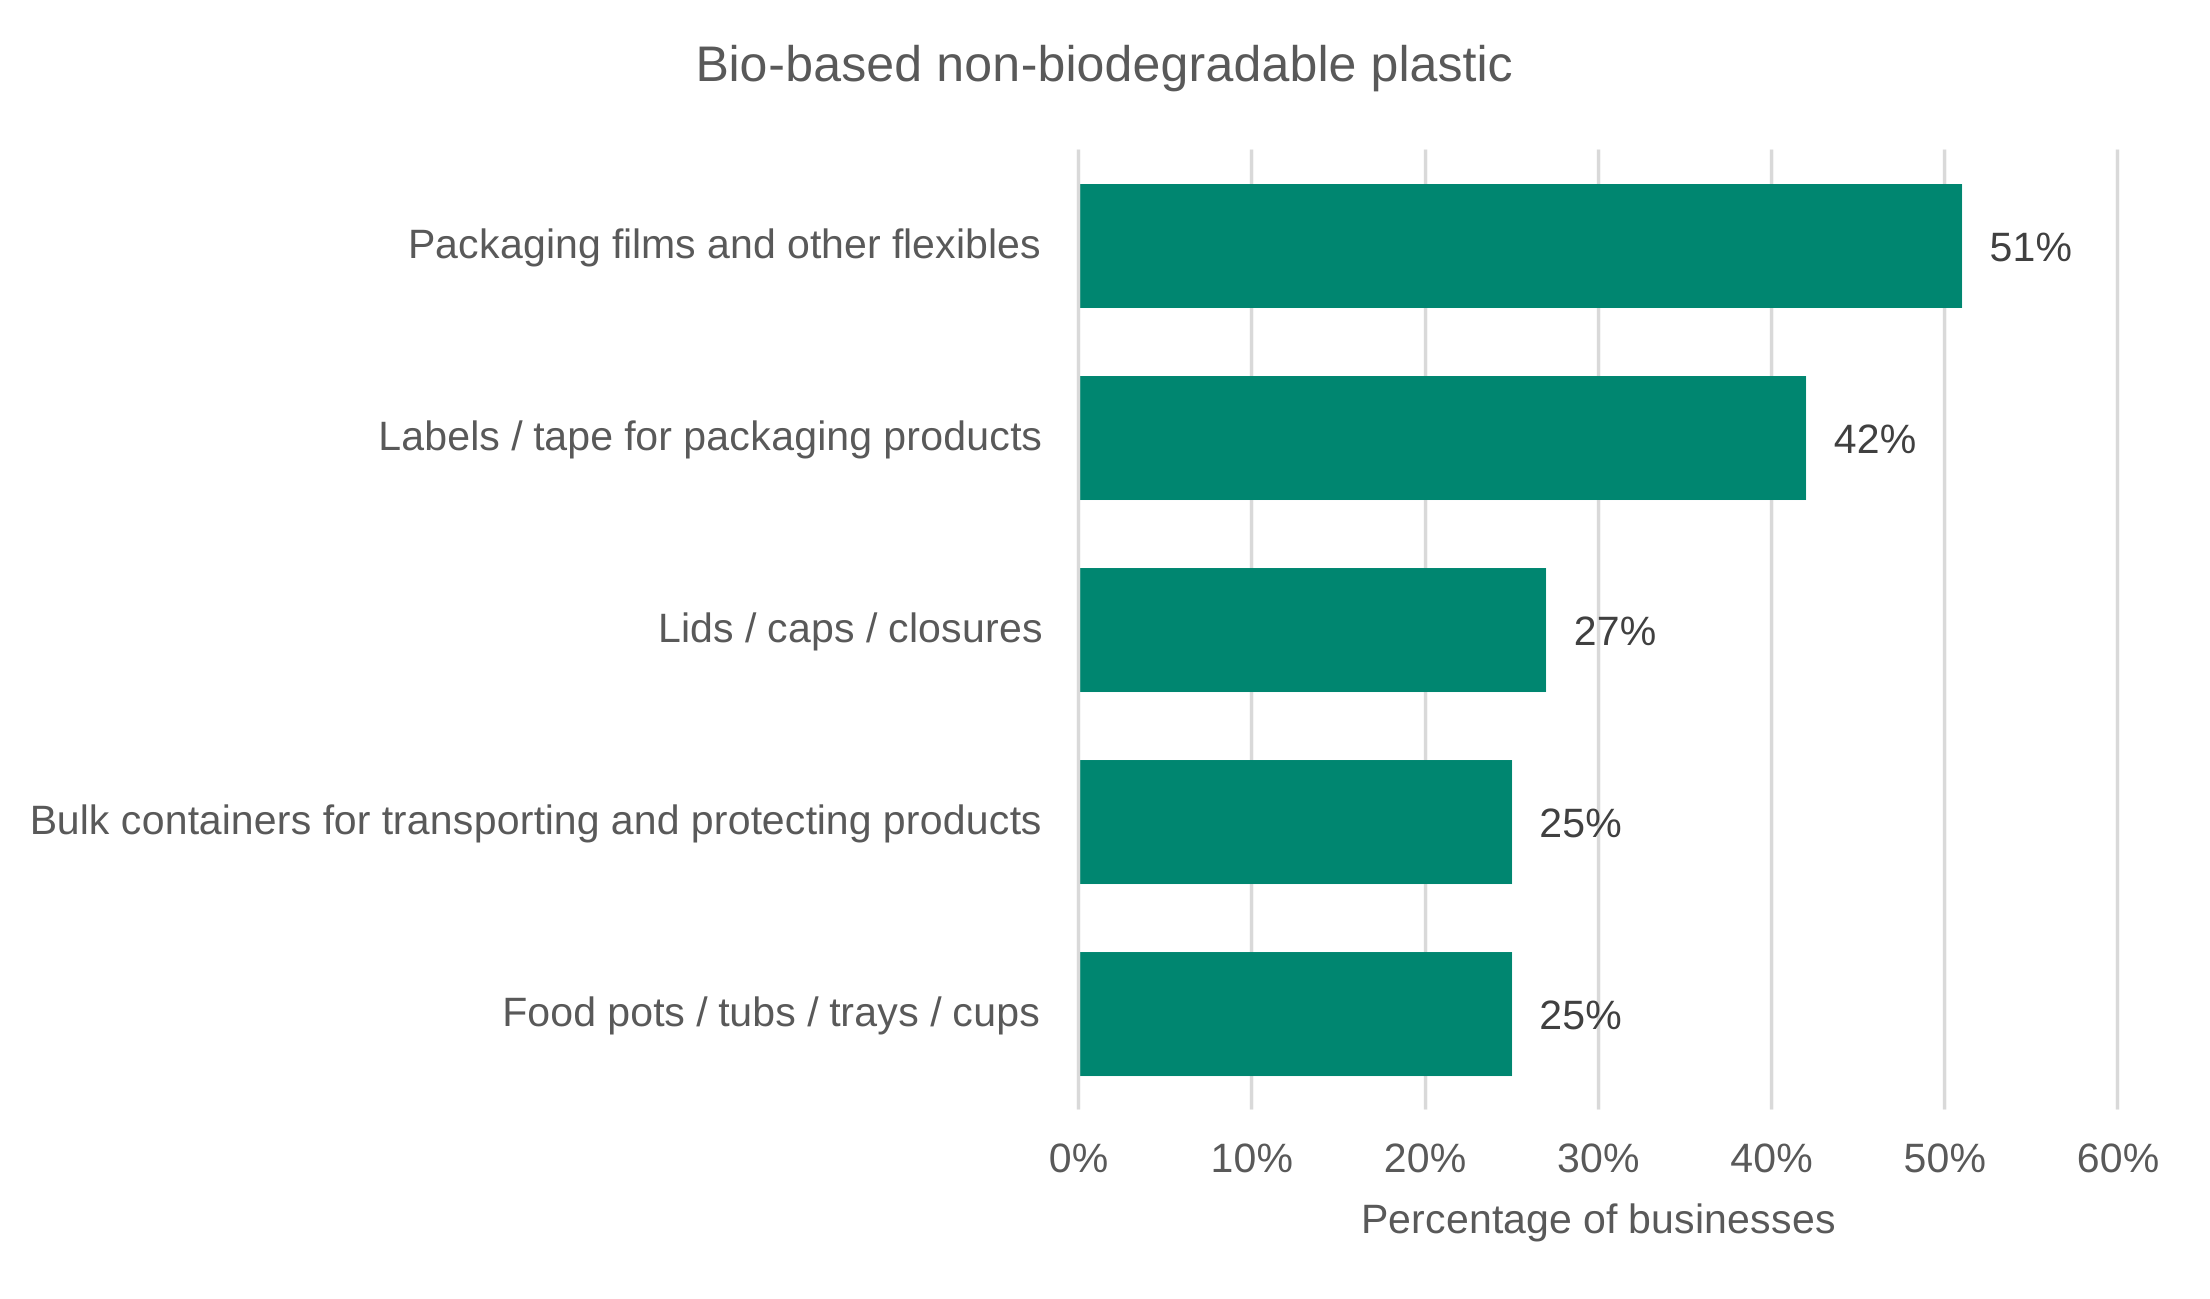
Figures C.8 to C.16 show the packaging products most commonly manufactured or imported by businesses as containing each plastic type. Responses indicating that businesses did not know which plastic type was used are also included. Respondents could select multiple packaging products and report multiple plastic types. As a result, percentages are calculated separately for each plastic type and therefore do not sum to 100% across product categories. Results for plastic types with fewer than 100 respondents should be interpreted with caution, as they are based on relatively small sample sizes.
Packaging films and other flexibles were the most reported packaging product across all 9 plastic type sub-groups. The quantitative research shows that 60% or more of businesses who manufacture and/or import plastic packaging made from PVC, HDPE or LDPE and compostable plastics reported they used those materials for films. Labels and tape, lids, caps and closures, and bulk containers also appeared frequently among the 5 most commonly reported products across the different plastic types.
Some products are more specific to particular plastic types. Carrier bags or bin liners appear in the top 5 product types for HDPE or LDPE (typically only LDPE) and compostable plastics only. Bottles only feature in the top 5 product types in the PET, PVC and ‘other’ plastic categories. These patterns are descriptive and should not be interpreted as demonstrating that these products are exclusively manufactured or imported using those plastics.
Figure C.8: Survey results for the 5 most common responses to the question, ‘Which of the following best describes the plastic packaging product(s) your business manufactures or imports?’, by bio-based non-biodegradable plastic.
The sample size for bio-based non-biodegradable plastic was 73. Given the small sample size, results for this plastic type should be interpreted with caution. Source: Ipsos.
Data for Figure C.8: Survey results for the 5 most common responses to the question, ‘Which of the following best describes the plastic packaging product(s) your business manufactures or imports?’, by bio-based non-biodegradable plastic.
The sample size for bio-based non-biodegradable plastic was 73. Given the small sample size, results for this plastic type should be interpreted with caution. Source: Ipsos.
| Packaging product | Bio-based non-biodegradable plastic |
|---|---|
| Packaging films and other flexibles | 51% |
| Labels / tape for packaging products | 42% |
| Lids / caps / closures | 27% |
| Bulk containers for transporting and protecting products | 25% |
| Food pots / tubs / trays / cups | 25% |
Figure C.9: Survey results for the 5 most common responses to the question ‘Which of the following best describes the plastic packaging product(s) your business manufactures or imports?’, by compostable plastic.
The base for Compostable plastic was 65. Given the small sample size, results for this plastic type should be interpreted with caution. Source: Ipsos.
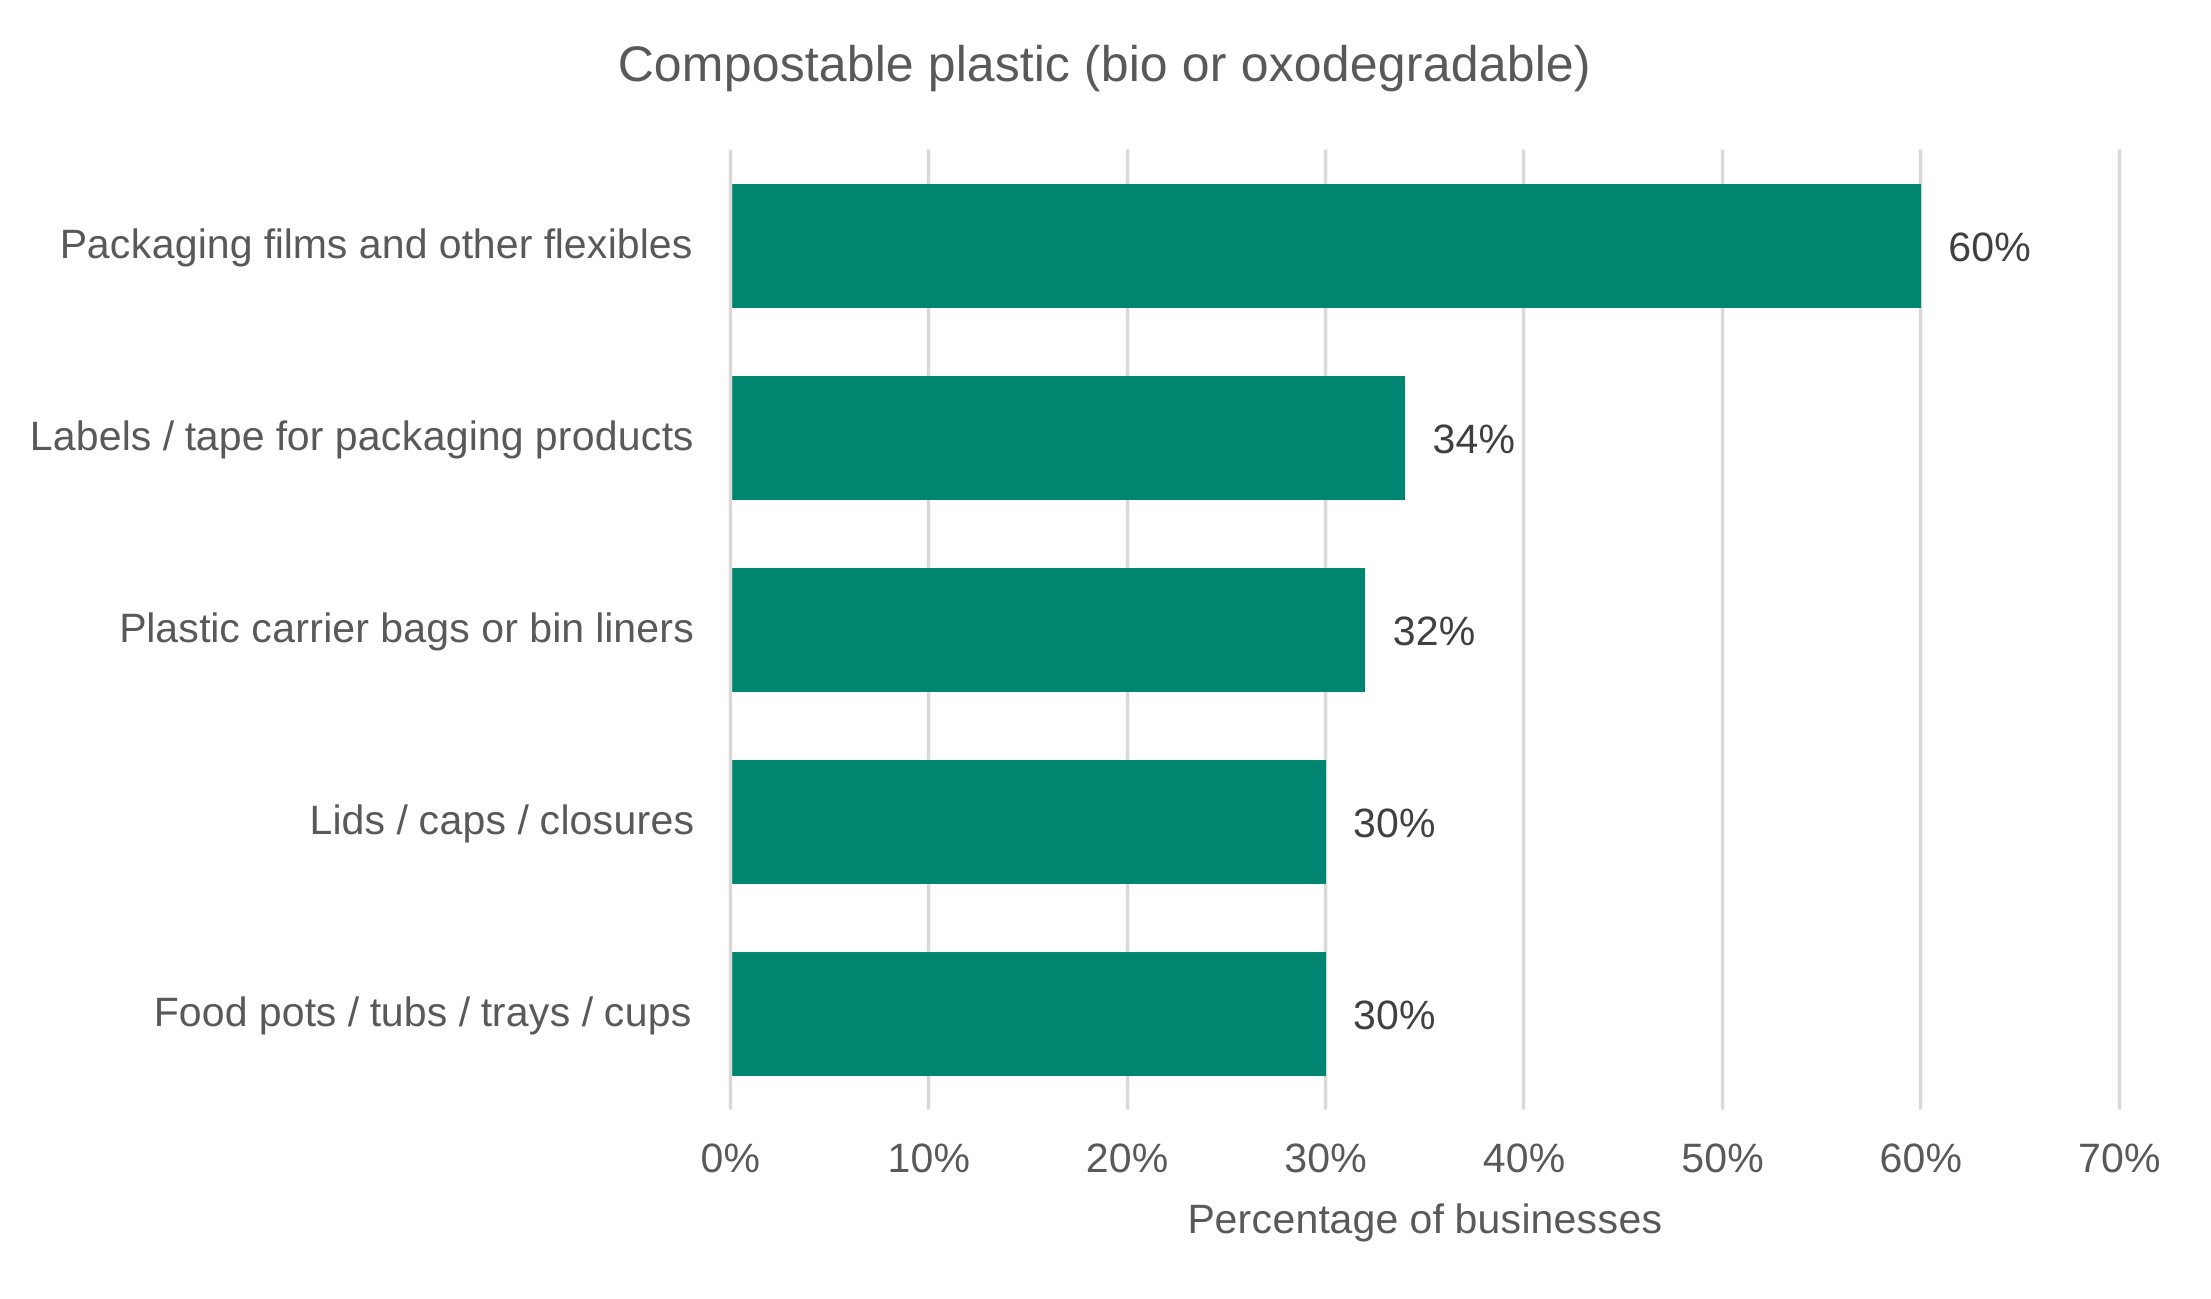
Data for Figure C.9: Survey results for the 5 most common responses to the question ‘Which of the following best describes the plastic packaging product(s) your business manufactures or imports?’, by compostable plastic.
The base for Compostable plastic was 65. Given the small sample size, results for this plastic type should be interpreted with caution. Source: Ipsos.
| Packaging product | Compostable plastic (bio or oxodegradable) |
|---|---|
| Packaging films and other flexibles | 60% |
| Labels / tape for packaging products | 34% |
| Plastic carrier bags or bin liners | 32% |
| Lids / caps / closures | 30% |
| Food pots / tubs / trays / cups | 30% |
Figure C.10: Survey results for the 5 most common responses to the question ‘Which of the following best describes the plastic packaging product(s) your business manufactures or imports?’, by polyethylene.
The base for HDPE or LDPE was 430. Source: Ipsos.
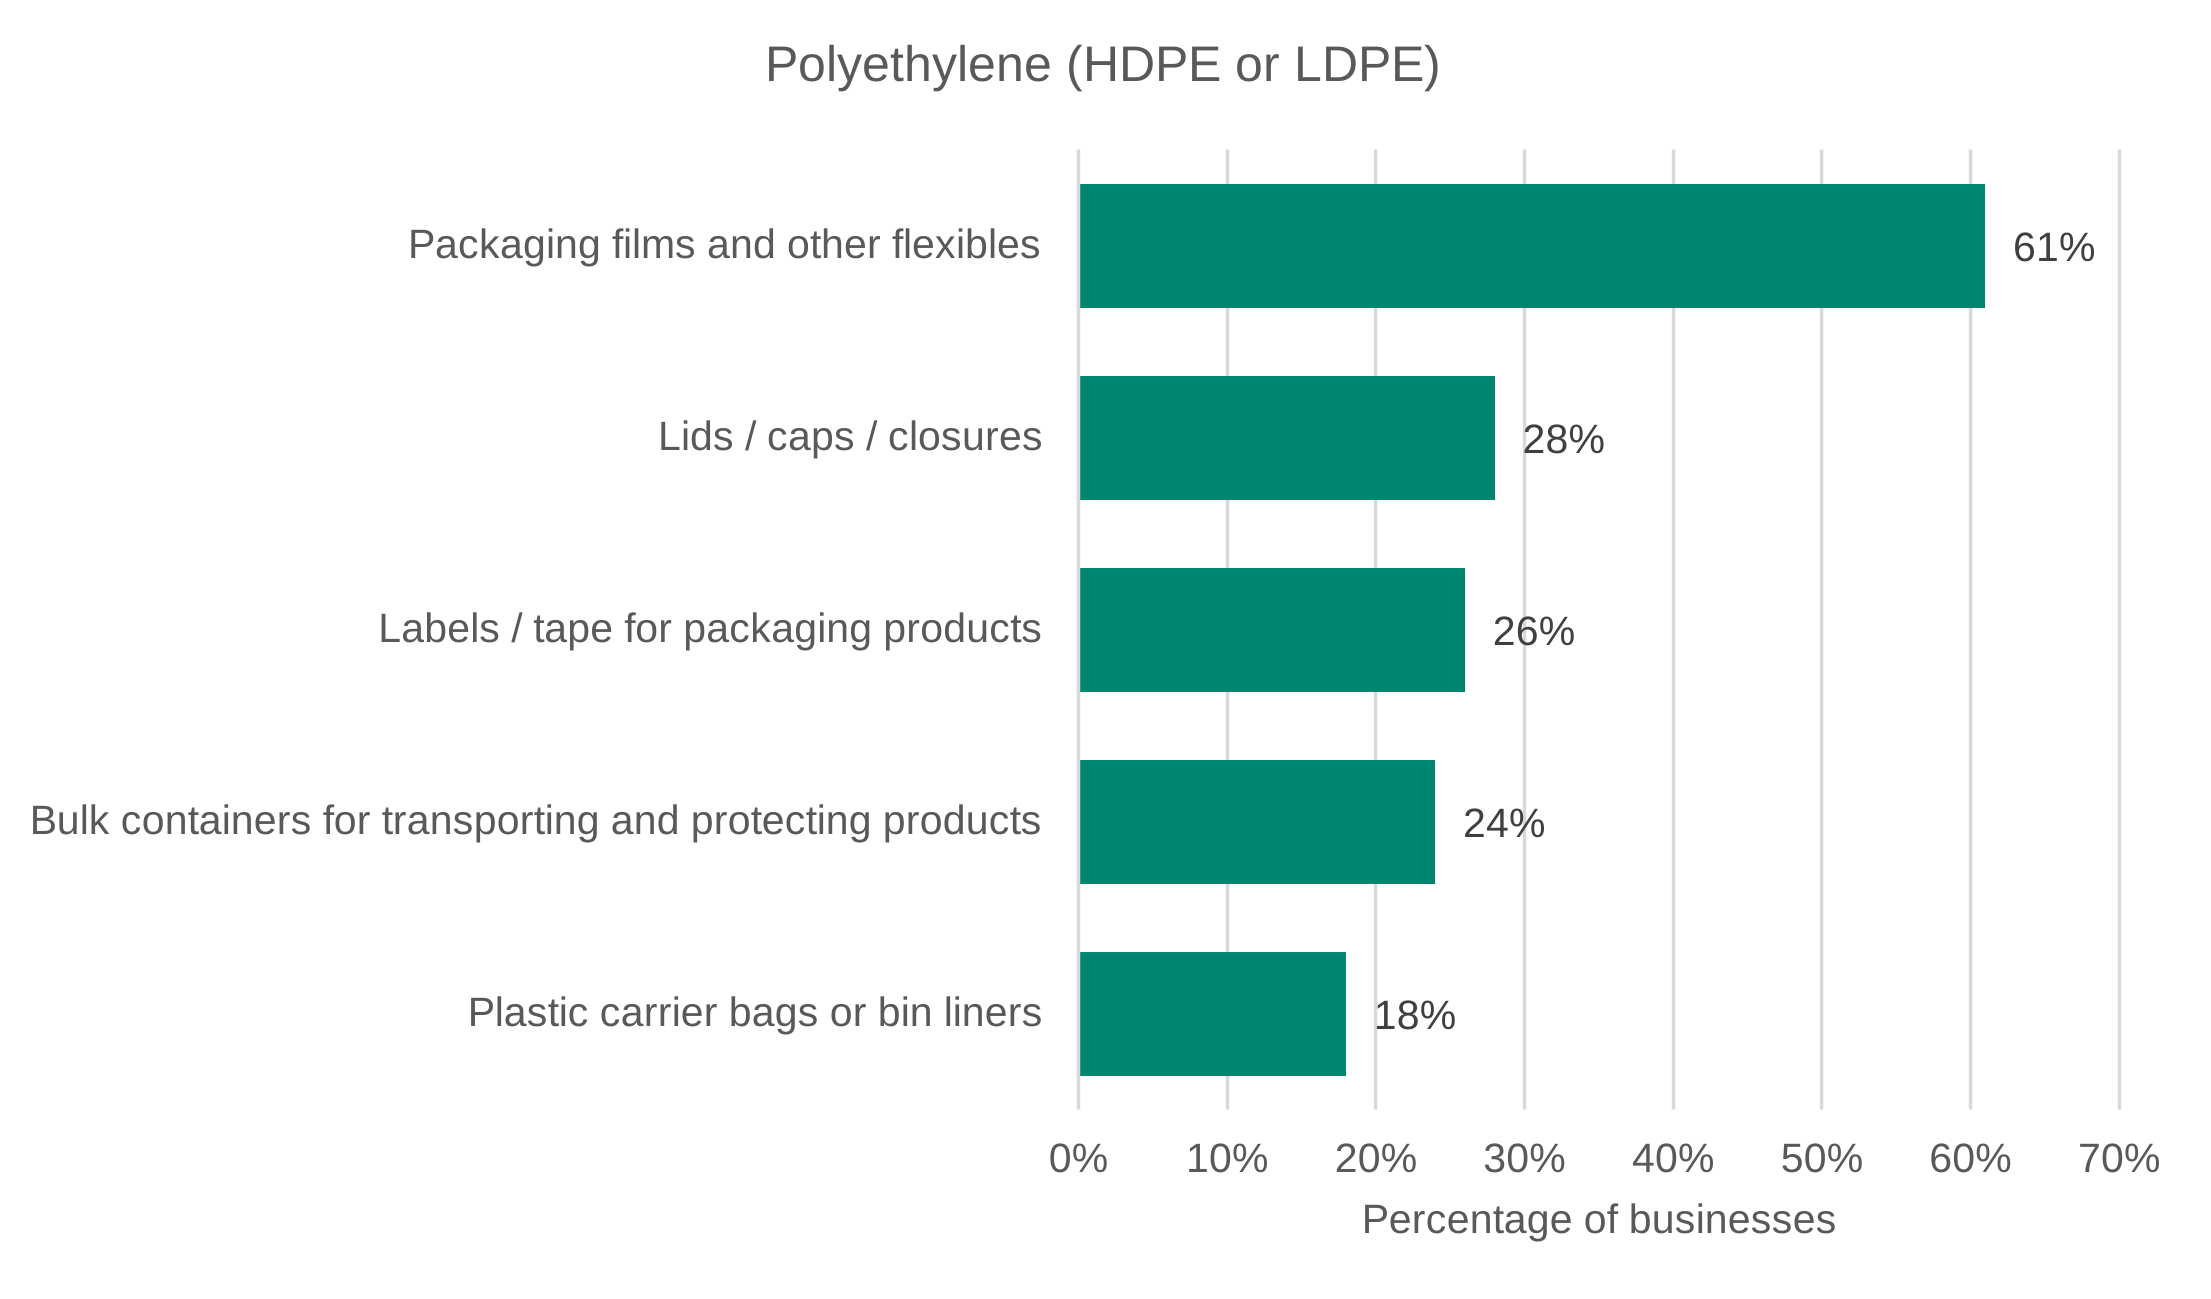
Data for Figure C.10: Survey results for the 5 most common responses to the question ‘Which of the following best describes the plastic packaging product(s) your business manufactures or imports?’, by polyethylene.
The base for HDPE or LDPE was 430. Source: Ipsos.
| Packaging product | Polyethylene (HDPE or LDPE) |
|---|---|
| Packaging films and other flexibles | 61% |
| Lids / caps / closures | 28% |
| Labels / tape for packaging products | 26% |
| Bulk containers for transporting and protecting products | 24% |
| Plastic carrier bags or bin liners | 18% |
Figure C.11: Survey results for the 5 most common responses to the question ‘Which of the following best describes the plastic packaging product(s) your business manufactures or imports?’, by PET.
The base for PET was 346. Source: Ipsos.
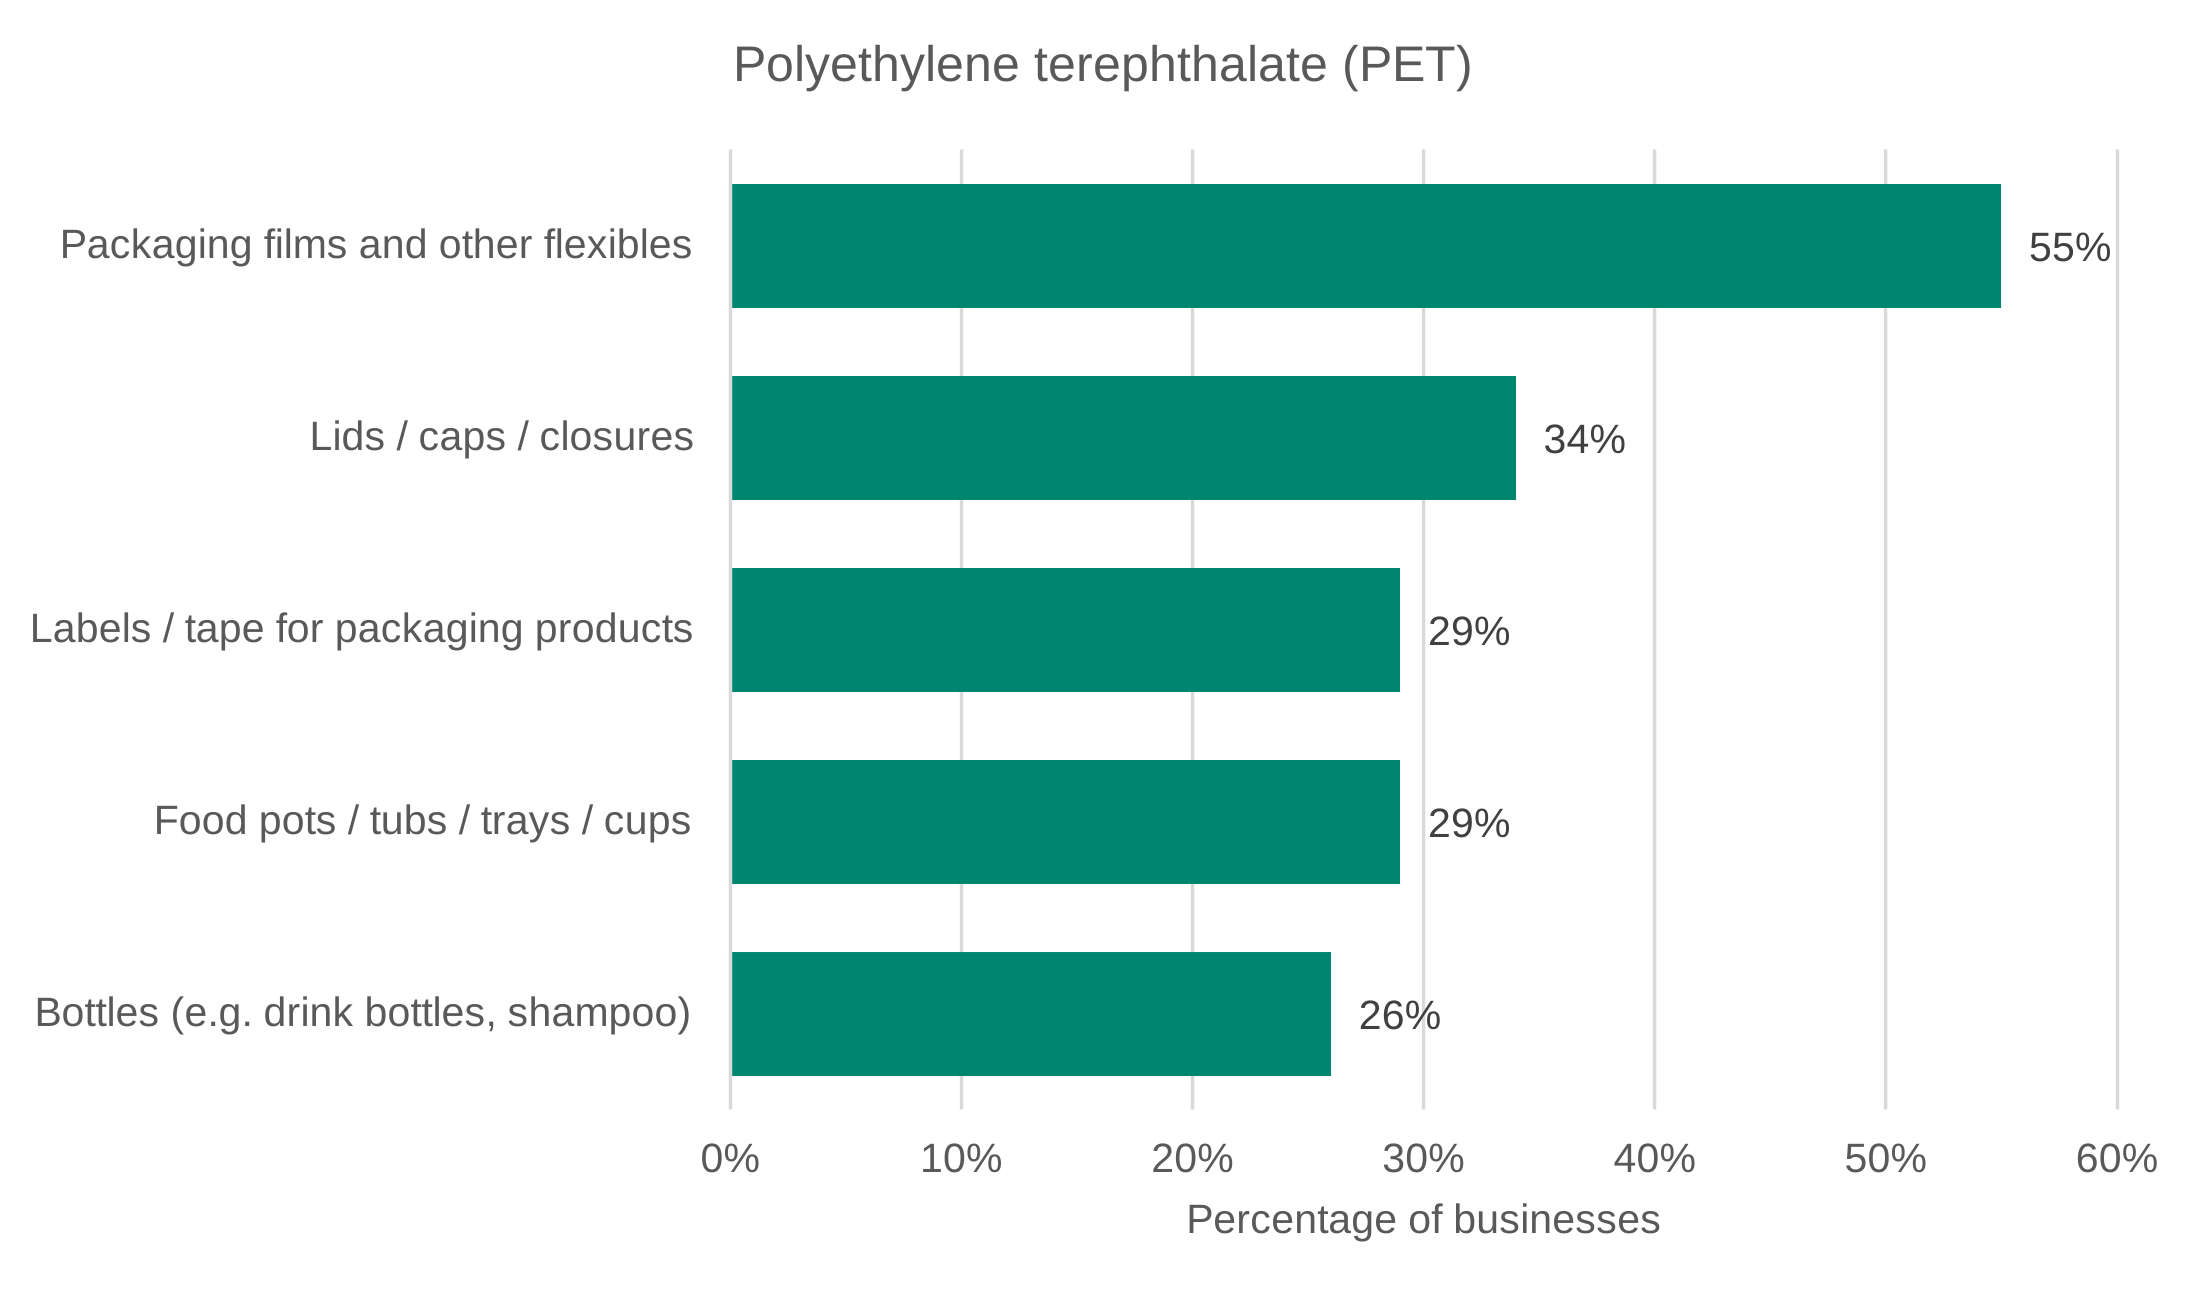
Data for Figure C.11: Survey results for the 5 most common responses to the question ‘Which of the following best describes the plastic packaging product(s) your business manufactures or imports?’, by PET.
The base for PET was 346. Source: Ipsos.
| Packaging product | Polyethylene terephthalate (PET) |
|---|---|
| Packaging films and other flexibles | 55% |
| Lids / caps / closures | 34% |
| Labels / tape for packaging products | 29% |
| Food pots / tubs / trays / cups | 29% |
| Bottles (for example drink bottles, shampoo) | 26% |
Figure C.12: Survey results for the 5 most common responses to the question ‘Which of the following best describes the plastic packaging product(s) your business manufactures or imports?’, by PP.
The base for PP was 376. Source: Ipsos.
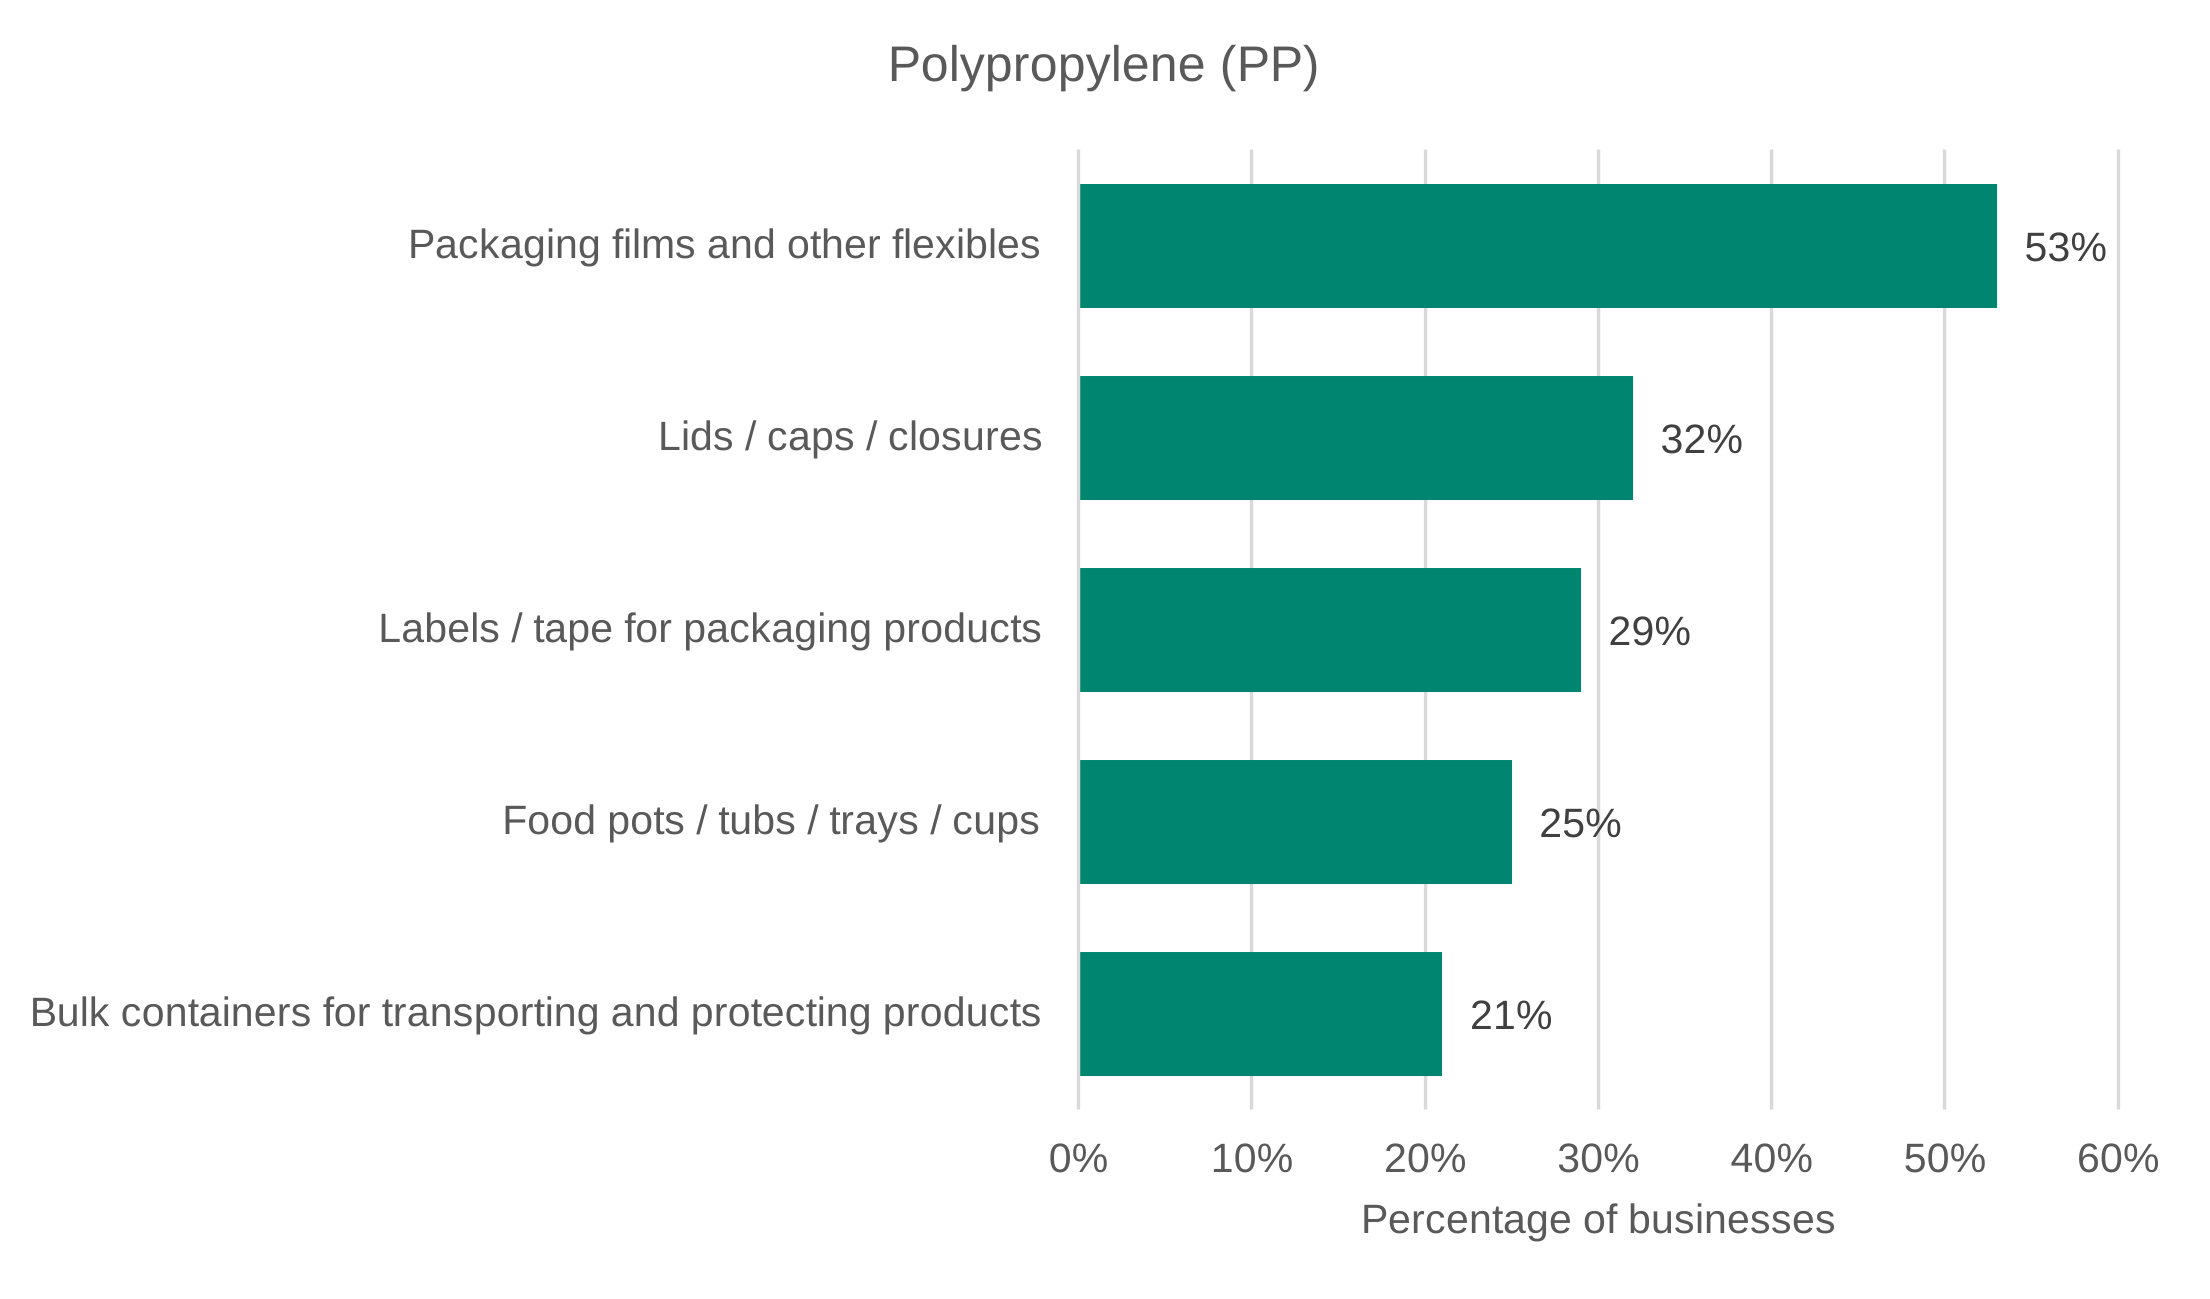
Data for Figure C.12: Survey results for the 5 most common responses to the question ‘Which of the following best describes the plastic packaging product(s) your business manufactures or imports?’, by PP.
The base for PP was 376. Source: Ipsos.
| Packaging product | Polypropylene (PP) |
|---|---|
| Packaging films and other flexibles | 53% |
| Lids / caps / closures | 32% |
| Labels / tape for packaging products | 29% |
| Food pots / tubs / trays / cups | 25% |
| Bulk containers for transporting and protecting products | 21% |
Figure C.13: Survey results for the 5 most common responses to the question ‘Which of the following best describes the plastic packaging product(s) your business manufactures or imports?’, by PS.
The base for PS was 114. Source: Ipsos.
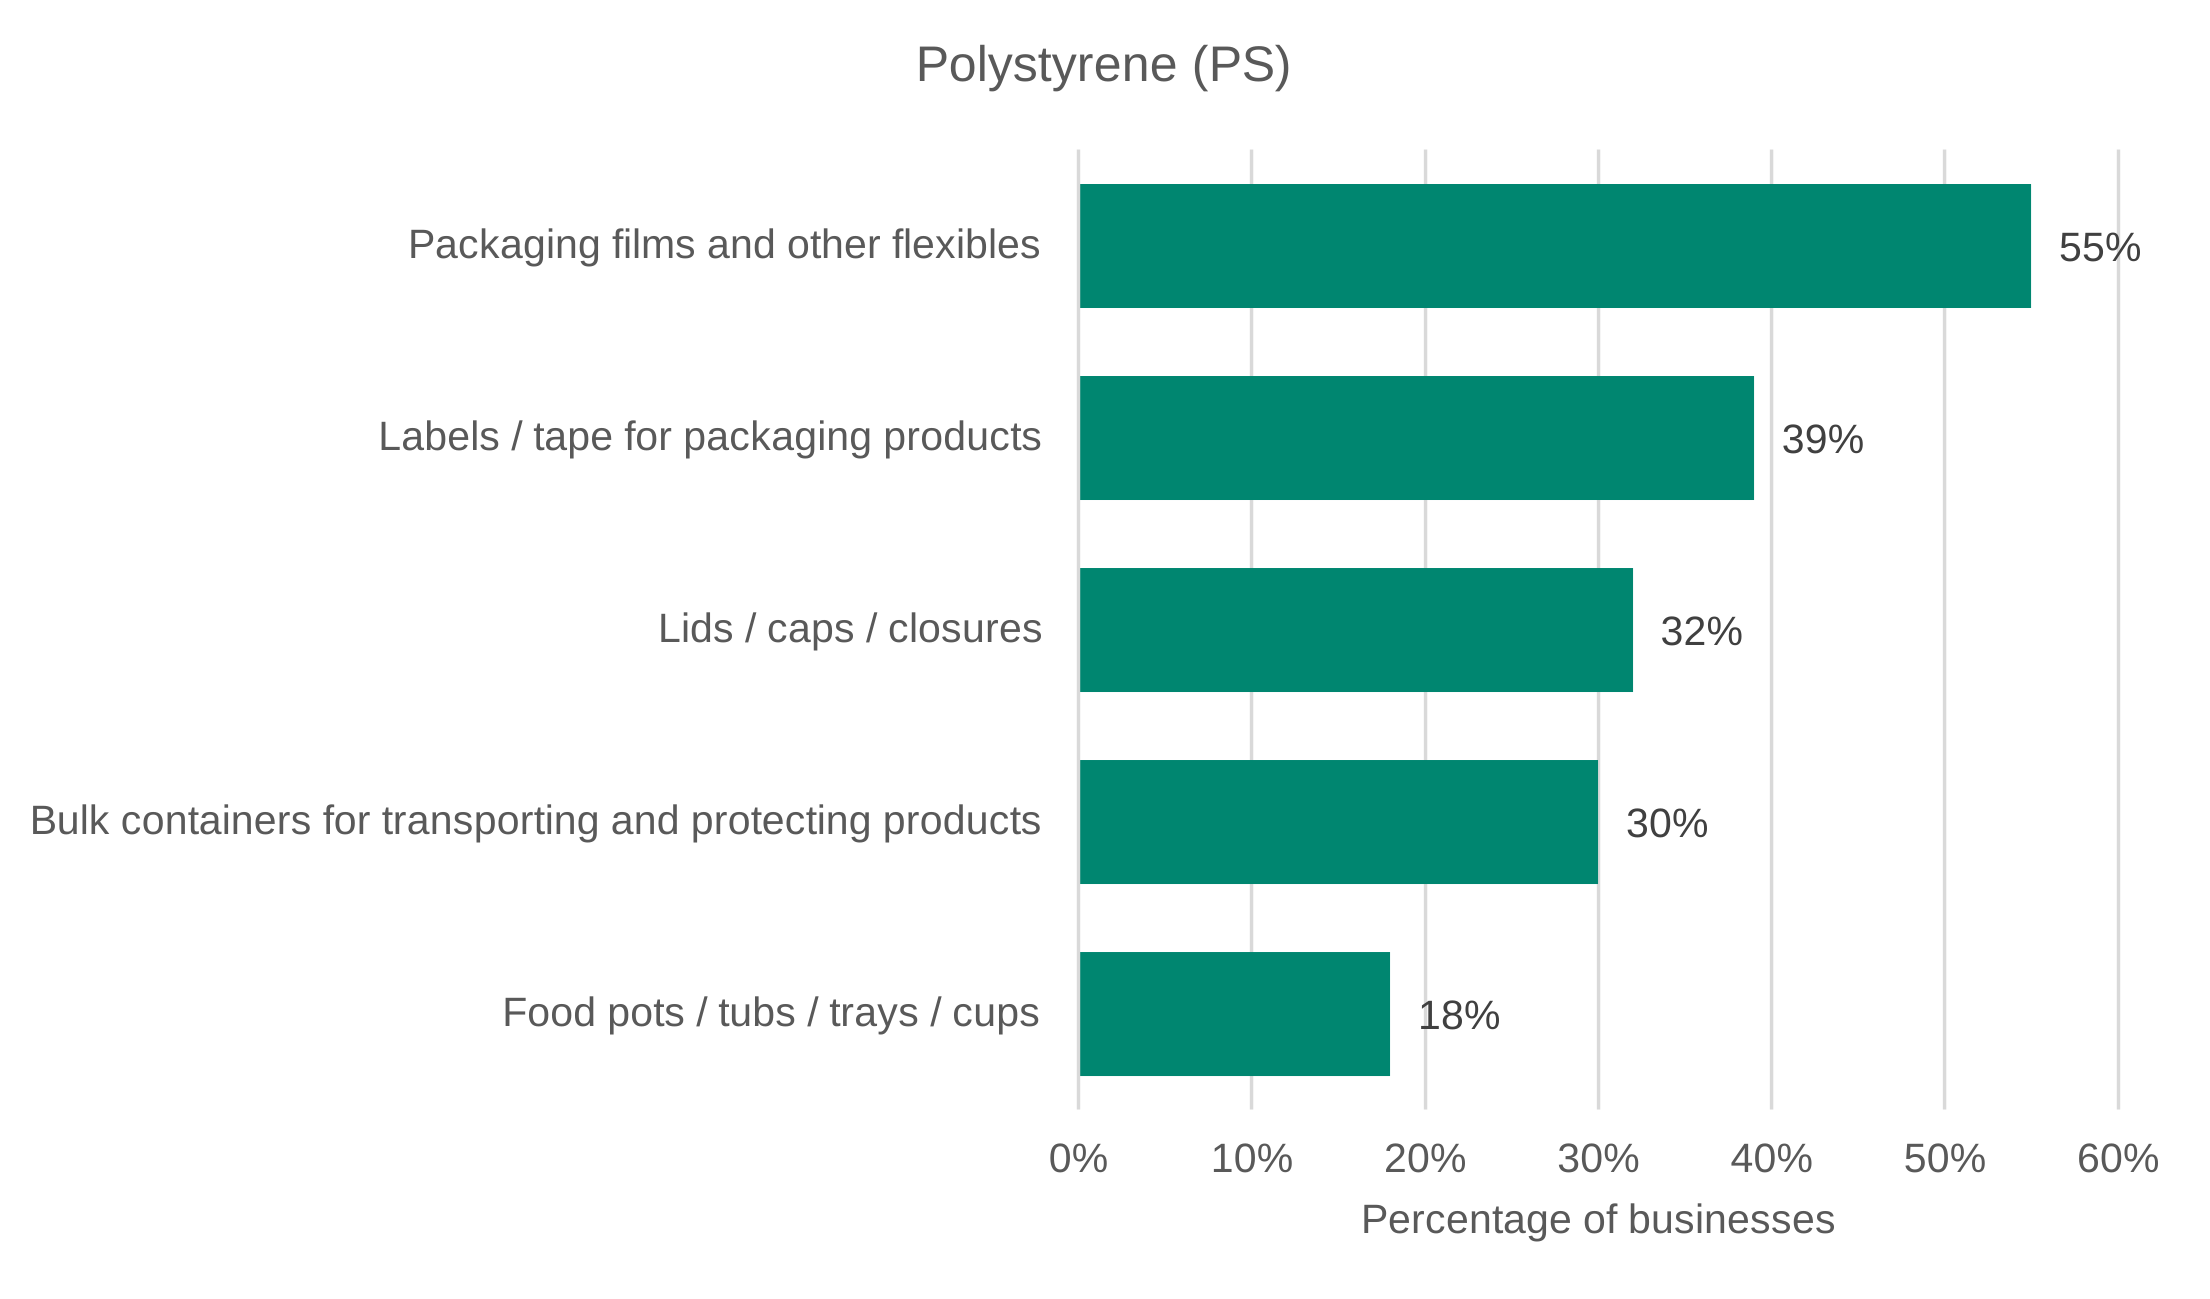
Data for Figure C.13: Survey results for the 5 most common responses to the question ‘Which of the following best describes the plastic packaging product(s) your business manufactures or imports?’, by PS.
The base for PS was 114. Source: Ipsos.
| Packaging product | Polystyrene (PS) |
|---|---|
| Packaging films and other flexibles | 55% |
| Labels / tape for packaging products | 39% |
| Lids / caps / closures | 32% |
| Bulk containers for transporting and protecting products | 30% |
| Food pots / tubs / trays / cups | 18% |
Figure C.14: Survey results for the 5 most common responses to the question ‘Which of the following best describes the plastic packaging product(s) your business manufactures or imports?’, by PVC.
The base for PVC was 91. Given the small sample size, results for this plastic type should be interpreted with caution. Source: Ipsos.
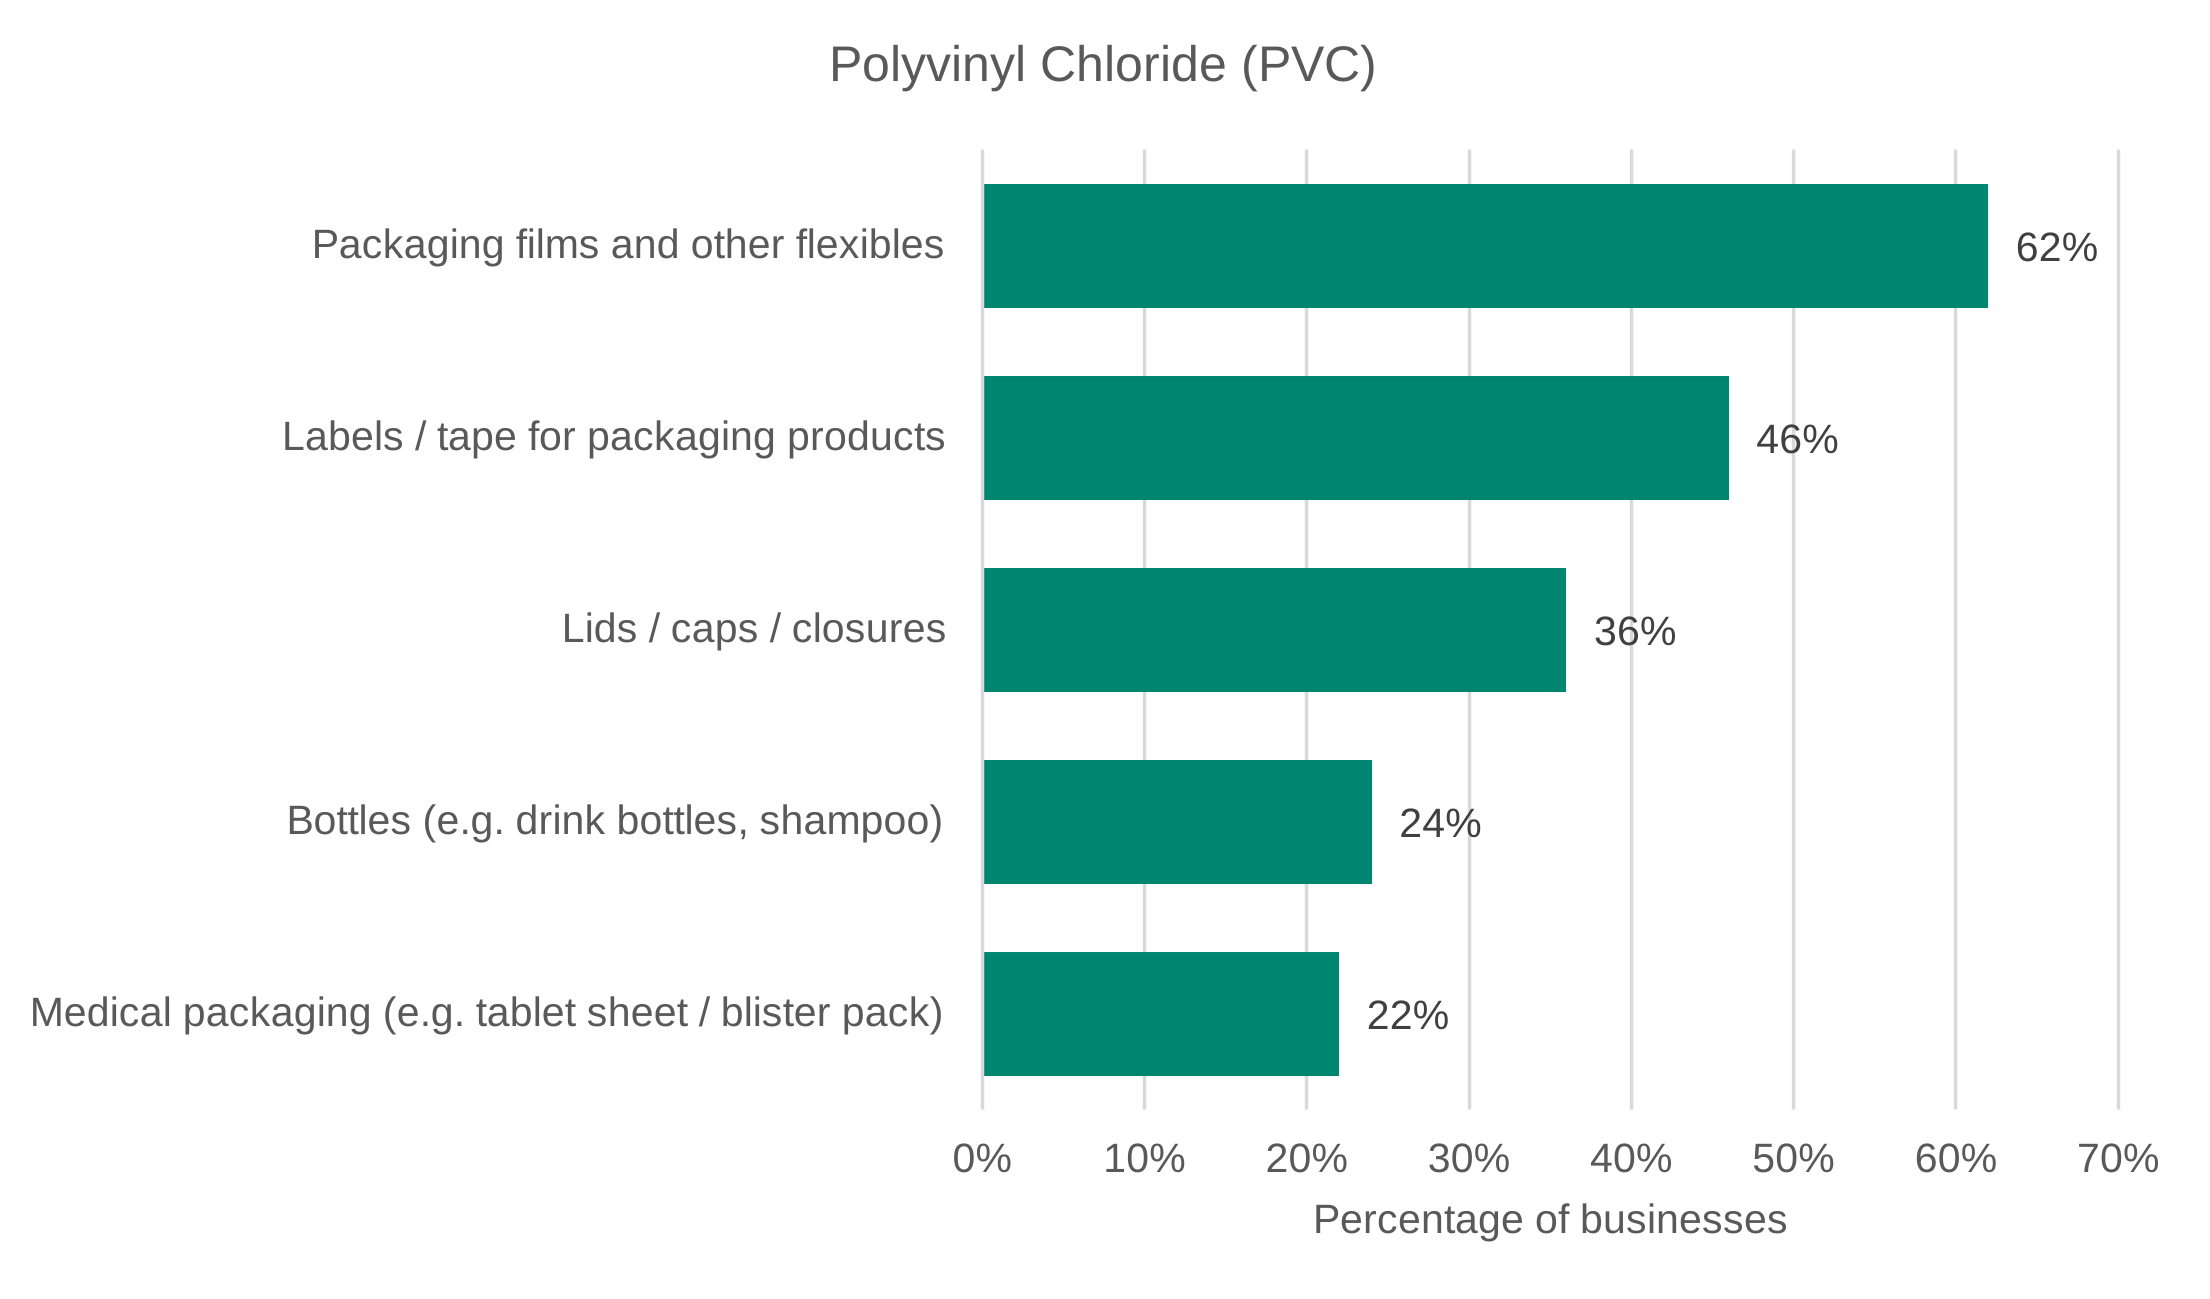
Data for Figure C.14: Survey results for the 5 most common responses to the question ‘Which of the following best describes the plastic packaging product(s) your business manufactures or imports?’, by PVC.
The base for PVC was 91. Given the small sample size, results for this plastic type should be interpreted with caution. Source: Ipsos.
| Packaging product | Polyvinyl Chloride (PVC) |
|---|---|
| Packaging films and other flexibles | 62% |
| Labels / tape for packaging products | 46% |
| Lids / caps / closures | 36% |
| Bottles (for example drink bottles, shampoo) | 24% |
| Medical packaging (for example tablet sheet / blister pack) | 22% |
Figure C.15: Survey results for the 5 most common responses to the question ‘Which of the following best describes the plastic packaging product(s) your business manufactures or imports?’, by other plastic.
The base for Other was 70. Given the small sample size, results for this plastic type should be interpreted with caution. Source: Ipsos.
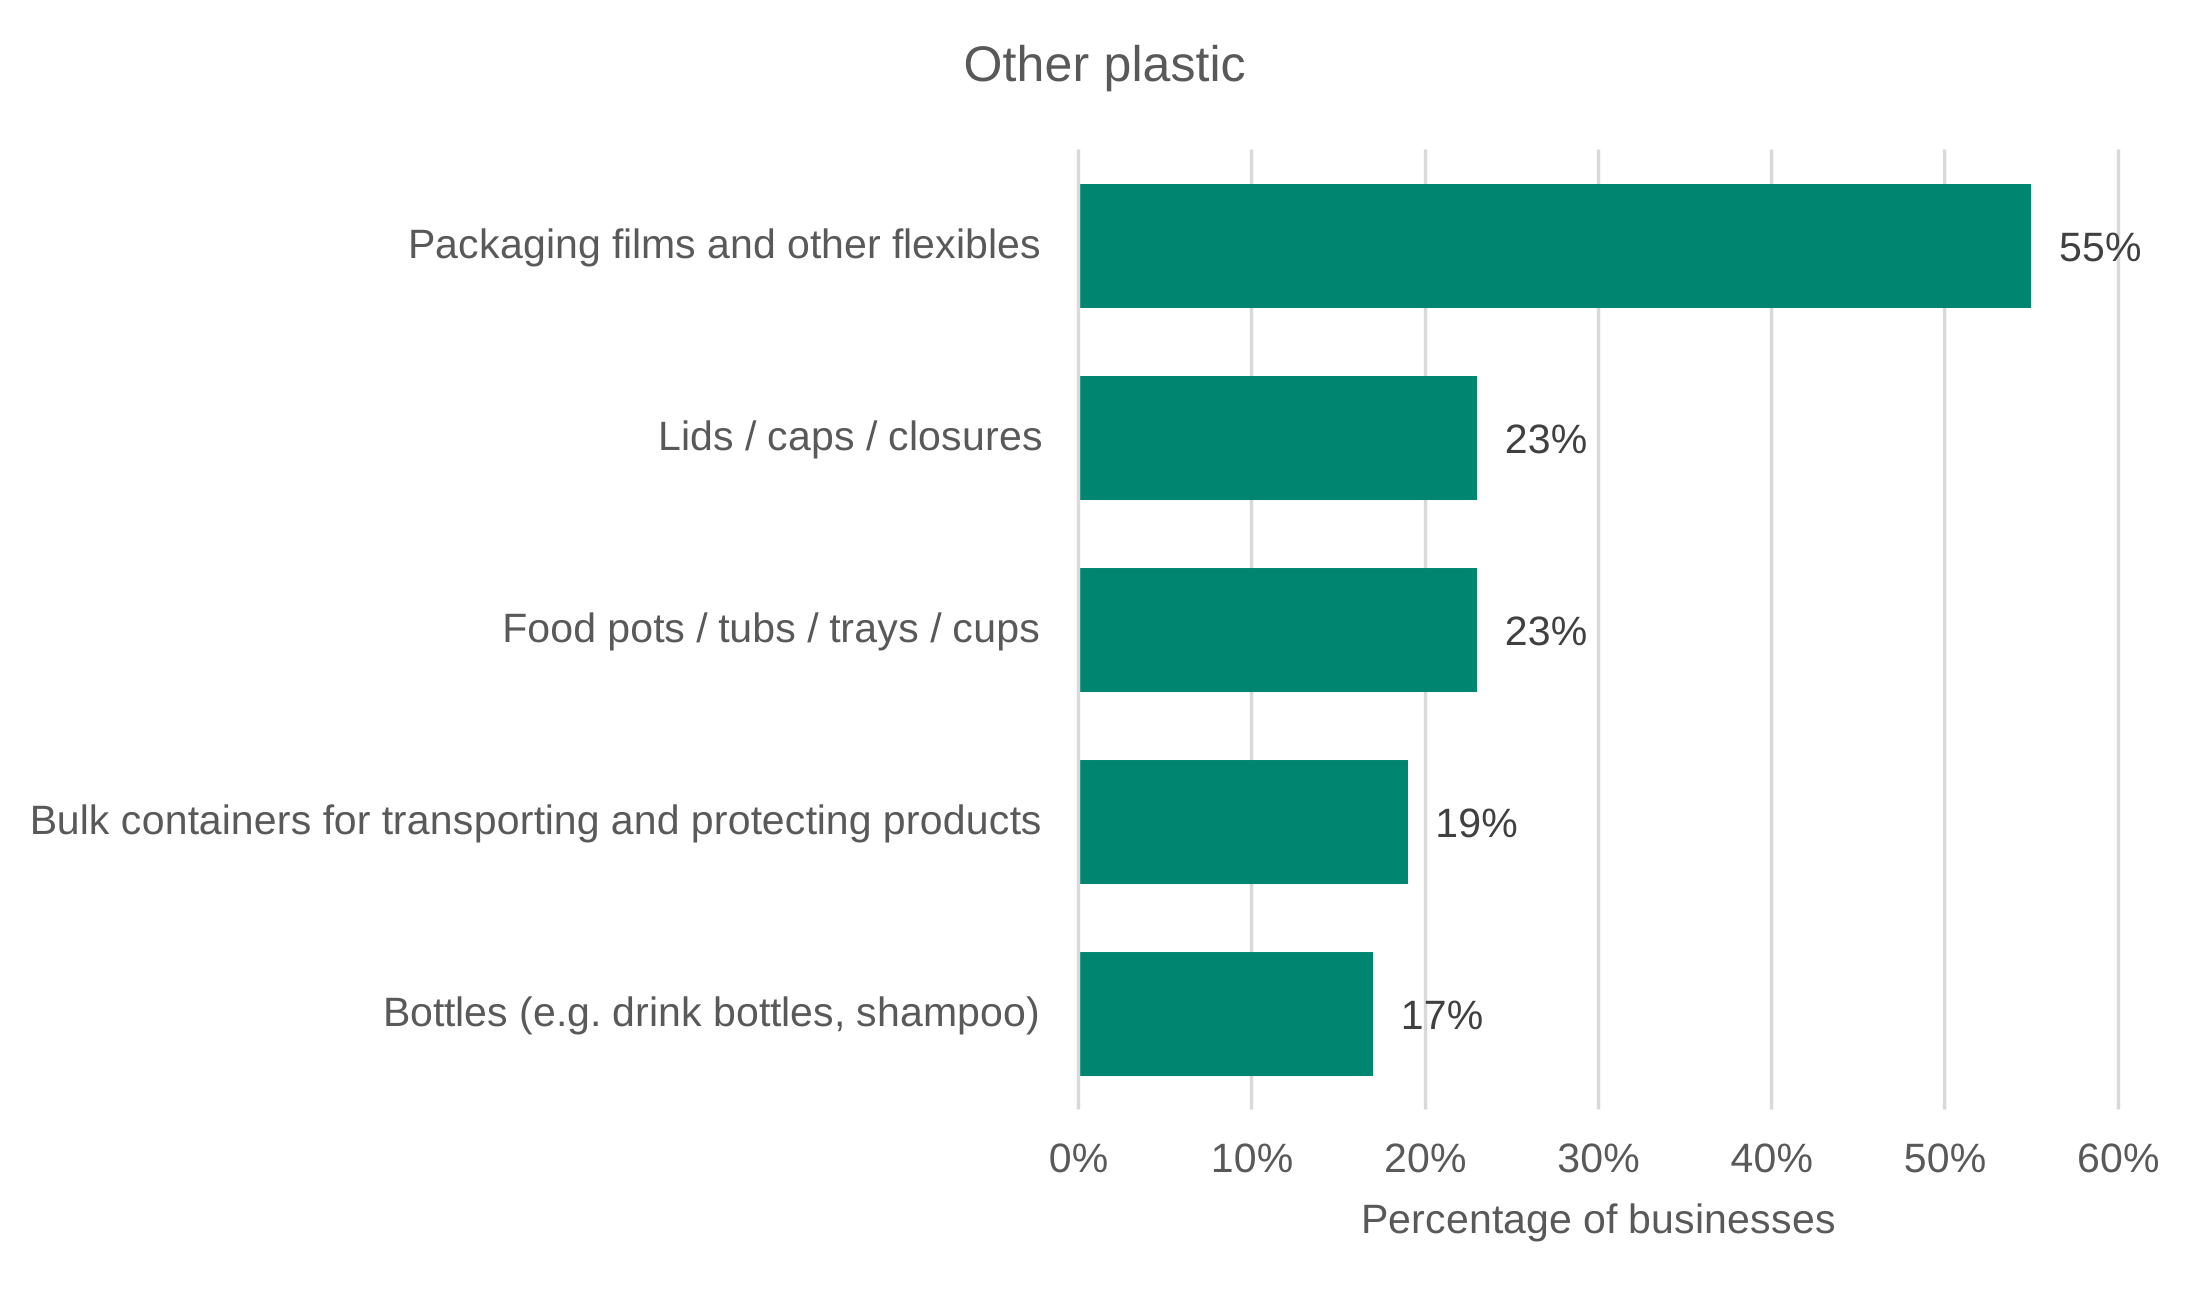
Data for Figure C.15: Survey results for the 5 most common responses to the question ‘Which of the following best describes the plastic packaging product(s) your business manufactures or imports?’, by other plastic.
The base for Other was 70. Given the small sample size, results for this plastic type should be interpreted with caution. Source: Ipsos.
| Packaging product | Other plastic |
|---|---|
| Packaging films and other flexibles | 55% |
| Lids / caps / closures | 23% |
| Food pots / tubs / trays / cups | 23% |
| Bulk containers for transporting and protecting products | 19% |
| Bottles (for example drink bottles, shampoo) | 17% |
Figure C.16: Survey results for the 5 most common responses to the question ‘Which of the following best describes the plastic packaging product(s) your business manufactures or imports?’, by ‘Don’t know’ plastic type.
The base for ‘Don’t know’ was 304. Source: Ipsos.
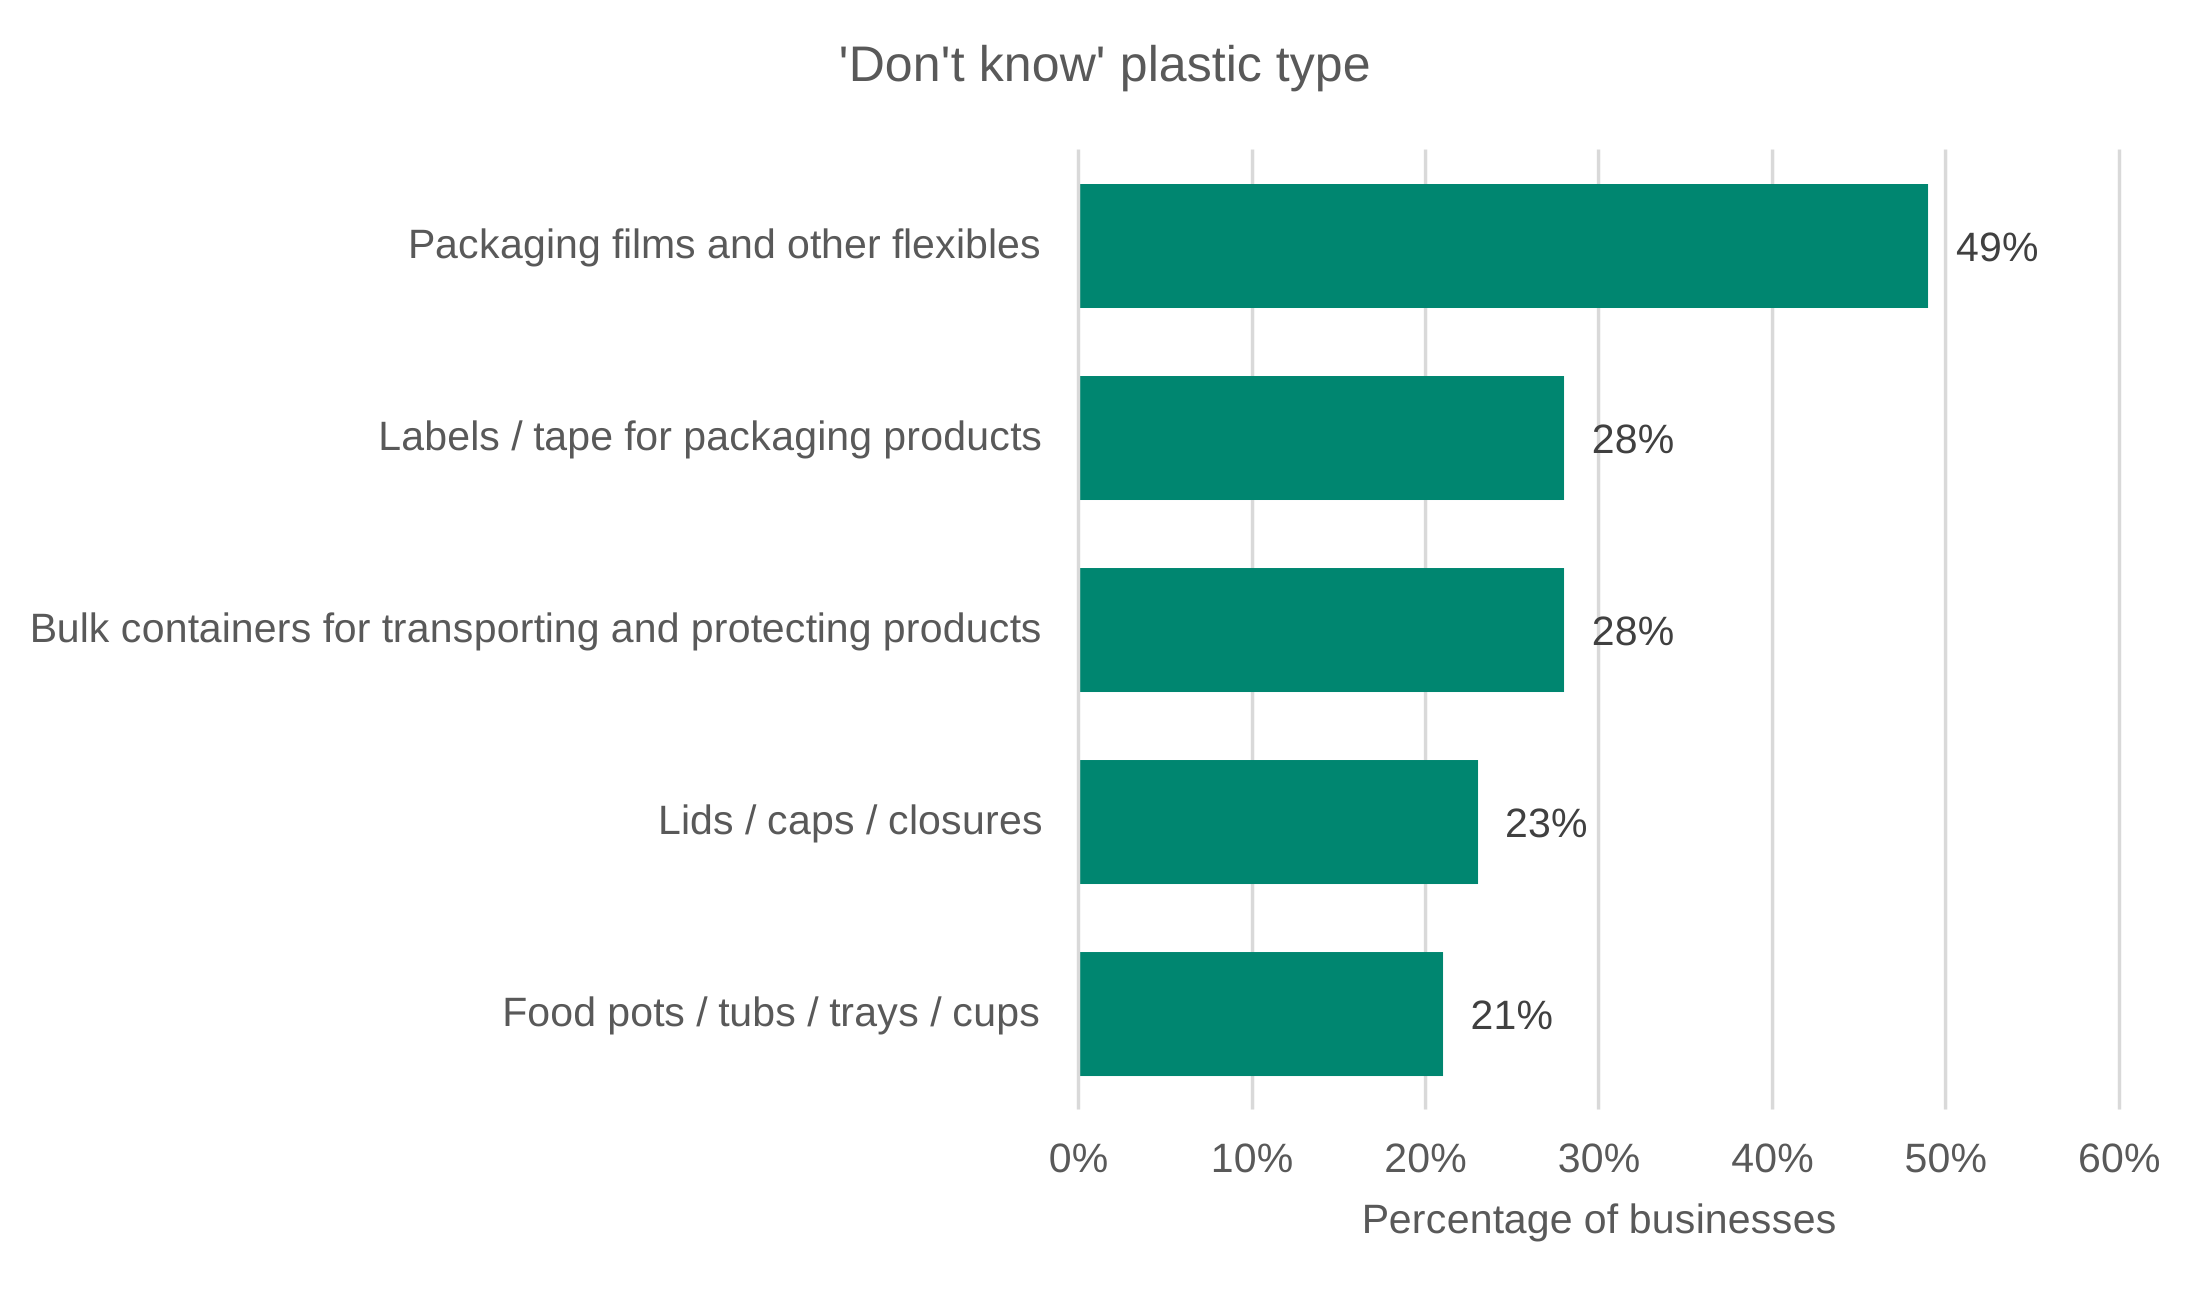
Data for Figure C.16: Survey results for the 5 most common responses to the question ‘Which of the following best describes the plastic packaging product(s) your business manufactures or imports?’, by ‘Don’t know’ plastic type.
The base for ‘Don’t know’ was 304. Source: Ipsos.
| Packaging product | Don’t know plastic type |
|---|---|
| Packaging films and other flexibles | 49% |
| Labels / tape for packaging products | 28% |
| Bulk containers for transporting and protecting products | 28% |
| Lids / caps / closures | 23% |
| Food pots / tubs / trays / cups | 21% |
Figure C.17: Survey results for the question ‘Has the total tonnage of plastic packaging you manufacture and/or import changed due to Plastic Packaging Tax?’ broken down by type of plastic used in packaging.
The base for HDPE or LDPE was 430, for PET it was 346, for PP it was 376, and for PS it was 114. Source: Ipsos.
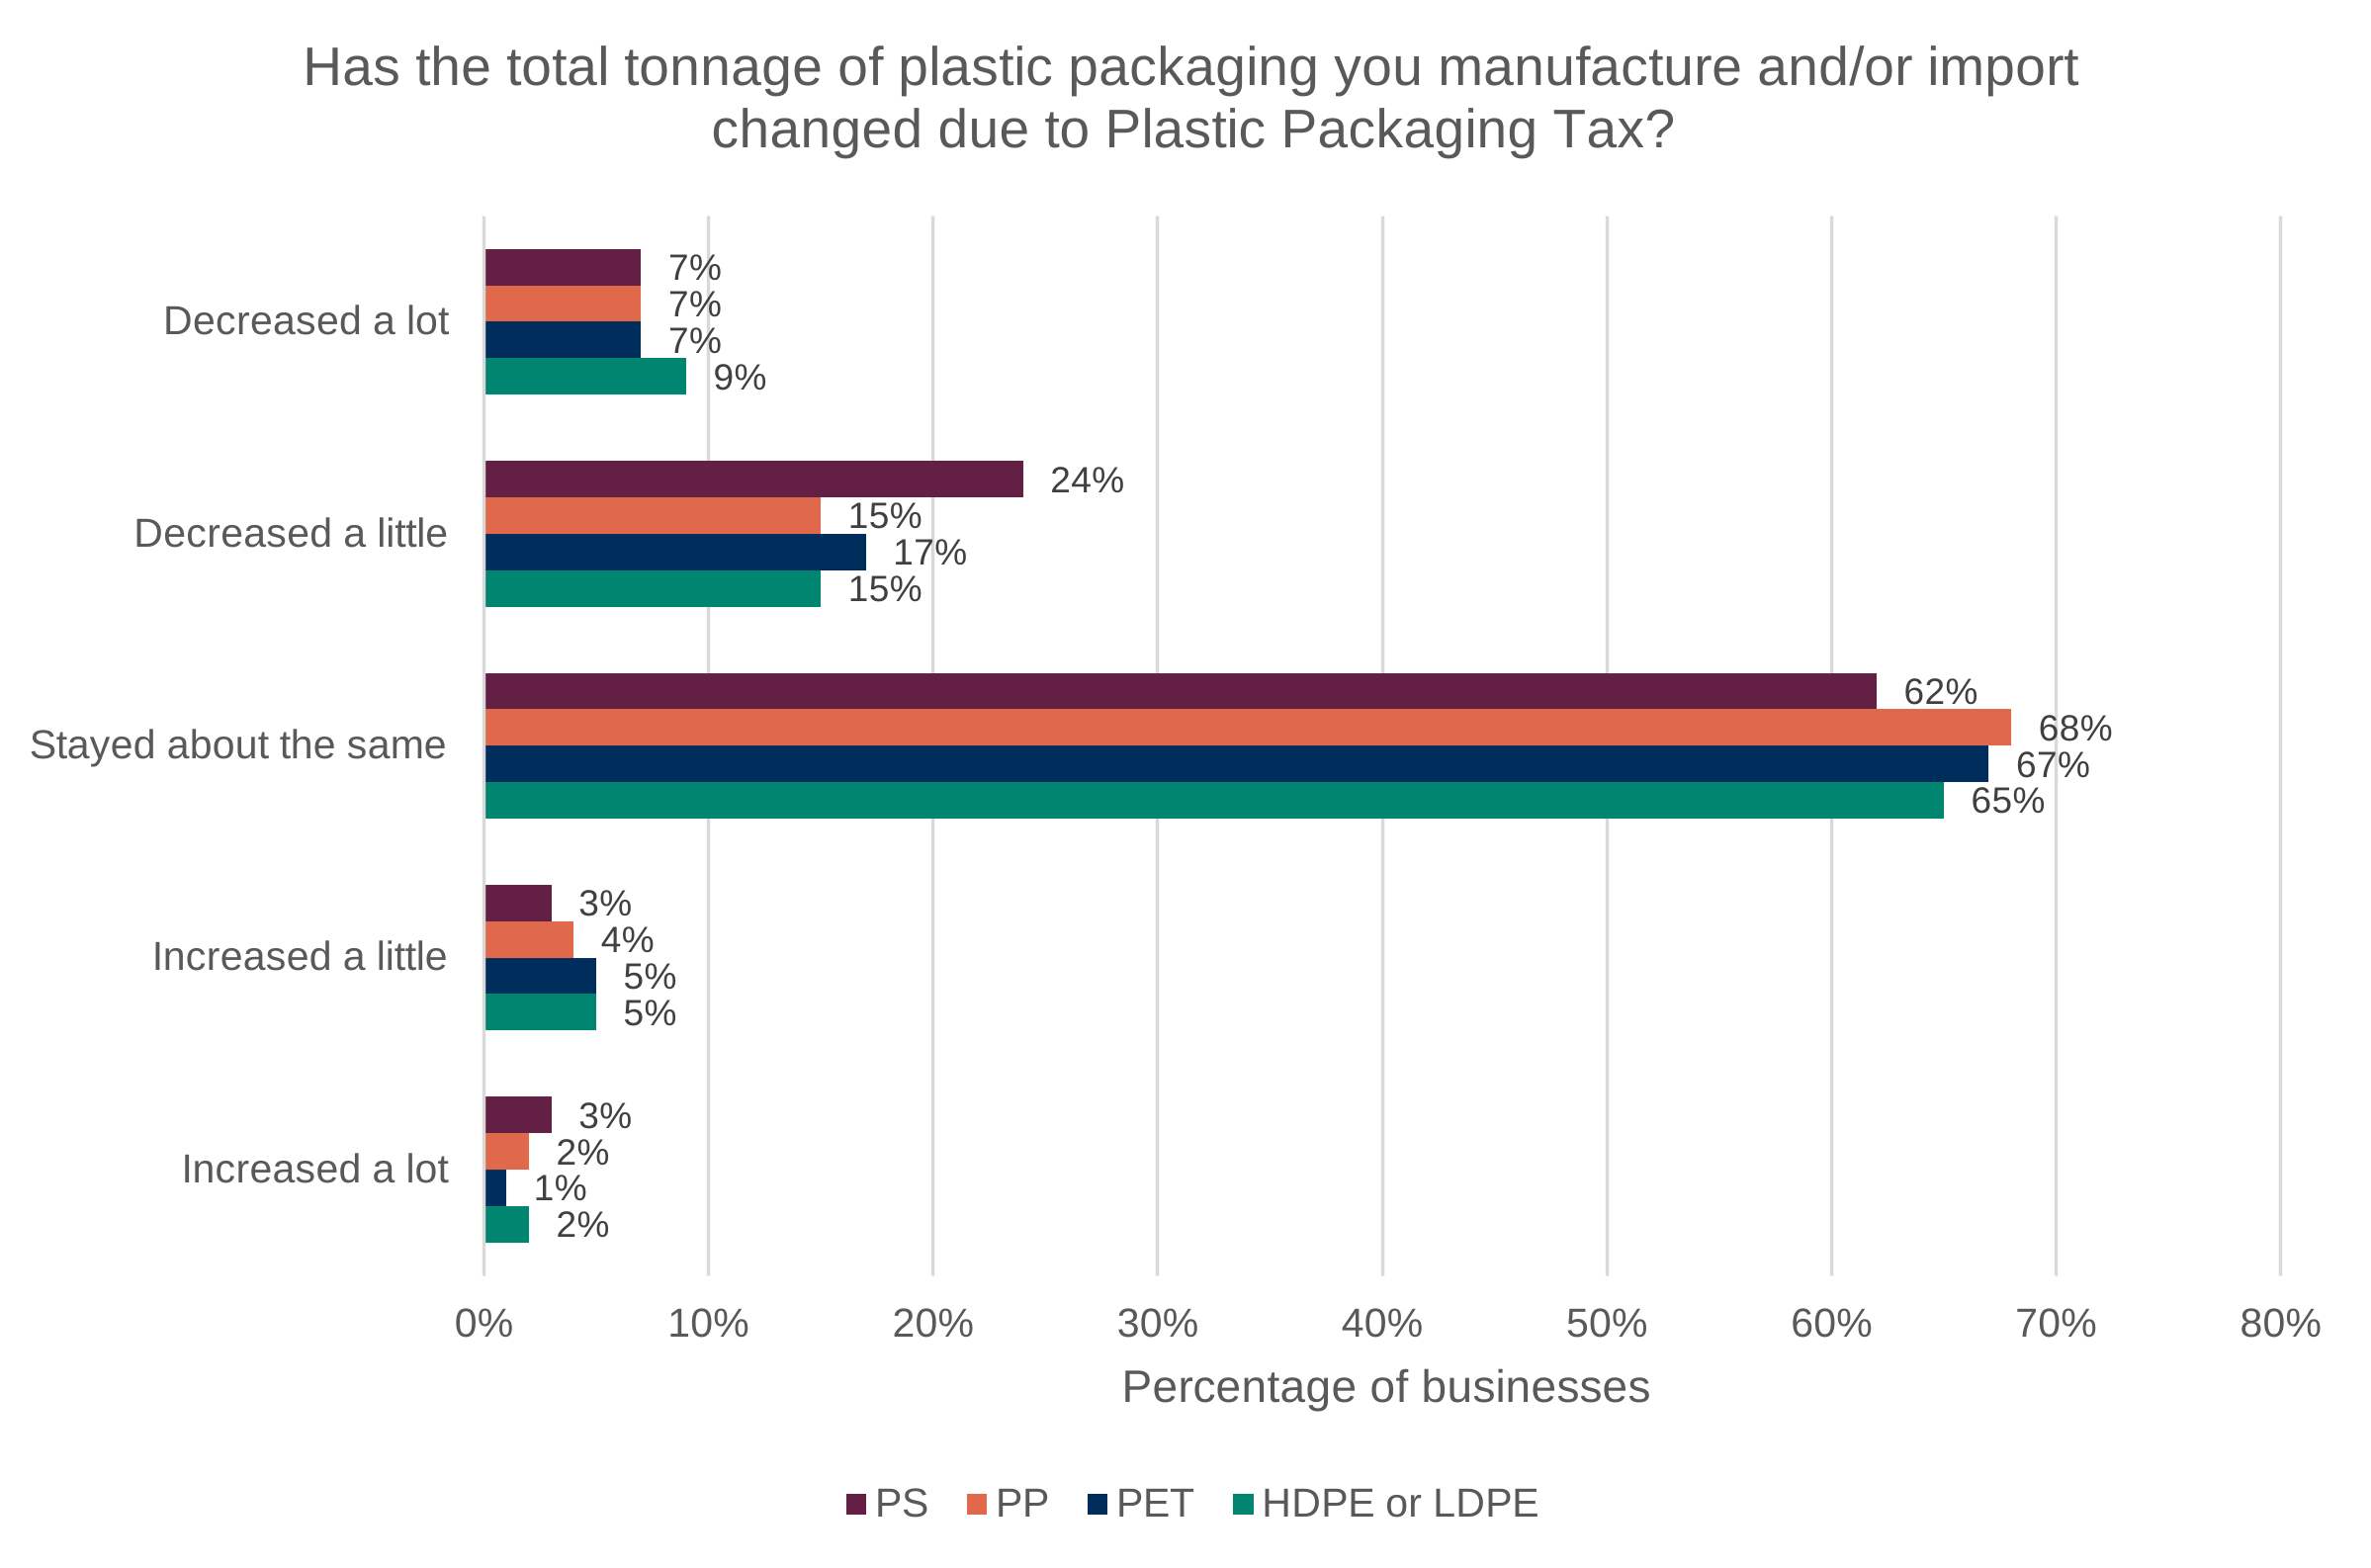
Data for Figure C.17: Survey results for the question ‘Has the total tonnage of plastic packaging you manufacture and/or import changed due to Plastic Packaging Tax?’ broken down by type of plastic used in packaging.
The base for HDPE or LDPE was 430, for PET it was 346, for PP it was 376, and for PS it was 114. Source: Ipsos.
| Category | HDPE or LDPE | PET | PP | PS |
|---|---|---|---|---|
| Decreased a lot | 9% | 7% | 7% | 7% |
| Decreased a little | 15% | 17% | 15% | 24% |
| Stayed about the same | 65% | 67% | 68% | 62% |
| Increased a little | 5% | 5% | 4% | 3% |
| Increased a lot | 2% | 1% | 2% | 3% |
Figure C.17 shows that across the 4 main polymer types, the majority of businesses reported that total tonnage had stayed about the same due to PPT, ranging from 62 to 68%. This suggests limited widespread change in overall volumes of plastic packaging across plastic types. However, there is some variation in reported decreases: PS shows a higher proportion of businesses reporting that tonnage had decreased a little (24%) compared to other polymer types, which are more clustered around 15 to 17%. Reported increases in tonnage are consistently low across all polymer types.
Across the core polymer types, Figure 5.7 in Chapter 5 demonstrates that the majority of businesses reported that the proportion of recycled content had stayed about the same in their packaging, though this is notably lower for HDPE or LDPE (52%) than for PS, PP and PET. The difference between HDPE or LDPE and both PET and PP is statistically significant, indicating that businesses using HDPE or LDPE were less likely to report no change in recycled content compared to those using PET and PP (with PS not statistically distinct).
Furthermore, HDPE or LDPE stands out in terms of reported increases in recycled content. A substantially higher proportion of businesses using HDPE or LDPE report that recycled content has increased a lot (22%), compared to PS (9%), PP (13%), and PET (12%). These differences are statistically significant, suggesting a materially stronger response among HDPE or LDPE users. However, a different pattern is observed for smaller adjustments. PS has a comparatively higher proportion of businesses reporting that recycled content has increased a little (28%), and this is statistically significantly higher than for HDPE or LDPE (18%). This may indicate that, for PS, businesses have been more likely to make incremental or marginal increases in recycled content, rather than the larger step changes seen for HDPE or LDPE. Reported increases of any size (combining ‘increased a little’ and ‘increased a lot’) are therefore most pronounced for HDPE and LDPE with 40% of businesses reporting positive changes. Reported decreases in recycled content are relatively uncommon across all polymer types.
Figure C.18: Survey results for the question ‘By approximately how much has the proportion of recycled plastic content increased due to Plastic Packaging Tax?’ broken down by type of plastic used in packaging.
The base for HDPE or LDPE was 179, for PET it was 116, and for PP it was 133. Source: Ipsos.
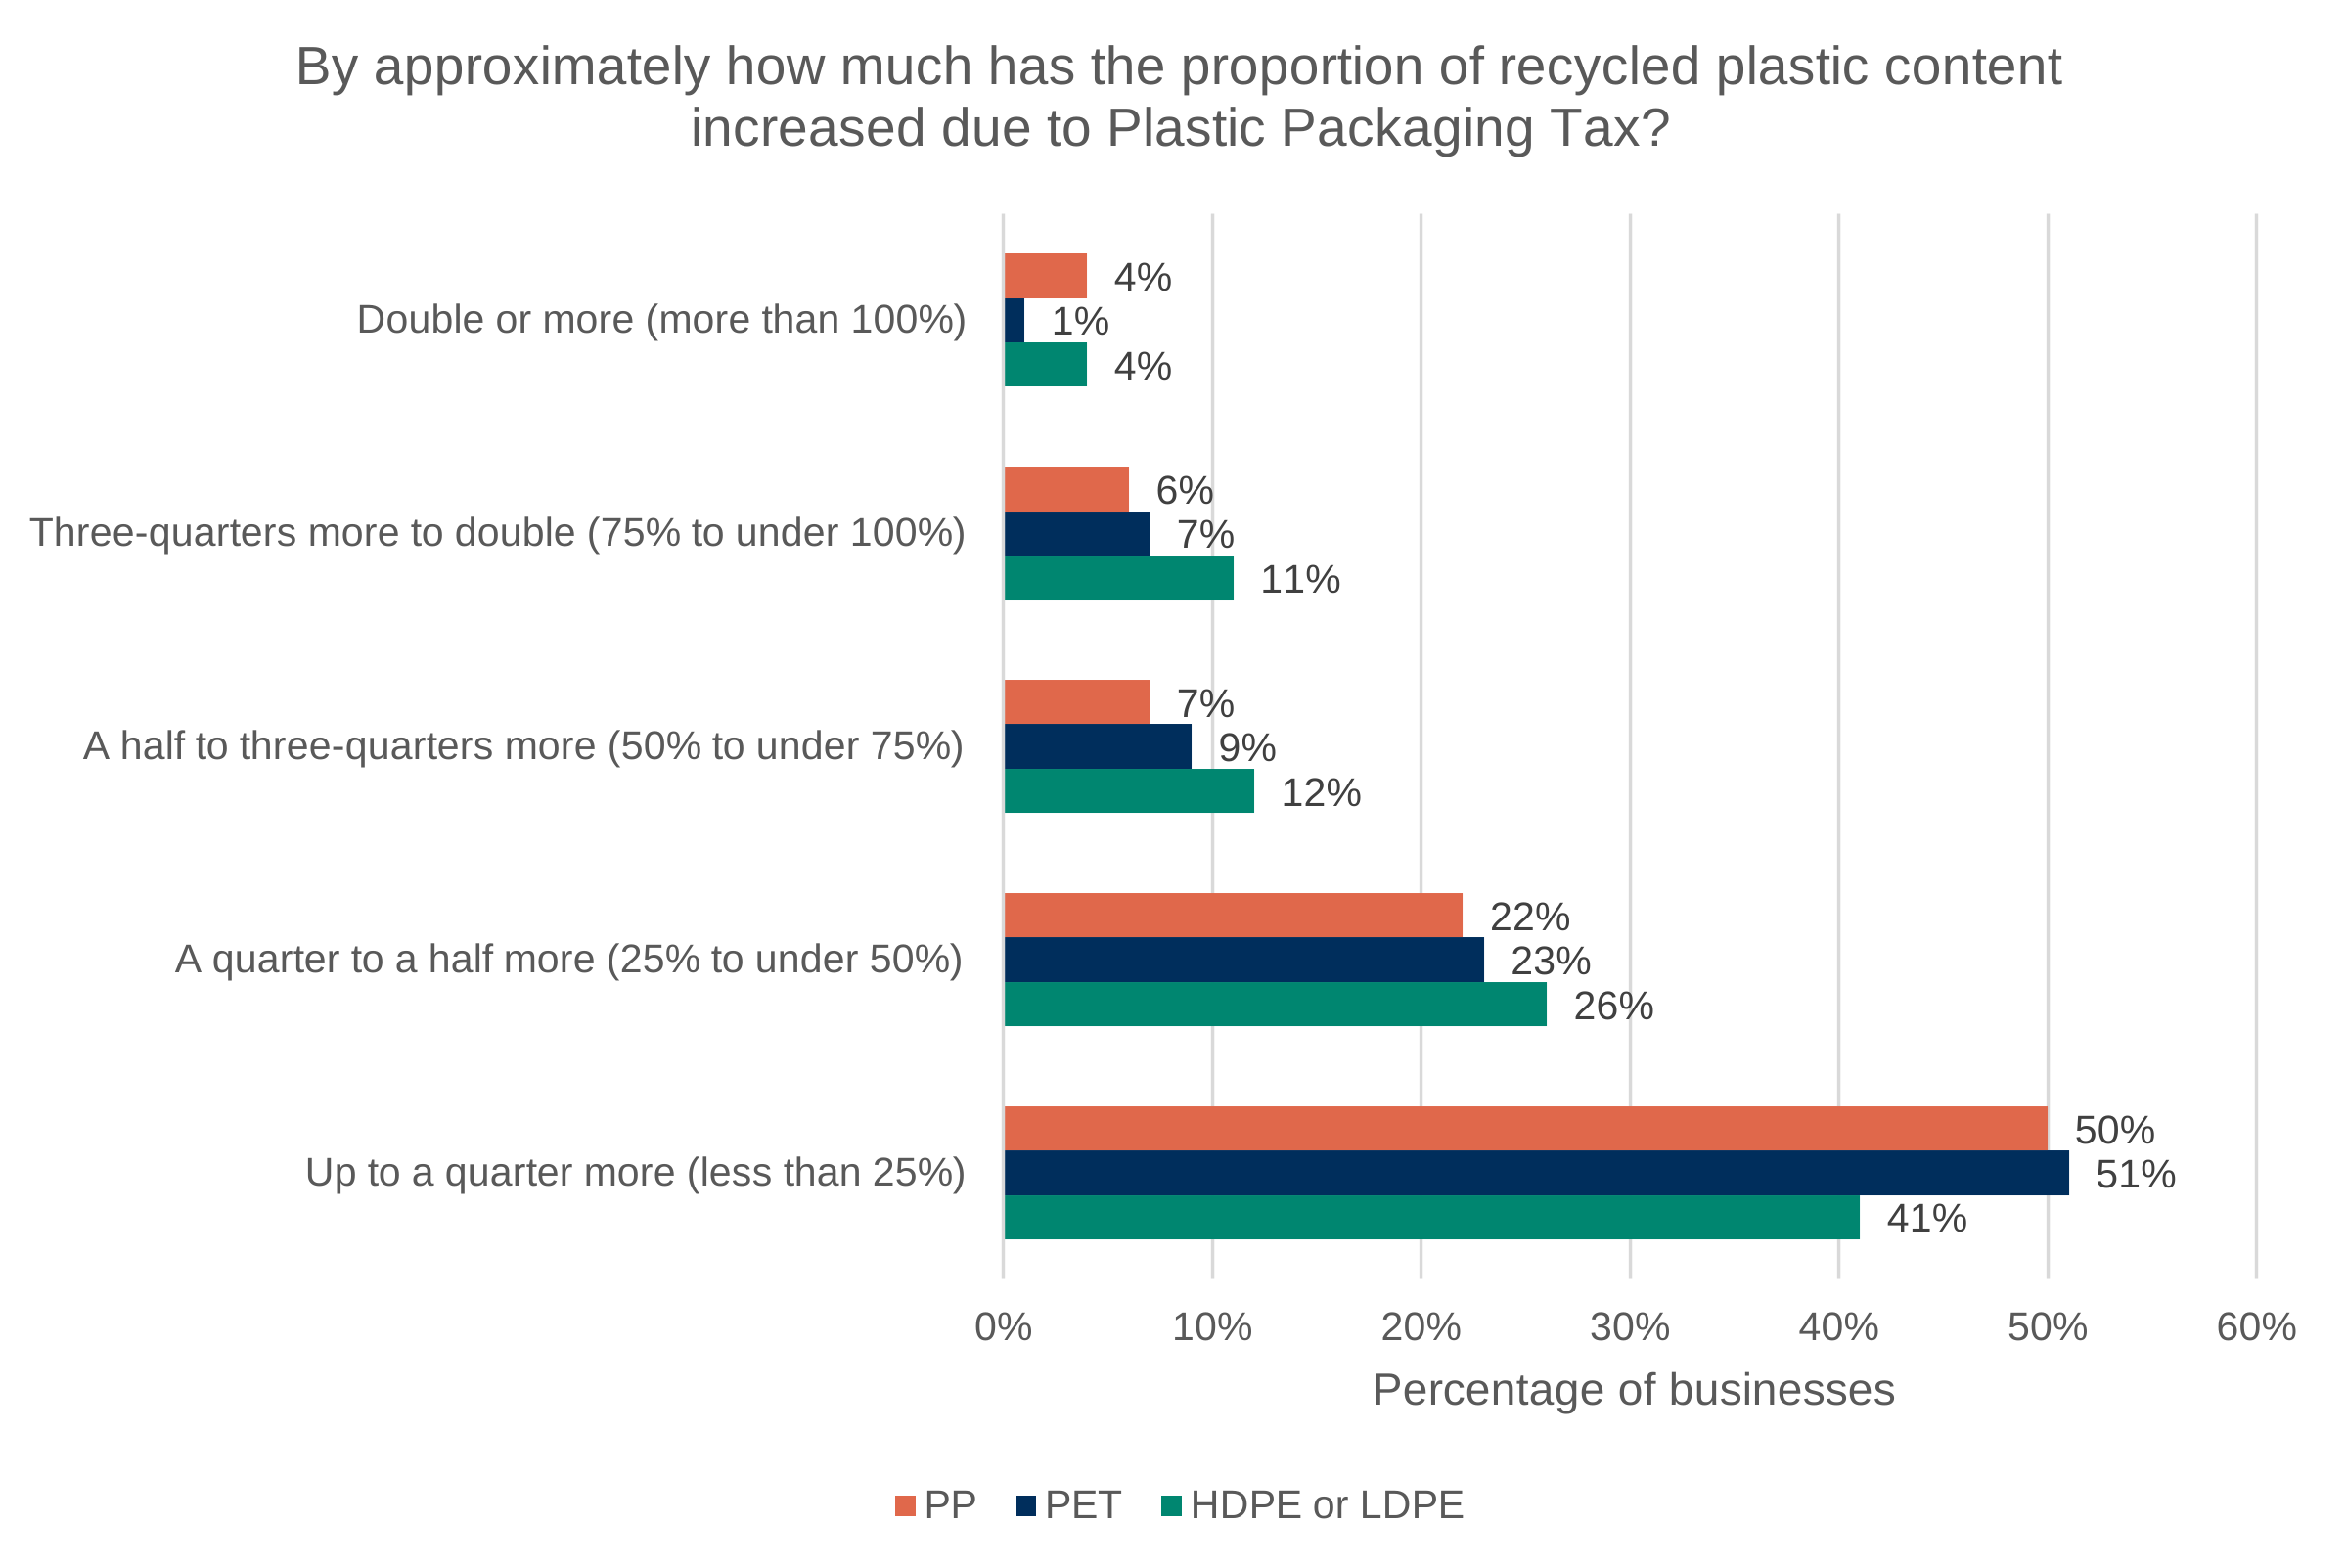
Data for Figure C.18: Survey results for the question ‘By approximately how much has the proportion of recycled plastic content increased due to Plastic Packaging Tax?’ broken down by type of plastic used in packaging.
The base for HDPE or LDPE was 179, for PET it was 116, and for PP it was 133. Source: Ipsos.
| Category | HDPE or LDPE | PET | PP |
|---|---|---|---|
| Double or more (more than 100%) | 4% | 1% | 4% |
| 3-quarters more to double (75% to under 100%) | 11% | 7% | 6% |
| A half to 3-quarters more (50% to under 75%) | 12% | 9% | 7% |
| A quarter to a half more (25% to under 50%) | 26% | 23% | 22% |
| Up to a quarter more (less than 25%) | 41% | 51% | 50% |
The findings in Figure C.18 exclude PS due to a small sample size for respondents reporting increases, meaning results are presented for PP, PET and HDPE or LDPE only. Among these polymer types, most businesses that reported an increase in recycled content indicated that the scale of change was relatively modest, with the most common response being ‘up to a quarter more’. However, this proportion is notably lower for HDPE or LDPE (41%) than for PP (50%) and PET (51%), and these differences are statistically significant, suggesting that increases for HDPE or LDPE are less concentrated at the lower end of the distribution.
Instead, businesses using HDPE or LDPE are more likely to report larger increases in recycled content. For example, a higher proportion report increases in the ‘3-quarters more to double’ category (11%), compared to PP (6%), with this difference statistically significant. A similar pattern is observed for other mid-to-higher increase bands, where HDPE or LDPE generally has higher shares than both PP and PET, indicating a tendency towards more substantial changes overall.
These results reinforce the pattern observed, namely that increases in recycled content for HDPE or LDPE are more likely to be larger step changes, whereas for PP and PET, increases tend to be more incremental and concentrated at lower magnitude ranges.
Figure C.19: Survey results for the question ‘What, if anything, is preventing your business from increasing recycled content in your plastic packaging?’ broken down by type of plastic used in packaging.
The base for HDPE or LDPE was 430, for PET it was 346, for PP it was 376, and for PS it was 114. Source: Ipsos.
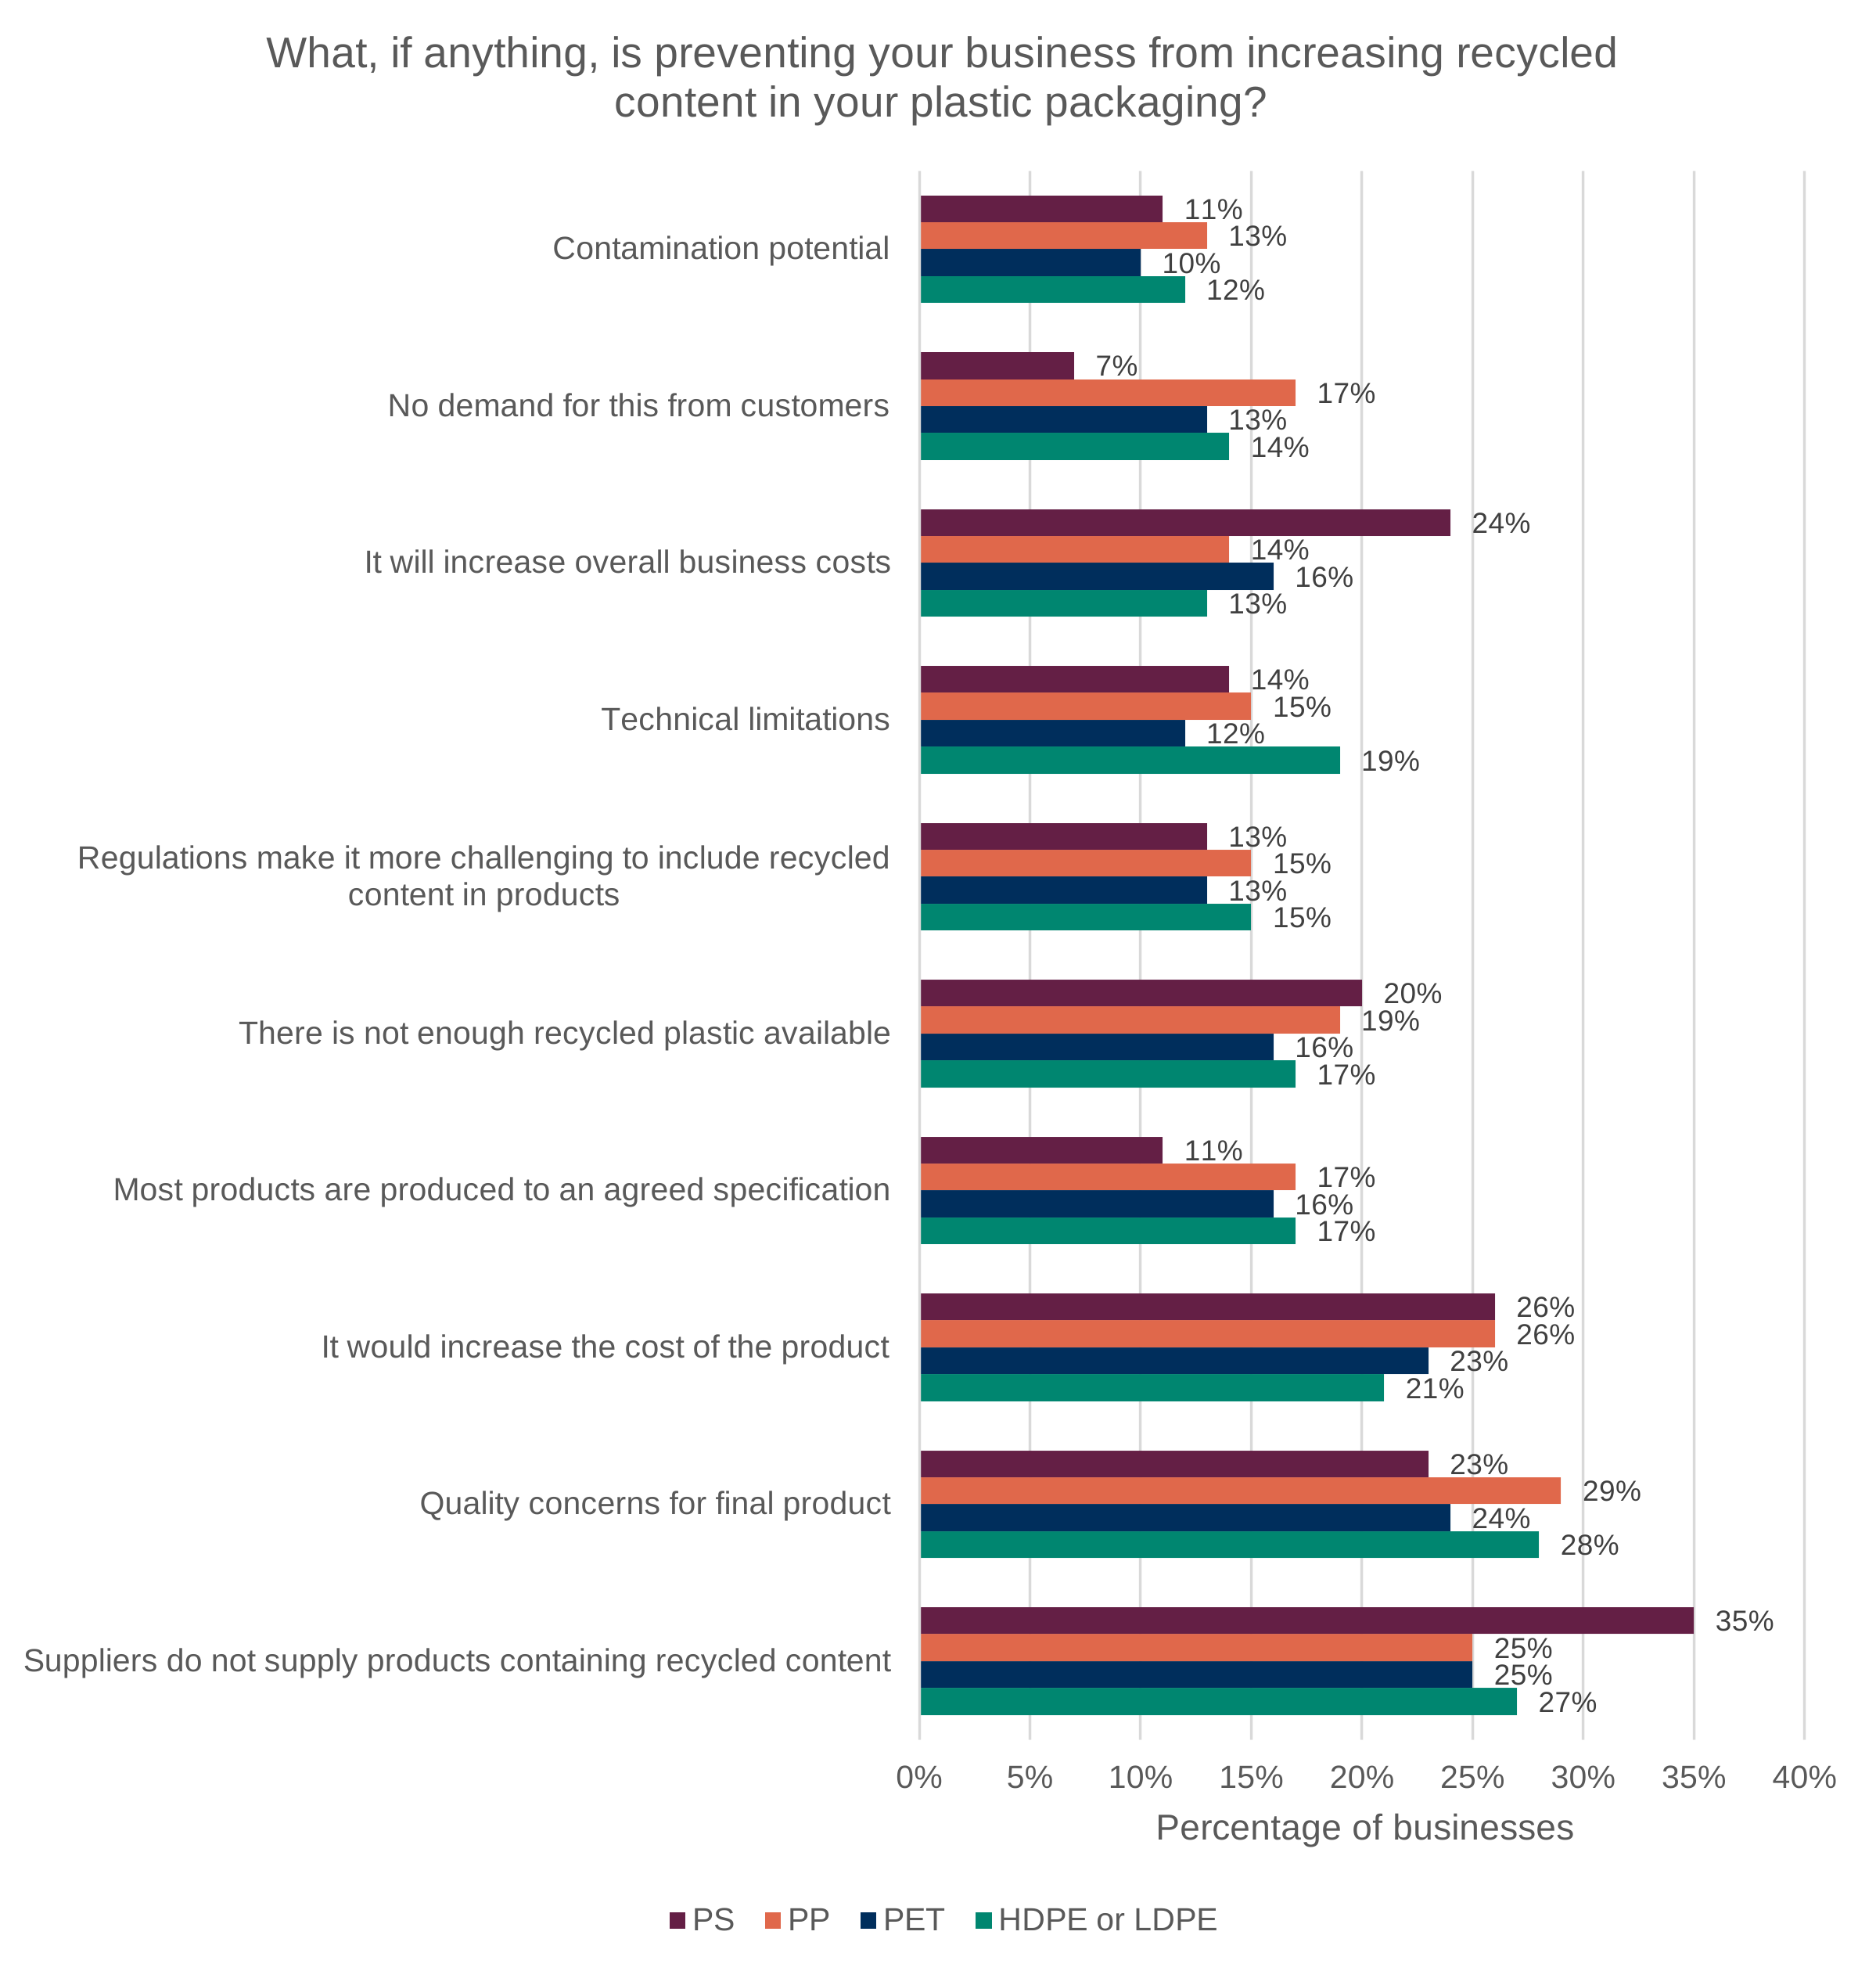
Data for Figure C.19: Survey results for the question ‘What, if anything, is preventing your business from increasing recycled content in your plastic packaging?’ broken down by type of plastic used in packaging.
The base for HDPE or LDPE was 430, for PET it was 346, for PP it was 376, and for PS it was 114. Source: Ipsos.
| Category | HDPE or LDPE | PET | PP | PS |
|---|---|---|---|---|
| Contamination potential | 12% | 10% | 13% | 11% |
| No demand for this from customers | 14% | 13% | 17% | 7% |
| It will increase overall business costs | 13% | 16% | 14% | 24% |
| Technical limitations | 19% | 12% | 15% | 14% |
| Regulations make it more challenging to include recycled content in products | 15% | 13% | 15% | 13% |
| There is not enough recycled plastic available | 17% | 16% | 19% | 20% |
| Most products are produced to an agreed specification | 17% | 16% | 17% | 11% |
| It would increase the cost of the product | 21% | 23% | 26% | 26% |
| Quality concerns for final product | 28% | 24% | 29% | 23% |
| Suppliers do not supply products containing recycled content | 27% | 25% | 25% | 35% |
Figure C.19 shows there is evidence of some systematic differences in reported barriers to increasing recycled content across polymer types, which may help to explain the variation in behavioural responses observed.
Supply-side constraints appear particularly relevant for PS: a higher proportion of PS users reported that suppliers do not supply products containing recycled content (35%), which is statistically significantly higher than for PP (25%) and PET (25%), though not statistically distinct from HDPE or LDPE (27%). This suggests that limited availability of suitable recycled inputs may be a more binding constraint for PS relative to some other polymer types.
Cost-related barriers also appear particularly relevant for PS: a higher proportion of PS users reported that increasing recycled content would increase overall business costs (24%), which is statistically significantly higher than for PP (14%) and HDPE or LDPE (13%), but not PET (16%). In addition, there is a statistically significant difference between PP (26%) and HDPE or LDPE (21%) for increasing the cost of the product, indicating that cost pressures may be more salient for some polymers than others.
For demand-and market-related factors, a larger proportion of PP users report that there is no demand from customers for increased recycled content (17%), compared to PS (7%), with this difference statistically significant. This may suggest weaker demand-side incentives for switching among PP users relative to PS.
Finally, material-specific technical considerations showed statistically significant differences between PP (13%) and PET (10%) in reporting contamination potential as a barrier, alongside broader similarity across polymer types. While differences are relatively small in absolute terms, this may point to variation in perceived risks associated with incorporating recycled content.
These findings indicate that differences in behavioural responses across polymer types may reflect a combination of supply constraints, cost pressures, and market demand factors, with PS appearing more constrained by supply and cost considerations, and PP more affected by weaker customer demand signals.
Overall, the findings suggest that behavioural responses to PPT do vary to some extent across polymer types, more so than by packaging type, but these differences are more apparent in the scale and nature of changes in recycled content than in overall reductions in plastic tonnage. Across all major polymer types, most businesses report that total tonnage of plastic packaging has remained broadly unchanged, indicating that substitution away from plastic or reductions in overall use have been limited irrespective of material type.
In contrast, more meaningful variation is observed in responses related to recycled content. Businesses using HDPE or LDPE are more likely to report larger increases in recycled content, compared to lower proportions for PS, PP and PET. This pattern is reinforced by evidence on the magnitude of change, where increases for HDPE or LDPE are less concentrated at lower levels and more likely to fall within higher increase bands. By comparison, businesses using PS are more likely to report incremental increases, for example, suggesting that smaller, marginal adjustments are more common for this material. PP and PET tend to sit between these 2 patterns, with increases more concentrated at lower magnitudes.
These differences in observed behaviour appear to align with variation in reported constraints. For PS, a greater emphasis on supply-side limitations and cost pressures may restrict the scope for larger adjustments and instead lead to more incremental changes. For PP, relatively weaker customer demand signals may dampen incentives to increase recycled content. Meanwhile, for HDPE or LDPE, fewer firms report ‘no change’ and a higher proportion report substantial increases, suggesting that where constraints are less binding or more tractable, larger behavioural responses may be achievable.
The results indicate that while the overall direction of behavioural response is broadly similar across polymer types, the magnitude and form of adjustment differ in a systematic way, reflecting underlying differences in material properties, supply chain conditions, and market incentives. However, these findings should be interpreted with caution, given the reliance on self-reported survey data and the inability to isolate the specific causal impact of PPT from other concurrent factors, including broader market developments and regulatory influences.
C.2.4 UK Plastic Pact
WRAP data is not directly comparable to PPT administrative data. The 2 sources measure related but conceptually distinct quantities and allocate packaging differently. WRAP data is reported at the level of the product system and is typically attributed to brand owners or retailers, reflecting the total packaging associated with products placed on the market. In contrast, PPT data records plastic packaging components at the point at which tax liability arises — namely manufacture or import — and assigns these to the legally liable entity. As a result, packaging associated with a given WRAP member may be reported under different entities in PPT returns, particularly where production or import activities are undertaken by third parties.
Further differences arise from the definition and scope of packaging captured. WRAP’s primary packaging measure includes all packaging up to the point of sale, including certain retail-associated packaging such as carrier and produce bags. PPT data, by contrast, is defined according to the statutory scope of the tax and captures packaging components as defined in legislation. These differences in scope and reporting unit mean that WRAP POM estimates and PPT tonnage cannot be directly compared or used to validate one another at the business level.
Despite these differences, WRAP data remains analytically useful within the evaluation. In particular, membership of the UKPP provides a means of identifying a group of businesses that have made voluntary commitments to reduce the environmental impact of plastic packaging, including increasing recycled content and improving recyclability. This group may therefore be expected to differ systematically from the broader tax base in terms of both baseline behaviour and responsiveness to the introduction of PPT. The purpose of the UKPP analysis is not to estimate the causal impact of PPT on UKPP businesses relative to non-members. Instead, it is used to explore whether behavioural responses appear to differ between businesses with pre-existing commitments to packaging sustainability and those without. This would consequently help in trying to isolate the impact of PPT specifically.
Accordingly, UKPP membership is used within the analysis as a way of segmenting the PPT returns data. Comparing trends for UKPP members against non-members provides an indication of whether businesses that have made voluntary commitments to improve the sustainability of their plastic packaging appear more or less likely to have changed their behaviour following the introduction of the tax. This approach allows the WRAP data to inform the analytical framework, while avoiding direct comparison of non-equivalent measures.
Any observed differences between UKPP members and non-members cannot be interpreted as the isolated effect of PPT. UKPP members voluntarily adopted sustainability commitments prior to the introduction of the tax and may therefore differ from non-members in ways that affect packaging decisions independently of PPT. Observed differences are therefore descriptive and should be interpreted as evidence of heterogeneity in behavioural outcomes rather than causal effects of membership or tax exposure.
In the WRAP data provided, several plastic-type categories consistently report no recycled content over the period observed. These include, for example, Crystalline Polyethylene Terephthalate (CPET), compostable and biodegradable plastic, and multilayer formats. For these materials, recycled content remains zero across all available years. However, aggregated together these categories account for a relatively small share of overall plastic packaging from UKPP members. In 2024, plastic types with zero recycled content made up 11.7% of total plastic packaging placed on the market by UKPP members. As these materials do not exhibit meaningful variation in recycled content over time, they are not the primary focus of the analysis presented in Section 5.4.4.
Figure 5.8 shows that the aggregate proportion of recycled content in plastic packaging from UKPP members has increased steadily over time. The overall recycled content share rose from 9.0% in 2018 to 28.8% in 2024, indicating a substantial shift towards greater use of recycled material. This trend is primarily driven by developments in PET packaging, which shows the most pronounced increase in recycled content over the period, increasing from 14.9% in 2018 to 49.9% in 2024. PET packaging makes up between 40 to 44% of the plastic packaging placed on the market by UKPP members. Polyethylene (PE) makes up 22 to 26% of UKPP member plastic packaging and also exhibits a clear upward trend, with recycled content increasing from 8.1% in 2018 to 20.2% in 2024. Polypropylene (PP), which makes up 20 to 23% of UKPP member packaging, has shown more limited progress, with recycled content remaining relatively low and more variable over time.
Identifying businesses that are members of the UKPP in the PPT tax base allows for testing whether observed data differs meaningfully between businesses with a prior, voluntary commitment to improve packaging sustainability and those without. This in turn will help understand the strength of the signal PPT is having.
Although it was not possible to match all UKPP members to registered businesses in the PPT administrative data, the identification of over 100 businesses provides a sufficiently large subset to explore patterns. The intent is to assess whether trends in this group — such as increased use of packaging with at least 30% recycled content — are more pronounced than among non-members, which could suggest that observable behavioural change is stronger where there is pre-existing motivation and capability, and weaker where there isn’t. The analysis is not limited to recurring members; instead, it includes all businesses that have participated in the UKPP at any point, reflecting a focus on signalled intent rather than sustained membership.
However, any such differences would need to be interpreted cautiously: a stronger observed change among UKPP members is likely not to be fully attributable to PPT, as these businesses were already signalling intent to shift behaviour prior to the tax being active by being part of UKPP. Conversely, if non-members show little or no change over the same period, this may indicate that the tax is less effective in influencing behaviour among businesses that are not already inclined to respond, highlighting potential limits to its impact in driving system-wide change.
Figure C.20: Total tonnage of plastic packaging that met and did not meet the 30% recycled content threshold, comparing UKPP members and associates and non-member businesses across financial years.
Source: HMRC.
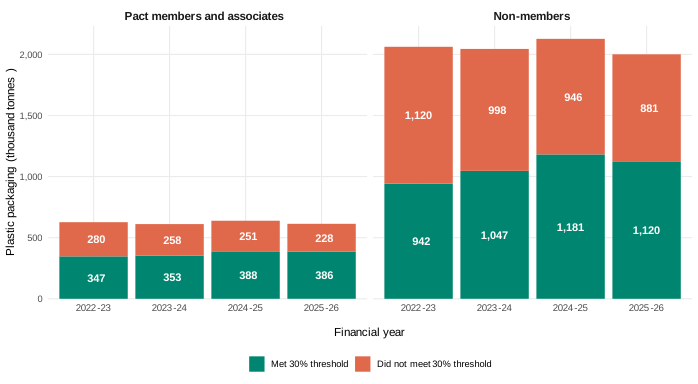
Data for Figure C.20: Total tonnage of plastic packaging that met and did not meet the 30% recycled content threshold, comparing UKPP members and associates and non-member businesses across financial years.
Source: HMRC.
| Membership | Financial year | Met 30% threshold (thousand tonnes) | Did not meet 30% threshold (thousand tonnes) |
|---|---|---|---|
| Pact member/associate | 2022–23 | 347 | 280 |
| Pact member/associate | 2023–24 | 353 | 258 |
| Pact member/associate | 2024–25 | 388 | 251 |
| Pact member/associate | 2025–26 | 386 | 228 |
| Membership | Financial year | Met 30% threshold (thousand tonnes) | Did not meet 30% threshold (thousand tonnes) |
|---|---|---|---|
| Non-member/associate | 2022–23 | 942 | 1,120 |
| Non-member/associate | 2023–24 | 1,047 | 998 |
| Non-member/associate | 2024–25 | 1,181 | 946 |
| Non-member/associate | 2025–26 | 1,120 | 881 |
Figure C.20 highlights the amount of plastic packaging handled by businesses linked to the UKPP and those who aren’t. The 118 businesses in the administrative data that were identified as members or associates of the UKPP account for a substantial share of activity, representing approximately 18 to 23% of total packaging reported to HMRC in any given financial year. As a result, their behaviour has the potential to materially influence aggregate trends observed in the data.
Figure 5.9 further illustrates that UKPP members and associates consistently report a higher proportion of their plastic packaging meeting the 30% recycled content threshold. While both groups have demonstrated increases in this proportion, UKPP members and associates had a comparatively higher starting point and consistently increased over the years of the tax being active. For non-members or associates, the most pronounced change was between the first and second year of the tax. Moreover, the difference between UKPP members and non-members is statistically significant. This suggests that factors beyond PPT, such as pre-existing environmental commitments, business strategies, or differing capabilities, may also contribute to observed differences in recycled-content outcomes.
A Wilcoxon rank-sum test was conducted to assess differences in the distribution of packaging falling above the recycled content threshold between UK Plastics Pact members and non-members. The test indicated a statistically significant difference between the 2 groups (W = 4,031,707, p < 0.001), with UK Plastics Pact members generally reporting higher levels of recycled content.
Figure C.21: Boxplots comparing the percentage of packaging above and below the 30% recycled content threshold for UKPP members and associates versus all remaining businesses.
Source: HMRC.
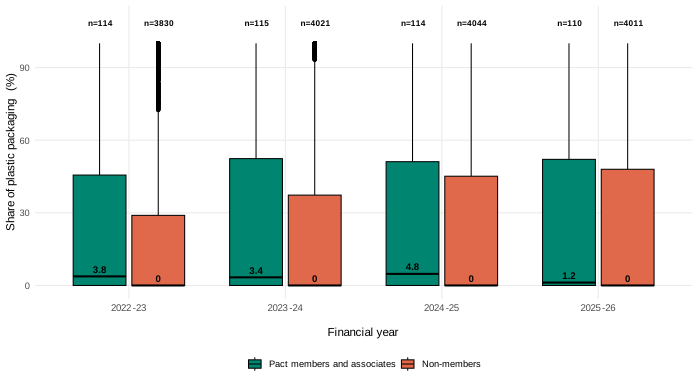
Figure C.21 further demonstrates that UKPP members and associates have consistently had higher percentages of recycled plastic packaging than non-members across all financial years since the tax became active. While the median proportion of packaging above the threshold remained low for both groups, the distribution for UKPP-linked businesses was consistently shifting towards higher values (until the most recent year), with larger upper quartiles and a greater concentration of businesses reporting higher levels of packaging above the recycled content threshold. This suggests that businesses participating in the UKPP were more likely to utilise recycled plastic within their packaging portfolios than businesses outside of the UKPP ecosystem.
The analysis provides consistent evidence that businesses participating in the UKPP have historically exhibited higher levels of recycled-content use than businesses outside the initiative. WRAP data shows substantial growth in recycled content among UKPP members between 2018 and 2024, particularly within PET and PE packaging, indicating that progress towards greater use of recycled material was already occurring within this group prior to, and alongside, the introduction of PPT.
Analysis of PPT administrative data similarly shows that businesses identified as UKPP members or associates consistently report a greater proportion of packaging meeting the 30% recycled-content threshold than non-members. Although both groups increased the proportion of packaging above the threshold after the introduction of PPT, UKPP-linked businesses started from a higher baseline and maintained this advantage throughout the observation period.
These findings suggest that businesses with pre-existing sustainability commitments may be better positioned to utilise recycled plastic within their packaging portfolio. However, the observed differences cannot be attributed solely to PPT. UKPP members voluntarily committed to improving the environmental performance of their packaging before the tax was introduced and are therefore likely to differ from non-members in ways that also influence packaging decisions.
Overall, the analysis indicates that behavioural responses to PPT are not uniform across the tax base. Business characteristics, capabilities and pre-existing environmental commitments appear to influence recycled-content outcomes alongside the incentives created by the tax. This highlights the importance of considering heterogeneity in business responses when assessing the effectiveness of PPT and its ability to drive system-wide change.
C.2.5 Sector Variation
The distribution of businesses across sectors was captured in the quantitative social research and provides important context for interpreting variation in responses to the evaluation questions. Of the 1,011 businesses surveyed, the sample is concentrated in businesses involved in manufacturing (43%) and wholesale and retail trade (47%), with smaller representation from transportation and storage (4%) and accommodation and food service activities (3%).
Figure C.22: Survey results for the question ‘And which of the following sectors does your business primarily operate in?’.
The base for this question is 397, comprised of firms who are in the ‘manufacturing’ sector. Source: Ipsos.
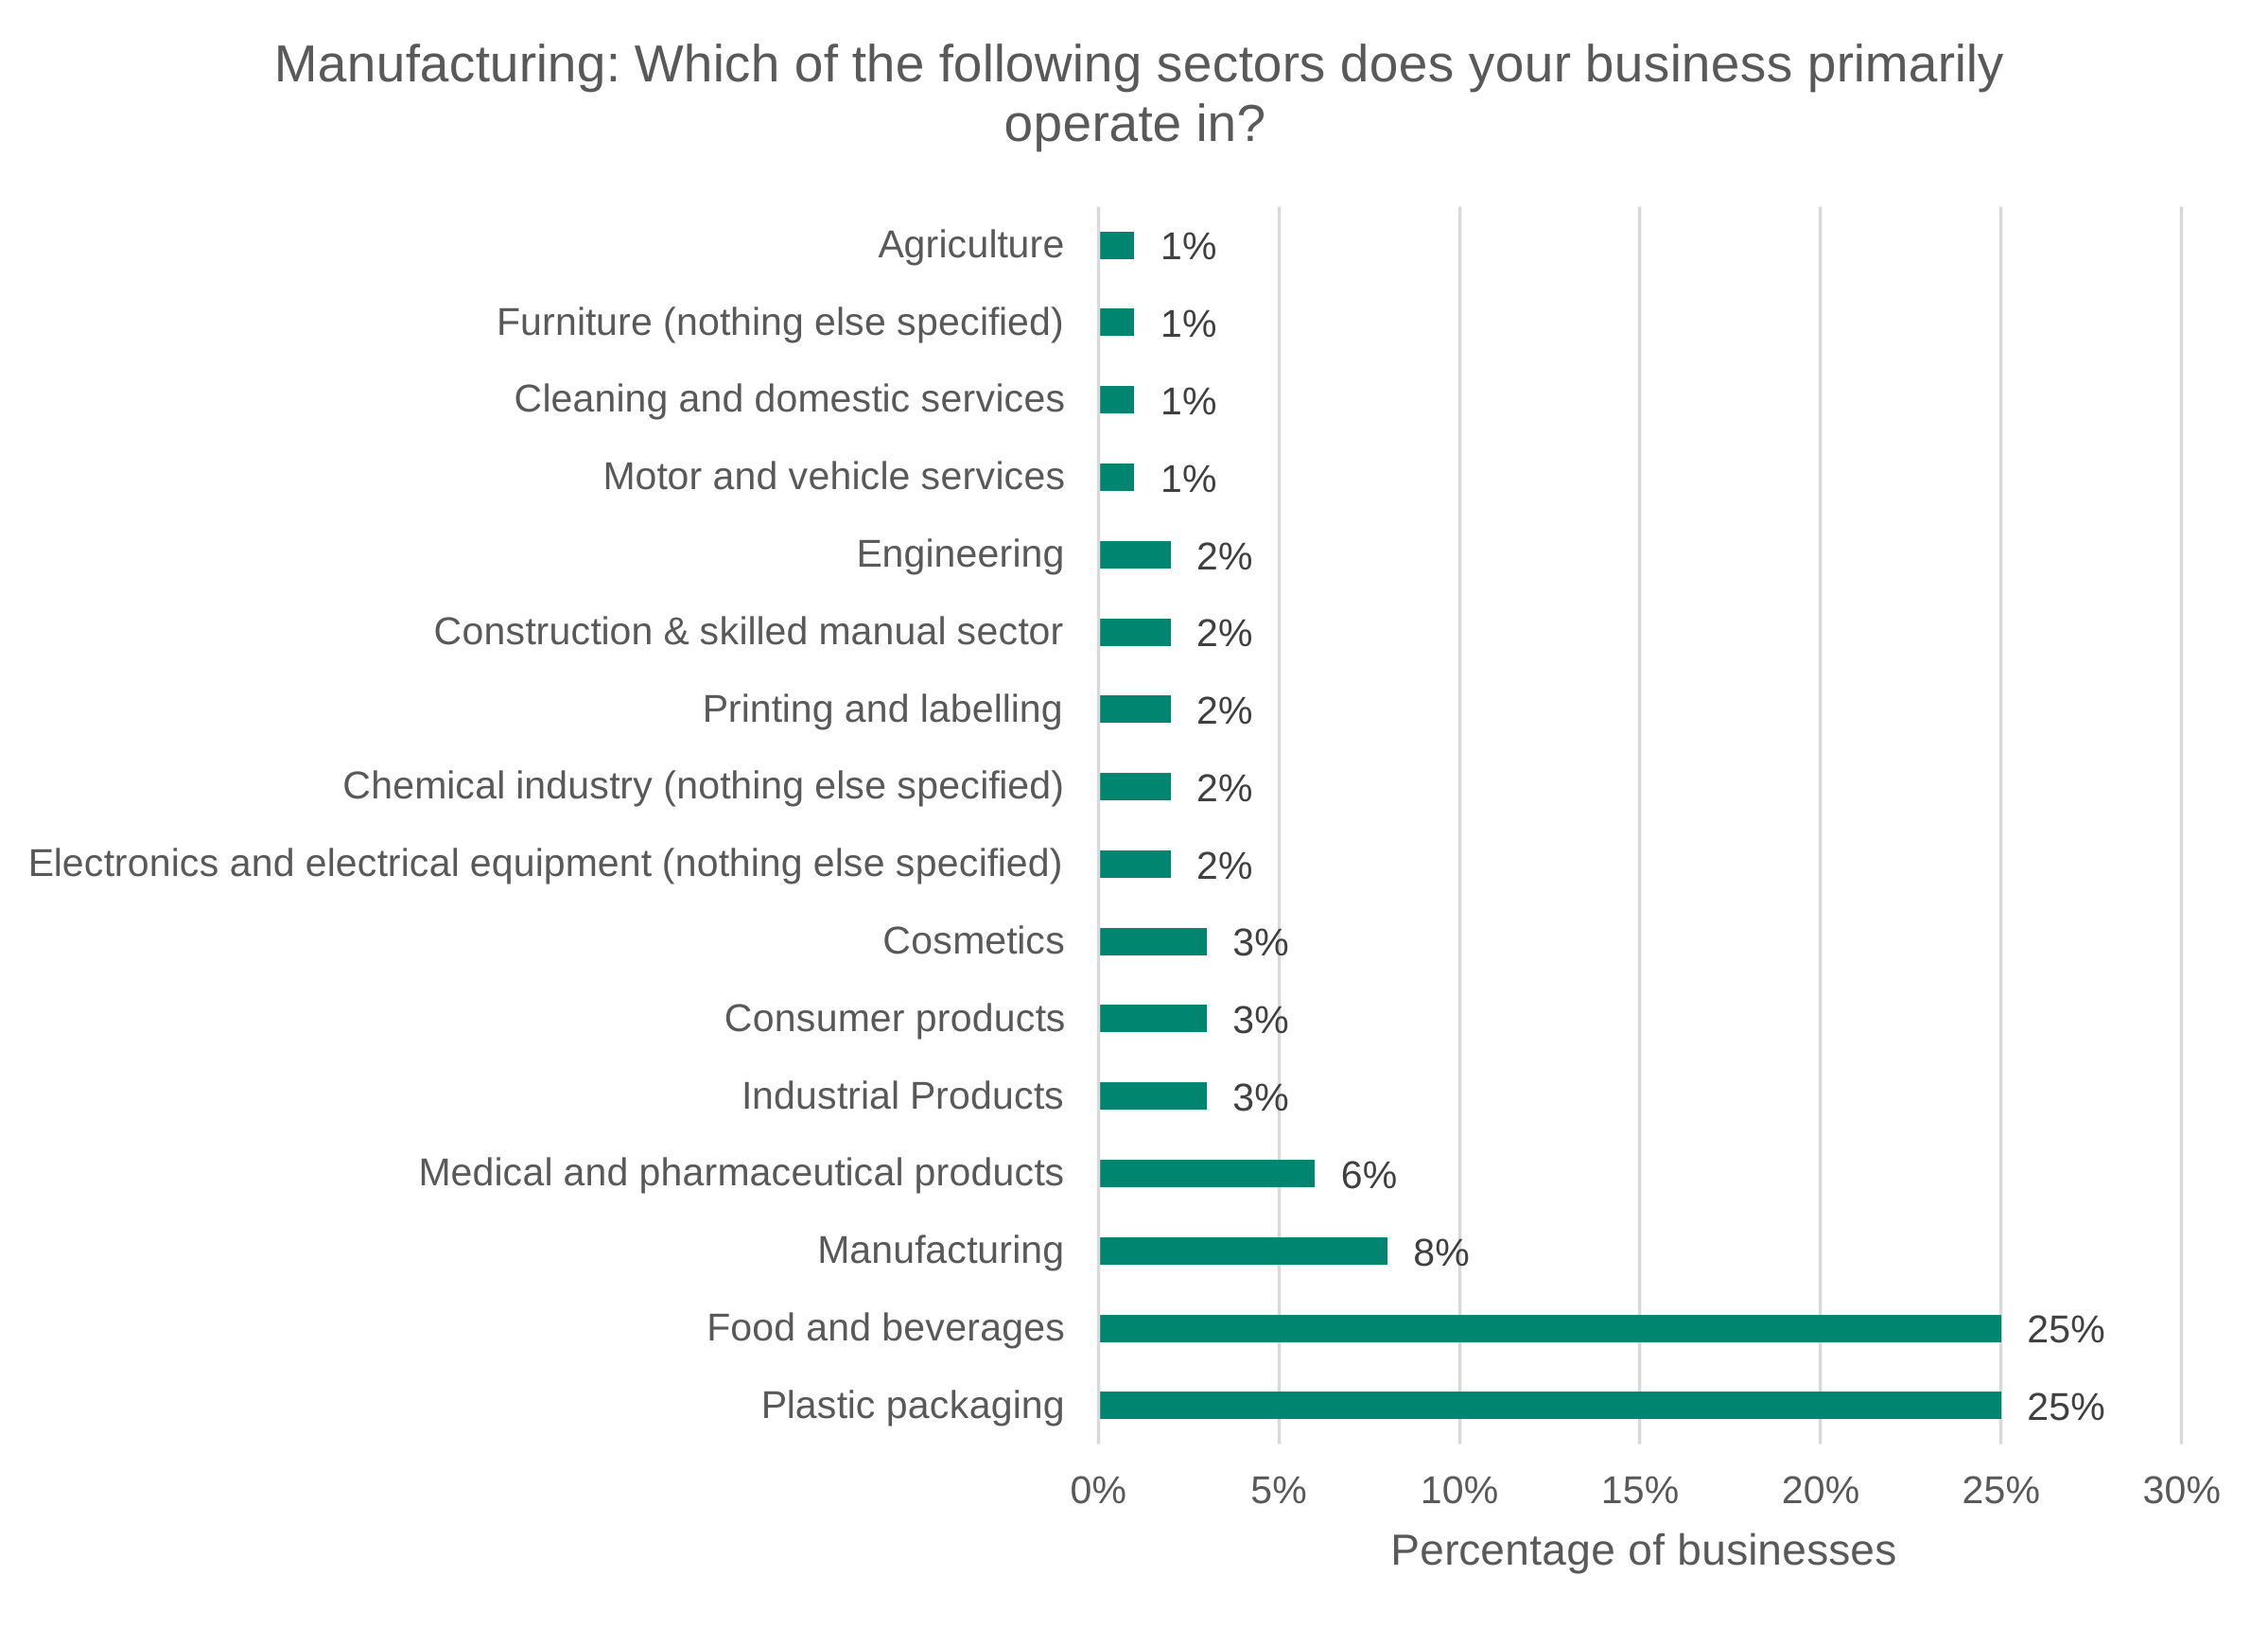
Data for Figure C.22: Survey results for the question ‘And which of the following sectors does your business primarily operate in?’.
The base for this question is 397, comprised of firms who are in the ‘manufacturing’ sector. Source: Ipsos.
| Sector | Percentage of businesses |
|---|---|
| Agriculture | 1% |
| Furniture (nothing else specified) | 1% |
| Cleaning and domestic services | 1% |
| Motor and vehicle services | 1% |
| Engineering | 2% |
| Construction & skilled manual sector | 2% |
| Printing and labelling | 2% |
| Chemical industry (nothing else specified) | 2% |
| Electronics and electrical equipment (nothing else specified) | 2% |
| Cosmetics | 3% |
| Consumer products | 3% |
| Industrial Products | 3% |
| Medical and pharmaceutical products | 6% |
| Manufacturing | 8% |
| Food and beverages | 25% |
| Plastic packaging | 25% |
Figure C.22 shows the distribution of businesses within the manufacturing sector subgroup. The sample is concentrated in a small number of manufacturing activities, with food and beverage production and plastic packaging each accounting for 25% of manufacturing respondents. A further 8% are classified under manufacturing (not otherwise specified), and 6% operate in medical and pharmaceutical products.
The remaining manufacturing activity is more dispersed across a range of sectors, each representing relatively small shares (generally 1-3%), including chemicals, cosmetics, consumer products, engineering, and printing and labelling. This distribution highlights that, while manufacturing businesses form a substantial portion of the sample overall, much of the activity is concentrated in sectors that are closely linked to packaging production and use, with a long tail of smaller, more specialised manufacturing activities. Given these small percentages for other sectors, the sample sizes for these sub-sectors are limited, meaning that results at these levels cannot be used to infer results.
Figure C.23: Survey results for the question ‘And which of the following sectors does your business primarily operate in?’.
The base for this question is 468, comprised of firms who answered ‘wholesale and retail trade’ to the activity. Source: Ipsos.
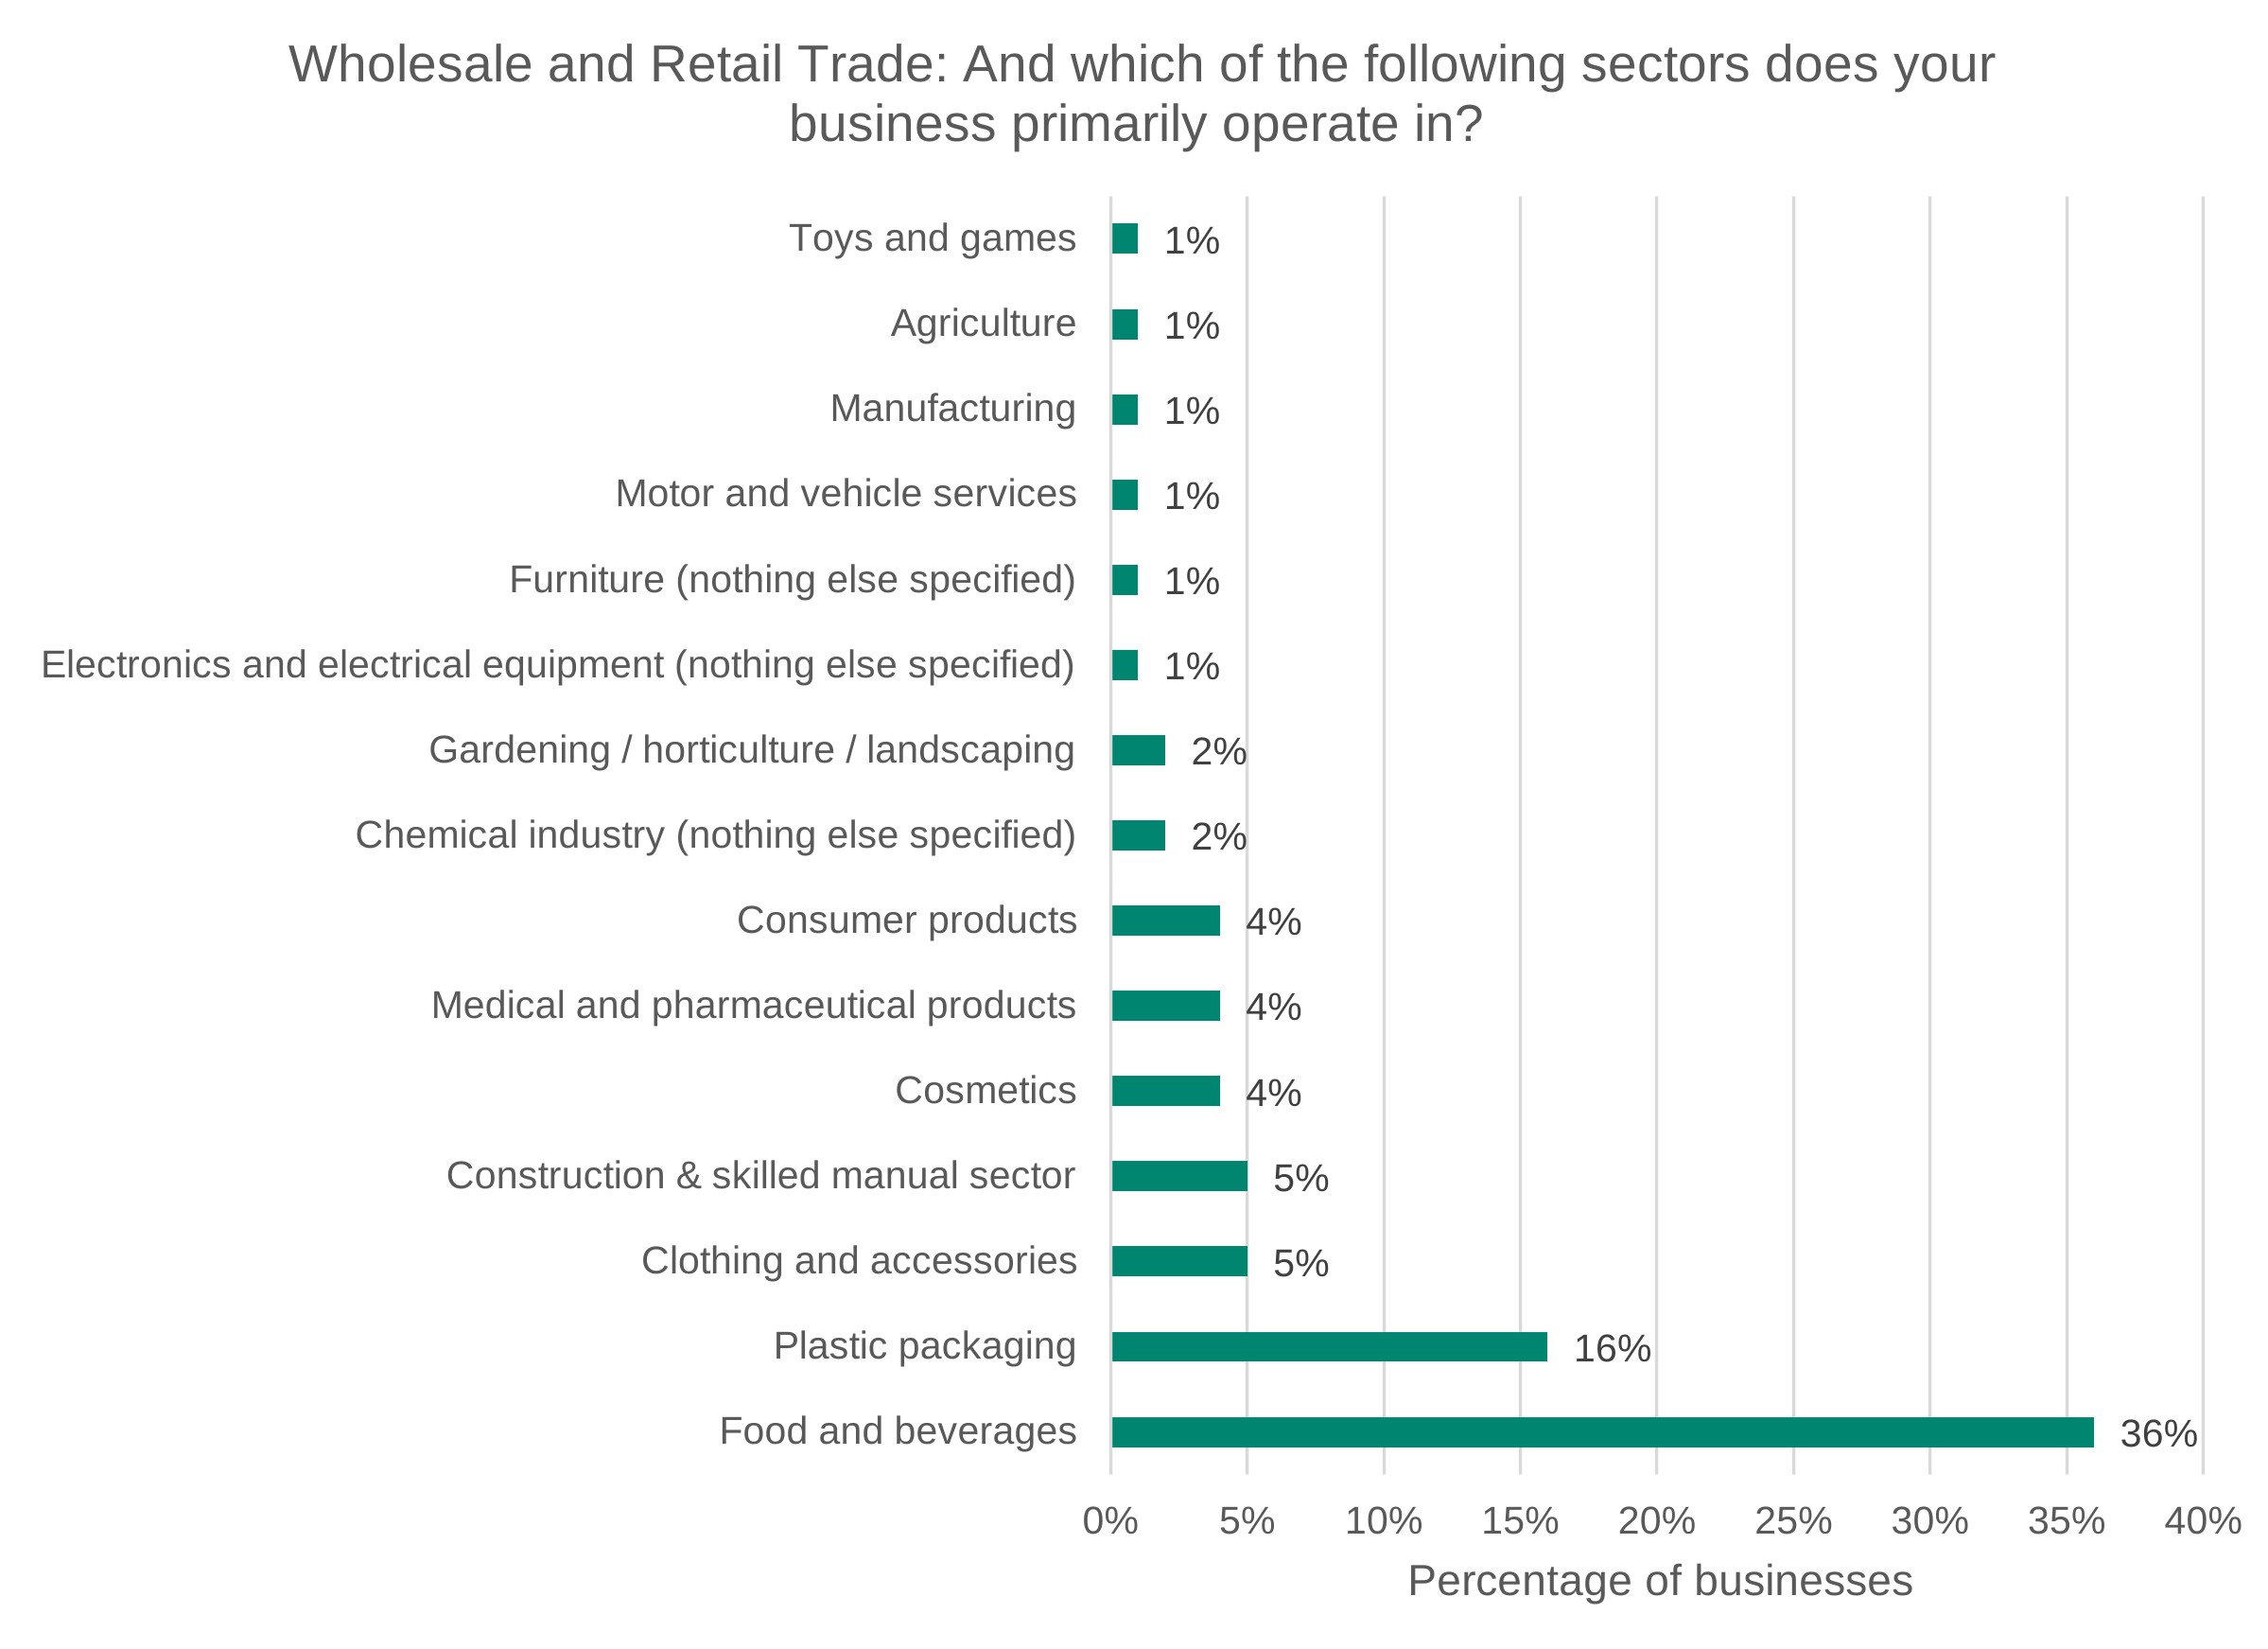
Data for Figure C.23: Survey results for the question ‘And which of the following sectors does your business primarily operate in?’.
The base for this question is 468, comprised of firms who answered ‘wholesale and retail trade’ to the activity. Source: Ipsos.
| Sector | Percentage of businesses |
|---|---|
| Toys and games | 1% |
| Agriculture | 1% |
| Manufacturing | 1% |
| Motor and vehicle services | 1% |
| Furniture (nothing else specified) | 1% |
| Electronics and electrical equipment (nothing else specified) | 1% |
| Gardening / horticulture / landscaping | 2% |
| Chemical industry (nothing else specified) | 2% |
| Consumer products | 4% |
| Medical and pharmaceutical products | 4% |
| Cosmetics | 4% |
| Construction & skilled manual sector | 5% |
| Clothing and accessories | 5% |
| Plastic packaging | 16% |
| Food and beverages | 36% |
Figure C.23 shows the distribution of businesses within the wholesale and retail subgroup. The sample is strongly concentrated in food and beverage businesses (36%), followed by plastic packaging (16%). Smaller but still notable shares include clothing and accessories and construction-related activities (both 5%), and consumer products, cosmetics, and medical and pharmaceutical products (each 4%). Beyond these, the remaining sectors each account for only a very small proportion of the sample (generally 1 to 2%), including areas such as toys and games, agriculture, electronics, and motor services. As with the manufacturing subgroup, these small shares imply limited sample sizes at a more granular sector level, meaning that findings for individual sub-sectors are limited.
Figure C.24: Survey results for the question ‘Has the total tonnage of plastic packaging you manufacture and/or import changed due to Plastic Packaging Tax?’ broken down by main economic sector.
The base for Manufacturing is 426 and for Wholesale and Retail Trade it is 481. Source: Ipsos.
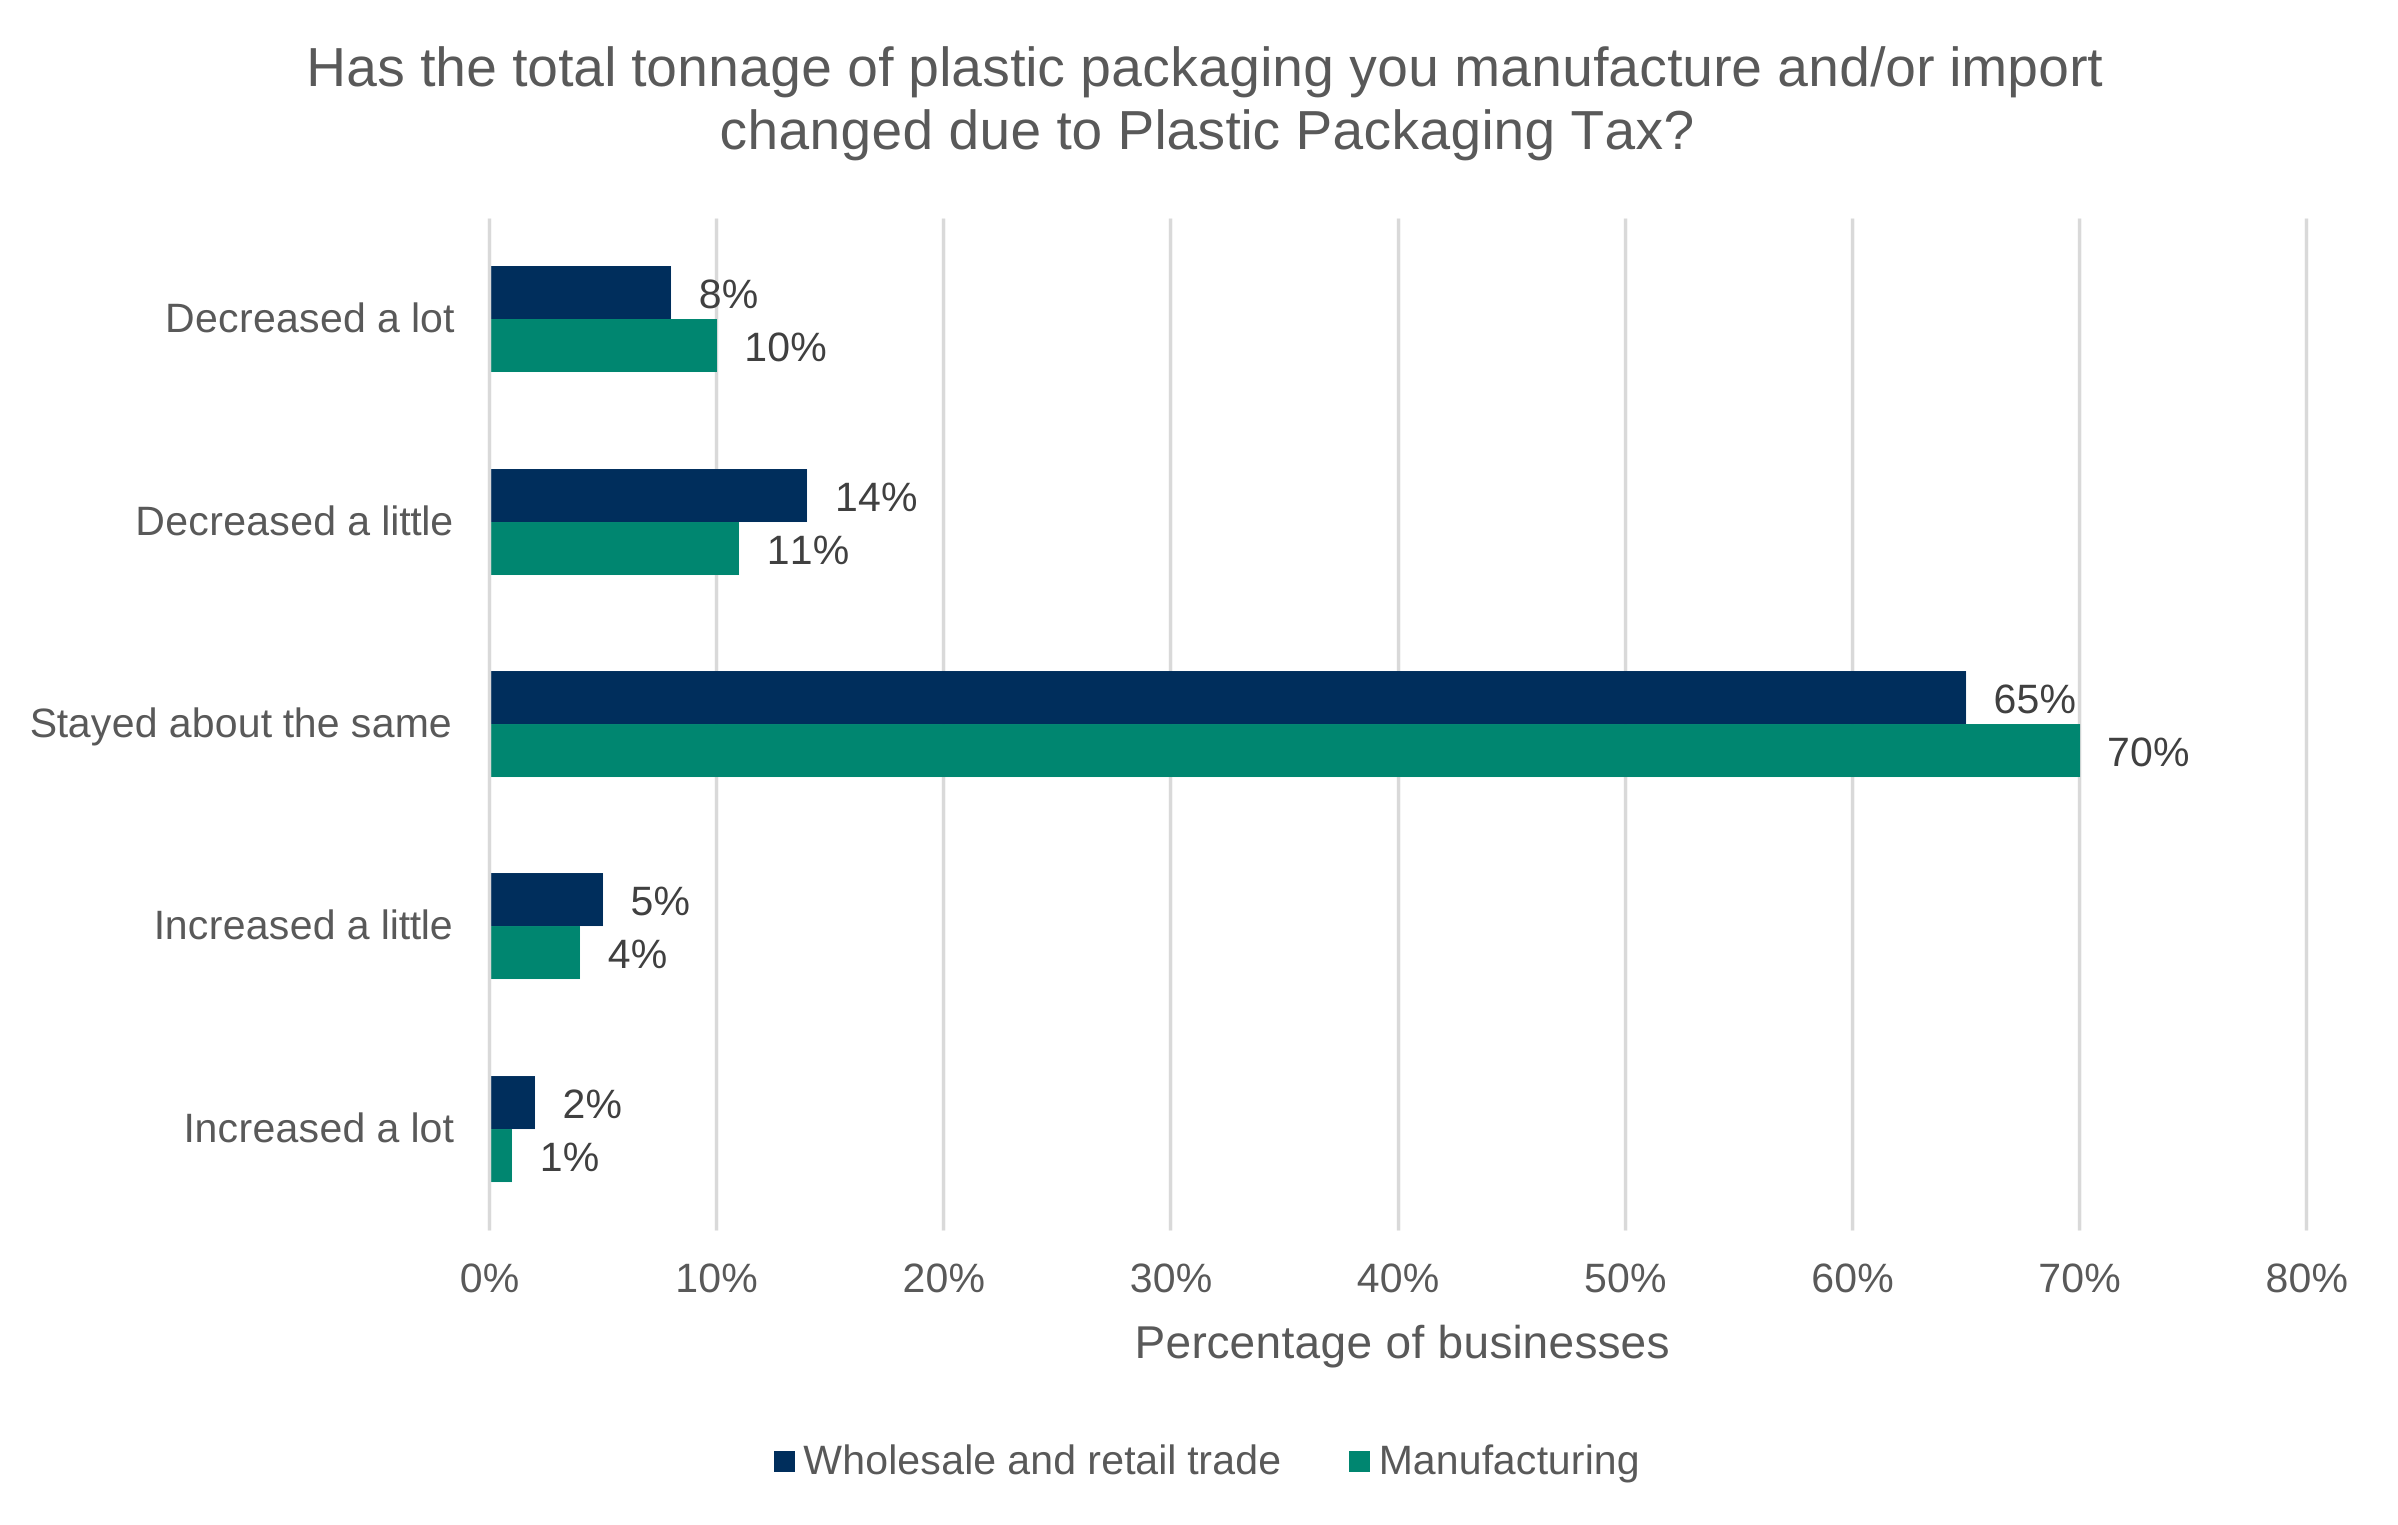
Data for Figure C.24: Survey results for the question ‘Has the total tonnage of plastic packaging you manufacture and/or import changed due to Plastic Packaging Tax?’ broken down by main economic sector.
The base for Manufacturing is 426 and for Wholesale and Retail Trade it is 481. Source: Ipsos.
| Category | Manufacturing | Wholesale and retail trade |
|---|---|---|
| Decreased a lot | 10% | 8% |
| Decreased a little | 11% | 14% |
| Stayed about the same | 70% | 65% |
| Increased a little | 4% | 5% |
| Increased a lot | 1% | 2% |
Figure C.24 shows that most businesses reported no change in the total tonnage of plastic packaging they manufactured and/or imported, with 65% of wholesale and retail businesses and 70% of manufacturing businesses stating that tonnage had stayed about the same. Smaller proportions reported decreases (around 21 to 22% combined) or increases (around 5 to 7% combined). Overall, the distribution of responses is broadly similar across the 2 main sectors, with only minor differences in the proportions reporting increases or decreases. Consistent with this, there is no strong evidence of systematic differences between sectors in how total packaging tonnage has changed in response to PPT.
In terms of the barriers to increasing recycled content, there are some clear and relevant differences across sectors. Wholesale and retail businesses are significantly more likely than businesses in the manufacturing sector to report supply-side barriers, with 31% citing a lack of supplier availability compared to 22% of manufacturers. This further supports the view that downstream businesses may be more constrained by the availability of suitable inputs, rather than their own production capabilities.
In contrast, businesses in the manufacturing sector are significantly more likely to report demand-side and commercial constraints. For example, 16% of manufacturers say there is no customer demand for increased recycled content, compared to 7% of wholesale and retail businesses. Similarly, manufacturers are more likely to report technical limitations (15% vs 10%) and lack of recycled plastic availability (17% vs 12%). This is consistent with manufacturers being more directly engaged in production processes, where material performance and customer specifications are more binding.
At a more granular level, businesses in the plastic packaging subsector of manufacturing stand out in several areas. They are significantly more likely to report demand-side constraints (29%) and quality concerns (31%), as well as supply limitations (23%). These findings reinforce the earlier result that plastic packaging businesses are reporting being more actively engaged in adjusting recycled content but face tighter technical and commercial constraints in doing so.
Overall, the evidence in this section suggests that sector-level differences are not, in themselves, a main driver of variation in how businesses respond to the PPT. At an aggregate level, responses across the 2 main sectors — manufacturing and wholesale and retail trade — are broadly similar for both changes in total plastic packaging tonnage and the proportion of recycled content.
Where more pronounced differences do emerge, these tend to occur at a more granular level and are linked to businesses’ position in the supply chain rather than their sector classification alone. In particular, businesses directly involved in the production of plastic packaging appear to show a stronger behavioural response, with higher reported increases in recycled content, alongside more acute technical, commercial, and demand-side constraints. Conversely, downstream businesses, such as those in wholesale and retail, are more likely to report being constrained by the availability of suitable inputs from the suppliers they choose to use.
C.2.6 Other variation
C.2.6.1 Packaging handled
Further statistical analysis was undertaken to build on the analysis presented in Section 5.4.6. It assesses whether the proportion of plastic packaging above the recycled content threshold differed according to the volume of packaging handled by businesses. Businesses were grouped into quintiles for each financial year based on the total volume of plastic packaging handled, with each quintile representing one fifth of businesses.
Statistical analysis of the administrative data shows that the proportion of recycled packaging above the threshold varies according to the volume of packaging handled by businesses. Businesses in the highest packaging-handled quintile consistently reported statistically significantly higher proportions of packaging above the threshold than businesses in the remaining quintiles. By contrast, businesses in the middle and lower packaging-handled quintiles generally reported lower proportions of recycled packaging above the threshold, with relatively little difference observed between the smallest and second-smallest quintiles.
A series of Kruskal-Wallis tests were undertaken to assess whether the proportion of packaging above the threshold differed across packaging-handled quintiles within each financial year. Statistically significant differences were identified in every year examined (2022 to 2023: χ²(4) = 349.94, p < 0.001; 2023 to 2024: χ²(4) = 404.04, p < 0.001; 2024 to 2025: χ²(4) = 388.81,p < 0.001; 2025 to 2026: χ²(4) = 420.66, p < 0.001).
To identify where these differences occurred, Dunn’s post-hoc tests with Benjamini-Hochberg adjustment were conducted. In each financial year, the highest packaging-handled quintile exhibited statistically significantly different proportions of packaging meeting the recycled content threshold from all other packaging-handled quintiles (all adjusted p-values < 0.001). Businesses in the second-highest packaging-handled quintile also generally reported statistically significantly higher proportions of packaging above the threshold than businesses in the lower quintiles. By contrast, differences between the smallest and second-smallest packaging-handled quintiles were generally not statistically significant following adjustment for multiple comparisons.
Additional Kruskal-Wallis tests were undertaken to assess whether the proportion of packaging above the recycled content threshold changed over time within each packaging-handled quintile. Statistically significant differences between years were only identified for the highest packaging-handled quintile (χ²(3) = 14.60, p = 0.002). No statistically significant differences over time were identified for the smallest (χ²(3) = 4.53, p = 0.209), second-smallest (χ²(3) = 4.21, p = 0.239), middle (χ²(3) = 4.48, p = 0.214), or second-highest (χ²(3) = 4.79, p = 0.188) packaging-handled quintiles.
For businesses in the highest packaging-handled quintile, Dunn’s post-hoc tests indicated statistically significant differences between financial year 2022 to 2023 and financial year 2024 to 2025 (adjusted p = 0.035), and between financial year 2022 to 2023 and financial year 2025 to 2026 (adjusted p = 0.001). No statistically significant differences were observed between financial year 2022 to 2023 and 2023 to 2024 (adjusted p = 0.115), between financial year 2023 to 2024 and 2024 to 2025 (adjusted p = 0.528), between financial year 2023 to 2024 and 2025 to 2026 (adjusted p = 0.092), or between financial year 2024 to 2025 and 2025 to 2026 (adjusted p = 0.256).
These findings suggest businesses handling larger volumes of plastic packaging consistently report higher proportions of packaging falling above the PPT’s recycled content threshold than businesses handling smaller volumes. The persistence of these differences across the evaluation period indicates an association between packaging volume and the proportion of packaging meeting the recycled content threshold. However, as with the preceding analysis, these findings demonstrate an association rather than a causal relationship between packaging volume and recycled content outcomes.
C.2.6.2 Tax liability
A similar approach to the one presented in Section 5.4.6 has been applied using businesses’ PPT tax liability rather than the volume of packaging handled. Under PPT, businesses accrue a tax liability only on in-scope finished plastic packaging containing less than 30% recycled plastic; consequently, businesses handling similar volumes of packaging may have substantially different tax liabilities depending on the recycled content of that packaging. Examining businesses by tax-liability quintile therefore provides a complementary perspective on the relationship between tax position and threshold attainment and may reveal patterns that are not apparent when businesses are grouped by packaging volume alone.
Businesses were grouped into quintiles based on their tax liability, as reported to HMRC. These quintiles are constructed separately for each financial year and ordered from those with the lowest tax liability to those with the highest, such that each group represents approximately one fifth of businesses.
Figure C.25: Proportion of businesses meeting the 30% recycled content threshold to any degree, by tax due quintiles.
Source: HMRC.
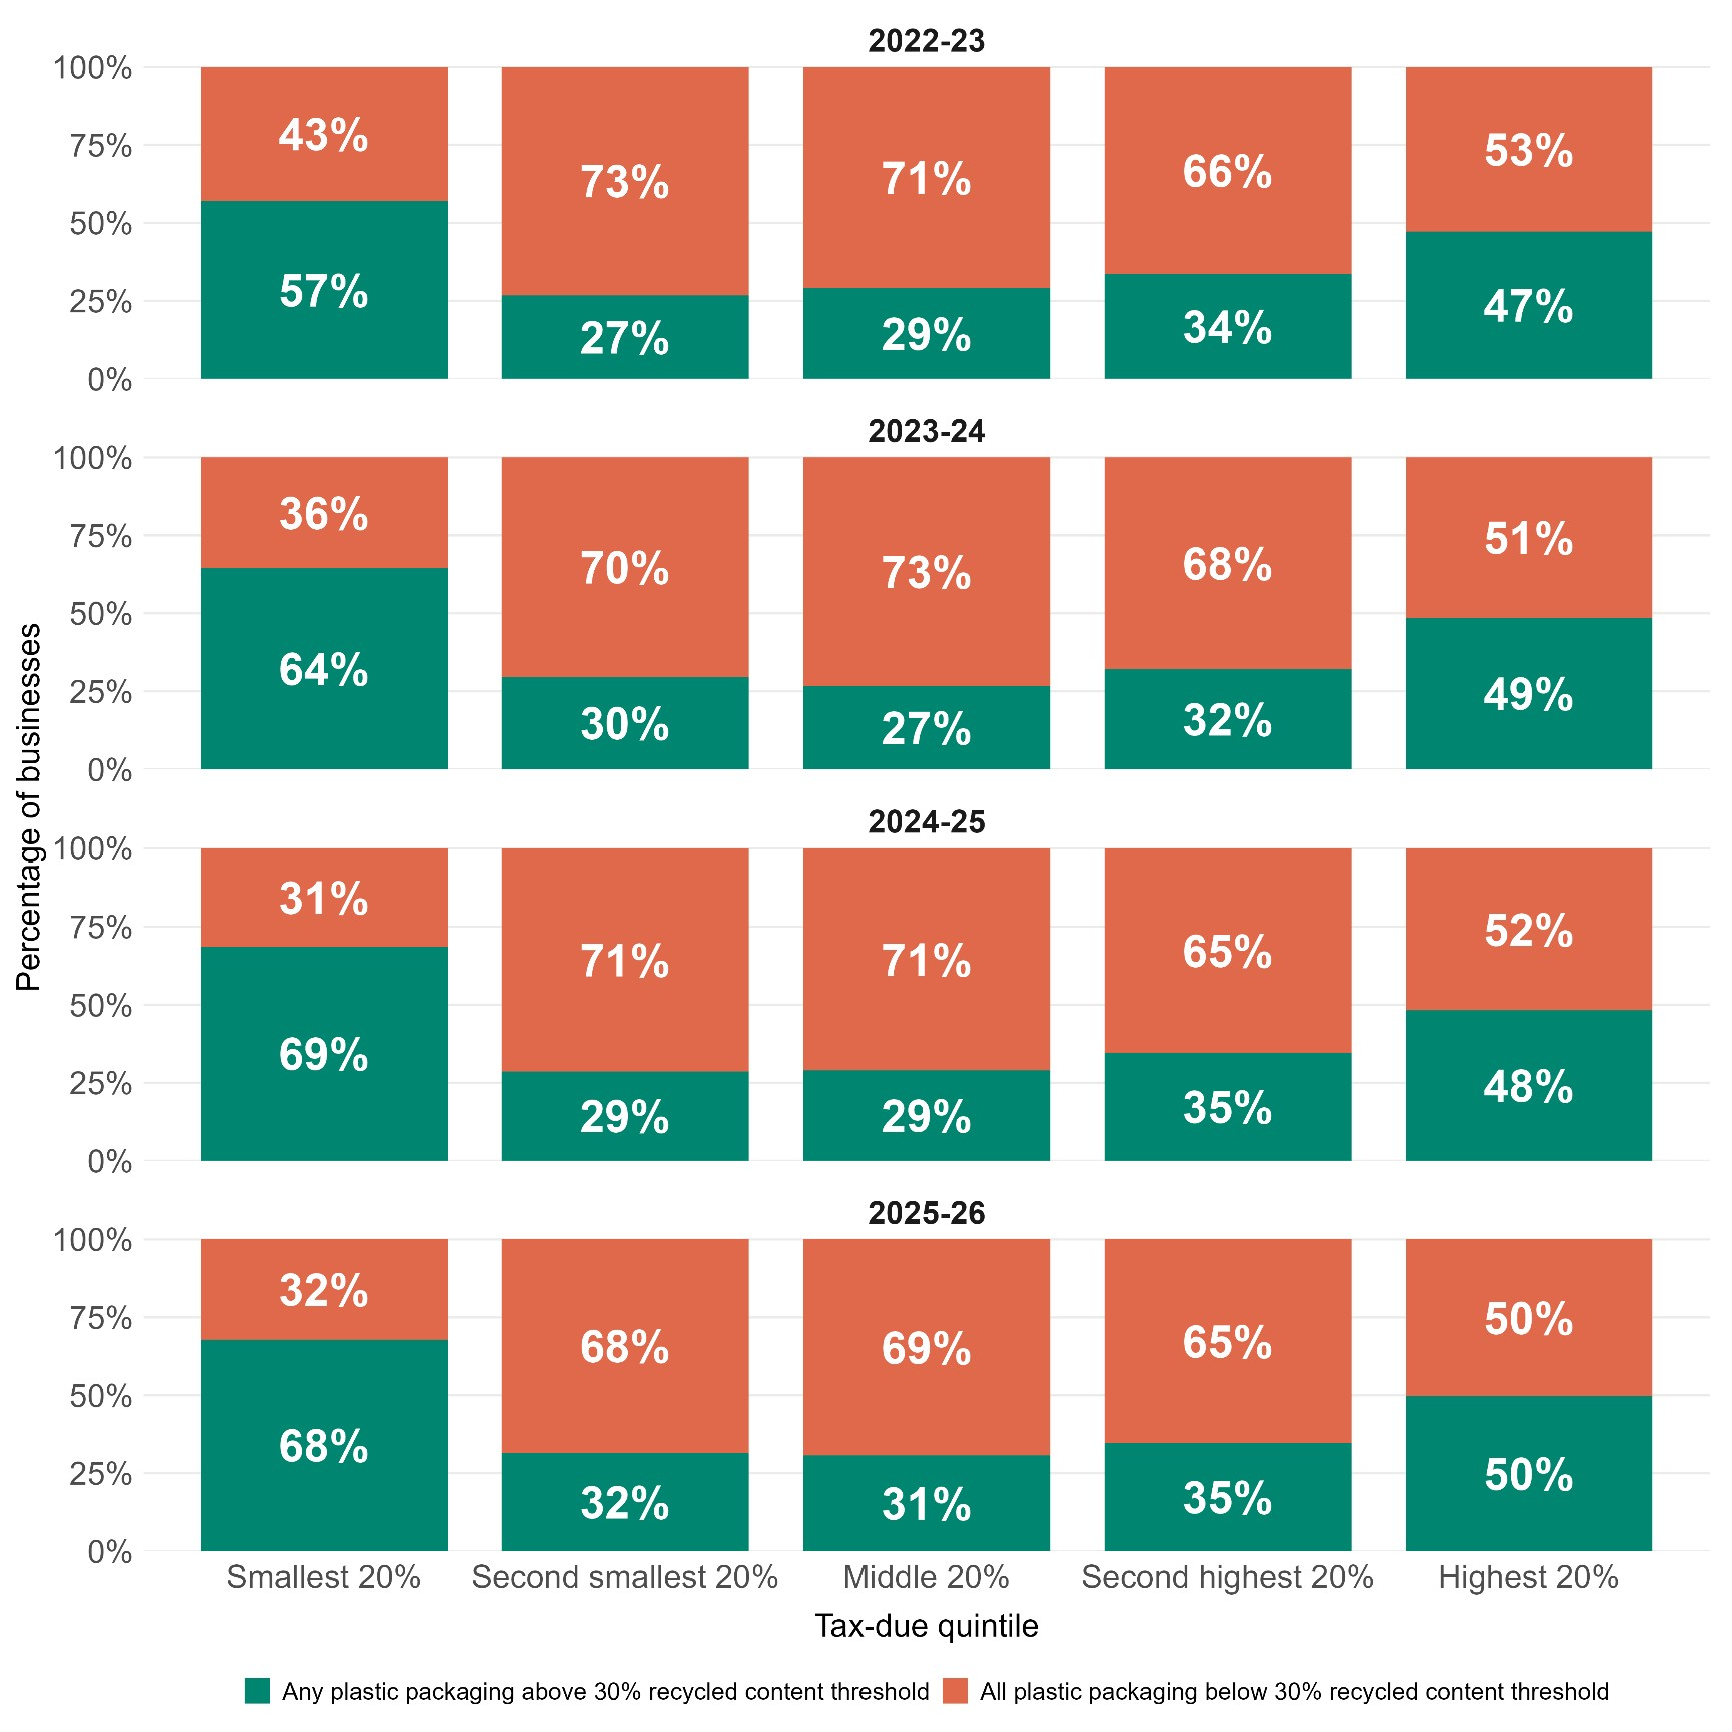
Data for Figure C.25: Proportion of businesses meeting the 30% recycled content threshold to any degree, by tax due quintiles.
Source: HMRC.
| Tax-due quintile (2022–23) | Any plastic packaging above 30% recycled content threshold | All plastic packaging below 30% recycled content threshold |
|---|---|---|
| Smallest 20% | 57% | 43% |
| Second smallest 20% | 27% | 73% |
| Middle 20% | 29% | 71% |
| Second highest 20% | 34% | 66% |
| Highest 20% | 47% | 53% |
| Tax-due quintile (2023–24) | Any plastic packaging above 30% recycled content threshold | All plastic packaging below 30% recycled content threshold |
|---|---|---|
| Smallest 20% | 64% | 36% |
| Second smallest 20% | 30% | 70% |
| Middle 20% | 27% | 73% |
| Second highest 20% | 32% | 68% |
| Highest 20% | 49% | 51% |
| Tax-due quintile (2024–25) | Any plastic packaging above 30% recycled content threshold | All plastic packaging below 30% recycled content threshold |
|---|---|---|
| Smallest 20% | 69% | 31% |
| Second smallest 20% | 29% | 71% |
| Middle 20% | 29% | 71% |
| Second highest 20% | 35% | 65% |
| Highest 20% | 48% | 52% |
| Tax-due quintile (2025–26) | Any plastic packaging above 30% recycled content threshold | All plastic packaging below 30% recycled content threshold |
|---|---|---|
| Smallest 20% | 68% | 32% |
| Second smallest 20% | 32% | 68% |
| Middle 20% | 31% | 69% |
| Second highest 20% | 35% | 65% |
| Highest 20% | 50% | 50% |
The distribution of businesses across tax liability quintiles was calculated separately for businesses with at least some packaging meeting the 30% recycled content threshold and those with no packaging meeting the threshold, as shown in Figure C.25. Businesses in the lowest tax-due quintile were consistently the most likely to have at least some packaging meeting the threshold, increasing from 57% in financial year 2022 to 2023 to around 68 to 69% from financial year 2024 to 2025 onwards. In contrast, only around 27 to 35% of businesses in the middle 3 tax-due quintiles had any packaging meeting the threshold across the period. The highest tax-due quintile fell between these groups, with around half of businesses having at least some packaging above the threshold. This suggests that businesses with the lowest tax liabilities were considerably more likely to have some packaging meeting the recycled content threshold than businesses with moderate or high tax liabilities.
Figure C.26: Percentage of total annual packaging handled by businesses in each tax due quintiles.
Source: HMRC.
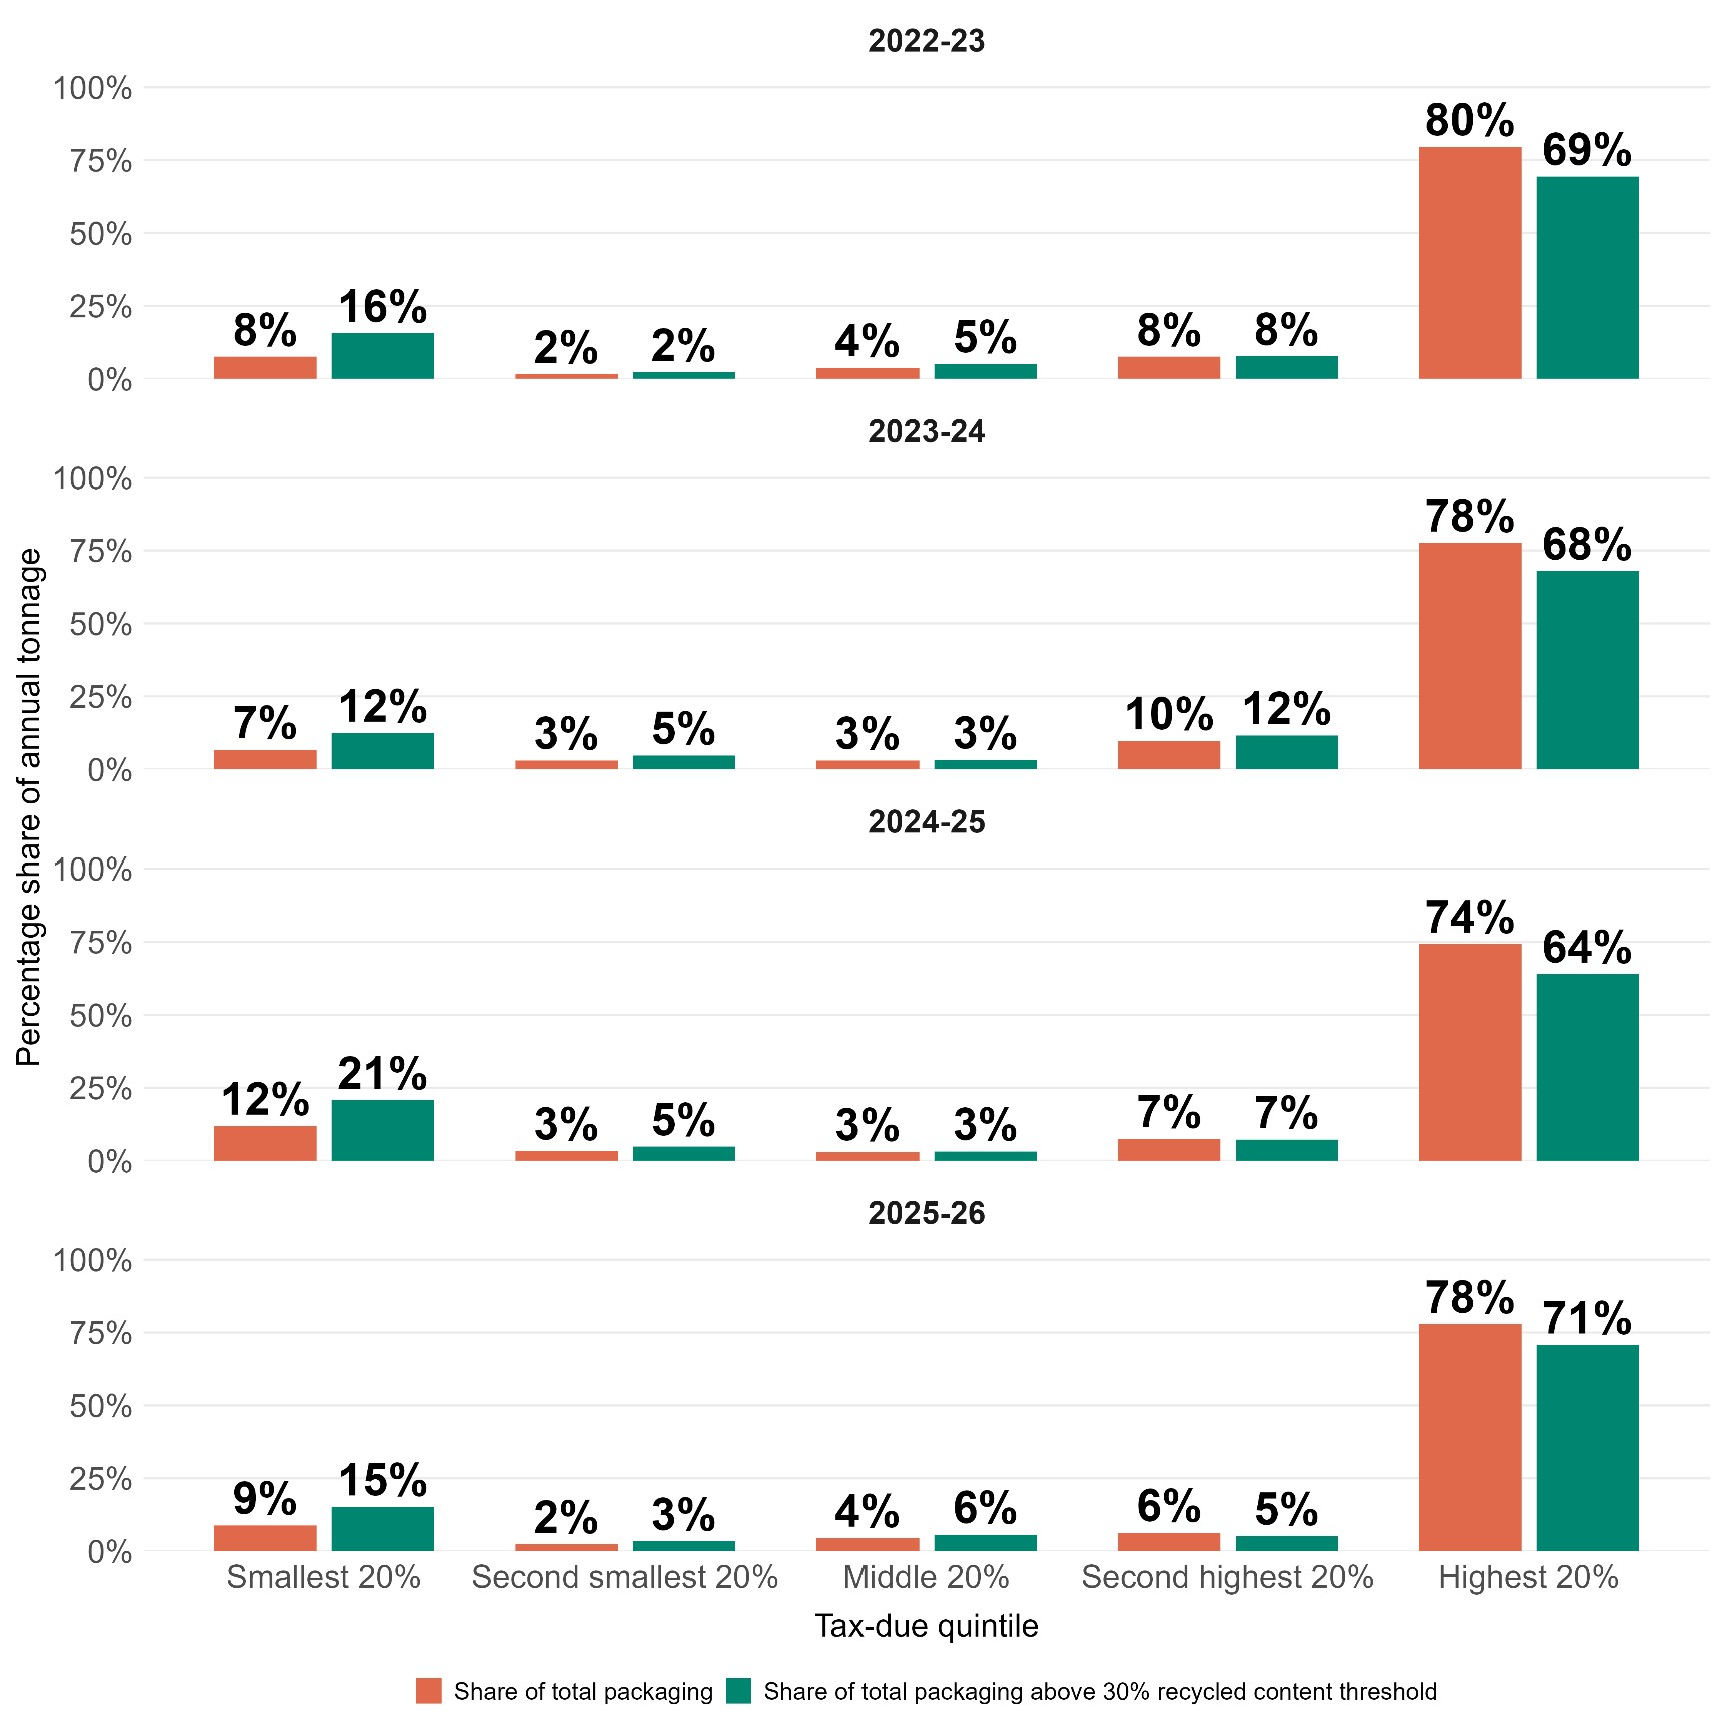
Data for Figure C.26: Percentage of total annual packaging handled by businesses in each tax due quintiles.
Source: HMRC.
| Tax-due quintile (2022–23) | Share of total packaging | Share of total packaging above 30% recycled content threshold |
|---|---|---|
| Smallest 20% | 8% | 16% |
| Second smallest 20% | 2% | 2% |
| Middle 20% | 4% | 5% |
| Second highest 20% | 8% | 8% |
| Highest 20% | 80% | 69% |
| Tax-due quintile (2023–24) | Share of total packaging | Share of total packaging above 30% recycled content threshold |
|---|---|---|
| Smallest 20% | 7% | 12% |
| Second smallest 20% | 3% | 5% |
| Middle 20% | 3% | 3% |
| Second highest 20% | 10% | 12% |
| Highest 20% | 78% | 68% |
| Tax-due quintile (2024–25) | Share of total packaging | Share of total packaging above 30% recycled content threshold |
|---|---|---|
| Smallest 20% | 12% | 21% |
| Second smallest 20% | 3% | 5% |
| Middle 20% | 3% | 3% |
| Second highest 20% | 7% | 7% |
| Highest 20% | 74% | 64% |
| Tax-due quintile (2025–26) | Share of total packaging | Share of total packaging above 30% recycled content threshold |
|---|---|---|
| Smallest 20% | 9% | 15% |
| Second smallest 20% | 2% | 3% |
| Middle 20% | 4% | 6% |
| Second highest 20% | 6% | 5% |
| Highest 20% | 78% | 71% |
Figure C.26 shows that packaging remains concentrated among businesses in the highest tax-due quintile, which accounted for between 74 and 80% of all packaging within the tax base across the evaluation period. However, unlike the analysis by packaging-volume quintile, the distribution of packaging meeting the 30% recycled content threshold is more dispersed across tax-due quintiles. Businesses in the lowest tax-due quintile consistently accounted for a larger share of packaging meeting the threshold than their share of packaging overall. For example, in 2025-26 they accounted for 9% of all packaging but 15% of packaging meeting the threshold. Conversely, businesses in the highest tax-due quintile accounted for 78% of all packaging but 71% of packaging meeting the threshold. This pattern suggests that businesses with relatively low tax liabilities contribute a disproportionately large share of packaging meeting the threshold, while packaging handled by businesses with the highest tax liabilities is less likely to meet the threshold than their overall share of packaging would suggest.
Figure C.27: Proportion of packaging meeting the 30% recycled content threshold, by tax due quintiles.
Source: HMRC.
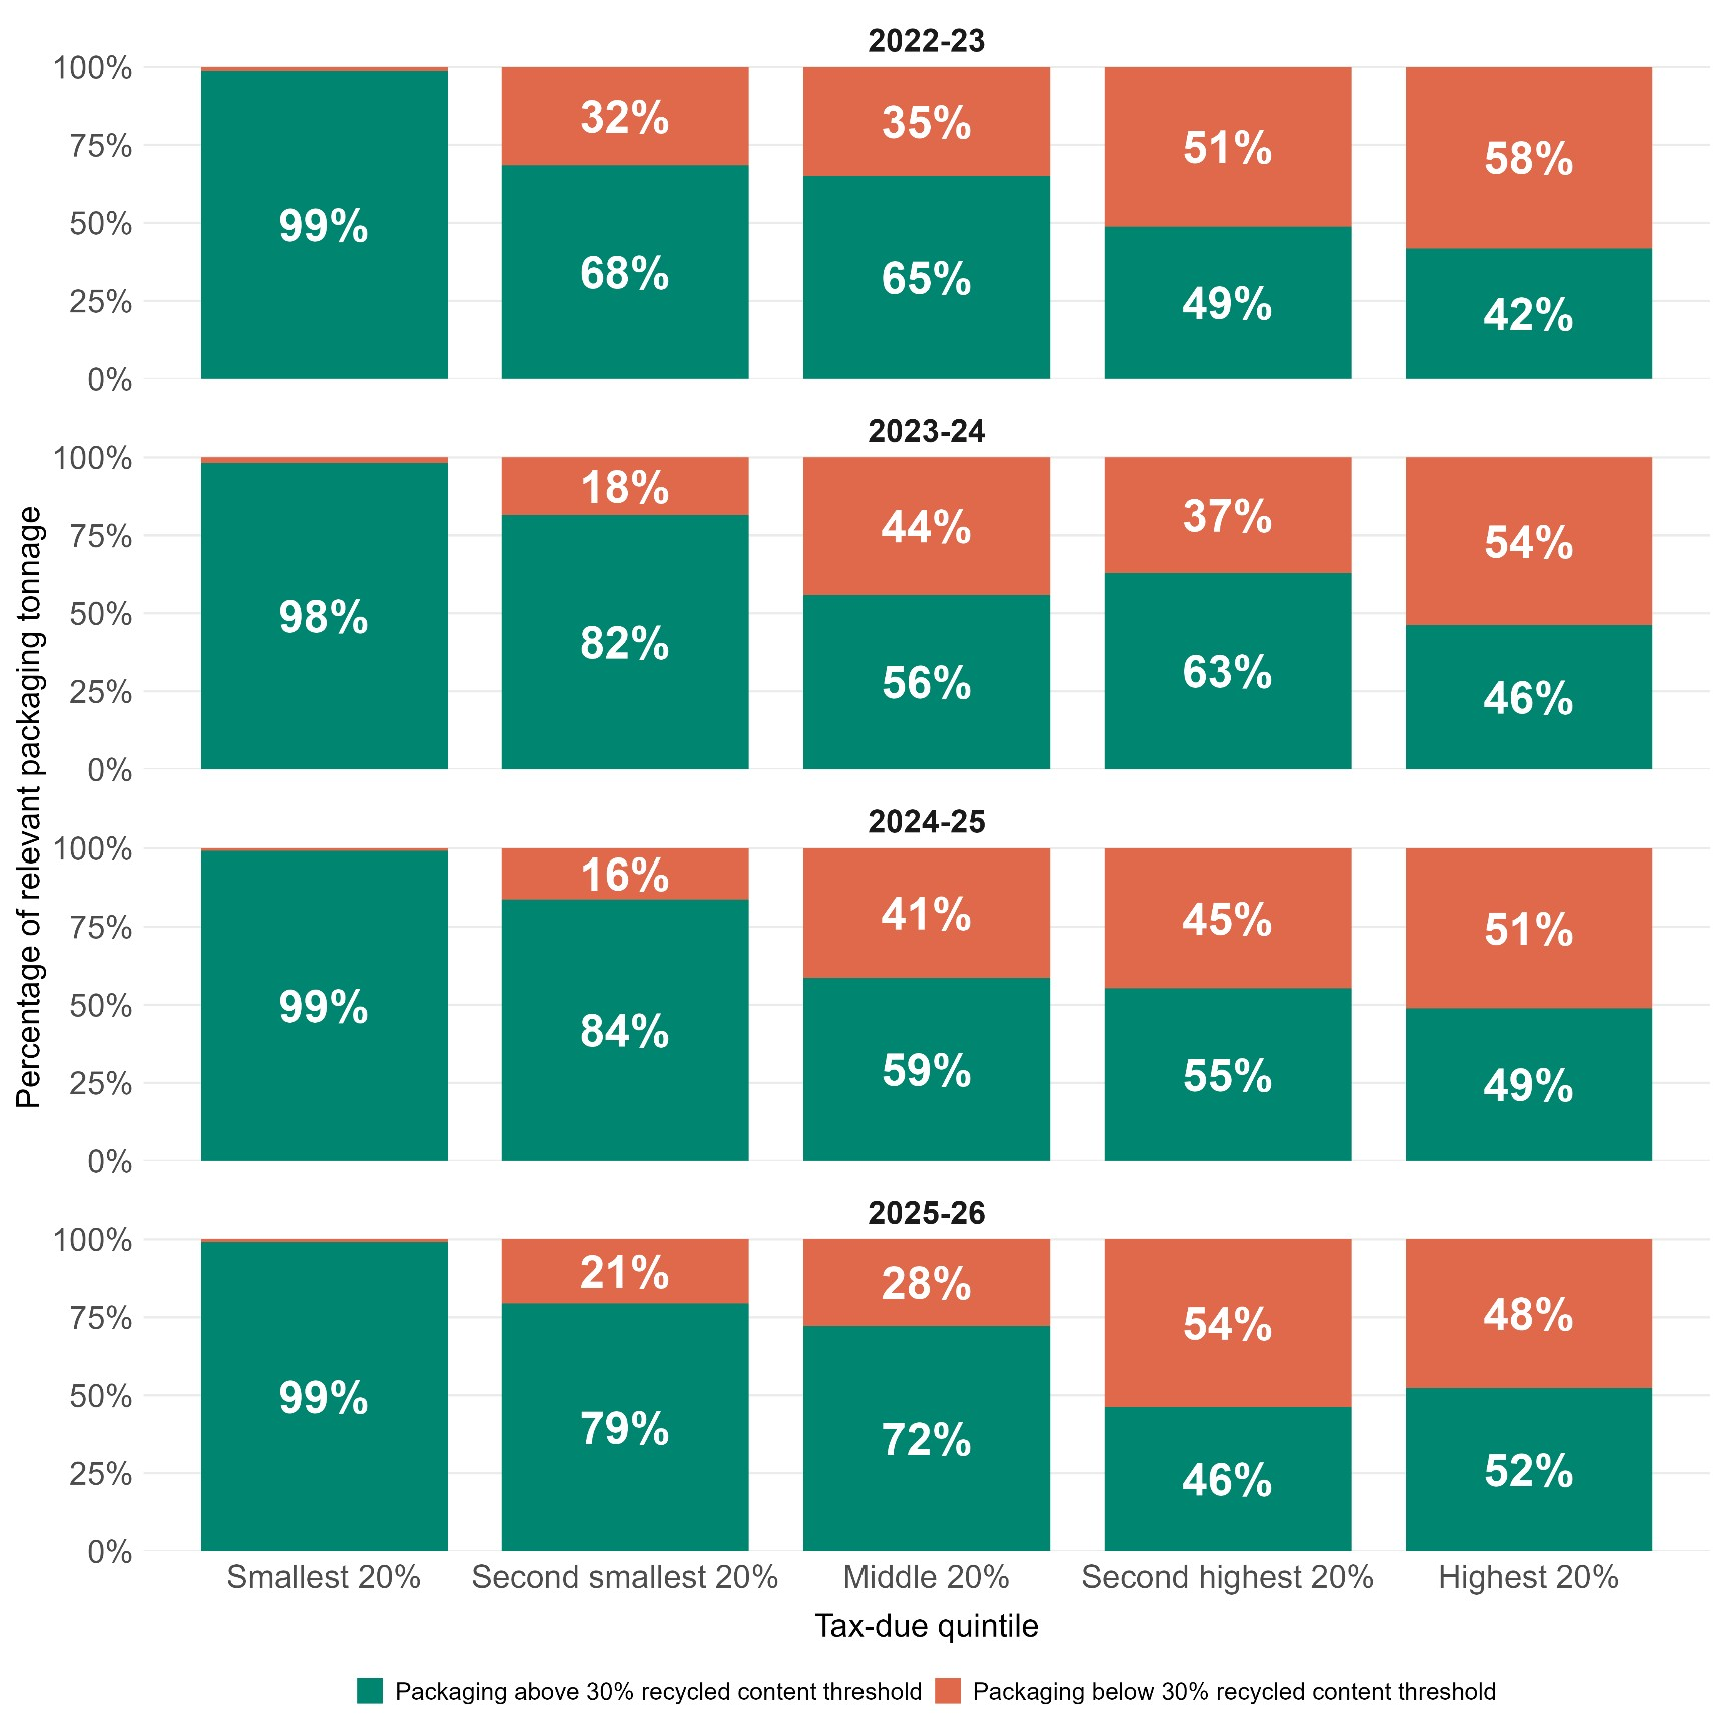
Data for Figure C.27: Proportion of packaging meeting the 30% recycled content threshold, by tax due quintiles.
Source: HMRC.
| Tax-due quintile (2022–23) | Packaging above 30% recycled content threshold | Packaging below 30% recycled content threshold |
|---|---|---|
| Smallest 20% | 99% | 1% |
| Second smallest 20% | 68% | 32% |
| Middle 20% | 65% | 35% |
| Second highest 20% | 49% | 51% |
| Highest 20% | 42% | 58% |
| Tax-due quintile (2023–24) | Packaging above 30% recycled content threshold | Packaging below 30% recycled content threshold |
|---|---|---|
| Smallest 20% | 98% | 2% |
| Second smallest 20% | 82% | 18% |
| Middle 20% | 56% | 44% |
| Second highest 20% | 63% | 37% |
| Highest 20% | 46% | 54% |
| Tax-due quintile (2024–25) | Packaging above 30% recycled content threshold | Packaging below 30% recycled content threshold |
|---|---|---|
| Smallest 20% | 99% | 1% |
| Second smallest 20% | 84% | 16% |
| Middle 20% | 59% | 41% |
| Second highest 20% | 55% | 45% |
| Highest 20% | 49% | 51% |
| Tax-due quintile (2025–26) | Packaging above 30% recycled content threshold | Packaging below 30% recycled content threshold |
|---|---|---|
| Smallest 20% | 99% | 1% |
| Second smallest 20% | 79% | 21% |
| Middle 20% | 72% | 28% |
| Second highest 20% | 46% | 54% |
| Highest 20% | 52% | 48% |
Figure C.27 shows substantial variation in the proportion of packaging meeting the 30% recycled content threshold across tax-due quintiles. Businesses in the lowest tax-due quintile consistently had the highest proportion of packaging meeting the threshold, at between 98 and 99% throughout the evaluation period. By contrast, the proportion meeting the threshold was considerably lower in the remaining quintiles, ranging from 42 to 84%. This pattern helps explain the findings shown in Figure C.26, where businesses in the lowest tax-due quintile accounted for a disproportionately large share of packaging meeting the threshold relative to their share of total packaging. The findings suggest that many businesses in the lowest tax-due quintile face relatively low PPT liabilities because a large proportion of their packaging meets the recycled content threshold rather than for handling small amounts of packaging.
Statistical analysis of the administrative data shows that the proportion of packaging meeting the recycled content threshold significantly varies according to businesses’ PPT tax liability. Businesses in the lowest tax-liability quintile consistently reported statistically significantly higher proportions of packaging meeting the recycled content threshold than businesses in the remaining quintiles. By contrast, businesses in the middle and higher tax-liability quintiles generally reported lower proportions of packaging meeting the threshold, with relatively little difference observed between these groups.
A series of Kruskal-Wallis tests were undertaken to assess whether the proportion of packaging meeting the recycled content threshold differed across tax-liability quintiles within each financial year. Statistically significant differences were identified in every year examined (2022 to 2023: χ² (4) = 414, p < 0.001; 2023 to 2024: χ²(4) = 614, p < 0.001; 2024 to 2025: χ²(4) = 712, p < 0.001; 2025 to 2026: χ²(4) = 673, p < 0.001).
To identify where these differences occurred, Dunn’s post-hoc tests with Benjamini-Hochberg adjustment were conducted. In each financial year, the lowest tax-liability quintile exhibited statistically significantly different proportions of packaging meeting the threshold from all other tax-liability quintiles (all adjusted p-values < 0.001). The highest tax-liability quintile also differed significantly from the second-smallest, middle and second-highest quintiles in every financial year (all adjusted p-values < 0.001). By contrast, differences between the middle, second-smallest, second-highest and highest tax-liability quintiles were generally not statistically significant following adjustment for multiple comparisons.
Additional Kruskal-Wallis tests were undertaken to assess whether the proportion of packaging meeting the threshold changed over time within each tax-liability quintile. Statistically significant differences between years were only identified for the lowest tax-liability quintile (χ²(3) = 18.6, p < 0.001). No statistically significant differences over time were identified for the highest (χ2 (3)= 2.64, p = 0.451), middle (χ²(3) = 3.78, p = 0.286), second-highest (χ²(3) = 1.59, p = 0.663) or second-smallest (χ²(3) = 5.11, p = 0.164) tax-liability quintiles.
For businesses in the lowest tax-liability quintile, Dunn’s post-hoc tests indicated statistically significant differences between financial year 2022 to 2023 and financial years 2024 to 2025 (adjusted p = 0.002) and 2025 to 2026 (adjusted p < 0.001). The difference between financial years 2022 to 2023 and 2023 to 2024 was not statistically significant following adjustment for multiple comparisons (adjusted p = 0.091). No statistically significant differences were identified between financial years 2023 to 2024 and 2024 to 2025 (adjusted p = 0.132), between 2023 to 2024 and 2025 to 2026 (adjusted p = 0.082), or between 2024 to 2025 and 2025 to 2026 (adjusted p = 0.654).
There is also evidence that the relationship between tax liability and the proportion of plastic packaging meeting the recycled content threshold remained broadly stable over time. The lowest tax-liability quintile consistently had a higher mean proportion of recycled packaging than all other tax-liability quintiles between financial years 2022 to 2023 and 2025 to 2026. The mean proportion increased from 50.1% in financial year 2022 to 2023 to 59.9% in financial year 2025 to 2026. Mean proportions were substantially lower in the other tax-liability quintiles and changed by smaller amounts over the same period.
These findings suggest that businesses with lower PPT tax liabilities are considerably more likely to report higher proportions of packaging above the threshold than businesses with higher liabilities. The results also indicate that statistically significant changes over time were limited to the lowest tax-liability quintile, with its proportion of packaging above the threshold significantly higher in financial years 2024 to 2025 and 2025 to 2026 than in 2022 to 2023.
Overall, the findings suggest a clear relationship between businesses’ PPT tax liability and the likelihood of reporting packaging above the 30% recycled content threshold. Businesses in the lowest tax-liability quintile were consistently more likely to meet the threshold and reported substantially higher proportions of packaging above the threshold than businesses in other tax-liability groups. While lower tax liability is partly associated with handling smaller volumes of packaging, businesses in the lowest tax-liability quintile were represented across the full packaging-volume distribution, indicating that differences in recycled content are also likely to be an important factor. The persistence of these patterns over time provides further evidence that businesses with lower PPT liabilities tend to have a greater proportion of plastic packaging above the threshold. However, the results also show that businesses in the highest tax-liability quintile generally had higher proportions of packaging above the threshold than businesses in the 3 middle tax-liability quintiles. As with the preceding analysis, these findings demonstrate an association rather than a causal relationship between tax liability and recycled content outcomes.
C.2.6.3 Business size
This section examines whether business responses to the tax have varied based on the size of their business, both in employee numbers and turnover. While aggregate trends indicate an increase in the use of recycled material and some reduction in virgin plastic, these changes are not uniform across businesses. Differences in starting positions driven by business size may mean that the scale and nature of responses to PPT vary. Understanding this variation is important for assessing the effectiveness of the tax and the extent to which observed changes reflect broader shifts across the population of registered businesses.
Businesses were classified by employee number as micro (0-9 employees), small (10-49 employees), medium (50-249 employees), and large (250 or more employees).
Figure C.28: Survey results for the question ‘Has the proportion of recycled content in your plastic packaging changed due to Plastic Packaging Tax?’ broken down by the size of businesses based on employee numbers.
The base for micro is 192, small is 334, medium is 303, and large is 151. Source: Ipsos.
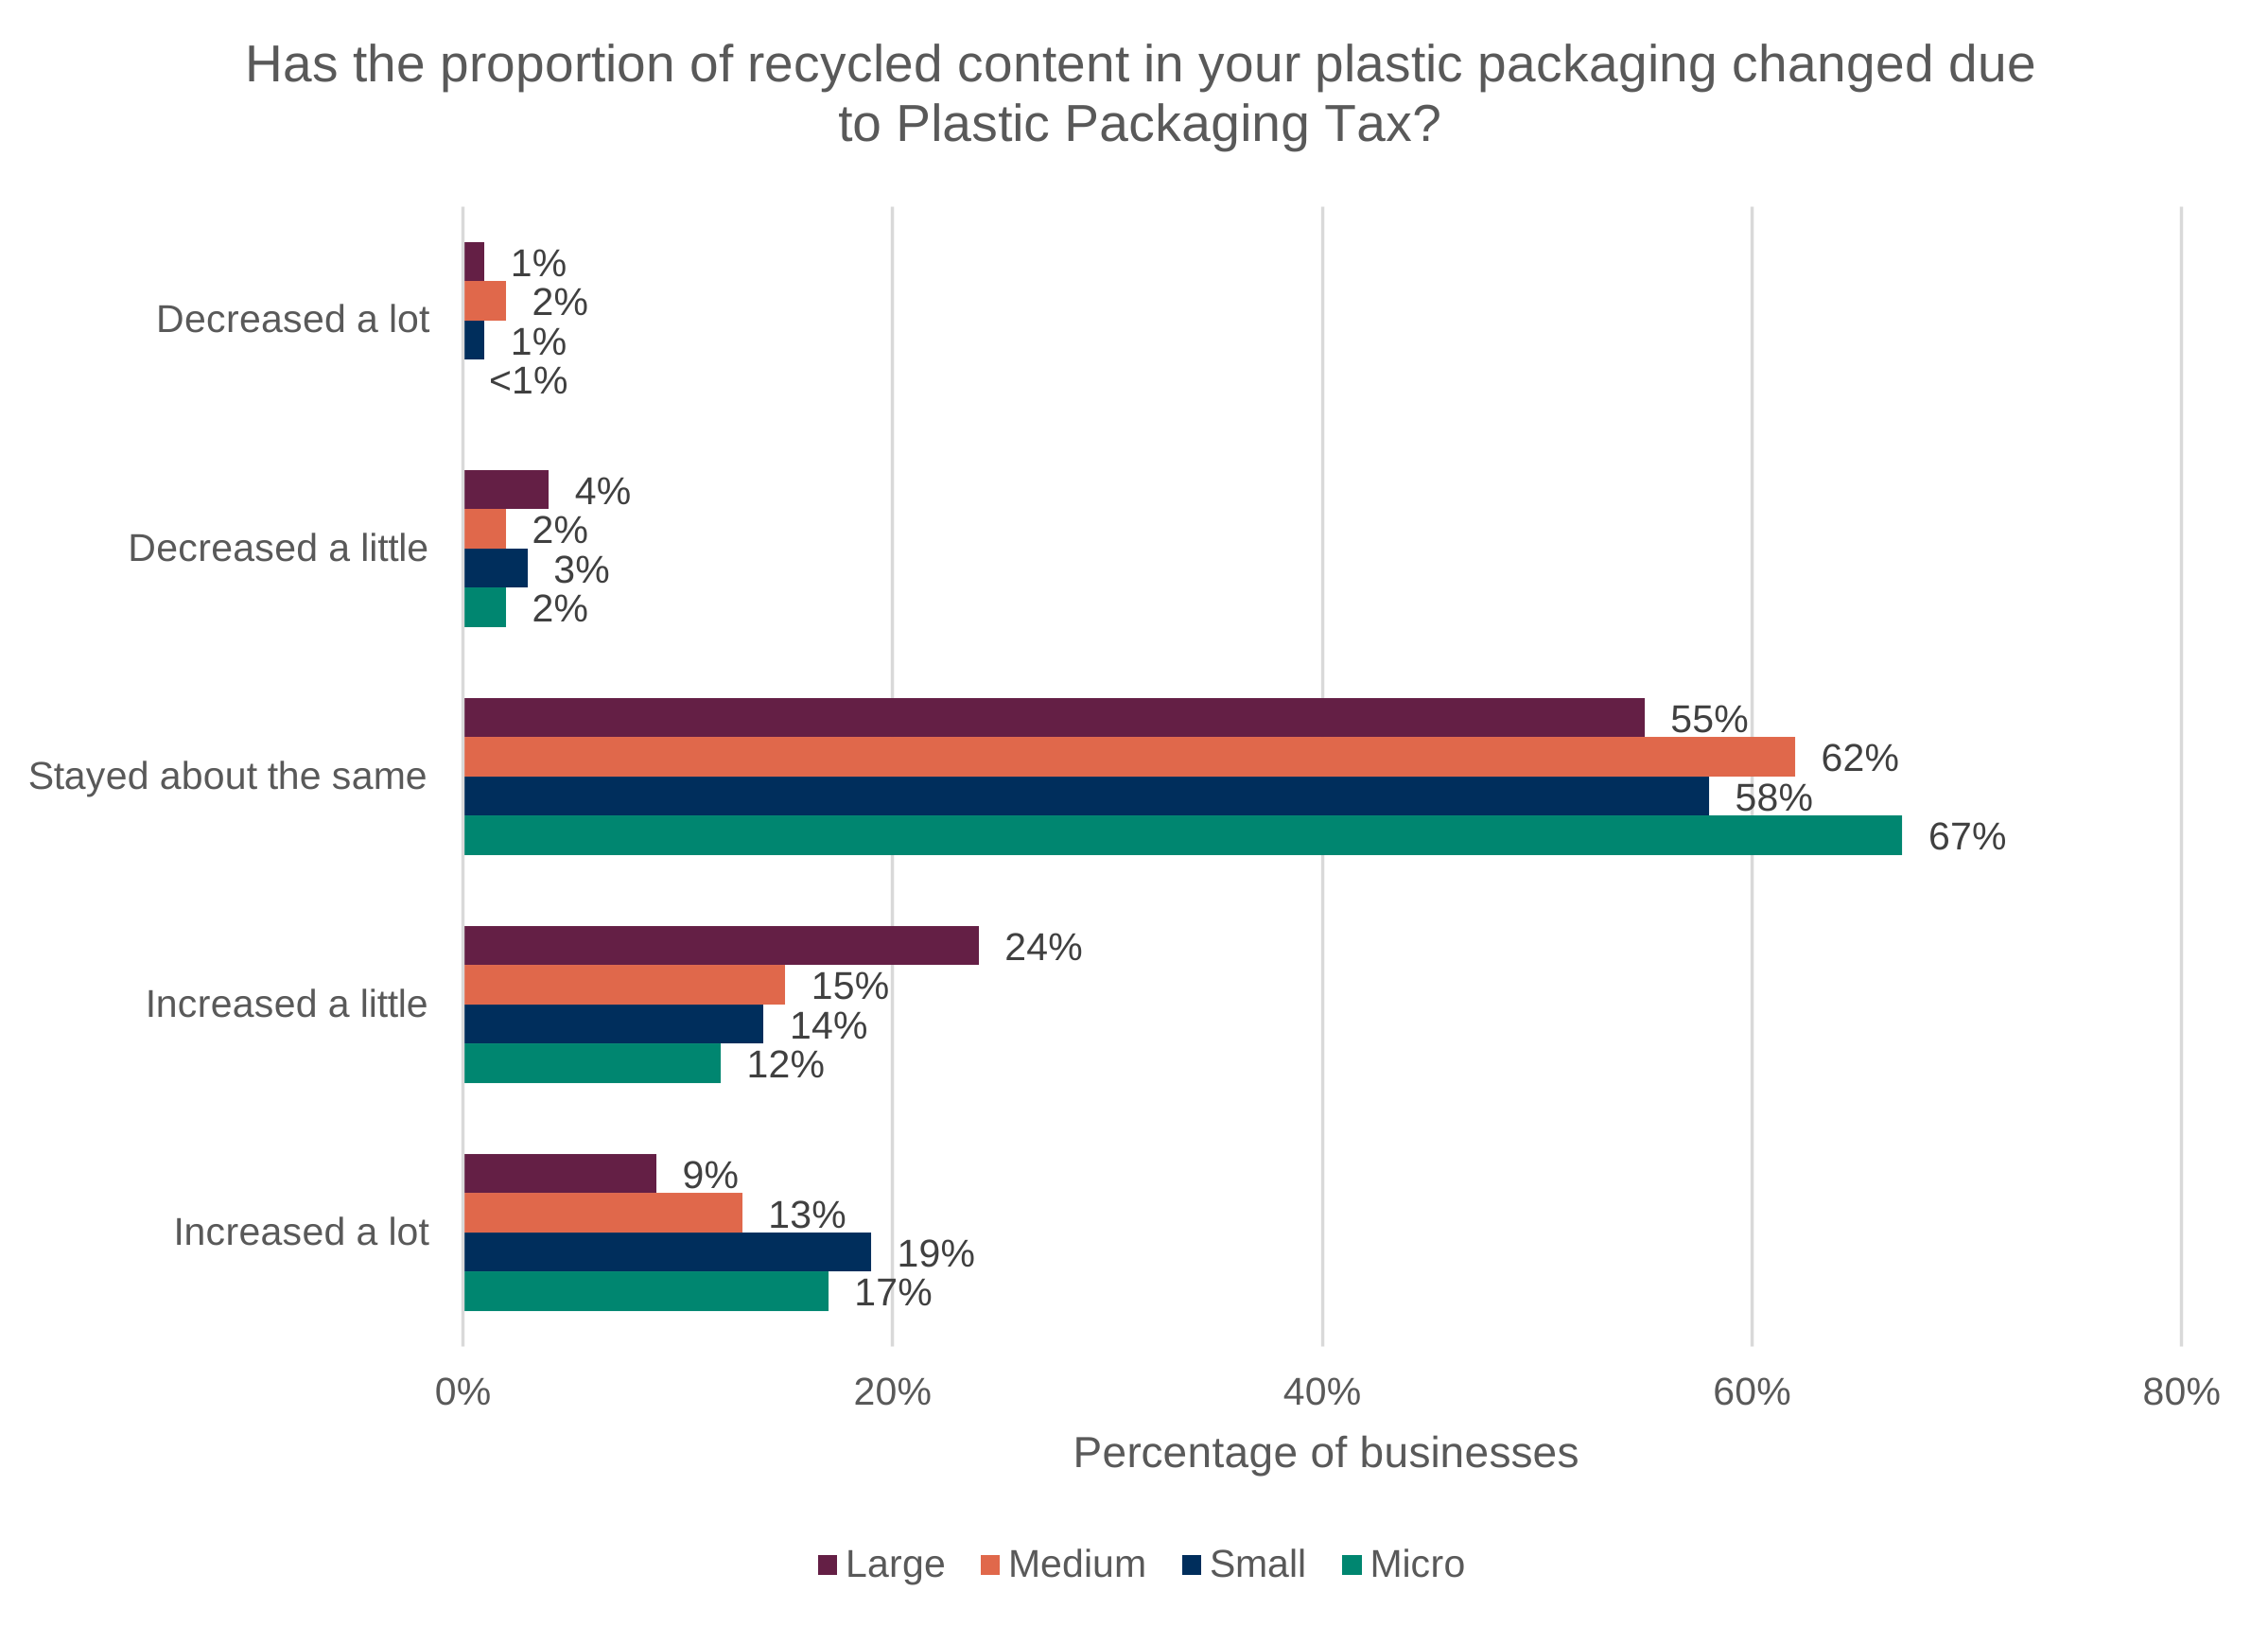
Data for Figure C.28: Survey results for the question ‘Has the proportion of recycled content in your plastic packaging changed due to Plastic Packaging Tax?’ broken down by the size of businesses based on employee numbers.
The base for micro is 192, small is 334, medium is 303, and large is 151. Source: Ipsos.
| Category | Micro | Small | Medium | Large |
|---|---|---|---|---|
| Decreased a lot | 0% | 1% | 2% | 1% |
| Decreased a little | 2% | 3% | 2% | 4% |
| Stayed about the same | 67% | 58% | 62% | 55% |
| Increased a little | 12% | 14% | 15% | 24% |
| Increased a lot | 17% | 19% | 13% | 9% |
Figure C.28 demonstrates that, while most businesses report no change, there is clear heterogeneity in responses across firm sizes based on employee numbers. In particular, large businesses are statistically significantly more likely to report small increases in the proportion of recycled content due to the tax compared with medium, small and micro businesses, suggesting differences in capacity or flexibility to adjust packaging in response to the tax. Small businesses are statistically significantly more likely to increase their recycled content a lot when compared to large businesses, though results are non-significant compared to micro and medium businesses. There were no significant differences by business size (by employee numbers) in terms of the proportion that reported any increase.
Figure C.29: Survey results for the question ‘Has the proportion of recycled content in your plastic packaging changed due to Plastic Packaging Tax?’ broken down by the size of businesses based on turnover.
Base: less than £5 million (183), £5 million to below £10 million (109), £10 million to below £50 million (354), £50 million to below £100 million (97 — note), and £100 million or more (147). Source: Ipsos.
Note: The sample for £50 million to below £100 million is small, and results should be interpreted with caution.
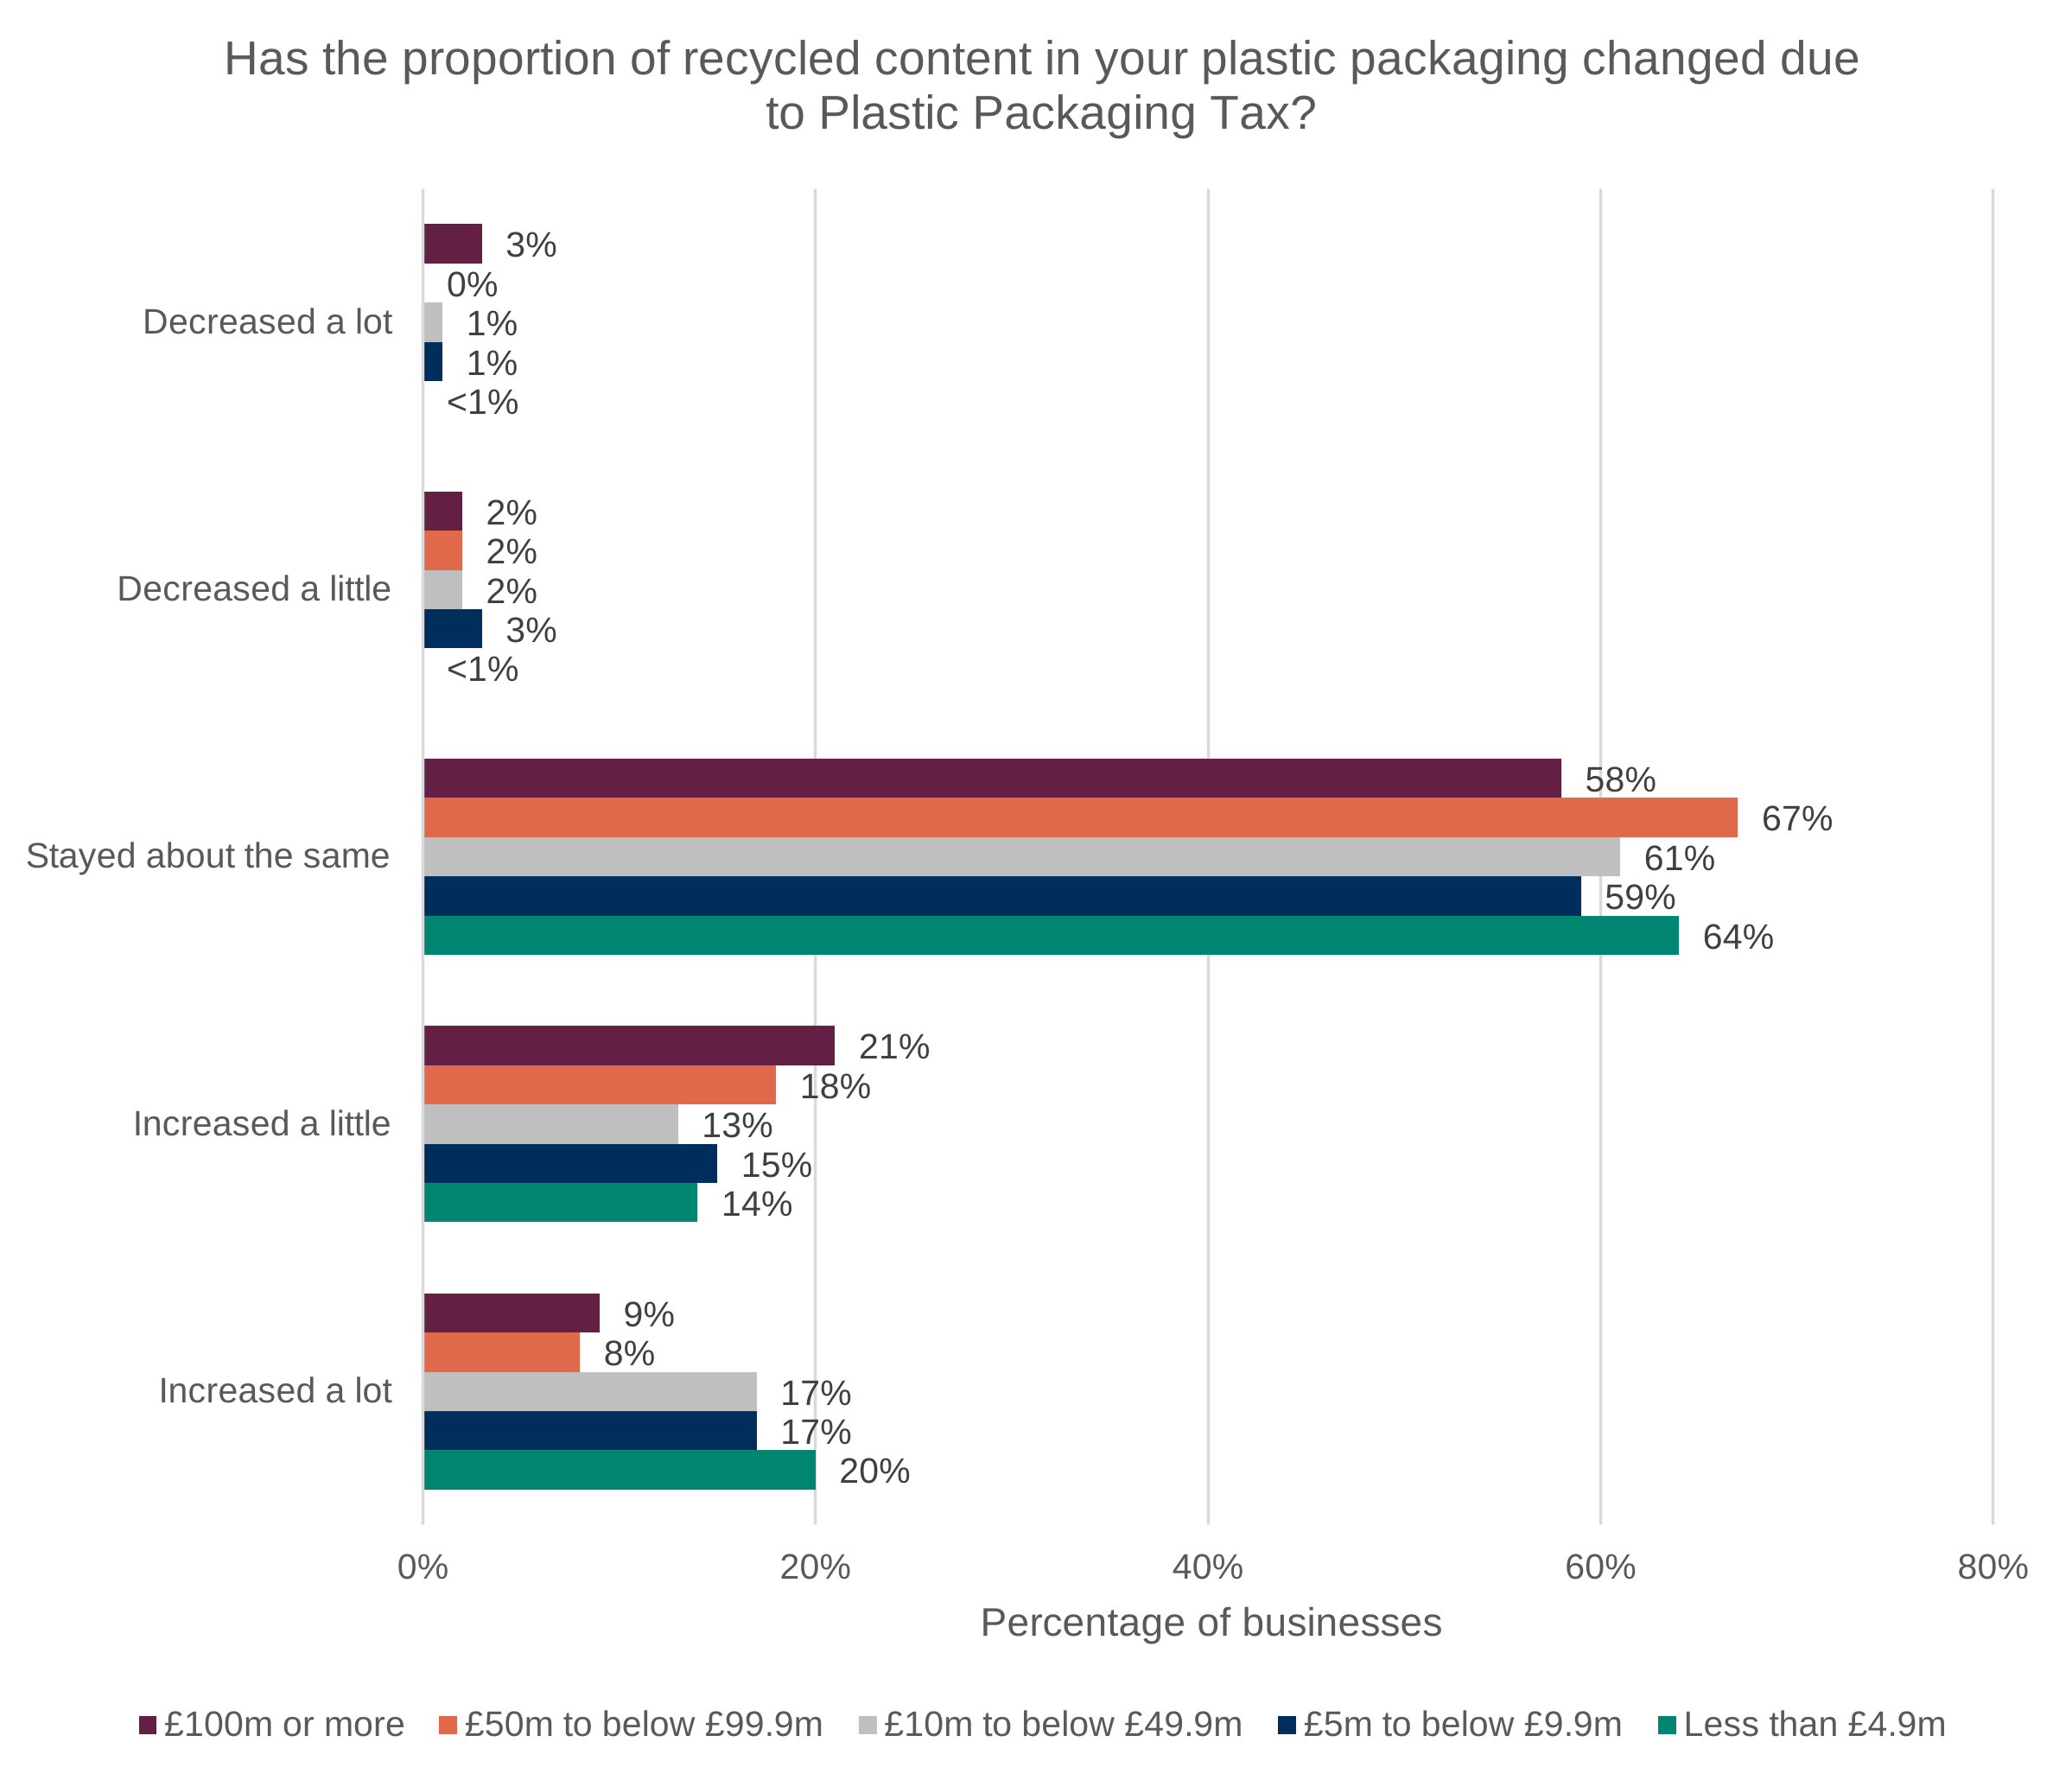
Data for Figure C.29: Survey results for the question ‘Has the proportion of recycled content in your plastic packaging changed due to Plastic Packaging Tax?’ broken down by the size of businesses based on turnover.
Base: less than £5 million (183), £5 million to below £10 million (109), £10 million to below £50 million (354), £50 million to below £100 million (97 — note), and £100 million or more (147). Source: Ipsos.
Note: The sample for £50 million to below £100 million is small, and results should be interpreted with caution.
| Turnover band | Increased a lot | Increased a little | Stayed about the same | Decreased a little | Decreased a lot |
|---|---|---|---|---|---|
| £100 million or more | 9% | 21% | 58% | 2% | 3% |
| £50 million to below £99.9 million | 8% | 18% | 67% | 2% | 0% |
| £10 million to below £49.9 million | 17% | 13% | 61% | 2% | 1% |
| £5 million to below £9.9 million | 17% | 15% | 59% | 3% | 1% |
| Less than £4.9 million | 20% | 14% | 64% | 0% | 0% |
Figure C.29 presents the same survey question broken down by the turnover of the businesses. Across turnover bands, the majority of businesses reported no change in the proportion of recycled content used in their plastic packaging, ranging from 58% among businesses with turnover of £100 million or more to 67% among those with turnover of £50 million to below £100 million. Around a quarter to a third of businesses reported an increase overall, with limited variation by turnover. However, businesses with turnover of £100 million or more were statistically significantly more likely than those with turnover of £10 million to below £50 million to report that recycled content had increased ‘a little’, 21% compared with 13%. The ‘£10 million to below £50 million’ category were significantly more likely than the ‘£100 million or more’ category to say it had ‘increased a lot’. Businesses in the lowest turnover band were also more likely to report that recycled content had “increased a lot” than those in the 2 highest turnover bands.
There was no clear relationship between business size and the extent of behavioural change observed due to the tax. However, there is evidence that businesses of different sizes based on employee numbers faced different barriers to increasing recycled content, although some constraints were common across all groups. Supply-side limitations were more pronounced for larger businesses: those in the large (31%), medium (29%) and small (27%) size groups were all statistically significantly more likely than micro businesses (16%) to report that suppliers do not provide products containing recycled content.
Cost-related barriers also varied by size. Small businesses were significantly more likely than medium businesses to report that increasing recycled content would raise product costs (21% compared with 12%) and were also more likely than micro businesses to cite increases in overall business costs (15% compared with 7%).
In contrast, demand-side constraints appear to have been more relevant for smaller businesses: micro (13%), small (13%) and medium (12%) businesses were all significantly more likely than large businesses (5%) to report a lack of customer demand. Micro businesses were also more likely to report that they had already made all feasible changes (10% compared with 4% or less for other groups).
There is more limited variation for other barriers, including quality concerns, regulatory challenges and availability of recycled plastic. These barriers were reported at broadly similar levels across business sizes. These results suggest that while supply-chain and technical constraints may be more binding for larger firms, smaller businesses may be relatively more affected by cost pressures and weaker customer demand, highlighting different challenges in increasing recycled content across the business population.
C.2.6.4 Business locations
The ability of businesses to respond to the PPT may depend on the location of their operations and supply chains. Businesses that reported having manufacturing sites outside the UK, or those headquartered in different jurisdictions, may face different opportunities and constraints when seeking to increase recycled content or alter the amount of plastic packaging they place on the UK market. For example, decisions relating to packaging specification, procurement, and investment may be taken at a global or regional level rather than solely within the UK, potentially influencing the extent to which businesses can respond to the incentives created by PPT.
To explore whether behavioural responses differ according to business location and international footprint, this section examines survey responses to changes in recycled content and plastic usage by whether businesses are headquartered in the UK and whether they operate manufacturing sites outside the UK that supply plastic packaging to the UK market. This provides insight into whether PPT appears to have had a different influence on businesses with more internationally integrated operations compared with those whose activities are primarily UK-based.
Figure C.30: Survey results for the question ‘Has the total tonnage of plastic packaging you manufacture and/or import changed due to Plastic Packaging Tax?’ broken down by headquarters location.
The base for businesses headquartered in the UK is 796, and for those outside the UK it is 204. Source: Ipsos.
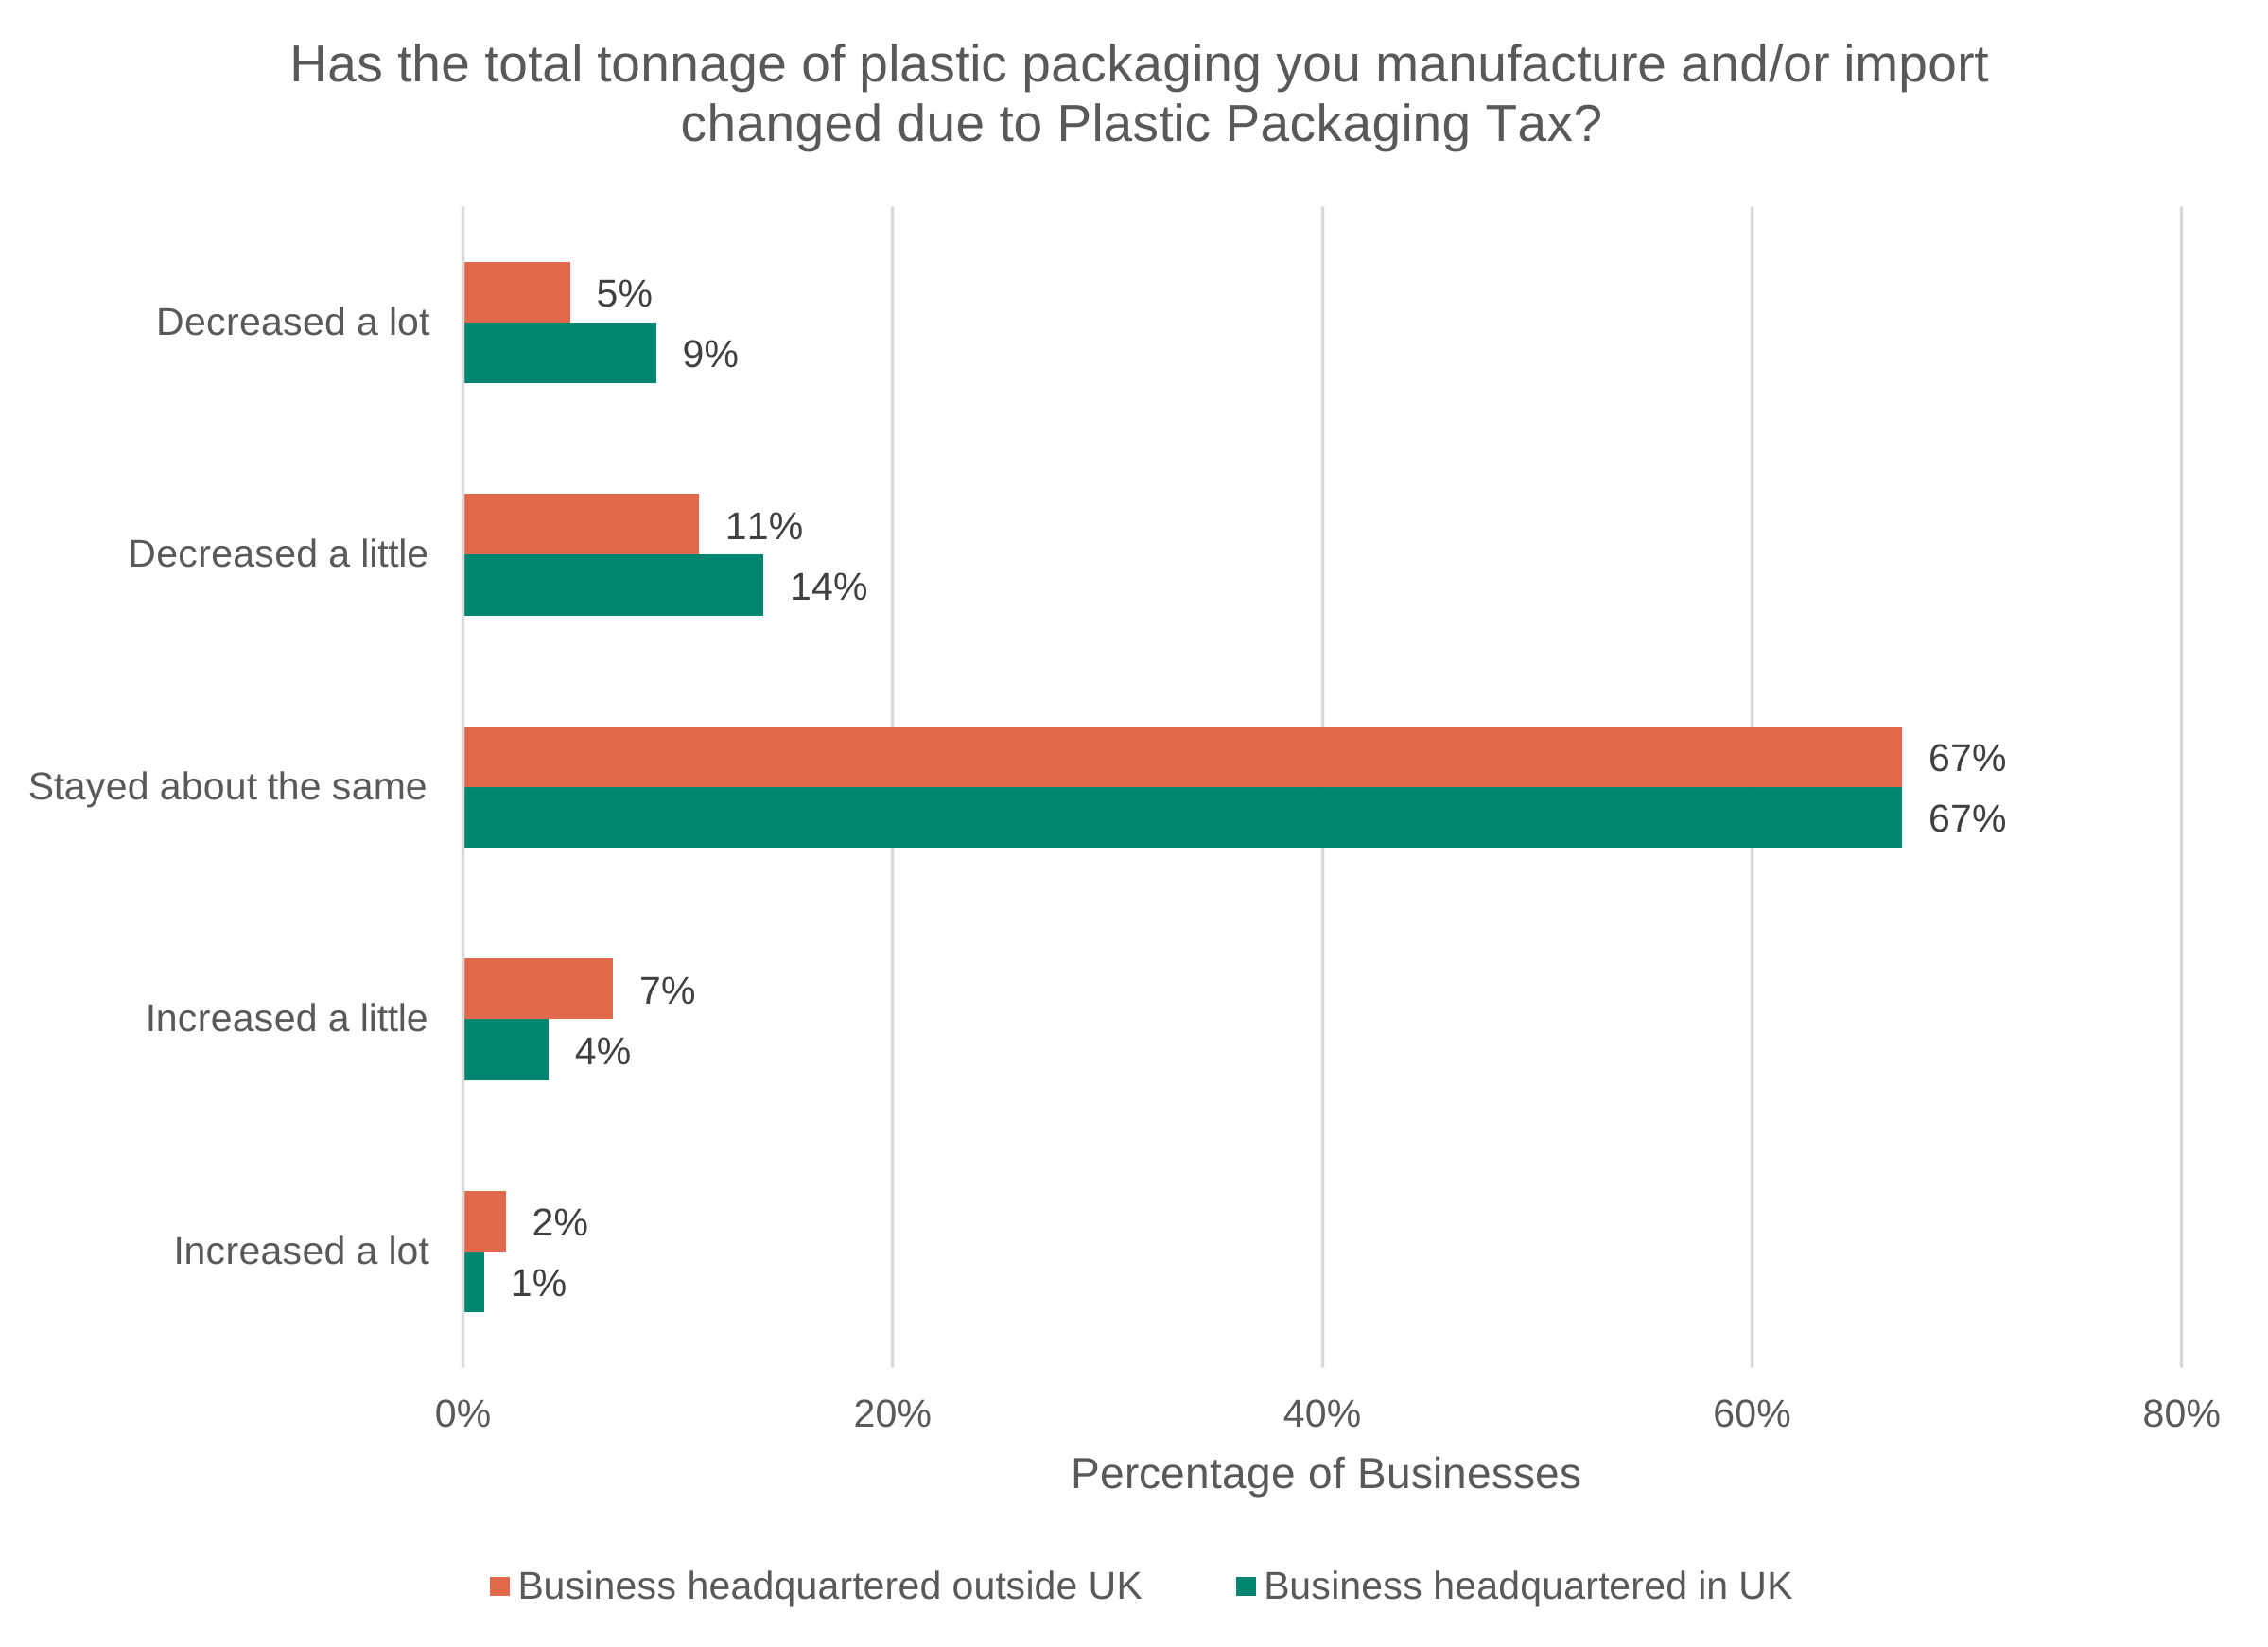
Data for Figure C.30: Survey results for the question ‘Has the total tonnage of plastic packaging you manufacture and/or import changed due to Plastic Packaging Tax?’ broken down by headquarters location.
The base for businesses headquartered in the UK is 796, and for those outside the UK it is 204. Source: Ipsos.
| Category | Business headquartered in UK | Business headquartered outside UK |
|---|---|---|
| Decreased a lot | 9% | 5% |
| Decreased a little | 14% | 11% |
| Stayed about the same | 67% | 67% |
| Increased a little | 4% | 7% |
| Increased a lot | 1% | 2% |
Figure C.30 shows that most businesses reported that the total tonnage of plastic packaging they manufacture and/or import had stayed about the same due to PPT, with 67% of both UK-headquartered businesses and businesses headquartered outside the UK selecting this response. Reported increases were uncommon across both groups, while reported decreases varied slightly by headquarters location. Businesses headquartered outside the UK were less likely to report that their plastic packaging tonnage had decreased a lot (5%) than UK-headquartered businesses (9%), and this was the only statistically significant difference between the 2 groups. Other response categories were not statistically significantly different. Overall, the results suggest that business headquarters location is not associated with substantial differences in reported changes to total plastic packaging tonnage, although there is some evidence that larger reductions were more commonly reported among businesses headquartered in the UK.
Figure C.31: Survey results for the question ‘Has the total tonnage of plastic packaging you manufacture and/or import changed due to Plastic Packaging Tax?’ broken down by whether they operate manufacturing sites outside the UK that supply plastic packaging to the UK.
The base for businesses operating such sites is 208, and for businesses not operating such sites it is 774. Source: Ipsos.
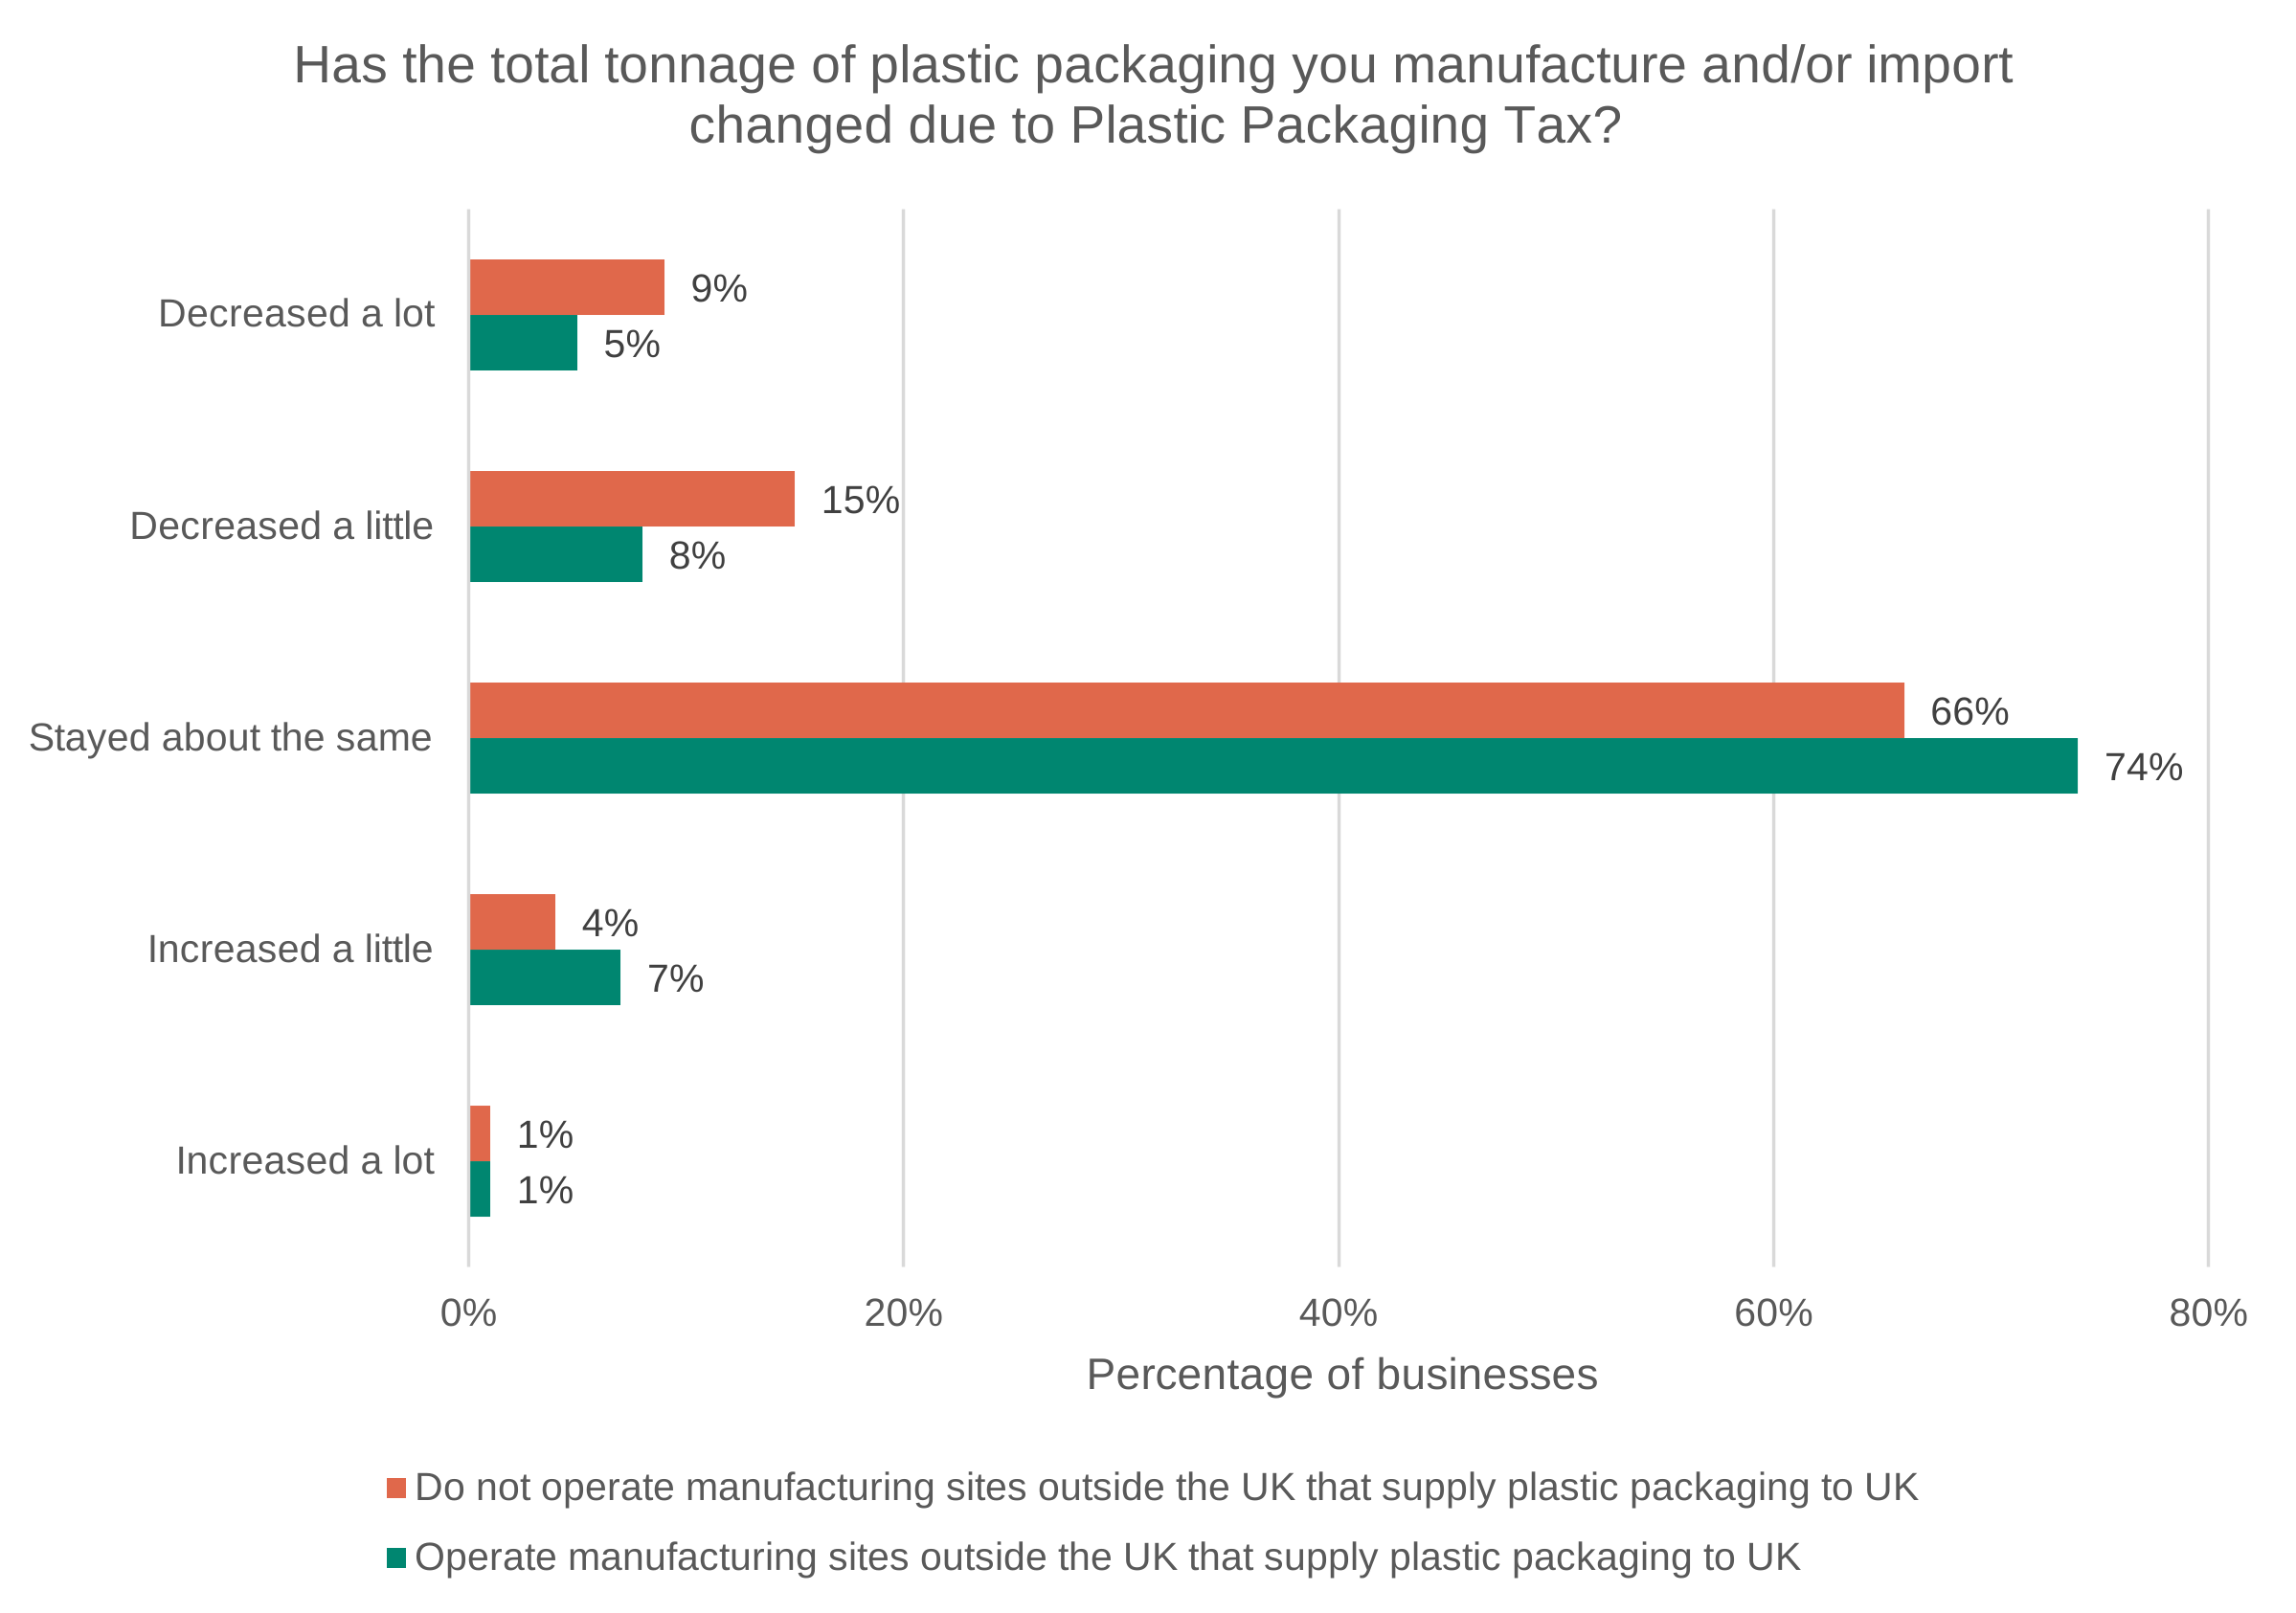
Data for Figure C.31: Survey results for the question ‘Has the total tonnage of plastic packaging you manufacture and/or import changed due to Plastic Packaging Tax?’ broken down by whether they operate manufacturing sites outside the UK that supply plastic packaging to the UK.
The base for businesses operating such sites is 208, and for businesses not operating such sites it is 774. Source: Ipsos.
| Category | Operate manufacturing sites outside the UK that supply plastic packaging to UK | Do not operate manufacturing sites outside the UK that supply plastic packaging to UK |
|---|---|---|
| Decreased a lot | 5% | 9% |
| Decreased a little | 8% | 15% |
| Stayed about the same | 74% | 66% |
| Increased a little | 7% | 4% |
| Increased a lot | 1% | 1% |
Figure C.31 shows that most businesses reported no change in the total tonnage of plastic packaging they manufacture and/or import due to PPT, regardless of whether they operate manufacturing sites outside the UK that supply plastic packaging to the UK. However, businesses operating manufacturing sites outside the UK were more likely to report that their plastic packaging tonnage had stayed about the same (74%) compared with businesses that do not operate such sites (66%). Conversely, businesses without manufacturing sites outside the UK were more likely to report that their plastic packaging tonnage had decreased a little (15%) than businesses with overseas manufacturing sites (8%). Both of these differences were statistically significant. This aligns with businesses headquartered in the UK being also statistically significantly more likely to report any decrease.
Figure C.32: Survey results for the question ‘Has the proportion of recycled content in your plastic packaging changed due to Plastic Packaging Tax?’ broken down by headquarters location.
The base for businesses headquartered in the UK is 796, and for those outside the UK it is 204. Source: Ipsos.
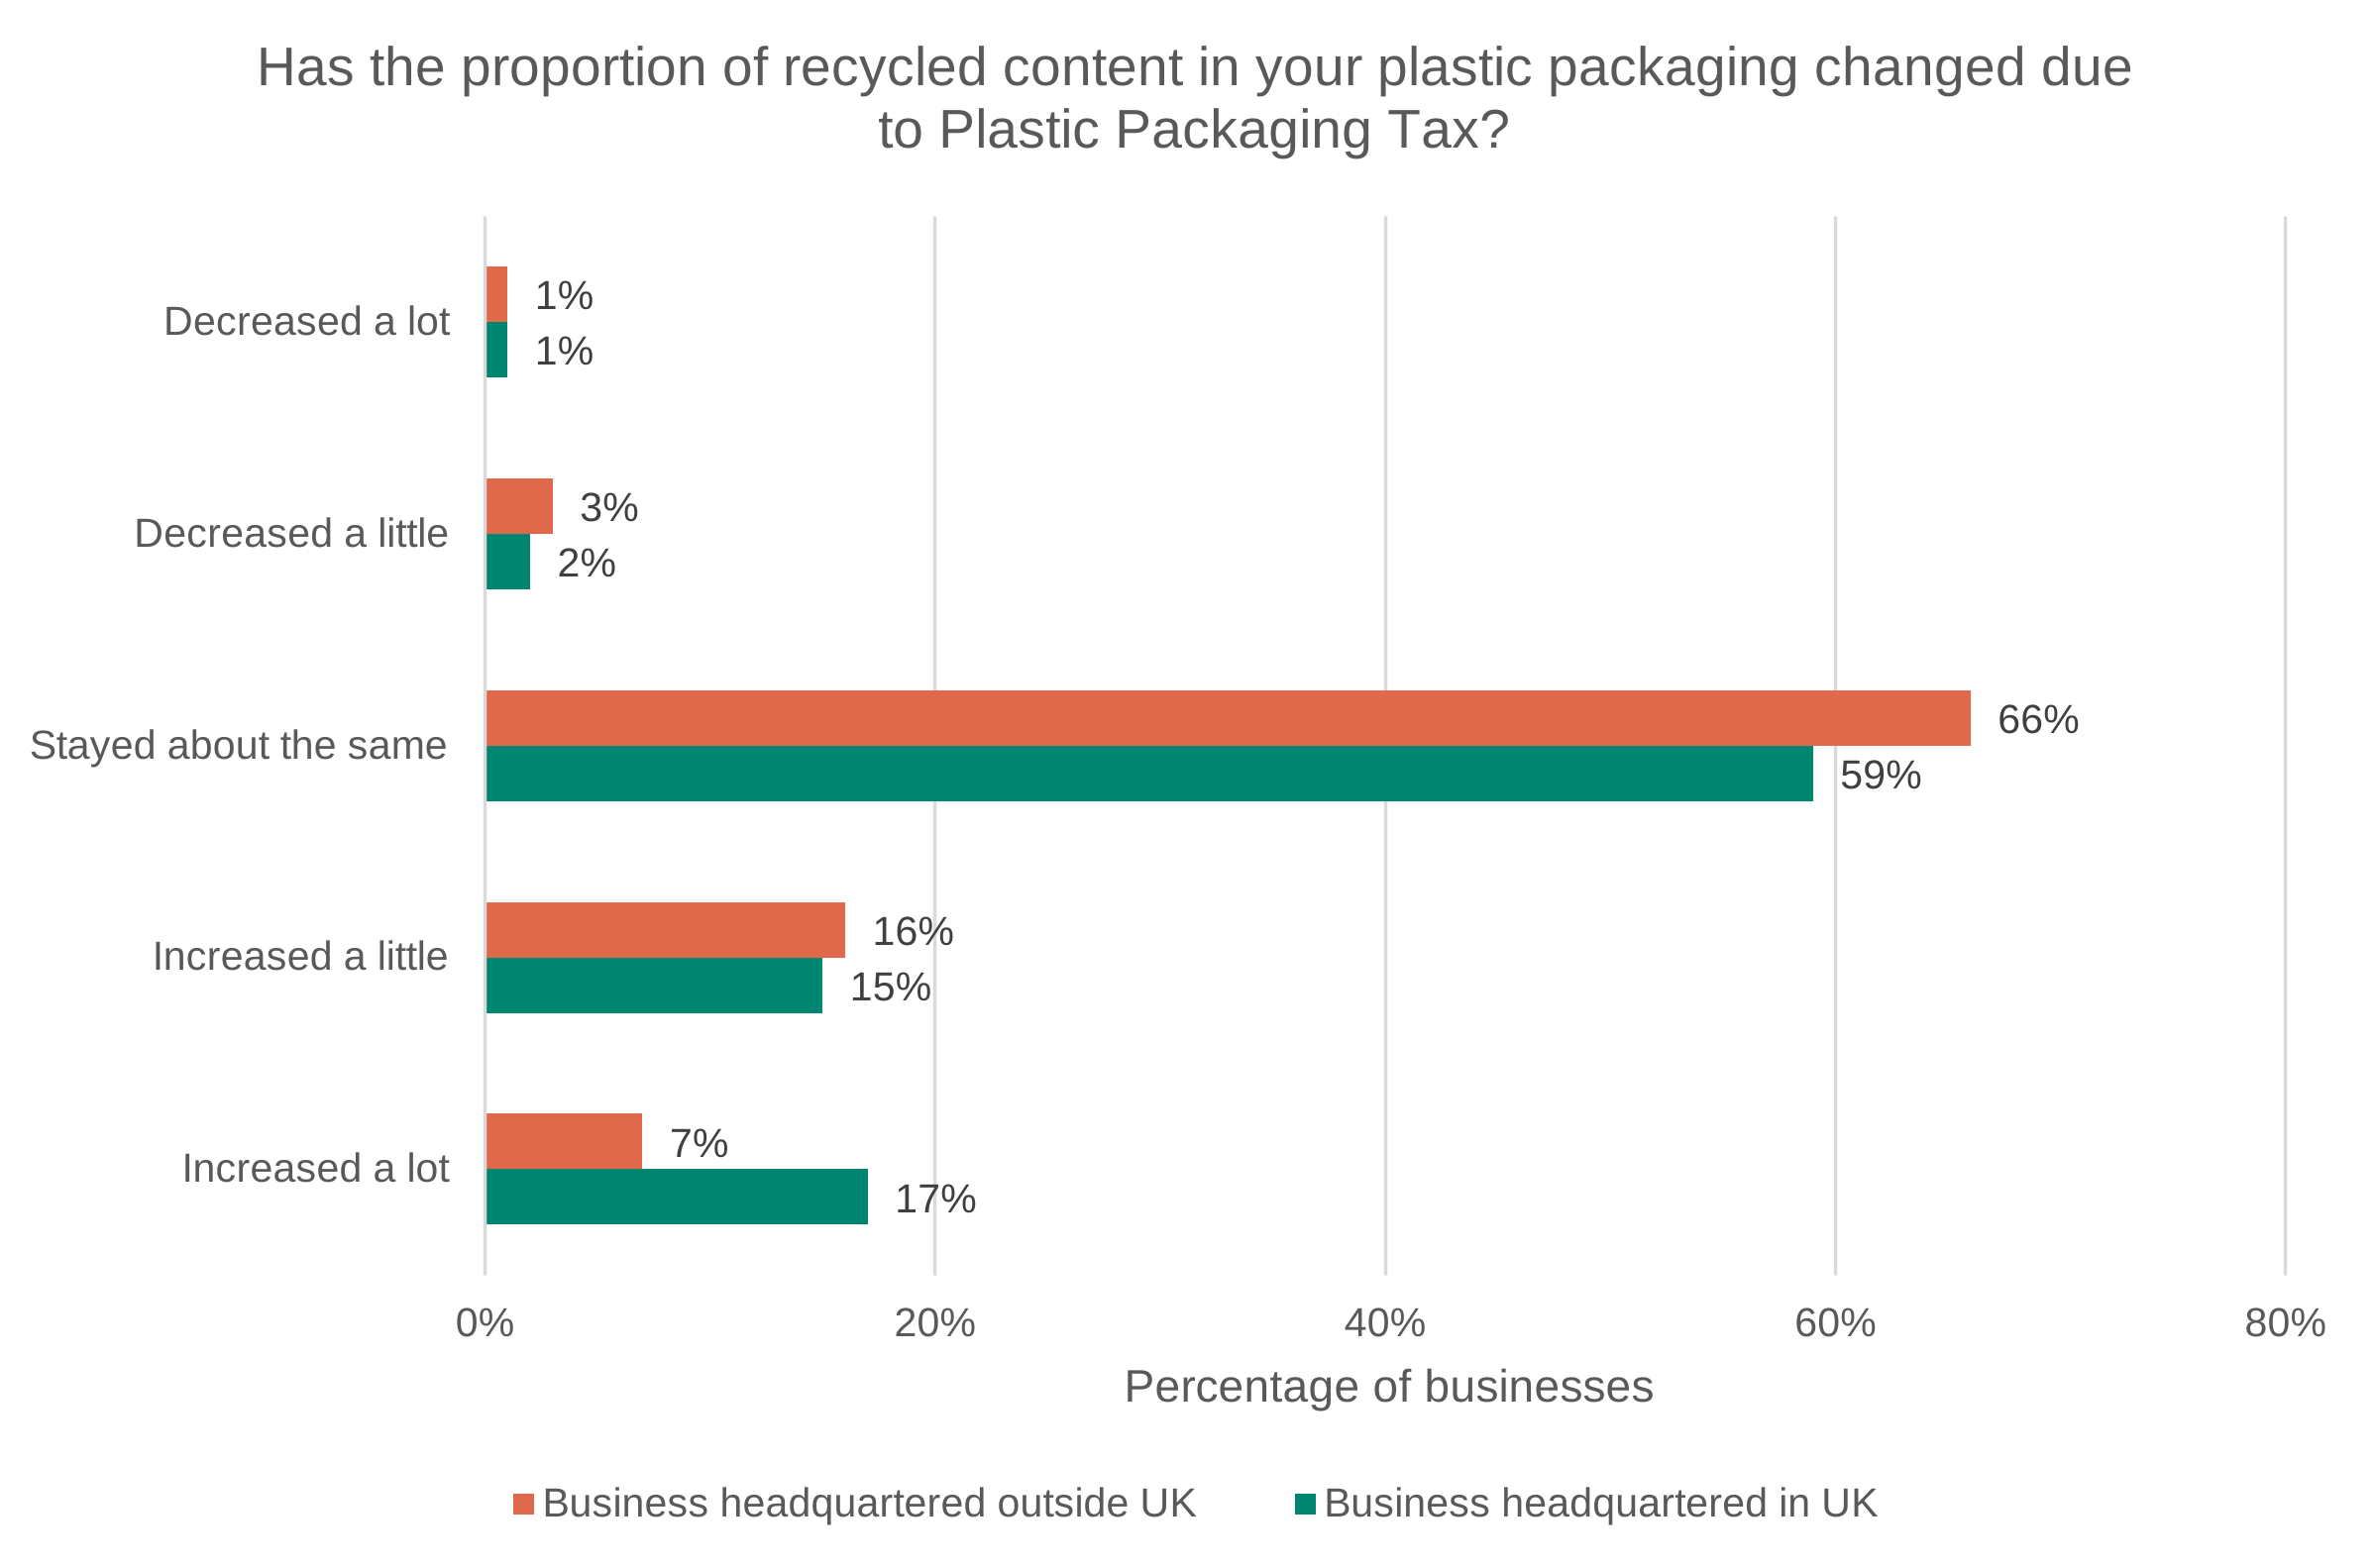
Data for Figure C.32: Survey results for the question ‘Has the proportion of recycled content in your plastic packaging changed due to Plastic Packaging Tax?’ broken down by headquarters location.
The base for businesses headquartered in the UK is 796, and for those outside the UK it is 204. Source: Ipsos.
| Category | Business headquartered in UK | Business headquartered outside UK |
|---|---|---|
| Decreased a lot | 1% | 1% |
| Decreased a little | 2% | 3% |
| Stayed about the same | 59% | 66% |
| Increased a little | 15% | 16% |
| Increased a lot | 17% | 7% |
Figure C.32 shows that most businesses reported that the proportion of recycled content in their plastic packaging had stayed about the same due to PPT, regardless of whether the business was headquartered in the UK or outside the UK. This was reported by 66% of businesses headquartered outside the UK and 59% of businesses headquartered in the UK. Reported decreases in recycled content were uncommon across both groups, with 1% of each group reporting that recycled content had decreased a lot, and 3% of businesses headquartered outside the UK and 2% of businesses headquartered in the UK reporting that it had decreased a little.
Reported increases in recycled content were more common among businesses headquartered in the UK. While the proportion reporting that recycled content had increased a little was similar across the 2 groups — 16% of businesses headquartered outside the UK and 15% of businesses headquartered in the UK — businesses headquartered in the UK were more likely to report that recycled content had increased a lot (17%) compared with businesses headquartered outside the UK (7%). This was the only statistically significant difference between the 2 groups.
These findings suggest that business headquarters location is not associated with large differences in the overall direction of reported change in recycled content, as most businesses in both groups reported no change. However, there is some evidence that stronger increases in recycled content were more commonly reported among businesses headquartered in the UK. This may indicate that UK-headquartered businesses were more likely to make substantial changes to recycled content in response to PPT, although the survey evidence alone does not explain the reasons for this difference.
Figure C.33: Survey results for the question ‘Has the proportion of recycled content in your plastic packaging changed due to Plastic Packaging Tax?’ broken down by whether they operate manufacturing sites outside the UK that supply plastic packaging to the UK.
The base for businesses operating such sites is 208, and for businesses not operating such sites it is 774. Source: Ipsos.
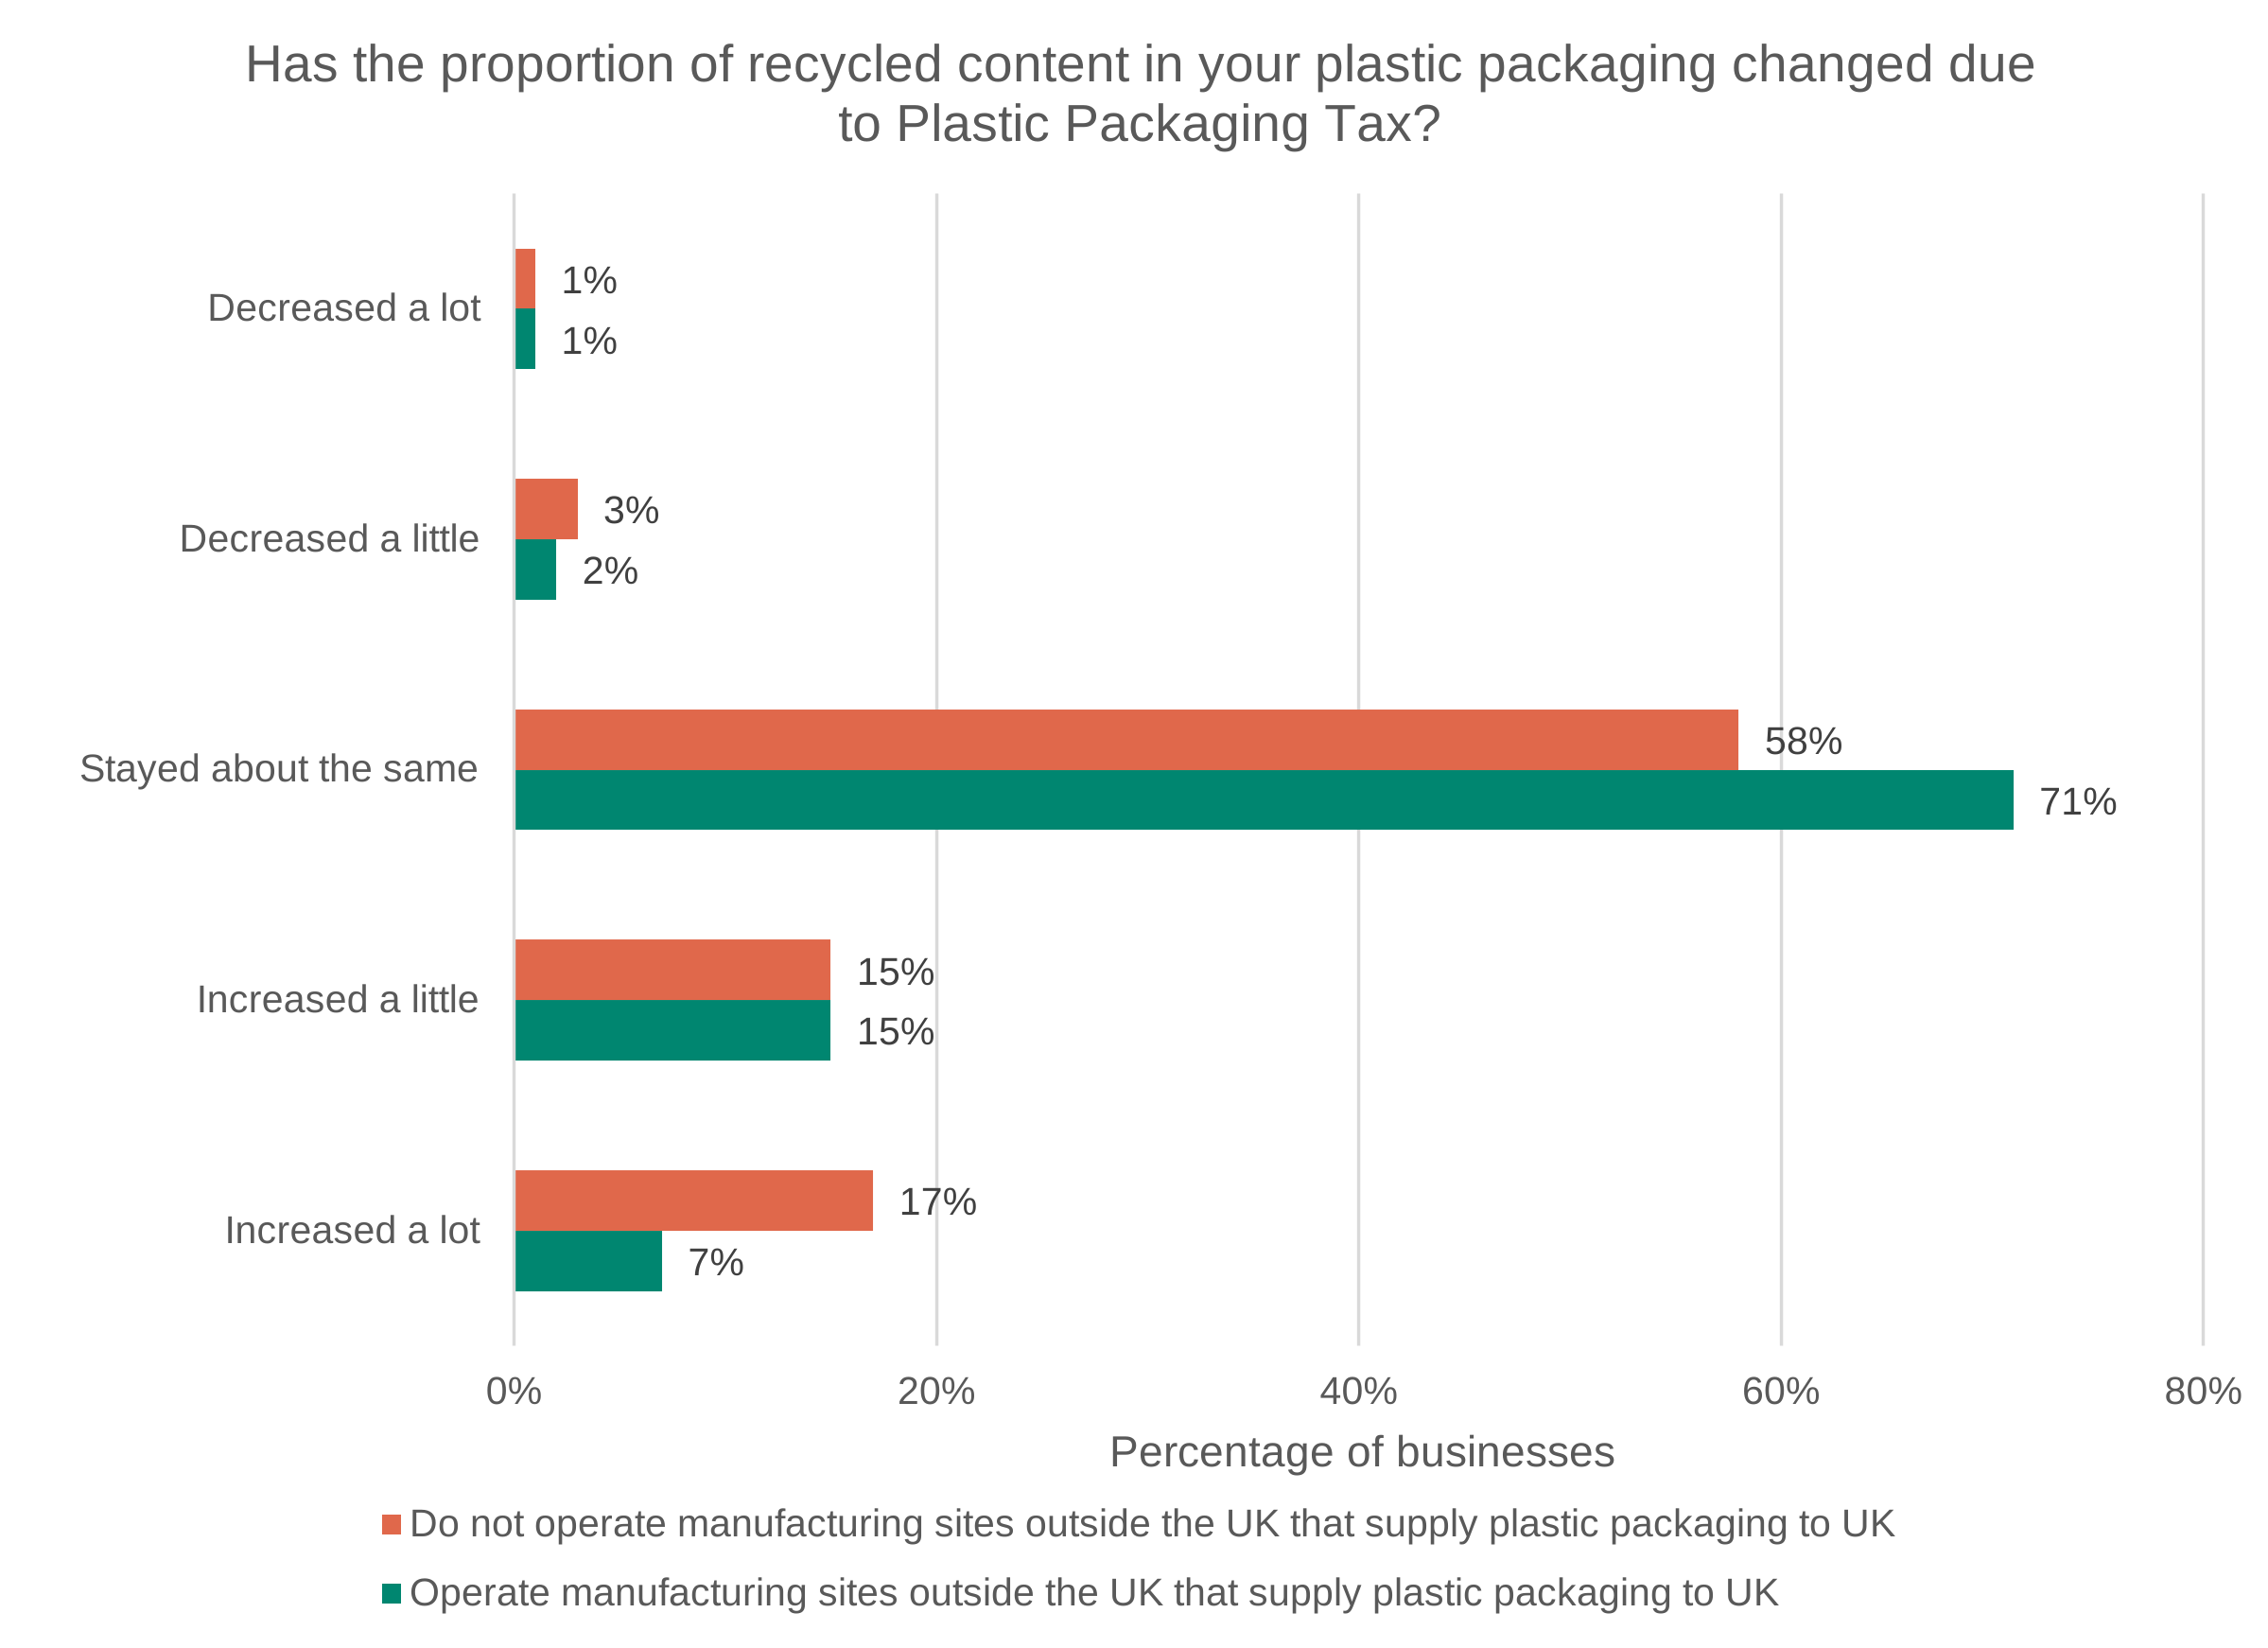
Data for Figure C.33: Survey results for the question ‘Has the proportion of recycled content in your plastic packaging changed due to Plastic Packaging Tax?’ broken down by whether they operate manufacturing sites outside the UK that supply plastic packaging to the UK.
The base for businesses operating such sites is 208, and for businesses not operating such sites it is 774. Source: Ipsos.
| Category | Operate manufacturing sites outside the UK that supply plastic packaging to UK | Do not operate manufacturing sites outside the UK that supply plastic packaging to UK |
|---|---|---|
| Decreased a lot | 1% | 1% |
| Decreased a little | 2% | 3% |
| Stayed about the same | 71% | 58% |
| Increased a little | 15% | 15% |
| Increased a lot | 7% | 17% |
Figure C.33 shows that most businesses reported that the proportion of recycled content in their plastic packaging had either stayed about the same or increased due to PPT, regardless of whether they operated manufacturing sites outside the UK that supply plastic packaging to the UK. However, businesses operating manufacturing sites outside the UK were more likely to report that recycled content had stayed about the same (71%) compared with businesses that do not operate such sites (58%). This difference was statistically significant.
Businesses that do not operate manufacturing sites outside the UK were more likely to report substantial increases in recycled content. Around 17% of these businesses reported that recycled content had increased a lot due to the tax, compared with 7% of businesses operating manufacturing sites outside the UK. This difference was statistically significant.
These findings suggest that businesses operating manufacturing sites outside the UK that supply plastic packaging to the UK were more likely to report no change in recycled content following the introduction of PPT. In contrast, businesses without such overseas manufacturing operations were more likely to report larger increases in recycled content due to the tax. This may suggest that businesses whose manufacturing operations are primarily UK-based had greater scope to make substantial changes to recycled content in response to PPT, which is consistent with the earlier analysis of manufacturers, importers and supply-chain constraints. However, the survey evidence alone cannot determine the reasons for these differences.
Overall, the findings relating to location of operations provide evidence that businesses do not appear to have responded uniformly to PPT. Differences by headquarters location and the presence of manufacturing sites outside the UK suggest that international business structures may influence the extent to which businesses are able to alter packaging composition or reduce plastic packaging use. The qualitative research additionally identified that some businesses reported that their international parent company didn’t necessarily prioritise PPT. The clearest differences were observed for recycled content, where businesses headquartered in the UK and those without overseas manufacturing operations supplying the UK were more likely to report substantial increases in recycled content. This may indicate that businesses with greater control over domestic packaging decisions, procurement, and manufacturing processes are better able to respond to the incentives created by PPT. These findings reinforce the wider conclusion of this chapter that responsiveness to PPT is heterogeneous and may depend, in part, on the operational and supply-chain constraints faced by different businesses.