Occupational Impact of COVID-19 in the Transport and Education Sectors
Published 14 November 2024

© Crown copyright 2024
This publication is licensed under the terms of the Open Government Licence v3.0 except where otherwise stated. To view this licence, visit nationalarchives.gov.uk/doc/open-government-licence/version/3 or write to the Information Policy Team, The National Archives, Kew, London TW9 4DU, or email: psi@nationalarchives.gov.uk.
Where we have identified any third party copyright information you will need to obtain permission from the copyright holders concerned.
This publication is available at https://www.gov.uk/government/publications/occupational-impact-of-covid-19-in-the-transport-and-education-sectors/occupational-impact-of-covid-19-in-the-transport-and-education-sectors
Presented to Parliament by the Secretary of State for Work and Pensions by Command of His Majesty
November 2024
This publication is licensed under the terms of the Open Government Licence v3.0 except where otherwise stated.
Where we have identified any third party copyright information you will need to obtain permission from the copyright holders concerned.
This publication is available at www.gov.uk/official-documents.
Any enquiries regarding this publication should be sent to us at iiac@dwp.gov.uk.
ISBN 978-1-5286-5258-2
Industrial Injuries Advisory Council
Dr Lesley Rushton, OBE, BA, MSc, PhD, Hon FFOM, (Chair)
Professor John Cherrie, CFFOH
Ms Lesley Francois, LLB (Hons), MA, LLM
DR Sally Hemming, CPsychol
Professor Max Henderson, MSc, PhD, MRCP, MRCPsych, Hon FFOM
DR Richard Heron, FRCP, FFOM
Dr Jennifer Hoyle, MRCP Edin, FRCP
Dr Ian Lawson, MB, BS, FFOM, FRCP, FRSPH
Professor Damien McElvenny, BSc MSc CStat CSci
Mr Steve Mitchell
Mr Daniel Shears, BA (Hons)
Dr Chris Stenton, BSc, MB, BCh, BAO, FRCP, FFOM, FFOM.RCPI
DR Sharon Stevelink, BSc, MSc
Dr Gareth Walters, MD, FRCP, FHEA
Former Council Members
Professor Raymond Agius, MD, DM, FRCP, FRCPE, FFOM
Professor Kim Burton, OBE, PhD, Hon FFOM
Mr Keith Corkan, BA
HSE Observer
Ms L Darnton
IIAC Secretariat
Secretary: Mr S Whitney
Scientific Adviser: Mr I Chetland
Administrative Secretary: Ms C Hegarty
Occupational Impact of COVID-19 in the Transport and Education Sectors
Dear Secretary of State,
The Industrial Injuries Advisory Council (IIAC) has been investigating potential occupational impacts of COVID-19 since the start of the coronavirus pandemic in 2020. Over this time period, it published an initial position paper ‘COVID-19 and occupation: IIAC position paper 48’ which concluded that there was a clear association between several occupations and increased risk of death from COVID-19 but acknowledged the evidence was too limited in quality and quantity to justify prescription at that stage.
During 2021 and 2022, very many more scientific reports were published on the symptoms, illnesses, and pathology associated with COVID-19, and on occupational exposure to the virus, SARS-CoV-2, which causes the disease. Reviewing this emerging evidence resulted in a 2022 command paper – COVID-19 and Occupational Impacts from IIAC which detailed the extensive evaluation of that evidence. The Council identified there was a large body of consistent supporting evidence showing that, for Health and Social Care Workers (H&SCWs), whose work brings them into frequent close proximity to patients or clients, there was a significantly increased risk of infection, subsequent illness, and death. The Council therefore felt that there was sufficient evidence to recommend prescription for these workers. The Council found robust evidence for the prescription of five serious pathological complications following COVID-19 which had been shown to cause persistent impairment and loss of function in some people.
Since the publication of the 2022 command paper, more evidence has become available for transport workers and those working in the education sector. However, there are still sparse or poor-quality data on other specific occupations and also on the group of occupations classified as key workers by the UK government; this position is largely unchanged from that of our previous two reports. This current report thus presents the Council’s evaluation of the evidence that has now accrued in the education and transport sectors.
From the published data on mortality, IIAC takes the view in this report that the risks of infection are likely to be more than doubled in transport workers who have been working in proximity to the general public. Based on the available scientific evidence, IIAC therefore recommends prescription for workers in bus/coach transport and taxis/private hire cars/cabs working in proximity to the general public in the 2 weeks prior to infection for the five serious pathological complications following COVID-19, as recommended for H&SCWs, which have been shown to cause persistent impairment and loss of function in some people. These conditions are:
1. Persisting pneumonitis or lung fibrosis following acute COVID-19 pneumonitis.
2. Persisting pulmonary hypertension caused by a pulmonary embolism developing between 3 days before and 90 days after a diagnosis of COVID-19.
3. Ischaemic stroke developing within 28 days of a COVID-19 diagnosis.
4. Myocardial infarction developing within 28 days of a COVID-19 diagnosis.
5. Symptoms of Post Intensive Care Syndrome following ventilatory support treatment for COVID-19.
The Council found no evidence of any marked increase in death rates in workers in the education sector associated with SARS-CoV-2 infection. In addition, the infection risks vary depending on when and where the studies were carried out and, overall, do not provide consistent evidence of a doubled risk in education workers. IIAC is thus unable to recommend prescription for these workers.
IIAC recognises that there are other occupational sectors where COVID-19 infection may be acquired in work settings. However, the evidence for an increased risk is weaker with inconsistent results over different time periods. The Council has concluded, therefore, that at this stage the evidence is of insufficient quantity and quality to recommend prescription for these occupations. IIAC also recognises that there have been outbreaks where several co-workers where infection and the spread was probably occupational. However, currently it is not possible to define these circumstances for the purposes of IIDB.
The Council will continue to monitor the evidence and available data relating to COVID-19. The Council expects that there will be more evidence on the long-term adverse health consequences of COVID-19, including increased understanding of the underlying pathophysiology of the key symptoms of post-COVID syndrome (or long COVID).
Yours sincerely,
Dr Lesley Rushton
Chair, Industrial Injuries Advisory Council
Summary
The pandemic of Coronavirus Disease 2019 (COVID-19) caused by infection with severe acute respiratory syndrome coronavirus 2 (SARS-CoV-2) began early in 2020 in the UK. Since then, the Industrial Injuries Advisory Council (IIAC) has been continually reviewing the accruing scientific evidence on the occupational risks of COVID-19. Two papers have been published: an interim Position Paper – COVID-19 and occupation: IIAC position paper 48 published in February 2021 based on information available in 2020; a Command Paper published in November 2022 which recommended prescription for Health and Social Care Workers of five serious pathological complications following COVID-19 that have been shown to cause persistent impairment and loss of function in some people – COVID-19 and Occupational Impacts – GOV.UK. Although associations between several other occupations and death and infection related to COVID-19 were also found, the evidence available at that time for any increased risk was much weaker, with inconsistent results over different time periods.
Since the publication of the command paper, more evidence has become available for transport workers and those working in the education sector. However, there are still sparse or poor-quality data on other specific occupations and also on the group of occupations classified as key workers by the UK government; this position is largely unchanged from that of our previous two reports. This report thus presents the Council’s evaluation of the evidence that has now accrued in the education and transport sectors.
Although the World Health Organisation (WHO) declared the end of the COVID-19 pandemic in May 2023 there continues to be changing patterns of occupational and non-occupational infection and this, together with the complex patterns of control measures during the pandemic period, has presented IIAC with challenges when interpreting the large amount of data collected and reports and papers published. Any prescription for a disease under Industrial Injuries Disablement Benefit (IIDB) must be based on robust evidence such that it is possible to assume with reasonable certainty (the balance of probabilities) that the condition was acquired as a result of work.
The majority of the data for the education sector relates to schools and colleges and there is very little information for work in the early years sector such as nursery schools and childminding. There is no evidence of any marked increase in death rates in workers in the education sector associated with SARS-CoV-2 infection. The risk of SARS-CoV-2 infection among education workers in schools varies depending on when and where the studies were carried out. Overall, although there are a few results where the confidence intervals around risk estimates extend to doubled, the infection data does not identify education workers as meeting IIAC’s requirement for prescription. IIAC accepts that in some studies the risks faced by education workers with direct student contact is likely to have been diluted by the risks of those who did not have such direct contact, and there are likely to be circumstances where education workers developed infection as a consequence of contact with students. However, taking the infection and mortality data as a whole, IIAC is unable to conclude that there is sufficient evidence of a doubled risk in education workers and is therefore unable to recommend prescription.
There is sparser evidence relating to SARS-CoV-2 infection in transport workers especially in the early stages of the pandemic and in subgroups of transport workers. However, the mortality data for the transport sector relating to COVID-19 consistently shows increased risks, particularly for public-facing transport workers such as coach/bus and taxi/cab (including private hire) drivers. IIAC considers that mention of COVID-19 on death certificates gives a good indication of the occurrence of infection. IIAC recognises that infection may occur outside occupation, including in hospital, but this information is not available. From the mortality data, IIAC takes the view that the risks of infection are likely to be more than doubled in transport workers who have been working in proximity to the general public. Based on the available scientific evidence, IIAC therefore recommends prescription of five serious pathological complications following COVID-19 that have been shown to cause persistent impairment and loss of function in some people:
1. Persistent pneumonitis or lung fibrosis following acute COVID-19 pneumonitis
2. Persisting pulmonary hypertension following a pulmonary embolism
3. Ischaemic stroke
4. Myocardial infarction
5. Symptoms of Post Intensive Care Syndrome following ventilatory support treatment for COVID-19: for workers in bus/coach transport and taxis/private hire cars/cabs working in proximity to the general public in the 2 weeks prior to infection.
The Council recognises that there are other occupational sectors where COVID-19 infection may be acquired in work settings. However, the evidence for an increased risk is weaker with inconsistent results over different time periods. The Council has concluded, therefore, that at this stage the evidence is of insufficient quantity and quality to recommend prescription for these occupations. We also recognise that there have been outbreaks where several co-workers were infected, and the spread was probably occupational. However, currently it is not possible to define these circumstances for the purposes of IIDB.
The Council also acknowledges that some people may suffer persisting symptoms that may impact of their daily activities including their work (post-COVID syndrome or long COVID). Currently, understanding of the underlying pathophysiology of the key symptoms of post-COVID syndrome is limited, as is the ability to measure and diagnose the condition objectively. Although IIAC acknowledges the occurrence of symptoms of long COVID, they are not objectively verifiable in the majority of cases. IIAC therefore considers that there is insufficient evidence at present to recommend extension for prescription for this syndrome. IIAC acknowledges, however, that many of the reported symptoms of long COVID may occur following one or more of the pathological complications listed in the recommended prescription and will be responsible for an as yet unknown proportion of reported cases of long COVID.
The Council is aware that, separate from any prescription, there may be a number of instances where individual workers may make a claim under the accident provisions of IIDB for any disability or loss of faculty that can be shown to have resulted from linking their exposure to SARS-CoV-2 to a specific incident or occurrence: this would apply to immediate injury and also to effects that are delayed and only become apparent at a later time.
The Council will continue to monitor the evidence and available data relating to COVID-19. The Council expects that there will be more evidence on the long-term adverse health consequences of COVID-19, including increased understanding of the underlying pathophysiology of the key symptoms of post-COVID syndrome.
Introduction
1. December 2019 saw the start of a pandemic of Coronavirus Disease 2019 (COVID-19) caused by infection with severe acute respiratory syndrome coronavirus 2 (SARS-CoV-2). The first case of COVID-19 documented in the UK was on 31 January 2020 and the UK has since experienced several major waves of infection.
2. In April 2020 the Industrial Injuries Advisory Council (IIAC) began to collect, collate, and review the evidence linking occupation to the risk of COVID-19 during 2020. An interim Position Paper –COVID-19 and occupation: IIAC position paper 48 was published in February 2021 which focussed mainly on mortality data from March to December 2020. Although there were inconsistencies in the data, the Council found evidence of a clear association between several occupations and death from COVID-19, including within the health and social care sectors, transport, food processing, retail work, security and local and national administration sectors. There was a lack of data on morbidity associated with infection from SARS-CoV-2 although it was acknowledged that it was likely to cause a substantial health burden and potential long-term disability. The Council felt the inconsistency and limited extent of the data overall meant that the evidence was too limited in quality and quantity to justify prescription at that stage.
3. In 2021 to 2022, the Council carried out a further investigation following publication of a large number of additional scientific papers and reports on both mortality and morbidity from COVID-19 and occupational exposure to SARS-CoV-2; There was also an increased understanding of the complications of COVID-19 and of the development of post-COVID syndrome (popularly termed ‘long COVID’). A Command paper –COVID-19 and Occupational Impacts – GOV.UK which was published in November 2022 recommended, for Health and Social Care Workers (H&SCWs), the prescription of five serious pathological complications following COVID-19 that have been shown to cause persistent impairment and loss of function in some people:
1. Persistent pneumonitis or lung fibrosis following acute COVID-19 pneumonitis
2. Persisting pulmonary hypertension following a pulmonary embolism
3. Ischaemic stroke
4. Myocardial infarction
5. Symptoms of Post Intensive Care Syndrome following ventilatory support treatment for COVID-19
4. There was less robust and consistent evidence for other occupational sectors although the Council noted some evidence of increased risk of infection and mortality in occupations such as bus and taxi drivers and in those who worked in education. The Council concluded at the time, however, that the evidence was of insufficient quantity and quality to recommend prescription for these occupations.
5. Since the publication of the command paper, more evidence has become available for transport workers and those working in the education sector. However, there are still sparse or poor-quality data on other specific occupations and also on the group of occupations classified as key workers by the UK government; this position is largely unchanged from that of our previous two reports. For the same reasons, IIAC have been unable to evaluate the evidence for small groups of workers including those who may have experienced an outbreak of Sars-CoV-2 infection. Hence, IIAC came to a consensus that this report should focus on the transport and education sectors. This report includes evaluation of both infection and mortality information, a discussion of relevant work patterns and transmission pathways, and the use of Job Exposure Matrices (JEM) to indicate the potential risk of being infected because of the characteristics of a person’s job. As part of the evaluation, IIAC carried out a benchmarking process comparing the evidence used for the prescription for H&SCWs with that available for transport and education workers.
The Industrial Injuries Disablement Benefit (IIDB) Scheme
6. The IIDB Scheme provides non-contributory, ‘no-fault’ benefits for disablement because of accidents or prescribed diseases which arise during the course of employed earners’ work. The benefit is paid in addition to other incapacity and disability benefits. It is tax-free and administered by the Department for Work and Pensions.
7. The legal requirements for prescription are set out in The Social Security Contributions and Benefits Act 1992 which states that the Secretary of State may prescribe a disease where they are satisfied that the disease ought to be treated, having regard to its causes and incidence and any other relevant considerations, as a risk of the occupation and not as a risk common to all persons; and is such that, in the absence of special circumstances, the attribution of particular cases to the nature of the employment can be established or presumed with reasonable certainty.
8. Thus, a disease may only be prescribed if there is a recognised risk to workers in an occupation and the link between disease and occupation can be established or reasonably presumed in individual cases.
The Role of the Industrial Injuries Advisory Council
9. IIAC is an independent statutory body established by an Act of Parliament in 1946 to advise the Secretary of State for Social Security on matters relating to the IIDB scheme. A major part of the Council’s time is spent considering whether the list of prescribed diseases for which benefit may be paid should be enlarged or amended.
10. In considering the question of prescription the Council searches for a practical way to demonstrate in the individual case that the disease can be attributed to occupational exposure with reasonable certainty; for this purpose, ‘reasonable certainty’ is interpreted as being based on the balance of probabilities.
11. Some occupational diseases are relatively simple to verify, as the link with occupation is clear-cut. Some only occur due to particular work or are almost always associated with work or have specific medical tests that prove their link with work, or have a rapid link to exposure, or other clinical features that make it easy to confirm the work connection. However, many other diseases are not uniquely occupational, and when caused by occupation, are clinically indistinguishable from the same disease occurring in someone who has not been exposed to a hazard at work. In these circumstances, attribution to occupation depends on research evidence that work in the prescribed job or with the prescribed occupational exposures causes the disease on the balance of probabilities.
12. The health effects arising from workplace exposure to SARS-CoV-2 cannot be distinguished from infection transmitted in non-occupational circumstances, so the case for prescription rests on having robust research evidence on the causal probabilities for the relevant occupational circumstances. Where there is good quality epidemiological data, the Council therefore looks for evidence that the risk of developing the disease associated with occupation is more than doubled (previous reports of the Council explain why this threshold was chosen). However, in circumstances where there are limited epidemiological studies of long-term disabling disease with good quality occupational information, the Council will consider the totality of all available qualitative and quantitative evidence on exposure, transmission pathways, risk and disease outcomes. An evidence synthesis approach is then used to evaluate the strength and consistency of the information in making a judgement based on the balance of probabilities.
13. For most individuals COVID-19 is a self-limiting illness but a minority of people experience persisting symptoms following recovery from acute illness that may last for some months or even longer. These can be a consequence of complications of the acute illness such as pulmonary thromboembolism, or the less clearly understood sequelae that are generally referred to under the umbrella terms ‘post-COVID-19 syndrome’ or ‘long COVID’. In both situations symptoms may improve over the course of several weeks or months but, in some instances, they may result in persisting impairment, loss of function and disability.
14. During 2020 and 2021, the UK, like many other countries, experienced varying patterns of population infection rates and consequently varying restrictions on movement, closure of schools, shops and other venues and changes to working patterns. There were several variants of SARS-CoV-2 during these 2 years and substantial changes to prevention, detection and treatment, including the introduction of population vaccination programmes. There have continued to be persisting waves of different variants of SARS-CoV-2 since then, including varying numbers of deaths and hospital admissions, although testing programmes of the general population ceased in February 2022 in the UK. The World Health Organisation (WHO) Director General announced the end of the COVID-19 Public Health Emergency on May 5 2023 but added a caution that ‘The worst thing any country could do now is to ‘… let down its guard, to dismantle the systems it has built, or to send the message…’ that COVID-19 is nothing to worry about’ (WHO 2023 ).This complex situation has presented IIAC with challenges when interpreting the large amount of data collected and reports and papers published.
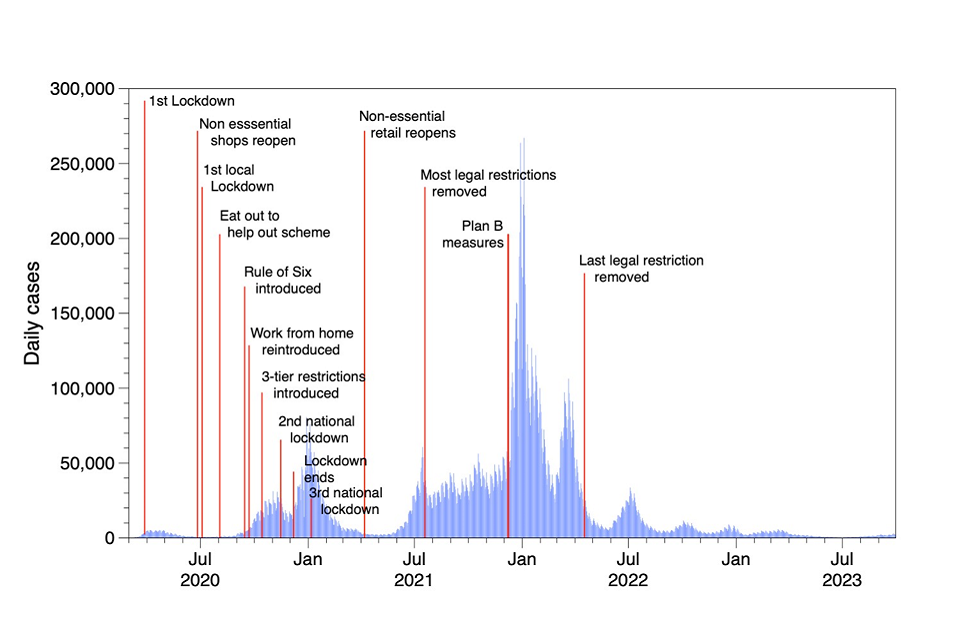
15. Figures 1 and 2 show deaths and cases respectively, attributed to COVID-19 in Great Britain from 2020 together with information on restrictions throughout the period.
Figure 1
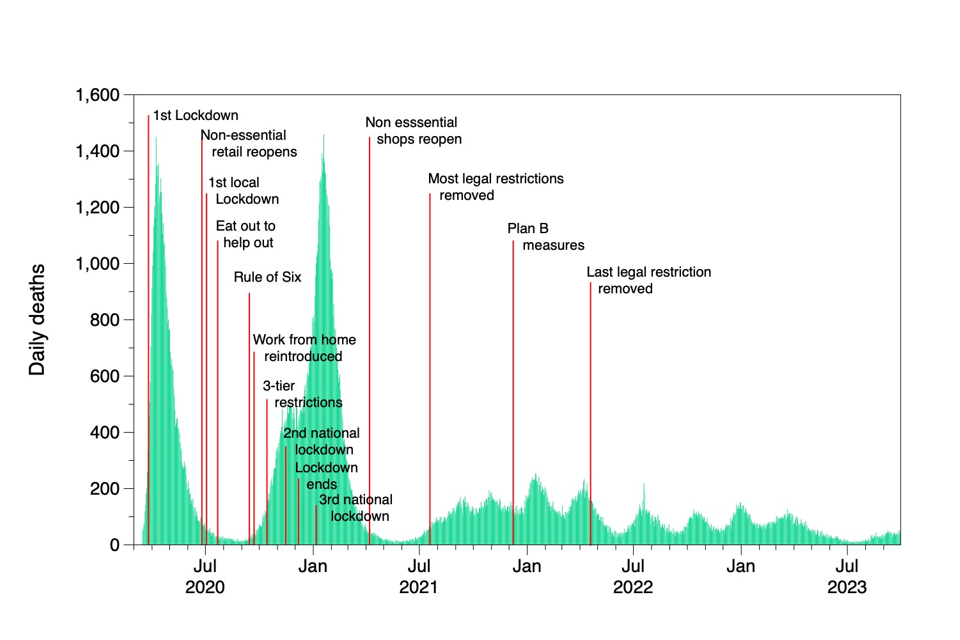
Figure 2
Exposure to SARS-CoV-2
Work patterns during the pandemic
16. During the pandemic, workers in a number of sectors including health care, transport, education and others were designated as key or essential workers – Coronavirus and key workers in the UK – Office for National Statistics (ons.gov.uk). This often absolved them from restrictions regarding home working and gave access to in-person schooling for their children. The Office for National Statistics (ONS), using data from the 2019 Labour Force Survey (ONS 2020a), estimated that there were 10.6 million people employed in key worker occupations and industries (33% of the total workforce).
17. The usual place of work in many occupations changed during the pandemic compared to pre-pandemic, particularly regarding working outside the home; this varied considerably by major occupational groups. Changes in usual work patterns may have impacted on the estimation of risks of COVID-19 due to occupational exposure. In healthcare there was large scale redeployment to deal with the burden in high dependency units. In the retail sector there was some redeployment of workers to cope with increased use of online purchasing and resulting delivery requirements.
Transmission pathways and possible risks
18. It is now widely accepted that the main route of transmission of the SARS-CoV-2 virus is by inhalation of fine particles and/or liquid droplets (aerosols) containing the virus, that are suspended in the air (airborne). These aerosols are continuously produced when an infectious individual exhales, although the amount of virus emitted is dependent on the stage of the infection and the extent of any vocalisation. Coughing or sneezing produce larger droplets along with fine aerosol. These larger droplets may have sufficient momentum to act like projectiles and they may impact on nearby people or settle on surfaces. Residual virus contamination of surfaces can be transferred to the nose or mouth of uninfected individuals, primarily by hand-to-mouth actions, and result in infection, although this pathway is probably less important. Transmission pathways were described more fully in our earlier command paper on COVID-19.
19. It is assumed that the risk of infection is related to the number of viable virus particles that reach a susceptible surface in the body, e.g. a mucous membrane. For inhalation this is determined by the concentration of these particulate viable viruses inhaled and the breathing rate of the susceptible person. The virus concentration in the air in a room or other enclosed space is determined by the size of the room, the extent of ventilation from outdoor air or air that is clear of viruses, the number of infected people in the space and the rate at which they are emitting virus particles, the duration of exposure, and in larger spaces the proximity of the susceptible person to infected individuals. The risks from aerosol transmission are likely to be highest for people who encounter many individuals who may potentially be infected, over a long period of time, in small poorly ventilated spaces. Evidence of viral contamination
20. During the pandemic researchers attempted to measure the SARS-CoV-2 virus contamination on surfaces and in the air of buildings. Cherrie et al. (2021) reviewed the evidence up to the end of 2020. Most of the data came from healthcare settings, with about 6% of the surface samples showing detectable concentrations of SARS-CoV-2 RNA, although the virus sampled was typically not viable. Airborne SARS-CoV-2 virus concentrations were mostly not detectable. Later reviews showed similar results (Dinoi et al, 2021), although in some situations, for example in poorly ventilated nightclubs in Spain, higher levels of airborne contamination with the virus were found (Sanchiz et al, 2023).
Mitigation of risk
21. A variety of strategies were recommended by government and trade bodies to protect people at work from SARS-CoV-2 infection. Advice initially focussed on good hand hygiene, coughing and sneezing into a tissue or some other cloth and social distancing. During the early stages of the pandemic the main focus was on cleaning surfaces to remove any residual SARS-CoV-2 contamination and hand washing, although this route is now considered relatively unimportant in transmission of the virus.
22. It became increasingly clear that aerosol transmission was important (Morawska et al., 2020). By mid-June 2020 there was a legal obligation in England to wear a face covering in public places[footnote 1]. There was greater use of respiratory protection in workplaces and increased emphasis on steps to ensure good ventilation in indoor spaces. In some situations, barriers were used to separate workers from the public, e.g. in shops. Some private hire taxis, that used conventional cars, installed temporary plastic screens to separate the driver from the passengers.
23. Wearing a respirator mask (Gawn et al., 2008) rather than a simple face covering, is an important mitigation step that individuals can take to protect themselves and others. Respirators are manufactured to specific standards to protect workers from inhaling dusts and other aerosols. These devices work by filtering the inhaled air to remove a large proportion of the virus particles. The effectiveness of masks is mostly determined by the effectiveness of the filter element and how well they seal against the face; the virus particles can circumvent the filter by passing through small gaps between the mask and the face. The integrity of a respirator seal is dependent on the fit to the face and how carefully it is fitted and worn. If worn as intended by the manufacturer they provide a good level of protection for the wearer (Cherrie et al., 2018). Surgical masks have a looser fit to the face and are much less effective than respirators (Gawn et al, 2008). Face coverings, widely used by the general population during the pandemic, offer the least effective protection (Steinle et al., 2018). Human trials and observational studies have generally shown that wearing masks reduces the risk of infection and these data support the view that respirators offer better protection than surgical masks (Boulos et al, 2023).
24. A review to assess the effectiveness of physical interventions to stop or reduce the spread of acute respiratory viruses, including SARS-CoV-2, was undertaken by Jefferson et al. (2023). Twelve studies, ten of which were cluster randomised control trials, compared surgical masks against no masks to prevent the spread of respiratory illness. They found that wearing a surgical mask made no difference to the risk of infection. They identified five studies that compared wearing respirators with use of surgical masks. These studies suggested there was some protection from the respirator, but the authors concluded the data were not definitive because of limitations in the study designs. These data are in contrast with the results from measurements of the reduction in particulate inhaled when wearing a respirator. From experimental research on non-viral aerosols the mean efficacy of surgical masks could be around 65% and for filtering facepiece respirators around 95% (Cherrie et al., 2018; Steinle et al., 2018). However, the effectiveness of respiratory protection depends on correctly fitting the device and in practice the effectiveness may be much lower, as seen in the review by Jefferson and colleagues.
25. In addition to protecting the wearer, masks provide protection for other people close to the wearer by filtering virus containing particles from the air that they exhale. This reduces the transmission from the person wearing the mask to others. The relative effectiveness of masks protecting others near the wearer is similar to that for the wearer, i.e. respirators are most effective and other face coverings least effective (Chazelet and Pacault, 2022).
26. Beale et al. (2023b) carried out a questionnaire survey of 6,279 people who participated in the Virus Watch study, who were either employed or self-employed. They asked about employment between January 2021 and February 2022, and those who attended their workplace during this period were questioned about important determinants of work-related transmission risks and strategies used to try to mitigate these risks. They found that in general, social distancing was not consistently followed. Healthcare workers and teachers and those involved in childcare consistently reported the highest chance of reporting no social distancing at work. Ventilation was commonly reported as a means to mitigate risk (predicted probability of reporting use of mechanical ventilation for occupations ranged from 25% to 60%), but these measures were least used amongst teaching, education and childcare workers. The main mitigation strategies reported in these situations were ‘posters/reminders’, ‘reconfiguring the workplace’, ‘one-way systems’ and ‘workplace bubbles’.
27. Krishnaratne et al. (2022) carried out a scoping review to map the evidence for the impacts of control measures implemented in schools to enable them to open during the pandemic. They identified 42 research studies that they considered informative in relation to organizational measures to reduce transmission of the virus (e.g. face coverings and physical distancing), structural or environmental measures to reduce transmission (e.g. improving air ventilation) and surveillance or response measures to detect SARS-CoV-2 infections. While the evidence suggested the interventions could be effective, the quality was not sufficient to make clear recommendations on effectiveness.
28. Pizarro et al. (2022) reviewed the scientific evidence on the benefits and possible harms of interventions in non-healthcare workplaces to reduce the risk of SARS-CoV-2 infection. They identified more than 13 thousand papers that were potentially informative, but in the end, they only included a single study, carried out in 162 secondary and post-secondary schools in England between March and June 2021. The study investigated the effectiveness of using a COVID-19 test to help decide whether the staff member should or should not attend school, compared to self-isolation for 10-days. The reviewers considered the study to be uninformative.
29. Vaccination is an important factor in reducing the risk and severity of health consequences of infection with SARS-CoV-2 and can also contribute to reducing the risk of infection. Current vaccines are approximately 50% effective in reducing asymptomatic infection; 75% effective in reducing symptomatic infection; and over 90% effective in preventing severe illness or death (Grana et al 2022). Whilst vaccination is beneficial to individuals it complicates the interpretation of the available epidemiological studies. In the UK, healthcare workers were prioritised for vaccination and so from early 2021 onwards their infection and mortality rates were reduced when compared to the 2020. Differential vaccination rates between work groups also complicates the assessment of risk.
30. A study to assess variation in vaccination uptake across occupational groups as a potential explanation for variation in risk of SARS-CoV-2 infection used data from the ONS Infection Survey linked to vaccination data from the National Immunisation Management System in England from December (Rhodes et al, 2024). Estimated rates of triple-vaccination were above 80% across all occupational groups but were lowest for food processing (80%), personal care (82%), hospitality (83%), manual occupations (84%), and retail (85%). Proportions of participants who had received three vaccinations were 87% in public-facing transport roles. In general, the impact of adjusting for vaccination when estimating relative risks of infection by occupational group was modest (ratio of hazard ratios reduced from 1.38 to 1.32); the authors note that this is consistent with the hypothesis that low vaccination rates contribute to elevated risk in some groups. Risk of infection by occupational group compared to other office-based workers (reference group) was higher for public-facing transport roles than for non-public-facing transport workers but did not vary much when adjusted for different co-variates: HR = 1.12 (95%CI 1.0,1.26) (age/sex adjusted); HR = 1.12 (95%CI 1.0,1.25) (additionally adjusted for ethnicity, deprivation, region, household size, pre-existing health conditions); HR = 1.08 (95%CI 0.97,1.21) additionally adjusted for vaccinations.
Job Exposure Matrices
31. As noted above, there are very limited objective measurements of the concentration of SARS-CoV-2 in in most occupational settings. An alternative approach to assessing the potential for exposure in different situations involves the use of a Job-Exposure Matrix (JEM). A JEM provides a score based on key aspects of a job that may result in greater or lesser exposure to the infective agent (SARS-Cov-2 virus). People working in jobs with high JEM scores are, in principle, more likely to become infected than those in jobs with low JEM scores. However, where robust epidemiological data for different jobs/occupations exists, evaluation of risk using actual infection rates in different jobs, based on the number of people known to be infected clearly is the more precise way to quantify the level of risk of infection due to the nature of a job. Where there are gaps in the epidemiological data, the JEM can help us better to understand, and possibly predict, the level of risk of infection to which people in that job may be exposed. However, this, assumes that the theoretical level of risk predicted by the JEM has a close relationship with actual risk derived from known infection rates and that the JEM has been appropriately validated.
32. Oude Hengel et al. (2022) developed a JEM to assess the risk of becoming infected with the SARS-CoV-2 virus in an occupational setting in Europe. The JEM has four determinants of transmission of risk [number of people, nature of contacts, contaminated workspaces and location (indoors or outdoors)], two for mitigation measures (social distancing and face covering), and two factors for precarious work (income insecurity and proportion of migrants). Excluding the latter two factors, which describe potential vulnerabilities for infection rather than exposure determinants, the maximum non-dimensional exposure score that can be generated by the algorithm is 16 (highest exposure) and the lowest is zero (lowest exposure).
33. Van der Feltz et al. (2023a) published research to attempt to validate this COVID-19-JEM using the Netherlands Working Conditions Survey (NWCS)–COVID-19 cohort by, firstly, comparing the JEM scores with risk scores derived using self-reported data from questionnaires and, secondly, by investigating the associations between the JEM risk scores and self-reported COVID-19 infection. The researchers concluded that there was good agreement between the JEM score and the NWCS-COVID-19 derived risk scores and also between the JEM and infection rates at work. In the comparison, the factors for work location and face covering were less important than the others in determining the agreement with self-reported risk. In the comparison with infection data the associations were particularly strong for the infections that were thought to have happened at work (Odds Ratios for JEM factors between 2.3 and 11.6). Neither income insecurity nor migrant status appeared important in determining risk (these factors were excluded from the data shown below in appendix Table 1).
34. Two studies have explored whether workplace exposures as estimated via the SARS-CoV-2 job exposure matrix (Oude Hengel et al, 2022) are associated with SARS-CoV-2, one using UK data (Rhodes et al, 2023) and one in the Netherlands (Eekhout et al, 2023). Rhodes et al used data on 244470 participants aged 20-64 years from the ONSs Coronavirus Infection Survey (CIS) and 16,801 participants from the Virus Watch Cohort, restricted to workers aged 20–64 years. Logistic regression models were used to explore the relationship of SARS-CoV-2 and eight individual domains from the JEM (high risk category given in parentheses):
1. number of workers (>30 workers per day)
2. nature of contacts (Patients including those with COVID-19)
3. contact via surfaces (frequent sharing workspaces with general public)
4. indoor or outdoor location (mostly indoor)
5. ability to social distance at least 1m (can never be maintained)
6. use of face covering (not feasible)
7. job insecurity (proportion of flexible labour contracts >25%)
8. migrant workers (proportion >25%).
Adjustment was carried out for age, sex, ethnicity, index of multiple deprivation (IMD), region, household size, urban versus rural area, and health conditions. Analyses were repeated for three time periods:
(i) February 2020 (Virus Watch) / April 2020 (CIS) to May 2021)
(ii) June 2021 to November 2021, and
(iii) December 2021 to January 2022.
35. Over the entire study period, a higher JEM score was associated with a higher risk of SARS-CoV-2 infection for the four domains of transmission risk (number of contacts, nature of contacts, contaminated workspaces, and location) and the two domains of mitigation measures (social distancing, use of face covering) across both cohorts. There was little evidence of a relationship for domains relating to proportion of workers with job insecurity or migrant workers. Comparing different time periods, there was a clear exposure–response relationship for these domains in the first period only. Results were largely consistent across the two UK cohorts.
36. Eekhout et al (2023) applied the JEM described by Oude Hengel and colleagues to data from 207,034 workers from the Netherlands with test data on COVID-19 from June 2020 until August 2021. Personal characteristics, household composition and residence area were derived from Statistics Netherlands. A test-negative design was applied in which the risk of a positive test was analysed in a conditional logit model. Adjustment was made for age, gender, educational level, ethnic background, household position, having children living at home, province of the residence area, urban or rural and a previous positive test. All eight domains of occupational exposure included in the JEM increased the odds of a positive test for the entire study period and three pandemic waves [OR ranging from 1.09, (95% confidence interval (CI) 1.02–1.17) to 1.77 (95% CI 1.61–1.96)]. Adjusting for a previous positive test and other covariates strongly reduced the odds of being infected, but most domains remained at elevated risk. Fully adjusted models showed that contaminated work-spaces and wearing face coverings were mostly relevant in the first two pandemic waves, whereas income insecurity showed higher odds in the third wave. Over the total study period, cleaners, refuse workers and machine operators had the highest predictive risk of a positive test (predicted probability 0.62) with heavy truck and bus drivers having a predicted probability of 0.59.
37. Van der Feltz et al (2023b) describe the use of the Danish version of the COVID-19-JEM with Danish registry-based SARS-CoV-2 infection data from 2,021,309 persons over three waves during the pandemic. The authors used logistic regression models to assess the association between the JEM scores and SARS-CoV-2 infection rates. Higher JEM scores for factors linked to transmission and mitigation and the overall JEM score were associated with higher odds ratios for SARS-CoV-2 infection. During the first wave of the pandemic the odds ratio was more than doubled for overall scores more than 13, but during the subsequent waves the corresponding risks were much lower. There was no association between JEM score and infection in wave 3 for those who were fully vaccinated.
Risk of Infection With SARS-CoV-2 and Adverse Health Effects of COVID-19 in the Transport Sector
38. This section reviews evidence on risk of infection with SARS-CoV-2 due to exposure in the transport and education sectors and risk of adverse health effects including mortality, severe disease, hospitalisation and sickness absence where available.
39. During the pandemic, transport workers were categorised as key workers by the UK government (approximately 6% of all key workers, over 600,000 people). Unlike many other groups of workers, the nature of their jobs generally required them to work in person. Data from the Annual Population Survey showed that, during 2020 over 80% of full-time workers in transport and storage reported never working at home (ONS, 2021).
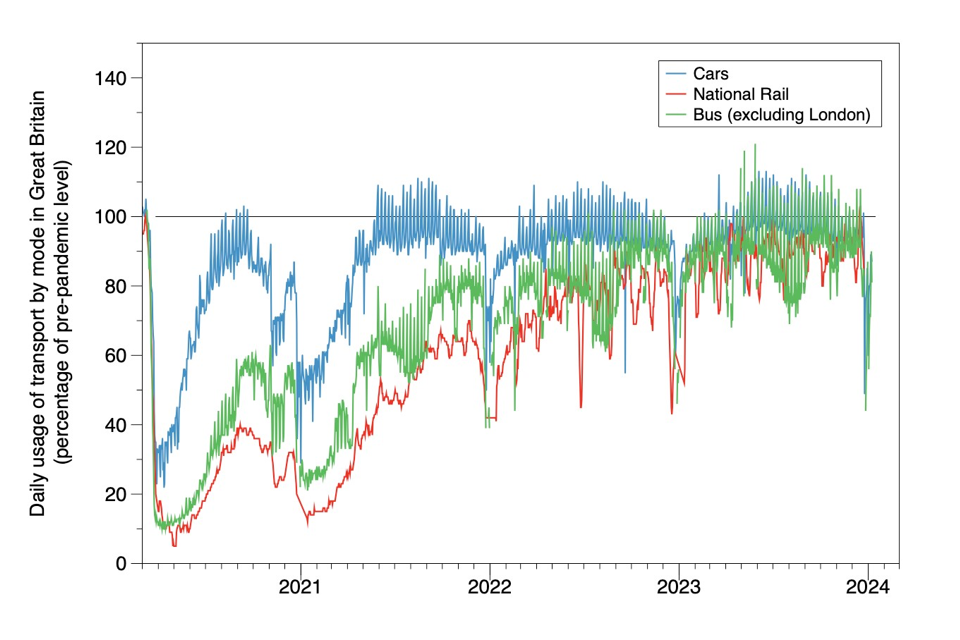
40. In the initial stages of the pandemic there was decreased use of public transport by the general population and consequently compared to the time before the pandemic there were fewer workers engaged in these jobs and fewer passengers on the services that ran. This was particularly the case during periods of lock-down. Data from the Department for Transport is shown in Figure 3[footnote 2]. Usage is shown as a percentage of pre-pandemic baseline travel (data for National Rail is shown as a 7-day rolling average and other modes as daily usage.
Figure 3: Daily usage of selected travel modes in Great Britain since March 2020
41. Previously the Council has recognised that the risk of infection with COVID-19 was high for H&SCWs, and this formed the basis for recommendations for disease prescription. These workers were often near infected people and involved in clinical care, in small rooms with poor ventilation, e.g. in hospital wards or in care homes. Workers in some transport sectors may also have had potential for high exposure to the virus based on their risk scores using the SARS-CoV-2 JEM. In particular, workers with prolonged close contact with the general public in a confined vehicle; for example, taxi drivers, bus drivers, train and tram staff working in passenger carriages, and cabin personnel on aircraft. Many of members of the public using the transport services provided by these sectors will have been unable to work from home due to the nature of their work and may have been more likely to have been infected than the background population. In transportation, the distance and duration of the trip and number of travellers are proxies for infection risk. Specific mitigation measures such as the use of barrier screens between the worker and the public and the use of face coverings would also have mitigated the risk for individual workers.
Evidence of contamination
42. In contrast to the healthcare setting, there is very limited information about the extent of SARS-Cov-2 contamination in the air or surfaces of transport vehicles. Di Carlo et al. (2020) measured the contamination in a bus in an Italian town in the Abruzzo region each day for two weeks during May 2020. In total 1,100 passengers travelled on the bus during the measurement period. None of the air or surface samples collected were positive for SARS-CoV-2 virus. Moreno et al (2021) reported data from 70 surface and similar samples and 12 air samples collected inside Barcelona buses and subway trains from May to July 2020. Around 40% of the surface samples were positive for SARS-CoV-2 virus DNA and three of the 12 air samples were also positive.
43. In the UK, Transport for London commissioned a study of SARS-CoV-2 contamination of stations, underground trains and buses between September and December 2020 (Green et al., 2021). Air and surface samples were collected in three underground stations, on an underground train and a bus. All samples were negative for SARS-CoV-2.
44. Gartland et al. (2022) reviewed the scientific literature to evaluate the potential for transmission of SARS-CoV-2 on ground-based public transport and to assess the effectiveness of control measures implemented during the early part of the pandemic (up to May 2021). They noted that there was mixed evidence for the presence of SARS-COV-2 virus on transportation vehicles, and there remained uncertainty about the relative importance of transmission routes. They also observed that steps specifically introduced to protect workers on public transport included: the installation of clear plastic screens; introduction of contactless payment and enhanced cleaning systems. They discussed the potential to reduce risk by increasing ventilation and the possibility of monitoring the carbon dioxide (CO2) concentrations (exhaled by passengers) as an index of effectiveness of ventilation, although no research studies in their review investigated CO2 monitoring on public transport.
Mitigation
45. Factors that affected the risk on public transport included service suspensions, reduced frequency of provision, discouraged use, reduced capacity of vehicles, fare suspension and rear-door boarding, hygiene measures such as cleaning surfaces, design interventions such as barriers and use of personal protective equipment (Vitrano, 2021).
46. Usage of all travel modes decreased during periods of lock-down; however, 80% of transport workers reported never working from home. Car travel recovered most quickly post lock-down. Bus and rail travel had not completely returned to pre-pandemic levels by March 2023 (both around 87%).
47. The COVID-19 pandemic had a significant impact on air travel in the UK, as it did worldwide. There was a sharp decline in passenger numbers due to travel restrictions, lockdown measures and a decrease in demand for international and domestic flights. The Civil Aviation Authority (CAA) reported a decrease in air passenger numbers during the pandemic, for example, UK passenger numbers in 2020 dropped by about 75% compared to 2019. Cabin crew on aircraft are in a confined space with a high density of passengers. The potential for spread of infection may be mitigated to some extent by the relatively good ventilation in the cabin, although experience suggests that virus transmission can occur in this situation (Spengler and Wilson, 2003). Experimental evidence has shown that virus particles released in an aircraft cabin may spread to contaminate seats in four adjacent rows (Li et al., 2021).
48. Gartland et al. (2023) investigated the experience of the transport sector in the UK in dealing with the pandemic. They found there was a perception that the mitigation measures put in place were effective in reducing virus transmission. However, they also identified that there were issues of non-compliance with the COVID-19 guidance: either ‘wilful non-compliance’ by work colleagues and passengers, and ‘in-group thinking’ where individuals felt ‘safe’ with colleagues they trusted.
Job Exposure Matrix
49. Bus and coach drivers and taxi and cab drivers and chauffeurs have a combined score of 15 out of 16 in the SARS-CoV-2 JEM (excluding terms for income insecurity and migrant workers), which puts them in the top 20 occupations for SARS-CoV-2 infection risk score (Table 2).
Table 2: The top thirty occupations in the SARS-CoV-2 JEM*
| Standard Occupational Classification (SOC 2010) code | Occupational Group Titles | Score |
|---|---|---|
| 6141 | Nursing auxiliaries and assistants | 16 |
| 2231 | Nurses | 16 |
| 6121 | Nursery nurses and assistants | 16 |
| 6122 | Childminders and related occupations | 16 |
| 6123 | Playworkers | 16 |
| 6126 | Educational support assistants | 16 |
| 9271 | Hospital porters | 16 |
| 3314 | Prison service officers (below principal officer) | 16 |
| 6125 | Teaching assistants | 16 |
| 9273 | Waiters and waitresses | 15 |
| 2217 | Medical radiographers | 15 |
| 6144 | House parents and residential wardens | 15 |
| 2312 | Further education teaching professionals | 15 |
| 2314 | Secondary education teaching professionals | 15 |
| 8213 | Bus and coach drivers | 15 |
| 8214 | Taxi and cab drivers and chauffeurs | 15 |
| 9251 | Shelf fillers | 15 |
| 3218 | Medical and dental technicians | 15 |
| 6214 | Air travel assistants | 15 |
| 1181 | Health services and public health managers and directors | 15 |
| 2218 | Podiatrists | 15 |
| 2219 | Health professionals, not elsewhere classified | 15 |
| 2222 | Occupational therapists | 15 |
| 1242 | Residential, day and domiciliary care managers and proprietors | 15 |
| 2444 | Clergy | 15 |
| 9274 | Bar staff | 14 |
| 6142 | Ambulance staff (excluding paramedics) | 14 |
| 6145 | Care workers and home carers | 14 |
| 6147 | Care escorts | 14 |
| 6240 | Cleaning and housekeeping managers and supervisors | 14 |
*Note: occupations in bold represent those in the education and travel sectors
50. Postal workers, mail sorters, messengers and couriers score 14 (49th in the infection risk), van drivers score 11 (155th), other drivers and transport operatives not elsewhere classified score 9 (232nd), rail transport operatives score 9 (247th), train and tram drivers score 9 (266th) and large goods vehicle drivers score 7 (292th). In total there are 370 jobs coded in the JEM. Eight of the jobs in the top twenty highest SARS-CoV-2 infection risk are in the health and social care sector.
51. The main differences, for example, between van drivers and taxi drivers in the Covid JEM is the scores for ‘Indirect contact with adults/adolescents at work within the same workday’ and for ‘Location of work: inside or outside’ – both of which are higher for taxi drivers.
52. Bridgen et al. (2023) carried out a cross-sectional survey to assess the interactions of delivery drivers in the UK between December 2020 and 31 March 2021. They found that, during a shift, drivers had many face-to-face contacts with customers and other workers in the depot. However, they judged that transmission risk may have been minimised because of the relatively short contact duration and the widespread use of face masks and hand sanitisers.
Evidence from studies of rates of infection in transport workers
53. An analysis of 3,910,311 observations from 312,304 working age adults taking part in the ONS Coronavirus Infection Survey (CIS) compared SARS-CoV-2 infection rates between occupational/sector groups, overall and during four time periods (April – September 2020, October 2020- February 2021, March 2021 – May 2021, June 2021 – October 2021) with interactions, adjusted for age, sex, ethnicity, deprivation, region, household size, urban/rural neighbourhood and current health conditions (Rhodes et al 2022). Elevated risks for transport workers (defined using SOC codes) were shown compared with non-essential workers.
Hazard ratios adjusted for age and sex were:
| Occupation | Ratio |
|---|---|
| Bus and coach drivers | 1.49 (95% CI 1.08, 2.06) |
| Taxi/cab drivers/ chauffeurs | 1.32 (95% CI 0.93, 1.85) |
| Van drivers | 1.23 (95% CI 1.0, 1.5) |
| Other transport workers | 1.10 (95% CI 1.0, 1.27) |
Adjustment for additional covariates gave similar results. For transport workers as a whole, the risks were higher during the period April 2020 to February 2021 (HR approximately 1.5) than during the period March to October 2021 (HR approximately 1.1). Rhodes et al comment that there were small numbers of participants from the transport sector who had at least one positive PCR test (43/465 taxi etc drivers, 40/404 bus/coach drivers, 113/1211 van drivers, 215/2488 other transport workers) leading to wide confidence intervals and an unclear picture.
54. Separately, the ONS published figures for all transport workers for the period 31 May to 14 November 2021 (dataset of 01 12 2021)[footnote 3] and showed no significantly increased risk of likelihood of testing positive (Figure 4):
Figure 4: Transport workers Likelihood of testing positive for transport workers compared with all other non-transport workers 31/5/21 to 14/11/21*
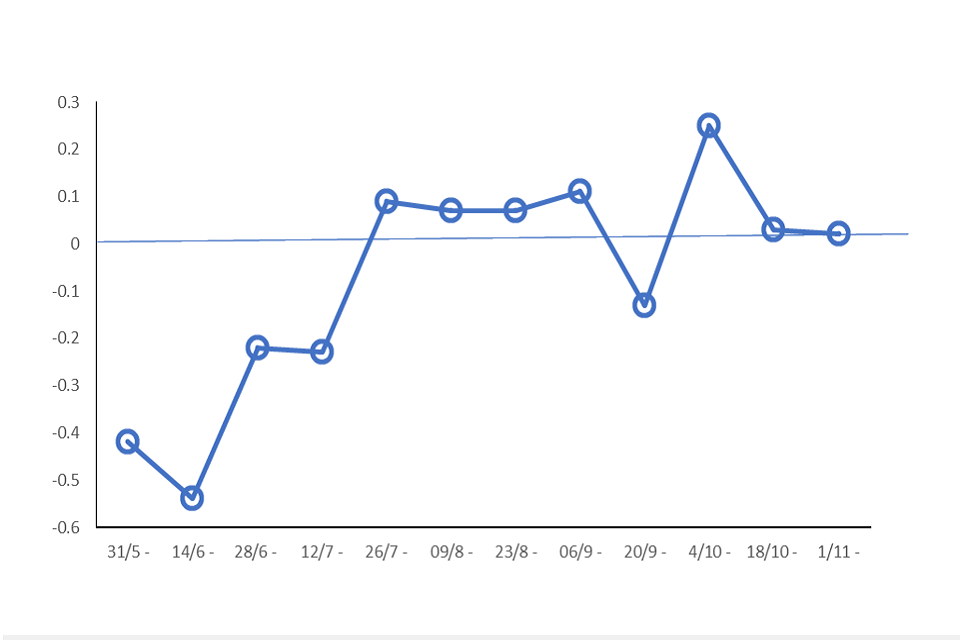
*The coefficients indicate the likelihood of a transport worker testing positive for COVID-19 compared with all other non-transport workers (the reference group). A coefficient greater than zero indicates an increased likelihood of testing positive for COVID-19 compared with the reference category. A coefficient less than zero indicates a decreased likelihood of testing positive for COVID-19.
55. The ONS data for the periods December 2020 to May 2022 (Rhodes et al 2023) and for February 2021 to April 2022 (Kromydas et al, 2023) separated transport workers into those who were public-facing and those who were non-public-facing based on SOC codes for occupation. Those categorised as public-facing were bus, coach, taxi and cab drivers, chauffeurs, driving instructors, aircraft pilots and flight engineers, air and rail travel assistants, and leisure and travel service occupations not classified elsewhere.
56. The December 2020 to May 2022 analysis was limited to those who were resident in England and comprised 256,598 working aged adults of whom 1,088 were public-facing and 2,990 were not.
The HRs (95% CIs) for infection amongst public-facing transport workers in comparison with ‘other workers office-based’ were:
1.12 (1.00 – 1.26) adjusted for age and sex
1.12 (1.00 – 1.25) + adjusted for ethnic group, Index of Multiple Deprivation, geographic region, household size, urban or rural location and presence of a health condition
1.01 (0.97 – 1.21) + adjusted for vaccination status
For non-public-facing transport workers the figures were:
1.05 (0.97 – 1.13) adjusted for age and sex
1.05 (0.97 – 1.13) + adjusted for ethnic group, Index of Multiple Deprivation, geographic region, household size, urban or rural location and presence of a health condition
1.00 (0.93 – 1.08) + adjusted for vaccination status
57. The February 2021 to April 2022 cohort comprised 277,487 UK working aged adults of whom 1088 were public-facing transport workers and 3562 were non-public-facing. The HRs (and approximate 95% CIs) for infection were 1.13 (1.00 – 1.40) for public-facing and 1.01 (0.95 – 1.10) for non-public-facing transport workers compared with all other workers. It should be noted that the use of ‘all other occupations’ as a comparison means that there is a different comparison group for each separate occupation analysed, limiting comparisons across the occupations.
58. Beale et al (2022) tested a sub-cohort (n = 3761) of adults aged 18 or more from the Virus Watch study, a large community prospective cohort study (over 50,000 participants), for SARS-CoV-2 anti-nucleocapsid antibodies between 01 February-21 April 2021. These antibodies (unlike antibodies directed at the ‘spike’ protein) should not have been influenced by prior vaccination. There were 76 self-reported transport workers and mobile machine operators (SOC 8211-8239) in the sub-cohort out of a total of 382 in the complete cohort; 12/76 transport workers and mobile machine operators (Standard Occupational Code (SOC) 8211-8239) had positive tests. The OR for infection compared with the ‘Other Professional & Associate’ category and adjusted for age, sex, household income and region for the transport workers was 2.17 (95% CI 1.12, 4.18). 47% reported daily workplace contact with others. The 3 commonest subcategories of transport workers in this study were HGV drivers (22%), driving instructors (14%) and bus/coach drivers (13%).
59. Beale et al (2023a) extended the study to include 15,190 employed persons aged 16 or more for the period November 2020 to March 2022. They documented evidence of infection using a variety of tests (lateral flow (rapid antigen tests), PCR, anti-spike antibodies in the non-vaccinated, and anti-nucleocapsid antibodies). 96 of 340 transport/ mobile machine operators had evidence of infection. The risk ratio for transport/mobile machine operators was approximately 1.05 compared with ‘Other Professional and Associate Occupations’ and approximately 0.85 compared with the working population.
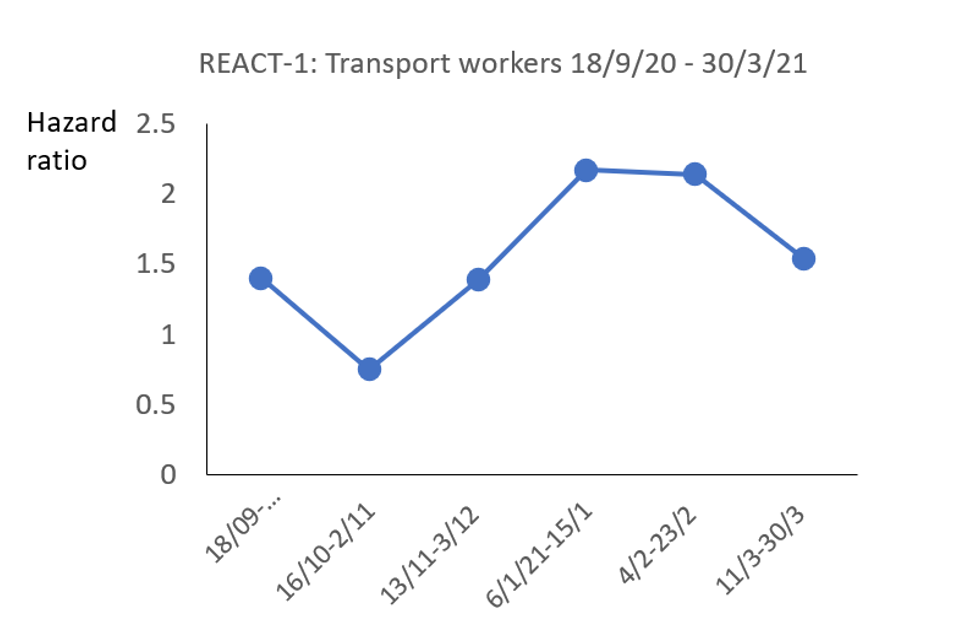
60. The Real-time Assessment of Community Transmission study-1 (REACT-1) obtained throat and nose swabs for RT-PCR testing from representative cross-sectional samples of the population in England at approximately monthly intervals from May 2020 (Riley et al 2021). Thirteen rounds involving 1.9 million tests were reported up to July 2021. The REACT-1 study showed more than doubled rates of infection amongst those who responded positively to the question “Do you have a job that currently requires you to work outside your home in any of the following public facing roles? ….(6) Public transport (including taxis)” compared with other workers at rounds 8 and 9 (January-February 2021). The overall adjusted Odds Ratio (aOR) (adjusted for age, sex, ethnicity, region) for the period September 2020 – March 2021 was 1.54 (95%CI1.14-2.17) (Figure 5).
Figure 5: Hazard ratios for transport workers from REACT 1
61. The REACT-2 study reported on 5 rounds of SARS-CoV-2 antibody testing involving 685,000 subjects between June 2020 and February 2021 (Ward et al 2021). The REACT-2 study showed a more than doubled rate of seropositivity amongst public-facing transport/taxi workers (12.9%) compared with non-essential workers (6.0%) in the first survey (up to July 2020) but not after that (Table 3).
Table 3: Seropositivity among public-facing transport workers from REACT-2
| Date | Round | N+ve/total | % positivity (95% CI) Public transport *or taxi | % positivity (95%CI) Non- key workers | Relative risk* |
|---|---|---|---|---|---|
| 20 June to 13 July 2020 | 1 | 4/33 | 12.92 [4.12-31.24] | 5.28 [5.00-5.57] | 2.45 |
| 31 July to 13 August 2020 | 2 | 45/757 | 5.48 [3.70-7.79] | 4.17 [3.92-4.43] | 1.28 |
| 15 to 28 Sep 2020 | 3 | 69/1177 5.38 [3.93-7.17] | 3.68 [3.48-3.88] | 1.46 | |
| 27 Oct to 10 Nov 2020 | 4 | 84/1116 | 7.03 [5.40-9.00] | 4.77 [4.56-4.99] | 1.47 |
| 26 Jan to 8 Feb 2021 (unvaccinated) | 5 | 124/1072 | 12.22 [10.08-14.69 | 7.82 [7.55-8.1] | 1.56 |
*Relative Risks (RR) for each occupational group have been estimated by dividing the % positivity for public transport/taxi by % positivity for non-key workers. The adjusted odds ratio for seropositivity was reported as 1.47 (95% CI 1.16,1.86) at round 4. aORs were not reported for the earlier rounds.
62. At round 5 (26 January to 8 February 2021) 12.2% of unvaccinated public-facing transport/taxi workers were seropositive compared with 7.8% seropositivity amongst unvaccinated non-keyworkers.
63. The records of participants in the UK Biobank cohort, resident in England, alive and aged less than 65 years in 2020 and employed or self-employed at baseline data collection (2006-2008) were linked to SARS-CoV-2 test results from Public Health England (16 March to 26 July 2020) (Mutambudzi et al. 2020). The analyses adjusted for baseline demographic, socioeconomic, work-related, health, and lifestyle-related risk factors. Of 120,075 participants, 271 were defined as having severe COVID-19, defined as a positive test taken in a hospital setting or a death with primary or secondary cause as COVID-19. Participants with a negative test or a positive test outside a hospital setting were included in the denominator. The cohort included 3279 transport workers, 12 (0.4%) of whom had severe COVID-19 compared with non-essential workers (0.1%). Their risk was more than doubled compared with non-essential workers but like the Nafilyan et al (2021 data (see below) the risk ratios were attenuated with serial adjustment (Table 4).
Table 4: Risk ratios for transport workers from the UK Biobank study
| model | adjusted for (compared with non-essential workers) | risk ratio | 95% CI |
|---|---|---|---|
| 1 | age group, sex, ethnicity, country of birth | 2.20 | [1.21,4.00] |
| 2 | Model 1 + SES quartile, education | 1.66 | [0.91,3.01] |
| 3 | Model 2 + shift & manual work, job tenure, working hours | 1.48 | [0.81,2.70] |
| 4 | Model 2 + illness/disability | 1.66 | [0.91,3.01] |
| 5 | Model 2 + BMI category, smoking, alcohol | 1.58 | [0.87,2.90] |
| 6 | All covariates | 1.43 | [0.78,2.63] |
64. Hiironen et al (2020) carried out a case-control study of 6,000 COVID-19 positive individuals who completed a NHS contact tracing questionnaire in 3 periods - late August 2020, late September 2020 and late October 2020 (with separate samples of 2000 people in each period). Controls were identified from members of the public who registered as volunteers for a Market Research Panel, and who were not household contacts of a confirmed case. There was a greater proportion of individuals in the control group that were of white ethnicity (83%) compared to the cases (65%), although ethnicity was not recorded for 9% of case respondents. A greater proportion of cases lived in areas of lowest quintile of deprivation (17%) than controls (12%), although deprivation score was unknown for a large proportion of control respondents (11%). Distributions were largely similar for all other demographic variables. There were no significant increased risks for those working in public transport including underground, trains, buses, and logistics and storage (Table 5). The authors comment that the use of volunteers for the control population might have introduced selection bias.
Table 5: Odds ratios for transport workers from study by Hiironen et al (2020)
| Date | Number transport/controls | OR 95% CI |
|---|---|---|
| Aug 2020 | 37/64 | 1.1 (0.6-2.0) |
| Sep 2020 | 42/37 | 0.8 (0.5-1.3) |
| Oct 2020 | 59/34 | 2.1 (0.9-5.0) |
Mortality studies of transport workers
65. The ONS reported on England and Wales death rates for deaths with a mention of COVID-19 in people aged 20 to 64 years in different occupations as described on death certificates for the period 9th March - 28th December 2020 (ONS 2020b). The age-adjusted death rates were more than doubled amongst male taxi and cab drivers and chauffeurs (101 per 100,000) and bus/coach drivers (70 per 1,000,000) compared with the rate for with all jobs (31 per 100,000). Rates for large goods vehicle and van drivers were slightly elevated (Table 6).
Table 6: Numbers of deaths and Death Rates per 100,000 (95% Confidence Intervals) involving COVID-19 for 4 digit SOC codes for transport occupations: men aged 20 to 64, England and Wales, deaths registered between 9 March and 28 December 2020[footnote 4].
| SOC code | Occupation | Deaths | Rate/ 100,00 (95% CI) | RR* |
|---|---|---|---|---|
| 8214 | Taxi and cab drivers and chauffeurs | 209 | 101.4 (87.5-115.2) | 3.2 |
| 8211 | Large goods vehicle drivers | 118 | 39.7 (32.4-47.1) | 1.3 |
| 8212 | Van drivers | 97 | 39.7 (32.1-48.5) | 1.3 |
| 8213 | Bus and coach drivers | 83 | 70.3 (55.3-88.0) | 2.4 |
| 8222 | Fork-lift truck drivers | 22 | 34.8 (21.4-53.1) | 1.1 |
| 8229 | Mobile machine drivers/ operatives | 16 | 44.2 (24.9-72.3) | 1.4 |
*Relative Risks (RR) for each occupational group have been estimated by dividing the death rate/100,000 for the specific occupation by the overall death rate per 100,000 (31.4 deaths per 100,000 men of the working population.
66. The ONS data were not adjusted to take account of ethnicity or other possible risk factors. Nafilyan et al (2021) linked the 2020 mortality data for those aged 40 to 64 to information on occupation derived from the 2011 Census in England, and other potential explanatory variables derived from general practice data. They showed similar increased risks for a variety of driving-related occupations, but the hazard ratios compared with non-essential workers progressively declined with increasing adjustment for covariates. The only residual association with a more than doubled risk was in the small group of female taxi/cab drivers and chauffeurs (HR = 2.45, 95%CI 1.01-5.92); the risk for male taxi/cab drivers was also significantly increased after full adjustment but not doubled (HR = 1.39, 95%CI 1.14-1.70) (Table 7).
Table 7: HRs for death involving COVID-19 for adults aged 40 to 64 years, compared with non-essential workers
Males
| HR and 95% CIs adjusted for | age | confoundersa | fully adjustedb |
|---|---|---|---|
| Taxi & cab drivers and chauffeurs | 3.08 (2.56–3.70) | 2.01 (1.67–2.43) | 1.39 (1.14–1.70) |
| Bus and coach drivers | 2.33 (1.81–3.00) | 1.53 (1.19–1.98) | 1.11 (0.85–1.45) |
| Van drivers | 1.81 (1.48–2.22) | 1.28 (1.05–1.57) | 1.26 (1.03–1.55) |
| Other transport workers | 1.21 (1.02–1.43) | 1.07 (0.91–1.27) | 1.10 (0.93–1.30) |
Females
| HR and 95% CIs adjusted for | age | confoundersa | fully adjustedb |
|---|---|---|---|
| Taxi and cab drivers and chauffeurs | 3.94 (1.63–9.48) | 2.59 (1.08–6.26) | 2.45 (1.01–5.92) |
| Bus and coach drivers | 2.95 (1.23–7.12) | 1.05 (0.86–1.28) | 1.73 (0.72–4.18) |
| Van drivers | 1.59 (0.66–3.84) | 1.09 (0.71–1.66) | 1.27 (0.53–3.06) |
| Other transport workers | 0.36 (0.12–1.11) | 1.33 (1.05–1.67) | 0.31 (0.10–0.95) |
a. geographical factors (region, population density and rural–urban classification)
b. geographical factors, ethnicity, socioeconomic characteristics (Index of Multiple Deprivation decile group, household deprivation, educational attainment, social grade, household tenancy, type of accommodation, household size, multigenerational household and household with children), health (body mass index, chronic kidney disease, learning disability, cancer or immunosuppression and other conditions).
67. Nafilyan et al (2021) also carried out several analyses using different reference populations. HRs are larger when the reference population is ‘corporate managers and directors’ compared with all non-essential workers (Table 8).
Table 8: HRs for death involving COVID-19 for adults aged 40 to 64 years, compared with corporate managers and directors
| Male HRs [95%CIs] compared with managers and directors adjusted for | age | + region, location | + ethnicity, education | + SES, household | + BMI, other comorbidities |
|---|---|---|---|---|---|
| Taxi/ cab drivers and chauffeurs | 4.62 [3.64-5.87] | 3.44 [2.70-4.37] | 1.82 [1.41-2.34] | 1.57 [1.21-2.02] | 1.49 [1.15-1.92] |
| Bus/coach drivers | 3.5 [2.61-4.70] | 2.75 [2.05-3.70] | 1.96 [1.45-2.65] | 1.54 [1.14-2.08] | 1.18 [0.86-1.61] |
| Van drivers | 2.66 [1.75-4.02] | 2.31 [1.53-3.50] | 1.85 [1.22-2.81] | 1.52 [1.00-2.31] | 1.37 [0.90-2.08] |
| Mobile machine/other drivers | 2.27 [1.72-2.99] | 2.03 [1.54-2.68] | 1.61 [1.22-2.13] | 1.28 [0.97-1.70] | 1.27 [0.95-1.68] |
Model 1: Age; Model 2: Model 1 + geographical factors (region, population density, urban/rural classification); Model 3: Model 2+ ethnicity and education; Model 4: Model 3 + socio-economic characteristics (IMD decile, household deprivation, educational attainment, social grade), household tenancy, type of accommodation, household size, overcrowding; Model 5: Model 4 + health (Body Mass Index, Chronic kidney disease (CKD), Learning disability, Cancer and immunosuppression, other conditions)
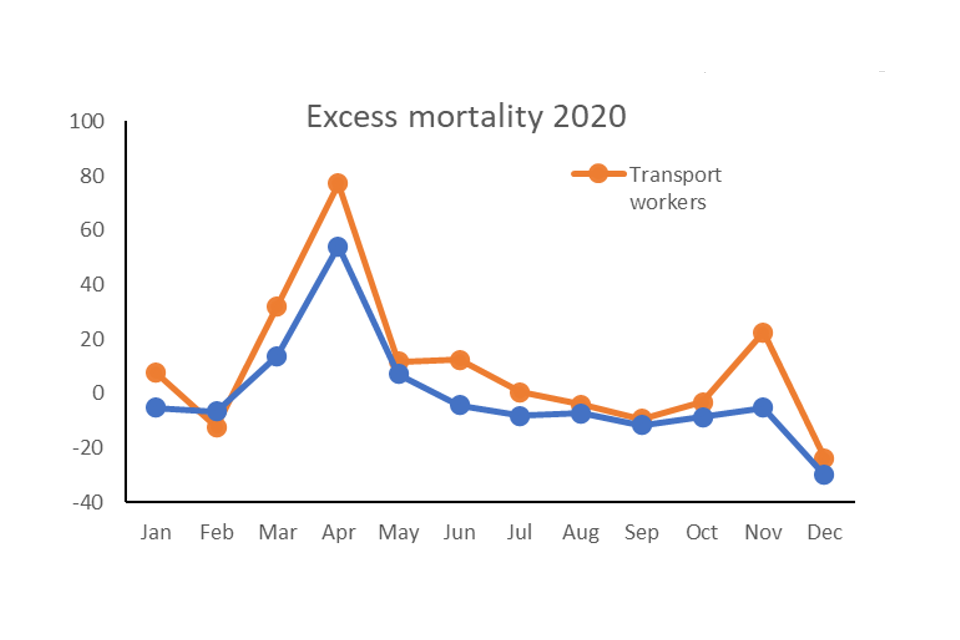
68. Estimation of excess mortality over a particular year gives a measure that may be less influenced by potential confounders, particularly those that are constant such as ethnicity and others that are unlikely to change substantially over a year such as deprivation and weight. Matz et al. (2022) estimated excess mortality from all causes of death by occupational group in England by comparing monthly deaths in 2020 with the average number of deaths occurring in the same month during the previous five years. Overall, there was 9.2% excess mortality for transport workers in 2020 compared with mortality in the previous five years, with the highest excess mortality being in March (32%) and April (77%) (Figure 6); (orange line transport workers, blue line non-essential workers).
Figure 6: Excess mortality from all causes of death 2020
69. An update of this study gives excess all-cause mortality for both 2020 and 2021 (Matz et al., 2023). During 2021, excess all-cause mortality remained higher for most groups of essential workers compared to non-essential workers, including transport workers. It peaked in January 2021 when all-cause mortality was 44.6% higher than expected for all occupational groups combined. Excess mortality was highest for adults working in social care (86.9% higher than expected).
70. Cherrie et al (2022) used ONS mortality data for England and Wales for deaths (20–64 years) from January 2020 to October 2021 to compare odds of death with a mention of COVID-19 to death from other causes, adjusting for age, sex, deprivation, region, urban/rural and population density using logistic regression. The proportional mortality rates were significantly increased for all groups of transport workers and were more than doubled for taxi/cab and bus/coach drivers. In this dataset serial adjustment made little difference to the odds ratios (Table 9).
Table 9: Odds of death from COVID-19 compared with death from other causes (2020-2021)
| ORs (95% CIs) vs non-essential, adjusted for | age, sex | + deprivation | + region | + population density |
|---|---|---|---|---|
| Taxi and cab drivers | 2.94 (2.64–3.28) | 2.87 (2.58–3.2) | 2.69 (2.42–3.01) | 2.65 (2.37–2.95) |
| Bus and coach drivers | 2.12 (1.81–2.49) | 2.07 (1.76–2.43) | 2.04 (1.73–2.4) | 2.04 (1.73–2.4) |
| Van drivers | 1.26 (1.11–1.43) | 1.24 (1.09–1.41) | 1.24 (1.09–1.41) | 1.23 (1.08–1.4) |
| Other transport workers | 1.22 (1.12–1.33) | 1.23 (1.12–1.34) | 1.25 (1.14–1.36) | 1.26 1.15–1.37) |
71. Cherrie et al (2022) also analysed the data over 3 time periods: Jan to Sept 20; Oct 20 to May 21; and June to Oct 21. Taxi and cab drivers were the only group that had higher odds of death from COVID-19 compared to other causes throughout the whole period under study (TP1: odds ratio (OR) 2.42, 95% confidence interval (CI) 1.99–2.93; TP2: OR 3.15,95% CI 2.63–3.78; TP3: OR 1.7, 95% CI 1.26–2.29). The rates increased between October 20 and May 21 then fell again with the aORs in the last period being less than 2.0; the rates in the general population were lower in the last period than the earlier periods (Table 10).
Table 10: Odds of death from COVID-19 compared with death from other causes by three time periods
| Deaths and aORs (95% CIs) | Jan to Sept 2020: COVID/non-COVID | Jan to Sept 2020: aOR | Oct 2020 to May 2021: COVID/non-COVID | Oct 2020 to May 2021: aOR | Jun to Oct 2021: COVID/non-COVID | Jun to Oct 2021: aOR |
|---|---|---|---|---|---|---|
| Taxi and cab drivers | 147/530 | 2.42 (1.99–2.93) | 242/260 | 3.15 (2.63–3.78) | 54/341 | 1.7 (1.26–2.29) |
| Bus and coach drivers | 58/300 | 1.84 (1.37–2.46) | 104/156 | 2.44 (1.89–3.15) | 20/180 | 1.42 (0.89–2.27) |
| Van drivers | 72/678 | 1.1 (0.86–1.41) | 147/426 | 1.33 (1.1–1.62) | 31/451 | 0.78 (0.54–1.13) |
| Other transport workers | 165/1559 | 1.14 (0.96–1.34) | 327/829 | 1.54 (1.35–1.77) | 75/1043 | 0.9 (0.7–1.14) |
72. A data-linkage cohort study of 1.7 million Scottish adults aged 40 to 64 years between1 March 2020 and 31 January 2021 estimated age-standardised COVID-19 hospital admission and mortality rates. Generally, women had lower age-standardised rates (ASRs) than men for both hospital admissions and mortality (Pattaro et al, 2024). For women, the highest ASRs for COVID-19 admissions were observed among those working in caring personal services, including nursing assistants and ambulance staff (excluding paramedics). For men, the highest ASRs for COVID-19 admissions were observed among taxi and cab drivers, with 949.8 admissions per 100,000 persons (95%CI 763.8-1164.6); this gave the highest hazard ratios (HR) compared with the reference category, managers, directors and senior officials, (HR 1.84, 95%CI 1.42-2.40). The authors then modelled the time to COVID-19 hospital admission and death, separately for women and men, using Cox proportional hazards models. Hazard ratios were interpreted as the rate at which an event of interest occurs in one group relative to the rate at which it occurs in a reference group over time. A set of nested models was estimated to adjust for potential confounders. Model 1: adjusting for individual-level socio-demographic factors including age and ethnicity; Model 2: model 1 plus household-level characteristics and measures of occupational exposure that are likely to confound the relationship between workplace factors and COVID-19 admission and death; Model 3 additional adjustment for confounders such as disability and health-related factors including whether the person had a learning disability/difficulty or whether shielding, and pre-pandemic health conditions. Among men, death risks were all more than doubled for all models for: taxi and cab drivers, model 1 HR = 3.48 (95%CI 1.99, 6.08), model 2, HR = 3.77 (95%CI 1.90, 7.48), model HR = 3.46 (95%CI 1.74, 6.86); large goods vehicle drivers, model 1 HR = 2.34 (95%CI 1.32,4.13), model 2 HR = 2.63 (95%CI 1.42,4.58), model 3 HR = 2.69 (95%CI 1.45,4.99).
73. The National Records for Scotland published mortality data for Scotland for a wider age group, aged 20-64, than Pattaro et al (2024) by occupation, coded to 2-digit SOC code for the period from March 1 2020 to 31 January 2023[footnote 5]. The pattern of age-adjusted death rates from all causes by month was closely mirrored by that of age adjusted deaths rates in which Covid was mentioned on the death certificate. Occupations with a more than doubled risk ratio (age-adjusted) with COVID-19 mentioned on the death certificate compared to all occupations together are given in Table 11.
Table 11: Death rates per 100,000 in Scotland by occupation
| SOC code | Occupation | COVID Rate/ 100,000 (95% CI) | RR* | |
|---|---|---|---|---|
| 81 | Process plant and machine operatives | 85 | 57.0 (44.0-70.1) | 2.9 |
| 91 | Elementary traders and related occupations | 49 | 56.4 (40.3-72.6) | 2.9 |
| 33 | Protective services occupations | 11 | 49.2 (4.8-93.6) | 2.5 |
| 54 | Textiles, printing and other skilled trades | 57 | 49.1 (35.7-62.5) | 2.5 |
| 82 | Transport & mobile machine drivers and operatives | 125 | 41.7 (34.3-49.0) | 2.1 |
*RR estimated compared with overall rate/100,000 of 19.5 for all occupations.
74. There were 125 transport deaths that had a mention of Covid on the death certificate out of a total of 1386 total deaths (9%). This compares to 1210 COVID-19 mentions for all occupations out of 18354 deaths overall (6.6%).
75. The only other UK mortality study is that of London bus drivers who had an apparently high death rate from COVID-19 in the early stages of the pandemic. This led to the commissioning of a review of the data (Goldblatt et al 2021) that considered 27 deaths up to May 2020. All the deaths occurred in males. The age-corrected death rate was 3.5 times the national figure. The rate of infection in London was 1.76 times that of England and Wales as a whole, and bus drivers were more likely than others to be in the 45-64 age band, and to be of an ethnic minority both of which increase the risk of COVID-19 mortality. When adjusted for these the mortality ratio was significantly increased at 2.0 (95% CI 1.3-2.9). 80% of the deaths were likely to have been caused by infection occurring before the first lockdown of 22 March 2020. 15 further deaths occurred amongst London bus driver between June 2020 and January 2021. This was thought to be no greater than expected but national figures to allow a direct comparison were lacking.
Summary
-
The JEM values for transport are highest for those subsectors where closer and/or more frequent proximity to the general public might occur, including bus/coach drivers and taxi/cab drivers. Direct evidence of the rates of infection in transport workers comes largely from the ONS and REACT studies which demonstrate risks that are generally in the region of 1.0 to 1.5 times those of other workers, with a few CIs including 2 or more. They provide very little evidence relating to the early stages of the pandemic, and there is little evidence relating to subgroups of transport workers. There is some evidence of a doubled risk during the early months of 2021.
-
Information is available on approximately 1,600 COVID-19 associated deaths in transport workers. The earliest study for March-December 2020 showed a more than doubled age-sex standardised (to the 2013 European Standard Population) risk for taxi, cab, bus and coach drivers, and chauffeurs. In Scotland the mortality rates for transport and mobile machine drivers and operatives were doubled up to October 2021. Overall mortality rates for transport workers in England and Wales were increased in 2020 and 2021, and the proportion of deaths associated with SARS-CoV-2 infection was also more than doubled up to May 2021. Overall, the mortality data provide the strongest evidence of high rates of infection in transport.
Education
Work patterns, transmission and mitigation
76. The education sector covers a range of jobs and also a range of ages for children and older students. These include ‘early years’ care in nurseries and by child minders, primary and secondary schools, and post-school provision such as at further education colleges, Universities and adult education establishments. The evidence relating to COVID-19 in the education sector, particularly infection data, is almost entirely restricted to schools. Many nurseries remained open throughout the pandemic, particularly for the children of key workers.
77. Between the 18 March 2020 and 19 April 2022 there were varying restrictions on school opening, which are illustrated in Figure 7 for England (closures varied in other nations of the UK). During this period learning was delivered remotely using the internet. Some school staff were in school during the closure periods to teach the children of key workers and vulnerable children. Figure 7 also shows data for the proportion (%) teachers and school leaders absent with a suspected case of COVID-19.
Figure 7: Restrictions of school opening in England and teacher absences with COVID-19 (data from Hale et al. (2021) and Roberts and Danechi (2022)
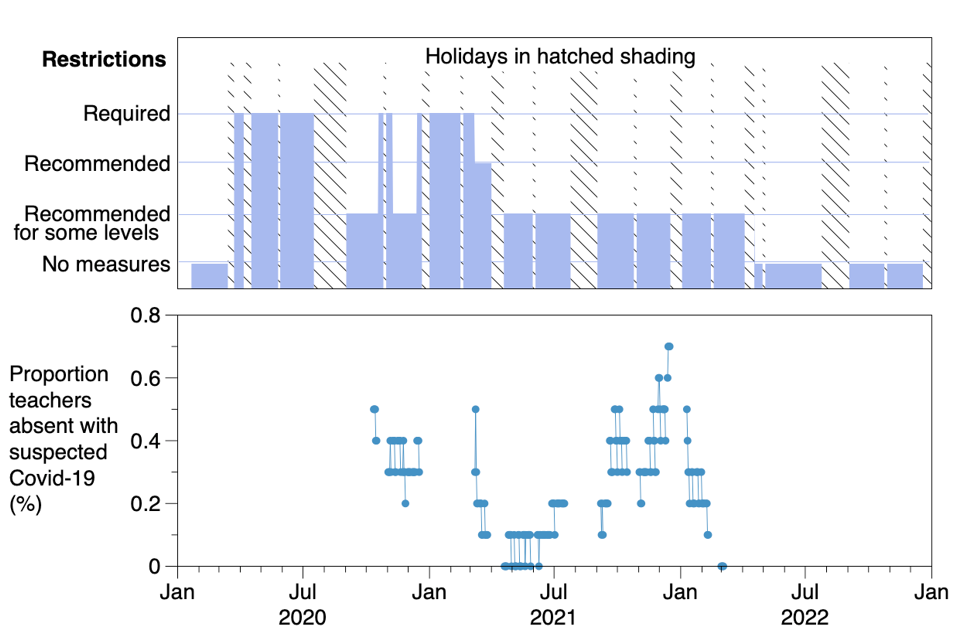
78. The risk of infection in school staff will have depended on the population infection dynamic (waves and troughs) as well as the infection dynamic within schools, the susceptibility of staff to the infection and the number of contacts of the staff at that time. The absolute risk of infection is therefore difficult to assess.
79. Although there were some regional differences, UK schools closed in late March 2020. Primary schools began to re-open from June 1st, and secondary schools from mid-June 2020. Schools were generally open throughout the autumn term 2020 but closed again between early January and March 2021 (Fenton 2021) (see Figure 8). University education was mostly carried out remotely throughout that period. Although most teaching was carried out online during school closures, a small number of children, mainly those whose parents were key workers, continued to be taught in school by teachers and teaching assistants.
80. Zuniga-Montanez et al. (2022) reported a study measuring surface SARS-CoV-2 contamination on surfaces (floors and portable filtration units) in 96 classrooms in Californian schools. From 2,341 tests 22 surfaces tested positive (0.9%). However, the researchers found intermittent repeated positive results in a single room over 52 days, despite regular cleaning of the room. They concluded that the positive samples may have contained ‘relic’ SARS-CoV-2 virus from before the monitoring began. As far as we are aware no measurements of SARS-CoV-2 virus contamination were made in schools in the UK. A Dutch study found no contamination from 469 settling dust samples collected in 18 schools between October 2020 - June 2021 (Jonker et al, 2023).
81. The UK study applying the COVID-19 JEM found that, overall, higher risk classifications of the four domains of transmission risk (number of contacts, nature of contacts, contaminated workspaces, location) and the two domains of mitigation measures (social distancing, use of face covering) tended to be associated with an increased risk of infection (Rhodes et al 2023). Seven educational or related jobs, including nursery nurses and assistants, educational support assistants, and teachers, were in the top 20 risk occupations in the SARS-CoV-2 JEM (appendix Table 1).
Evidence from studies of rates of infection in education workers
82. Ismail et al (2021) reported on SARS-CoV-2 infection in English schools during the period June 1 to July 17 2020 when schools reopened after the initial closure. They identified 113 single infections, 9 coprimary cases (sharing the same household), and 55 outbreaks involving 230 individuals. Most infections (213/343) occurred in staff members. A potential source of infection was identified in 127 (82%) of 154 staff cases linked to outbreaks and included another staff member (91 cases) or a schoolchild (21 cases). In the remaining 15 cases, the source was a household (11 cases) or a community contact (4 cases).
83. A study initiated by Public Health England (now the UK Health Security Agency) in the summer of 2020 undertook nasal swabbing or blood sampling in 131 schools in England (Lhadani et al, 2021). At recruitment 15% of staff members were positive for SARS-CoV-2 antibodies compared with 11% of students, similar to local community seroprevalence. During the summer half-term, weekly SARS-CoV-2 infection rates were 12·5 (95%CI 1·5–45·0) per 100 000 staff compared with 4·1 (95% CI 0·1–21·8) per 100,000 students. By December 2020, only 5% of 1085 participants who were seronegative at recruitment (in June 2020) had seroconverted, with similar rates for both staff and students. Overall, a very low risk of SARS-CoV-2 infection was found in students or staff attending primary schools during both partial reopening in the summer half-term and full opening in the autumn term.
84. Aiano et al (2021) carried out a cross-sectional investigation of outbreaks of SARS-CoV-2 infection in English primary and secondary schools during the first half of the 2020 Autumn term (August 31 to October 18). Approximately 24,000 schools were open during that period. 969 outbreaks were reported and 179 were investigated as part of the study. The outbreaks involved 2-100 individuals (mode= 6 cases). Infection rates were higher amongst staff (5.07% (95% CI 4.8 - 5.4%) compared with pupils (1.09%: 95% CI 1.0 - 1.2%) but the index case was considered to be a staff member in 49% of outbreaks. When the index case was a teacher, 13.65% (95% CI 12.1-15.3%) of teachers were affected whereas when the index case was a pupil 6.6% (95% CI 5.3 -8.1%) of teachers were affected. Additionally, teaching staff (6.0%; 95% CI, 5.7,6.5%) had higher attack rates than non-teaching staff (3.4%; 95% CI, 3.0,3.9%). Within an outbreak setting, primary school teaching staff had the highest attack rate (9.8%; 95% CI, 8.9,10.8%). Teaching staff in secondary schools by comparison had an attack rate of 4.0% (95% CI, 3.5,4.45%) (P<0.001), while non-teaching staff had the lowest attack rate (3.0%; 95% CI, 2.1,4.3%).
85. Aiano et al (2022) also reported a similar cross-sectional study of outbreaks in 324 nurseries during the period 02 November 2020 to 31 January 2021. One in three staff were affected compared to one in thirty children. When the index case was a child the infection rate in staff with child contact was less than that in those with no child contact (25% vs 34%). When the index case was a staff member with child contact the rates were 38% and 15% respectively, suggesting that staff-staff infection was more important that child-staff. It is noteworthy that the infection rates were much higher than in the school study but that reflects the winter 20/21 peak compared with the lower summer/autumn 2020 population infection levels.
86. A study in Wales based on national case detection and contact tracing system data was carried out during the autumn and summer terms 2020 to 2021 to identify whether educational staff had higher incidence rates of COVID-19 than the general population in Wales, and whether these differed between primary and secondary school settings and by teacher age (Thomas et al 2023). The observed pooled COVID-19 incidence rates for staff across both terms was 23.30 per 100,000 person days (95% CI: 22.3,24.3) compared with 21.7 per 100,000 person days (95%: CI 21.5,21.8) in the general population; incidence among teaching staff was highest in the two youngest age groups (< 25 years and 25 to 29 years). Age standardised incidence for primary school staff across both terms was 245.5 per 10,000 population (95% CI; 231.1,260.4) and for secondary school staff 188.7 per 10,000 population (95% CI; 171.9,206.5).
87. The ONS COVID-19 Schools Infection study in England is one of the largest and most comprehensive longitudinal research studies undertaken globally in primary and secondary schools during the COVID-19 pandemic. Hargreaves et al (2022) reported an estimated SARS-CoV-2 infection prevalence among those attending school, antibody prevalence, and antibody negative to positive conversion rates in staff and students over the school year (November 2020−July 2021) in a sample of 59 primary and 97 secondary schools in 15 English local authority areas that were implementing government guidance to schools open during the pandemic. 22,585 staff and students participated. SARS-CoV-2 infection prevalence in staff and students attending school varied with local community infection rate and was highest during the first two rounds of testing in the autumn term, ranging from 0.7% (95% CI 0.2, 1.2) among primary staff in November 2020 to 1.6% (95% CI 0.9, 2.3) among secondary staff in December 2020. Antibody conversion rates were highest in the autumn term. Infection patterns were similar between staff and students, and between primary and secondary schools. The prevalence of nucleoprotein antibodies increased over the year and was lower among students than staff. SARS-CoV-2 infection prevalence in the North-West region was lower among secondary students attending school on normal school days than the regional estimate for secondary school-age children. SARS-CoV-2 infection prevalence in staff and students attending school varied with local community infection rates (Figure 8).
Figure 8: Schools Infection Survey September 2020−July 2021, population case rates over time in study local areas by initial transmission status and age groups, school term dates, national lockdowns, school closures, and other major relevant public health events.
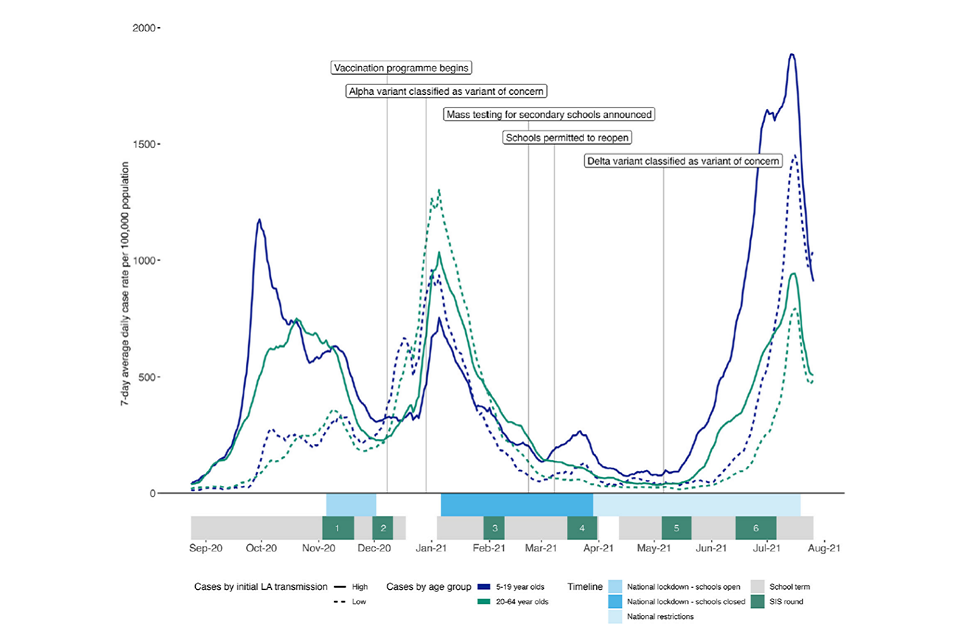
88. Nguipdop-Djomo et al (2023) carried out a further analysis of the data and noted that 3.7% of school staff were newly infected in the autumn 2020 term and 2.5% in the spring/summer 2021 term. There were no significant differences in infection rates in different staff groups and no relationship with the number of contacts: aOR 1.14 for >10 vs 0 pupil contacts per day and 0.75 for >10 vs 0 staff contacts during the autumn term, and aORs of 1.07 and 1.52 respectively for the spring / summer terms.
89. Fenton et al (2021) carried out a case-control study of Scottish teachers linking the General Teaching Council for Scotland register with a case-control dataset containing information on COVID-19 cases in Scotland over the period March 2020 to July 2021. Schools were closed for some terms during that period. The risk ratios for infection (a positive SARS-CoV-2 test) amongst teachers varied with state of openness of the schools (Table 12); similar to the study by Hargreaves et al the risk increased when the schools opened.
Table 12: Risk of infection in Scottish teachers by season
| Term | state | cases/controls | RR* | 95%CI |
|---|---|---|---|---|
| Spring/ summer 20 | closed | 72/2349 | 0.41 | 0.32-0.52 |
| Autumn 20 | open | 1424/8947 | 1.48 | 1.40-1.57 |
| Winter 20 | closed | 813/9000 | 0.81 | 0.76-0.88 |
| Spring 21 | phased | 386/2418 | 1.48 | 1.32-1.65 |
| Summer 21 | open | 1103/5530 | 1.69 | 1.65-1.89 |
| Overall | 3794/21792 | 1.27 | 1.22-1.30 |
*Risk ratios adjusted for age, sex and general practice
90. The ONS analysis of infection rates for the period 1/9/20 to 7/1/21 when schools were open were 25% to 60% higher in several teaching settings than the rates in the entire study population (ONS 2021). Teaching assistants had the highest rates, 6.64% (95% CI 5.57-7.85) compared with 4.1% for the whole population, followed by 6.35% for nursery nurses and assistants (95% CI 4.18-8.89), 5.42% for secondary education teaching (95% CI 4.19,6.88) and 5.21 for primary and nursery teaching (95% CI 4.09,6.54).
91. The ONS analysis for the period April 2020 to November 2021 (Rhodes et al 2022) showed approximately a consistent 30% higher rate of infection in education workers compared with non-essential workers across all 3 periods (aHR 1.31: 95% CI 1.23-1.39). The rates were elevated for both the April 2020 to February 2021 period (HR approximately 1.5) and the March to October 2021 period (HR approximately 1.5).
92. The REACT-1 study reported an aOR for SARS-CoV-2 positivity of 1.20 (95% CI 1.11-1.31) amongst education, school, nursery and preschool care workers for rounds 5-10 (Sept 2020 to March 2021) based on 4899 infections. The highest aOR of 1.43 (95% CI 1.07,1.01) was in February 2021.
93. The REACT-2 study reported on 2,565 positive SARS-CoV-2 antibody tests amongst 38,423 unvaccinated education workers. The seropositivity rates of ‘teachers and childcare’ workers were higher than those of non-key workers at rounds 1 (June to July 2020: 8.8% v 5.3%), round 2 (July to August 2020: 5.6% v 4.2%), round 3 (September 2020: 4.3% v 3.7%) and round 4 (October to November 2020: 5.7% v 4.8%). Rates for unvaccinated ‘education, school or nursey’ workers at round 5 (January to February 2021) were also higher than those of non-key workers (11.4% v 7.8%).
94. The VirusWatch study (Beale et al 2022) identified SARS-CoV-2 seropositivity in 47 of 446 (10.5%) self-reported teaching, education or childcare workers for the period 1 February to 21 April 2021. The OR for infection compared with the ‘Other Professional & Associate’ category adjusted for age, sex, household income and region was 1.12 (95% CI 0.80, 1.57). There were 1,671 teaching, education or childcare workers in the extended VirusWatch cohort covering the period between November 2020 and March 2022 (Beale et al 2023a). 702 (42%) had positive SARS-CoV-2 tests. Their adjusted risk ratio (aRR) for infection was increased across each of 3 time periods i.e. November 2020 to April 2021; May to October 2021; and November 2021 to March 2022. It was 1.34 (95% CI 1.24-1.44) for the entire study period. Within the sector the aRR for primary school teachers was 1.67 (95% CI 1.62-1.96); for secondary school teachers the aRR was 1.48 (95% CI 1.26-1.76), and for teaching support staff.it was 1.42 (95% CI 1.23,1.64).
95. The UK Biobank study covering the period 6 March to 26 July 2020 (Mutambudzi et al. 2020) included 8166 education workers of whom 11 had severe COVID-19 (death or a positive test in a hospital). Their relative risk of severe disease compared to nonessential workers was 1.36 (95%CI 0.75 - 2.48) adjusted for age, sex, ethnicity and country of birth.
96. The NHS Test and Trace study (Hiironen et al 2022) case-control study of COVID-19 infections across 3 time periods (late August, late September, and late October 2020) included 563 subjects working in or attending schools. For primary schools the ORs for infection adjusted for age, sex, region, ethnicity, non-work exposures, index of multiple deprivation, and leisure activities for the 3 time periods were respectively 0.43, 2.23 and 2.58 with a pooled OR of 1.43 (95% CI 0.49-4.201.01). For secondary schools the ORs were 1.53, 3.02 and 2.98 with a pooled OR of 2.58 (95% CI 1.62 – 4.11), and for others involved in education the ORs were 0.25,0.78 and 2.50 with a pooled OR of 0.90 (95% CI 0.26-3.07).
Risk of Mortality
97. The ONS mortality study (7961 COVID-19 related deaths between 9th March and 28th December 2020) showed moderately (less than doubled) increased rates amongst some teaching and related professionals (ONS 2020b) (Table 13).
Table 13: Numbers of deaths and Death Rates per 100,000 (95% Confidence Intervals) involving COVID-19 for 4-digit SOC codes in the education sector: men and women aged 20 to 64, England and Wales, deaths registered between 9 March and 28 December 2020[footnote 6].
Men
| SOC | Description | Deaths | Rate (95% CI) | RR* |
|---|---|---|---|---|
| 2312 | Further education teaching professionals | 10 | 24.7 (10.7-47.6) | <1.0 |
| 2311 | Higher education teaching professionals | 10 | 11.5 (12.4-33.2) | <1.0 |
| 6122 | Childminders and related occupations | 0 | – | – |
| 2317 | Senior educational professionals | 3 | – | – |
| 6125 | Teaching assistants | 5 | – | – |
| 6121 | Nursery nurses and assistants | 0 | – | – |
| 2315 | Primary and nursery education professionals | 4 | – | – |
Women
| SOC | Description | Deaths | Rate (95% CI) | RR* |
|---|---|---|---|---|
| 2312 | Further education teaching professionals | 3 | – | – |
| 2311 | Higher education teaching professionals | 4 | – | – |
| 6122 | Childminders and related occupations | 18 | 27.8 (15.9-44.8) | 1.65 |
| 2317 | Senior educational professionals | 12 | 25.2 (10.7-47.6) | 1.5 |
| 6125 | Teaching assistants | 37 | 15 (10.2-21) | – |
| 6121 | Nursery nurses and assistants | 12 | 11.8 (5.3-22) | – |
| 2315 | Primary and nursery education professionals | 19 | 10 (5.4-16.5) |
*Relative Risks (RR) for each occupational group have been estimated by dividing the death rate/100,000 for the specific occupation by the overall death rate per 100,000 (31.4 deaths per 100,000 men of the working population; 16.8 deaths per 100,000 women of the working population)
98. In the analysis adjusting for socio-economic factors, Nafilyan et al (2021) did not demonstrate an increased mortality rate (hazard ratio compared with all other occupations) for the period 24 January 2020 to 28 December 2020 for teaching and educational professionals: males HR= 0.99 (95% CI, 0.71,1.38) (age adjusted); HR= 1.05 (95% CI 0.75,1.47) (adjusted for age, geographical factors, ethnicity, education, socioeconomic characteristics, co-morbidities); females HR= 0.88 (95% CI, 0.56,1.37) (age adjusted); HR= 1.06 (95% CI 0.67,1.66) (adjusted for age, geographical factors, ethnicity, education, socioeconomic characteristics, co-morbidities).
99. In the study by Matz et al (2022) of excess mortality in 2020, overall, there was a reduced excess mortality of 3.4% for the education sector compared with the previous 5 years. The update of this study showed that infection in the education sector rose in the autumn of 2020 when schools reopened after the summer peaking in January 2021 (Matz et al 2023). This resulted in just over a 30% excess mortality rate from all causes for January to February 2021 for the education sector. There were very few excess deaths after this although infection rates rose in June to July 2021. Matz et al. (2023) suggest that this might be explained by the high uptake of vaccination in this sector (Nafilyan et al 2022).
100. In the study by Cherrie et al (2022) that used ONS mortality data to estimate proportional mortality, the age-adjusted mortality odds ratio (MOR) for the educational sector was 1.03 (95% CI 0.93,1.14) and slightly higher when fully adjusted, 1.05 (95% CI 0.95,1.17). MORs were highest in the first study period (January-September 2020), MOR = 1.17 (95% CI 0.97,1.14) compared to non-essential occupations.
101. The age-standardised mortality rate per 100,000 for deaths in Scotland with a mention of COVID-19 on the death certificate was 6.3 (95% CI 3.2,9.3) for teaching and education professionals compared with 20.6 per 100,000 for all occupations.
Summary
- With the exception of mortality data from 2020, there is little or no information pertaining to child minding, nurseries, universities and colleges, and most relates to primary and secondary education. There is no evidence of any marked increase in death rates associated with SARS-CoV-2 infection. The infection studies in England and Wales show increased risks of SARS-COV-2 infection in the region of 1.3 to 1.5 times those of comparator groups during 2020 and 2021. These risks are likely to have been diluted by periods when schools were closed but the ONS analysis for September 2020 to January 2021 when schools were open showed similar risks. The study of Scottish schools also showed risks in the region of 1.5 to 1.7 times those of the general working-age population during periods when schools were open and 0.4 to 0.8 when schools were closed. The few studies of individual schools show conflicting results.
Sequelae From Infection with SARS-CoV-2: Post-COVID-19/ Long COVID.
Definitions
102. The rate of severe illness and death was high particularly during the early stages of the COVID-19 pandemic. Survivors sometimes suffered ongoing problems as consequence of complications of the acute illness and these were recognised in IIAC’s 2022 Command paper. From an early stage of the pandemic it was also recognised that others could suffer persisting symptoms or develop new symptoms following infection that were not related to any of the recognised complications.
103. A post-COVID-19 condition was recognised in the International Classification of Diseases revision 10 (ICD 10) classification of diseases from September 2020, and in October 2021 the World Health Organisation defined the condition as ‘an illness that occurs in people who have a history of probable or confirmed SARS-COV-2 infection, usually within 3 months from the onset of COVID-19, with symptoms that have lasted at least two months and cannot be explained by an alternative diagnosis (Soriano et al., 2022).
104. ‘Long COVID’ is a patient-created term that has been used largely synonymously with the post-COVID-19 condition. The United States Centres for Disease Control (CDC) defines long COVID as ‘signs, symptoms, and conditions that continue or develop after acute COVID-19 infection’ (CDC, 2024). In the UK the National Institute for Health and Care Excellence (NICE) distinguishes ongoing symptomatic COVID-19 (signs and symptoms of COVID-19 infection from 4 weeks to 12 weeks) from post-COVID-19 syndrome (‘signs and symptoms that develop during or after an infection consistent with COVID-19, continue for more than 12 weeks, and are not explained by an alternative diagnosis’) and uses the term long COVID to include both (NICE, 2022).
105. The National Institute for Health and Care Research (NIHR) in 2022 recognised the lack of use of these definitions in research on post-COVID-19 and noted that ‘the absence of universally agreed outcomes to measure in people with long COVID causes different researchers and health professionals around the world to measure different outcomes. In 2023 Chaichana et al (2023) reported that the 3 main organisational definitions of long COVID from NICE, WHO and the CDC were used in only 35% of relevant studies published before October 2022. Of the remainder, 65% of studies used their own definition and 33% did not define the condition under investigation. The varying definitions used makes it challenging to measure the overall burden of post-COVID-19 symptoms and to compare findings across different regions and populations (Yang et al, 2024).
106. NICE recognises that long COVID symptoms may include those of permanent organ damage arising from the acute infection, post-ICU syndrome, and post-viral fatigue syndrome (NICE, 2022). However, for the most part definitions of long COVID do not distinguish those whose symptoms can be explained by complications of the acute illness, such as thrombo-embolism or lung fibrosis, from those without obvious physical sequelae of the acute infection (Pan et al, 2023). There are likely to be different pathological processes resulting in similar symptoms that are often grouped together as a post-COVID-19 condition. Some, but not all, individuals with what is commonly considered to be long COVID are likely to be included in IIAC’s proposed prescription of complications of COVID-19 infection in H&SCWs – COVID-19 and Occupational Impacts – GOV.UK.
Prevalence
107. The precise prevalence of post-COVID-19 symptoms is uncertain because of the considerable heterogeneity amongst studies in relation to definitions, study populations, methods of recruitment and symptom ascertainment, durations of follow-up, and comparisons with control populations.
108. The Winter Coronavirus (COVID-19) Infection Study asked participants to self-report symptoms of long COVID between November 2023 and March 2024 in England and Scotland over 4 separate periods of time with self-testing (Glaser et al. 2024). An estimated 3.3% of participants experienced symptoms of long COVID in wave 4, between 6 February and 7 March 2024. The proportion of cases coming to medical attention appears to be lower than that. Jeffrey et al (2024) identified text or clinical codes indicating long COVID in 0.3% of general practice records of adult Scottish patients for the period March 2020 to October 2023. Using an operational definition based on four symptoms, 6 investigation types, and 7 management strategies following a positive SARS-CoV-2 test they identified possible long COVID in a further 1.4% of patients.
109. The trends in incidence of long COVID are also uncertain. Jeffrey et al (2024) reported a steady increase in new cases of long COVID identified in general practice records by clinical code, free text or sick note up to April 2022 when large-scale SARS-CoV-2 testing stopped and a fall after that. The ONS reported prevalences of self-reported long COVID symptoms in the UK of 2.4% (95% CI 2.3-2.4) in January 2022 and 2.6% (95% CI 2.5-2.7) in July 2022 which were lower than the England prevalence in January and February 2024 of 3.2% (95% CI 3.0-3.4). The US Household Pulse Survey reported a fall in long COVID symptom prevalence from 7.5% (95% CI 7.1%-7.9%) of adults in June 2022 to 5.3% of adults (95% CI 5.0%-5.6%) in March 2024.
110. In the UK referrals to specialist centres for assessment of new cases with post-COVID symptoms declined substantially between July 2021 and December 2023.
Figure 9: Number of referrals accepted into post-COVID assessment services In England by month*
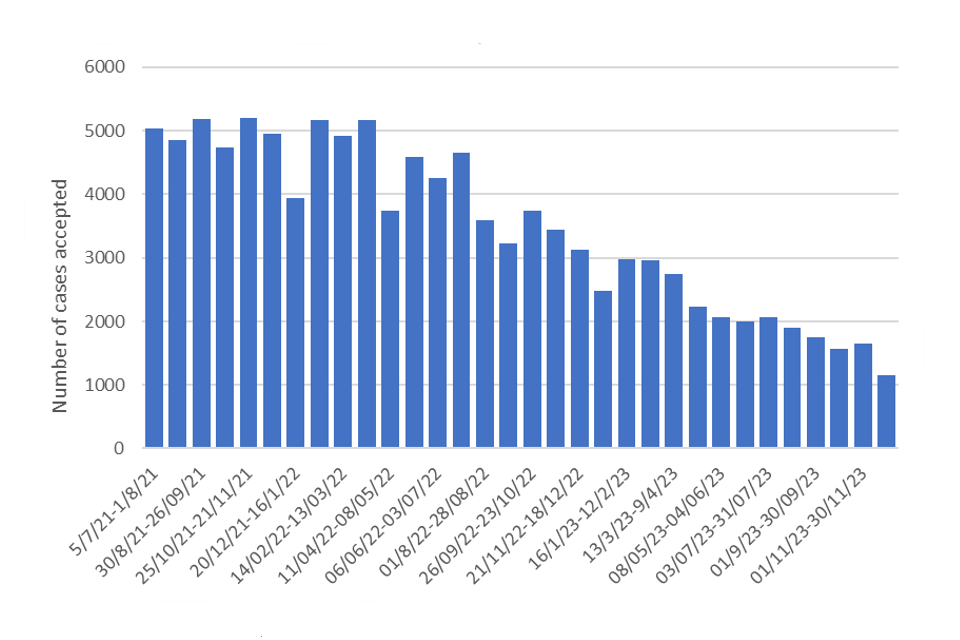
*Data extracted from NHS England statistical reports published in the COVID statistical work area. July 2021- Feb 2024[footnote 7].
Pathophysiology
111. The pathophysiological processes associated with most cases of long COVID remain unclear, but it is unlikely that a single mechanism can explain the symptoms in all cases. Several processes have been proposed but there is no substantial body of evidence to support any as a unifying mechanism. Suggested explanations include (Davis et al, 2023):
- Microemboli- including amyloid fibrin clots.
- Persisting viral infection and reactivation
- Persisting inflammation and unrepaired tissue
- Autoimmunity
- Autonomic dysregulation
- Deconditioning/ anxiety
Symptoms
112. Over 200 individual post-COVID-19 symptoms have been reported. The commonest as reported after an average follow-up time of 126 days in a systemic review and meta-analysis of 194 papers (O’Mahoney et al., 2023) are:
- fatigue (28.4%; 95% CI 24.7%–32.5%; 70 studies)
- pain/discomfort (27.9%; 95% CI 21.2%–35.6%; 10 studies)
- impaired sleep (23.5%; 95% CI 18.1%–29.8%; 34 studies)
- breathlessness (22.6%; 95% CI 18.3%–27.4%; 70 studies)
- impaired usual activity (22.3%; 95% CI 14.2%–33.39%; 10 studies).
Diagnosis
113. In some cases, post-COVID-19 symptoms can be explained at least in part by abnormalities that are apparent radiologically or from other tests such as lung function measurements. That is particularly the case when ongoing symptoms are associated with a complication of the acute illness such as myocardial infarction, interstitial lung disease, pulmonary hypertension or a prolonged stay in an intensive care unit. O’Mahoney et al (2023) in their meta-analysis of investigations performed on hospital survivors, noted that abnormal CT patterns/x-rays were frequently reported (pooled prevalence of 45.3% 95% CI 3.3%-55.7%; 13 studies). However, an undetermined proportion of symptoms included under the umbrella term long COVID cannot at present be explained by any particular pathophysiological or anatomical abnormality. For example, the proportion of cases where breathlessness is experienced in the absence of radiological, lung function or cardiac abnormalities, and the effect of deconditioning on this number is not clear in the literature.
114. Long COVID disease phenotypes and underlying mechanisms remain poorly understood and at present the diagnosis is based on symptoms alone in the majority of cases. Davis et al (2023) reviewed the various diagnostic tools and noted that although there are tests for proposed components of long COVID such as tilt tests for postural tachycardia syndrome (POTS), there are no established tests for the condition itself. There are a number of putative biomarkers but these are not yet fully validated, (Davis et al, 2023; Liew et al, 2024) and are not in general use. Similarly, while radiological and pathophysiological abnormalities have been identified in some patients there is no specific test that can reliably distinguish those with long COVID symptoms from those without.
115. One issue in quantifying and classifying long COVID is that the symptoms overlap with those that are common in the general population. In 2023, Thaweethai et al (2023) noted that 3.7% of their control population fulfilled their definition of long COVID based on symptom scores. Several authors have noted the similarity between the symptoms of long COVID and those of myalgic encephalomyelitis (ME) and chronic fatigue syndrome (CFS) (Davis et al, 2023). ME/CFS is a long-term complicated illness characterized by at least six months of fatigue and exhaustion, and comparison with studies on long COVID are difficult due to the differences in definition and study designs (r et al 2023). The cause of ME/CFS is medically unexplained, although raised risks for developing ME/CFS following viral infection have been found in some studies (Hwang et al 2023).
116. A further issue is that symptoms similar to those of long COVID are reported following other viral infections. Vivaldi et al (2023) compared 1311 patients with SARS-CoV-2 infection, 472 with non-COVID-19 respiratory infections and 8388 non-infected subjects taking part in the UK CONVIDENCE study. All were unvaccinated. Information about symptoms was gathered in January and February 2021 by online questionnaire. More of the COVID-19 patients had been infected more than 12 weeks previously (87% v 42%) and more had been hospitalised (5% v 2%). Odds ratios for symptom prevalence compared with non-infected individuals were raised for both SARS-COV-2 infected individuals and those with other acute respiratory infections (Table 14).
Table 14: Odds ratios for symptoms following COVID-19 and other respiratory illnesses compared with a control population.
| Symptoms | vs no infection | vs non-COVID infection |
|---|---|---|
| Problems with sense of smell / taste | 17.63 (12.40–25.07) | 1.35 (0.75–2.43) |
| Changes to voice | 3.25 (1.94–5.46) | 3.11 (2.12–4.55) |
| Coughing | 2.96 (2.13–4.11) | 2.93 (2.29–3.76) |
| Unusual racing of the heart | 2.45 (1.67–3.59) | 1.79 (1.33–2.41) |
| Light-headedness or dizziness | 2.40 (1.71–3.35) | 1.54 (1.17–2.03) |
| Unusual sweating | 2.42 (1.61–3.63) | 1.83 (1.32–2.54) |
| Diarrhoea | 2.29 (1.53–3.41) | 2.09 (1.56–2.82) |
| Memory problems | 2.01 (1.46–2.77) | 1.69 (1.32–2.16) |
| Stomach (abdominal pains) | 1.72 (1.15–2.58) | 2.15 (1.64–2.81) |
| Difficulty concentrating | 1.69 (1.23–2.33) | 1.53 (1.21–1.94) |
| Hair loss | 1.66 (1.03–2.68) | 0.97 (0.65–1.46) |
| Problems with sleep | 1.46 (1.13–1.89) | 1.49 (1.23–1.82) |
| Pains in muscles or joints | 1.46 (1.11–1.92) | 1.25 (1.01–1.54) |
Investigation and treatment
117. When persisting symptoms arise from a complication of acute COVID-19, investigations such as CT scanning, lung function measurement and echocardiography are likely to be abnormal. For many patients with persisting symptoms such tests are normal or show only minor abnormalities. More sensitive tests are being researched together with a variety of biomarkers and markers of inflammation. However, there is currently no validated single diagnostic test for long COVID (Davis et al 2023, Liew et al, 2024).
118. NICE guidelines recommend self-management and a rehabilitative approach to treatment of long COVID symptoms. McGregor et al (2024) report benefit in hospitalised adults from a structured programme of rehabilitation in those admitted with acute COVID-19 infection. A variety of anticoagulant, anti-inflammatory, antihistamine and anti-viral treatments are under research as potential treatments (Davis et al, 2023).
Summary
- Several large studies have found a high proportion of individuals self-reporting ongoing symptoms following acute infection with SARS-COV-2 and that these symptoms are persistent and relapsing in nature. There is no single symptom which distinguishes long COVID from similar symptoms following other viral infections. The lack of uniformity of the definitions and criteria used to identify long COVID in research studies has resulted in a substantial heterogeneity in the findings. Many studies to date have limitations with regards to methodology and as such are subject to bias, as acknowledged by NICE. There remains poor understanding of the pathophysiology of long COVID which is further confounded by a lack of specific diagnostic testing and variable definitions of the condition. IIAC has made recommendations regarding specific post-acute COVID sequalae which will be responsible for an, as yet unknown, proportion of reported cases of long Covid.
General Discussion
119. IIAC has previously carried out 2 extensive evaluations of the occupational impacts of infection with SARS-CoV-2.
120. the first used mainly mortality data in 2020 and did not recommend prescription – COVID-19 and occupation: IIAC position paper 48; the second reviewed reports and publications up to the end of 2021 and led to a Command paper recommending prescription for major sequalae of SARS-Cov-2 infection in H&SCWs – COVID-19 and Occupational Impacts – GOV.UK. This current report evaluates the more recent evidence for transport workers and those working in educational sectors. However, a continuing scarcity of good quality data has hampered evaluation for other specific occupations and for workers involved in workplace outbreaks. The information utilised in this current evaluation includes an updated description of work patterns and transmission pathways, the development and use of JEMs for indicating the potential risk for being infected in specific jobs, and evaluation of infection and mortality data.
121. Two main sources of epidemiological information have been considered in this report, i.e., estimates of risk from infection surveys, and mortality data. As discussed in IIAC’s previous reports, much of this information has strengths and weaknesses which need taking into account when drawing conclusions from the total body of evidence. Both occupation and cause of death data obtained from death certificates are subject to uncertainties and inaccuracies. The available mortality rates by occupation include both deaths where SARS-CoV-2 was the primary cause of death and those where SARS-CoV-2 infection was a contributary cause (approximately 30%) and not the underlying cause. Approximately 70% of COVID-19 deaths overall occur in hospital with a further 20% occurring in care homes. However, there is no information by occupation as to where the deaths occurred and thus no data on when the diagnosis of COVID-19 occurred for these people.
122. This report has evaluated data over 3 years of the pandemic during which infection rates varied at different times both across the UK and between different regions; there were also several different SARS-CoV-2 variants. Potential exposure to SARS-CoV-2 will also have fluctuated over time depending on the restriction measures in place. This presents a complex picture and challenges for interpretation.
123. The development of JEMs can provide an efficient way to assign exposure estimates in population-based studies and allows incorporation of exposure measurements with expert opinion. The SARS-CoV-2 JEM provides a semi-quantitative score based on key aspects of a job that may result in greater or lesser exposure to SARS-Cov-2 and it has been applied in a small number of epidemiological studies. As can be seen from Appendix 1, a relatively large number of occupations have the same total score using this JEM and thus the granularity may be limited when applied. However, many of the epidemiological studies also use broad occupational groups and the COVID JEM allows identification of subgroups who were potentially at higher risk than others, for example bus/coach drivers and taxi/cab drivers within the Transport sector and nursery nurses and assistants, educational support assistants, and teachers within education. These occupational groups had JEM scores similar to those of many health and social care workers.
124. The infection and mortality data vary considerably between studies in terms of the time periods covered and includes differences in: the age ranges of the study participants included, even using the same data source, for example for mortality 20-64 years (ONS 2020b), 40-54 years (Nafilyan et al 2021); different sources of occupational data e.g. from death certificates, linkage with occupation on a census, self-reported occupation; the choice of comparison population, e.g. all non-essential workers, professional workers, the national population for some mortality analyses etc; the availability, choice and use of adjustment factors. Most studies used non-essential workers as the comparison group, with a few using ‘professional or corporate workers’; the occupations included in these groups varies between studies. The risk estimates tend to be higher when professional or corporate workers are used as a comparison group. One or two studies compared each occupation with ‘all other’ occupations i.e., each comparison was different; this limits the interpretation of the results.
125. There were quite often small numbers of participants in some of the analysis categories particularly for occupation. Of note was the lack of occupation on the death certificate for women in the ONS mortality analysis, with only 60% of those of women having an occupation on the death certificate versus 85% for men. This both limited the analyses that could be carried out by researchers and the interpretation of results. Grouping occupations with potentially different exposure risks into a broader group can cause dilution of specific risks. The Council noted that much of the information for both the transport and education sectors lacks granularity in occupation subgroups.
126. The magnitude of risk estimates relating occupation to risk of COVID-19 has been shown to decline in some, but not all studies, when covariates such as ethnicity, socio-economic status, deprivation, and co-morbidities, are all included in the statistical models. However, many of these variables are highly correlated and risk estimates stratified by occupation for these covariates are often not presented. There is now a greater understanding of the dynamics and intersection of occupation and socioeconomic inequalities experienced by workers during the pandemic.
127. Studies such as that by Elliott J et al (2021), Amdaoud et al (2020), Amalgro and Orane-Hutchinson (2022) and Green and Semple (2023) have shown that inequality in COVID-19 incidence is strongly associated with occupation, which itself is strongly correlated with gender, racial inequalities, deprivation, poor health and other socioeconomic characteristics. Carlsten et al (2021) discuss the difference and overlap between the vulnerable worker who is at higher risk of COVID-19 due to greater likelihood of higher exposure and the worker who is susceptible to COVID-19 at any exposure due to demographic characteristics, co-morbidity and co-exposures. In the UK, lockdowns increased inequalities because people working in front-line jobs, such as essential retail, delivery, and health-care workers were unable to work from home. Many workers in these industry sectors are also in the lower deciles of income and more likely to be living in deprived areas; sectors such as Health and Social care also have higher proportions of workers of non-white ethnicity (ONS 2020a). Disentangling the effects of these interrelated social determinants of health from work related factors is thus challenging.
Conclusions
128. The process of evaluating evidence needed to fulfil the very specific requirements of the IIDB scheme can be difficult and challenging. A key feature of IIDB is the benefit of presumption and thus IIAC has to decide whether the attribution of a particular disease to an occupation can be established or presumed with ‘reasonable certainty’. i.e. is more likely than not. For this, IIAC requires consistent, independent, good quality evidence (usually epidemiological) that the risk to workers in a certain occupation is much greater than risk to the general population with a clearly defined and verifiable exposure and disease. Any recommendation from IIAC must also be able to be administered effectively by decision makers and be a cause of impairment/disablement. The boundaries of the IIDB scheme are perhaps more rigid than those of some other countries but have the advantage of being ‘no fault’. The conclusions described below are the result of IIAC having considered all available evidence relating to COVID-19 and transport and education sectors and come to a consensus decision.
129. The evidence relating to COVID-19 in workers from both the transport and education sectors is more limited than that available for H&SCWs, although some studies show similar risks. The SARS-Cov-2 JEM scores for public-facing transport workers and for some jobs in the education sector are high and comparable to those for many H&SCWs.
130. The majority of the data for the education sector relates to schools and colleges and there is very little information for work in the early years sector such as nursery schools and childminding. There is no evidence of any marked increase in death rates in workers in the education sector associated with SARS-CoV-2 infection. The ONS and REACT studies showed increased risks of SARS-COV-2 infection in the region of 1.3 to 1.5 times those of comparator groups during 2020 and 2021. These risks might have been diluted by periods when schools were closed but the ONS analysis for September 2020 to January 2021 when schools were open showed similar risks. The PHE study of English schools reported similar rates of infection in primary school teachers during the summer 2020 term compared with the local community rates. The study of Scottish schools also showed risks in the region of 1.5 to 1.7 times those of the general working-age population during periods when schools were open and 0.4 to 0.8 when schools were closed. In Wales there was little difference between rates in primary and secondary teaching staff and community rates during the autumn 2020 and summer 2021 school terms. One study of English schools reported that infection rates in teaching staff were approximately twice those of non-teaching staff (Aiano et al. 2021) whereas another reported no differences (Nguipdop-Djomo et al 2023). Overall, although there are a few results where the confidence intervals around risk estimates extend to 2, the infection data does not identify education workers as meeting IIACs requirement for prescription.
131. It is acknowledged that in some studies the risks faced by education workers with direct student contact is likely to have been diluted by the risks of those who did not have such direct contact, and there are likely to be circumstances where education workers developed infection as a consequence of contact with students. However, taking the infection and mortality data as a whole, IIAC is unable to conclude that there is sufficient evidence of a doubled risk in education workers and is therefore unable to recommend prescription.
132. The mortality data for the transport sector relating to COVID-19 shows increased risks, particularly for public-facing transport workers in the coach/bus and taxi/cab (including private hire) sectors. This includes drivers, driving instructors, chauffeurs, ticket/travel assistants, and inspectors in these sectors. For some measures of mortality this has persisted into 2023. Co-morbidities such as diabetes and obesity and personal characteristics such as older age increase the likelihood of death after infection with SARS-CoV-2. IIAC does not generally take account of confounders other than those that are clearly established competing causes of the disease of interest. IIAC considers that mention of COVID-19 on death certificates gives a good indication of the occurrence of infection. IIAC recognizes infection may have occurred outside occupation, including in hospital, but this information is not available. From the mortality data, IIAC takes the view that the risks of infection are likely to be more than doubled in transport workers who work in proximity to the public. Based on the available scientific evidence, IIAC therefore recommends prescription for the complications of COVID-19 outlined in our previous report for workers in the taxi/cab (including private hire) and coach/bus sectors who have worked in close proximity to the public during their time at work in the two weeks prior to the onset of their illness.
133. IIAC acknowledges that there are other occupational sectors where COVID-19 infection was acquired in work settings. However, the evidence for any increased risk is sparser and has lower excess risks and inconsistent results over different time periods and between occupations. The Council concludes, therefore, that at this stage the evidence is of insufficient quantity and quality to recommend prescription for occupations other than H&SCWs and the transport sector. We also recognise that there have been outbreaks where several co-workers were infected and the spread was probably occupational. However, currently it is not possible to define these circumstances for the purposes of IIDB.
134. The Council also acknowledges that some people may suffer persisting symptoms following SARS-CoV-2 infection that impact of their daily activities including their work; a wide range of symptoms have been described including fatigue, cognitive dysfunction, breathlessness, muscle and joint pains. Together these have been described as post-COVID syndrome or long COVID. Currently, understanding of the underlying pathophysiology of the key symptoms of post-COVID Syndrome is limited, as is the ability to measure and diagnose the condition objectively. As explained above, IIDB usually requires objective evidence of disease in the form of clinical signs or abnormal test results. Although IIAC acknowledges the occurrence of the symptoms of long COVID and that these sometimes follow infection at work, they are not objectively verifiable in the majority of cases. IIAC therefore concludes that there is insufficient evidence at present to recommend extension of the prescription for this syndrome. IIAC acknowledge, however, that many of the reported symptoms of long COVID may occur following one or more of the pathological complications listed in the recommended prescription.
135. The Council is aware that, separate from any prescription, there may be a number of instances where individual workers may make a claim under the accident provisions of IIDB for any disability or loss of faculty that can be shown to have resulted from linking their exposure to SARS-CoV-2 to a specific incident or occurrence: this would apply to immediate injury and also to effects that are delayed and only become apparent at a later time.
Recommendations
136. Based on the available scientific evidence, the Council recommends the following prescription should be added to the list of prescribed diseases for which benefit is payable:
1. Persisting pneumonitis or lung fibrosis following acute COVID-19 pneumonitis
2. Persisting pulmonary hypertension caused by a pulmonary embolism developing between 3 days before and 90 days after a diagnosis of COVID-19
3. Ischaemic stroke developing within 28 days of a COVID-19 diagnosis
4. Myocardial infarction developing within 28 days of a COVID-19 diagnosis
5. Symptoms of Post Intensive Care Syndrome following ventilatory support treatment for COVID-19: for workers in bus/coach transport* and taxis/private hire cars/cabs** working in proximity to the general public in the 2 weeks prior to infection.
*Includes drivers, ticket inspectors, ticket/travel assistants, instructors in this sector; **Includes drivers, chauffeurs, instructors in this sector.
Future Work by IIAC on Occupation and COVID-19
136. In this Command paper IIAC has recommended that specific complications of COVID-19 should be eligible for IIDB for certain sections of the transport sector. This decision is based on substantial and consistence evidence. However, as noted above, there is far less evidence currently available for other industry sectors. Although some studies show some excess risk in several specific sectors, the evidence is less robust and less consistent than for H&SCWs and the transport sector. The Council, at the current time, concluded that there was insufficient evidence for prescription for other occupations.
137. The Council will continue to keep the situation under review and will continue to monitor the evidence and available data. The Council expects that there will be more evidence on the long-term adverse health consequences of COVID-19, including increased understanding of the underlying pathophysiology of the key symptoms of post-COVID syndrome.
138. More information on outbreaks is also expected to become available and this will be evaluated by IIAC.
Prevention
139. The Council’s previous reports on COVID-19 included some observations on prevention, which were written during the pandemic and reflected the actions employers were expected to take at that time. These are updated here for non-health and social care workplaces in a post-pandemic situation, along with further observations relevant to post-Covid-19 syndrome. Further information is available from the UK Health Security Agency – Reducing the spread of respiratory infections, including COVID-19, in the workplace - GOV.UK, Coronavirus (COVID-19) – Advice for workplaces – Health and Safety Executive , and the Scottish Government – Reducing the spread of respiratory infections, including COVID-19, in the workplace – GOV.UK.
140. Development of COVID-19 requires human-to-human transmission of the virus, SARS-CoV-2. The best way to prevent the disease is to stop the virus being transferred from the exhaled breath of an infectious person to the lungs of an uninfected individual. The restrictions during the pandemic for people at work have been replaced by public health advice. Workers who develop symptoms of a respiratory infection are advised to try and stay at home and avoid contact with others. Employees are currently no longer expected to wear face coverings or respirators when potentially infected individuals are present in the workplace. However, to help reduce transmission, infected individuals who go to their workplace are advised to wear a well-fitting face covering made with multiple layers or a surgical face mask, and to avoid enclosed or poorly ventilated workspaces. Most employers do not need to include consideration of SARS-CoV-2 in their risk assessments, and do not need to provide specific risk mitigation measures, such as physical barriers or social distancing measures. However, employers have a legal obligation under health and safety law to provide adequate fresh air through appropriate building ventilation. This helps to dilute the concentration of the SARS-CoV-2 virus in the workplace and reduce the risks of transmission. Employers must also consult workers and their representatives on any changes affecting health and safety.
141. The Control of Substances Hazardous to Health 2002 Regulations (COSHH) only applies in very specific situations where workers contact the SARS-CoV-2 virus as part of their work, e.g. laboratory workers researching the virus or H&SCWs caring for COVID-19 patients.
142. Workers with a weakened immune system, which makes them at higher risk of serious illness from COVID-19, may be entitled to a Reasonable Adjustment under the Equality Act, which could include introduction of physical control measures to the workplace or other preventative measures. For example, a private hire cab driver with a compromised immunity might require a plastic screen installed to isolate them from their passengers.
143. Vaccination has been shown to be effective in reducing the severity of COVID-19, mortality and the need for hospital admissions but has a more limited effect on reducing transmission (Stokel-Walker, 2022). So long as the SARS-CoV-2 virus is in circulation in the community and in workplaces, people will continue to develop COVID-19, and a proportion will develop post-COVID-19 complications. While there is no evidence currently that post-Covid-19 complications can be completely prevented, there is increasing evidence that long term (as well as short term) symptoms / complications are less frequent and less severe in people who have been vaccinated (Ceban et al., 2023: Watanabe et al., 2023). Currently the vaccination programme in Britain does not generally include those under the age of 65; exceptions include frontline health and social care workers, staff working in homes for older adults, pregnant women, those with a clinical risk and those living with someone who has a weakened immune system. There is no vaccination programme for those actively in the workforce.
144. Those people who do develop ongoing activity-limiting symptoms as well as pathophysiological complications from COVID-19 will need varying levels of support and rehabilitation to regain their work ability. The NHS has established numerous long COVID clinics and offers advice through the ‘Your COVID Recovery’ website. Work-related guidance has been published by various bodies to help people overcome their difficulties returning to work and normal activities. This guidance, which is variously directed at healthcare professionals and workplaces, has been compiled by the [Faculty of Occupational Medicine] (https://www.fom.ac.uk/media-events/publications/fom-guidance), and the Society of Occupational Medicine.
Appendix
Table 1: Jobs categorised by 6-digit SOC codes with a score of 13 or more on the COVID-19 JEM, indicating relatively high risk of exposure to SARS-CoV-2 at work due to characteristics inherent in the job.
[Scoring (0,1,2 or3) based on 6 factors - job insecurity and migrant worker factors excluded]
| SOC 2-digit | SOC 4 digit | Occupation | Sum 6 dimensions in JEM |
|---|---|---|---|
| 11 Corporate managers and directors | 1181 | Health services and public health managers and directors | 15 |
| 11 Corporate managers and directors | 1190 | Managers and directors in retail and wholesale | 14 |
| 12 Other managers and proprietors | 1221 | Hotel and accommodation managers and proprietors | 14 |
| 12 Other managers and proprietors | 1223 | Restaurant and catering establishment managers and proprietors | 13 |
| 12 Other managers and proprietors | 1224 | Publicans and managers of licensed premises | 14 |
| 12 Other managers and proprietors | 1226 | Travel agency managers and proprietors | 13 |
| 12 Other managers and proprietors | 1241 | Health care practice managers | 13 |
| 12 Other managers and proprietors | 1242 | Residential, day and domiciliary care managers and proprietors | 15 |
| 12 Other managers and proprietors | 1251 | Property, housing and estate managers | 13 |
| 12 Other managers and proprietors | 1252 | Garage managers and proprietors | 13 |
| 12 Other managers and proprietors | 1253 | Hairdressing and beauty salon managers and proprietors | 14 |
| 12 Other managers and proprietors | 1254 | Shopkeepers and proprietors – wholesale and retail | 14 |
| 12 Other managers and proprietors | 1259 | Managers and proprietors in other services n.e.c. | 13 |
| 22 Health professionals | 2211 | Medical practitioners | 14 |
| 22 Health professionals | 2213 | Pharmacists | 13 |
| 22 Health professionals | 2214 | Ophthalmic opticians | 14 |
| 22 Health professionals | 2215 | Dental practitioners | 14 |
| 22 Health professionals | 2216 | Veterinarians | 13 |
| 22 Health professionals | 2217 | Medical radiographers | 15 |
| 22 Health professionals | 2218 | Podiatrists | 15 |
| 22 Health professionals | 2219 | Health professionals n.e.c. | 15 |
| 22 Health professionals | 2221 | Physiotherapists | 14 |
| 22 Health professionals | 2222 | Occupational therapists | 15 |
| 22 Health professionals | 2223 | Speech and language therapists | 13 |
| 22 Health professionals | 2231 | Nurses | 16 |
| 22 Health professionals | 2232 | Midwives | 14 |
| 23 Teaching and educational professionals | 2312 | Further education teaching professionals | 15 |
| 23 Teaching and educational professionals | 2314 | Secondary education teaching professionals | 15 |
| 23 Teaching and educational professionals | 2315 | Primary and nursery education teaching professionals | 13 |
| 23 Teaching and educational professionals | 2316 | Special needs education teaching professionals | 13 |
| 24 Business, media and public service professionals | 2412 | Barristers and judges | 13 |
| 24 Business, media and public service professionals | 2413 | Solicitors | 13 |
| 24 Business, media and public service professionals | 2419 | Legal professionals n.e.c. | 13 |
| 24 Business, media and public service professionals | 2442 | Social workers | 14 |
| 24 Business, media and public service professionals | 2443 | Probation officers | 14 |
| 24 Business, media and public service professionals | 2444 | Clergy | 15 |
| 24 Business, media and public service professionals | 2449 | Welfare professionals n.e.c. | 14 |
| 24 Business, media and public service professionals | 2451 | Librarians | 13 |
| 32 Health and social care associate professionals | 3213 | Paramedics | 14 |
| 32 Health and social care associate professionals | 3216 | Dispensing opticians | 13 |
| 32 Health and social care associate professionals | 3217 | Pharmaceutical technicians | 14 |
| 32 Health and social care associate professionals | 3218 | Medical and dental technicians | 15 |
| 32 Health and social care associate professionals | 3219 | Health associate professionals n.e.c. | 13 |
| 32 Health and social care associate professionals | 3231 | Youth and community workers | 13 |
| 32 Health and social care associate professionals | 3233 | Child and early years officers | 13 |
| 32 Health and social care associate professionals | 3234 | Housing officers | 13 |
| 32 Health and social care associate professionals | 3235 | Counsellors | 14 |
| 32 Health and social care associate professionals | 3239 | Welfare and housing associate professionals n.e.c. | 13 |
| 33 Protective service occupations | 3312 | Police officers (sergeant and below) | 13 |
| 33 Protective service occupations | 3314 | Prison service officers (below principal officer) | 16 |
| 33 Protective service occupations | 3315 | Police community support officers | 13 |
| 33 Protective service occupations | 3319 | Protective service associate professionals n.e.c. | 14 |
| 34 Culture, media and sports occupations | 3413 | Actors, entertainers and presenters | 13 |
| 34 Culture, media and sports occupations | 3443 | Fitness instructors | 13 |
| 35 Business and public service associate professionals | 3512 | Aircraft pilots and flight engineers | 14 |
| 41 Administrative occupations | 4123 | Bank and post office clerks | 13 |
| 41 Administrative occupations | 4129 | Financial administrative occupations n.e.c. | 13 |
| 41 Administrative occupations | 4135 | Library clerks and assistants | 14 |
| 42 Secretarial and related occupations | 4211 | Medical secretaries | 13 |
| 52 Skilled metal, electrical and electronic trades | 5231 | Vehicle technicians, mechanics and electricians | 13 |
| 52 Skilled metal, electrical and electronic trades | 5232 | Vehicle body builders and repairers | 13 |
| 54 Textiles, printing and other skilled trades | 5431 | Butchers | 14 |
| 54 Textiles, printing and other skilled trades | 5432 | Bakers and flour confectioners | 14 |
| 54 Textiles, printing and other skilled trades | 5433 | Fishmongers and poultry dressers | 14 |
| 54 Textiles, printing and other skilled trades | 5436 | Catering and bar managers | 13 |
| 54 Textiles, printing and other skilled trades | 5443 | Florists | 14 |
| 61 Caring personal service occupations | 6121 | Nursery nurses and assistants | 16 |
| 61 Caring personal service occupations | 6122 | Childminders and related occupations | 16 |
| 61 Caring personal service occupations | 6123 | Playworkers | 16 |
| 61 Caring personal service occupations | 6125 | Teaching assistants | 16 |
| 61 Caring personal service occupations | 6126 | Educational support assistants | 16 |
| 61 Caring personal service occupations | 6131 | Veterinary nurses | 13 |
| 61 Caring personal service occupations | 6141 | Nursing auxiliaries and assistants | 16 |
| 61 Caring personal service occupations | 6142 | Ambulance staff (excluding paramedics) | 14 |
| 61 Caring personal service occupations | 6143 | Dental nurses | 14 |
| 61 Caring personal service occupations | 6144 | Houseparents and residential wardens | 15 |
| 61 Caring personal service occupations | 6145 | Care workers and home carers | 14 |
| 61 Caring personal service occupations | 6146 | Senior care workers | 14 |
| 61 Caring personal service occupations | 6147 | Care escorts | 14 |
| 61 Caring personal service occupations | 6148 | Undertakers, mortuary and crematorium assistants | 13 |
| 62 Leisure, travel and related personal service occupations | 6211 | Sports and leisure assistants | 13 |
| 62 Leisure, travel and related personal service occupations | 6212 | Travel agents 14 | |
| 62 Leisure, travel and related personal service occupations | 6214 | Air travel assistants | 15 |
| 62 Leisure, travel and related personal service occupations | 6215 | Rail travel assistants | 14 |
| 62 Leisure, travel and related personal service occupations | 6219 | Leisure and travel service occupations n.e.c. | 13 |
| 62 Leisure, travel and related personal service occupations | 6221 | Hairdressers and barbers | 14 |
| 62 Leisure, travel and related personal service occupations | 6222 | Beauticians and related occupations | 14 |
| 62 Leisure, travel and related personal service occupations | 6232 | Caretakers | 14 |
| 62 Leisure, travel and related personal service occupations | 6240 | Cleaning and housekeeping managers and supervisors | 14 |
| 71 Sales occupations | 7111 | Sales and retail assistants | 14 |
| 71 Sales occupations | 7112 | Retail cashiers and check-out operators | 14 |
| 71 Sales occupations | 7114 | Pharmacy and other dispensing assistants | 14 |
| 71 Sales occupations | 7115 | Vehicle and parts salespersons and advisers | 14 |
| 71 Sales occupations | 7121 | Collector salespersons and credit agents | 13 |
| 71 Sales occupations | 7123 | Roundspersons and van salespersons | 13 |
| 71 Sales occupations | 7124 | Market and street traders and assistants | 13 |
| 71 Sales occupations | 7125 | Merchandisers and window dressers | 13 |
| 71 Sales occupations | 7129 | Sales related occupations n.e.c. | 13 |
| 71 Sales occupations | 7130 | Sales supervisors | 13 |
| 81 Process, plant and machine operatives | 8135 | Tyre, exhaust and windscreen fitters | 13 |
| 82 Transport and mobile machine drivers and operatives | 8213 | Bus and coach drivers | 15 |
| 82 Transport and mobile machine drivers and operatives | 8214 | Taxi and cab drivers and chauffeurs | 15 |
| 82 Transport and mobile machine drivers and operatives | 8215 | Driving instructors | 13 |
| 92 Elementary trades and related occupations | 9211 | Postal workers, mail sorters, messengers and couriers | 14 |
| 92 Elementary trades and related occupations | 9233 | Cleaners and domestics | 13 |
| 92 Elementary trades and related occupations | 9239 | Elementary cleaning occupations n.e.c. | 13 |
| 92 Elementary trades and related occupations | 9241 | Security guards and related occupations | 14 |
| 92 Elementary trades and related occupations | 9244 | School midday and crossing patrol occupations | 14 |
| 92 Elementary trades and related occupations | 9249 | Elementary security occupations n.e.c. | 14 |
| 92 Elementary trades and related occupations | 9251 | Shelf fillers | 15 |
| 92 Elementary trades and related occupations | 9259 | Elementary sales occupations n.e.c. | 13 |
| 92 Elementary trades and related occupations | 9271 | Hospital porters | 16 |
| 92 Elementary trades and related occupations | 9273 | Waiters and waitresses | 15 |
| 92 Elementary trades and related occupations | 9274 | Bar staff | 14 |
| 92 Elementary trades and related occupations | 9279 | Other elementary services occupations n.e.c. | 14 |
Bibliography
Aiano F., et al. Feasibility and acceptability of SARS-CoV-2 testing and surveillance in primary school children in England: Prospective, cross-sectional study. PLoS One. 2021 Aug 27;16(8):e0255517
Aiano F, McOwat K, Obi C et al. A cross-sectional national investigation of COVID-19 outbreaks in nurseries during rapid spread of the Alpha (B.1.1.7) variant of SARS-CoV-2 in England. BMC Public Health. 2022 22(1):1845. https://doi.org/10.1186/s12889-022-14228-z
Almagro M, Orane-Hutchinson A. JUE insight: the determinants of the differential exposure to COVID-19 in New York city and their evolution over time – J Urban Econ 2020; published online Oct 28.
Amdaoud M et al. Are regions equal in adversity? A spatial analysis of spread and dynamics of COVID 19 in Europe – The European Journal of Health Economics 2021.
Beale S et al. Occupation, work-related contact and SARS-CoV-2 anti-nucleocapsid serological status: findings from the Virus Watch prospective cohort study. OEM 2022, doi:10.1136/oemed-2021-107920
Beale S, Hoskins S, Byrne T, et al Differential Risk of SARS-CoV-2 Infection by Occupation. Evidence from Virus Watch J Occup Med Tox 2023a;18;5
Beale S, Yavlinsky A, Hoskins S et al. Between-occupation differences in work-related COVID-19 mitigation strategies over time: Analysis of the Virus Watch Cohort in England and Wales. Scand J Work Environ Health 2023b;49(5):350-362.
Boulos L, Curran JA, Gallant A et al. Effectiveness of face masks for reducing transmission of SARS-CoV-2: a rapid systematic review. Philos Trans A Math Phys Eng Sci. 2023 Oct 9;381(2257):20230133.
Bridgen JRE, Wei H, Whitfield C et al. Contact patterns of UK home delivery drivers and their use of protective measures during the COVID-19 pandemic: a cross-sectional study. Occup Environ Med 2023;80:333-38.
Carlsten C. et al., COVID‐19 as an occupational disease. Am J Ind Med. 2021;64:227–237.
CDC (Center for Disease Control). Long Covid Terms and definitions. Accessed 17.05.2024.
Ceban F, Kulzhabayeva D, Rodrigues NB et al. COVID-19 vaccination for the prevention and treatment of long COVID: A systematic review and meta-analysis. Brain Behav Immun. 2023;111:211-229.
Chazelet S, Pacault S. Efficiency of Community Face Coverings and Surgical Masks to Limit the Spread of Aerosol. Ann Work Expo Health. 2022;66(4):495-509.
Cherrie JW, Apsley A, Cowie H et al. Effectiveness of face masks used to protect Beijing residents against particulate air pollution. Occup Environ Med 2018;75:446-52.
Cherrie JW, Cherrie MPC, Smith A et al. Contamination of Air and Surfaces in Workplaces with SARS-CoV-2 Virus: A Systematic Review. Ann Work Expo Health 2021;65:879-92.
Cherrie M et al. Longitudinal changes in proportionate mortality due to COVID-19 by occupation in England and Wales. Scand J Work Environ Health 2022;48(8):611-620
Chaichana U, Man KKC, Chen A, et al. Definition of Post-COVID-19 Condition Among Published Research Studies. JAMA Netw Open. 2023 Apr 3;6(4):e235856
Davis, H.E, et al., Long COVID: major findings, mechanisms and recommendations. Nat Rev Microbiol, 2023. 21(3): p. 133-146.
Di Carlo P, Chiacchiaretta P, Sinjari B et al. Air and surface measurements of SARS-CoV-2 inside a bus during normal operation. PLOS ONE 2020;15:e0235943.
Dinoi A, Feltracco M, Chirizzi D et al. A review on measurements of SARS-CoV-2 genetic material in air in outdoor and indoor environments: Implication for airborne transmission. Sci Total Environ 2021;151137.
Eekhout I, van Tongeren M, Pearce N, Oude Hengel K. The impact of occupational exposures on infection rates during the COVID-19 pandemic: a test-negative design study with register data of 207034 Dutch workers. Scand J Work Environ Health. 2023;49(4):259–270. doi:10.5271
Elliott J et al. COVID 19 mortality in the UK Biobank cohort: revisiting and evaluating risk factors. European Journal of Epidemiology 2021) 36:299–309 https://doi.org/10.1007/s10654-021-00722-y
Fenton L, Gribben C, Caldwell D, et al. Risk of hospital admission with covid-19 among teachers compared with healthcare workers and other adults of working age in Scotland, March 2020 to July 2021: population based case-control study. BMJ. 2021;374:n2060.
Gartland N, Fishwick D, Coleman A. Transmission and control of SARS-CoV-2 on ground public transport: A rapid review of the literature up to May 2021. J Transp Health 2022;26:101356.
Gartland N, Coleman A, Fishwick D et al. Experiences, Perceptions of Risk, and Lasting Impacts of COVID-19 for Employees in the Public Transport Sector. Ann Work Expo Health 2023;67:76-86.
Gawn J, Clayton M, Makison C, Crook B. Evaluating the protection afforded by surgical masks against influenza bioaerosols. Gross protection of surgical masks compared to filtering facepiece respirators. HSE report RR619, 2008.
Glaser et al. UKHSA official statistics. Winter Coronavirus (covid-19) infection Study; estimates of epidemiological characteristics, 14 March 2024
Goldblatt P and Morrison J. Report of the Second Stage of a Study of London Bus Driver Mortality from COVID-19. UCL Institute of Health Equity, 2021
Graña C, Ghosn L, Evrenoglou T et al. Efficacy and safety of COVID-19 vaccines. Cochrane Database Syst Rev. 2022 Dec 7;12(12):CD015477
Green D, Zhou J, Desouza C. Transport For London SARS-CoV-2 RNA Sampling Study. Book Transport For London SARS-CoV-2 RNA Sampling Study, City 2021.
Green MA & Semple M. Occupational inequalities in the prevalence of COVID-19: A longitudinal observational study of England, August 2020 to January 2021. PLOS ONE 2023.
Hale T, Angrist N, Goldszmidt R et al. A global panel database of pandemic policies (Oxford COVID-19 Government Response Tracker). Nat Hum Behav 2021;5:529-38.
Hargreaves JR et al. Epidemiology of SARS-CoV-2 infection among staff and students in a cohort of English primary and secondary schools during 2020−2021. The Lancet Regional Health – Europe 2022;21: 100471 Published online xxx https://doi.org/10.1016/j. lanepe.2022.100471
Hiironen I, Saavedra-Campos M, Panitz J. Occupational exposures associated with being a COVID-19 case; evidence from three case-controls studies. medRxiv 2020.12.21.2024816
Hiironen I et al. (2022). Workplace exposures associated with COVID-19: evidence from a case-control study with multiple sampling periods in England, August–October 2020. Epidemiology and Infection 2022 150; e99, 1–10. https://doi.org/10.1017/S0950268822000863
Hwang, J.H., et al., Evaluation of viral infection as an etiology of ME/CFS: a systematic review and meta-analysis. J Transl Med, 2023. 21(1): p. 763
Ismail SA, Saliba V, Lopez Bernal J et al. SARS-CoV-2 infection and transmission in educational settings: a prospective, cross-sectional analysis of infection clusters and outbreaks in England. Lancet Infect Dis. 2021 Mar;21(3):344-353.
Jefferson T, Dooley L, Ferroni E et al. Physical interventions to interrupt or reduce the spread of respiratory viruses. Cochrane Database Syst Rev 2023;1:CD006207.
Jeffrey K, Woolford L, Maini R, Basetti S et al, Prevalence and risk factors for long COVID among adults in Scotland using electronic health records: a national, retrospective, observational cohort study. EClinicalMedicine. 2024 Apr 11:71:102590.
Jonker L, Linde KJ, de Boer AR et al. SARS-CoV-2 incidence in secondary schools; the role of national and school-initiated COVID-19 measures. BMC Public Health. 2023 Jun 27;23(1):1243. Krishnaratne S, Littlecott H, Sell K et al. Measures implemented in the school setting to contain the COVID-19 pandemic. Cochrane Database Syst Rev 2022;1:CD015029.
Kromydas T, Demou E, Edge R et al. Occupational differences in the prevalence and severity of long COVID: analysis of the Coronavirus (COVID-19) Infection Survey. Occup Environ Med 2023;0:1–8. doi:10.1136
Ladhani SN, Baawuah F, Beckmann J et al. SARS-CoV-2 infection and transmission in primary schools in England in June-December, 2020 (sKIDs): an active, prospective surveillance study. Lancet Child Adolesc Health. 2021 Jun;5(6):417-427.
Li X, Zhang T, Fan M, Liu M, et al. Experimental evaluation of particle exposure at different seats in a single-aisle aircraft cabin. Building and Environment 2021.
Liew, F., et al., Large-scale phenotyping of patients with long COVID post-hospitalization reveals mechanistic subtypes of disease. Nat Immunol, 2024. 25(4): p. 607-621.
Matz M, Allemani C, van Tongeren M. Excess mortality among essential workers in England and Wales during the COVID-19 pandemic. J Epidemiol Community Health 2022;76(7):660-666. Matz M, Rhodes S, Tongeren MV et al. Excess mortality among essential workers in England and Wales during the COVID-19 pandemic: an updated analysis. J Epidemiol Community Health. 2023;77(8):481-484. McGregor, G., et al., Clinical effectiveness of an online supervised group physical and mental health rehabilitation programme for adults with post-covid-19 condition (REGAIN study): multicentre randomised controlled trial. BMJ, 2024. 384: p. e076506.
Morawska L, Tang JW, Bahnfleth W et al. How can airborne transmission of COVID-19 indoors be minimised? Environ Int 2020;142:105832.
Moreno T, Pintó RM, Bosch A et al. Tracing surface and airborne SARS-CoV-2 RNA inside public buses and subway trains. Environ Int. 2021 Feb;147:106326.
Mutambudzi M, Niedwiedz C, Macdonald EB, et al Occupation and risk of severe COVID-19: prospective cohort study of 120 075 UK Biobank participants Occup Environ Med 2020 0:1–8. doi:10.1136/oemed-2020-106731.
Nafilyan V, Dolby T, Finning K et al. Differences in COVID-19 vaccination coverage by occupation in England: a national linked data study. Occup Environ Med 2022;79:758–766. doi:10.1136
Nafilyan V, Pawelek P, Ayoubkhani D et al. Occupation and COVID-19 mortality in England: a national linked data study of 14.3 million adults. Occup Environ Med. 2021 Dec 27:oemed-2021-107818.
National Center for Health Statistics, Long COVID, Household Pulse Survey.
Nguipdop-Djomo P, Oswald WE, Halliday KE et al. COVID-19 Schools Infection Survey Study Group. Risk factors for SARS-CoV-2 infection in primary and secondary school students and staff in England in the 2020/2021 school year: a longitudinal study. Int J Infect Dis. 2023;128:230-243.
NICE (National Institute for Clincal Excellence), Long term effects of coronavirus (long COVID). Clinical knowledge summaries (CKS), Oct 2022.
O’Mahoney, L.L., et al., The prevalence and long-term health effects of Long Covid among hospitalised and non-hospitalised populations: A systematic review and meta-analysis. EClinicalMedicine, 2023. 55: p. 101762.
ONS 2020a. Coronavirus and key workers in the UK 2019. Office of National Statistics, 15 May 2020.
ONS 2020b Office for National Statistics. Coronavirus (COVID-19) related deaths by occupation, England and Wales: deaths registered between 9 March and 28 December 2020. (Release date 25 January 2021).
ONS 2021 Coronavirus (COVID-19) Infection Survey: characteristics of people testing positive for COVID-19 in England, 22 February 2021.
ONS 2022 Prevalence of ongoing symptoms following coronavirus (COVID-19) infection in the UK: 3 March 2022
Oude Hengel KM, Burdorf A, Pronk A, et al. Exposure to a SARS-CoV-2 infection at work: development of an international job exposure matrix (COVID-19-JEM). Scand J Work Environ Health 2022;48:61-70.
Pan D, Pareek M. Toward a Universal Definition of Post-COVID-19 Condition-How Do We Proceed? JAMA Netw Open. 2023 Apr 3;6(4): e235779
Pattaro S, Bailey N, Dibben C. Occupational differences in COVID-19 hospital admission and mortality risks between women and men in Scotland: a population-based study using linked administrative data. medRxiv 2024.01.25.24301783. doi:10.1136/jech-2022-219101
Pizarro AB, Persad E, Durao S et al. Workplace interventions to reduce the risk of SARS-CoV-2 infection outside of healthcare settings. Cochrane Database Syst Rev 2022;5:CD015112.
Rhodes S, Wilkinson J, Pearce N et al. Occupational differences in SARS-CoV-2 infection: analysis of the UK ONS COVID-19 infection survey J Epid Comm Hlth 2022;0:1–6. doi:10.1136.
Rhodes S, Beale S, Wilkinson et al. Exploring the relationship between job characteristics and infection: Application of a COVID-19 job exposure matrix to SARS-CoV-2 infection data in the United Kingdom. Scand J Work Environ Health 2023;49(3):171-181
Rhodes S, Demou E, Wilkinson J et al. Potential contribution of vaccination uptake to occupational differences to risk of SARS-CoV-2: analysis of the ONS COVID-19 infection Survey. Occup Environ Med 2024;81:34–39.
Riley S, Eales O, Haw D et al. Doi: REACT-1 round 13 interim report: acceleration of SARS-CoV-2 Delta epidemic in the community in England during late June and early July 2021. MedRxiv 2021.07.08.21260185.
Roberts N, Danechi S. Coronavirus and schools. Book Coronavirus and schools, City. 2022
Sanchiz A, Martin R, Del Val M, et al. MPXV and SARS-CoV-2 in the air of nightclubs in Spain. Lancet Microbe 2023;4:e389.
Soriano, J.B., et al., A clinical case definition of post-COVID-19 condition by a Delphi consensus. Lancet Infect Dis, 2022. 22(4): p. e102-e107.
Spengler JD, Wilson DG. Air quality in aircraft. Proceedings of the Institution of Mechanical Engineers, Part E: J Process Mechanical Engineering 2003;217:323-36.
Steinle S, Sleeuwenhoek A, Mueller W et al. The effectiveness of respiratory protection worn by communities to protect from volcanic ash inhalation. Part II: Total inward leakage tests. Int J Hyg Environ Health 2018;221:977-84. Stokel-Walker C. What do we know about covid vaccines and preventing transmission? BMJ. 2022 4;376:o298. Thaweethai, T., et al., Development of a Definition of Postacute Sequelae of SARS-CoV-2 Infection. Jama, 2023. 329(22): p. 1934-1946.
Thomas F, Fedeli A, Steggall E, et al. SARS-CoV-2 incidence among teaching staff in primary and secondary schools-Wales, 2020-2021. BMC Public Health 2023;19;23(1):922 van der Feltz S, Peters S, Pronk A, et al. Validation of a COVID-19 Job Exposure Matrix (COVID-19-JEM) for Occupational Risk of a SARS-CoV-2 Infection at Work: Using Data of Dutch Workers. Ann Work Expo Health 2023(a);67:9-20.
van der Feltz S, Schlünssen V, Basinas I et al. Associations between an international COVID-19 job exposure matrix and SARS-CoV-2 infection among 2 million workers in Denmark. Scand J Work Environ Health 2023(b);49(6):375-385 https://doi.org/10.5271
Vitrano C. COVID-19 and Public Transport. A Review of the International Academic Literature. K2 WORKING PAPER 2021:1. Book COVID-19 and Public Transport. A Review of the International Academic Literature. K2 WORKING PAPER 2021:1, City. 2021.
Vivaldi, G., et al., Long-term symptom profiles after COVID-19 vs other acute respiratory infections: an analysis of data from the COVIDENCE UK study. EClinicalMedicine, 2023. 65: p. 102251.
Ward, H., Atchison, C., Whitaker, M. et al. SARS-CoV-2 antibody prevalence in England following the first peak of the pandemic. Nat Commun 12, 905 (2021). Watanabe A, Iwagami M, Yasuhara J, Takagi H, Kuno T. Protective effect of COVID-19 vaccination against long COVID syndrome: A systematic review and meta-analysis. Vaccine. 2023 10;41(11):1783-1790. Wong, T.L. and D.J. Weitzer, Long COVID and Myalgic Encephalomyelitis/Chronic Fatigue Syndrome (ME/CFS)-A Systemic Review and Comparison of Clinical Presentation and Symptomatology. Medicina (Kaunas), 2021. 57(5).
Yang J, Markus K, Andersen KM, et al. Definition and measurement of post-COVID-19 conditions in real-world practice: a global systematic literature review. BMJ Open. 2024 Jan 17;14(1):e077886.
Zuniga-Montanez R, Coil DA, Eisen JA, et al. The challenge of SARS-CoV-2 environmental monitoring in schools using floors and portable HEPA filtration units: Fresh or relic RNA? PLOS ONE 2022;17:e0267212.
-
See https://www.cps.gov.uk/legal-guidance/coronavirus-health-protection-coronavirus-wearing-face-coverings-public-transport ↩
-
See https://assets.publishing.service.gov.uk/government/uploads/system/uploads/attachment_data/file/1142810/COVID-19-transport-use-statistics.ods ↩
-
ONS. COVID-19 Infection Survey dataset of 01 12 2021 accessed on 04 03 2024 at: https://www.ons.gov.uk/file?uri=/peoplepopulationandcommunity/healthandsocialcare/conditionsanddiseases/datasets/coronaviruscovid19infectionsinthecommunityinengland/1december2021/covid19infectionsurveydatasets202112011.xlsx ↩
-
Death rates were not calculated by ONS where numbers of deaths involving COVID-19 were less than 10; deaths from all SOC codes relating to air and rail transport and for women in all travel related codes were less than 10. ↩
-
See https://www.nrscotland.gov.uk/statistics-and-data/statistics/statistics-by-theme/vital-events/general-publications/deaths-involving-coronavirus-covid-19-in-scotland/archive ↩
-
Death rates were not calculated by ONS where numbers of deaths involving COVID-19 were less than 10; deaths were less than 10 for both men and women for: special needs education teaching professionals (SOC code 2316); education advisers and schools inspectors (SOC code 2318); teaching and other educational professionals n.e.c (SOC code 2319); playworkers (SOC code 6123); educational support assistants (SOC code 6126). ↩
-
See https://www.england.nhs.uk/statistics/statistical-work-areas/covid-19-post-covid-assessment-service/ ↩