COVID-19 and Occupational Impacts
Published 16 November 2022

© Crown copyright 2022
This publication is licensed under the terms of the Open Government Licence v3.0 except where otherwise stated. To view this licence, visit nationalarchives.gov.uk/doc/open-government-licence/version/3 or write to the Information Policy Team, The National Archives, Kew, London TW9 4DU, or email: psi@nationalarchives.gov.uk.
Where we have identified any third party copyright information you will need to obtain permission from the copyright holders concerned.
This publication is available at https://www.gov.uk/government/publications/covid-19-and-occupational-impacts/covid-19-and-occupational-impacts
Presented to Parliament by the Secretary of State for Work and Pensions by Command of His Majesty
November 2022
This publication is licensed under the terms of the Open Government Licence v3.0 except where otherwise stated. To view this licence, visit nationalarchives.gov.uk/doc/open-government-licence/version/3.
Where we have identified any third party copyright information you will need to obtain permission from the copyright holders concerned.
This publication is available at www.gov.uk/official-documents.
Any enquiries regarding this publication should be sent to us at iiac@dwp.gov.uk.
ISBN 978-1-5286-3552-3
E02822108 11/22
Industrial Injuries Advisory Council
Dr Lesley Rushton, OBE, BA, MSc, PhD, Hon FFOM, (Chair)
Professor Raymond Agius, MD, DM, FRCP, FRCPE, FFOM
Professor Kim Burton, OBE, PhD, Hon FFOM
Professor John Cherrie, CFFOH
Mr Keith Corkan, BA
Ms Lesley Francois
Dr Max Henderson, MSc, PhD, MRCP, MRCPsych, Hon FFOM
Dr Jennifer Hoyle, MRCP Edin, FRCP
Dr Ian Lawson, MB, BS, FFOM, FRCP
Professor Damien McElvenny BSc MSc CStat CSci
Ms Karen Mitchell, LLB
Mr Douglas Russell, BSc (Hons), MSc, CMIOSH
Mr Daniel Shears, BA (Hons)
Dr Chris Stenton, BSc, MB, BCh, BAO, FRCP, FFOM, FFOM.RCPI
Dr Gareth Walters, MD, FRCP, FHEMA
Dr A White, BSc (Hons), PhD, CMIOSH, AIEMA
Former Council Members
Dr Sayeed Khan, BMedSci, FFOM, FRCGP, FRCP, DM
Professor Neil Pearce, BSc, DipSci, DipORS, PhD, DSc
Professor Karen Walker-Bone, BM, FRCP, PhD, Hon FFOM
HSE Observer
Ms L Darnton
IIAC Secretariat
Secretary: Mr S Whitney
Scientific Adviser: Mr I Chetland
Administrative Secretary: Ms C Hegarty
COVID-19 and Occupational Impacts
Dear Secretary of State,
Since the start of the pandemic of Coronavirus Disease 2019 (COVID-19) in 2020 the Industrial Injuries Advisory Council (IIAC) has been continually reviewing and assessing the rapidly accruing scientific evidence on the occupational risks of COVID-19. An interim Position Paper (COVID-19 and occupation: IIAC position paper 48) was published in February 2021 based on information available in 2020.
There was good data on mortality from COVID-19 but scarce information on longerterm health problems and disability arising from these. There have now been very many more scientific reports on the symptoms, illnesses, and pathology associated with COVID-19, and on occupational exposure to the virus, SARS-CoV-2, that causes the disease. The UK, like many countries, has experienced several waves of increasing and decreasing rates of infection, implementation of a variety of control measures and changing patterns of work. This complex situation presents challenges when evaluating adverse health effects of COVID-19 that can be attributed to exposure to the virus in the workplace.
This Command paper documents the detailed and extensive evaluation of the evidence and sets out how the Council has arrived at its conclusions. The Council has identified that there is a large body of consistent supporting evidence showing that, for Health and Social Care Workers, whose work brings them into frequent close proximity to patients or clients, there is a significantly increased risk of infection, subsequent illness, and death. The Council therefore feels that there is sufficient evidence to recommend prescription for these workers.
Although there is some evidence of increased risk of infection and mortality in some other occupations there are fewer studies and findings tend to be less consistent. At this current time IIAC has therefore concluded that the evidence is not of sufficient quantity and quality to recommend prescription for these occupations.
Although most people infected with SARS-CoV-2 experience relatively mild or shortterm symptoms, a small proportion report longer-term symptoms that lead to persisting loss of function and disability. The Council has identified robust evidence for the prescription of five serious pathological complications following COVID-19 that have been shown to cause persistent impairment and loss of function in some people. These are: Persisting pneumonitis or lung fibrosis following acute COVID-19 pneumonitis; Persisting pulmonary hypertension caused by a pulmonary embolism developing between 3 days before and 90 days after a diagnosis of COVID-19; Ischaemic stroke developing within 28 days of a COVID-19 diagnosis; Myocardial infarction developing within 28 days of a COVID-19 diagnosis; Symptoms of Post Intensive Care Syndrome following ventilatory support treatment for COVID-19.
There is also an increasing literature reporting one or more of a wide range of persisting symptoms following COVID-19 (described as Post-COVID syndrome or Long Covid), which may impact on daily activities including ability to work. Currently, however, there is limited understanding of the underlying pathophysiology, temporal course, and predictable effects of the key symptoms of Post-COVID syndrome and a lack of objective diagnostic methods. IIAC therefore considered that the evidence is not, at present, sufficient to recommend prescription for this syndrome.
The pandemic remains on-going and the Council will thus continue to collate and evaluate further evidence, particularly for other occupations and also on the longerterm effects of COVID-19 with the expectation of producing a third report in the future
Yours sincerely
Dr Lesley Rushton
Chair, Industrial Injuries Advisory Council
Summary
The pandemic of Coronavirus Disease 2019 (COVID-19) caused by infection with severe acute respiratory syndrome coronavirus 2 (SARS-CoV-2) began early in 2020 in the UK. Since then, the Industrial Injuries Advisory Council (IIAC) has been continually reviewing the accruing scientific evidence on the occupational risks of COVID-19. An interim Position Paper (COVID-19 and occupation: IIAC position paper 48) was published in February 2021 based on information available in 2020, most of which reported on death following infection. An association between several occupations and death related to COVID-19 was found, which included the health and social care sectors, transport, food processing, retail work, security, and local and national administration sectors. However, at that time there was little information on longer term effects and subsequent potential disability.
Since then, there have been very many more scientific reports on the symptoms, illnesses, and pathology associated with COVID-19, and on occupational exposure to SARS-CoV-2.
Although most people infected with SARS-CoV-2 experience relatively mild or shortterm symptoms, a small proportion report longer-term symptoms that lead to persisting loss of function and disability.
Any prescription for a disease under Industrial Injuries Disablement Benefit (IIDB) must be based on robust evidence such that it is possible to assume with reasonable certainty (the balance of probabilities) that the condition was acquired as a result of work. The complex patterns of occupational and non-occupational infection and control measures that occurred during the pandemic in the UK has made it challenging to evaluate the health consequences that can be attributed to work exposure. Also, the quality and quantity of available evidence relating to occupation is very variable.
Since any disabling effects from COVID-19 depend on an initial infection with the virus, the key question for the Council was whether there was robust evidence that, for any given occupation, the risk of infection was more likely than not to have been caused by work. Questions around subsequent illness and disabling consequences were addressed in logical sequence.
There is a large body of consistent supporting evidence showing that, for Health and Social Care Workers, whose work brings them into frequent close proximity to patients or clients, there is a significantly increased risk of infection, subsequent illness, and death. The Council therefore feels that there is sufficient evidence to recommend prescription for these workers.
There are far fewer studies for other occupational sectors with less consistent findings. While the Council noted some evidence of increased risk of infection and mortality in occupations such as bus and taxi drivers and in protective services, the evidence was not robust. In other sectors, such as education and retail, the evidence for any increased risk was much weaker, with inconsistent results over different time periods. The Council concluded, therefore, that currently, the evidence was of insufficient quantity and quality to recommend prescription for these occupations.
In order to recommend prescription, IIAC requires clearly defined disease entities with measurable diagnostics and a measurable loss of faculty/function that is likely to lead to one or more disabilities. Taking account of these criteria, the Council has identified robust evidence for the prescription of five serious pathological complications following COVID-19 that have been shown to cause persistent impairment and loss of function in some people:
1. Persistent pneumonitis or lung fibrosis following acute COVID-19 pneumonitis;
2. Persisting pulmonary hypertension following a pulmonary embolism;
3. Ischaemic stroke;
4. Myocardial infarction;
5. Symptoms of Post Intensive Care Syndrome following ventilatory support treatment for COVID-19.
The Council acknowledges that some people may report one or more of a wide range of persisting symptoms following COVID-19 (described as Post-COVID syndrome or Long Covid), which may impact on their daily activities including their work ability. However, current understanding of the underlying pathophysiology, temporal course, and predictable effects of the key symptoms of Post-COVID syndrome is limited, as is the ability to diagnose the condition objectively. IIAC therefore considered that the evidence is not, at present, sufficient to recommend prescription for this syndrome.
It is widely acknowledged that the pandemic is ongoing and it can be expected that more and better evidence on the long-term adverse health consequences of COVID-19, and on the association with occupational exposure, will emerge. The Council will thus continue to monitor the scientific literature and reported data. Indeed, the Council is aware of several ongoing studies, including analyses of death and infection data for 2021 and 2022, along with data on workplace infection outbreaks in the UK that should be published in the near future. IIAC thus expects to carry out a further review.
Introduction
1. December 2019 saw the start of a pandemic of Coronavirus Disease 2019 (COVID-19) caused by infection with severe acute respiratory syndrome coronavirus 2 (SARS-CoV-2). The first case of COVID-19 documented in the UK was on 31 January 2020 and the UK has since experienced several major waves of infection.
2. In April 2020 the Industrial Injuries Advisory Council (IIAC) began to collect, collate, and review the evidence linking occupation to the risk of COVID-19 during 2020. An interim Position Paper (COVID-19 and occupation: IIAC position paper 48) was published in February 2021 which focussed mainly on mortality data from March to December 2020, but also included available evidence on risks of infection. The Council found evidence at that time of a clear association between several occupations and death from COVID-19, including within the health and social care sectors, transport, food processing, retail work, security and local and national administration sectors. However, the Council acknowledged that the inconsistency and limited extent of the mortality data, and the lack of adjustment for factors such as deprivation, meant that the evidence was too limited in quality and quantity to justify prescription at that stage.
3. A similar lack of data prevented the Council from evaluating morbidity associated with infection from SARS-CoV-2. However, the Council acknowledged that it was likely to cause a substantial health burden and potential long-term disability. In addition, the (limited) evidence of a doubling of risk in several occupations indicated a pathway to potential prescription in future.
4. Since the publication of Position Paper 48, there has been a large number of additional scientific publications and reports on both mortality and morbidity from COVID-19 and occupational exposure to SARS-CoV-2. There has also been a substantial literature on the complications of COVID-19 and on the development of Post-COVID syndrome (popularly termed ‘Long-covid’). As COVID-19 requires exposure to SARS-CoV-2, this second IIAC report intends to build up a picture, starting with what is known about transmission pathways and exposure mechanisms, moving on to the theoretical risks of infection through knowledge of job characteristics. Sections covering the evidence on infection and disease among people in various jobs/occupations are then presented followed by a discussion of the evidence around post-COVID complications and subsequent disabling consequences. By definition, a report on Post-COVID-19 syndrome involves survivors, but mortality data have been included where they are relevant to understanding the risk of occupational infection. To help orient the reader in what is a complex report, each main section concludes with a short summary.
5. It should be noted that at the time of writing (first quarter 2022) there was a large wave of infections occurring with high numbers of hospitalisations and between 800-2000 deaths on average a week. IIAC therefore expects to be identifying and collating evidence from studies and reports appearing after this current report and anticipates the production of a third report at some time in the future and which may make further recommendations in respect of occupations at risk and/or adverse health outcomes.
The Industrial Injuries Disablement Benefit Scheme
6. The IIDB Scheme provides non-contributory, ‘no-fault’ benefits for disablement because of accidents or prescribed diseases which arise during the course of employed earners’ work. The benefit is paid in addition to other incapacity and disability benefits. It is tax-free and administered by the Department for Work and Pensions.
7. The legal requirements for prescription are set out in The Social Security Contributions and Benefits Act 1992 which states that the Secretary of State may prescribe a disease where they are satisfied that the disease ought to be treated, having regard to its causes and incidence and any other relevant considerations, as a risk of the occupation and not as a risk common to all persons; and is such that, in the absence of special circumstances, the attribution of particular cases to the nature of the employment can be established or presumed with reasonable certainty.
8. Thus, a disease may only be prescribed if there is a recognised risk to workers in an occupation and the link between disease and occupation can be established or reasonably presumed in individual cases.
The Role of the Industrial Injuries Advisory Council
9. IIAC is an independent statutory body established by an Act of Parliament in 1946 to advise the Secretary of State for Social Security on matters relating to the IIDB scheme. A major part of the Council’s time is spent considering whether the list of prescribed diseases for which benefit may be paid should be enlarged or amended.
10. In considering the question of prescription the Council searches for a practical way to demonstrate in the individual case that the disease can be attributed to occupational exposure with reasonable certainty; for this purpose, ‘reasonable certainty’ is interpreted as being based on the balance of probabilities.
11. Some occupational diseases are relatively simple to verify, as the link with occupation is clear-cut. Some only occur due to particular work or are almost always associated with work or have specific medical tests that prove their link with work, or have a rapid link to exposure, or other clinical features that make it easy to confirm the work connection. However, many other diseases are not uniquely occupational, and when caused by occupation, are indistinguishable from the same disease occurring in someone who has not been exposed to a hazard at work. In these circumstances, attribution to occupation depends on research evidence that work in the prescribed job or with the prescribed occupational exposures causes the disease on the balance of probabilities.
12. The health effects arising from workplace exposure to SARS-CoV-2 cannot be distinguished from infection transmitted in non-occupational circumstances, so the case for prescription rests on having robust research evidence on the causal probabilities. Where there is robust epidemiological data, the Council therefore looks for evidence that the risk of developing the disease associated with occupation is more than doubled (previous reports of the Council explain why this threshold was chosen). The conclusions in this report are generally based on this type of evidence and the doubling of risk test is being applied. However, in circumstances where there are limited epidemiological studies of long-term disabling disease with good quality occupational information, the Council will consider the totality of all available qualitative and quantitative evidence on exposure, transmission pathways, risk and disease outcomes and use an evidence synthesis approach to evaluate the strength and consistency of the information in making a judgement based on the balance of probabilities.
13. For most individuals COVID-19 is a self-limiting illness but a minority experience persisting symptoms after infection. Current estimates indicate that the death rate for adult infections is about 1% but that many times this number may experience prolonged symptoms following recovery from acute illness and lasting some months.
These can be a consequence of complications of the acute illness such as pulmonary thromboembolism, or the less clearly understood sequelae that are generally referred to under the umbrella terms ‘Post-COVID-19 syndrome’ or ‘Long-covid’. In both situations symptoms may improve over the course of several weeks or months but in some cases, they may result in persisting or even permanent impairment, loss of function and disability.
14. During 2020 and 2021, the UK like many other countries, experienced varying patterns of population infection rates and consequently varying restrictions on movement, closure of schools, shops and other venues and changes to working patterns. There were several variants of SARS-CoV-2 during the 2 years and substantial changes to detection and treatment, including the introduction of population vaccination programmes. This complex situation has presented IIAC with challenges when interpreting the large amount of data collected and reports and papers published.
Patterns of Infection and Risk Reduction Measures During the COVID-19
Pandemic in the UK.
15. From March 2020 to the end of 2021, the UK experienced several periods of increasing and decreasing infection rates (waves) of SARS-CoV-2. This was influenced by the emergence of several variants of the virus, in particular alpha in September 2020, delta in December 2020, gamma in February 2021 and more recently, omicron in autumn 2021. Throughout this period there were a wide range of risk reduction measures put in place. National lockdowns (late March 2020 - June 2020, January 2021 – July 2021) and local lockdowns (tiers) (September 2020 – November 2020) restricted gatherings and movements of all but essential workers, closure of all hospitality venues and non-essential shops, closed schools and encouraged working from home (Brown & Kirk-Wade 2021). Between these lockdowns, restrictions were gradually lifted sometimes nationally and sometimes at a local level; the city of Leicester, for example, was under some form of restriction for most of the period. Testing for SARS-CoV-2 was only generally available for healthcare workers for the first few months of the pandemic in the UK but became more widely available later in 2020. Vaccination was again only available for health and social care workers together with older and more vulnerable adults at the end of 2020; the general community vaccination programme got underway throughout 2021. This complex situation presents challenges when interpreting the large amount of data collected and reports and papers published. Figures 1a and 1b show deaths and cases respectively, attributed to COVID-19 in the UK from 2020 together with information on restrictions throughout the period.
Figure 1a: Daily count of UK deaths[footnote 1]
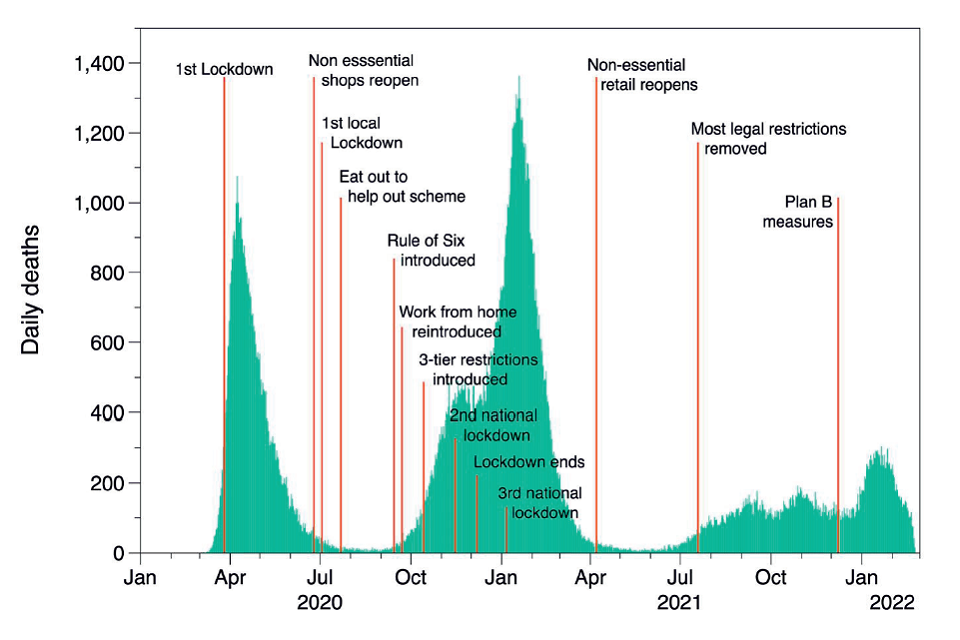
Daily count of UK deaths
Figure 1b: Daily count of UK cases.
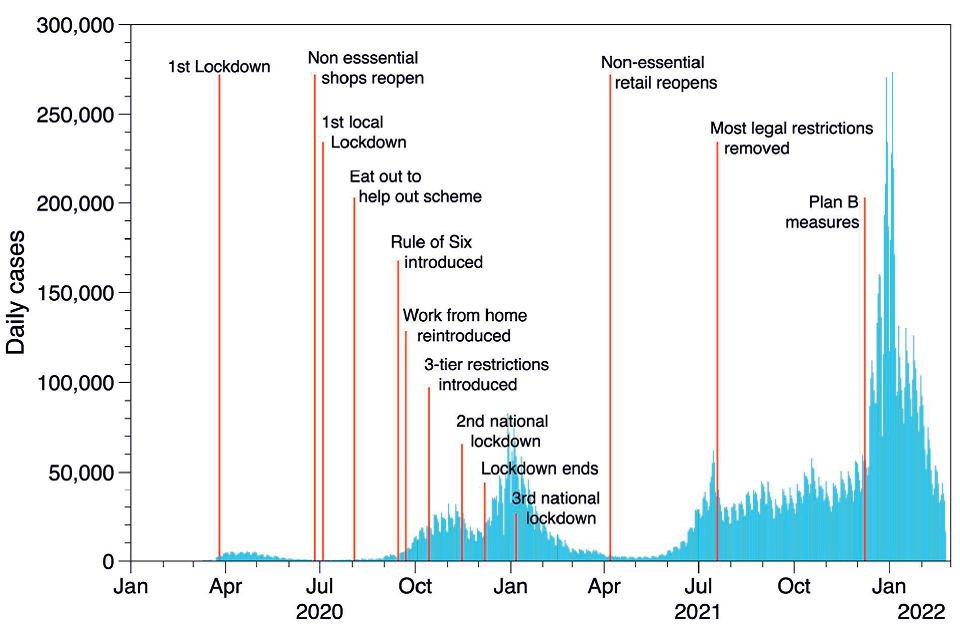
Daily count of UK cases
Transmission of and Exposure to SARS-CoV-2
Transmission Pathways
16. Modes of transmission of SARS-CoV-2 are becoming better understood. In common with other respiratory infections, the transmission route involves transfer of the virus from an infected person to the recipient, predominantly through the respiratory tract. At the start of the pandemic the prevailing authoritative opinion stressed the potential risk from contact with contaminated surfaces (fomites), and inhalation of relatively large infective droplets. More recent evidence suggests that transmission from surfaces is less important and that droplet transmission is feasible only when individuals are in close proximity (SAGE-EMG, 2020a). The main route is airborne transmission through inhalation of aerosols (very fine particles suspended in air), which can be transmitted indoors over distances of several metres (Meyerowitz et al,. 2021; Stadnytskyi et al., 2021). Breathing, talking and singing result in the emission of fine aerosol, with higher vocalisation volumes substantially increasing the amount of aerosol emitted; coughing emits similar amounts of fine aerosol to loud speaking or singing (Gregson et al., 2021). The interconnection of the different routes is illustrated in Figure 2.
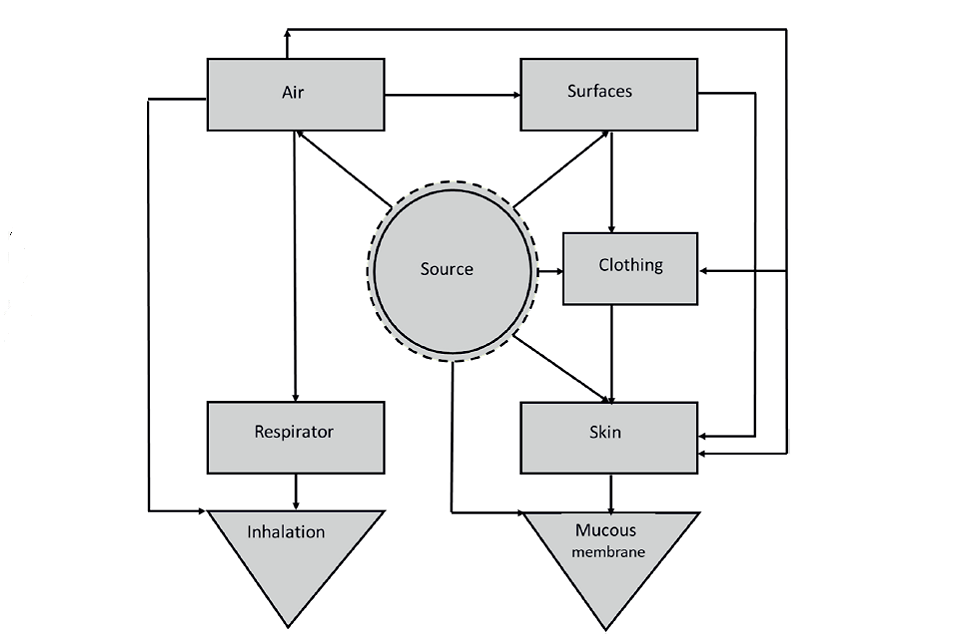
Pathway receptor model for transmission of SARS-CoV-2
Figure 2: A source, pathway receptor model for transmission of SARS-CoV-2 (Williams et al, 2021)
17. It is difficult to determine the relative contribution of each of these transmission pathways and it is possible that the contribution of each may vary depending on the exposure setting or environment and the activities undertaken by people (SAGE, 2020). In general terms, the risk of viral infection depends on the level of exposure which, in turn, depends on the number, frequency, duration and proximity of infection sources (both social and occupational). In addition, environmental factors such as temperature, humidity and exposure to sunlight are relevant: e.g., the virus survives longer outside the body in cold dry environments (Dabisch et al., 2020, Chi et al., 2021).
18. The ONS has created an estimate of exposure to generic infectious disease, and physical proximity to others, for UK occupations based on US analysis of these factors. Occupations involving both regular exposure to infected individuals plus close contact with people will have higher risk of transmission, while those with close proximity yet lower exposure to disease will have lower risk. For example, health and social care workers who have a greater chance of being near to infected people will be at greater risk than someone working from home.
Exposure Environments
19. Several different environments or settings have been linked with SARS-CoV-2 transmission, including the home, transportation, social environments and 15 workplaces, with the home being the dominant source of infection (Anderson et al., 2020). High risks of infection have been associated with crowded poorly ventilated indoor spaces (HSE, 2021), particularly where activities promote increased emission of virus contaminated aerosol, e.g., singing, or situations where face masks are not worn (SAGE, 2020). Frequent and prolonged contact with an infected individual is also linked to increased transmission (SAGE, 2020) – by principle, the risk will be higher when the environment has greater numbers of infected people (e.g., in health and social care). These factors may be behind many of the reported workplace clusters of COVID-19 cases, although the role of shared transport or shared accommodation often confounds the interpretation (ECDC, 2020).
20. As described above, cold environments with dry air maintain the viability of the virus longer than in the environments typically found in homes or workplaces. This suggests that workers in cold workplaces, such as food processing plants, may be at greater risk of COVID-19 infection than workers in otherwise similar workplaces. Additionally, it is common in food processing plants that workers are closer together than in many other workplaces, and the HSE (2021) also noted that workers in meat processing plants use high pressure water hoses to clean surfaces and this may create a risk of inhaling fine water droplets containing the virus.
21. SAGE-EMG (2021) noted that outbreaks among staff in prisons occurred despite control measures that typically included restrictions on prisoner mixing, isolation of new arrivals and others who may be infected, confining prisoners to their cells for up to 23 hours a day and stopping visitors. The environment in prison may predispose the spread of infection because of the high population density, high turnover of prisoners, sharing of facilities and accommodation, and poor ventilation.
22. Public transport and transportation of workers is a recognised transmission environment (SAGE-EMG 2020b). The risk is attributed to potential close contact with infected individuals, aerosol transmission because of poor ventilation, and possibly fomite transmission via handles and other hard surfaces. Gartland et al., (2021) reviewed the information on transmission and control of the virus on public transport. They showed there was evidence for SARS-CoV-2 viral RNA being present on transport and possibly resulting in infection, but the relative contribution of transmission routes could not be assessed. Similarly, while the use of face masks, improved ventilation and social distancing would reduce risk of transmission the effectiveness of each of these measures on public transport could not be determined.
23. Physical proximity to infected people goes beyond public- or patient-facing environments and can involve proximity to infected work colleagues (who may be asymptomatic). A risk of transmission is present in jobs where colleagues gathering in groups is an integral part of the job. As well as the example above of meat processors, some jobs entail the use of shared spaces within the workplace for rest and refreshments, such as train, taxi and bus drivers resting between journeys, or health professionals sharing changing facilities (Ochoa-Leite et al., 2021; Emecen et al., 2021). It follows, then, that solo jobs, such as HGV driving, will carry less risk in this respect. Similarly, working outdoors should, in principle, limit transmission of 16 SARS-CoV-2 because of good ventilation and (probably) greater distance between people, yet that will depend on the relative amount of worktime outdoors and congregating indoors with colleagues.
24. Across the time course of the pandemic, there have been varying levels of hybrid working whereby people alternated between working at home and working in the workplace (where there will be a variable number of people with whom they have physical proximity with others under varying environmental conditions). Thus, the level of exposure and potential for transmission will likely have varied across time in any given workplace, job or sector.
Individual Behaviour and Transmission Risks
25. Transmission of the virus is dependent on the behaviour of individuals, whether that is complying with appropriate social distancing rules, wearing face coverings, or using other intervention measures. For instance, some work environments may entail or encourage behaviours that increase risk while others inherently control it. Some employers may provide better exposure controls than others both for their workers and for the public. Some people may choose to adopt risky behaviours dictated by personality, culture, or their inherent beliefs. In addition, typical human behaviours such as habitual face touching provides a possible route for transmission of the virus from fomites to the mucous membranes, while the tendency for kissing/hugging on greeting provides an even more direct route to infection.
26. Reports[footnote 2] indicate that, overall, younger people are considerably less likely to adhere to guidance on reducing exposure (attendance at parties, refusal to wear face covering and the like), perhaps because they are persuaded that they are unlikely to become ill or die if infected. Media attention has been given to high profile individuals displaying behaviours likely to increase transmission, as well as highlighting groups that choose to gather in close proximity, whether through cultural, political or social needs. Such examples serve to emphasise that behaviours outside the workplace can impact on the potential for exposure to infected people within the workplace, as well as increasing the risk of exposure for more vulnerable people in other environments such as transport and households.
27. The drivers of health behaviour are known to be complex. Brown et al., (2021) discuss how risk perception can influence individual health behaviours and note that behaviour can be inappropriate when there are inconsistencies between actual and perceived risk. In a UK national survey, they found that while threat to life was the most consistent predictor of reported adherence to measures designed to prevent infection, for some people a perception that the risk was uncontrollable (which had increased during the pandemic) led to lower adherence – this was also associated with lower adherence to Government advice on physical activity and smoking.
28. Even among healthcare workers, adherence to ‘safe’ behaviours is not guaranteed. Houghton et al., (2020) found that healthcare workers point to several factors (including culture, training, and trust) which influence their ability and willingness to follow guidelines when managing respiratory infectious diseases: they followed guidance more closely when they saw its value (e.g., reducing the risk of infecting themselves and their families).
29. Changing individual as well as group behaviour is a crucial aspect of reducing exposure, and thus infections, in the community as well as the workplace. Yet, there remains a need for further evidence on just which behaviour change approaches are most effective for the various population groups and environments involved (West et al., 2020).
Interventions to Control Risk
30. A variety of public health and occupational hygiene interventions have been used with the intention of reducing the risk of COVID-19 infection. SAGE-EMG (2020c) list 39 different interventions, which are grouped as: elimination or substitution (e.g., preventing infected individuals entering the environment), engineering (e.g., use of screens or partitions and increasing the ventilation), administrative (e.g. providing hand sanitisation facilities and maintaining social distancing), and PPE (e.g., respirators (tight fitting or power assisted facepieces worn over the nose and mouth that are designed to filter dust and other aerosols from the air being inhaled), surgical masks used in health care work, or other types of face coverings worn outside work). SAGE-EMG (2020c) only provides a qualitative assessment of these interventions based on their professional judgement and the limited data in the scientific literature.
31. Based on data for the effectiveness of some of these interventions for chemicalcontaminants in workplaces we can infer something about their potential effectiveness in controlling SARS-CoV-2. Fransman et al., (2008) compiled a database summarising the literature on the efficacy of local ventilation and other engineering control measures for chemicals and dust, known as the Exposure Control Efficacy Library. These data show that there is considerable variability in the effectiveness of engineering controls. For mechanical general ventilation improvement, the median efficacy is around 40%; for natural ventilation (e.g., opening windows) the corresponding value is just under 30% - this implies that opening windows in a workplace might typically reduce the concentration of SARSCoV- 2 by around 30%.
32. Studies of the effectiveness of respiratory protection have demonstrated that the range of effectiveness of respirators in reducing average exposure is similar to that of engineering systems. Based on experimental research on non-viral aerosols the mean efficacy of surgical masks could be around 65% and for filtering facepiece respirators around 95% (Cherrie et al., 2018; Steinle et al., 2018). However, the effectiveness of respiratory protection depends heavily on correctly fitting the device, so real-life effectiveness may be much lower - in the early stages of the pandemic there were anecdotal reports of poor fitting of respirators by workers unused to wearing such devices (Nagpaul 2021).
33. Bagheri et al., (2021) modelled the infection risk for two individuals facing each other wearing a respirator or surgical mask compared to social distancing (1.5 and 3 m distances). They found that social distancing alone had a very high risk of infection (inhalation of aerosol), especially if individuals are speaking. The best protection was achieved when both wore a properly fitted filtering facepiece respirator, where the risk was more than 100 times lower than social distancing alone. When both parties wore a surgical mask the modelled reduction in risk was around a factor of ten. In all the scenarios the risk increased over time, with around a tenfold increase during the first 10 minutes and a further similar increase during the following hour.
34. Oskanen et al., (2021) evaluated the occupational exposure to SARS-CoV-2 among 866 Finnish healthcare workers. 4.7% tested positive for SARS-CoV-2 during the study, of which 53% were judged to have contracted the virus at work and a further 29% from work colleagues. Around two-thirds of occupational infections occurred while the worker was wearing a surgical mask; no occupational infections were identified while using a respirator and following aerosol precautions. Lentz et al., (2021) collected data from 1130 healthcare workers in 63 countries using an online survey. Laboratory-confirmed COVID-19 was associated more with contact with sick colleagues than with patients. The risk was reduced if the worker wore a respirator for all patient contacts and was increased if only a surgical mask was worn.
Determinants of Infection Risk at Work
35. An important determinant of occupational risk of infection is proximity to and number of contacts with others at work. Thomas et al., (2021) used an online questionnaire to collect data related to COVID-19 infection risks, including details of activities and contacts, from adult participants of the ALSPAC cohort. The contact data were summarised as either face-to-face encounters with no physical contact or encounters where there was physical touching. Around 60% of respondents reported at least one encounter each day with people other than those they lived with: face-to-face (mean = 3.4) and physical touch (mean = 0.3). Health care workers (doctors, nurses and care workers) and key workers (teachers and school staff) reported higher number of contacts than other workers (4.4 and 2.8 times respectively).
36. Data on proximity to others at work and other occupation-specific descriptors for about 1,000 occupations in the USA is available as part of the Occupational Information Network (ONET) database. Zhang (2021) used these data along with data on the number of COVID-19 infections recorded in Washington State to try to identify possible occupational risk factors. Six factors were incorporated into the statistical model (contact with others; cramped workspace; duration of typical work week; reported exposure to disease or infections; face‐to‐face encounters; physical proximity) - only reported disease exposure and physical proximity were associated with infection prevalence by occupation. The regression model developed in this study was applied to the ONET data to predict the occupations with the highest infection risk, assuming the work characteristics were as recorded in the O*NET. The top 15 occupations at risk were all in healthcare, with four of the top five in dentistry, and a further six non-health care occupations had predicted prevalence ratios significantly greater than two (flight attendants, fire fighters, ambulance drivers, barbers, kindergarten teachers and prison officers).
37. Crowley et al. (2020) constructed a “social distancing index” for the Irish workforce using data from 15 questions in the ONET database that were broadly related to teamwork requirements, customer orientation and physical presence. Their results showed that several personal factors influenced ability to social distance at work, including age, gender and educational attainment: health and social work occupations were the least able to social distance. St-Denis (2020) obtained similar results in applying the ONET data to the Canadian population. Barbieri et al. (2020) used data similar to the O*NET collected for Italian workers, and analysed responses to the questions ‘During your work are you physically close to other people?’ and ‘How often does your job expose you to diseases and infections?’ The top ten occupational sectors related to disease risk were all in health and social care, veterinary medicine, or education. The corresponding sectors for estimated close physical proximity were mostly in education, retail, hospitality and dentistry. The number of infected individuals encountered at work is also likely to be an important determinant of risk. That is particularly relevant to health and social care workers. For the period August 2020 to April 2021 the rate of infection in hospital inpatients was generally more than 5 times the rate in the general population and peaked at approximately 30 time the general population rate in February 2021.
38. Overall, summarising this literature, the main job-related characteristics that have been identified with high infection risk are:
- proximity to others in the workplace
- frequent encounters with others
- duration of encounters with others
- high density of people in the workplace
- high numbers of infected people (workers or patients/public)
- confined poorly ventilated workspace
- lack of specific controls (e.g., engineering measures and PPE)
SARS-CoV-2 Contamination in Workplaces and Occupational Risks
39. There are around 35 scientific studies of workplace contamination from SARS-CoV-2 and most of these originate from hospitals and other healthcare settings in China and Europe (Cherrie et al., 2021). A diverse range of measurement methods have been used to detect the virus on surfaces and/or in the air, none of which is an accepted “standard” approach, and in almost all cases the methods lacked sensitivity to reliably detect the presence of SARS-CoV-2 virus. On average only around 6% of samples had detectable virus (range from none to 100%) and only in one study was it possible to confirm that the virus collected was still able to cause infection. It was estimated that the typical air SARS-CoV-2 concentrations in healthcare settings was around 0.01 virus RNA copies m−3; the estimated mean in each of the studies ranged from 0.0000002 to 2,600 RNA copies m−3. One study in transportation identified similar concentrations of the virus in the air. In general, the proportion of positive samples on surfaces was higher when the proportion of air samples was also higher, which suggests that the main source of surface contamination arises from aerosol, rather than droplet spray or other mechanisms.
40. Williams et al., (2021) describes the development of a COVID-19 control banding matrix by a working group of the British Occupational Hygiene Society (BOHS). The matrix was based on occupational hygiene principles and the judgement of the occupational health practitioners. It comprises five exposure categories based on generic job descriptions and example occupations linked to guidance on intervention strategies. A limited evaluation of the reliability suggested that the highest exposure ranked jobs were associated with proximity to other workers. However, there was variation in exposure assignments between assessors. The highest risk jobs in the matrix were all healthcare workers in the vicinity of COVID-19 infected patients.
41. Oude Hengel et al., (2022) have developed a semi-quantitative job-exposure matrix (JEM), the COVID-19-JEM, to estimate the likelihood of workers becoming infected with SARS-CoV-2 in an occupational setting. The COVID-19-JEM was developed by experts in occupational epidemiology to assess the risk at population level to improve the ability to investigate work-related risk factors in epidemiological studies of workers. It has eight factors, each scored between 0 (no risk) and 3 (high risk) depending on the characteristics of the job: summing the scores gives an overall score for a given job:
a) factors for transmission risk:
- number of people in a workplace
- nature of contact between people
- contaminated workplaces
- location
b) factors for mitigation:
- social distancing
- wearing face covering
c) factors for precarious work:
- income insecurity
- proportion of migrant workers in the job.
The agreement between the expert assessors was ‘moderate’ to ‘good’ for all the factors, except for estimates of the proportion of migrants working in specific occupations, which showed poor agreement.
42. For the purposes of this report, the COVID-19-JEM was used to estimate of the theoretical risk of infection for different jobs. Appendix Table 1 tabulates jobs with COVID-19-JEM risk scores of 13+, based on the six factors in categories (a) and (b) in paragraph 39 (the less reliable precarious work factors of income insecurity and migrant workers were excluded from the scoring). The jobs are classified from the 4- digit UK Standard Occupational Classification (SOC). The resultant list includes some 115 job titles with inherent characteristics resulting in a relatively high risk of exposure to SARS-CoV-2 at work. These jobs cover around 15 million workers – almost half the UK workforce.
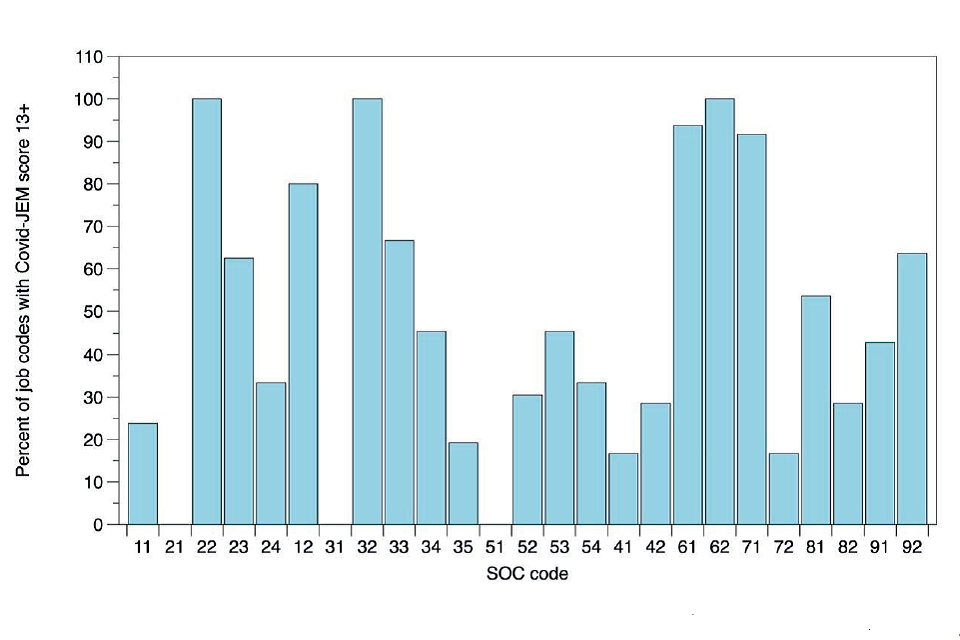
43. The jobs in Appendix Table 1 cover several broad groups, the infection risk of which can be estimated by grouping the 4-digit SOC codes by the 2-digit SOC codes which, while less precise, allows for broader categorisation that helps identify job categories of potential concern. Figure 3 shows the percentage of 4-digit job codes with COVID-19-JEM score of 13+ that fall under 2-digit SOC codes, resulting in a shorter list.
SOC codes
Figure 3: 4-digit SOC code jobs with JEM scores of 13+ grouped by 2-digit SOC codes (Descriptions of the 2-digit SOC codes are shown in Appendix Table 1).
44. For some 2-digit codes, almost all the 4-digit codes included in the 2 digits had scores of 13+. For most others there is generally between 20% and 60% of jobs included. Examples of 2-digit codes with particularly high percentages of 4-digit 13+ JEM scores are:
22 Health professionals
32 Health and social care associate professionals
61 Caring personal service occupations
62 Leisure, travel and related personal service occupations
71 Sales occupations
Three of the 2-digit codes had no 4-digit codes with JEM scores >13:
21 Science, research, engineering and technology professionals
31 Science, engineering and technology associate professionals
51 Skilled agricultural and related trades
45. Using the COVID-19-JEM is a way of identifying specific jobs that entail the key characteristics of high exposure to SAR-CoV-2, and thus a potentially greater risk of developing COVID-19. Importantly, as illustrated in the paragraph above, this approach can also help identify jobs with low risk.
46. However, the SOC code (or job title) alone is not sufficient to determine the actual risk or likelihood of occupational transmission. That depends on additional criteria: clearly, to be at risk of occupational infection, the person needs to be doing the job as characterised by the JEM, not furloughed nor working from home, and will need to have worked in the job prior to symptoms and/or a positive test result.
47. This approach to risk estimation is based on the inherent characteristics of the job, providing a theoretical estimate of risk, where all other factors are equal: i.e., irrespective of any risk assessment or implementation of controls. For instance, while the COVID-19-JEM allows for potential mitigation, it cannot account for individual and group behaviours in the workplace. Thus, the estimates of risk shown in Appendix Table 1 and Figure 3 will likely vary across workplaces depending on the extent to which mitigation strategies (such as provision and use of PPE or ventilation) are implemented.
48. In general, JEMs and similar tools, such as those based on O*NET, are a useful basis for exposure assessment in population-based epidemiological studies, despite some lack of specificity (inevitable when based on subjective expert opinion). In the case of SARS-CoV-2 there are no objective data on the extent of contamination in different workplaces, yet the COVID-19-JEM, coupled with SOC codes, offers a workable evidence-informed way of identifying those jobs with inherent characteristics associated with infection risk (both high and low), which can be compared with rates of actual infection where data are available.
Work Patterns in the UK During the Pandemic
49. Although working from home was encouraged during the lockdowns and other periods of restriction during the pandemic, many key/essential workers worked outside the home. Key workers (as defined by the UK government) included workers in Health and social care, education and childcare, key public services, local and national government, food and other necessary goods, public safety and national security, transport and border, utilities, communication and financial services. The Office for National Statistics (ONS) estimated the number of people who were employed in key worker occupations/industries using data from the 2019 Labour Force Survey (ONS 2020a): 10.6 million of those employed (33% of the total workforce) were in key worker occupations and industries. Approximately 3 million (31%) were in health and social care, 2 million (20%) in education and childcare, 1.7 million in utilities and communication, 1.5 million in food and necessary goods and about 0.5 million each in key public services and security and 0.25 million in national and local government. Some 15% of key workers were considered at moderate risk from COVID-19 because of a health condition; 31% of key workers had children aged 5 -15 years; 16% had children aged ≤4 years. The ONS drew attention to the fact that many of these key workers were in the three lowest-paid deciles: 35% of employees in health and social care; 28% of employees in education and childcare; 27% of employees in food and necessary goods. Thus, some workers may have financial barriers to isolation and/or be unable to work from home, which may affect their risk of infection.
50. The usual place of work in many occupations changed during the pandemic compared pre-pandemic, particularly with regard to working outside the home; this varied considerably by major SOC-code groups. Data from the Annual Population Survey showed that, during 2020, between 40-45% of full-time workers in the information and communication industry, in financial services and real estate industry, and in professional, and scientific services reported never working at home; a further 30-35% of these three industry groups reporting recently working at home, almost doubled that from 2019 (ONS 2021a). In contrast, over 80% of full-time workers in accommodation and food services and in transport and storage reported never working at home, with between 70% and 76% of full-time workers in health and social work, wholesale retail, repair of vehicles, construction and manufacturing reporting never working at home. Hybrid working also occurred with a mixture of working in and away from home; this varied between industry.
51. Many industrial sectors introduced remote working from home where possible for jobs such as administrators, managers and clerical work but, clearly, some jobs cannot be done from home. In addition, because of changing Government restrictions, the number working from home has varied over time during the pandemic. Furthermore, there was some redeployment of staff to jobs that were different from their pre-pandemic jobs so that their official job titles may not reflect the actual work carried out during the pandemic. Hospital work was particularly affected with both clinical and non-clinical staff being redeployed to cope with the large number of patients admitted with COVID-19. Redeployment also occurred in the retail sector to cope with increased use of online purchasing and resulting delivery requirements.
52. In addition, many businesses took advantage of the UK government coronavirus job retention scheme (“the Furlough Scheme”) where employers could claim back 80% of a furloughed employee’s salary up to a maximum of £2,500 per month, plus the employer’s national insurance contribution during periods when businesses were closed due to the pandemic e.g., when non-essential retail businesses were compulsorily closed. The proportion of furloughed employees’ jobs varied widely across industry sector and across quarters of 2020 (ONS 2020b). The highest proportions of employees furloughed were in accommodation and food services, art, entertainment and recreation, and other service activities. The lowest were in utilities, financial services, public administration and defence, and in health and social work activities. It should be noted that furloughed employees are included in the total number of people in employment at any time.
53. Changes in usual work patterns may have impacted on the estimation of risks of COVID-19 due to occupational exposure. For example, there may have been misclassification of occupation e.g., those notifying a death may have used the usual occupation rather than the one that was actually being done at the time of getting COVID-19.
Risk of Transmission Within Occupations
54. The Environmental Modelling Group (EMG) of the Scientific Advisory Goup for Emergencies (SAGE), set up to advise the UK government during the COVID-19 pandemic, have published 2 reports summarising and assessing evidence on transmission within different occupations and discuss the complexities of evaluating the contributions of exposures at work, home, shopping and on tranport (February and April 2021). They highlight international studies that show there has been a clear intersection of COVID-19 transmission networks and socioeconomic inequities, reflecting the amplifying effects of working in public facing jobs, crowded housing, job insecurity, and poverty (EMG 2021a). They also comment that a raised risk of infection due to occupational exposure may potentially lead to increased transmissions in the homes and communities of people within these occupational groups, so it is often not possible to measure the relative contribution of the different environments because they are highly interlinked with bidirectional causal pathways. There are strong connections between certain occupations and social circumstances and the dynamic processes involved, so that simply controlling for these variables within models may underplay occupational and other risks – see mortality section below.
55. There is consistent evidence that transmission within a household is higher in houses with more people living in them and within multigenerational households. However, there is less known about the index case and where that person was likely to have been exposed. An unpublished analysis using ONS COVID Infection Survey data shows that people working in patient-facing roles are more likely than a nonpatient-facing comparison group to be the first case in their household (external exposure) but that the relative risk changed over time corresponding to variation in COVID-19 cases and hospital admissions over the time periods: up to September 2020 Risk = 3.2 (95% CI 2.1-4.9); Sept – 15 Nov 2020 Risk = 1.5 (95% CI 1.0-1.4); 15 Nov - 1 Jan 2021 Risk = 1.5 (95% CI 1.3-1.8); Jan 1 - Feb1 2021 Risk = 1.7 (95% CI 1.4-1.9), (EMG, Feb 2021).
56. House et al., (2021) used the ONS household infection study stratified into four time periods from April 2020 to February 2021 relating to prevalence (waves) of infection and prevention policies: 26.04.20 – 01.09.20 low infection prevalence generally, schools closed; 01.09.20 - 15.11.20 high prevalence, schools open; 15.11.20 - 01.01.21 high prevalence, schools open; 01.01.21 – 15.02.21 high prevalence, schools closed. Complex mathematical modelling suggested that there was a much greater number of households with two positive cases than would be expected under the assumption of independence, with the pattern suggesting that, in most households, the introduction to the household would have been through a child. Analyses showed that both primary and secondary school children were associated with greater external infection risk when the schools were open. There was also significantly (in the range 25-300%) more risk of bringing infection into the household for workers in patient-facing roles.
Summary of Risk of Transmission Within Occupations
- Infection with the SARS-CoV-2 virus requires transmission of virus particles from an infected person to a recipient which, for the most part, is through exposure to aerosol. There are some fundamental factors that increase the risk of viral transmission and, thus, infection.
- Transmission will be higher where there is a high concentration of infected individuals, where people are close together, and where there are more contacts between people.
- The likelihood of encountering an infective person is not constant: it will vary over the time course of the pandemic, depending on community prevalence and contact-limiting behaviours (lockdowns).
- Some environments, and jobs within them, carry an inherently higher likelihood of encountering an infected person, such as work in a hospital treating COVID-19 patients.
- Environmental workplace factors that are associated with increased exposure and transmission include poor room ventilation and colder air, to which can be added the lack of suitable controls to mitigate those factors (e.g., PPE, screens, social distancing etc).
- Risk factors vary from job-to-job, from workplace-to-workplace, across geographical regions, and over time. Thus, the level of exposure/transmission and, therefore, the risk of infection for a given occupation, a given employment sector, or a particular job is not a constant.
- There are inherent characteristics of jobs that theoretically will increase exposure/transmission which, in principle, could lead to greater risk of infection. Job-exposure matrices (JEMs) referred to above may be helpful here, allowing identification of characteristics that are integral to the job, which produce a theoretical relative risk of infection - accepting that the level of risk will depend on numerous circumstances, many of which are unpredictable and only some of which are controllable.
- The inherent characteristics of jobs for which there are data on high occupational infection rates can provide a benchmark against which other jobs can be compared in order to estimate the possible exposure/transmission level, thus enabling a reasonable indication of the likely infection risk for jobs where data do not exist. This approach is independent of exposure control measures, the implementation of which is likely to be highly variable.
- It is not possible to confirm that an individual infection has occurred at the workplace (with the exception of genome sequencing), but people working in jobs with high JEM scores are, in principle, likely to be exposed to a greater extent than people in jobs with lower JEM scores.
Risk of Infection With SARS-CoV-2 and Adverse Health Effects of COVID-19 by Occupation
57. This section collates and evaluates evidence on risk of infection with SARS-CoV-2 due to workplace exposure and risk of adverse health effects including mortality, severe disease, hospitalisation, and sickness absence where available.
58. IIAC’s earlier position paper reviewed available studies of infection occurring in various occupations during 2020. Access to testing in the UK was limited in the early months of 2020 with sectors such as healthcare being prioritised. Many studies were thus opportunistic and focused on infection rates in healthcare settings. High rates of COVID-19 infection were found in many of the studies of health care workers. The few community studies available also generally indicated a higher rate of infection in health and social care workers. However, infection rates by occupation varied across the pandemic and often mirrored the patterns of infection in the general population. This is apparent in the ONS data for health and social care workers, for example, see below. The Council noted that interpretation was potentially limited by biases introduced by test availability and by the potential for inclusion and recall biases, small sample sizes or unclear participation rates, lack of or poorly defined comparator populations, imprecise exposure estimates, absence of control for confounders, and insufficient information about outcomes.
59. More data have now become available, and this is reviewed here with a focus on UK studies. Although there are also a substantial number of non-UK studies showing varying rates of infection and mortality, these are generally not described in detail unless they are of relevance to the UK situation and/or include information on both occupational and non-occupational transmission.
60. No data on deaths by occupation are currently available for 2021 but, in addition to a summary of mortality data from ONS, previously reviewed by IIAC, several other analyses of mortality data in 2020 are described. Supporting data from RIDDOR are also included.
61. Evidence for health and social care workers is described first, followed by an overview of findings relating to other occupations from population studies and surveys. Separate sections are then given for selected occupations where data are available.
Work in Health and Social Care
62. Health and social care workers became a focus of attention at an early stage in the COVID-19 pandemic. Their risks have been more extensively studied than those of other groups of workers. In the UK information has been derived from population surveys, studies of individual healthcare settings, sickness absences, and mortality data. Some relevant information is available from overseas studies and systematic reviews of the topic.
Infection Data
Population Data - Office for National Statistics
63. In April 2020, the Office for National Statistics (ONS) began to undertake regular estimations of SARS-CoV-2 infection rates (Pouwels et al., 2021). Initially the study involved approximately 20,000 individuals who had previously participated in the Labour Force Survey; following this, additional individuals were recruited at regular intervals throughout 2020 and 2021 and into 2022. It was expanded at the end of July 2020 and was expanded further in October with an aim of testing 150,000 subjects fortnightly up to March 2021. Participants completed a questionnaire that included questions about patient-facing work in healthcare or resident-facing care work and provided nasopharyngeal swabs for SARS-CoV-2 testing.
64. For the period between 26 April and 28 June 2020 those reporting patient-facing work were 4.06 (95%CI 2.37 - 6.72) times more likely than others to have a positive test. Those reporting care home resident-facing work were 2.35 (95% CI 0.85 - 5.27) more likely to have a positive test. There was also an increased risk associated with contact with hospitals either by the infected individual (relative exposure 2.18: 95% CI 1.09 - 4.18) or by another household member (relative exposure 1.99 95% CI 0.86 - 4.13). There was no association with reported care home contact (relative exposure 0.77: 95% CI 0.18 - 2.79).
65. There was no longer evidence of an increased risk associated with healthcare or care homework for the period up to the end of October 2020 (Table 1). For much of this period the infection rates in the general population were relatively low and the ability to detect differences was correspondingly reduced.
Table 1: Percentage testing positive for COVID-19 by work role, 2 September – 16 October 2020
| Work role | Number Positive | Total surveyed | Percentage positive | 95% Confidence Interval | 95% Confidence Interval |
|---|---|---|---|---|---|
| Healthcare (non patient-facing) | 9 | 1759 | 0.51 | 0.23 | 0.97 |
| Healthcare (patient-facing) | 28 | 7548 | 0.37 | 0.25 | 0.54 |
| Care home (resident-facing) | 0 | 611 | 0 | 0 | 0.6 |
| Other professions | 286 | 65,047 | 0.44 | 0.39 | 0.49 |
66. The ONS then compared the infection rates of those in patient-facing roles with those in non-patient-facing roles for the period from September 2020 up to May 2021 (ONS 2021c). The infection rates in the two groups followed similar patterns (Figure 4). They remained at or around the same level until mid-October. Infection rates in those with patient-facing roles then rose gradually to approximately 60% above those in non-patient-facing roles by mid December 2020. They fell again to the same rate as those in non-patient-facing roles by mid-March 2021 and after that they were lower. The relative fall in the rates in those in patient-facing roles from early 2021 probably reflects the earlier vaccination of healthcare staff compared with the rest of the population.
Figure 4: Estimated percentage of the population testing positive for COVID-19 on nose and throat swabs by patient-facing role, UK, from 21 September 2020 to 2 May 2021
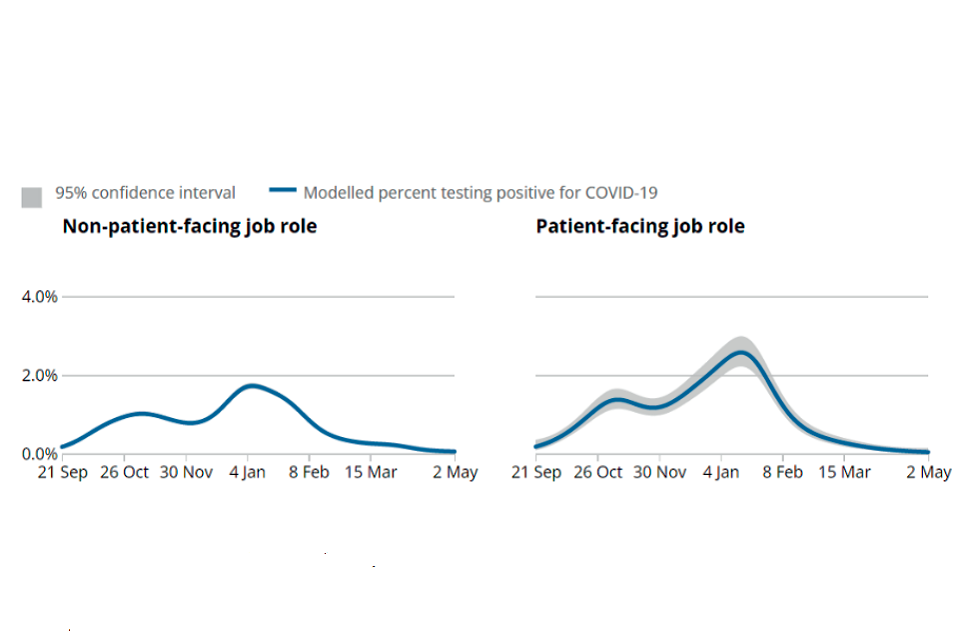
Estimated percentage of the population testing positive for COVID-19, UK, 21 September 2020
67. The ONS also reported the likelihood of testing positive for SARS-CoV-2 by 2 digit and 4-digit Standard Occupational Classification (SOC) for the period 1 September 2020 to 07 January 2021 (ONS 2021d). This included the period between 1 November 2020 and 1 December 2020 during which there was a national lockdown and there were varying Tier restrictions at other times. The predicted likelihood (%) of infection was estimated using a statistical model which included the following variables: age, sex, region, the interaction between region and ethnicity, household size, multigenerational households, index of multiple deprivation, face coverings, working from home and, in those not working from home, ease of distancing at work. After adjusting for differences across occupations and reported ability to socially distance in the workplace and work from home, there was no statistical evidence of a difference in the likelihood of testing positive for the coronavirus (COVID-19) between the majority of the 25 occupations defined by 2-digit SOC code. The likelihood of testing positive for COVID-19 at some time between 1 September 2020 and 7 January 2021 ranged from 2.1% to 4.8.% (mean 3.9%). Pairwise comparisons of the probability of testing positive between the 25 individual occupations showed that there was no difference between the majority of occupations.
68. Caring service professionals (4.6 % positive) showed strong evidence of higher rates of infection than health professionals (3.7% positive), and 7 other categories mostly of professional and skilled workers (2.1 - 3.4% positive). Apart from having lower rates of infection than caring service professionals, health professionals did not have strong evidence of different rates from any other groups of workers.
69. Results from the 2-digit SOC code raw data on which the likelihood of testing positive analysis was based showed the percentage testing positive was 4.17 (95% CI 3.74 - 4.64) for health professionals, 4.25 (95% CI 3.53 - 5.07) for health and social care associate professionals, 5.47 (95% CI 5.01 - 5.97) for caring personal service occupations and 4.1% for all workers (Appendix Table 2).
70. The percentage testing positive by occupations categorised by 4-digit SOC codes within Health and Social Care Work ranged from 2.02 (95% CI 0.66 - 4.66) for Health Care Associates not elsewhere classified to 12.33 (95% CI 7.47 - 18.78) for Paramedics, see Appendix Table 2. However, the results for many of the 20 occupations classified by 4-digit SOC codes were based on very small numbers of cases and confidence intervals were wide. ONS comment that caution should be taken about any conclusions drawn based on raw data alone; the data are unweighted and do not control for the effects of variables used in the statistical modelling.
71. A recent analysis of 3,910,311 observations from 312,304 working age adults taking part in the ONS Infection Survey compared SARSCoV-2 infection rates between occupational/sector groups, overall and by four time periods (April – September 2020, October 2020 - February 2021, March 2021 – May 2021, June 2021 – October 2021) with interactions, adjusted for age, sex, ethnicity, deprivation, region, household size, urban/rural neighbourhood and current health conditions (Rhodes et al., 2022). For healthcare workers the rates of infection fell progressively over the 4 time periods (Hazard Ratios (HR) approximately 1.6;1.3;0.8;0.6 respectively) and the overall rate for health care professionals was not elevated (HR = 0.78, 95% CI 0.67- 0.91). For social care workers the risks also fell with HRs of approximately 1.4 for the April 2020 - February period and approximately 0.9 for March - October 2021. The risk of infection for the whole period was increased (HR 1.14, 95% CI 1.04 to 1.24).
REACT Studies
72. Similar patterns were found for health care workers in the data from the Real-time Assessment of Community Transmission study-1 (REACT-1) that obtained throat and nose swabs for RT-PCR testing from representative cross-sectional samples of the population in England at approximately monthly intervals from May 2020 (Riley et al., 2021a). Thirteen rounds involving 1.9 million tests were reported up to July 2021. Results in each round were reported separately for health care and care home workers.
73. In the first round of testing health care workers (HCW) and care home workers (CHW) reported higher rates of contact with confirmed or suspected COVID-19 cases (weighted prevalence 22% and 14% respectively) compared with other key workers (2%) and other workers (1%). Infection rates were significantly higher in both health care workers: odds ratios adjusted for age and gender (aOR) were 5.2: 95%CI 2.9-9.5) for health care workers and 8.3 (95%CI 2.5-2.8) for care home workers when compared with ‘other workers’ (Riley at al., 2020a).
74. There were no longer statistically significant differences in infection rates by the time of the second survey carried out between June 19 and July 8, 2021, but by that stage the rates of infection in the general population had fallen substantially. The relative rates of infection in health and care home workers (aORs) rose again as infection rates in the community increased in the latter months of 2020 and fell again in 2021 in line with the early immunisation programme for health and social care workers (Appendix Table 3). The pattern is similar to that of the ONS data.
75. The REACT-1 team analysed data for health and social care workers separately by reported patient contact for rounds 5-10 covering the period 18/9/20 – 30/3/21 (Appendix Table 4: personal communication). Compared with other key workers HCWs with patient contact (413 subjects with positive tests) had higher rates of infection (aOR 1.18, 95% CI 1.05, 1.34) compared with other essential/key workers. HCWs with no patient contact (68 subjects) had lower aORs (0.76, 95%CI 0.59, 0.98). Care home workers with direct client contact (67 subjects) had an elevated aOR (1.36, 95%CI 1.02, 1.81). The numbers of Care home workers with no direct client contact were small (18 subjects) but they also had an elevated aOR (2.45, 95%CI 1.57, 3.8). The reference group of other essential/key workers had a higher rate of infection (aOR 1.19) compared with the ‘none of these’ occupational group.
76. The REACT-2 study reported on 5 rounds of SARS-CoV-2 antibody testing involving 685,000 subjects between June 2020 and February 2021 (Ward et al., 2021a). In the first round of testing carried out between 20 June and 13 July 2020, the overall prevalence of positive antibody tests, weighted at the national level for age, sex, region, ethnicity and deprivation to the adult population of England, was 5.96% (95% CI 5.78-6.14). Weighted prevalence were higher amongst patient-facing health care workers (11.4%) and client-facing care home workers (16.5%) (Appendix Table 5). The higher rates of seropositivity amongst health and social care workers were maintained in the second (31 July to 15 August 2020) and third round of testing (15 September – 28 September 2020).
77. Unlike the RT-PCR tests used in the ONS and REACT-1 studies which test for active infection, antibody tests as used in in REACT-2 test detect infection up to and including the test period. They thus reflect all previous experience up to the time of the test though as seropositivity wanes with time they are weighted towards more recent experience.
78. By the time of the 5th REACT-2 round (26 January – 8 February 2021) antibody levels were markedly influenced by vaccination, particularly amongst healthcare (68% of whom were vaccinated), and care home workers (60% vaccinated). Seropositivity rates remained high amongst unvaccinated health care workers (21.9%, 95% CI 20.2-23.9%) and care home workers (24.2%, 95% CI 19.8-29.1%) compared with 9.8% (95% CI 9.6-10.0%) for the entire unvaccinated population (Ward et al., 2021b).
Other Population-based Studies
79. Nguyen et al (2020) reported the findings of a voluntary web-based surveillance scheme involving 2.1 million users in the UK and USA. 4.7% of the participants selfidentified as health care workers. A total of 5,545 participants reported having had a positive SARS-CoV-2 test between 24 March and 23 April 2020. UK front-line healthcare workers were 11.6 times more likely than others to report a positive test (adjusted Hazard Ratio (aHR) 11·61, 95%CI 10·93 –12·33), adjusted for age, sex, co-morbidities, BMI, and ethnicity. Health care workers were 4-5 times more likely than others to undergo testing for SARS-CoV-2 test suggesting that their higher rate of infection could in part be related to better access to testing. A weighted analysis taking that into account showed a lower but still significant increased risk (aHR 3·43, 95% CI 3·18–3·69). Symptom combinations that were predictive of COVID-19 infection were also more common in health-care workers (aHR 2·05, 95% CI 1·99– 2·10). Amongst health care workers there were increased risks for those reporting caring for patients with documented COVID-19 (HR 4·83, 95% CI 3·99–5·85), suspected COVID-19 (aHR 2·39, 95% CI 1·90–3·00) and using inadequate personal protective equipment (aHR 5·91, 95% CI 4·53–7·71).
80. The records of participants in the UK Biobank cohort, resident in England, alive and aged less than 65 years in 2020 and employed or self-employed at baseline data collection (2006-2008) were linked to SARS-CoV-2 test results from Public Health England (16 March to 26 July 2020) (Mutambudzi et al., 2020). A comparison was made between the occupation data collected at baseline and that collected for a subsample of the cohort (n=12,306) who participated in further data collection when attending a clinic visit to participate in the UK Biobank Imaging project between 30 April 2014 and 7 March 2019 (median August 2017). A high correlation (r=0.71, p<0.001) was found between job at baseline and follow-up indicating a high likelihood that participants had continued working in the same profession. The analyses adjusted for baseline demographic, socioeconomic, work-related, health, and lifestyle-related risk factors. Of 120,075 participants, 271 were defined as having severe COVID-19, defined as a positive test taken in a hospital setting or a death with primary or secondary cause as COVID-19. Participants with a negative test or a positive test outside a hospital setting were included in the denominator. After adjustment for age, sex, ethnicity and country of birth, relative to non-essential workers, healthcare workers (RR=7.43, 95% CI 5.52,10.00, n=102), social and education workers (RR=1.84, 95%C I:1.21,2.82) and other essential workers (RR=1.60, 95% CI 1.05,2.45) had a higher risk of severe COVID-19. After further adjustment including socioeconomic, work, health and lifestyle variables the RRs were respectively 7.69 (95% CI 5.58, 10.60), 1.88 (95% CI 1.21, 2.91) and 1.15 (95% CI 0.75, 1.77). Adjusted RRs (age, sex, ethnicity and country of birth) for other occupational subgroups were: Health care professionals (RR=6.19 95% CI 3.68, 10.13, n-17); Medical support staff (RR=8.70, 95% CI 4.87, 15.55, n=14); Health associate professionals (RR=7.53, 95% CI 5.44, 10.43, n=71). Results for Social Care Workers were RR=2.46 (95% CI 1.47, 4.14, n=18). Fully adjusted RRs other subgroups were for Healthcare professionals 8.99 (95% CI 5.20, 15.54, n=17), Health associate professionals 7.65 (95% CI 5.34, 10.91, n= 71) and Social Care Workers 2.13 (95% CI 1.23, 3.63).
81. Shah et al (2020) linked data on 158,445 Scottish NHS healthcare workers with information on SARS CoV-2 testing, hospital admissions and deaths over the period 1 March to 6 June 2020 using a Community Health Index database. The proportion of patient facing healthcare workers admitted to hospital (0.20%) was more than 3 times higher than the proportion in non-patient-facing healthcare workers (0.07%), HR = 3.30 (95% CI 2.13- 5.13), adjusted for age, sex, ethnicity, socioeconomic deprivation and comorbidity. Household members of patient-facing healthcare workers were also at increased risk of hospital admission (HR = 1.79, 95% CI 1.10 to 2.91). Those patient-facing healthcare workers who worked in “front door,” intensive care, and other aerosol-generating settings were at higher risk than other healthcare workers (HR = 2.09, 95% CI 1.49 to 2.94). Although the rate of hospital admission for healthcare workers was higher than that for the general population, the rates ofintensive care unit treatment and death amongst those admitted were lower (12.3 % vs 16.1% for intensive care treatment) and (2.5% vs 13.1% for death within 28 days). This suggests that the results may have been influenced by more ready access to hospital admission by health care workers.
82. Fenton et al., (2021) carried out a later case-control study of subjects aged 21-65 using linked Scottish occupational and healthcare data. Cases were those with a positive PCR result or those admitted to hospital or who died with a diagnosis of COVID-19 (with/without a confirmed test). Controls (10 per case) were obtained from the Community Health Index database, matched on age and sex. The study was primarily concerned with education workers but healthcare workers were used as a comparator group. The relative risks of infection for health care workers were markedly elevated early in 2020, decreased during the autumn and winter school terms and fell off markedly in 2021, probably reflecting the early vaccination of health care workers. Overall, the Odds Ratio (OR), adjusted for ethnicity, Scottish index of multiple deprivation, co-morbidities and number of adults in the household, for the whole period was 2.38 (95% CI 2.33, .2.44) for patient-facing health care workers. The adjusted ORs of patient-facing healthcare work in those with SARS-CoV-2 infection by school term are given in Table 2.
Table 2: Adjusted Odds Ratios for any case of COVID-19 for patient-facing health care workers
| Term | Cases | Controls | aOR | 95% CI |
|---|---|---|---|---|
| Spring/summer 2020 | 2640 | 3509 | 10.74 | 10.09-11.43 |
| Autumn 2020 | 3807 | 12498 | 2.76 | 2.66-2.87 |
| Winter 2020/21 | 2933 | 12636 | 2.09 | 2.03-2.18 |
| Spring 2021 | 244 | 3420 | 0.59 | 0.52-0.68 |
| Summer 2021 | 509 | 7496 | 0.54 | 0.54-0.65 |
83. Beale et al., (2022) tested a sub-cohort (n =3761) of adults aged 18 and over from the Virus Watch study, a large community prospective cohort study (over 50,000 participants), for SARS-CoV-2 antinucleocapsid antibodies between 01 February - 21 April 2021. These antibodies should not have been influenced by prior vaccination. Participants also responded to a questionnaire about work practices. Seropositivity was 18.2% amongst participants employed in healthcare professions and 9.4% in the ‘Other Professional & Associate’ category OR (adjusting for age, sex, household income and region) = 2.14, 95% CI 1.47,3.12.
84. Hiironen et al., (2020) carried out a case-control study of 6000 COVID-19 positive individuals who completed a NHS contact tracing questionnaire in 3 periods - late August 2020, late September 2020 and late October 2020 (with separate samples of 2000 people in each period). Controls were identified from members of the public who registered as volunteers for a Market Research Panel, and who were not household contacts of a confirmed case. There was a greater proportion of individuals in the control group that were of white ethnicity (83%) compared to the cases (65%), although ethnicity was not recorded for 9% of case respondents. A greater proportion of cases lived in areas of lowest quintile of deprivation (17%) than controls (12%), although deprivation score was unknown for a large proportion of control respondents (11%). Distribution was largely similar for all other demographic variables. There were associations across the 3 periods of the study for health and social care work, with the infection rate consistently elevated for hospital workers, varying for GP surgeries and showing no elevation for working in community hospitals (Appendix Table 6).
85. The NHS Test and Trace data included information acquired from the cases about their contacts. This facilitated estimation of the secondary attack rates, i.e., the rates of positive cases amongst those named as close contacts of those with COVID-19 between 01 August and 31 December 2020 (referred to in EMG Feb 2021 report as unpublished data) (EMG 2021a). Secondary attack rates were highest amongst household contacts (10.3%). Workplace transmission was identified in 4.2% of all contacts. The rates in health care workers and social care/care home workers were slightly higher at 4.5% and 5.4% respectively (Appendix table 7).
86. National records of hospital admissions and discharges between 1 March 2020 and 31 December 2020, linked to data on SARS-CoV-2 testing, were used to quantify the contribution of pathways of nosocomial acquisition (originating in a hospital) of COVID-19 in English hospitals using an individual-based model that simulated transmission from patient-to-patient, patient-to-healthcare worker (HCW), HCW-topatient and HCW-to-HCW transmission (Evans et al 2022). SARS-CoV-2 infections that were classified as nosocomial were identified in 0.5% (0.34–0.74) of patients admitted to an acute National Health Service trust. The most likely route of nosocomial transmission to patients was indirect transmission from other infected patients, e.g., through HCWs acting as vectors or contaminated fomites, followed by direct transmission between patients in the same bay. The risk of transmission to patients from HCWs over this time period was low; the authors comment that this could, however, contribute significantly when the number of infected inpatients is low. The study found that the risk of a HCW acquiring SARS-CoV-2 in hospital was approximately equal to that in the community, thereby doubling their overall risk of infection and that the most likely route of transmission to HCWs was transmission from other infected HCWs.
Studies in Healthcare Settings
87. Several hospitals and healthcare institutions have reported prevalences of SARSCoV-2 infection based on RT-PCR or antibody tests. In general, these studies have reported infection levels which appear higher than those in the local community (Grant et al., 2020, Hanrath et al., 2021) with differential risks amongst various categories of hospital staff.
Real-time polymerase chain reaction (RT-PCR) testing
88. Although many of the studies reviewed in this section were carried out early in the pandemic and were often on symptomatic health care staff and thus subjective in design, they are useful for demonstrating the differential risks experienced within hospital settings depending on the specific job undertaken and the likelihood of patient contact.
89. Hunter et al., (2020) reported the first UK hospital experience of SARS-CoV-2 testing with positive results in 15-18% of symptomatic Newcastle hospital staff between 10 and 31 March 2020. Keeley et al., (2020) reported similar findings from a Sheffield hospital with positive results in 18% of symptomatic staff tested 16-29 March 2020. Zheng et al., (2020) reported a higher prevalence of positive tests (52%) between 18 March and 3 May 2020 in a London hospital, and Leeds et al (2020) reported a similar high proportion of positive tests (43%) in symptomatic staff at County Durham and Darlington hospitals during April 2020. Factors such as the availability of testing and the likelihood of staff coming forward are likely to have influenced these findings.
90. Treibel et al., (2020) reported that 7% of asymptomatic staff at a London hospital tested positive for SARS-CoV-in the last week of March 2020. Eyre et al., (2020) reported that 2.9% of asymptomatic Oxford hospital staff were positive when first tested around the beginning of May 2020.
91. There were rapid fluctuations in the numbers of positive tests over the first few weeks of the epidemic (Houlihan et al., (2020), Keeley et al., (2020), Zheng et al., (2020), paralleling the rates of infection in the local communities, and the numbers of hospital admissions. Zheng et al., (2020), for example, reported that the number of positive tests fell from more than 100/ week in late March to fewer than 10/week by late April 2000. Treibel et al., (2020) showed that the proportion of asymptomatic staff who tested positive for SARS-CoV-2 fell from 7% in the last week of March 2020 to 1.1% by the last week in April. These rates paralleled the rates of infection in London which peaked in early April 2020 and fell by about 80% over the next month (Houlihan et al., 2020), (Appendix Table 6). Several studies demonstrated a rise in infection rates amongst hospital staff from September 2020 coinciding with the second wave of infection in the community (Lumley et al., 2021).
92. A number of studies showed associations between SARS-CoV-2 positivity and the type of work undertaken within the Healthcare sector. In an early study undertaken in March 2020 Hunter et al., (2020) reported no differences in the rates of positive tests between those in patient-facing and in non-clinical roles but those in patientfacing roles were tested approximately twice as often. An extension of this study to 6 July in the same hospital trust by Hanrath et al., (2021) reported higher rates of positive tests across several job categories. Following adjustment for age, sex, ethnicity, and deprivation decile the odds of testing positive were more than doubled for domestic services staff (aOR=3.32 95% CI 1.98,5.56), and Healthcare Assistants (aOR=2.05 95% CI 1.34,3.14), and slightly less for nurses and midwives (aOR=1.56 95% CI 1.07,2.29) compared with non-patient-facing administrative and managerial staff.
93. Keeley et al., (2020) reported that 81% of positive tests in Sheffield were from clinical staff, 17% were laboratory or secretarial staff, and there was 1 (2%) cleaner. In the County Durham and Darlington study 81% of the positive tests were from medical and nursing staff, and 7% from non-clinical staff. Zheng et al., (2020) reported that rates of infection in the London hospital varied from 17% amongst those working emergency medicine to 2% in pharmacy workers.
Antibody tests
94. SARS-CoV-2 antibody testing of hospital staff was carried out widely from around May 2020, and a number of hospitals reported their findings. Participation was generally by volunteering for the tests with participation rates in the range 56-78%. Sample sizes were relatively large ranging from 1,300 to 26,000. The proportion of staff with positive tests ranged from 8.4% to 31.6%. There were no direct comparisons but these rates were thought to be substantially higher than those in the community (Eyre et al., 2020, Grant et al., 2020).
95. Almost all studies showed variations in seropositivity rates by staff role or location within the hospital. In general, those with clinical roles had higher rates of seropositivity than those in non-clinical roles with the exception of work in intensive care units where rates were relatively low. In studies that quantified the relative risks (as odds ratios) these were increased up to 2.7- fold (see Appendix Table 8). There were no specific work areas or jobs that showed consistently elevated risks in all studies.
Sickness Absence
96. Appleby (2021) summarised sickness absence trends in the NHS during March to September 2020. He pointed out that before the pandemic, sickness absence rates among staff directly employed by the NHS in England were fairly stable over the previous decade, averaging about 4% of the workforce each month. Provisional statistics from NHS Digital showed that although sickness rates in January and February 2020 were similar to the average for the previous decade, in March they began to rise above the 10-year average, peaking in April at 6.2% of the workforce absent each month, equivalent to about 79,000 full time staff absent each month; absences fell again to the 10-year average by early June. Absences varied geographically and reflected the waves of infection across England. Staff groups were also affected differently by absences related to COVID-19, for example, for doctors, from 1.3% to 3% absent each month compared with 2019 figures. At a peak in April, half of all doctors’ absences were due to COVID-19.
97. Edge et al., (2021) used pseudonymised data on 902,813 individuals continuously employed by 191 National Health Service trusts between 1.1.19 and 31.7.20 to investigate demographic and occupational risk factors for sickness absence ascribed to COVID-19 during the period 9.3.20 to 31.7.20 (n = 92,880, 10%). Sickness absence with a duration 14 days or longer was defined as ‘prolonged’. With adjustment for employing trust, demographic characteristics, and previous frequency of sickness absence, risk relative to administrative/clerical occupations was highest (and more than doubled ) in additional clinical services (a group that included care assistants) (OR 2.31 95% CI 2.25, 2.37), and registered nursing and midwifery professionals (OR 2.28 95% CI 2.23, 2.34), nearly doubled in allied health professionals (OR 1.94 95% CI 1.88, 2.01), and less than doubled in doctors and dentists (OR 1.55, 95% CI 1.50, 1.61). A job-exposure matrix (JEM) was also developed by an occupational hygienist and three occupational physicians with experience in the NHS. The JEM reclassified the 659 job descriptions held on employment records into eight exposure categories based on likely patient contact and the likelihood of the patients having COVID-19. Exposure category showed a gradient of risk, with the highest OR (relative to no patient care and only occasionally in patient areas) for hands-on or face-to-face care of patients likely to have a higher prevalence of COVID-19 than the general population (ORs 1.48 and 1.43). After adjustment for exposure category, the risk estimates for other staff groups relative to administrative and clerical jobs were all reduced. For prolonged COVID-19 sickness absence (episodes lasting >14 days), there was a progressive increase in risk across the age bands (OR for age >60 vs.<30 years 2.15 in fully adjusted model), higher ORs for non-white vs. white ethnicity, higher risk estimates for additional clinical services and registered nurses and midwives (ORs of 2.88 and 2.59 respectively, reducing to 1.88 and 1.60 after adjustment for exposure category), and lower risk estimates for medical and dental staff (ORs 1.10 and 0.77 before and after adjustment for exposure category).
Mortality
ONS Mortality Data
98. The previous IIAC report on COVID-19 presented and discussed data from ONS on 7,961 deaths aged 20-64 from 9th March to 28th December 2020 (ONS 2020b). These data have also been informative for this current evaluation and are therefore described more briefly here. Table 9 in the Appendix gives the number of deaths and the death rate per 100,000 (and 95% confidence interval) for men and women for selected occupational groups defined by a Standard Occupational Classification (SOC) 2010 4-digit code within broad occupational sectors. The Relative Risks (RR) for each occupational group are also given and have been estimated by dividing the death rate/100,000 for the specific occupation by the overall death rate per 100,000 (31.4 deaths per 100,000 men of the working population, 16.8 deaths per 100,000 women of the working population).
99. Deaths involving COVID-19, both as the underlying cause, or with any mention on the death certificate, were defined as those with International Classification of Diseases 10th Revision (ICD-10) codes U07.1 (COVID-19, virus identified) or U07.2 (COVID-19, virus not identified). Population counts of people aged 20-64 years for occupations were obtained from the Annual Population Survey (APS), using data collected in 2019; these were weighted to be representative of those living in England and Wales. Mortality rates for the broader population of all usual residents in England and Wales were based on the mid-year population estimates for 2018.
100. Only those deaths with an occupation recorded on the death certificate at the time of death registration by the informant were included. This information was then coded using the Standard Occupational Classification 2010 (SOC 2010). The analyses were presented as age standardised death rates (ASDRs) per 100,000 (with 95% Confidence Intervals (CI)); the 2013 European Standard Population was used for age standardisation. Occupation was analysed by 9 major SOC groups (SOC 1-digit), 25 sub-major (SOC 2-digit), 90 minor (SOC 3-digit) and >350 individual (SOC 4-digit) groups of occupations.
101. Of the 7961 deaths involving COVID-19 in people aged between 20 and 64, 60% (4,761) occurred between March 2020 and the end of May 2020 with 40% occurring after that. Nearly two-thirds of the 7,961 deaths were among men, with 5,128 (64.4%) deaths compared with 35.6% (2,833 deaths) among women. Men had a statistically higher rate of death involving COVID-19, with 31.4 deaths per 100,000 men of the working population, compared with 16.8 deaths per 100,000 women.
102. Of the death certificates of men of working age (20-64 years), 80.6% deaths overall and 82.4% (4,225) of those involving COVID-19 included information on occupation. Fewer women’s death certificates included occupational information: 69.0 % overall and 61.5% (1,742) involving COVID-19. The relatively small number of deaths limit the interpretation of the results for some of SOC 4-digit occupations particularly for the women’s occupations.
103. From the 9 major SOC groups, the highest death rates per 100,000 for both men and women compared with men and women respectively of the same age in the general population were in elementary occupations (men 66.3 95% CI 61.3, 71.2, women 21.1 95% CI 18.4, 23.9), caring, leisure and other service occupations (men 64.1 95% CI 56.2, 71.9, women 27.3 95% CI 24.7, 29.8) and process, plant and machine operatives (men 52.8 95% CI 49.2, 56.4, women 33.1 95% CI 25.1, 44.2).
104. Death rates per 100,000 for Care workers and Home Carers were, for men 109.9/100,000 (95% CI 88.6, 141.3 n=107), RR=3.8 and for women, 47.1/100,000 (95% CI 41.1, 53.1, n=240), RR=2.8. The death rates for this sector overall (SOC 3-digit 614) were 91/100,000 for males and 38.3/100,000 for females giving RRs of more than double the risk, 2.9 and 2.3 respectively. There were 204 deaths in care workers and home carers between March and the end of May 2020 and a further 143 up to the end of December (Appendix Table 9).
105. Among health care worker occupations there were increased risks of death, some of which were more than doubled: nurses - men 79.1/100,000 (95% CI 57.4, 106.1, n=47) RR=2.5, women 24.5/100,000 (95% CI 19.7, 29.4, n=110), RR=1.5; nursing auxiliaries and assistants – men 87.2/100,000 (95% CI 63.3, 117.1, n=45) RR=2.8, women 25.3 (95% CI 18.9, 33.1, n=54), RR=1.5); ambulance staff – men 95.2/100,000 (95% CI 38.7, 178.5, n=15), RR=3.00; hospital porters – men 86.7/100,000 (95% CI 47.7, 142.3, n=18), RR=2.8. Risk was not increased for either medical practitioners or other health care occupations.
106. ONS also carried out specific analyses for two large categories of workers grouping together various SOC2010 codes; health care workers (including doctors, nurses and midwives, nurse assistants, paramedics and ambulance staff, and hospital porters), and social care workers (including care workers and home carers, social workers, managers of residential care institutions, and care escorts). Rates of death involving COVID-19 among men (79.1/100,000, 150 deaths) and women (35.9/100,000, 319 deaths) social care workers were more than doubled compared with the general population (adjusted for age and sex) in England and Wales. The rates of death involving COVID-19 were lower for health care workers and not more than doubled- 44.9/100,000 for men (190 deaths) and 17.3/100,000 for women (224 deaths). However, combining such a diverse group of workers who may have different risks may have obscured true associations for some types of workers. As shown in above, elevated death rates were found among some of the individual health care professions such as nurses and nursing auxiliaries and assistants.
Other Mortality Studies, Including Health and Social Care Workers (HSCW)
107. The ONS deaths rates were adjusted for age and sex but not for other factors such as deprivation, region and ethnicity. However, two more recent studies have been able to link death information with data on these and other factors. The UK Biobank cohort was analysed to investigate risk factors for 459 COVID-19 deaths in comparison with 2,626 non-COVID-19 deaths, to 21 September 2020 (Elliott J et al. 2021). Risk was evaluated by demographic, social (education, income, housing, employment), lifestyle (smoking, drinking, body mass index), biological (lipids, cystatin C, vitamin D), medical (comorbidities, medications) and environmental (air pollution). Similar to the ONS data there were increased risks of COVID mortality associated with age (OR = 2.76, 95% CI 2.18–3.49) per S.D. (8.1 years), male sex (OR = 1.47, 95% CI 1.26-1.73), and Black versus White ethnicity (OR = 1.21, 95% CI 1.12–1.29). In multivariable regression, alongside demographic covariates, being a healthcare worker, current smoker, having cardiovascular disease, hypertension, diabetes, autoimmune disease, and oral steroid use at enrolment were independently associated with COVID-19 mortality. The risk estimate for mortality from COVID-19 for healthcare workers was 1.66 (95% CI 1.03 - 2.68) compared with 1.02 (95% CI 0.81 - 1.28) for non-COVID mortality. The increased risk of COVID-19 death was maintained although reduced even after adjustment for other covariates (risk estimates about 1.29 for all models using a range of adjustment factors).
108. Nafilyan et al., (2021) used individual-level data from a dataset (the Public Health Data Asset) based on the 2011 Census in England, linked with the NHS number to death records, Hospital Episode Statistics and the General Practice Extraction Service (GPES) data for pandemic planning and research. Data on 14,295,900 individuals who were aged 31-55 years at the time of the 2011 Census and were therefore likely to be in stable employment both in 2011 and 2020 (by which time they were aged 40-64 years) were used; the numbers of deaths are thus smaller than in the ONS analyses. Deaths with confirmed or suspected COVID-19 death on the death certificate (ICD codes U07.1 or U07.2 from 24 January to 28 December 2020 were analysed in relation to occupation (classified to SOC 10) at the time of the 2011 Census. This is a different approach to that of ONS described above, in which the occupation on the death certificate was used. The authors compared the nine SOC-10 1-digit major occupations from the 2011 census with those in 2019 using data from Understanding Society, a large-scale longitudinal household survey; these showed that overall, about 68% of men (range 42-79%) and 66% of women (range 58 – 74%) were in the same occupational group in 2019 as 2011. Adjusted standardised mortality rates were derived and hazard ratios (HR) using corporate managers and directors as a comparison group as it was a large group with a low absolute risk. The authors used a series of models that progressively included additional adjustment factors. Model 1 adjusted for age only. Significantly raised HRs were found for 30 4-digit SOC-code occupations for men with 20 of these being more than doubled. These results mirrored those found in the ONS analysis and included Care workers and home care, and Health and social care. Most of the HRs gradually reduced as further adjustment factors were added to the models with model 2 adding geographical factors, model 3 ethnicity and education, model 4 socioeconomic factors and model 5 adding health conditions. Adjusting for socio-economic status had the largest impact on the hazard ratios, followed by geographical factors with the exception of health professionals, for whom adjustment for socio-economic factors did not affect the hazard ratios. Men working as Care workers and home carers remained at elevated risk of dying from COVID-19 from the fully adjusted analysis: age-adjusted HR = 3.75 (95% CI 2.75 - 5.12); adjusted for geographical region, education and ethnicity HR = 2.36 (95% CI 1.72 – 4.43); fully adjusted HR = 1.57 (95% CI 1.14 - 2.15]. Estimates for women Care workers and home carers were lower but followed a similar pattern: age-adjusted HR = 2.98 (95% CI 2.02 – 4.38); adjusted for geographical region, education and ethnicity HR = 2.12 (95% CI 1.43 – 3.14); fully adjusted HR = 1.29 (95% CI 0.87 – 1.92). Other occupations with a high risk of COVID-19 related death after adjustment for confounding factors included male health professionals (age-adjusted HR = 2.12. (95% CI 1.58 - 2.84), fully adjusted HR = 1.65 (95% CI 1.23 – 2.23)), and male caring personal services (ageadjusted HR = 2.72. (95% CI 2.12 – 3.50), fully adjusted HR = 1.33 (95% CI 1.03 – 1.73)). The authors also carried out an analysis using all other occupations (rather than corporate managers and directors) as a reference group; results were similar although the unadjusted hazard ratios were slightly lower.
109. Estimation of excess mortality gives a measure that may be less influenced by potential confounders, particularly those which stay constant over time such as ethnicity. Matz et al., (2022) estimated excess mortality by occupational group in England by comparing monthly deaths in 2020 with the average number of deaths occurring in the same month during the previous five years. Essential workers included those in health and social care, education, police and protective services, food processing and manufacture and transport. Overall essential workers had consistently higher excess mortality that other groups throughout 2020 compared with the previous 5 years. For non-essential workers, unemployed or those whose occupation was unknown, mortality was 3%–6% lower than would have been expected if the pandemic had not occurred. Health care workers had 13.3% excess deaths in 2020 compared with the previous 5 years. Medical support staff had the highest excess mortality in 2020 (22.3%) compared with the previous five years, followed by health associate professionals (10%), Social Care workers (7.7%) and healthcare professionals (7.0%).
Reporting of Injuries, Diseases and Dangerous Occurrences Regulations
110. An official source of data regarding the burden of work related COVID-19 in Great Britain arises from the Reporting of Injuries, Diseases and Dangerous Occurrences Regulations (RIDDOR)[footnote 3]. RIDDOR requires employers, and other people in charge of work premises, to report (amongst other things) cases of any disease in workers where there was ‘reasonable’ evidence to suggest that it was caused by occupational exposure, including a biological agent. The Health and Safety Executive (HSE) has been collating and periodically publishing these data in relation to cases of COVID-19 from early in the pandemic.
111. Over the period 10 April 2020 – 31 March 2022, 44,458 disease notifications of COVID-19 in workers (including 459 deaths) where occupational exposure was suspected were reported to enforcing authorities under RIDDOR. Relevant categories of these data by industry sector are shown in Appendix Table 10. Figure 1 in the Appendix also shows the notifications by the week reported; the patterns mirror those of the waves of infection in the general population.
112. The RIDDOR data provide some useful information regarding industries where COVID-19 cases occur. However, as acknowledged by HSE and as further discussed by IIAC (COVID-19 and occupation: IIAC position paper 48) the data suffer from many limitations. These include under-reporting of cases especially in jobs that do not entail dealing with people known to be infected but with the general public (e.g., the transport sector), and potential misallocation in the coding of the industry as well as other biases. The NHS Business Service Authority awarded compensation for approximately twice as many COVID-19 fatalities attributed to work exposure as had been reported to RIDDOR over the same period[footnote 4]. The RIDDOR data are thus likely to be an underestimate of the COVID-19 burden attributable to work.
113. In the period 11 March 2020 to 31 March 2022 there were 25,038 RIDDOR notifications in the category ‘Human health and social work activities’ including 307 fatalities (human health activities 12,330 notifications, 170 fatalities; residential care activities 11,524 notifications, 122 fatalities).
Summary of Evidence for HSCWs
114. Despite the methodological difficulties involved in some of the studies reviewed in this report, there is clear evidence that health and social care workers have been at increased risk of SARS-CoV-2 infection compared with the general population. The extent of the increased risk has varied over time during the epidemic. There is evidence that those in patient-facing roles are at higher risk than those who are not.
115. Health and social care staff were more likely to be tested, more likely to report the results of positive tests, to have earlier vaccination that other occupations, and more likely to seek medical help in the event of an infection. Analyses based on mortality were limited by the accuracy of occupation on death certificates, the lack of adjustment for important factors such as ethnicity, and the influence of postdiagnosis events such as treatment. Analyses in which healthcare occupations have been grouped together may have diluted effects in specific occupational groups.
116. There was a very high risk during the first wave of infection up to July 2020. The probability of testing positive was 5-6 times higher than that of other workers in two large population-based studies and even higher in some other studies.
117. The very high risks amongst health and social care workers during the first wave of infection are not surprising. Hospitals came under pressure from the numbers of infected patients, normal work patterns were disrupted, testing was limited and many cases of infection were not suspected; optimum protective equipment was not always available, treatments were limited, and there was often pressure to move infected individuals through the system.
118. When infection rates fell in the community, for example in summer in 2020 and 2021, the numbers of positive tests in studies reduced making it difficult to detect differences between occupational groups.
119. However, there is good evidence that the infection rates in health and care home staff rose again, paralleling and exceeding the rates in the general population during the second wave of infection from around October 2021 with relative risks ranging from about 1.5 to over 3 for some subgroups of health and social care workers.
120. After the middle of January 2021, the earlier immunisation of health and social care workers rendered direct comparisons of infection rates of limited value, at least for the subsequent few months.
121. Hospital studies of health care workers showed differential risks with rates in those in patient-facing roles generally higher than in those who were non-patient facing. A sickness absence study showed similar findings. Front line health care workers with early patient contact tended to exhibit higher risks than those workers such as in intensive care units (who also tended to be better protected).
122. There is robust evidence of a more than doubled increased risk of death in some subgroups of health and social care workers including care workers and home workers, social workers, nurses, nursing auxiliaries and assistants, ambulance staff, and hospital porters.
123. Overall, in 2020, healthcare workers had the highest excess mortality, (13.3%) of all occupations compared with non-essential workers and those unemployed; excess mortality was 7.7% for social care workers.
Other Occupations
124. Evidence relating to the risks relating to COVID-19 amongst non-health and social care workers is available from a number of population-based studies and from studies of specific work sectors including (i) Transport, (ii) Education, (iii) Leisure, Hospitality and Retail and (iv) Emergency and Protective Services.
Work Outside the Home
125. The ONS pilot COVID-19 Infection Survey (Pauwels et al 2021) reported that for the period 26 April to 28 June 2020 those who worked outside the home were 2.47 (95% CI 1.40 - 4.55) times more likely to have a positive SARS-CoV-2 test than those working solely from home. Those who worked both at home and away from home were 1.43 (95% CI 0.53 - 3.54) times more likely to be infected.
126. The REACT 1 study described earlier reported risks associated with working outside the home in 5 survey rounds carried out between September 2020 and March 2021 Appendix Table 4. Adjusted ORs were increased both for all those working outside the home (aOR 1.37: 95% CI 1.27-1.47) and for those working outside the home but not in a public-facing role (aOR 1.13: 95% CI 1.02-1.26).
127. The REACT-2 study showed lower rates of seropositivity for those not working outside the home (3.1% vs 5.2%) in the first survey round carried out in June and July 2020. Seropositivity rates remained 10-30% lower in subsequent surveys Appendix Table 5.
Key Workers
128. The ONS analysis for the period April 2020 - November 2021 (Rhodes et al., 2022) showed that the risk of infection for key workers not involved in health and social care work rose from April - September 2020 (aOR 1.08: 95% CI 0.66-1.49) to a peak during the period March – May 2021 (aOR 1.56: 95%CI 1.16-1.96) and fell during the June - October 2021 period (aOR 0.95: 95% CI 0.86-1.03).
129. The REACT-1 study reported results for key workers not involved in health and social work (Education and childcare, Key public services, Local and national government, Food and other necessary goods, Public safety and national security, Transport and border, Utilities, communication and financial services) in each of the 13 rounds from May 2020 to July 2021 (Riley et al., 2021a). In the earlier rounds key workers had a higher proportion of positive tests (Appendix Table 4). The proportion of tests that were positive fell to rates that were similar to those of other workers byAugust 2020 when general population infection rates were low. They rose again in early 2021 during the second wave of the pandemic and then fell by mid-2021 to levels that were lower than those of other workers.
130. The REACT-2 study reported on 4 rounds of SARS-CoV-2 antibody testing involving 685,000 subjects between June and October 2020. Key (‘essential’) workers excluding health and social care workers had similar weighted prevalence of seropositivity to other workers Appendix Table 5. The adjusted odds ratio for seropositivity at round 1 (June-July 2020) was 1.10 (95% CI 1.02-1.18) and at round 4 was 1.07 (95% CI 1.01-1.14).
131. By the time of the 5th REACT-2 round (26th Jan – 8th Feb 2021) 5.7% of key workers (excluding health and social care workers), and 1.9% of other workers had been vaccinated against COVID-19. Seropositivity in the non-vaccinated key workers was approximately 25% higher than the rate in other workers (9.64% vs 7.82%).
132. Between 14% and 19% of respondents were categorised as key workers in the various rounds in the REACT studies. They formed a substantial proportion of the working population and the category is too broad to identify any substantially increased risks of infection that might be found in some sub-categories of key workers.
Transport Workers
133. The ONS analysis for the period April 2020 to November 2021 (Rhodes et. al., 2022) showed elevated risks for transport workers compared with non-essential workers. Hazard ratios adjusted for age, sex, deprivation, ethnicity, region, household size, location and health status were:
| Job | Ratio |
|---|---|
| Bus and coach drivers | 1.43 (95% CI 1.03 -1.97) |
| Taxi/cab drivers/ chauffeurs | 1.17 (95% CI 0.83-1.65) |
| Van drivers | 1.17 (95% CI 0.96-1.44) |
| Other transport workers | 1.06 (95% CI 0.92-1.23) |
For transport workers as a whole, the risks were higher during the period April 2020 - February 2021 (HR approximately 1.5) than during the period March - October 2021 (HR approximately 1.1).
134. The REACT-1 study reported more than doubled rates of self-reported infection amongst public transport workers at rounds 8 and 9 (January - February 2021). The overall aOR for the period September 2020 – March 2021 was 1.54 Appendix Table 4.
135. The REACT-2 study showed a more than doubled rate of seropositivity amongst public transport/taxi workers (12.9%) compared with non-keyworkers (5.3%) in the first survey (up to July 2020) but not after that (Appendix Table 5). At round 5 (26 January to 8 February 2021 12.2% of public transport/taxi workers were seropositive compared with 7.8% seropositivity amongst non-keyworkers. The adjusted odds ratio for seropositivity was 1.47 (95% CI 1.16,1.86) at round 4 (27/10 - 10/11/20). aORs were not reported for the earlier rounds.
136. The NHS Test and Trace (Hiironen et al.,), Biobank, and VirusWatch studies showed a range of risks for transport workers (Table 3).
Table 3: Risk estimates from selected studies
| Study | Period | Risk Estimate Measure | Risk Estimate (95% CI) |
|---|---|---|---|
| Biobank | pre July 20 | RR | 1.6 [0.8,2.6] |
| Test and Trace | Aug-20 | aOR | 1.1 (0.6-2.0) |
| Test and Trace | Sept–20 | 0.8 (0.5-1.3) | |
| Test and Trace | Oct-20 | 0.8 (0.5-1.3) | |
| Test and Trace | Nov/Dec-20 | 4.8 | |
| REACT-2 | Oct/Nov 20 | aOR | 1.5 (1.2-1.9] |
| Virus Watch* | Feb/Apr -21 | aOR | 2.2 (1.1-4.2) |
*Includes mobile machine operators
137. An apparent high death rate from COVID-19 amongst London bus drivers in the early stages of the pandemic led to the commissioning of a review of the data (Goldblatt et al., 2021). 27 deaths up to May 2020 were considered. All occurred in males. The age-corrected death rate was 3.5 times the national figure. However, the rate of infection in London was 1.76 times that of England and Wales as a whole, and bus drivers were more likely than others to be in the 45-64 age band, and to be of an ethnic minority both of which increase the risk of COVID-19 mortality. When adjusted for these the mortality ratio was significantly increased at 2.0 (95% CI 1.3-2.9). 80% of the deaths were likely to have been caused by infection occurring before the first lockdown of 22 March 2020. 15 further deaths occurred amongst London bus driver between June 2020 and January 2021. That was thought to be no greater than expected but national figures to allow a direct comparison were lacking.
138. The ONS study of 7961 age-adjusted COVID-19 related deaths in England and Wales between 9th March and 28th December 2020 also showed more than doubled rates amongst male bus/coach drivers (70 per 1,000,000) and taxi and cab drivers and chauffeurs (101 per 100,000) compared with all jobs (31 per 100,000) (ONS 2020b). Rates for large goods vehicle and van drives were slightly elevated Appendix Table 9.
139. The ONS data were not adjusted to take account of ethnicity or other possible risk factors. Nafilyan et al’s., (2021) analysis of COVID-19 related deaths between 24 January 2020 and 28 December 2020 showed that when fully adjusted the magnitudes of the increased risks are substantially reduced. A significantly increased risk that was more than doubled remained after full adjustment for female taxi/cab drivers and chauffeurs; the risk for male taxi/cab drivers was also significantly increased after full adjustment but not doubled Appendix Table 11.
140. Overall, there was 9.2% excess mortality for transport workers in 2020 compared with mortality in the previous five years, with the highest excess mortality being in March (32%) and April (77%) (Matz et al., 2022).
141. In the period 11 March 2020 to 31 March 2022 there were 893 RIDDOR notifications for the transportation and storage sector including 10 fatalities.
Summary
- The risks of infection for transport workers generally mirror that of the risks in the general population. However, the results from studies vary and the data are patchier than for health and social care workers.
- The ONS infection data suggest substantial but not doubled rates of infection in several public transport sectors in late 2020 / early 2021.
- The REACT-1 infection study suggested a less than doubled rate of infection for public transport workers for the September 2020 - March 2021 period with a more than doubled rate around January - February 2021.
- The study of seropositivity, REACT-2, suggested a doubled infection rate for all public transport workers up to the end of July 2020 but not after that.
- The London transport workers study suggested a doubled death rate amongst bus drivers up to May 2020.
- There was more than double the risk of death for bus/coach drivers and taxi drivers, cab drivers and chauffeurs in 2020 with slightly raised risk for large goods vehicle and van drivers. These risks greatly reduced in a study which adjusted for socio-economic factors.
- There was a 9% overall excess risk of death for transport workers in 2020 compared with the previous five years.
Education
142. Although there were some regional differences, UK schools closed in late March 2020. Primary schools began to re-open from June 1st, and secondary schools from mid-June 2020. Schools were generally open throughout the autumn term 2020 but closed again between early January and March 2021 (Fenton 2021). University education was mostly carried out remotely throughout that period. Although most teaching was carried out online during school closures, a small number of children, mainly those whose parents were key workers, continued to be taught in school by teachers and teaching assistants.
143. Ismail et al (2021) reported on SARS-CoV-2 infection in English schools during the period June 1 to July 17, 2020 when schools reopened after the initial closure. They identified 113 single infections, 9 coprimary cases (sharing the same household), and 55 outbreaks involving 230 individuals. Most infections (213/343) occurred in staff members. The potential source of infection was identified in 127 (82%) of 154 staff cases linked to outbreaks and included another staff member (91 cases) or a schoolchild (21 cases). In the remaining 15 cases, the source was a household (11 cases) or a community contact (4 cases).
144. A study initiated by Public Health England (PHE) in the summer of 2020 undertooknasal swabbing or blood sampling in 131 schools in England (Lhadani et al., 2020). Overall, a very low risk of SARS-CoV-2 infection was found in students or staff attending primary schools during both partial reopening in the summer half-term and full opening in the autumn term. During the summer half-term, 11,966 participants (6,727 students, 4,628 staff, and 611 with unknown staff or student status) had 40 501 swabs taken. Weekly SARS-CoV-2 infection rates were 4·1 (95% CI 0·1–21·8) per 100,000 students and 12·5 (95% CI 1·5–45·0) per 100,000 staff. At recruitment, in 45 schools, 91 (11·2%; 95% CI 7·9–15·1) of 816 students and 209 (15·1%; 11·9– 18·9) of 1,381 staff members were positive for SARS-CoV-2 antibodies, similar to local community seroprevalence. Seropositivity was not associated with school attendance during lockdown (p=0·13 for students and p=0·20 for staff) or staff contact with students (p=0·37). At the end of the summer half-term, 603 (73·9%) of 816 students and 1015 (73·5%) of 1381 staff members were still participating in the surveillance, and five (four students, one staff member) seroconverted. By December 2020, 55 (5·1%; 95% CI 3·8–6·5) of 1085 participants who were seronegative at recruitment (in June 2020) had seroconverted, including 19 (5·6%; 3·4–8·6) of 340 students and 36 (4·8%; 3·4–6·6) of 745 staff members.
145. Aiano et al., (2021) carried out a further survey of outbreaks of SARS-CoV-2 infection in English schools during the first half of the 2020 Autumn term (August 31– October 18). Approximately 24,000 schools were open during that period. 969 outbreaks were reported and 179 were investigated as part of the study. The outbreaks involved 2-100 individuals (mode= 6 cases). Infection rates were higher amongst staff (5.07% 95% CI 4.8 - 5.4%) compared with pupils (1.09% 95% CI 1.0 - 1.2%) but the index case was considered to be a staff member in 49% of outbreaks. When the index case was a teacher, 13.65% (95% CI 12.1-15.3%) of teachers were affected whereas when the index case was a pupil 6.62 (95% CI 5.3 -8.1%) of teachers were affected.
146. Fenton et al., (2021) carried out a case-control study of Scottish teachers linking the General Teaching Council for Scotland register with a case-control dataset containing information on COVID-19 cases in Scotland over the period March 2020 – July 2021. Schools were closed for some terms during that period. The adjusted odds ratios of infection (a positive SARS-CoV-2 test) amongst teachers varied with state of openness of the schools (Table 4).
Table 4: Risk of infection in Scottish teachers by season
| Term | state | cases/controls | aOR | 95%CI |
|---|---|---|---|---|
| Spring/ summer 20 | closed | 72/2349 | 0.43 | 0.34-0.57 |
| Autumn 20 | open | 1424/8947 | 1.48 | 1.40-1.57 |
| Winter 20 | closed | 813/9000 | 0.83 | 0.77-0.90 |
| Spring 21 | phased | 386/2418 | 1.57 | 1.40-1.75 |
| Summer 21 | open | 1103/5530 | 1.69 | 1.58-1.81 |
| Overall | 3794/21792 | 1.27 | 1.22-1.30 |
147. The ONS analysis of infection rates for the period 1/9/20 to 7/1/21 when schools were open were 25% - 60% higher in several teaching settings than the rates in the entire study population (Appendix Table 12) (ONS 2021d). Teaching assistants had the highest rates, 6.64% (95% CI 5.57-7.85) compared with 4.1% for the whole population.
148. The ONS analysis for the period April 2020 to November 2021 (Rhodes et al 2022) showed approximately a 50% higher rate of infection in education workers compared with non-essential workers (aHR 1.31: 95% CI 1.23-1.39). The rates were elevated for both the April 2020-February 2021 period (HR approximately 1.5) and the March - October 2021 period (HR approximately 1.3).
149. The REACT-1 study reported an aOR for SARS-CoV-2 positivity of approximately 1.2 amongst education, school, nursery and preschool care workers for rounds 5-10 (Sept 2020 – March 2021), Appendix Table 4.
150. The REACT-2 study also showed elevated seropositivity rates amongst teaching and childcare workers compared with non-key workers particularly at round 1 (June - July 2020: 8.8% v 5.3%) and for unvaccinated education, school or nursery workers at round 5 (26/1/21 - 8/2/21: 11.4% v 7.8%). Schools were closed during the latter round but seropositivity reflects infection up to the time of the study and not just during the data collection period Appendix Table 5.
151. The NHS Test and Trace (Hiironen et al., 2020), Biobank (Mutambudzi et al., 2020), and VirusWatch (Beale et al., 2022) showed variable infection risks (Table 5).
Table 5: Risk of Infection for the education sector
| Study | Study Period | Study population | Risk Estimate Measure | Risk Estimate (95% CI) |
|---|---|---|---|---|
| Biobank | pre-July 20 | Education | RR | 1.59 (0.67-2.91) |
| Test and Trace | Aug-20 | Education (working/attending) | aOR 0.3 | (0.2-0.5) |
| Test and Trace | Sept-20 | Education (working/attending) | 1.6 (1.3-2.1) | |
| Test and Trace | Oct-20 | Education (working/attending) | 2.0 (1.6-2.6) | |
| REACT-2 | Oct/Nov 20 | Teacher/ childcare | aOR | 1.28 (1.15- 1.42) |
| Virus Watch* | Feb/Apr -21 | Teaching/education/childcare | aOR | 1.12 (0.80-1.50) |
152. The ONS mortality study (7,961 COVID-19 related deaths between 9th March and 28th December 2020) showed moderately (less than doubled) increased rates amongst some teaching and related professionals (Appendix Table 9) (ONS 2020b). In the analysis adjusting for socio-economic factors, Nafilyan et al., (2021) did not demonstrate an increased mortality rate (hazard ratio compared with all other occupations) for the period 24 January 2020 to 28 December 2020 Appendix Table 11.
153. Overall, there was a reduced excess mortality of 3.4% for the education sector compared with the previous 5 years (Matz et al., 2022).
154. In the period 11 March 202 to 31 March 2022 there were 3,955 RIDDOR notifications for the Education sector including 18 fatalities.
Summary
- The data suggest relatively low rates of infection in the education sector overall.
- For school education workers this clearly that depends on whether or not schools were open and on the extent to which staff worked from home. There is fairly consistent evidence from the infection studies of about a 1.5 – fold risk during periods when schools were open.
- Mortality was only moderately higher in some education sectors. However, overall, there was a reduced excess of deaths compared with the previous 5 years.
- Intermittent presence in schools and the low average age of teachers could have contributed to this.
Leisure and Retail
155. The ONS analysis for the period April 2020 to November 2021 (Rhodes et al., 2022) showed increased rates of infection (aHRs) in a number of leisure and retail settings:
Food production 1.04 (95% CI 0.83-1.31)
Food distribution and retail 1.02 (95% CI 0.93-1.13)
Retail/ wholesale work 1.19 (95% CI 1.11-1.23)
Hospitality 1.36 (95% CI 1.24-1.49)
Arts, entertainment, recreation 1.07 (95% CI 0.97-1.19)
The rates in retail and hospitality workers were higher during the April 2020 - February 2021 period (aHRs approximately 1.5) than during the March - October 2021 period (aHR approximately 1.1 for retail workers and 1.2 for hospitality workers).
156. The REACT-1 study Appendix Table 4 reported slightly elevated rates of infection for home delivery workers (aOR 1.05), retail workers (aOR 1.24) and hospitality services (aOR 1.27) for rounds 5-10 (September 2020 to March 2021).
157. The REACT-2 study showed increased rates of seropositivity amongst retail workers only during round 5, i.e., January-February 2021 (9.5%) versus 7.8% for non-key workers, Appendix Table 5.
158. The NHS Test and Trace data (Hiironen et al., 2020) showed persistently elevated rates of infection in hospitality workers through August – October 2020 (aORs 2.1 - 2.9). The rates were more variable in other retail/leisure sectors Appendix Table 6.
159. Subdivision of hospitality work showed that work in restaurants, bars, and pubs was particularly strongly associated with infection with aORs 3.52, 2.92, 2.41 for August, September, and October respectively). Work in entertainment (other) activities was also strongly associated with increased odds of infection, aORs 8.47, 4.13 and 7.12.
160. The secondary attack rate analysis for the period 23 October 2020 to 31 January 2021 (EMG report of February 2021 Appendix Table 7) showed higher rates of infection in named contacts of cases in the hospitality (6.6% 95% CI 6.3% - 6.8%) than in retail (4.4% 95% CI 4.2% - 4.6%) but these were both lower than the 10.2% (10.1% - 10.2%) amongst household contacts (EMG 2020a). Secondary attack rates in these sectors were lower during periods of lockdown: 4.1% (3.6% - 4.6%) for 5 Nov – 1 Dec and 4.0% (3.6% - 4.6%) for 4 Jan – 31 Jan compared to 5.6% (5.3% - 5.9%) observed over 23 Oct – 4 Nov and 5.6% (5.4% - 5.8%) for 2 Dec – 4 Jan when there were fewer restrictions.
161. PHE studied concordance of the S-Gene Target Failure (SGTF) marker in pairs of infected individuals in various settings, mostly around December 2020 (EMG 2021b). SGTF was a pattern seen in a proportion of SARS-CoV-2 PCR tests. Two individuals with SGTF were more likely to have a common source of infection than individuals with discordant results. The results were expressed as the odds ratios relative to the random chance of paired individuals both having the SGTF marker Appendix Table 6.
162. There was variable evidence of transmission rates within the workplaces reported. These were generally lower than those found in domestic settings such as visiting or staying with friends or relatives. For some workplace the numbers analysed were small giving wide confidence intervals.
Table 6: Risk of transmission by work or activity
| Work/activity | OR(95%CI) |
|---|---|
| retail work | 3.47 (2-4.83) |
| hospitality work | 6.09 (4.64-7.98) |
| arts, entertainment, recreation | 4.17 (2.05-8.5) |
| close contact services | 45.6 (5.77-360) |
| food and drink | 6.09 (4.64-7.98) |
| hotel etc | 10.1 (3.06-33.2) |
| staying with friends/ relatives | 19.9 (11.4-34.8) |
| visiting friends/relatives | 35.6 (19.7-64.2) |
163. Other studies showed variable rates of infection in the retail and leisure sectors (Table 7).
Table 7: Risk estimates for Retail and Leisure in selected studies
| Study | Study Period | Study population | Risk Estimate Measure | Risk Estimate (95% CI) |
|---|---|---|---|---|
| Biobank | pre-July 20 | Food workers | aOR | 0.84 (0.39-1.80) |
| REACT-2 | Oct/Nov 20 | Retail work | aOR | 1.07 (0.94-1.21) |
| Virus Watch | Feb/Apr - 21 | Leisure/personal services | aOR | 1.96 (1.00-3.84) |
| Sales/ customer services | 1.49 (0.84-2.63) |
164. The ONS study of 7961 age-adjusted COVID-19 related deaths in England and Wales between 9th March and 28th December 2020 showed markedly increased rates amongst some retail and leisure-related occupations (Appendix Table 9 (ONS 2020b)). The highest rates in men were in bakers and flour confectioners 50 (716/100,000); publicans and managers of licensed premises (220/100,000), and butchers (207/100,000) with the rate in all jobs 31/100,000. Amongst women, death rates were more than doubled in hairdressers and barbers (44/100,000), chefs (40/100,000), and shopkeepers and proprietors (36/100,000) compared with the rate in all jobs (17/100,000).
165. Nafilyan et al., (2021) also demonstrated an increased age-adjusted mortality ratio in a number of retail and leisure-related occupations but these fell to close to those for all other occupations in the fully adjusted model (Appendix Table 11).
166. Excess mortality for the food sector was 4% higher for 2020 compared with the previous 5 years (Matz et al., 2022).
167. In the period 11 March 2020 to 31 March 2022 there were the following RIDDOR notifications: Manufacture of food products 602 including 3 fatalities; Accommodation and food service activities 2,173 including 16 fatalities; Arts, entertainment and recreation and other service activities 4,934 including 59 fatalities.
Summary
- There is some evidence of increased risk of infection in several of the occupations included in Leisure and Retail, including hospitality and food processing but there is no consistent pattern of a more than doubled risk.
- There were also increased death rates in some of these occupations but after adjustment these fell to levels close to those for all occupations.
- Excess mortality for the food sector was only marginally raised.
Protective Service Occupations
168. SAGE EMG Transmission Group reported on COVID-19 in prisons in March 2021 (EMG 2021c). They noted that the incidence of disease, number and size of outbreaks, hospitalisation and mortality rates all increased markedly in wave 2 of the epidemic compared with wave 1. Most prisons were reported to have had outbreaks and in the second wave more than 79% of prisons (n=102) had outbreaks where at least 50 prisoners and staff were infected. Infection rates were generally lower than those reported for the general population in ONS surveys.
169. The ONS analysis for the period April 2020 to November 2021 (Rhodes et al., 2022) showed an increased rate of infection (aHR 1.45 95% CI 1.29-1.62) for police and protective service workers. In the ONS infection survey for the period 1/9/20 to 7/1/21 (Appendix Table 12) rates were elevated for police officers, 5.61% (95% CI 5.61-7.16), fire service officers 6.12% (95% CI 6.12-10.45), prison officers 6.3% (95% CI 6.3-12.03) and security guards 6.28% (95% CI 6.28-9.28) compared with the 4.1% positivity of the entire study population.
170. The REACT-1 study showed an OR of 1.45 (95% CI 1.09-1.92) for SARS-CoV-2 infection in those in policing, prison, fire & rescue, and coastguard occupations Appendix Table 4 for rounds 5-10 (September 2010 to March 2011).
171. The REACT-2 study showed seropositivity rates in emergency service workers including prison and coastguard workers that were 25-60% higher than those of nonkeyworkers for the period June-November 2020 Appendix Table 5. The rate in nonvaccinated emergency service workers (police, prison, fire and rescue) remained similarly elevated at round 5 (26 January – 8 February 2021 11.9% v 7.8% for nonkey workers).
172. The UK Biobank study (Mutambudzi et al., 2021) showed a less marked risk of severe infection in police and protective service workers (RR 1.19 95% CI 0.55- 2.58) for the period up to 26/7/20.
173. The ONS study of 7961 age-adjusted COVID-19 related deaths in England and Wales between 9th March and 28th December 2020 showed very high (more than doubled) death rates amongst male police officers and security guards (194 and 101 per 100,000 respectively compared with 31 per 100,000 for all working men) (ONS 2020b). There were very few deaths for women in any of the protective service job categories.
174. Nafilyan et al., (2021) did not demonstrate any increased mortality ratio, adjusted for socio-economic factors, in those working in protective services during the period 24 January 2020 to 28 December 2020 (Appendix Table 11).
175. There was an excess mortality of 5.5% over 2020 compared with the previous 5 years for police and protective occupations (Matz et al., 2022).
176. In the period 11 March 2020 to 31 March 2022 there were 2310 RIDDOR notifications for the category Public administration and defence and compulsory social security, including 8 fatalities.
Summary
- There is some evidence for increased risk of infection in several security occupations. However, these are based on small numbers in some of the studies.
- Age adjusted deaths are raised for police officers and security guards and there is an overall excess of deaths of 5.5% for the security sector in 2020.
Other Occupations
177. There is relatively little data relating to other occupations. Some studies have suggested elevated rates of infection in particular work groups but there is no consistent pattern of increased risk.
178. The ONS analysis for the period April 2020 to November 2021 (Rhodes et al., 2022) showed an increased rate of infection (aHR 1.24 95% CI 1.09-1.41) for personal services workers such as hairdressers. The rates were higher during the April 2020 - February 2021 period (aHR approximately 1.4) than during the March - October 2021 period (aHR approximately 1.1). In the ONS infection survey for the period 1/9/20 to 7/1/21 (Appendix Table 12), apart from those mentioned above the only groups that had percentages (unweighted) of positive tests that were more than twice the population average of 4.2% were draughtspersons (9.52%, 95% CI 4.2- 17.91, n/N = 8/84), planners, process and production technicians (9.26%, 95%CI 3.08-20.3, n/N = 5/54), and floorers and wall tilers (8.62%, 95% CI 2.86-18.98, n/N = 5/58). The numbers in all these groups were small.
179. The rates for ‘personal care’ workers were not elevated in the REACT-1 studies (aOR 1.0: Appendix Table 4) Those involved in ‘close contact services’ had a more than doubled rate of infection (aOR 2.9) for August in the PHE case-control study (Appendix Table 6), but the rates for September and October were only marginally elevated. The Biobank study (Mutambuzi et al., 2020) showed a more than doubled risk in ‘personal services’ workers.
180. The PHE case-control study (Hiironen et al.,) identified associations between work and infection amongst warehouse workers, construction workers, arts and entertainment, and food production/ agriculture workers (Appendix Table 6). The rate amongst warehouse workers was particularly high during the October 2020 period (aOR 15.2). The adjusted odds ratios tended to increase over the 3 periods of the study for several occupations which may reflect the increasing rates in the general population at that time).
181. The NHS Test and Trace secondary attack analysis showed relatively high rates of secondary infection amongst information and communication workers (6.1%), financial services workers (5.8%), and arts, entertainment or recreation workers (5.7%). These figures compared with the average secondary infection rate of 4.2%, and the rate in household contacts of 10.3%.
182. Beale et al’s., (2022) study of a sub-cohort (n =3761) of the Virus Watch study carried out between 01 February and 21 April 2021 showed elevated seropositivity rates for some other occupations compared with the ‘other professional and associate’ reference group, in particular for Indoor Trades, Process & Plant; Outdoor Trades; and Transport & Mobile Machine operators groups (Table 8).
Table 8: Seropositivity rates by Occupation
| Occupation | OR | 95% CI |
|---|---|---|
| Other Professional and Associate | Ref | |
| Administrative and Secretarial | 1.3 | (0.93-1.81) |
| Indoor Trades, Process and Plant | 2.09 | (1.31-3.33) |
| Leisure and Personal Service | 1.96 | (1.00-3.84) |
| Managers, Directors and Senior Officials | 1.2 | (0.78-1.85) |
| Outdoor Trades | 2 | (0.99-4.05) |
| Sales and Customer Service | 1.49 | (0.84-2.63) |
| Social Care and Community Protective Services | 1.18 | (0.67-2.05) |
183. In Mutambuzi et al’s., (2020) study of UK Biobank participants, RRs of ‘severe disease’, after adjustment for age, sex, ethnicity and country of birth, for subgroups of key workers compared with non-essential workers for SOC major occupational groups are given in Table 9; these reduced after additional adjustment for socioeconomic, work, health and lifestyle variables.
Table 9: Adjusted risk estimates of severe disease by occupation
| Occupation | No. cases | RR (95% CI)* |
|---|---|---|
| Managers and senior officials | ref | |
| Professional occupations | 1.53 | |
| Associated prof and technical | 3.15 (includes HCWs) | |
| Admin and secretarial | 1.24 | |
| Process/plant/machine operative | 1.26 |
*adjusted for age, sex, ethnicity and country of birth
184. In a later Biobank study (Rowlands et al., 2021) an increased risk of severe COVID- 19 was demonstrated in those who were recorded as being shift-workers aOR 2·06 (95% CI: 1·72, 2·47). Fatima et al., (2021) extended the study to include 1713 Biobank participants who had a positive COVID-19 tests between March 16 and September 9, 2020. After adjustment for age, gender, ethnic minority status, income, education, deprivation, sleep variables, overall health, and obesity there was still a significant association with shift work. Those who worked predominantly night shifts had an aOR of 1.85 for COVID-19 (95% CI 1.42-2.41) and those who worked predominantly day shifts had an aOR of 1.54 (95% CI 1.30-1.81).
185. The ONS analysis of deaths of working age adults (20-64) involving COVID-19 occurring from March to the end of 2020 using occupation as recorded on the death certificates found elevated rates in male metal working machine operatives (RR 3.4), Food, drink and tobacco process operatives (RR 3.3), elementary construction occupations (RR 2.6), local govt administrative occupations (RR 2.3), and cleaners and domestics (RR 2.1) (ONS 2020b). Amongst women there were several occupations of concern where the RR was just less than doubled and/or there were smaller numbers of deaths: these included occupations in food processing, hospitality, local and national administration, bank and postal work, security and emergency services and hair dressing.
186. In the study by Nafilyan et al., (2021) described earlier most hazard ratios gradually reduced as further adjustment factors were included in the analysis. In the fully adjusted model taking into account age, gender, geographical factors, ethnicity and education, socioeconomic factors and health conditions the only groups with a more than doubled mortality rate were male secretarial and related workers, and female taxi/cab drivers and chauffeurs Appendix Table 11.
Summary
- There are relatively few studies with results for the occupations described above, including several within the construction, service, administration and office work, and manufacturing and there is no consistent evidence of increased rates of infection or death in any of these occupations.
Workplace Outbreaks
187. Throughout the pandemic there have been reported outbreaks of infection in workplaces involving varying numbers of workers; this can provide useful additional information, for example, to corroborate potential increased risk. However, currently, there is no agreed definition of what constitutes an outbreak.
188. Data on COVID-19 outbreaks in workplaces (excluding care homes, hospitals and educational settings) between May and October 2020 were analysed using the Public Health England (PHE) HPZone data (a national web-based system for communicable disease control in England) (Chen et al., 2021). Workplace outbreak rates were estimated for 9 English regions, 151 Upper Tier Local Authorities (UTLAs) and twelve industrial sectors, using the National Population Database (NPD) data extracted in May 2019 on the total number of the relevant workplaces as the denominator. Infection attack rates by enterprise size (small, medium, large) and industrial sector were estimated using PHE Situations of Interest (SOI) data on the number of test-confirmed COVID-19 cases in a workplace outbreak as the numerator and using NPD data on the number employed in that workplace as the denominator.
189. In total, 1,317 confirmed workplace outbreaks were identified from HPZone data, of which 1,305 were available for estimation of outbreak rates. The average outbreak rate was 66 per 100,000 workplaces. Of the nine geographical regions in England, the Northwest had the highest workplace outbreak rate (155/100,000 workplaces), based on 351 outbreaks. Of the UTLAs, the largest numbers of workplace outbreaks were mainly observed in northern English towns and cities with the highest outbreak rates registered in Blackburn with Darwen (387/100,000), Sandwell (351/100,000), Liverpool (349/100,000), Rochdale (277/100,000), Manchester (275/100,000) and Bradford (254/100,000). The industrial sector with the highest workplace outbreak rate was manufacturers and packers of food (1,672/100,000), based on 117 outbreaks: this was consistent across seven of the regions. In addition, high outbreak rates in warehouses were observed in the East Midlands and the Northwest.
190. In total, 390 outbreaks were identified from SOI data and 264 of them allowed for estimation of attack rates. The overall median attack rate was 3.4% of the employed persons with confirmed COVID-19 at a workplace with an outbreak. Most of these outbreaks (162) had an attack rate less than 6%. However, in a small number of outbreaks (57) the attack rate was over 15%. The attack rates were highest in workplaces with less than 50 workers (17.8%) compared with 4.3% (50-249 workers) and 1.1% (> 250 workers). The highest attack rate was for outbreaks in close contact services (median 16.5%), which was followed by outbreaks in restaurants and catering (median 10.2%), and in manufacturers and packers of non-food products (median 6.7%); the latter were mostly in medium and large workplaces whereas the first 2 were mostly in small enterprises.
191. A freedom of Information request by the Trade Union Council (TUC) to Public Health England revealed that between April 2020 and January 2021 there had been 4,523 workplace reported incidents of linked cases of COVID-19 infections. High numbers were reported for: distribution and transporters (408, including 148 mail delivery); first responders (218 including 117 police); manufacturers and processors, food (354); manufacturers and processors, non-food (728 including 119 engineering); Office (687); ‘other’ (1,254 including 160 construction sites, 132 domiciliary care); restaurant and caterers (112); retailers (559 including 264 supermarkets, 94 small retailers); warehouses (108).
192. Similar findings in food processing have been reported in several countries including the UK, described in a narrative review by Gaitens et al., (2021). Gaitens et al., also describe many outbreaks in the US in grocery stores and other retail establishments, emergence services, transportation, factory workers and security. The authors comment that many of the workplaces where outbreaks have occurred include racially diverse, low-wage workers whose jobs require close interaction with the public and/or close proximity to their co-workers, placing them at increased risk of infection.
193. It has been suggested in a study of US SARS-CoV-2 infection that outbreaks in meatpacking plants could contribute substantially to the per capita infection rates in local areas (Saitone et al., 2021). They concluded that the presence of a large beef packing facility increased per capita infection rates by 110%, relative to comparable counties without meatpacking plants; large pork and chicken processing facilities increase transmission rates by 160% and 20%, respectively.
Sequelae From Infection with SARS-CoV-2
194. A large majority of people infected with SARS-CoV-2 experience mild or short-term symptoms with no long-term consequences. However, following acute infection, a number can go on to experience longer-term symptoms. In some these may lead to persisting or even permanent impairment, loss of function and disability. In some cases, the symptoms are associated with persisting lung abnormalities following acute COVID-19 pneumonitis. In others they are caused by complications of the acute illness such as pulmonary emboli, myocardial infarction or stroke, or prolonged intensive care treatment. In the majority of cases the symptoms have no clear pathophysiological basis. This condition is often referred to as ‘Long Covid’.
195. The medical nomenclature describing these conditions is not yet fully established. Lopez-Leon et al described 11 synonyms and descriptive terms for ongoing symptoms following COVID-19 in their systematic review of the condition. The National Institute for Health and Care Excellence (NICE) defines the post-COVID-19 syndrome as signs and symptoms that continue for more than 12 weeks following COVID-19 and are not explained by an alternative diagnosis (NICE 2021). The WHO describes a ‘post COVID-19 condition’ in similar terms (WHO 2022). NICE defines ‘Long COVID’ in broader terms including both symptoms that are explained by an alternative diagnosis or complication of the COVID-19 and those that are not.
196. The International Classification of Diseases (ICD)[footnote 5] also have designated codes for the ‘Post COVID-19 condition’ (U09 for ICD10 and RA02 for ICD11). There is also a code U09.9 for ‘Post COVID-19 condition, unspecified’. SNOMED CT coding is widely used in the UK and includes a code for ‘Post COVID-19 syndrome’. Its uptake has been low. Walker et al (2021) reviewed primary care data for England (OpenSAFELY) up to April 25, 2021. Post-COVID syndrome was the most commonly used COVID-19-related diagnostic code (23,273 cases or 64% of all codings). Coding was unevenly distributed varying with geography and type of computer system used, and 26.7% of practices had not using the codes at all.
IIAC’s Approach Regarding Post-COVID-19 Syndrome and Associated Sequelae
197. In addition to requiring a demonstrable relationship with work to prescribe a disease IIAC requires the condition to be clearly defined, to have measurable diagnostics and to lead to adverse health consequences causing some loss of faculty/function that are likely to lead to one or more disabilities. For the sequelae of an infection additional issues to consider are the timing of the relevant infection period and the timing of onset of the complication, disease or symptoms.
198. For the purposes of IIAC it is important that the sequalae of infection that can explain symptoms and resultant disability are considered; these are considered first followed by a section on Post-COVID-19 syndrome.
199. IIAC has identified a range of complications (sequelae) following infection with SARS-CoV-2 and/or treatment for COVD-19 that have a defined pathophysiology, that could lead to some loss of faculty with potential long-term disability.
These include:
1. Persisting pneumonitis or lung fibrosis following acute COVID-19 pneumonitis
2. Persisting pulmonary hypertension following a pulmonary embolism
3. Ischaemic stroke
4. Myocardial infarction
5. Symptoms of Post Intensive Care Syndrome following ventilatory support treatment for COVID-19
The evidence for these is reviewed and discussed below.
Persisting Pneumonitis or Pulmonary Fibrosis Following Acute COVID-19 Pneumonitis
200. Pulmonary fibrosis is a condition where inflammation, scarring and thickening of the lung parenchyma occurs. This can stiffen the lungs and impair oxygen transfer into the bloodstream leading to breathlessness and an impaired exercise capacity. Pulmonary fibrosis is a well described condition but its cause is commonly unknown (termed idiopathic), and although it may affect up to 1 in 200 adults over the age of 70, under the age of 65 years it is rare.
201. Disease of the lungs is the commonest cause of severe morbidity and mortality in the acute phase of COVID-19. Radiographs and CT scans show diffuse ‘ground-glass’ shadowing with associated low oxygen levels and breathlessness.
202. Persisting lung abnormalities are common in the first months after COVID-19 infection. The commonest features are persisting ground glass shadowing, and reticular shadowing or other features that are suggestive of diffuse lung fibrosis.
203. So et al., (2021) carried out a meta-analysis of 13 studies involving 1,232 patients. Lung abnormalities were present on CT scans after an average follow-up period of 3 months in 56% of subjects (95% CI 41%–70%). 44% were categorised as ground glass change and 11% as interstitial thickening or interlobular septal thickening. Vijayakumar et al., (2022) also reported that 56% of patients (41/73) had abnormal CT scans at 3 months following hospital discharge. Huang et al., (2021). also found that 53% of CT scans (186/348) remained abnormal six months after hospital admission. The median extent of lung involvement was 25%. Again, ground glass shadowing was the commonest abnormality affecting 44% of subjects. Huang et al., also found that 53% of CT scans remained abnormal. Again, ground glass shadowing was the commonest abnormality affecting 44% of subjects. A variety of other abnormalities were reported including interlobular septal thickening, reticular abnormalities, ‘irregular lines’, and consolidation. Thus, the commonest features are persisting ground glass shadowing, and reticular shadowing or other features suggestive of diffuse lung fibrosis.
204. The likelihood of persisting lung abnormalities is related to the severity of the initial infection. Johnsen et al (2021) reported that approximately 76% of admitted patients had CT scan abnormalities at 3 months compared with approximately 17% of nonhospitalised patients attending a post COVID-19 clinic. Vijayakumar et al (2022) found that those requiring mechanical ventilation were 8 times more likely to have persisting CT abnormalities at 3 months (OR=7.8 95% CI=1.7-36.1). Huang et al., (2021) reported that the volume of affected lung identified on CT scans after six months was significantly higher in those who required ventilatory support during the acute illness (29.1 cm3) compared with those requiring supplemental oxygen alone (3.3 cm3) or those who did not require supplemental oxygen (1.6 cm3). At 1 year, Wu et al., (2021) reported that those with persisting CT scan abnormalities had higher initial pneumonia scores and longer hospital admissions and were more likely to have required ventilatory support.
205. The radiological abnormalities improve with time, at least up to 1 year following infection. Fabbri et al., (2021) carried out a meta-analysis of 11 studies of post COVID-19 lung abnormalities up to 6 months after acute infection. 93% of subjects had ‘inflammatory abnormalities’ (ground glass opacities or consolidation on CT scanning) at baseline falling to 29% at 6 months (5 studies). The prevalence of fibrotic shadowing was unchanged (27% at baseline and 33% at 6 months). Wu et al., (2021) reported that both ground glass shadowing and reticular shadowing improved between 3 months and 1 year after infection. 78% of patients had ground glass shadowing after 3 months, falling to 23% at 1 year. The prevalence of reticular shadowing was 33% at 3 months and 4% at 1 year. None of the subjects showed evidence of progressive lung fibrosis after the acute phase of the illness. Vijayakumar et al., (2021) followed up 32 subjects who had abnormal CT scans after 3 months. The median extent of lung involvement was 25%. At one year most subjects (26/32) had shown improvement or resolution of the abnormalities and the median residual extent of lung involvement was 7.5%.
206. Of lung function measurements, gas transfer is the most markedly affected with lesser reductions in lung volumes. Huang et al., (2021) reported abnormalities of gas transfer in 34%, a reduction in total lung capacity in 17%, and airflow obstruction in 6% at 6 months. The meta-analysis by So et al., (2021) identified similar lung function abnormalities of gas transfer in 35%, restrictive abnormalities in 16% and airflow obstruction in 8%. These findings were replicated in a further meta-analysis of 7 studies by Torres-Castro et al., (2021). The prevalence of impairment of gas transfer, restrictive abnormalities, and airflow obstruction up to 3 months were respectively 39%, 15% and 7%. Fabbri et al., (2021) also reported impaired gas transfer in 45% of subjects up to 6 months post infection, and restrictive abnormalities in 21%’
207. Several studies have shown associations between the presence of CT abnormalities and impairment of lung function (Frija-Masson et al., 2021, Balbi et al., 2021). Vijayakumar et al., (2022) reported relationships with lung volumes (FEV, FVC and TLC) at 3 months but no significant abnormalities were demonstrated at 12 months. There was a negative association between CT abnormalities and gas transfer (KCO) at 3 months. Wu et al., (2021) also found significant differences in gas transfer (DLCO) and lung volumes in those with normal and abnormal CT scans at 1 year.
208. Lung function abnormalities improve with time in parallel with the improvements in CT scans. In Wu’s study 55% of subjects had a reduction in gas transfer measurements (less than 80% of the predicted value) at 3 months, falling to 33% at 1 year (Wu et al., 2021). The prevalence of total lung capacity measurements (less than 80% of the predicted values) fell from 27% to 15%. Fabbri et al., (2021) pooled data from SARS-CoV-2, SARS-CoV, and MERS-CoV patients and reported that the prevalence of impairment of gas transfer fell from 60% at 1 month to 39% at 1 year, and the prevalence of restrictive abnormalities fell from 28% to 7%.
209. Breathlessness is a common symptom following COVID-19 but is not consistently associated with abnormalities on CT scans. Wu et al., (2021) reported breathlessness in 81% of subjects at 3 months. Mostly the breathlessness was mild with only 5 of 83 subjects graded 2 or more on the MRC scale. The proportion reporting breathlessness fell to 5% at 1 year. This was paralleled by an improvement in exercise capacity with the median 6 minute walking distance increasing from 535 to 615 metres. Vijayakumar et al., (2022) reported similar findings with the proportion of subjects reporting breathlessness falling from 46% at 3 months to 19% at one year. There was no relationship between reported breathlessness and CT findings at 3 months. 51% of those with abnormal CT scans and 47% of those without reported breathlessness. At 1 year none of the subjects with normal CT scans reported breathlessness. Balbi et al., (2021) also did not identify any significant difference in breathlessness rates in those with abnormal CT scans (68%) compared with those with normal scans (55%) at 3 months after hospital discharge.
Summary
- There is clear evidence of persisting lung radiological abnormalities following acute COVID-19. These improve with time but in those with more severe initial disease the abnormalities can be persistent and are potentially permanent. The pathological associations with the radiological abnormalities are poorly understood. There is no close relationship between structural abnormalities visible on a CT scan, lung function abnormalities and breathlessness.
Pulmonary Hypertension Following a Pulmonary Embolism
210. Pulmonary emboli (PE) are blood clots that form in the deep veins then travel to the lungs where they obstruct the circulation potentially leading to a range of symptoms including chest pain, breathlessness and in severe cases death. Epidemiological studies show an annual incidence in the range 39-115 per 100,000 population (Konstantinides et al., 2019) but the rates are considerably higher in those suffering from acute illness, immobility or infection. Grimnes et al., (2017) reported a 48-fold increased risk following respiratory infections, and a 140-fold increased risk when that was combined with immobility.
211. Pulmonary emboli were recognised as an important complication of COVID-19 early in the course of the pandemic with up to 30% of patients affected (Leonard-Lorant et al., 2020). Even higher rates (up to 76%) were reported in those requiring intensive care treatment (Kollias et al., 2021). Ward and Sarraju et al., (2021) reported that the risks of PEs were almost twice as high as those seen in influenza patients (HR 1.8 95% CI 1.6–2.1). COVID-19 specific pathophysiological mechanisms such as endothelial tropism and associated coagulopathy were believed to contribute to the very high risk (Longchamp et al., 2021). Anticoagulation to reduce the risk became an early part of the management strategy of COVID-19 patients (NICE 2020).
212. There are several systematic reviews and meta-analyses of PE risks following COVID-19 infection (Malas et al 2020, Zhang et al 2021, Mansory et al., 2021, Tan et al., 2021, Longchamp et al., 2021, Kollias et al., 2021, and Mai et al., 2021). The PE prevalence were in the region of 8% in most studies but Zhang et al., (2021) and Kollias et al., (2021) found higher rates in studies that included patients who underwent screening for Venous thromboembolism (VTE) (22% and of 32% respectively.
213. The rates of VTE seen with COVID-19 are much higher than those expected in a healthy or control population. Pasha et al., (2021) studied 54,354 patients treated in Mayo Clinic enterprises and reported that compared with 90 days pre-infection the rate of VTE (64% of which were PEs or PEs and DVTs) was increased 29-fold (RR 29.4 95% CI 21.8-40.0) in the first week following infection. Katsoularis et al., (2022) studied 1.06 million Swedish subjects who tested positive for SARS-CoV-2 between February 2020 and May 2020 and compared their rates of PE with those between 30 days before and 180 days after diagnosis with those during the rest of the study period. They also compared PE rates with those of 4.08 million control subjects matched for age, sex and residency. The incident rate ratios (IRR) of PE were substantially elevated in both the self-controlled study (IRR 31.6 95% CI 30.0-35.6) and in the matched cohort study (IRR 33.1 95% CI 32.8-33.3).
214. The increased risk of PE appears to begin several days before the diagnosis of COVID-19 is established. Ho et al., (2021) investigated PE rates in 30,709 Scottish subjects in the period 3 days before to 56 days after a positive SARS-CoV-2 test. These rates were compared with those in the rest of the study period i.e., March 2018 to October 2020. The rate (incidence rate ratio: IRR) was increased 7-fold for the period 5 to 1 days prior to a positive test (IRR 7.47: 95% CI 4.13-13.51). Katsoularis et al., (2022) also demonstrated a high rate of PEs in the 3 days prior to a positive SARS-CoV-2 test (IRR 39.04 95% CI 33.59-45.37).
215. The risk of PE also appears to extend beyond the period of acute illness. Pre COVID-19, Amin et al., (2021) studied the VTE risk up to 180 days following admission in 11,000 hospitalised USA patients. The overall risk was high at 3.5%. More than half the VTEs occurred after hospital discharge with 25% occurring more than 71 days after the date of admission. That is likely to reflect in part the high rates of chronic ill health in that population. Hull et al., (2013) reported a mean time to VTE diagnosis post hospitalisation of 33.5 days (95% CI 23-44 days) with 20% of events occurring after more than 57 days in a study of 989 high risk Canadian patients. Only 38 (3.8%) subjects had a confirmed diagnosis of VTE in this study. Following COVID-19 infection, Ho et al., (2021) reported incidence rate ratios (IRRs) of 16.8 (95% CI 12.5-22.7) on days 0-7 following infection, 4.5 (95% CI 3.2-6.4) on days 8-28 and 3.5 (95% CI 2.5-4.9) on days 28-56. Katsoularis et al., (2022) reported a peak incidence at days 8-14 following infection (IRR 46.4 95% CI 40.6-53.0) falling to IRRs of 4.1 (95% CI 3.4-5.0) on days 31-60, 2.5 (95% CI 2.0-3.1) on days 61-90 and 1.4 (95% CI 1.1-1.8) on days 91-180. In Pasha et al’s., 2021 study the VTE rate although markedly increased initially had fallen to baseline by 6 weeks.
216. The risk of PE increases with age but is not markedly influenced by sex. In the Swedish study the risks were higher during the first wave of infection compared with the second and third (Katsoularis et al., 2022). The risk is related to the severity of the initial infection. Katsoularis et al., (2022) reported PE rates of 0.02% in those with mild disease, 2.06% in those requiring hospital admission and 6.23% in those treated on an intensive care unit. Ho et al., (2021) reported that PE rates were 35 times higher in hospitalised patients compared with non-hospitalised. The rates in hospitalised patients remained 5 times higher during the 28-56 post-diagnosis period. Pasha et al (2021) reported that almost all (97%) of VTEs in their study of 54,354 patients treated in Mayo Clinic enterprises occurred in the 8% of patients who required hospitalisation. Dalager-Pedersen et al., (2021) reported a 6.9-fold difference in the rates of PE between hospitalised and non-hospitalised patients. Ahuja et al., (2021) reviewed 194 papers relating to COVID-19 and venous thromboembolism. They concluded that severe COVID-19 infection is associated with a 6-fold increased risk and non-severe disease is associated with a 3-fold increased risk.
Summary
- There is clear evidence of an increased risk of pulmonary embolism in association with COVID-19. The risk appears to increase shortly before the diagnosis of COVID-19 is established and extends for up to 3 months afterwards.
- Most patients with a pulmonary embolism will make a complete recovery but a small minority will develop persisting pulmonary hypertension causing breathlessness and impaired mobility.
Ischaemic Stroke Occurring Within 28 Days of a Diagnosis of COVID-19
217. Infection and inflammation are known to increase the risk of strokes. Smeeth et al (2004) for example showed a 3.2-fold increased risk of stroke (95% CI 2.8-3.6) in the first 3 days following a diagnosis of a respiratory tract infection with the increased risk persisting for up to 90 days. Grau et al., (1998) also showed that those presenting with a stroke were 3.1 times (95% CI 1.6-6.1) more likely than control subjects to have had an infection in the preceding week. These associations with other infections suggest that an increased risk of stroke might also be expected with COVID-19.
218. The overall number of hospital admissions for both strokes and myocardial infarctions fell during periods when COVID-19 infection rates were highest. During the first wave of infection there was a 12% reduction in stroke admissions in the UK compared with similar periods during the previous 3 years (Douiri et al., 2021). Greek data suggest a similar effect during the second wave (Katsoularis et al., 2021). The falls in admissions were predominantly for older patients and those with milder symptoms suggesting that they resulted from reluctance to refer or to selfrefer rather than any reduction in the community prevalence of stroke.
219. A history of vascular disease is associated with an increased risk of COVID-19. Ayoubkhani et al., (2021) compared 48,000 hospitalised COVID-19 patients with matched control subjects from the UK GPRD database of 50 million patients. The COVID-19 patients had twice the rate of major adverse cardiovascular events (MACE), a composite of heart failure (30% of events), stroke (17% of events), myocardial infarction (13% of events) and arrhythmia (40% of events) in the 10 years prior to infection compared with the control subjects (60 per 1000 vs 30 per 1000).
220. The reduced incidence of stroke during the COVID-19 pandemic and the increased risk of infection in those with pre-existing disease potentially confound the investigation of a causative relationship between COVID-19 infection and strokes. Nonetheless, a number of studies have shown increased risks.
221. Tan YK et al., (2020) carried out a review of case reports and case series of strokes in COVID-19 patients up to May 2020. There were 39 papers reporting 135 acute ischaemia strokes. Reported incidences varied between 0.9 and 2.7%. The mean age of the patients was 63 years, and 63% were male. Most had a relevant comorbidity including hypertension (65%), diabetes mellitus (43%) and hyperlipidemia (32%). The mean time from the onset of COVID-19 symptoms to the stroke was 10 days. The mean National Institutes of Health Stroke Score (NIHSS) (a standardized scoring tool used to measure the level of impairments caused by a stroke) was 19, placing the subjects in the moderate to severe stroke range (16-20, with 21-42 indicating a severe stroke). 222. Misra et al., (2021) carried out a systematic review and meta-analysis of 29 studies. The reported prevalence of stroke ranged from 0% to 16%. The pooled prevalence for ischemic stroke or transient cerebral ischemic attack was 1% (95% CI 1-2%) in those with COVID-19. Luo et al (2022) showed similar findings in a meta-analysis of 10 studies with 26,691 subjects with COVID-19 and 280 with ischaemic strokes. The pooled prevalence of ischaemic stroke was 2% (95% CI 1–2%).
223. Modin et al., (2020) reported on the incidence of stroke in the 14 days after a diagnosis of COVID-19 in 5100 Danish patients. Incidences were compared with those in the 180 days prior to the diagnosis of COVID-19, and up to the end of the study excluding the immediate post-infection period. There were 18 strokes with an incidence rate ratio (IRR) of 12.9 (95% CI 7.1-23.5).
224. Katsoularis et al., (2021) reviewed data on 87,000 Swedish patients diagnosed with COVID-19 between February and September 2020. There were 254 first ischaemic strokes. Incidence rates were compared with historic control data obtained between Feb1st and one month prior to infection, and with 349,000 matched controls. There was a high rate of simultaneous diagnosis of stroke and COVID-19 leading to the possibility that in some cases the stroke led to a diagnosis of incidental COVID-19. The stroke rates were elevated for up to 28 days in comparison with both the historic control data and the matched control subjects. Incidence rate ratios (IRRs) in comparison with the control period were: days 1-7 IRR = 2.97 (95% CI 1.71-5.15); days 8-14 IRR = 2.80 (95% CI 1.60-4.88); days 15-28 IRR = 2.10 (95% CI 1.33- 3.32). When compared with control subjects, the odds ratio (OR) for an acute ischaemic stroke in the 14 days following a COVID-19 diagnosis was 3.63 (95%CI 1.69-7.80).
225. Nannoni et al., (2021) carried out a systematic review and meta-analysis of 61 studies including 109,000 COVID-19 patients published before September 2020. There were 1106 patients with an ischaemic or haemorrhagic stroke giving a pooled incidence of 1.4% (95% CI 1.0-1.9). Most strokes (87%) were ischaemic with 12% caused by intracerebral haemorrhage. The risk of stroke was related to the severity of the COVID-19 infection, age, and cardiovascular risk factors including hypertension, diabetes mellitus and coronary artery disease. 80% of ischaemic strokes were caused by large vessel occlusion. The median NIHSS score was 15 (i.e., in the moderately severe stroke category of 5-15/42). The authors noted that the results suggested a particular profile of COVID-19-associated strokes, characterized clinically by marked severity and poor outcome, and radiologically by large artery occlusion and multiple arterial territory involvement. The relation between COVID-19 infection and haemorrhagic stroke was unclear.
226. Ward and Sarraju et al., (2021) used a US-based electronic health record to compare the 90-day outcomes in 417,975 COVID-19 patients and 345,934 influenza patients. After adjustment for age, sex, severity of infection, care setting and comorbidities there were no significant differences in the risks of stroke (HR 1.11, 95% CI 0.98–1.25) between the two groups.
Summary
- There is good evidence of an increased risk of ischaemic stroke in those with acute infections, and a reasonable body of evidence suggesting that the same is the case with COVD-19. The risks are likely to continue for several weeks after the time of the infection.
- Many patients with strokes will recover but it is likely that some will be left with residual limb weakness or incoordination, visual loss, speech disturbance, and impaired cognitive function leading to disablement.
Myocardial Infarction
227. Influenza, pneumonia, acute bronchitis, and urinary tract infections are associated with an increased risk of myocardial infarction that can persist beyond the period of the acute infection (Musher and Abers, 2019). Smeeth et al., (2004) showed a 5-fold increased risk of myocardial infarction (IR = 5.0 95% CI 4.4-5.53) in the first 3 days following a diagnosis of a respiratory tract infection with the increased risk persisting for up to 90 days. Barnes et al., (2015) carried out a meta-analysis of 10 case-control studies of influenza and myocardial infarction. The pooled Odds Ratio in those with influenza was 2.0 (95% CI 1.5-2.8). In contrast, influenza immunisation was associated with a reduced risk of MI.
228. As with strokes the overall numbers of hospital admissions for myocardial infarctions fell during periods when COVID-19 infection rates were highest. The first wave of COVID-19 saw a 54% reduction in hospital admissions (PHE 2020), and the second wave a 41% decline (Wu et al., 2021). As with strokes, pre-existing cardiovascular disease poses an increased risk of the development of COVID-19. Wu J et al., (2021) carried out a meta-analysis of 203 studies involving 24 million subjects reporting on the risks of COVID-19 in those with cardiovascular disease. The pooled odds ratio was 1.4 (95% CI 1.3-1.5), and the pooled hazard ratio was 1.3 (95% CI 1.2-1.5).
229. Modin et al., (2020) reported on the incidence of myocardial infarction in the 14 days after a diagnosis of COVID-19 in 5100 Danish patients. Incidences were compared with those in the 180 days prior to the diagnosis, and up to the end of the study. There were 17 myocardial infarctions in the 14 days after a diagnosis of COVID-19 excluding the immediate post-infection period giving an incidence rate ratio (IRR) of 5.6 (95% CI 1.9-18.2).
230. Katsoularis et al., (2021) reviewed the incidence of myocardial infarction in the 87,000 Swedish patients diagnosed with COVID-19 between February and September 2020. Incidence rates were elevated for up to 28 days in comparison with both historic control data and the matched control subjects. Incidence rate ratios (IRRs) in comparison with the control period were: days 1-7 IRR= 2.9 (95% CI 1.5- 5.6); days 8-14 IRR= 2.5 (95% CI 1.3-4.9); days 15-28 IRR= 1.6 (95% CI 0.8-3.0). When compared with control subjects, the odds ratio for a myocardial infarction in the 14 days following a COVID-19 diagnosis was 3.4 (95% CI 1.6-7.4).
231. Myers et al., (2021) examined the healthcare data for 55 million US patients up to June 2020 and quantified the risk of myocardial infarction in those with a diagnosis of COVID-19. There were 634,000 COVID infections and approximately 4,000 myocardial infarctions. The time to the occurrence of the myocardial infarction is not stated but those with COVID-19 had approximately 7 times the risk compared with the control population. A history of familial hypercholesterolaemia appeared to double the risk.
232. Ayoubkhani et al., (2021) followed up 48,000 COVID-19 patients for a mean of 140 days after discharge and compared them with control subjects matched for demographic and health characteristic obtained from the UK GPRD database of 50 million patients. The main outcome measure was the rate of major adverse cardiovascular events, a composite of heart failure (30% of events), stroke (17% of events), myocardial infarction (13% of events) and arrhythmia (40% of events) rates. COVID-19 patients had more than 5 times the rates of new events (65.9 per 1000: 95% CI 61.8-70.3) compared with the control group (12.3 per 1000: 95% CI 10.6 to 14.1). Data are not provided for the individual conditions.
Summary
- As with strokes there is evidence of an increased risk of myocardial infarction for several weeks following acute infection including COVID-19. In many cases the symptoms of a myocardial infarction will resolve completely but in a minority of cases persisting breathlessness or exertional chest pain is likely to cause ongoing disability.
Post Intensive Care Syndrome
233. More than 850,000 patients have been admitted to hospital with COVID-19 up to May 2022. The proportion requiring treatment on an intensive care unit (ICU) varied from 6% to 14% up to the latter part of 2021 and then fell to approximately 1%. More than 50,000 patients required treatment on ICUs up to April 2022 (ICNARC 2022).
234. It has been recognised for some time that survivors of treatment on ICUs frequently suffer from new or worsened physical, and non-physical health problems. A variety of terms has been used to describe these conditions including “critical illness polyneuropathy”, “critical illness myopathy,” and “long-term cognitive impairments”. A 2012 stakeholders’ conference agreed the term “post-intensive care syndrome” (PICS) to encompass all new or worsening impairments in physical, cognitive or mental health status arising after critical illness and persisting beyond acute care hospitalization (Needham et al., 2012). The terminology has been generally adopted and widely used since then.
235. Up to 80% of ICU patients have been reported to have at least one symptom of PICS following hospital discharge (Rousseau et al., 2021). There is usually some improvement over the first 6-12 months but most patients have prolonged symptoms that have been reported to last for 15 years or more. PICS is associated with a reduced ability to work, a reduced quality of life, and an increased risk of death (Ahmed and Teo 2021).
236. Loss of exercise capacity caused by muscle weakness (myopathy), peripheral nerve damage (neuropathy) or both is the commonest physical abnormality seen in ICU survivors (Morgan et al., 2021, Joris et al., 2021). The precise pathophysiological mechanisms are uncertain. Immobility, a catabolic state and systemic inflammation lead to loss of muscle mass and muscle repair following critical illness, may lead to structural abnormalities contributing to long term weakness (Morgan et al., 2021). Peripheral nerve damage probably has several causes including abnormalities of the microcirculation, mitochondrial dysfunction, and disordered cell membrane function (Kress and Hall, 2014). The combined effects of muscle weakness and nerve damage result in global limb weakness, most pronounced around the shoulders and hips.
237. Impairments of memory, concentration, attention and higher mental functioning are common following critical illness. Pandharipande et al., (2013) followed up 467 patients (median age 59, 50% male) for 1 year after an admission to an intensive care unit. 6% had evidence of cognitive impairment at baseline. At 12 months 24% of patients had scores that were in the mild Alzheimer’s disease range (2 standard deviations below the population mean) using the Repeatable Battery for the Assessment of Neuropsychological Status (RBANS) tool. Other studies have reported a new diagnosis of dementia or evidence of moderate-to-severe cognitive impairment in approximately 15% of ICU survivors (Ahmed and Teo 2021).
238. Psychological problems of depression, anxiety and post-traumatic stress disorder are also common after ICU treatment. They are linked to events during the admission such as delirium, poor sleep, and sedative use (Morgan et al., 2021). A meta-analysis of 27 papers reported a prevalence of anxiety symptoms of 34% (95% CI 25-42%) at 12-14 months post ICU treatment (Nikayin et al 2016). A separate meta-analysis of 5 studies of ICU patients 7-12 months post discharge reported clinically important post-traumatic stress disorder symptoms in one fifth of critical illness survivors after 1-year (Parker et al., 2015). Hatch et al (2018) carried out a postal survey of 4,943 UK patients (mean age 64, 57% male) 1 year after discharge from an ICU. The response rate was 38%. Whilst PICS does not require patients to meet case definitions for psychiatric disorder it is notable that at 1 year 38% met case definitions for anxiety (score >7) using the Hospital Anxiety and Depression Scale (HADS), and 32% met the case definition for depression (HADS-D >7). 18% met the case definition for a post-traumatic stress disorder (Post Traumatic Stress Disorder Check List >45).
239. To date, experience with PICS following COVID-19 is much less than that following other acute severe illness requiring ICU treatment. PICS is primarily related to the severity of the illness and the need for treatment rather than its cause and PICS following COVID-19 is not likely to be any less severe that that from other causes. Patients admitted to the ICU with COVID-19 experience additional stress resulting from physical isolation and distancing from relatives, friends, and healthcare professionals due to strict preventive measures and extensive use of personal protective equipment (Martillo et al., 2021).
240. There is some evidence that the PICS outcome of COVID-19 is similar to PICS of other causes at least up to one year following the acute illness (Joris et al., 2021, Rousseau et al., 2021). Gamberini et al., (2021) followed up 178 Italian COVID-19 ICU patients for one year after discharge. Their mean age was 64 and 72% were male. Their average length of stay on the Intensive Care Unit was 23 days and their average duration of ventilation was 16 days. Health-related quality of life (HRQoL) was measured using a 15-dimensional questionnaire (15D), and lung function measurements were undertaken. HRQoL significantly increased from 3 months to 1 year mainly due to an increase in physical dimensions scores, while mental and breathing dimensions scores remained substantially unchanged. 53% of the patients reported persistent impairment of HRQoL at 1 year with arthomyalgias (35%) and breathlessness (58%) the commonest symptoms. The latter was only partly explained by abnormalities of lung function.
241. There are no specific diagnostic criteria for PICS. The syndrome is recognised by worsened mobility and or cognitive or psychological symptoms following a period of critical illness. Tools such as the 6-minute walk test (6MWT) can be used to quantify physical disability and nerve conduction studies and electromyography can be helpful in confirming the diagnosis. There are no validated tools for assessing cognitive function of mood disturbance in PICS but tests such as the Mini-Mental State Examination (MMSE) or HADS are commonly used (Ahmed and Teo 2021). It is often difficult to separate impaired function caused by physical problems from those with a psychological basis. Premorbid illness predisposes to PICS and it can be difficult to fully distinguish the effects of one from the other. Pre-illness cognitive status is often unknown or uncertain, and in the context of COVID-19 there is considerable overlap between the symptoms of PICS and those of the Post-COVID Syndrome.
Summary
- PICS is a recognised cause of considerable physical, psychological and mental symptoms following treatment on an intensive care unit and it is likely that similar symptoms can occur with COVID-19 treated in ICUs and with advanced respiratory support techniques in non-intensive care settings. Evaluation can be difficult because of the complex interactions of the various components of the syndrome.
Post-COVID Syndrome (Long-covid)
242. Ongoing symptoms are commonly reported following COVID-19 infection. In some cases, they can be attributed to complications such as pulmonary emboli or persisting pneumonitis but in other cases the cause of the symptoms is less clear.
243. Persisting symptoms are also common after other acute infections. Post-infective fatigue-type symptoms have been reported in 27% of subjects 3 months after infection with Epstein-Barr and Ross River viruses or with Q fever. 12% of patients reported symptoms after six months and 9% after 12 months (Hickie et al., 2006). 40% of patients with SARS reported chronic fatigue after an average of 41 months (Lam et al., 2009).
244. Some studies have reported even higher frequencies of symptoms following COVID-19 infection. These studies have varied markedly in their study populations, often concentrating on hospitalised patients, the duration of follow-up and the symptoms enquired about. As a consequence, there has been considerable heterogeneity in the frequency of documented symptoms. Hayes et al., (2021) carried out a review of 50 studies and reported symptom prevalences ranging from less than 10% to more than 70%. Nasserie et al., (2021) carried out a systematic review of 47 studies and reported at least one persisting symptom in 72% of subjects after 60 days from infection or 30 days from recovery from the acute illness.
245. The range of symptoms reported following COVID-19 is very wide. Hayes et al., (2021) described more than 100 symptoms in a review of 50 studies, and Davis et al., (2021) reported on 203 symptoms affecting 10 organ systems amongst 3,762 participants recruited from COVID-19 support groups. Fatigue and breathlessness are the most commonly reported symptoms. In the ONS October 2021 survey weakness/tiredness was reported by 56% of those with self-reported long COVID and shortness of breath was reported by 40%. Other common symptoms were loss of smell (32%), difficulty concentrating (31%), muscle ache (31%), trouble sleeping (28%), worry/anxiety (24%) and low mood/not enjoying anything (24%).
246. Many of these symptoms are not specific to COVID-19 infection. Tiredness is one of the most frequent complaints in primary care (Stadje et al., 2016), and in a survey of UK adults 18% reported substantial fatigue lasting six months or longer (Pawlikowska et al., 1994). Breathlessness is also common in the general population with 27% of adults reporting the symptom (Gronseth et al., 2014). Anosmia was reported in 22% of black and 10% of white subjects in one American study (Dong et al., 2017). In a Spanish study smell dysfunction was reported by 19.4% of 9,348 subjects (Mullol et al., 2012).
247. Few studies of post COVID-19 symptoms have used control populations but those that have done have confirmed higher prevalences in infected groups. The ONS compared symptoms amongst 15,061 subjects who developed COVID-19 between April 2020 and August 2021 and matched controls (ONS 2021e). 5.0% of COVID-19 patients reported symptoms at 12-16 weeks after testing positive, compared with 3.4% of control subjects. Continuous symptoms were less common with 3.0% lasting at least 12 weeks in the infected group compared with 0.5% in the control group. Havervall et al., (2021) reported on an 8-month follow-up study of 1,395 Swedish health care workers, 233 of whom had COVID-19. 26% of infected (seropositive) subjects reported at least 1 moderate to severe symptom lasting for at least 2 months compared with a prevalence of 9% amongst seronegative subjects.
248. Many post COVID-19 symptoms improve over the course of weeks or months although a proportion of patients report ongoing symptoms after at least one year. Sudre et al., (2021) described symptoms duration in 4,182 users of the Covid Symptoms Study App who self-identified as having a positive SARS-CoV-2 test between March and June 2020. 13% of users reported symptoms after 4 weeks, 4.5% after 8 weeks and 2.3% after 12 weeks. The ONS reported prevalences of post-acute symptoms amongst 15,061 subjects who tested positive for SARS-CoV-2 between April 2020 and August 2021 (ONS 2021f). Respondents were asked about 12 symptoms (fever, headache, muscle ache, weakness/tiredness, nausea/vomiting, abdominal pain, diarrhoea, sore throat, cough, shortness of breath, loss of taste, loss of smell). 9.4% of subjects reported at least 1 symptom 4-8 weeks after infection, falling to 5.4% between 8 and 12 weeks.
249. Post COVID-19 symptoms are more common in females, in those with more severe initial illness, and in some studies, in older subjects and those with comorbidities. Sudre et al., (2021) reported associations between persisting symptoms after 8 weeks and increasing age (mean age 52 yrs. vs 38 yrs. in those with short-lived symptoms); female sex (83% vs 67%); comorbidities especially asthma (18% vs 8%); and need for a hospital visit during the acute illness (44% vs 7%). The ONS study of October 2021 also identified associations with age (12-week symptoms prevalence was maximal at 18.2% in the 25-34 age group falling to 11.2% in those aged ≥70) and female sex (14.7% v 12.7%) (ONS 2021f). Those requiring hospital admission were more likely to have prolonged symptoms (8.6% of those reporting symptoms at ≥12 weeks were hospitalised compared with 7.9% at ≥5 weeks). Associations have been reported with occupation (ONS 2022) but these have not been shown to be independent of the risk of developing COVID-19.
250. Not all symptoms reported following COVID-19 have an impact on day-to-day activities. In the March 2022 ONS report 31% of those with self-reported ‘long COVID’ more than 1 year after infection had no reduction in their ability to undertake day to day activities (ONS 2022). 47% had ‘a little’ reduction in their abilities and 21% ‘a lot’. Other studies have shown similar differences between the frequency of symptoms and their impacts.
251. Most studies of Post COVID-19 symptoms have not distinguished those caused by complications such as pulmonary thromboembolism, persisting pneumonitis or the others discussed above. Symptoms of Post COVID-19 that are not explained by complications of the initial illness could potentially form a new disease. However, a pathophysiology for this syndrome has not yet been established and a variety of potential mechanisms have been suggested including microemboli, persisting post viral inflammation, autonomic nerve dysfunction, immune dysregulation, and others (Raveendran et al., 2022, Peluso and Deeks 2022). Parallels have been drawn with myalgic encephalitis/chronic fatigue syndrome which can have similar features and are reported to frequently follow viral infection but as yet no common pathophysiological mechanism has been established (Scordo et al., 2021). Studies of Post-COVID-19 syndrome are ongoing and further insights into underlying mechanisms are likely to be established.
252. There is no diagnostic test or in many cases objective features that can be used to confirm a diagnosis of Post-COVID-19 syndrome. Even the terminology used to describe the condition has yet to be firmly established as described earlier. The term ‘long COVID’ is commonly used but it lacks a definition with established validity.
253. Our current understanding of symptoms following COVID-19 infection is provisional. Much of it relates to self-reported symptoms without objective measurements, and to symptoms that improve over the course of several months with an impact on function that is poorly correlated with both the number and severity of symptoms. Studies of longer-term symptoms persisting for a year or more necessarily relate only to infection from the early stages of the pandemic. The influence of changing viral strains on the extent and nature of prolonged symptoms, and the influence of immunisation remains largely unknown. An understanding of the mechanisms underlying many of the symptoms remains to be established, as do objective tests to help confirm a diagnosis. Similarly, much more work is required on which symptoms in which patients lead to which functional impairments.
Summary
- A wide range of symptoms is reported following recovery from acute COVID- 19. In some cases, these can be explained by a complication of the acute illness but in many cases they cannot. The underlying pathophysiology of these symptoms of the Post-COVID-19 syndrome is not understood and there is, as yet no diagnostic test that can help confirm a diagnosis.
Discussion
254. This paper extends the evaluation carried out previously by IIAC using data available in 2020 on the impact of the COVID-19 pandemic on the health of UK workers and now includes reports and publications up to the end of 2021. Much of the previous report focused on occupational mortality data. During 2021 much more evidence relating to morbidity of workers became available including data on the risks of infection, severe disease and hospitalisation within different occupations.
255. During 2020 and 2021, the UK, like many other countries, experienced varying patterns of population infection rates and consequently varying restrictions on movement, closure of schools, shops and other venues and changes to working patterns. There were several variants of SARS-CoV-2 during the 2 years and substantial changes to detection and treatment, including the introduction of population vaccination programmes. This complex situation has presented IIAC with challenges when interpreting the large amount of data collected and reports and papers published.
256. The studies reviewed by IIAC used a wide range of study designs, methodologies and data sources. The sizes of the studies vary as does the quality and quantity of the information collected including information of potential confounders and effect modifiers. Pearce et al., (2021) reviewed a number of the key UK databases potentially available to assess occupational risks of COVID-19. The authors suggested that none of the data sets were ideal for the purpose, and all had various strengths and weaknesses.
257. During the first 4 months of 2021 there was a large wave of deaths from COVID-19. However, an analysis of the death registration data by occupation has not yet become available for 2021. The age-adjusted mortality data published by ONS for 2020 highlighted high death rates found in food processing, care work, transport, security, nursing, local, national and local government administration and retail work. These findings are also reflected in an analysis of the same dataset of excess mortality, a measure considered by some as one the most objective indicators of the impact of a pandemic (Karlinsky and, Kobak 2021). The highest excess mortality was found for Health care workers followed by transport workers, social care workers and police and protective service workers (Matz et al., 2022). Death certificate data on occupation may suffer from a number of limitations including under-reporting, inaccuracy and imprecision. The Council noted in their previous report that a high rate of Coroner referrals and delayed reporting of deaths in health care workers, or redeployment of staff away from their usual role may also have impacted on the results.
258. The increased risk of death in specific occupations is also generally mirrored in the results for the risk of infection. However, these risks vary across 2020 and 2021 and depend on the dates when the studies were carried out showing a tendency to follow the same patterns as the overall population infection rates. Many of the studies were able to collect more detailed information such as ethnicity, housing, region, deprivation and thus were able to explore the association of these factors with COVID-19 risk. Studies using individual patient data were also able to collect data on co-morbidities and lifestyle factors. The Council noted, however, that there was a wide variation in the data collected and how this was used, particularly in the choice and definition of variables included in statistical modelling of risk.
259. Generally, the same coding system, SOC codes, was used to classify occupations with varying aggregations of the codes used in analyses. IIAC noted that, in some studies, analyses using the most detailed occupational groups (4-digits) were based on small numbers of cases. Most studies focused on estimating risk for essential/key occupations although the definitions of these varied. There was also a range of choice of reference occupation, for example all ‘non-essential’ workers, office-based occupations, corporate managers, all other occupations.
260. The magnitude of risk estimates relating occupation to risk of COVID has been shown to decline when covariates such as ethnicity, socio-economic status, deprivation, and co-morbidities, are included in mathematical models in some, but not all, studies. However, many of these variables are highly correlated and risk estimates stratified by occupation for these covariates are often not presented. Small numbers of cases in some occupations may also reduce the power of a study to detect associations. There may thus be uncertainty about whether adjustment for a large number of related variables might artificially reduce the measured occupational risk.
261. Studies such as that by Elliott J et al., (2021) have highlighted the non-occupational influences of risk of death from COVID-19, with increased risk for men, older age groups, non-white ethnicity, living in a deprived area and unemployment. A spatial analysis of the spread and dynamics of COVID-19 in Europe found that the proportion of older people (aged ≥75 years) in the population, gross domestic product per capita, and the unemployment rate were associated with high COVID-19 mortality rates (Amdaoud et al., 2020). Amalgro and Orane-Hutchinson (2022) explored the dynamics of occupation and socioeconomic inequalities in New York and showed that inequality in COVID-19 incidence was strongly associated with occupation, which itself was strongly correlated with gender and racial inequalities. Lockdowns increased inequalities because people working in front-line jobs, such as essential retail, delivery, and health-care workers were unable to work from home. Many workers in these industry sectors are also in the lower deciles of income and more likely to be living in deprived areas; sectors such as Health and Social care also have higher proportions of workers of non-white ethnicity. Disentangling the effects of these interrelated social determinants of health from work related factors is thus challenging.
262. Since the start of the pandemic there has been a large number of localised outbreaks of COVID-19 in a wide range of industry sectors, many of which involve jobs requiring close physical proximity to other individuals. Knowledge of the modes of transmission of COVID-19 in both workplaces and community settings has accumulated over the 2 years and the Council acknowledges that there is now good evidence to inform the choice of appropriate measures to reduce the likelihood of infection and lessen any occupational risks.
263. The Council’s previous evaluation of the evidence drew attention to the inadequacy of available information on occupation. In addition to problems of using death certificate data, highlighted above, the Council noted that most of the studies of infection and hospitalisation rates were unable to include analyses by occupation or adjust for this; occupational information is rarely routinely collected in many healthcare data systems. Many of the studies reviewed were pre-peer-review scientific papers published online; IIAC has endeavoured to ascertain whether these have now been formally published in a journal and hence peer reviewed.
Conclusions
264. Any prescription for a disease under IIDB must be based on robust evidence such that it is possible to assume with reasonable certainty that the condition was acquired as a result of work. This means that there needs to be evidence to show that, on the balance of probabilities, it is more likely than not that a case of Covid19 infection was acquired at work and not elsewhere.
265. The complex patterns of infection and control measures that occurred during the pandemic in the UK has made it challenging to evaluate the health consequences in relation to work. The quality and quantity of available evidence has also varied widely. However, the Council feels that there is sufficient evidence to recommend prescription for Health and Social Care Workers whose work brings them into frequent close proximity with patients or clients. There is a large body of consistent supporting evidence from infection, morbidity and mortality studies to show that workers in these occupations have been exposed to significantly increased risk of infection. In addition, health and social care workers are more likely than many other occupations to be in close proximity to people who are infected during the course of the pandemic.
266. There clearly are other situations where COVID-19 infection was acquired in work settings other than health and social care. There is evidence of increased risk for several other occupations such as bus and taxi drivers and protective services. However, there are far fewer studies for these other sectors and the results are much more varied than for health and social care workers and do not always show consistent patterns over different waves of infection. In other sectors reviewed by IIAC, such as education and retail, the evidence for any increased risk was weaker with lower excess risks and inconsistent results over different time periods and between occupations within these sectors. In many of these occupations the likelihood of being in close proximity to people who were infected was much less than for Health and Social Care Workers. The Council concluded, therefore, that at this stage the evidence was of insufficient quantity and quality to recommend prescription for occupations other than Health and Social Care workers. We also \recognise that there have been outbreaks where several co-workers were infected and the spread was probably occupational. However, currently it is not possible to define these circumstances for the purposes of IIDB.
267. In terms of disease, IIAC require clearly defined disease entities with measurable diagnostics and a measurable loss of faculty or function that are likely to lead to one or more disabilities in order to recommend prescription. IIAC has identified robust evidence of several serious complications following COVID-19 that have been shown to cause persistent impairment and loss of function in some people; these are included in the recommendations below.
268. The Council also acknowledge that some people may suffer persisting symptoms that may impact of their daily activities including their work; a wide range of symptoms have been described including fatigue, cognitive dysfunction (ill-defined ‘brain fog’ or difficulty with concentration, memory problems), breathlessness, muscle and joint pains. Together these have been described as Post-COVID Syndrome or Long Covid. Currently, understanding of the underlying pathophysiology of the key symptoms of Post-COVID Syndrome is limited, as is the ability to measure and diagnose the condition objectively. IIAC therefore considered that there was insufficient evidence at present to recommend prescription for this syndrome.
269. The Council is aware that, separate from any prescription, there have been a few instances where individual workers have claimed under the accident provisions of the IIDB scheme by linking their exposure to SARS-CoV-2 to a specific incident or occurrence. IIAC also note that up until recently it was possible for a dependant of a deceased frontline NHS worker and Social Care Workers to claim under the Department of Health NHS and Social Care Coronavirus Life Assurance Scheme.
Recommendations
270. The Council recommends the following prescription should be added to the list of prescribed diseases for which benefit is payable:
1. Persisting pneumonitis or lung fibrosis following acute COVID-19 pneumonitis.
2. Persisting pulmonary hypertension caused by a pulmonary embolism developing between 3 days before and 90 days after a diagnosis of COVID-19.
3. Ischaemic stroke developing within 28 days of a COVID-19 diagnosis.
4. Myocardial infarction developing within 28 days of a COVID- 19 diagnosis.
5. Symptoms of Post Intensive Care Syndrome following ventilatory support treatment for COVID-19.
Workers in hospitals and other healthcare settings, Care Home workers and Home Care Workers* working in proximity to patients/clients in the 2 weeks prior to infection’
*Includes social workers visiting health facilities, hospitals, care homes and client homes.
Future Work by IIAC on Occupation and COVID-19
271. In this Command paper IIAC has recommended that specific complications of COVID-19 should be eligible for IIDB for the Health and Social Care Work sector. This decision is based on substantial and consistence evidence. However, as noted above, there is far less evidence currently available for other industry sectors. Although this shows some excess risk in several specific sectors, it is less robust and less consistent. The Council, at the current time, concluded that there was insufficient evidence for prescription for these occupations.
272. At the time of writing this report the UK was experiencing another large wave of cases of SARS-CoV-2 infection due mainly to the OMICRON (BA1, BA2) variant; hospitalisations and deaths also increased substantially. Most of the restrictions had been removed and retail and leisure venues were fully open.
273. The Council will thus continue to keep the situation under review and will continue to monitor the evidence and available data. The Council expects that there will be more evidence on the long-term adverse health consequences of COVID-19, including increased understanding of the underlying pathophysiology of the key symptoms of Post-COVID Syndrome.
274. The Council is aware of several ongoing analyses of the adverse health effects of COVID-19, particularly mortality and infection data for 2021 and 2022 and more detailed infection data. More information on outbreaks is also expected to become available. IIAC are in contact with some of the research groups involved in this work and will continue to monitor the literature for future published reports and papers. IIAC expects to carry out a further review of this issue in the near future.
Prevention
275. The Council’s previous report on COVID-19 included some observations on prevention. These are updated here, along with further observations relevant to post-COVID-19 syndrome.
276. Development of COVID-19 requires human-to-human transmission of the virus, SARS-CoV-2. The best way to prevent the disease is to stop the virus being transferred from the exhaled breath of an infectious person to the lungs of an uninfected individual. Preventive measures seek to reduce exposure by minimising emission of virus from infected people or by impeding it being inhaled by uninfected people. Common examples are the use of ‘face coverings’ (including cloth masks, visors) and Respiratory Protective Equipment (respirators); maintaining physical distance between people; reducing transmission through the environment (such as by providing good air ventilation and/or filtration). However, depending on circumstances, transmission may possibly occur by multiple routes (e.g., by inhaling aerosol; intercepting large droplets; and possibly hand contact with recently contaminated surfaces; physical contact with an infected person), so complete prevention for workers is not necessarily always feasible. While exposure levels vary in different workplaces, they are difficult to quantify, and will be subject to factors such as the presence of asymptomatic yet infective people. So, to try and manage the risk in the workplace employers need to consider all transmission routes and apply a variety of control measures.
277. These measures should usually include carrying out a COVID-19 risk assessment that considers maintaining adequate physical distance where possible, appropriate use of physical barriers and appropriate PPE, providing good ventilation, and maintaining regular sanitisation. At the time of writing HSE no longer requires every business to consider COVID-19 in their risk assessment or to have specific measures in place. However, under the COSHH Regulations, employers must protect workers who come into contact with COVID-19 either directly through their work, for example in researching the virus in laboratories or due to their work activity, such as health and social care workers caring for infectious patients. In these situations, employers must still undertake a risk assessment and implement appropriate control measures.
278. In the specific context of health care workers, updated guidance acknowledges the importance of airborne spread and the need for suitable risk assessment and protective measures when engaged in the face-to-face care of patients confirmed (or possibly) infected with COVID-19.
279. Vaccination has been shown to be effective in reducing the severity of COVID-19, mortality and the need for hospital admissions but has a much more limited effect on reducing transmission (Stokel, Walker 2022). There is some evidence that vaccination rates differ markedly by occupation, being lowest in elementary occupations, many of which involve contact with the general public (Nafilyan et al., 2021). So long as the SARS-CoV-2 virus is in circulation in the community and in workplaces, people will continue to develop COVID-19, and a proportion will develop post COVID-19 complications. While there is no evidence currently that post COVID-19 complications can be completely prevented, there is increasing evidence that long term (as well as short term) symptoms/complications are less frequent and less severe in people who have been vaccinated (Antonelli et al., 2021, PHE 2022, Ayoubkhani et al., 2022).
280. Those people who do develop ongoing activity-limiting symptoms as well as pathophysiological complications will need varying levels of support and rehabilitation to regain their work ability. The NHS has established numerous long COVID clinics and offers advice through the ‘Your COVID Recovery’ website. Work-related guidance has been published by various bodies to help people overcome their difficulties returning to work and normal activities. This guidance, which is variously directed at healthcare professionals and workplaces, has been compiled by the Faculty of Occupational Medicine, and the Society of Occupational Medicine.
Appendices: Tables and Figures
Table 1: Jobs categorised by 6-digit SOC codes with a score of 13 or more on the COVID-19 JEM, indicating relatively high risk of exposure to SARS-CoV-2 at work due to characteristics inherent in the job [Scoring (0,1,2 or3) based on 6 factors - job insecurity and migrant worker factors excluded]
| SOC 2-digit | SOC 4-digit | Sum 6 dimensions in JEM |
|---|---|---|
| 11 Corporate managers and directors | 1181 Health services and public health managers and directors | 15 |
| 1190 Managers and directors in retail and wholesale | 14 | |
| 12 Other managers and proprietors | 1221 Hotel and accommodation managers and proprietors | 14 |
| 1223 Restaurant and catering establishment managers and proprietors | 13 | |
| 1224 Publicans and managers of licensed premises | 14 | |
| 1226 Travel agency managers and proprietors | 13 | |
| 1241 Health care practice managers | 13 | |
| 1242 Residential, day and domiciliary care managers and proprietors | 15 | |
| 1251 Property, housing and estate managers | 13 | |
| 1252 Garage managers and proprietors | 13 | |
| 1253 Hairdressing and beauty salon managers and proprietors | 14 | |
| 1254 Shopkeepers and proprietors – wholesale and retail | 14 | |
| 1259 Managers and proprietors in other services n.e.c. | 13 | |
| 22 Health professionals | 2211 Medical practitioners | 14 |
| 2213 Pharmacists | 13 | |
| 2214 Ophthalmic opticians | 14 | |
| 2215 Dental practitioners | 14 | |
| 2216 Veterinarians | 13 | |
| 2217 Medical radiographers | 15 | |
| 2218 Podiatrists | 15 | |
| 2219 Health professionals n.e.c. | 15 | |
| 2221 Physiotherapists | 14 | |
| 2222 Occupational therapists | 15 | |
| 2223 Speech and language therapists | 13 | |
| 2231 Nurses | 16 | |
| 2232 Midwives | 14 | |
| 23 Teaching and educational professionals | 2312 Further education teaching professionals | 15 |
| 2314 Secondary education teaching professionals | 15 | |
| 2315 Primary and nursery education teaching professionals | 13 | |
| 2316 Special needs education teaching professionals | 13 | |
| 24 Business, media and public service professionals | 2412 Barristers and judges | 13 |
| 2413 Solicitors | 13 | |
| 2419 Legal professionals n.e.c. | 13 | |
| 2442 Social workers | 14 | |
| 2443 Probation officers | 14 | |
| 2444 Clergy | 15 | |
| 2449 Welfare professionals n.e.c. | 14 | |
| 2451 Librarians | 13 | |
| 32 Health and social care associate professionals | 3213 Paramedics | 14 |
| 3216 Dispensing opticians | 13 | |
| 3217 Pharmaceutical technicians | 14 | |
| 3218 Medical and dental technicians | 15 | |
| 3219 Health associate professionals n.e.c. | 13 | |
| 3231 Youth and community workers | 13 | |
| 3233 Child and early years officers | 13 | |
| 3234 Housing officers | 13 | |
| 3235 Counsellors | 14 | |
| 3239 Welfare and housing associate professionals n.e.c. | 13 | |
| 33 Protective service occupations | 3312 Police officers (sergeant and below) | 13 |
| 3314 Prison service officers (below principal officer) | 16 | |
| 3315 Police community support officers | 13 | |
| 3319 Protective service associate professionals n.e.c. | 14 | |
| 34 Culture, media and sports occupations | 3413 Actors, entertainers and presenters | 13 |
| 3443 Fitness instructors | 13 | |
| 35 Business and public service associate professionals | 3512 Aircraft pilots and flight engineers | 14 |
| 41 Administrative occupations | 4123 Bank and post office clerks | 13 |
| 4129 Financial administrative occupations n.e.c. | 13 | |
| 4135 Library clerks and assistants | 14 | |
| 42 Secretarial and related occupations | 4211 Medical secretaries | 13 |
| 52 Skilled metal, electrical and electronic trades | 5231 Vehicle technicians, mechanics and electricians | 13 |
| 5232 Vehicle body builders and repairers | 13 | |
| 54 Textiles, printing and other skilled trades | 5431 Butchers | 14 |
| 5432 Bakers and flour confectioners 14 | ||
| 5433 Fishmongers and poultry dressers | 14 | |
| 5436 Catering and bar managers | 13 | |
| 5443 Florists | 14 | |
| 61 Caring personal service occupations | 6121 Nursery nurses and assistants | 16 |
| 6122 Childminders and related occupations | 16 | |
| 6123 Playworkers | 16 | |
| 6125 Teaching assistants | 16 | |
| 6126 Educational support assistants | 16 | |
| 6131 Veterinary nurses | 13 | |
| 6141 Nursing auxiliaries and assistants | 16 | |
| 6142 Ambulance staff (excluding paramedics) | 14 | |
| 6143 Dental nurses | 14 | |
| 6144 Houseparents and residential wardens | 15 | |
| 6145 Care workers and home carers | 14 | |
| 6146 Senior care workers | 14 | |
| 6147 Care escorts | 14 | |
| 6148 Undertakers, mortuary and crematorium assistants | 13 | |
| 62 Leisure, travel and related personal service occupations | 6211 Sports and leisure assistants | 13 |
| 6212 Travel agents | 14 | |
| 6214 Air travel assistants | 15 | |
| 6215 Rail travel assistants | 14 | |
| 6219 Leisure and travel service occupations n.e.c. | 13 | |
| 6221 Hairdressers and barbers | 14 | |
| 6222 Beauticians and related occupations | 14 | |
| 6232 Caretakers | 14 | |
| 6240 Cleaning and housekeeping managers and supervisors | 14 | |
| 71 Sales occupations | 7111 Sales and retail assistants | 14 |
| 7112 Retail cashiers and check-out operators | 14 | |
| 7114 Pharmacy and other dispensing assistants | 14 | |
| 7115 Vehicle and parts salespersons and advisers | 14 | |
| 7121 Collector salespersons and credit agents | 13 | |
| 7123 Roundspersons and van salespersons | 13 | |
| 7124 Market and street traders and assistants | 13 | |
| 7125 Merchandisers and window dressers | 13 | |
| 7129 Sales related occupations n.e.c. | 13 | |
| 7130 Sales supervisors | 13 | |
| 81 Process, plant and machine operatives | 8135 Tyre, exhaust and windscreen fitters | 13 |
| 82 Transport and mobile machine drivers and operatives | 8213 Bus and coach drivers | 15 |
| 8214 Taxi and cab drivers and chauffeurs | 15 | |
| 8215 Driving instructors | 13 | |
| 92 Elementary trades and related occupations | 9211 Postal workers, mail sorters, messengers and couriers | 14 |
| 9233 Cleaners and domestics | 13 | |
| 9239 Elementary cleaning occupations n.e.c. | 13 | |
| 9241 Security guards and related occupations | 14 | |
| 9244 School midday and crossing patrol occupations | 14 | |
| 9249 Elementary security occupations n.e.c. | 14 | |
| 9251 Shelf fillers | 15 | |
| 9259 Elementary sales occupations n.e.c. | 13 | |
| 9271 Hospital porters | 16 | |
| 9273 Waiters and waitresses | 15 | |
| 9274 Bar staff | 14 | |
| 9279 Other elementary services occupations n.e.c. | 14 |
Table 2: ONS infection survey 01 Sept 2020 – 07 Jan 2021 by 2- and 4-digit SOC codes for health care and related occupations
| SOC | Title | Total sample size | Number testing positive | % +ve | lower 95% CI | upper 95% CI |
|---|---|---|---|---|---|---|
| 22 Health professionals | 7861 | 328 | 4.17 | 3.74 | 4.64 | |
| 32 | Health and social care associate professionals | 2776 | 118 | 4.25 | 3.53 | 5.07 |
| 61 | Caring personal service occupations | 486 | 8,878 | 5.47 | 5.01 | 5.97 |
| - | All workers | 140,787 | 5,710 | 4.06 | - | - |
| 3213 | Paramedics | 146 | 18 | 12.33 | 7.47 | 18.78 |
| 9274 | Health associated professionals n.e.c. | 346 | 27 | 7.80 | 5.21 | 1.15 |
| 2223 | Speech and language therapists | 129 | 8 | 6.20 | 2.72 | 11.85 |
| 3111 | Laboratory technicians | 278 | 17 | 6.12 | 3.60 | 9.61 |
| 4211 | Medical secretaries | 213 | 13 | 6.10 | 3.29 | 10.21 |
| 2214 | Ophthalmic opticians | 85 | 5 | 5.88 | 1.94 | 13.20 |
| 2231 | Nurses | 2613 | 125 | 4.78 | 4.00 | 5.67 |
| 3217 | Pharmaceutical technicians | 87 | 4 | 4.60 | 1.27 | 11.36 |
| 2211 | Medical practitioners | 1265 | 56 | 4.43 | 3.36 | 5.71 |
| 2219 | Health professionals n.e.c. | 140 | 6 | 4.29 | 1.59 | 9.09 |
| 2232 | Midwives | 260 | 11 | 4.23 | 2.13 | 7.44 |
| 2217 | Medical radiographers | 127 | 5 | 3.94 | 1.29 | 8.95 |
| 2212 | Psychologists | 187 | 7 | 3.74 | 1.52 | 7.56 |
| 2221 | Physiotherapists | 323 | 12 | 3.72 | 1.93 | 6.40 |
| 2215 | Dental practitioners | 189 | 7 | 3.70 | 1.50 | 7.48 |
| 2213 | Pharmacists | 278 | 10 | 3.60 | 1.74 | 6.52 |
| 2222 | Occupational therapists | 180 | 5 | 2.78 | 0.91 | 6.36 |
| 3219 | Health associate professionals n.e.c. | 247 | 5 | 2.02 | 0.66 | 4.66 |
| 2229 | Therapy professionals n.e.c. | 306 | 5 | 1.63 | 0.53 | 3.77 |
| 2218 | Podiatrists | 64 | 0 | 0.00 | 0.00 | 5.60 |
Results are unadjusted
Source: ONS. Coronavirus (COVID-19) Infection Survey: characteristics of people testing positive for COVID-19 in England, 22 February 2021
Table 3: REACT-1 rounds 1-13: Weighted Prevalences of Positive Tests and Adjusted Odds Ratios (aORs) for Heath and Care Home Workers and Key Workers
| Round* | Dates | Total sample size | Health Care and Care Home Workers: Number Positive | Health Care and Care Home Workers: Percentage Positive | Health Care and Care Home Workers: aOR(95% CI) | Key Workers : Number Positive | Key Workers : Percentage Positive | Key Workers : aOR(95% CI) | Other | ||
|---|---|---|---|---|---|---|---|---|---|---|---|
| Workers: Percentage Positive | |||||||||||
| Riley et al (2020b) | 1/5-1/6/20 | 4225 | 21 | 0.5 | 5.49 (3.11-9.69) | 28 | 0.17 | 1.83 (1.09-3.06) | 0.09 | ||
| Riley et al (2020b) | 19/6-7/7/20 | 988 | 7 | 0.09 | 1.13 (0.51-2.50) | 26 | 0.1 | 1.23 (0.72-1.97) | 0.08 | ||
| Riley et al (2020b) 24/7-11/8/20 | 8298 | 4 | 0.05 | 1.85 (0.62-5.51) | 10 | 0.04 | 1.44 (0.66-3.14) | 0.03 | |||
| Riley et al (2020b) | 20/8-8/9/20 | 63152 | 13 | 0.1 | 1.53 (0.84-2.80) | 28 | 0.16 | 1.02 (0.65-1.59) | 0.11 | ||
| Riley et al (2020b) | 18/9-5/10/20 | 18 | 0.53 | 1.03 (0.76-1.39) | 154 | 0.7 | 1.03 (0.85-1.25) | 0.47 | |||
| Riley et al (2020c) | 16/10-2/11/20 | 9257 | 124 | 1.78 | 1.14 (0.94-1.40) | 357 | 1.64 | 1.16 (1.01-1.32) | 1.22 | ||
| Riley et al (2020d) | 13/11-30/11/20 | 9460 | 122 | 1.54 | 1.2** | 267 | 1.04 | 1.15* | 0.82 | ||
| Riley et al (2021b) | 6/1-22/1/21 | 8259 | 161 | 2.24 | 1.48 | (1.25-1.77) | 531 | 1.79 | 1.35 (1.2-1.51) | 1.55 | |
| Riley et al (2021c) | 6/2-22/2/21 | 9042 | 55 | 0.73 | 1.37 | (1.02-1.86) | 165 | 0.57 | 1.19 (0.97-1.46) | 0.47 | |
| Riley et al (2021d) | 11/3-30/3/21 | 8614 | 19 | 0.21 | 0.99 | (0.58-1.68) | 44 | 0.2 | 0.91 (0.63-1.31) | 0.23 | |
| Riley et al (2021e) | 15/4-3/5/21 | 8384 | 6 | 0.07 | 0.7 | (0.29-1.66) | 26 | 0.12 | 1.31 | (0.79-2.15) | 0.12 |
| Elliott et al (2021) | 20/5-12/6/21 | 7955 | 6 | 0.08 | 0.37 | (0.16-0.87) | 17 | 0.12 | 0.55 | (0.32-0.94) | 0.18 |
| Elliott et al (2021) | 24/6-5/7/21 | 3089 | 17 | 0.55 | 0.98 | (0.58-1.66) | 30 | 0.5 | 0.83 | (0.55-1.27) | 0.55 |
*For references see Bibliography; ** aOR (adjusted odds ratio) estimated from the figure in the paper
Table 4: REACT-1 rounds 5-10 Adjusted Odds Ratios (95% CIs) of Positive tests for Sub-categories of key workers
| Key worker | Round 5 18/09-5/10 | Round 6 16/10-2/11 | Round 7 13/11-3/12 | Round 8 6/1/21-15/1 | Round 9 4/2-23/2 | Round 10 11/3-30/3 | Rounds 5 to 10 | |
|---|---|---|---|---|---|---|---|---|
| Health care workers with direct patient contact | 1.28 [0.92,1.78] | 0.98 [0.77,1.24] | 1.49 [1.17,1.88] | 1.16 [0.95,1.41] | 1.23 [0.87,1.73] | 1.30 [0.72,2.35] | 1.18 [1.05, 1.34] | |
| Health care workers with no patient contact | 0.66 [0.31,1.42] | 0.69 [0.43,1.11] | 1.03 [0.64,1.66] | 0.42 [0.24,0.71] | 0.89 [0.45,1.74] | 0.62 [0.15,2.56] | 0.76 [0.59, 0.98] | |
| Care home workers with direct contact with clients | 0.78 [0.29,2.13] | 1.53 [0.93,2.50] | 1.51 [0.84,2.71] | 2.02 [1.37,2.98] | 0.81 [0.30,2.18] | 1.24 [0.30,5.15] | 1.36 [1.02, 1.81] | |
| Care home workers without contact with clients | 1.35 [0.19,9.75] | 1.55 [0.49,4.90] | 1.25 [0.31,5.06] | 3.52 [1.78,6.95] | 3.04 [0.96,9.64] | 2.45 [1.57, 3.8] | ||
| Delivering to homes | 0.91 [0.45,1.83] | 0.86 [0.52,1.41] | 1.13 [0.68,1.89] | 1.15 [0.80,1.65] | 0.72 [0.32,1.61] | 1.84 [0.75,4.50] | 1.05 [0.84, 1.31] | |
| Food retail, other shop work | 1.18 [0.88,1.59] | 1.28 [1.03,1.57] | 1.20 [0.92,1.56] | 1.30 [1.08,1.56] | 1.13 [0.77,1.65] | 1.08 [0.57,2.05] | 1.24 [1.11, 1.38] | |
| Hospitality | 1.33 [0.92,1.91] | 1.20 [0.90,1.60] | 1.64 [1.19,2.24] | 1.20 [0.92,1.56] | 0.92 [0.47,1.78] | 0.24 [0.03,1.71] | 1.27 [1.1, 1.48] | |
| Personal care | 0.63 [0.26,1.52] | 1.56 [1.01,2.38] | 1.06 [0.58,1.94] | 0.81 [0.50,1.30] | 0.47 [0.12,1.87] | 0.57 [0.08,4.09] | 0.96 [0.66, 1.39] | |
| Policing, prisons, fire & rescue, coastguard | 0.85 [0.38,1.91] | 0.98 [0.60,1.62] | 2.02 [1.29,3.16] | 1.68 [1.17,2.41] | 1.49 [0.77,2.90] | 1.66 [0.53,5.22] | 1.45 [1.09, 1.92] | |
| Public transport | 1.40 [0.75,2.63] | 0.75 [0.40,1.40] | 1.39 [0.78,2.46] | 2.17 [1.58,2.97] | 2.14 [1.20,3.83] | 1.54 [0.49,4.86] | 1.54 [1.09, 2.17] | |
| Education, school, nursery or childcare | 1.15 [0.90,1.48] | 1.22 [1.04,1.44] | 1.14 [0.94,1.40] | 1.20 [1.03,1.39] | 1.43 [1.07,1.91] | 1.10 [0.66,1.83] | 1.2 [1.11, 1.31] | |
| Childcare | 0.57 [0.14,2.29] | 1.69 [0.42,6.83] | 0.98 [0.34, 2.83] | |||||
| Armed forces | 0.67 [0.09,4.80] | 1.84 [0.76,4.48] | 2.24 [0.55,9.07] | 1.70 [0.84, 3.43] | ||||
| Another public facing role | 0.94 [0.73,1.21] | 1.18 [1.00,1.38] | 1.16 [0.95,1.42] | 1.21 [1.05,1.39] | 1.22 [0.93,1.59] | 0.95 [0.57,1.57] | 1.15 [1.06, 1.25] | |
| Work outside but not in public facing role | 1.11 [0.91,1.35] | 1.04 [0.91,1.20] | 1.01 [0.85,1.21] | 1.12 [0.99,1.27] | 1.48 [1.19,1.83] | 1.30 [0.89,1.90] | 1.13 [1.02, 1.26] | |
| Not currently required to work outside my home | 0.84 [0.71,0.98] | 0.76 [0.68,0.85] | 0.74 [0.65,0.84] | 0.67 [0.61,0.74] | 0.64 [0.54,0.76] | 0.86 [0.64,1.16] | 0.73 [0.68, 0.79] |
For HCWs and CHWs the reference group is other key workers, for all other groups the reference group is no vs yes.
Table 5: REACT-2 Percentage seropositivity June 2020 – November 2020
| Key worker | Round 1: 20 June – 13 July 2020: tests n+ve/n | Round 1: 20 June – 13 July 2020: % +ve [95%CI] | Round 2: 31 July – 13 August 2020: tests | |||||
|---|---|---|---|---|---|---|---|---|
| n+ve/n | Round 2: 31 July – 13 August 2020: % +ve [95%CI] | Round 3: 15 – 28 September 2020: tests n+ve/n | Round 3: 15 – 28 September 2020: % +ve [95%CI] | Round 4: 27 October – 10 November 2020: tests n+ve/n | Round 4: 27 October – 10 November 2020: % +ve [95%CI] | |||
| Healthcare (patientfacing) | 379/3402 | 11.74 [10.51-13.06] | 389/3511 | 11.66 [10.46-12.96] | 578/5416 | 11.17 [10.21-12.20] | 589/6039 | 10.06 [9.19-11.00] |
| Healthcare (other) | 73/1151 | 5.95 [4.43-7.83] | 62/1112 | 5.03 [3.58-6.85] 113/1692 | 6.36 [5.04-7.91] | 133/1957 | 6.5 [5.26-7.95] | |
| Care home (client-facing) | 115/761 | 16.52 [13.67- 19.80] | 83/727 | 12.07 [9.52-15.10] | 108/979 | 11.6 [9.42-14.15] | 94/853 | 11.59 [9.27-14.34] |
| Care home (other) | 12/146 | 8.22 [4.05-14.96] | 12/224 | 4.77 [2.04-9.31] | 23/257 | 9.1 [5.59-14.06] | 21/233 | 9.17 [5.51-14.44] |
| Other essential worker | 1209/19927 | 5.62 [5.23-6.03] | 1019/19615 | 4.57 [4.21-4.96] | 1463/29572 | 4.27 [3.98-4.58] | 1799/31787 | 5.13 [4.83-5.44] |
| Other worker | 2189/37855 | 5.28 [5.00-5.57] | 1982/40782 | 4.17 [3.92-4.43] | 2704/60731 | 3.68 [3.48-3.88] | 3197/59632 | 4.77 [4.56-4.99] |
| Home delivery | 8/102 | 7.76 [3.17-16.05] | 36/1026 | 2.54 [1.38-4.12] | 76/1784 | 3.45 [2.43-4.70] | 102/1805 | 5.12 [3.95-6.52] |
| Retail 30/513 | 5.36 [3.29-8.22] | 284/5810 | 4.2 [3.57-4.91] | 258/6280 | 3.26 [2.70-3.89] | 343/6406 | 4.76 [4.13-5.46] | |
| Protective services* | 3/43 | 6.72 [1.21-20.73] | 65/934 | 6.7 [4.94-8.88] | 69/1343 | 4.5 [3.23-6.09] | 100/1481 | 6.45 [5.04-8.13] |
| Public transport or taxi | 4/33 | 12.92 [4.12-31.24] | 45/757 | 5.48 [3.70-7.79] | 69/1177 | 5.38 [3.93-7.17] | 84/1161 | 7.03 [5.40-9.00] |
| Teacher or childcare | 30/346 | 8.76 [5.71-12.90] | 365/5987 | 5.66 [4.96-6.42] | 566/11465 | 4.26 [3.80-4.76] | 704/11448 | 5.72 [5.21-6.27] |
| Armed forces | 0/9 | 0 [0.00-26.16] | 3/97 | 2.04 [0.00-8.80] | 10/132 | 7.44 [3.33-14.44] | 4/143 | 1.68 [0.00-6.71] |
| Other | 101/1597 | 5.93 [4.62-7.50] | 1029/21495 | 4.08 [3.75-4.43] | 1962/40297 | 4.18 [3.93-4.44] | 2243/39062 | 5.23 [4.96-5.51] |
| Not working outside home | 1293/32699 | 3.08 [2.83-3.34] | 1308/26118 | 4.35 [4.04-4.67] | 1380/30722 | 3.73 [3.45-4.01] | 1673/33005 | 4.42 [4.14-4.71] |
| All subjects | 5.96 [5.78-6.14] | 4.83 [4.67-5.00] | 4.38 [4.25-4.51] | 5.56 [5.43-5.71] |
- Emergency services, prisons, coastguard
Source: Ward et al (2020)
Table 6: Hiironen et al. (2021) Adjusted Odds Ratios* of Testing Positive by Occupation and Time Period
| Key worker | Aug-20: Cases/controls | Aug-20: OR (95% CI)* | Sep-20: Cases/ | ||||
|---|---|---|---|---|---|---|---|
| controls | Sep-20: OR (95% CI)* | Oct-20: Cases/controls | Oct-20: OR (95% CI)* | Meta-analysis across all periods** | |||
| Health care | 199/103 | 2.8 (2.0-4.0) | 176/73 | 2.7 (1.9-3.8) | 197/75 | 3.1 (2.7-3.0) | 2.9 (2.3,3.5) |
| Social care | 169/39 | 5.7 (3.5-9.1) | 95/21 | 4.9 (2.9-8.6) | 52/25 | 2.4 (1.3-4.4) | 4.2 (2.6,6.7) |
| Hospital work | 4.1 (2.2-7.5) | 2.3 (1.3-4.0) | 3.5 (2.2-5.6) | 3.2 (2.3,4.4) | |||
| GP work | 0.5 (0.2-1.4) | 2.2 (0.9-5.1) | 2.7 (1.2-7.2) | 1.5 (0.6,3.9) | |||
| Community hospital work | 0.1 (0.0-3.1) | 0.5 (0.1-3.1) | 0.6 (0.2- 2.8) | 0.4 (0.2,1.0) | |||
| Warehouse | 15/18 | 1.2 (0.4-3.6) | 29/6 | 5.3 (1.9-15.0) | 53/4 | 15.2 (4.6-50.4) | 3.9 (1.0, 15.8) |
| Hospitality | 98/54 | 2.9 (1.7-4.8) | 91/34 | 2.9 (1.8-4.7) | 86/47 | 2.1 (1.3-3.4) | 2.4 (1.8,3.1) |
| Construction | 77/75 | 1.4 (0.8-2.3) | 99/40 | 2.0 (1.3-3.1) | 154/59 | 2.7 (1.8-3.9) | 2.0 (1.4,3.0) |
| Education | 35/172 | 0.3 (0.2-0.5) | 238/129 | 1.6 (1.3-2.1) | 290/198 | 2.0 (1.6-2.6) | 1.0 (0.4,2.3) |
| Transport | 37/64 | 1.1 (0.6-2.0) | 42/37 | 0.8 (0.5-1.3) | 59/34 | 2.1 (0.9-5.0) | 1.2 (0.7,1.9) |
| Emergency services | 21/37 | 0.6 (0.3-1.2) | 10/7 | 1.8 (0.6-5.7) | 25/10 | 2.0 (0.7-5.5) | 1.3 (0.6,3.2) |
| Close contact services | 33/24 | 2.9 (1.1-7.7) | 22/8 | 1.1 (0.4-3.0) | 38/8 | 1.2 (0.8-1.9) | 1.9 (1.1,3.5) |
| Retail | 74/116 | 0.8 (0.6-1.3) | 68/60 | 1.0 (0.7-1.5) | 73/74 | 1.8 (1.1-3.0) | 1.0 (0.8,1.3) |
| Work - related travel | 15/62 | 0.4 (0.2-0.8) | 21/20 | 0.8 (0.4-1.6) | 13/36 | 0.5 (0.2-1.0) | 0.6 (0.4,0.9) |
| Arts, entertainment, recreation | 18/41 | 0.9 (0.4-1.9) | 27/30 | 0.8 (0.4-1.4) | 30/17 | 1.6 (0.8-3.4) | 1.0 (0.6,1.6) |
| Immigration services | 1/9 | 1.3 (0.1-25.6) | 1/3 | 0.3 (0.0-3.5) | 0/1 | 2.6 (0.1-66.6) | 0.7 (0.1,3.2) |
| Military | 0/11 | 0.1 (0.0-3.5) | 11/3 | 6.5 (1.2-36.8) | 10/3 | 4.8 (0.9-26.9) | 3.0 (0.5, 18.6) |
| Food production and agriculture | 17/24 | 1.2 (0.4-3.5) | 31/8 | 1.8 (0.9-4.0) | 17/17 | 0.9 (0.4-2.2) | 1.0(0.6,1.8) |
*Adjusted for age, sex, ethnicity, region, index for multiple deprivation, non-work exposures, leisure activities.
**Adjusted for age, sex, ethnicity, index for multiple deprivation, geographical region, and non-work community activities
Table 7: Secondary attack rates among named close contacts by selected
workplace settings, 24 October to 31 December 2020 (NHS Test and Trace Data, EMG 2021a)
| Work or Activity | Attack Rate |
|---|---|
| Household contact | 10.3 |
| Military (incl. civilian employees) | 6.2 |
| Information and communication | 6.1 |
| Financial services incl. insurance | 5.8 |
| Arts, entertainment or recreation | 5.7 |
| Emergency services | 5.7 |
| Social care or home care | 5.4 |
| Manufacturing or construction | 5.1 |
| Civil service or Local Government | 5.0 |
| Food production and agriculture | 5.0 |
| Transport | 4.9 |
| Other occupational sector | 4.7 |
| Warehouse or distribution | 4.6 |
| Hospitality | 4.5 |
| Health care | 4.5 |
| Work travel or activity outside workplace | 4.0 |
| Retail sector | 3.9 |
| Critical national infrastructure | 3.8 |
| Prison / detention facility | 3.5 |
| Immigration / border force services | 3.4 |
| Close contact services | 2.9 |
Table 8: Studies of SARS-CoV-2 seropositivity amongst hospital staff
| Author | Location | Period | Number of positive tests//total tests | High | |||||
|---|---|---|---|---|---|---|---|---|---|
| seropositivity rates | % +ve | Reference group | % +ve | aOR | 95% CI | ||||
| Eyre et al 2020* | Oxford | 23/4 - 8/6 | 10,044/13,800 | COVID-19 ward | 22.6 | All others | 8.6 | 2.39 | 1.91-3.00 |
| Haem-, oncology | 15.6 | Admin | 7.2 | 1.96 | 1.32-2.92 | ||||
| Medicine | 28 | 1.47 | 1.02-2.11 | ||||||
| Ortho, trauma, rheumatology | 17.3 | 1.83 | 1.23-3.72 | ||||||
| Porter | 18.6 | 1.96 | 1.26-3.04 | ||||||
| Hanrath et al 2021 | Newcastle | 29/5- | 11,103/17,126 | Domestic services | 13.2 | Admin and managerial | 5.9 | 2.49 | 1.75-3.54 |
| Estates and catering | 8.5 | 1.97 | 1.24-3.12 | ||||||
| Health care assistants | 11.4 | 1.78 | 1.33-2.36 | ||||||
| Patient-facing clerical | 10.5 | 1.80 | 1.16-2.80 | ||||||
| Nurses/midwives | 9.0 | 1.40 | 1.09-1.80 | ||||||
| Shorten et al 2021 | Lancashire | 29/5- 4/7 | 2,274/8,500 | work in COVID-19 areas | other | 2.68 | 2.27-3.14 | ||
| Ken-Dror et al 2021 | Surrey | 10/20- 11/20 | 3,119/4,000 | Nurse/ midwife | 23.8 | Admin | 15.4 | 1.11 | 0.83-1.50 |
| Clinical support | 22 | 1.09 | 0.79-1.50 | ||||||
| medicine | 19.6 | 0.73 | 0.51-1.06 |
- Eyre % includes both PCR and antibody +ve
Table 9: ONS mortality study. Numbers of deaths involving COVID-19, Death Rates per 100,000 (95% Confidence Intervals), and relative risks (RR) from selected 4 digit SOC codes: men and women aged 20-64, England and Wales, deaths registered between 9th March and 28th December 2020.
| SOC | Description | Men: Deaths | Men: Rate | Men: (95% CI) | Men: RR* | Women: Deaths | Women: Rate | Women: (95% CI) | Women: RR* |
|---|---|---|---|---|---|---|---|---|---|
| 6145 | Care workers and home carers | 107 | 109.9 | (88.6, 141.3) | 3.5 | 240 | 47.1 | (41.1, 53.1) | 2.8 |
| 6141 | Nursing auxiliaries and assistants | 45 | 87.2 | (63.3, 117.1) | 2.8 | 54 | 25.3 | (18.9, 33.1) | 1.5 |
| 2231 | Nurses | 47 | 79.1 | (57.4, 106.1) | 2.5 | 110 | 24.5 | (19.7, 29.4) | 1.5 |
| 6142 | Ambulance staff (excluding paramedics) | 15 | 95.2 | (38.7, 178.5) | 3.0 | ||||
| 9271 | Hospital porters | 18 | 86.7 | (47.7, 142.3) | 2.8 | ||||
| 2442 | Social workers | 25 | 32.4 | (20.7, 32.4) | 1.9 | ||||
| 8214 | Taxi and cab drivers and chauffeurs | 209 | 101.4 | (87.5-115.2) | 3.2 | ||||
| 8211 | Large goods vehicle drivers | 118 | 39.7 | (32.4-47.1) | |||||
| 8212 | Van drivers | 97 | 39.7 | (32.1-48.5) | |||||
| 8213 | Bus and coach drivers | 83 | 70.3 | (55.3-88.0) | 2.4 | ||||
| 8222 | Fork-lift truck drivers | 22 | 34.8 | (21.4-53.1) | |||||
| 8229 | Mobile machine drivers/ operatives | 16 | 44.2 | (24.9-72.3) | |||||
| 1254 | Shopkeepers and proprietors: wholesale and retail | 54 | 69 | (51.8-90.1) | 2.2 | 12 | 36 | (18.0-63.8) | 2.1 |
| 5431 | Butchers | 15 | 207 | (112-347) | 6.6 | ||||
| 5432 | Bakers and flour confectioners | 15 | 715.6 | (331-1283) | |||||
| 7111 | Sales and retail assistants | 69 | 56.5 | ( 3.7-71.9) | 1.8 | 111 | 26.9 | (21.8-31.9) | 1.6 |
| 7112 | Retail cashiers and check-out operators | 11 | 61.6 | (27.9-115) | 2.0 | 15 | 15.7 | (8.4-26.4) | |
| 7115 | Vehicle and parts salespersons and advisers | 11 | 42.1 | (20.3-76.6) | |||||
| 7219 | Customer service occupations n.e.c. | 16 | 41.8 | (23.2-68.8) | 17 | 12.6 | (7-20.8) | ||
| 9273 | Waiters and waitresses | 14 | 95.7 | (46.6-169.1) | 3.0 | ||||
| 1223 | Restaurant/catering managers/ proprietors | 26 | 119.3 | (71.2-183.8) | 3.8 | ||||
| 1224 | Publicans and managers of licensed premises | 19 | 219.9 | (124.7-354.2) | 7.0 | ||||
| 5434 | Chefs | 82 | 103.1 | (79.9-130.5) | 3.3 | 13 | 40.2 | (20.5-70) | 2.4 |
| 5436 | Catering and bar managers | 13 | 86.8 | (41.6-155.4) | 2.8 | ||||
| 9272 | Kitchen & catering assistants | 29 | 57.0 | (38.0, 81.9) | 1.8 | ||||
| 5432 | Bakers & flour confectioners | 15 | 715.6 | (331, 1282.8) | 22.7 | ||||
| 3312 | Police officers (sergeant and below) | 19 | 194.1 | (93.3-336.3) | 6.2 | ||||
| 3319 | Protective service associate professionals n.e.c. | 13 | 39.3 | (20.1-68.3) | |||||
| 9241 | Security guards and related occupations | 140 | 100.7 | (83.8-117.6) | 3.2 | ||||
| 2314 | Secondary education teaching professionals | 29 | 39.2 | (15.9-44.8) | 23 | 21.2 | (12.4-33.2) | ||
| 2312 | Further education teaching professionals | 10 | 24.7 | (10.7-47.6) | |||||
| 2311 | Higher education teaching professionals | 10 | 11.5 | (12.4-33.2) | |||||
| 6122 | Childminders and related occupations | 18 | 27.8 | (15.9-44.8) | |||||
| 2317 | Senior educational professionals | 12 | 25.2 | (10.7-47.6) | |||||
| 6125 | Teaching assistants | 37 | 15 | (10.2-21) | |||||
| 6121 | Nursery nurses and assistants | 12 | 11.8 | (5.3-22) | |||||
| 2315 | Primary and nursery education professionals | 19 | 10 | (5.4-16.5) | |||||
| 9120 | Elementary construction occupations | 70 | 82.1 | (63.9, 103.7) | 2.6 | ||||
| 8125 | Metal working machine operatives | 40 | 106.1 | (74.5, 146.0) | 3.4 | ||||
| 8111 | Food, drink and tobacco process operatives | 52 | 103.7 | (77.5, 136.4) | 3.3 | ||||
| 5313 | Roofers, roof tilers & slaters | 19 | 100.5 | (55.8, 163.6) | 3.2 | ||||
| 4113 | Local govt administrative occupations | 23 | 72.1 | (44.8, 109.4) | 2.3 | ||||
| 9233 | Cleaners and domestics | 58 | 66.6 | (50.3, 86.5) | 2.1 | ||||
| 4112 | National government administrative occupations | 28 | 58.5 | (38.8, 84.7) | 1.9 | 26 | 27.9 | (18.1, 41.2) | 1.7 |
| 9211 | Postal workers, mail sorter, messengers, couriers | 64 | 58.2 | (44.5, 74.6) | 1.9 | ||||
| 5231 | Vehicle technicians, mechanics & electricians | 48 | 58.0 | (42.4, 77.4) | 1.8 | ||||
| 9260 | Elementary storage occupations | 111 | 54.0 | (43.4, 64.6) | 1.7 | ||||
| 9236 | Vehicle valets & cleaners | 10 | 142.9 | (60.7, 275.5) | 4.6 | ||||
| 6221 | Hairdressers & barbers | 12 | 112.5 | (49.6, 209.8) | 3.6 | 18 | 44.0 | (24.2, 72.2) | 2.6 |
| 4123 | Bank & post office clerks | 11 | 105.5 | (49.6, 193.7) | 3.4 | ||||
| 5235 | Aircraft maintenance & related trades | 11 | 70.8 | (34.4, 128.2) | 2.3 | ||||
| 8137 | Sewing machinists | 14 | 64.8 | (34.6, 110) | 3.9 | ||||
| 6144 | Houseparents & residential wardens | 13 | 37.4 | (18.8, 65.7) | 2.2 | ||||
| All jobs | 5128 | 31.4 | (30.6-32.3) | 2833 | 16.8 | (16.2-17.5) |
- Relative Risks (RR) for each occupational group have been estimated by dividing the death rate/100,000 for the specific occupation by the overall death rate per 100,000 (31.4 deaths per 100,000 men of the working population; 16.8 deaths per 100,000 women of the working population)
Figures given only where there are 10 or more deaths.
Table 10: Number of worker COVID-19 disease reports made by employers to HSE and Local Authorities by disease severity and industry sector (RIDDOR)
| Industry sector (as reported by employer) | Total COVID-19 notifications | Fatal notifications (1) | Non-fatal notifications |
|---|---|---|---|
| All industry | 44,458 | 459 | 43,999 |
| All Manufacturing | 2,043 | 16 | 2,027 |
| Manufacture of food products including drinks | 602 | 3 | 599 |
| Other manufacturing | 1,484 | 13 | 1,471 |
| Construction | 348 | 4 | 344 |
| Wholesale and retail trade; repair of motor vehicles and motorcycles | 874 | 3 | 871 |
| Transportation and storage | 893 | 10 | 883 |
| Accommodation and food service activities (2) | 2,173 | 16 | 2,157 |
| Information/communication; financial/insurance; real estate activities; professional, scientific and technical activities; admin/support service | 1,102 | 15 | 1,087 |
| Public administration and defence; compulsory social security | 2,310 | 8 | 2,302 |
| Education | 3,955 | 18 | 3,937 |
| Human health and social work activities (2) | 25,038 | 307 | 24,731 |
| Human health activities (subcategory) | 12,330 | 170 | 12,160 |
| Residential care activities (subcategory) | 11,524 | 122 | 11,402 |
| Arts, entertainment and recreation; other service activities (2) | 4,934 | 59 | 4,875 |
(1) Data is as reported. Includes some non-fatal cases that have been reported as fatal
(2) A review of a sample of reports shows that many reports allocated to the accommodation sector and to other personal services (within arts, entertainment and recreation; other service activities) have been mis-classified by employers and are actually reports for workers in health and social work sector
Figure 1: Temporal trends of fatal and non-fatal notifications under RIDDOR by week of notification
Number of RIDDOR fatal and non-fatal COVID-19 disease reports made by employers to HSE and local authorities by week the report was submitted
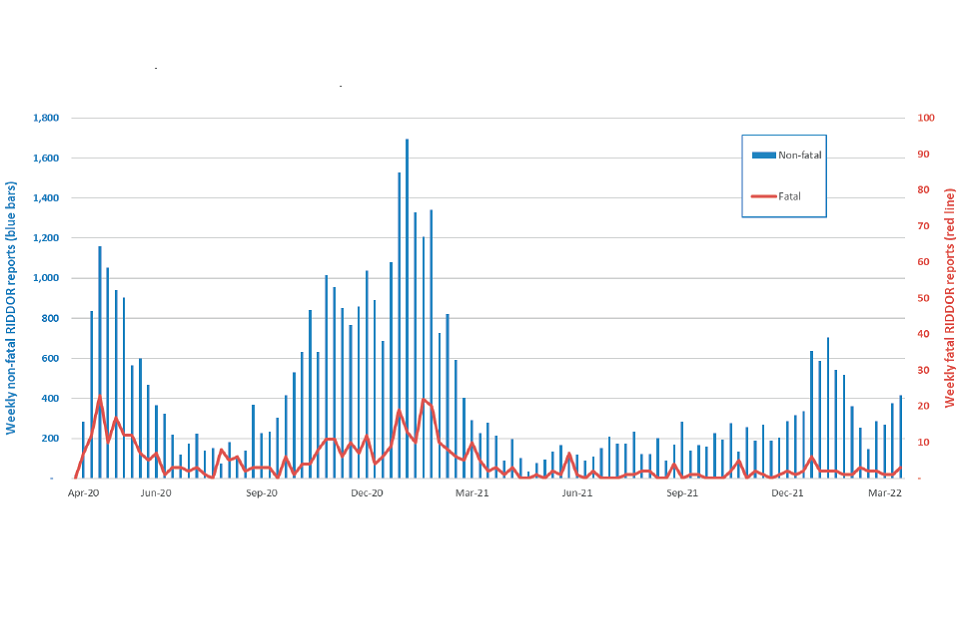
Temporal trends of fatal and non-fatal notifications under RIDDOR by week of notification
Table 11: Hazard ratios (95% Confidence Intervals) for COVID-19 related deaths for males and females aged 40 to 64, for selected non-health related occupations compared to corporate managers and directors (Nafilyan et al., 2021)
| Non-health related occupations | Males: Age-adjusted | Males: Fully-adjusted* | Females: Age-adjusted | Females: Fully-adjusted* |
|---|---|---|---|---|
| Taxi/cab drivers, chauffeurs | 4.62 (3.64 - 5.87) | 1.49 (1.15 – 1.92) | 6.39 (2.49 – 16.39) | 2.77 (1.07 – 7.16) |
| Bus and coach drivers | 3.50 (2.61 – 4.70) | 1.18 (0.86 – 1.61) | 4.79 (1.87 – 12.29) | 1.94 (0.75 – 5.01) |
| Van drivers | 2.66 (1.75 – 4.02) | 1.37 (0.90 – 2.08) | 2.58 (1.01 – 6.63) | 1.43 (0.55 – 3.69) |
| Mobile machine and other drivers | 2.27 (1.72 – 2.99) | 1.27 (0.95 – 1.68) | 2.33 (0.71 – 7.60) | 1.31 (0.40 – 4.31) |
| Large goods vehicle drivers | 1.75 (1.30 – 2.35) | 1.47 (1.09 – 1.98) | - | - |
| Food preparation and hospitality | 2.48 (1.87 – 3.27) | 0.96 (0.71 - 1.28) | 2.00 (1.23 – 3.27) | 0.99 (0.60 – 1.63) |
| Sales occupations | 2.46 (1.92 – 3.15) | 1.22 (0.94 – 1.58) | 2.37 (1.63 – 3.46) | 1.13 (0.77 – 1.67) |
| Leisure, travel, personal services | 2.17 (1.55 – 3.04) | 1.23 (0.87 – 1.73) | 1.74 (1.11 – 2.73) | 1.25 (0.79 – 1.97) |
| Culture, media and sports | 1.01 (0.68 – 1.49) | 0.90 (0.61 - 1.33) | 0.67 (0.32 – 1.40) | 0.70 (0.33 – 1.50) |
| Managers and directors in retail and wholesale | 1.67 (1.27 – 2.24) | 1.07 (0.80 – 1.42) | 1.88 (1.10 – 3.22) | 1.37 (0.80 – 2.35) |
| Elementary security occupations | 3.67 (2.82 – 4.79) | 1.21 (0.92 – 1.59) | 3.03 (1.88 – 4.87) | 1.36 (0.83 – 2.21) |
| Protective service occupations | 0.74 (0.48 – 1.13) | 0.65 (0.43 – 1.00) | 0.45 (0.11 – 1.88) | 0.38 (0.09 – 1.61) |
| Teaching and educational professionals | 0.99 (0.71 – 1.38) | 1.05 (0.75 – 1.47) | 0.88 (0.56 – 1.37) | 1.06 (0.67 – 1.66) |
| Secretarial and related occupations | 3.89 (2.39 – 6.34) | 2.32 (1.42 – 3.77) | 1.19 (0.78 – 1.82) | 0.94 (0.62 – 1.44) |
| Customer service occupations | 2.97 (2.06 – 4.29) | 1.72 (1.19 – 2.49) | - | - |
| Other elementary occupations | 4.22 (3.23 – 5.52) | 1.65 (1.26 – 2.18) | - | - |
| Science, engineering and technology | 1.67 (1.24 – 2.25) | 1.29 (0.96 – 1.75) | 1.59 (0.82 – 3.09) | 1.32 (0.68 – 2.58) |
| Administrative occupations | 2.00 (1.45 – 2.76) | 1.18 (0.85 – 1.65) | 1.36 (0.93 – 1.99) | 1.01 (0.69 – 1.49) |
| Cleaners and domestics | 3.23 (2.35 – 4.44) | 1.27 (0.92 – 1.77) | 2.89 (1.95 – 4.27) | 1.24 (0.83 – 1.85) |
| Elementary cleaning excl. cleaners/ domestics | 1.90 (1.34 – 2.67) | 1.11 (0.78 – 1.58) | 4.79 (1.87 – 12.29) | 1.98 (1.03 – 3.81) |
| Plant and machine operatives | 1.75 (1.30 – 2.35) | 0.90 (0.67 – 1.22) | 5.54 (3.04 – 10.10) | 1.66 (0.89 – 3.08) |
| Elementary storage occupations | 2.44 (1.90 – 3.12) | 1.17 (0.91 – 1.51) | 2.81 (1.50 – 5.26) | 1.58 (0.84 – 2.98) |
| Business, media, public service professionals | 1.01 (0.79 – 1.29) | 0.94 (0.94 - 1.20) | 1.08 (0.70 – 1.69) | 1.01 (0.67 – 1.66) |
*Adjusted for age, geographical factors, ethnicity, education, socioeconomic characteristics, co-morbidities
Table 12: ONS infection study 1/9/20 to 7/1/21: non health/ social care occupations
| SOC | Job title (SOC) | N +ve | Sample size | % + ve (95%CI) |
|---|---|---|---|---|
| 8231 | Train and tram drivers | 11 | 147 | 7.48 (3.79-12.99) |
| 8214 | Taxi and cab drivers and chauffeurs | 22 | 318 | 6.92 (4.39-10.29) |
| 8213 | Bus and coach drivers | 16 | 298 | 5.37 (3.10-8.57) |
| 8212 | Van drivers | 34 | 757 | 4.49 (3.13-6.22) |
| 6125 | Teaching assistants | 128 | 1927 | 6.64 (5.57-7.85) |
| 6121 | Nursery nurses and assistants | 28 | 449 | 6.24 (4.18-8.89) |
| 2314 | Secondary education teaching | 63 | 1162 | 5.42 (4.19-6.88) |
| 2315 | Primary and nursery teaching | 71 | 1362 | 5.21 (4.09-6.53) |
| 7125 | Merchandisers and window dressers | 7 | 90 | 7.78 (3.18-15.37) |
| 9251 | Shelf fillers | 4 | 67 | 5.97 (1.65-14.59) |
| 7129 | Sales related occupations n.e.c. | 4 | 72 | 5.56 (1.53-13.62) |
| 7130 | Sales supervisors | 6 | 127 | 4.72 (1.75-10) |
| 1254 | Shopkeepers and proprietors, wholesale and retail | 12 | 268 | 4.48 (2.33-7.69) |
| 7111 | Sales and retail assistants | 123 | 2785 | 4.42 (3.68-5.25) |
| 1190 | Managers and directors in retail and wholesale | 26 | 715 | 3.64 (2.39-5.28) |
| 5443 | Florists | 0 | 51 | 0.00 (0-6.98) |
| 6222 | Beauticians and related occupations | 17 | 246 | 6.91 (4.08-10.83) |
| 6221 | Hairdressers and barbers | 24 | 484 | 4.96 (3.2-7.29) |
| 1223 | Restaurant/ catering managers/ proprietors | 16 | 217 | 7.37 (4.27-11.7) |
| 9272 | Kitchen and catering assistants | 38 | 621 | 6.12 (4.37-8.3) |
| 8111 | Food, drink and tobacco process operatives | 6 | 105 | 5.71 (2.13-12.02) |
| 9273 | Waiters and waitresses | 21 | 421 | 4.99 (3.11-7.52) |
| 4216 | Receptionists | 36 | 760 | 4.74 (3.34-6.5) |
| 1221 | Hotel/ accommodation managers/proprietors | 4 | 150 | 2.67 (0.73-6.69) |
| 1172 | Senior police officers | 0 | 18 | 0 (0-18.53) |
| 3312 | Police officers (sergeant and below) | 60 | 1070 | 5.61 (5.61-7.16) |
| 3313 | Fire service officers (watch manager and below) | 12 | 196 | 6.12 (6.12-10.45) |
| 3314 | Prison service officers (below principal officer) | 8 | 127 | 6.3 (6.3-12.03) |
| 3319 | Protective service associate professionals n.e.c. | 9 | 206 | 4.37 (4.37-8.13) |
| 9241 | Security guards and related occupations | 23 | 366 | 6.28 (6.28-9.28) |
| Entire study population | 3928 | 95872 | 4.14 |
Bibliography
Ahmad MH and Teo SP. Post-intensive Care Syndrome. Ann Geriatr Med Res. 2021;25(2):72-78.
Ahuja N, et al. Thromboembolism in patients with COVID-19 infection: risk factors, prevention, and management. Semin Vasc Surg. 2021 Sep;34(3):101- 116
Aiano F., et al. Feasibility and acceptability of SARS-CoV-2 testing and surveillance in primary school children in England: Prospective, crosssectional study. PLoS One. 2021 Aug 27;16(8):e0255517
Almagro M, Orane-Hutchinson A. JUE insight: the determinants of the differential exposure to COVID-19 in New York city and their evolution over time. J Urban Econ 2020; published online Oct 28.
Amdaoud M et al. Are regions equal in adversity? A spatial analysis of spread and dynamics of COVID‐19 in Europe. The European Journal of Health Economics 2021.
Amin AN., et al. Duration of VTE Risk in Medically Ill Patients. J. Hosp. Med 2012;3;231-238.
Appleby J. NHS sickness absence during the covid-19 pandemic. BMJ. 2021 Mar 3;372:n471.
Anderson R. et al. (2020) SARS-CoV-2: Where do people acquire infection and ‘who infects whom’? London: The Royal Society.
Ayoubkhani D. et al. Epidemiology of post-COVID syndrome following hospitalisation with coronavirus: a retrospective cohort study. BMJ 2021;372:n693.
Bagheri G., et al. (2021) Face-masks save us from SARS-CoV-2 transmission. Preprint from arXiv, 28 May 2021
Balbi M, Conti C, Imeri G et al. Post-discharge chest CT findings and pulmonary function tests in severe COVID-19 patients. Eur J Radiol. 2021 May;138:109676.
Barbieri, T., et al. Italian workers at risk during the Covid-19 epidemic. 2020, Bank of Italy: Rome.
Barnes M., et al. Acute myocardial infarction and influenza: a meta-analysis of case–control studies. Heart. 2015;101:1738–1747.
Beale S et al. Occupation, work-related contact and SARS-CoV-2 antinucleocapsid serological status: findings from the Virus Watch prospective cohort study. OEM 2022, doi:10.1136/oemed-2021-107920
Brown J, Kirk-Wade E. A history of English Coronavirus lockdown laws April 2021. House of Commons Briefing Paper number 9068. 30 April 2020
Brown R, Coventry L, Pepper G. (2021) COVID-19: the relationship between perceptions of risk and behaviours during lockdown. Z Gesundh Wiss; 1-11.
Chen et al. COVID-19 outbreak rates and infection attack rates associated with the workplace: a descriptive epidemiological study 2021. medRxiv preprint doi.
Cherrie JW., et al. Effectiveness of face masks used to protect Beijing residents against particulate air pollution. Occupational and Environmental Medicine 2018;75:446-52.
Cherrie JW,. et al. Contamination of air and surfaces in workplaces with SARS-CoV-2 virus: a systematic review. Annals Work Exp Hth 2021; 65(8):879–892.
Chi Y., et al. The Long-Term Presence of SARS-CoV-2 on Cold-Chain Food Packaging Surfaces Indicates a New COVID-19 Winter Outbreak: A Mini Review. Frontiers in public health 2021; 9: 650493.
Crowley F, Doran J, Ryan G. (2020) The impact of COVID-19 restrictions on workers: Who is most exposed?
Dabisch P., et al. The Influence of Temperature, Humidity, and Simulated Sunlight on the Infectivity of SARS-CoV-2 in Aerosols. Aerosol Science and Technology 2020; 1-15.
Dalager-Pedersen M, Lund LC, Mariager T. Venous Thromboembolism and Major Bleeding in Patients with Coronavirus Disease 2019 (COVID-19): A Nationwide, Population-Based Cohort Study. Clin Infect Dis. 2021 Dec 16;73(12):2283-2293.
Davis HE, Assaf GS, McCorkell L et al. Characterizing long COVID in an international cohort: 7 months of symptoms and their impact. EClinicalMedicine. 2021 Aug;38:101019.
Dong J, Pinto JM, Guo X et al. The Prevalence of Anosmia and Associated Factors Among U.S. Black and White Older Adults. J Gerontol A Biol Sci Med Sci. 2017 Aug 1;72(8):1080-1086.
Douiri A, Muruet W, Bhalla A, et al. Stroke Care in the United Kingdom During the COVID-19 Pandemic. Stroke. 2021;52(6):2125-2133.
ECDC. (2020) COVID-19 clusters and outbreaks in occupational settings in the EU/EEA and the UK.
Edge R, van der Plaat DA, Parsons V et al. Changing patterns of sickness absence among healthcare workers in England during the COVID-19 pandemic. J Public Health (Oxf). 2022 Mar 7;44(1):e42-e50.
Elliott J et al. COVID‐19 mortality in the UK Biobank cohort: revisiting and evaluating risk factors. European Journal of Epidemiology 2021) 36:299–309.
Elliott P. et al (2021) REACT-1 round 13 final report: exponential growth, high prevalence of SARS-CoV-2 and vaccine effectiveness associated with Delta variant in England during May to July 2021. medRxiv 2021.09.02.21262979.
Emecen AN, Keskin S, Boncuckcu E et al Impact of social contacts on SARSCoV- 2 exposure among healthcare workers. Occupational Medicine 2021; 72: 10-16
Environmental Modelling Group (EMG 2021a). COVID-19 risk by occupation and workplace, 11 February 2021.
Environmental Modelling Group (EMG 2021b). Insights on transmission of COVID-19 with a focus on the hospitality, retail and leisure sector
Environmental Modelling Group (EMG 2021c). COVID-19 Transmission in Prison Settings
Evans S, Stimson J, Pople D, et al. Quantifying the contribution of pathways of nosocomial acquisition of COVID-19 in English hospitals. Int J Epidemiol. 2022;51(2):393-403.
Eyre DW, Lumley SF, O’Donnell D, et al. Differential occupational risks to healthcare workers from SARS-CoV-2 observed during a prospective observational study. eLife 2020;9:e60675.
Fabbri L, Moss S, Khan F et al. Post-viral parenchymal lung disease of COVID-19 and viral pneumonitis: A systematic review and meta-analysis. medRxiv 2021.03.15.21253593
Fatima Y, Bucks RS, Mamun AA, et al. Shift work is associated with increased risk of COVID-19: Findings from the UK Biobank cohort. J Sleep Res. 2021;30(5):e13326.
Fenton L, Gribben C, Caldwell D, et al. Risk of hospital admission with covid- 19 among teachers compared with healthcare workers and other adults of working age in Scotland, March 2020 to July 2021: population based casecontrol study. BMJ. 2021;374:n2060.
Frija-Masson J, Debray MP, Boussouar S, et al. Residual ground glass opacities three months after Covid-19 pneumonia correlate to alteration of respiratory function: The post Covid M3 study. Respir Med. 2021;184:106435.
Fransman W., et al. Development and Evaluation of an Exposure Control Efficacy Library (ECEL). The Annals of Occupational Hygiene 2008; 52: 567- 75.
Gaitens J et al. COVID-19 and Essential Workers: A Narrative Review of Health Outcomes and Moral Injury. Int. J. Environ. Res. Public Health 2021, 18, 1446.
Gamberini, Lorenzo et al. Health-related quality of life profiles, trajectories, persistent symptoms and pulmonary function one year after ICU discharge in invasively ventilated COVID-19 patients, a prospective follow-up study. Respir Med. 2021 Nov- Dec;189: 106665.
Gartland et al. Transmission and control of SARS-CoV-2 on ground public transport: A rapid review of the literature to date - 2021. Accessed February 2022.
Goldblatt P and Morrison J. Report of the Second Stage of a Study of London Bus Driver Mortality from COVID-19. UCL Institute of Health Equity, 2021
Grant J, Wilmore S, McCann N, et al. Seroprevalence of SARS-CoV- 2 antibodies in healthcare workers at a London NHS Trust. Infect Control Hosp Epidemiol 2020:1-12. Epub 3. 2020/08/05. doi: 10.1017/ice.2020.402.
Grau AJ, Buggle F, Becher H et al. Recent bacterial and viral infection is a risk factor for cerebrovascular ischemia: clinical and biochemical studies. Neurology. 1998;50(1):196–203.
Gregson FKA., et al. Comparing aerosol concentrations and particle size distributions generated by singing, speaking and breathing. Aero Sci Tech 2021; 55(6):1-14.
Grimnes G., et al. Acute infection as a trigger for incident venous thromboembolism: Results from a population-based case-crossover study. Res Pract Thromb Haemost. 2017;2(1):85-92.
Grønseth R, Vollmer WM, Hardie JA et al. Predictors of dyspnoea prevalence: results from the BOLD study. Eur Respir J. 2014 Jun;43(6):1610-20.
Hanrath AT., et al. SARS-CoV-2 Testing of 11,884 Healthcare Workers at an Acute NHS Hospital Trust in England: A Retrospective Analysis. Front Med (Lausanne). 2021 Mar 12;8:636160.
Hatch R., et al. Anxiety, Depression and Post Traumatic Stress Disorder after critical illness: a UK-wide prospective cohort study. Crit Care. 2018 Nov 23;22(1):310.
Havervall S., et al. Symptoms and Functional Impairment Assessed 8 Months After Mild COVID-19 Among Health Care Workers. JAMA. 2021 May 18;325(19)
Hayes LD, Ingram J, Sculthorpe NF. More Than 100 Persistent Symptoms of SARS-CoV-2 (Long COVID): A Scoping Review. Front Med (Lausanne). 2021 Nov 1;8:750378
Hickie I., et al. Post-infective and chronic fatigue syndromes precipitated by viral and non-viral pathogens: prospective cohort study. BMJ. 2006; 333(7568):575.
Hiironen I, Saavedra-Campos M, Panitz J. Occupational exposures associated with being a COVID-19 case; evidence from three case-controls studies. medRxiv 2020.12.21.2024816
Ho FK, Man KKC, Toshner M et al. Thromboembolic Risk in Hospitalized and Nonhospitalized COVID-19 Patients: A Self-Controlled Case Series Analysis of a Nationwide Cohort. Mayo Clin Proc. 2021 Oct;96(10):2587-2597.
Houlihan CF., et al. Pandemic peak SARS-CoV-2 infection and seroconversion rates in London frontline health-care workers. Lancet. 2020;396(10246):e6-e7.
Houghton C., et al. Barriers and facilitators to healthcare workers’ adherence with infection prevention and control (IPC) guidelines for respiratory infectious diseases: a rapid qualitative evidence synthesis. Cochrane Database Syst Rev 2020; 4: CD013582
House T et al. Inferring Risks of Coronavirus Transmission from Community Household data. Preprint from arXiv, 13 Apr 2021
HSE. (2021) SARS-CoV-2 (COVID-19) Transmission in Meat Processing Factories: Evidence Summary to 27 July 2020.
Huang C, Huang L, Wang Y et al. 6-month consequences of COVID-19 in patients discharged from hospital: a cohort study. Lancet. 2021 Jan 16;397(10270):220-232
Hull RD., et al. Venous thromboembolism in elderly high-risk medical patients: time course of events and influence of risk factors. Clin Appl Thromb Hemost. 2013 Jul-Aug;19(4):357-62.
Hunter E, Price DA, Murphy E et al. First experience of COVID-19 screening of health-care workers in England. Lancet.2020;395(10234):e77-e8.
IIAC Covid and Occupation. Position paper 48 March 2021.
Intensive Care National Audit and Research Centre. ICNARC report on COVID-19 in critical care: England, Wales and Northern Ireland 8 April 2022
Ismail SA, Saliba V, Lopez Bernal J et al. SARS-CoV-2 infection and transmission in educational settings: a prospective, cross-sectional analysis of infection clusters and outbreaks in England. Lancet Infect Dis. 2021 Mar;21(3):344-353.
Johnsen S, Sattler SM, Miskowiak KW et al. Descriptive analysis of long COVID sequelae identified in a multidisciplinary clinic serving hospitalised and non-hospitalised patients. ERJ Open Res. 2021 Aug 2;7(3):00205-2021.
Joris M, Minguet P, Colson C, et al. Cardiopulmonary Exercise Testing in Critically Ill Coronavirus Disease 2019 Survivors: Evidence of a Sustained Exercise Intolerance and Hypermetabolism. Crit Care Explor. 2021;3(7):e0491.
Karlinsky A, Kobak D. Tracking excess mortality across countries during the COVID-19 pandemic with the World Mortality Dataset. eLife 2021;10:e69336
Katsoularis I., et al. Risk of acute myocardial infarction and ischaemic stroke following COVID-19 in Sweden: a self-controlled case series and matched cohort study. Lancet. 2021 Aug 14;398(10300):599-607.
Katsoularis I., et al. Risks of deep vein thrombosis, pulmonary embolism, and bleeding after covid-19: nationwide self-controlled cases series and matched cohort study BMJ 2022; 377 :e069590
Keeley AJ, Evans C, Colton H, et al. Roll-out of SARS-CoV-2 testing for healthcare workers at a large NHS Foundation Trust in the United Kingdom, March 2020. Euro Surveill 2020;25(14):2000433.
Ken-Dror G, Wade C, Sharma SS, et al. SARS-CoV-2 antibody seroprevalence in NHS healthcare workers in a large double-sited UK hospital. Clin Med (Lond). 2021;21(3):e290-e294.
Kirwan PD, Elgohari S, Jackson CH, et al. Trends in risks of severe events and lengths of stay for COVID-19 hospitalisations in England over the prevaccination era: results from the Public Health England SARI-Watch surveillance scheme. arXiv 2021
Kollias A, Kyriakoulis KG, Lagou S, Kontopantelis E, Stergiou GS, Syrigos K. Venous thromboembolism in COVID-19: A systematic review and metaanalysis. Vasc Med. 2021 Aug;26(4):415-425.
Konstantinides SV, Meyer G, Becattini C et al. 2019 ESC Guidelines for the diagnosis and management of acute pulmonary embolism developed in collaboration with the European Respiratory Society (ERS): Eur Respir J. 2019 Oct 9;54(3):1901647.
Kress JP, Hall JB. ICU-acquired weakness and recovery from critical illness. N Engl J Med. 2014 Apr 24;370(17):1626-35.
Ladhani SN, Baawuah F, Beckmann J et al. SARS-CoV-2 infection and transmission in primary schools in England in June-December, 2020 (sKIDs): an active, prospective surveillance study. Lancet Child Adolesc Health. 2021 Jun;5(6):417-427.
Lam MH., et al. Mental Morbidities and Chronic Fatigue in Severe Acute Respiratory Syndrome Survivors: Long-term Follow-up. Arch Intern Med. 2009;169(22):2142–2147
Leeds JS., et al. Risk factors for detection of SARS-CoV-2 in healthcare workers during April 2020 in a UK hospital testing programme. EClinicalMedicine. 2020;26:100513.
Léonard-Lorant I., et al. Acute Pulmonary Embolism in Patients with COVID- 19 at CT Angiography and Relationship to d-Dimer Levels. Radiology. 2020;296(3):E189-E191.
Lentz RJ., et al. Assessing coronavirus disease 2019 (COVID-19) transmission to healthcare personnel: The global ACT-HCP case-control study. Infect Control Hosp Epidemiol 2021; 42: 381-87.
Longchamp G., et al. Proximal deep vein thrombosis and pulmonary embolism in COVID-19 patients: a systematic review and meta-analysis. Thromb J. 2021 Mar 9;19(1):15.
Lopez-Leon, S., Wegman-Ostrosky, T., Perelman, C. et al. More than 50 longterm effects of COVID-19: a systematic review and meta-analysis. Sci Rep 11, 16144 (2021).
Luo W, Liu X, Bao K, Huang C. Ischemic stroke associated with COVID-19: a systematic review and meta-analysis. J Neurol. 2022 Apr;269(4):1731-1740
Lumley SF, O’Donnell D, Stoesser NE et al. Antibody Status and Incidence of SARS-CoV-2 Infection in Health Care Workers. N Engl J Med. 2021 Feb 11;384(6):533-540
Mai V, Tan BK, Mainbourg S, et al. Venous thromboembolism in COVID-19 compared to non-COVID-19 cohorts: A systematic review with meta-analysis. Vascul Pharmacol. 2021;139:106882.
Malas MB, Naazie IN, Elsayed N, Mathlouthi A, Marmor R, Clary B. Thromboembolism risk of COVID-19 is high and associated with a higher risk of mortality: A systematic review and meta-analysis. EClinicalMedicine. 2020 Dec;29:100639.
Mansory EM, Srigunapalan S, Lazo-Langner A. Venous Thromboembolism in Hospitalized Critical and Noncritical COVID-19 Patients: A Systematic Review and Meta-analysis. TH Open. 2021;5(3):e286-e294
Martillo MA., et al. Post intensive Care Syndrome in Survivors of Critical Illness Related to Coronavirus Disease 2019: Cohort Study from a New York City Critical Care Recovery Clinic. Crit Care Med. 2021 Sep 1;49(9):1427- 1438.
Matz M., et al. Excess mortality among essential workers in England and Wales during the COVID-19 pandemic. Journal of Epidemiology and Community Health, in press.
Meyerowitz EA, Richterman A, Gandhi RT, Sax PE. (2021) Transmission of SARS-CoV-2: A Review of Viral, Host, and Environmental Factors. Ann Intern Med; 174: 69-79.
Modin D, Claggett B, Sindet-Pedersen C, et al. Acute COVID-19 and the Incidence of Ischemic Stroke and Acute Myocardial Infarction. Circulation. 2020;142(21):2080-2082.
Morgan A. Long-term outcomes from critical care. Surgery (Oxf). 2021 Jan;39(1):53-57
Misra S, Kolappa K, Prasad M et al. Frequency of Neurologic Manifestations in COVID-19: A Systematic Review and Meta-analysis. Neurology. 2021 Dec 7;97(23):e2269-e2281.
Mullol J., et al. Furthering the understanding of olfaction, prevalence of loss of smell and risk factors: a population-based survey (OLFACAT study). BMJ Open. 2012 Nov 6;2(6)
Musher DM, Abers MS, Corrales-Medina VF. Acute infection and myocardial infarction. N Engl J Med 2019;380:171-176
Mutambudzi M, Niedwiedz C, Macdonald EB, et al Occupation and risk of severe COVID-19: prospective cohort study of 120 075 UK Biobank participants Occup Environ Med 2020 0:1–8. doi:10.1136/oemed-2020- 106731.
Myers KD, Wilemon K, McGowan MP, Howard W, Staszak D, Rader DJ. COVID-19 associated risks of myocardial infarction in persons with familial hypercholesterolemia with or without ASCVD. Am J Prev Cardiol. 2021;7:100197.
Nafilyan V, Pawelek P, Ayoubkhani D et al. Occupation and COVID-19 mortality in England: a national linked data study of 14.3 million adults. Occup Environ Med. 2021 Dec 27:oemed-2021-107818.
Read Nagpaul 2021. Letter to the editor.
Nannoni S, de Groot R, Bell S, Markus HS. Stroke in COVID-19: A systematic review and meta-analysis. Int J Stroke. 2021;16(2):137-149.
Nasserie T, Hittle M, Goodman SN. Assessment of the Frequency and Variety of Persistent Symptoms Among Patients With COVID-19: A Systematic Review. JAMA Netw Open. 2021;4(5)
National Institute for Health and Care Excellence. COVID-19 rapid guideline: reducing the risk of venous thromboembolism in over 16s with COVID-19. NICE guideline NG186, 2020
National Institute for Health and Care Excellence. COVID-19 rapid guideline: managing the longterm effects of COVID-19. Published on 01.03.2022.
Needham DM., et al. Improving long-term outcomes after discharge from intensive care unit: report from a stakeholders’ conference. Crit Care Med. 2012 Feb;40(2):502-9
Nguyen, L. H., et al . Risk of COVID-19 among frontline healthcare workers and the general community: a prospective cohort study. Lancet Public Health 2020;5:e475–83
Nikayin S, Rabiee A, Hashem MD, et al. Anxiety symptoms in survivors of critical illness: a systematic review and meta-analysis. Gen Hosp Psychiatry. 2016;43:23-29.
Ochoa-Liete C et al. Occupational management of healthcare workers exposed to COVID-19. Occupational Medicine 2021;71:359–365.
Oksanen LAH., et al. Sources of healthcare workers’ COVID19 infections and related safety guidelines. Int J Occup Med Environ Health 2021; 34: 239-49.
ONS 2020a. Coronavirus and key workers in the UK 2019. Office of National Statistics, 15 May 2020
ONS 2020b Office for National Statistics. Coronavirus (COVID-19) related deaths by occupation, England and Wales: deaths registered between 9 March and 28 December 2020. (Release date 25 January 2021)
ONS 2021a. ONS Homeworking hours, rewards and opportunities in the UK 2011 to 2020. Office of National Statistics, 19 April 2021
ONS 2021b. ONS An overview of workers who were furloughed in the UK October 2021. Office of National Statistics, 1 October 2021
ONS 2021c Coronavirus (COVID-19) Infection Survey: characteristics of people testing positive for COVID-19 in countries of the UK, 20 May 2021
ONS 2021d Coronavirus (COVID-19) Infection Survey: characteristics of people testing positive for COVID-19 in England, 22 February 2021
ONS 2021e Coronavirus (COVID-19) Infection Survey: Updated estimates of the prevalence of post-acute symptoms among people with coronavirus (COVID-19) in the UK, 26 April 2020 to 1 August 2021
ONS 2021f Coronavirus (COVID-19) Infection Survey: Prevalence of ongoing Symptoms following coronavirus (COVID-19) infection in the UK: 7 October 2021
ONS 2022 Coronavirus (COVID-19) Infection Survey: Prevalence of ongoing Symptoms following coronavirus (COVID-19) infection in the UK: 3 March 2022
Oude Hengel KM., et al. Exposure to a SARS-CoV-2 infection at work: development of an international job exposure matrix (COVID-19-JEM). Scand J Work Environ Health. 2022; 48(1):61–70. doi:10.5271/sjweh.3998
Pandharipande PP, Girard TD, Jackson JC et al. Long-term cognitive impairment after critical illness. N Engl J Med. 2013 Oct 3;369(14):1306-16.
Parker AM., et al. Post traumatic stress disorder in critical illness survivors: a metaanalysis. Crit Care Med. 2015 May;43(5):1121-9.
Pasha AK, McBane RD, Chaudhary R, et al. Timing of venous thromboembolism diagnosis in hospitalized and non-hospitalized patients with COVID-19 [published online ahead of print, 2021 Oct 7]. Thromb Res. 2021;207:150-157.
Pawlikowska T, Chalder T, Hirsch SR, Wallace P, Wright DJ, Wessely SC. Population based study of fatigue and psychological distress. BMJ. 1994 Mar 19;308(6931):763-6
Pearce N et al. Occupational differences in COVID-19 incidence, severity, and mortality in the United Kingdom: Available data and framework for analyses. Wellcome Open Research 2021, 6:102 Last updated: 03 SEP 2021
Peluso MJ, Deeks SG. Early clues regarding the pathogenesis of long- COVID. Trends Immunol. 2022 Apr;43(4):268-270.
Pouwels KB, House T, Pritchard E, et al. Community prevalence of SARSCoV- 2 in England from April to November, 2020: results from the ONS Coronavirus Infection Survey. Lancet Public Health 2021 Jan; 6(1): e30–e38
Public Health England 2020. Emergency Department Syndromic Surveillance System: England year 2020 week 27. published 8th July 2020.
Raveendran AV, Jayadevan R, Sashidharan S. Long COVID: An overview [published correction appears in Diabetes Metab Syndr. 2022 May 13;:102504]. Diabetes Metab Syndr. 2021;15(3):869-875.
Rhodes S, Wilkinson J, Pearce N et al. Occupational differences in SARSCoV- 2 infection: Analysis of the UK ONS Coronavirus (COVID-19) Infection Survey. medRxiv 2022.04.28.22273177
Riley et al. (2020a) Community prevalence of SARS-CoV-2 virus in England during May 2020: REACT study. medRxiv preprint doi: this version posted July 11, 2020
Riley et al (2020b) [High and increasing prevalence of SARS-CoV-2 swab positivity in England during end September beginning October 2020: REACT- 1 round 5 updated report](https://doi.org/10.1101/2020.10.12.20211227. medRxiv 2020.10.12.20211227.
Riley et al (2020c) REACT-1 round 6 updated report: high prevalence of SARS-CoV-2 swab positivity with reduced rate of growth in England at the start of November 2020 medRxiv 2020.11.18.20233932.
Riley et al (2020d) REACT-1 round 7 updated report: regional heterogeneity in changes in prevalence of SARS-CoV-2 infection during the second national COVID-19 lockdown in England medRxiv 2020.12.15.20248244.
Riley S et al. (2021a). Resurgence of SARS-CoV-2: Detection by community viral surveillance. Science. 2021 May 28;372(6545):990-995
Riley et al (2021b) REACT-1 round 8 final report: high average prevalence with regional heterogeneity of trends in SARS-CoV-2 infection in the community in England during January 2021 medRxiv 2021.01.28.21250606.
Riley et al (2021c) REACT-1 round 9 final report: Continued but slowing decline of prevalence of SARS-CoV-2 during national lockdown in England in February 2021 medRxiv 2021.03.03.21252856.
Riley et al (2021d) REACT-1 round 10 report: Level prevalence of SARSCoV- 2 swab-positivity in England during third national lockdown in March 2021 medRxiv 2021.04.08.21255100.
Riley et al (2021e) REACT-1 round 11 report: low prevalence of SARS-CoV-2 infection in the community prior to the third step of the English roadmap out of lockdown medRxiv 2021.05.13.21257144.
Rousseau, AF., Minguet, P., Colson, C. et al. Post-intensive care syndrome after a critical COVID-19: cohort study from a Belgian follow-up clinic. Ann. Intensive Care 11, 118 (2021).
Rowlands AV, Gillies C, Chudasama Y et al. Association of working shifts, inside and outside of healthcare, with severe COVID-19: an observational study. BMC Public Health. 2021 Apr 22;21(1):773.
SAGE. (2020) SARS-COV-2 Transmission routes and environments. Book SARS-COV-2 Transmission routes and environments, City: Government Office for Science.
SAGE-EMG. (2020a) Transmission of SARS-CoV-2 and Mitigating Measures Book Transmission of SARS-CoV-2 and Mitigating Measures City: Scientific Advisory Group for Emergencies.
SAGE-EMG. (2020b) Evidence for transmission of SARS-COV-2 on ground public transport and potential effectiveness of mitigation measures. Book Evidence for transmission of SARS-COV-2 on ground public transport and potential effectiveness of mitigation measures, City.
SAGE-EMG. (2020c) Potential application of Air Cleaning devices and personal decontamination to manage transmission of COVID-19.
SAGE-EMG. (2021) COVID-19 Transmission in Prison Settings.
Saitone TL., et al. COVID-19 morbidity and mortality in U.S. meatpacking counties. Food policy 2021; 101: 102072. doi:10.1016/j.foodpol.2021.102072
Scordo KA, Richmond MM, Munro N. Post-COVID-19 Syndrome: Theoretical Basis, Identification, and Management. AACN Adv Crit Care. 2021 Jun 15;32(2):188-194.
Shah ASV et al. Risk of hospital admission with coronavirus disease 2019 in healthcare workers and their households: nationwide linkage cohort study. BMJ 2020;371:m3582.
Shorten RJ, Haslam S, Hurley MA, et al. Seroprevalence of SARS-CoV- 2 infection in healthcare workers in a large teaching hospital in the North West of England: a period prevalence survey. BMJ Open 2021;11:e045384.
Smeeth L., et al. Risk of myocardial infarction and stroke after acute infection or vaccination. N Engl J Med. 2004 Dec 16;351(25):2611-8
So M, Kabata H, Fukunaga K, Takagi H, Kuno T. Radiological and functional lung sequelae of COVID-19: a systematic review and meta-analysis. BMC Pulm Med. 2021 Mar 22;21(1):97.
SOC 2010 Office for National Statistics. Standard Occupational Classification 2000.
Stadje R, Dornieden K, Baum E, et al. The differential diagnosis of tiredness: a systematic review. BMC Fam Pract. 2016;17(1):147.
Stadnytskyi V, Anfinrud P, Bax A. Breathing, speaking, coughing or sneezing: What drives transmission of SARS-CoV-2? J Intern Med. 2021. Eprint
St-Denis X. Sociodemographic Determinants of Occupational Risks of Exposure to COVID-19 in Canada. Can Rev Sociol 2020; 57: 399-452.
Steinle S., et al. The effectiveness of respiratory protection worn by communities to protect from volcanic ash inhalation. Part II: Total inward leakage tests. Int J Hyg Environ Health 2018 ; 221: 977-84
Sudre CH, Murray B, Varsavsky et al. Attributes and predictors of long COVID. Nat Med. 2021 Apr;27(4):626-631
Tan BK, Mainbourg S, Friggeri A et al. Arterial and venous thromboembolism in COVID-19: a study-level meta-analysis. Thorax. 2021 Feb 23:thoraxjnl- 2020-215383
Tan YK, Goh C, Leow AST, et al. COVID-19 and ischemic stroke: a systematic review and meta-summary of the literature. J Thromb Thrombolysis. 2020;50(3):587-595. doi:10.1007/s11239-020-02228-y
Thomas A., et al. Limits of lockdown: characterising essential contacts during strict physical distancing. 2021 Wellcome Open Research.
Torres-Castro R, Vasconcello-Castillo L, Alsina-Restoy X. Respiratory function in patients post-infection by COVID-19: a systematic review and meta-analysis. Pulmonology. 2021;27(4):328-337.
Treibel TA, Manisty C, Burton M et al. COVID-19: PCR screening of asymptomatic health-care workers at London hospital. Lancet. 2020 May 23;395(10237):1608-1610.
Vijayakumar B, Tonkin J, Devaraj A et al. CT Lung Abnormalities after COVID-19 at 3 Months and 1 Year after Hospital Discharge. Radiology. 2022 May;303(2):444-454.
Walker AJ, MacKenna B, Inglesby P, Clinical coding of long COVID in English primary care: a federated analysis of 58 million patient records in situ using OpenSAFELY. British Journal of General Practice 2021; 71 (712): e806- e814.
Ward, H., Atchison, C., Whitaker, M. et al. SARS-CoV-2 antibody prevalence in England following the first peak of the pandemic. Nat Commun 12, 905 (2021a).
Ward H, Cooke G, Whitaker M et al. REACT-2 Round 5: increasing prevalence of SARS-CoV-2 antibodies demonstrate impact of the second wave and of vaccine roll-out in England medRxiv 2021.02.26.21252512 (2021b)
Ward A, Sarraju A, Lee D, Bhasin K, Gad S, Beetel R, Chang S, Bonafede M, Rodriguez F, Dash R. COVID-19 is associated with higher risk of venous thrombosis, but not arterial thrombosis, compared with influenza: Insights from a large US cohort. medRxiv [Preprint]. 2021 Oct 18:2021.10.15.21264137.
World Health Organization. (2021). A clinical case definition of post COVID-19 condition by a Delphi consensus, 6 October 2021. World Health Organization.
Wu J., et al. Second Decline in Admissions with Heart Failure and Myocardial Infarction During the COVID-19 Pandemic. J Am Coll Cardiol. 2021;77(8):1141-1143.
Wu X, Liu X, Zhou Y et al. 3-month, 6-month, 9-month, and 12-month respiratory outcomes in patients following COVID-19-related hospitalisation: a prospective study. Lancet Respir Med. 2021 Jul;9(7):747-754.
West R, Michie S, Rubin GJ, Amlot R. Applying principles of behaviour change to reduce SARS-CoV-2 transmission. Nat Hum Behav2020; 4: 451-59.
Williams K, Cherrie JW, Dobbie J, Agius RM. The Development of a Covid-19 Control Measures Risk Matrix for Occupational Hygiene Protective Measures. Ann Work Expo Health. 2021 doi: 10.1093/annweh/wxab050
Zhang M. Estimation of differential occupational risk of COVID-19 by comparing risk factors with case data by occupational group. Am J Ind Med 2021; 64: 39-47.
Zhang R, Ni L, Di X, Wang X, Ma B, Niu S, Liu C. Systematic review and meta-analysis of the prevalence of venous thromboembolic events in novel coronavirus disease-2019 patients. J Vasc Surg Venous Lymphat Disord. 2021 Mar;9(2):289-298.e5.
Zheng C, Hafezi-Bakhtiari N, Cooper V, et al. Characteristics and transmission dynamics of COVID-19 in healthcare workers at a London teaching hospital. J Hosp Infect 2020;106:325–9.
Glossary
Types of study
Cohort study
A study which follows up a population of individuals (usually defined by a workplace) over time and compared the incidence rate of disease or mortality among those within the cohort or with an external comparison population. The outcome is expressed as a Rate Ratio or Relative Risk, Standardised Incidence Ratio, Standardised Registration Ratio, or Standardised Mortality Ratio, depending on the type of analysis and the disease outcome being studied.
Case-control study
A study which compares people who have a given disease (cases) with people who do not (non-cases, also known as controls) in terms of exposure to one or more risk factors of interest. Have cases been exposed more than non-cases? The outcome is expressed as an Odds Ratio, a form of Relative Risk. In a nested-case control study, cases and controls are sampled from the members in a cohort study – often, all the cases occurring in the cohort and a sample of non-cases.
Measures of association
Statistical significance and P values
Statistical significance refers to the probability that a result as large as that observed, or more extreme still, could have arisen simply by chance. The smaller the probability, the less likely it is that the findings arise by chance alone and the more likely they are to be ‘true’. A ‘statistically significant’ result is one for which the chance alone probability is suitably small, as judged by reference to a pre-defined cut-point. (Conventionally, this is often less than 5% (p<0.05)).
Relative Risk (RR)
A measure of the strength of association between exposure and disease. RR is the ratio of the risk of disease in one group to that in another. Often the first group is exposed and the second unexposed or less exposed. A value greater than 1.0 indicates a positive association between exposure and disease. (This may be causal, or have other explanations, such as bias, chance or confounding.) RR is measured or approximated by other measures in this glossary, such as the Odds Ratio, Standardised Incidence Ratio and Standardised Mortality Ratio.
Odds Ratio (OR)
A measure of the strength of association between exposure and disease. It is the odds of exposure in those with disease relative to the odds of exposure in those without disease, expressed as a ratio. For rare exposures, odds and risks are numerically very similar, so the OR can be thought of as a Relative Risk. A value greater than 1.0 indicates a positive association between exposure and disease. (This may be causal, or have other explanations, such as bias, chance or confounding.)
aOR
Odds ratios adjusted for age and gender.
Standardized Incidence Ratio (SIR)
Used to determine if the occurrence of cancer in a relatively small population is high or low. An SIR analysis can tell if the number of observed cancer cases in a particular geographic area is higher or lower than expected, given the population and age distribution for that community.
Standardised Mortality Ratio (SMR)
A measure of the strength of association between exposure and mortality; a form of Relative Risk in which the outcome is death. The SMR is the ratio of the number of deaths (due to a given disease arising from exposure to a specific risk factor) that occurs within the study population to the number of deaths that would be expected if the study population had the same rate of mortality as the general population (the standard). By convention, SMRs (and proportional mortality ratios, as described below) are usually multiplied by 100. Thus, an SMR (or PMR) of 200 corresponds to a RR of 2.0. For ease of understanding in this report, SMRs (or PMRs) are quoted as if RRs and are not multiplied by 100. Thus, a value greater than 1.0 indicates a positive association between exposure and disease. (This may be causal, or have other explanations, such as bias, chance or confounding.)
Proportional Mortality Ratio (PMR)
A PMR is the proportion of observed deaths from a given cause in a given population divided by the proportion of deaths from that cause expected (in a standard population). The value is often expressed on an age-specific basis or after age adjustment. It is a form of Relative Risk.
Other terms
Bias
A systematic tendency to over or underestimate the size of a measure of interest in a study. Confounding: Arises when the association between exposure and disease is explained in whole or part by a third factor (confounder), itself a cause of the disease that occurs to a different extent in the groups being compared.
Prevalence
Prevalence is the proportion of a particular population found to be affected by a medical condition (typically a disease or a risk factor such as smoking). It is derived by comparing the number of people found to have the condition with the total number of people studied, and is usually expressed as a fraction, as a percentage, or as the number of cases per 10,000 or 100,000 people. It is the total number of cases of a disease in a given area during a given time period.
Standardised Prevalence Ratio (SPR)
Indicates how large is the prevalence of an event/outcome in one group of subjects (with characteristics/attribute) relative to another group (without the characteristics/attributes).
Poisson Regression
A generalized linear model form of regression analysis used to model count data and contingency tables. Poisson regression assumes the response variable Y has a Poisson distribution and assumes the logarithm of its expected value can be modelled by a linear combination of unknown parameters.
Meta-analysis
A statistical procedure for combining data from multiple studies. When the treatment effect (or effect size) is consistent from one study to the next, metaanalysis can be used to identify this common effect. The effect may be summarised as a meta-estimate of relative risk.
Risk
The probability that an event will occur (e.g., that an individual will develop disease within a stated period of time or by a certain age). Incidence rate or incidence: The rate of occurrence of a new event of interest (e.g., cancer) in a given population over a given time period. (The rate is often expressed in terms of cases per year of ‘person-time’, and so incorporates the numbers at risk of the event, the time for which they are at risk and the numbers that go on to develop that event.)
Confidence Interval (CI)
The Relative Risk reported in a study is only an estimate of the true value of relative risk in the underlying population; a different sample may give a somewhat different estimate. The CI defines a plausible range in which the true population value lies, given the extent of statistical uncertainty in the data. The commonly chosen 95% CIs give a range in which there is a 95% chance that the true value will be found (in the absence of bias and confounding). Small studies generate much uncertainty and a wide range, whereas very large studies provide a narrower band of compatible values.
Job-exposure matrix (JEM)
A tool used to assess exposure to potential health hazards in occupational epidemiological studies. A JEM comprises a list of levels of exposure to a variety of harmful (or potentially harmful) agents for selected occupational titles. In large population-based epidemiological studies, JEMs may be used as a quick and systematic means of converting coded occupational data (job titles) into a matrix of possible exposures, obviating the need to assess each individual’s exposure in detail.
-
Source: coronavirus.data.gov.uk ↩
-
See Management Information: Coronavirus (COVID-19) disease reports made by employers to HSE and Local Authorities since 10 April 2020 ↩
-
See [Staff covid death payouts set to top £40m] (https://www.hsj.co.uk/finance-and-efficiency/staff-covid-death-payouts-set-to-top-40m/7031179.article) ↩