Net Zero Society: Scenarios and Pathways Report HTML
Updated 17 February 2025

© Crown copyright 2025
This publication is licensed under the terms of the Open Government Licence v3.0 except where otherwise stated. To view this licence, visit nationalarchives.gov.uk/doc/open-government-licence/version/3 or write to the Information Policy Team, The National Archives, Kew, London TW9 4DU, or email: psi@nationalarchives.gov.uk.
Where we have identified any third party copyright information you will need to obtain permission from the copyright holders concerned.
This publication is available at https://www.gov.uk/government/publications/net-zero-society-scenarios-and-pathways--2/net-zero-society-scenarios-and-pathways-report-html
Net zero society: scenarios and pathways
How could societal changes affect the path to net zero?
April 2023
Foreword
Climate change presents a threat to humanity that we cannot ignore. In the UK, we have committed to reaching net zero emissions by 2050. Reducing emissions is not only the right thing to do for the health of our planet and its population but it is also a key economic opportunity for the 21st century. This Foresight report indicates that, depending on the direction of societal change and related changes in energy demand, the energy system costs of meeting net zero could be lower for the UK than not meeting net zero, as a percentage of GDP. The potential economic, environmental and health costs of doing nothing are substantial. Meanwhile, the path to net zero provides opportunities, including for creating green jobs and fostering new technologies for which there will be a substantial market.
This report draws together evidence from climate science, social science, and energy systems modelling. It sets out four scenarios for what UK society could be like in 2050 and then examines how these could affect energy demand and the path to net zero, including the composition of the energy system and the related costs. The scenarios developed are not predictions of what will happen. They should feel challenging and, perhaps, even extreme. It is unlikely that any one of these scenarios will come to pass in its entirety, but we do know that society in 30 years will look very different from today and is likely to include some features of these scenarios. I hope that organisations can use these scenarios to reflect on their long-term strategy, considering questions such as: What if society changed in some of the ways described? What about meeting net zero becomes harder, and how could we respond? What new opportunities could this present? The answers to these questions signal the need to work outside of siloes; our findings suggest that the path to net zero cannot be paved by one organisation alone.
Our report adds to the evidence base showing that societal changes can affect future energy demand and emissions. Scenarios with lower energy demand could have lower costs for taxpayers and businesses, as well as reduced reliance on new technologies, but of course come with other challenges. To meet net zero, economic growth needs to continue to be decoupled from demand and emissions, and we should not assume that as-yet-unproven technology will provide a simple answer. A complex challenge like climate change requires a combination of novel technologies, the infrastructure to embed these in society, and for us all to make more sustainable choices where we can.
Our public dialogue allowed us to bring a greater diversity of thought to the questions being posed. When we spoke with members of the public about the scenarios, they were open to the idea of significant societal changes, understood the need for these to happen, and were more positive about futures that maximised the health and equity co-benefits of meeting net zero. My thanks to these volunteers. I would also like to thank the wide range of academic, government and industry experts who supported this work as well as the brilliant team in the Government Office for Science.
Sir Patrick Vallance
Government Chief Scientific Adviser
Executive summary
The UK is committed to reaching net zero by 2050. Future societal norms and behaviours will have a significant impact on how emissions are reduced, but they are also highly uncertain. Society in 2050 is likely to be very different from today. Testing against a wider set of assumptions about how society could look should make the UK’s net zero strategy more resilient and ready to address risks and opportunities as they arise.
This report shows that if society changed in ways that reduce demand for energy, the energy system costs of a scenario meeting net zero could be lower by 2% of GDP than a baseline case where the UK fails to meet net zero. There are also risks and costs associated with scenarios with higher levels of energy demand, which should be planned for. The twelve key findings of this report can be found at the bottom of this section.
Purpose
Commissioned as part of the government’s net zero strategy in 2021, the net zero society report aims to answer the following questions:
- What does evidence on past societal changes tell us about how future changes could unfold, and can we spot early signs of this happening?
- Informed by this evidence, how might society plausibly change by 2050, and how could this affect our pathway to net zero?
The report does not explore or make recommendations for HM Government’s net zero strategy. It focuses on how society might change, the impact (positive or negative) on the costs and feasibility of meeting net zero, and the potential drivers of this beyond government climate policy. While our analysis is extensive, it was not technically feasible to quantify all relevant impacts of each scenario, such as the economic impacts of being a successful exporter of green technologies or reducing imports of fossil fuels.
Background
The UK’s independent Climate Change Committee (CCC) has published a range of evidence showing that meeting net zero in the UK is both technologically feasible and affordable, with a predicted cost of about 1–2% of GDP.
Many changes needed for net zero have upfront investment costs. However, these may be fully or partially offset by reduced running costs, such as decreased need for heating in better-insulated homes. Higher fossil fuel prices would also increase such savings. If gas prices do not fall from their 2022 levels, which are historically very high, then the CCC has estimated the net zero programme would provide a cost saving of 0.5% of GDP per year.
Many of the technologies needed to meet net zero are already available in some form, which reduces some of the uncertainty over how net zero will be met. For example, most scenarios for meeting net zero rely on significant rollout of electric vehicles, heat pumps and renewable electricity (predominantly wind and solar). , , ,6 Other technologies have been demonstrated at a small scale but are yet to be proven at the scale needed.
There is also increasing evidence of the co-benefits of meeting net zero, including for the economy and for health. For example, developing and exporting new green technologies from the UK would help meet net zero while being a driver of UK jobs and growth. Such direct benefits from mitigating climate change and reaching net zero have been shown to outweigh the costs in HM Government’s Carbon Budget 6 Impact Assessment.
Despite this evidence base on the overall costs, benefits and feasibility of meeting net zero, there remain some key uncertainties around issues such as energy demand, consumption patterns and the availability of certain technologies out to 2050, which this project explores.
Approach
The report has been informed by the following research:
- Recent societal trends review: A high-level review of recent trends in the behaviours that directly impact emissions, with analysis of the underlying societal drivers of those trends, to provide a baseline on which the project builds.
- Societal change evidence review: A review of evidence on past societal changes, including a series of case studies covering different categories (including consumer-led, market-led and government-led) and different timescales. This has informed the development of the scenario narratives.
- Scenario narrative development: A set of plausible scenarios designed to stretch thinking about how society might change, developed through workshops with stakeholders from different sectors, including government, business, and academia, brought to life through written narratives and illustrations. Scenarios are not predictions. They are a tool designed to support net zero policy makers in considering how they would respond to a wide range of circumstances. There is no ‘right answer’ within the scenarios, instead they illustrate the impacts of different possible changes.
- Energy system modelling: Representing each scenario in a suite of energy system models, including the key model used for HM Government’s net zero strategy, to understand what type of energy system might be required to meet net zero in each scenario. This includes an analysis of the costs, feasibility, and some wider impacts (for example, health) of meeting net zero in each scenario.
- Public dialogue: A series of workshops with members of the public to test the plausibility of the scenarios and understand their views on the implications of different scenarios for meeting net zero.
Scenarios
This report presents four scenarios which explore critical uncertainties in patterns of societal energy use, consumption and technology availability out to 2050. The four scenarios vary in terms of:
- Economic growth and technological change,
- Institutional trust and social cohesion, and
- What these differences mean for activity across society and the economy.
Chapter 2 describes how these scenarios were made. The scenarios have been brought to life in a series of descriptive narratives (summary overleaf), infographics, illustrations, and quantitative assumptions. These are all set out in Chapter 3.
The quantitative assumptions in each scenario were then fed into an energy system model. This enabled an assessment of how net zero would likely be met in each scenario, taking account of the energy infrastructure and carbon removal technologies that would be needed. High level results from this analysis are set out in the next section.
The scenarios were each designed to include challenging outcomes, to make them useful for testing net zero policy against. If you read them and find you do not want any of these futures to happen, that is the scenarios working as intended. They are deliberately provocative and draw out some of the issues government would need to address in each case. Think about what you would like to be different and how to make that happen. Reality in 2050 is likely to include some aspects from all our scenarios, as well as changes not considered here.
Figure 1. Summary of the four net zero society future scenarios

2x2 matrix, each cell represents a scenario. Top cell left is scenario A: The atomised society; bottom left C: The self-preservation Society; bottom right D: The slow lane society; top right B: The metropolitan society.
The text from Figure 1 is laid out below:
-
The atomised society: Technological change has fuelled growth. Individual freedoms are prioritised, with people able to enjoy new experiences enabled by technology. However, more wealth has been accumulated by the richest and society is divided along income lines; the rich live in protected bubbles and the poor are more exposed to the effects of climate change.
-
The self-preservation society: economic growth and technological progress have failed to live up to expectations for rich and poor alike. People do that they need to get by, often using traditional methods and out-dated technology. Society is fragmented into many different groups. Some are more comfortable with the slow pace of change, particularly older and rural communities.
-
The slow lane society: Economic and technological growth are slow meaning there is less money to invest in beneficial infrastructure and limited new technology available. However, with high levels of social cohesion and institutional trust, people are willing to contribute more to improve their communities. There is also a growing culture of repair, recycling and the sharing economy.
-
The metropolitan society: Economic growth and technological change have delivered improvements in living standards for most, through inequalities remain. Geography shapes identity, with strong communities in the city regions that have driven growth. There is growing resentment in rural populations as they see funding directed towards urban areas but limited investment in the countryside.
Implications for meeting net zero
Our modelling provides a detailed assessment of how net zero can be met in each scenario, covering energy supply, technology rollout and infrastructure requirements. Full details can be found in Chapter 4. Figure 2 below shows total final energy use by scenario. All scenarios see a fall in energy use due to the rollout of energy efficient technologies and measures, but variation is significant. Higher energy demands result from factors like more long-distance travel, higher consumption of goods, and living in bigger homes.
Figure 2. Total final energy use in 2020–2050 (Petajoule/year) in the four net zero society scenarios

The content of this figure is provided in the report in an accessible format.
Figure 2 data: Total final energy use, PJ/year
| 2020 | 2025 | 2030 | 2035 | 2040 | 2045 | 2050 | |
|---|---|---|---|---|---|---|---|
| At Soc | 5600 | 5500 | 5000 | 4600 | 4500 | 4500 | 4600 |
| Met Soc | 5600 | 5300 | 4700 | 4200 | 3900 | 3700 | 3500 |
| SP Soc | 5700 | 5300 | 4600 | 4000 | 3600 | 3400 | 3300 |
| SL Soc | 5700 | 5200 | 4500 | 3800 | 3300 | 3000 | 2800 |
Figure 3 below shows residual emissions in 2050. All scenarios have roughly the same emissions trajectory, meeting legislated carbon budgets and the 2050 net zero target. In all cases meeting net zero requires carbon removal technologies. However, the scenarios with higher energy use rely more heavily on these technologies. The impact of agriculture and land use is also significant, as the scenarios with less meat consumption have more land available for afforestation and bioenergy crops. Land-based carbon removals further reduce reliance on engineered carbon removals.
Figure 3. Greenhouse gas emissions by sector (MtCO2e/year) in 2020 and for the four net zero society scenarios in 2030 and 2050

The content of this figure is provided in the report in an accessible format.
Figure 3 data.Greenhouse gas emissions, MtCO2e/year
| Power | Industry | Fuel supply | Heat and buildings | Domestic transport | International aviation and shipping | Agriculture and land use | Waste and F-gases | Removals | ||
|---|---|---|---|---|---|---|---|---|---|---|
| 2020 | 47 | 56 | 29 | 100 | 99 | 28 | 50 | 34 | 0 | |
| At Soc | 2030 | 3 | 42 | 20 | 84 | 52 | 30 | 48 | 18 | 0 |
| At Soc | 2050 | -4 | 7 | 5 | 0 | 1 | 19 | 36 | 14 | -78 |
| Met Soc | 2030 | 3 | 43 | 23 | 72 | 63 | 29 | 43 | 22 | 0 |
| Met Soc | 2050 | 0 | 18 | 6 | 10 | 5 | 18 | 8 | 14 | -80 |
| SP Soc | 2030 | 3 | 42 | 22 | 76 | 62 | 27 | 46 | 19 | 0 |
| SP Soc | 2050 | 0 | 11 | 1 | 0 | 1 | 13 | 21 | 14 | -62 |
| SL Soc | 2030 | 3 | 36 | 23 | 78 | 61 | 29 | 42 | 22 | 0 |
| SL Soc | 2050 | 0 | 7 | 5 | 7 | 5 | 14 | -6 | 13 | -45 |
The implications of the scenarios for energy system costs (including fuel costs and other operating expenses, and capital investment) are shown in Figure 4, which presents the system costs in each scenario:
- as a percentage of GDP (which varies by scenario), reflecting the fact that higher investment costs are more affordable to a society with higher real incomes and associated tax revenue; and also
- relative to the system costs in a baseline scenario in which net zero is not met (recognising that building, maintaining and running an energy system will always represent a significant national expenditure). While each scenario’s costs are calculated as a direct proportion of the scenario’s individual GDP projection, the baseline scenario uses the OBR’s 2020 forecasts.
Figure 4. Annual energy system costs (2019 prices, undiscounted) as a percentage of GDP for the four net zero society scenarios, relative to those in the baseline scenario (expressed as a percentage point difference)

The content of this figure is provided in the report in an accessible format.
Figure 4 data. Annual energy system cost as a percentage of GDP, relative to baseline scenario
| The atomised society | The metropolitan society | The self-preservation society | The slow lane society | |
|---|---|---|---|---|
| 2019 | -0.0055 | -0.0055 | -0.0055 | -0.0055 |
| 2020 | -0.0084 | -0.0083 | -0.0084 | -0.0086 |
| 2021 | -0.0046 | -0.0059 | -0.0053 | -0.0072 |
| 2022 | -0.0026 | -0.0047 | -0.0028 | -0.0058 |
| 2023 | -0.0016 | -0.0042 | -0.00059 | -0.0044 |
| 2024 | -0.0014 | -0.0044 | 0.0011 | -0.0034 |
| 2025 | -0.0014 | -0.0047 | 0.0027 | -0.0025 |
| 2026 | -0.0019 | -0.0058 | 0.0033 | -0.0031 |
| 2027 | -0.0027 | -0.0071 | 0.0035 | -0.0041 |
| 2028 | -0.0036 | -0.0084 | 0.0037 | -0.005 |
| 2029 | -0.0044 | -0.0097 | 0.0039 | -0.0059 |
| 2030 | -0.0052 | -0.011 | 0.0041 | -0.0067 |
| 2031 | -0.0028 | -0.0099 | 0.0067 | -0.0049 |
| 2032 | -0.00058 | -0.009 | 0.0093 | -0.0031 |
| 2033 | 0.0015 | -0.0082 | 0.012 | -0.0013 |
| 2034 | 0.0034 | -0.0074 | 0.014 | 0.00043 |
| 2035 | 0.0052 | -0.0066 | 0.017 | 0.0022 |
| 2036 | 0.0031 | -0.0089 | 0.016 | 0.0014 |
| 2037 | 0.0011 | -0.011 | 0.016 | 0.00076 |
| 2038 | -0.00078 | -0.013 | 0.015 | 0.00021 |
| 2039 | -0.0026 | -0.015 | 0.015 | -0.00028 |
| 2040 | -0.0044 | -0.017 | 0.015 | -0.00073 |
| 2041 | -0.0044 | -0.017 | 0.016 | -0.00016 |
| 2042 | -0.0044 | -0.018 | 0.016 | 0.00044 |
| 2043 | -0.0045 | -0.018 | 0.017 | 0.001 |
| 2044 | -0.0046 | -0.019 | 0.018 | 0.0017 |
| 2045 | -0.0047 | -0.02 | 0.019 | 0.0023 |
| 2046 | -0.0033 | -0.02 | 0.024 | 0.0034 |
| 2047 | -0.002 | -0.02 | 0.03 | 0.0044 |
| 2048 | -0.0008 | -0.02 | 0.035 | 0.0055 |
| 2049 | 0.00031 | -0.02 | 0.041 | 0.0066 |
| 2050 | 0.0013 | -0.02 | 0.046 | 0.0077 |
Meeting net zero is most affordable in the metropolitan society, where 2050 system costs as a percentage of GDP are 2% lower than in the baseline scenario, meaning it is more affordable than not meeting net zero. Energy demand and economic growth have been decoupled most significantly in this scenario, through changes such as shifting travel patterns and moving to a ‘circular economy’ which uses resources more efficiently. Even though the metropolitan society needs a larger energy system than the slow lane society, the higher GDP makes this more affordable.
Meeting net zero is also affordable in the slow lane and atomised societies, at less than 1% above the baseline scenario in 2050. In the slow lane society this is because societal changes have led to lower levels of energy demand, whereas in the atomised society this is because higher GDP helps to pay for the high levels of technology adoption and infrastructure needed to meet net zero in this scenario.
In contrast, the self-preservation society assumes neither the societal changes to reduce demand, nor the technological innovation and economic resources to pay for it. As a result, the 2050 system costs are 5% higher than the baseline.
It is important to note that we have not modelled the positive impacts on GDP that meeting net zero would be likely to have. Such benefits have been set out previously by the CCC and in HM Government’s Carbon Budget 6 Impact Assessment and Net Zero Strategy. 6, Nor have we factored in the significant avoided costs of additional adaptation to the effects of climate change from meeting net zero at a global level. Both are discussed in more detail in Chapter 4.
Public dialogue
We could not discuss the future of society without talking directly with the people who shape it: UK citizens. The project team, with support from Sciencewise, commissioned the research company Ipsos to carry out a public dialogue based on the four scenarios.
A group of 29 participants from across the UK (Figure 5) took part in the public dialogue. This group, while small, was broadly reflective of UK population demographics (including age, income level, geographical location, ethnicity and gender).
Figure 5. Locations of participants on a map of the UK (locations in large cities, such as London, represent more than one participant)

Participant locations represented on a map of the UK. A range of locations are shown across the whole of the UK.
The public dialogue explored:
- Plausibility and pathways: The aspects of the scenarios that participants felt were least plausible and the changes they believed would be needed between now and 2050 to make the scenario plausible.
- Cross-cutting themes: The areas that participants felt were important across all scenarios.
- Tensions and trade-offs: The tensions and trade-offs involved in decision making around net zero, as identified by participants.
- Reactions to the individual scenarios: Initial reflections relating to the sectors discussed above.
More detail on the public dialogue approach and findings can be found in Chapter 5.
Key findings
- Net zero can be met in all the scenarios we modelled. Even in scenarios where societal changes lead to higher levels of energy demand, there are pathways to net zero. However, these higher demand scenarios rely on extensive use of carbon removal technologies that are yet to be proven at scale, which could be difficult and/or expensive to roll out at the pace required, introducing greater risk to this path to net zero.
- Societal change will affect the future level of demand for energy and goods and what technologies are available. There is around a 65% difference in 2050 energy demand between our scenarios. But exactly how society will change is, of course, uncertain. Many equally plausible scenarios exist, but ours represent some of the key potential changes that governments should be aware of as they plan.
- If societal changes reduce energy demand, meeting net zero could be cheaper than failing to do so. Compared to a baseline scenario, which fails to meet net zero and has limited societal changes, our scenario with higher economic growth and demand-reducing societal changes has 2050 energy system costs that are lower by 2% of GDP. In this scenario, changes to travel patterns and new models for consuming goods reduce energy demand. This in turn reduces the size, complexity and investment needs of the energy system.
- In scenarios where societal changes reduce energy demand, reliance on carbon removal technologies is reduced, less land is needed for infrastructure, and health co-benefits are higher. Scenarios that see lower energy demand and consumption, due to factors such as those outlined in the previous finding, have reduced reliance on direct air capture (DAC) technology to address residual emissions. These scenarios also require less land for energy infrastructure, which could make the energy system easier to deliver and allow the land to be used for other purposes. Significant health benefits could also flow from reduced meat consumption and increased physical activity.
- In contrast, in scenarios where societal changes do little to reduce demand, meeting net zero will be harder to deliver. This is partially due to the need for a larger energy system to be built rapidly to meet the demand. It is also due to the increased reliance on expensive technology such as DAC to compensate for higher energy use and emissions. Such large energy systems can be more affordable in scenarios with stronger economic growth. However, if economic growth is weak then this may mean net zero is less affordable (up to 5% of GDP costlier than the baseline).
- Economic growth and technological innovation are correlated. There is a risk that a low growth, low innovation world would have fewer technological options for meeting net zero. It is possible to meet net zero without further technological breakthroughs. However, without them, the route to net zero would require more significant societal changes, such as bigger reductions in the levels of flying and reduced consumption of meat and dairy. We have not explicitly estimated the potential economic benefits of the UK being a leader in green technology in our analysis. However, this could plausibly further enhance the relative cost reduction in some scenarios.
- Economic growth and energy demand can be further decoupled if other societal changes such as resource efficiency and other ‘circular economy’ measures take place in parallel. Our analysis suggests that meeting net zero in a high economic growth scenario with such societal changes could be around 2% of GDP less costly in 2050 than in a high economic growth scenario without them. All else being equal, economic growth is likely to increase overall energy demand, increasing the size and complexity of the energy system, with associated delivery challenges. With improving economic growth as a consistent government goal, net zero planning should account for how net zero can be met in a world with higher growth.
- High levels of innovation could lead to more rapidly falling unit cost reductions than assumed here. Cost reductions for key net zero technologies could come about more rapidly in scenarios where the UK is leading technologically or where global decarbonisation drives faster innovation. This may be more likely to happen in the scenarios with higher levels of technological development, in which case we might be understating the affordability of meeting net zero in these scenarios.
- The path to net zero will be affected by a wide range of societal factors that could be tracked as part of planning for net zero, including income distribution, sectoral mix in the economy, adoption of digital technologies, the level of urban versus rural living, and levels of cohesion between different social groups. Government will best be able to adapt its approach to net zero — seizing opportunities and mitigating some of the costs — with early signals of the direction of travel. To improve the resilience of its net zero strategy, the government could track these developments and adapt its approach to net zero accordingly.
- Public support for technological innovation is likely to need to be actively cultivated when it creates highly visible changes in people’s daily lives. As these scenarios demonstrate, technology will have a big role to play in meeting net zero. However, members of the public we spoke to were apprehensive of high levels of visible technological change, such as automation of jobs or novel food production technologies. Concern centred on the health impacts of technologies as well as ensuring they did not introduce inequalities. Where a government’s chosen path to net zero might involve highly visible technologies, public support will need to be maintained. Increased affordability, more knowledge about the technology, and reassurances around reliability and safety were all seen as key to ensuring public support.
- Members of the public we spoke to were open to the idea that there may be significant societal changes by 2050. However, they identified some tensions between the changes that might occur and the impact on their lives. These included tensions between maintaining choice but encouraging sustainability and between increasing investment in technology but ensuring costs were manageable and fairly distributed.
- Sustainable choices are only possible for most people when underpinned with supportive policies and infrastructure. The members of the public that we spoke to suggested that individuals’ ambitions to make sustainable choices were limited by the options available and their personal circumstances. Participants suggested that there were ways to help people make more sustainable choices, including: increased investment in infrastructure (such as public transport or active travel), reskilling those at risk of being ‘left behind’ by changes, supporting the public in developing their knowledge of different options, and incentivising businesses to move towards a circular economy.
How can our report be used?
The outputs of the report provide insights into the general risks and opportunities associated with different pathways to net zero, but the evidence and scenarios can also be used by policy makers to help develop and refine specific net zero policies. Approaches that could be used include:
- Stress-testing: Policy makers could stress-test policy options against the possible future scenarios set out here, to identify the options that are most resilient to different outcomes, or to help adapt policies so that they become more resilient. It is important to recognise that there is not a ‘correct scenario’; they are simply an illustrative set of discrete possibilities. The Government Office for Science provides resources that can be used to support stress-testing workshops.
- Horizon scanning: Government could track indicators to assess whether the UK is headed more towards a world which resembles one or other of the scenarios, providing intelligence on whether net zero might be harder or easier to meet than currently assumed, or the strategy may need to adapt in some other way. It is important to note that these are only four possible scenarios, and it is unlikely that that the UK will track exactly towards any one of them specifically. But the exercise can still help to ensure policy makers are on the front foot in preparing for possible outcomes.
- Further public engagement: By gathering more intelligence on societal attitudes and relevant information on how society is changing, government could be equipped with better data about the likely direction of travel for society. This could include new surveys or public dialogue activities.
Guide to using our report:
Would you like to stress test your organisation’s net zero plan?
If yes, please refer to: Our futures (3.1, 3.2, 3.3, 3.4), implications for net zero (4.2, 4.3, 4.4), public dialogue (5.3, 5.4, 5.5) & next steps.
Would you like to monitor signals that we are on a certain scenario?
If yes, please refer to: Our futures (3.3, 3.4, 3.5), implications for net zero (4.2, 4.3, 4.4, 4.5), public dialogue (5.3) & next steps.
Would you like to explore how a net zero society might feel for different groups?
If yes, please refer to: Our futures (3.1, 3.2, 3.3), implications for net zero (4.3), public dialogue (5.1, 5.2, 5.3, 5.4, 5.5, 5.6) & annex 6.
Would you like to create engaging learning materials on net zero?
If yes, please refer to: Our futures (3.1, 3.2, 3.3, 3.4), implications for net zero (4.2, 4.3, 4.4, 4.5), public dialogue (5.3, 5.4, 5.5, 5.6) & annex 6.
Would you like to: understand more about futures work and scenario development?
If yes, please refer to: Our approach (2.1, 2.2, 2.3), scenarios (3.1, 3.2, 3.3, 3.4), public dialogue (5.1, 5.2, 5.3, 5.4, 5.5), annex 1, annex 2 & annex 3
Would you like to compare model outputs to other modelling work?
If yes, please refer to: Our approach (2.3), our futures (3.3, 3.4), implications for net zero (4.1, 4.2, 4.3, 4.4, 4.5), annex 4 & annex 5.
1. Introduction
What could the UK be like in 2050 when it has achieved its emissions targets? A net zero society is one where there is a balance between the greenhouse gases emitted and those removed from the atmosphere. There are questions about what will change over the next few decades on the UK’s journey to becoming a net zero society. How will buildings be different? What will travel be like at home and abroad? What jobs will there be? What foods will be eaten and how will they be made? UK society is a constantly changing and complex system made up of millions of individuals, each driven by their own beliefs, values and circumstances. With such complexity, it is impossible to predict exactly how society will change. However, it is possible to think about some of the different paths that UK society could take in a systematic, evidence-informed way. This report is intended to help policy makers and shapers plan by considering a range of possible societal changes that could happen by 2050.
1.1 Background
Greenhouse gases (GHGs) are compounds released into our atmosphere that trap the sun’s heat, contributing to global warming and climate change. Some of these gases are produced by living beings; for example, many animals release methane during digestion. GHGs can also be produced by human activities, including through energy generation, manufacturing, agriculture, and waste management. , For many decades, global net emissions of these gases have been going up. , This means that the amount of GHGs being released into the atmosphere far exceeds the amount that can be removed by natural processes or human technology.
In 2019, the UK committed in legislation to reaching ‘net zero’ by 2050, meaning the UK’s GHG emissions would be equal to the emissions the UK removes from the atmosphere. This target followed a recommendation by the Climate Change Committee (CCC) and made the UK the first major economy to pass a net zero emissions law. In its progress reports to Parliament on this target, the CCC notes that achieving net zero by 2050 is as much a societal challenge as a technical one.2, Progress has been made in the UK in reducing emissions through infrastructure and industry-focused initiatives, such as transitioning to less polluting power sources and increasing energy efficiency. Most of these changes have been somewhat invisible to consumers. However, the next phase of reducing emissions will likely require more visible and extensive changes, such as how we travel or heat our homes.2
Social norms (the shared standards for acceptable behaviour) will likely have a significant impact on the effectiveness of emissions-reducing policies; evidence suggests that those that align with pre-existing social norms could be more successful. , Future social norms, attitudes and behaviours are difficult to predict accurately. For example, a policy maker in the UK in the 1990s thinking about tobacco use in the 2020s might have struggled to envisage a future society where most people no longer smoke in cars, many former smokers favour electronic cigarettes (which were only just emerging on the market in the 1990s), and the social acceptability of smoking is low across all age groups. Social norms are not immutable and can change dramatically over time. They can be influenced by many factors, including social movements, media campaigns, mounting research evidence, and government policies. , , Returning to the example of smoking, evidence from a study on the effect of the smoking ban in indoor public spaces in the 2000s (which followed decades of public health campaigns) found that the policy preceded an increase in people’s support for smoke-free legislation and a decrease in how acceptable they deemed smoking to be.
Societies are extremely complex systems made up of millions of individuals, each driven by their own values, needs and ambitions. It is impossible to predict exactly what UK society will be like in 2050. However, it is possible to think about some of the different paths UK society could take, and what this might mean for meeting net zero, to help policy makers consider how they might need to respond to a range of possible future circumstances.
1.2 Scope
The research undertaken to produce this report has been built on the solid foundations of previous work from across a range of sectors (including academia, private industry, the public sector, and the third sector).
Highly relevant previous work in this area includes the 2021 Energy Systems Catapult research on the direct emissions impacts of different societal and behavioural changes. This project mapped 39 individual behaviours (such as reducing food waste or carpooling) and 11 societal changes (such as increased working from home) to understand how these interact and contribute to overall emissions. The project also used modelling and analysis to explore the emissions and costs implications of behavioural and societal changes in different sectors.
The Centre for Research into Energy Demand Solutions’ (CREDS) 2021 report on the role of energy demand reduction in achieving net zero has also informed this report. CREDS envisaged four future scenarios for the UK in 2050 and modelled how different levels of energy demand reduction could affect future emissions. Its approach is distinct from much other research in this area because it did not assume substantial technological innovations and investment.
Elements of both the Energy Systems Catapult research and CREDS work have fed into the methods used in the net zero society report. However, this report is distinct from previous work in how it:
- considers the impact of multiple combined societal changes in each scenario, including how various actors within society behave and use technology,
- co-creates scenarios with government policy makers and external experts to ensure they were plausible, but also sufficiently divergent and challenging to stress-test policy and strategy,
- includes the impacts of potential societal shifts across a range of sectors (specifically those outside of the traditional decarbonisation policy space) that could either decrease or increase emissions and energy use, and
- provides fresh insight on the key interdependencies, trade-offs, and spill-over effects of different behavioural and societal changes on the path to net zero.
This approach is intended to add value to the discussions around future energy needs and emissions by exploring how the behaviour of individuals and organisations might combine in the future to form different possible societies. This project was commissioned by the Department for Business, Energy and Industrial Strategy (BEIS) in their 2021 Net Zero Strategy: Build Back Greener.3
In the strategy, HM Government set out its approach to meeting net zero and proposed to go ‘with the grain’ of societal trends to support progress towards net zero. This Foresight report is intended to help policy makers and shapers consider the different ways those societal trends might develop between now and 2050. It explores the question of how societal changes could affect the way the UK achieves net zero.
This project cuts across many interrelated research and policy areas. Therefore, it is important to clarify what this report will (and will not) cover, as follows:
- Net zero: This report primarily considers future emissions and progress towards the UK’s domestic net zero target. Recognising the importance of cumulative emissions, this includes the commitment to legislated carbon budgets between now and 2050. The report also recognises that UK society has a wider international carbon footprint, which includes emissions resulting from the production of goods imported from other countries. The UK’s international carbon footprint is considered across the scenarios but is not the focus of our analysis. There are other related issues (such as biodiversity loss or plastic pollution), which could be affected by the societal changes in the scenarios. The report includes a high-level consideration of these impacts by scenario, but not a detailed analysis. Additionally, the focus of this work is mitigation (making climate change impacts less severe) rather than adaptation (changing how people live to cope with the effects of climate change).
- UK in a global context: The scenarios developed in this project concentrate on the UK. There are some considerations for how global trends and events could influence progress towards net zero. However, the scenarios do not attempt to estimate emissions levels in other countries. It is possible that in these scenarios other nations have also met their net zero targets but also conceivable that there has been slower progress internationally towards net zero.
- Target achievement: All the scenarios presented in this report show the UK meeting its net zero target by 2050. However, the pathways taken to net zero differ, as do the costs, technical challenges, outcomes and impacts of the pathways chosen. For example, in some scenarios the pathway to net zero may be more costly or difficult.
1.3 How to use this report
This report does not make recommendations but can be used in a variety of ways to prepare for possible futures. The primary audience is policy makers in government working on net zero or indirectly relevant policies, but it should also be usable by a range of other organisations with net zero strategies (such as businesses or local authorities).
To help ensure this relevance and usability, the report has received guidance and advice from a diverse group of knowledgeable individuals including, but not limited to, those who gave time to develop the scenarios in this report and those who reviewed various parts of the project in our working group, steering group and expert group. A list of individuals and organisations who helped shape this work can be found in the acknowledgements section.
To support usability, there are suggestions below for which sections might be of most relevance for those wanting to engage with the report for different means.
Guide to using our report:
Would you like to stress test your organisation’s net zero plan?
If yes, please refer to: Our futures (3.1, 3.2, 3.3, 3.4), implications for net zero (4.2, 4.3, 4.4), public dialogue (5.3, 5.4, 5.5) & next steps.
Would you like to monitor signals that we are on a certain scenario?
If yes, please refer to: Our futures (3.3, 3.4, 3.5), implications for net zero (4.2, 4.3, 4.4, 4.5), public dialogue (5.3) & next steps.
Would you like to explore how a net zero society might feel for different groups?
If yes, please refer to: Our futures (3.1, 3.2, 3.3), implications for net zero (4.3), public dialogue (5.1, 5.2, 5.3, 5.4, 5.5, 5.6) & annex 6.
Would you like to create engaging learning materials on net zero?
If yes, please refer to: Our futures (3.1, 3.2, 3.3, 3.4), implications for net zero (4.2, 4.3, 4.4, 4.5), public dialogue (5.3, 5.4, 5.5, 5.6) & annex 6.
Would you like to: understand more about futures work and scenario development?
If yes, please refer to: Our approach (2.1, 2.2, 2.3), scenarios (3.1, 3.2, 3.3, 3.4), public dialogue (5.1, 5.2, 5.3, 5.4, 5.5), annex 1, annex 2 & annex 3
Would you like to compare model outputs to other modelling work?
If yes, please refer to: Our approach (2.3), our futures (3.3, 3.4), implications for net zero (4.1, 4.2, 4.3, 4.4, 4.5), annex 4 & annex 5.
2. Our approach
Anyone can think about what UK society might look like in 2050. Some people might imagine situations where society has not changed very much from how it is now. Others might picture worlds with huge technological innovations or societal shifts. Indeed, thinking about, and planning for, the future is something that policy makers and shapers do all the time. However, taking a systematic approach to generating future scenarios may be less familiar to some. This chapter sets out the approach used in this project, including explanations of the methods used to generate our scenarios and to translate these into models.
2.1 Overview
The net zero society scenarios have been developed using techniques from the Government Office for Science (GO-Science) Futures Toolkit.10 This is a set of methods designed to help government officials with long-term, strategic policy making. It comprises three stages:
- Evidence gathering, which uses horizon scanning techniques to identify trends (general movements across society in an identifiable direction) and weak signals (early indicators of change or emerging issues that may become more significant) that indicate potential future societal changes. The drivers (causes or reasons for change) for these trends are then identified.
- Driver mapping, which explores the relative importance and uncertainty of these drivers of future societal change and identifies critical uncertainties.
- Scenario narrative development, which brings together a number of these critical uncertainties into a set of coherent, plausible and diverse depictions of the future. This project also introduced a fourth stage to explore the scenarios further:
- Energy system modelling, which translates qualitative scenario narratives into quantitative inputs for models to consider the implications for meeting net zero in each scenario.
Figure 6. A schematic showing the four stages used in developing the scenarios and their emissions implications

The content of this figure is provided in the report in an accessible format.
Figure 6. Text version
| Step | 1. What are the emerging societal changes that could impact emissions | 2. Which of these societal changes are critical uncertainties for net zero? | 3. How could potential changes combine into coherent scenarios? | 4. What are the implications for meeting net zero? |
|---|---|---|---|---|
| Exercise | Evidence gathering: Using PESTLE to find drivers and evidence for change | Driver mapping workshop: ranking identified drivers in terms of uncertainty and importance | Scenario narratives workshop | Energy system modelling and wider analysis |
2.2 Principles
Why use scenarios?
Scenarios are short narratives that describe alternative ways a system and its environment might develop in the future. A system could be an organisation, local area, economy, or whole society, and the environment is the external factors that influence how it functions. For example, a hospital could be a system and the environment could include the physical location it is in, the investments it receives, and the number of patients it serves. Scenarios are not predictions but are a way to imagine different versions of the future. They explore how different futures could emerge, identify risks and opportunities, and test what can be done to achieve various objectives in different future circumstances. By definition, they tend to be discrete alternatives and reality will most likely lie in some mix of scenarios.
The net zero society scenarios have been developed by identifying critical uncertainties relating to how society will use energy and consume goods between now and 2050. Critical uncertainties are potential future changes that are likely to be important, but it is currently unclear which direction the change will go in and/or what the magnitude of change is likely to be. Because it is not possible to know the changes that will happen, this means there are a range of plausible future ‘end states’. These end states can include opposing extremes when critical uncertainties could go either of two very different ways. A scenario is built from a combination of end states that are coherent and possible but still present different and interesting conditions.
The narrative scenarios presented in this report include some explanation of how a particular end state has occurred, based on available evidence on how wider societal changes (such as economic growth) could impact behaviours associated with reduced emissions (such as driving less or using products for longer). The advantages of this approach are:
- It helps decision makers understand which wider changes might lead to such scenarios.
- It acknowledges evidence on correlations between factors that might not be represented in a simpler sensitivity analysis of individual factors. For example, a high technology world could lead to higher energy demands in some areas (such as manufacture of electronics due to higher consumer demand) but lower demand in others (such as travel for work due to improved digital communication). It could also accelerate the development of technologies to achieve net zero.
- It allows a wider set of indicators to be developed to track against the scenarios, including wider societal factors that could affect pathways to net zero.
Of course, it is important to acknowledge that the relationships assumed in our scenarios are not set in stone, and that causality in society is rarely provable (that is to say, demonstrably true) or immutable (meaning unable to change). Scenarios may suggest that a particular event could trigger a specific change. However, that does not mean the event would definitely cause the change, nor that the event would be the only way for the change to happen, nor that the change would last. For this reason, we have kept explanations of some of the aspects of scenario end states more open to interpretation.
What are the principles for our scenarios?
Some key principles for the net zero society scenarios include that they are:
- Plausible: Scenario end states should feel like they could happen by 2050. This means critical uncertainties need to be combined in a coherent way, considering their likely interactions. This also requires narratives to consider what might happen between now and 2050 to reach the end state.
- Stretching: As the scenarios are being developed to stress-test government strategy, they should feel stretching and, in some cases, uncomfortable or unduly negative, diverging from what policy makers consider to be the ‘business as usual’ trajectory.
-
Answer important questions: The scenarios should be designed to help answer key questions for government, such as:
- What are the possible range of outcomes that could come from identified critical uncertainties and how can these be planned for?
- What if society starts to evolve in a way that increases (or decreases) energy demand significantly beyond current assumptions? What would the implications be for meeting net zero if that trend continues?
- What do decision makers who are considering supporting a particular societal change need to know about the wider benefits and costs?
- What will be needed in the wider system to ensure that possible negative impacts of any transitions are abated and positive impacts augmented?
2.3 Process
Stage one: Evidence gathering
History and trends
Looking back over the past 30 years, we can see how societal changes (such as pervasive internet use or low-cost air travel) have had widespread impacts on energy use and GHG emissions. As part of the evidence gathering stage of the project, a recent societal trends report was produced (Annex 1). It explored historical relationships between drivers of change, societal trends, and emissions within four sectors: the built environment, travel and transport, work and industry, and food and land use. This evidence informs the assumptions about the future relationships between these factors, which have been used to build the scenarios. An example of how drivers of change were mapped to recent societal trends and the likely impact can be seen in Figure 7, below.
Figure 7. Relationships between selected drivers of change, societal trends, and emissions

The relationship between selected societal drivers of change, behavioural trends, and emissions. The content of this figure is provided in the report an accessible format.
Figure 7. Text version
| Societal driver of change | Resulting net zero behavioural trends from drivers of change | Impact on net zero |
|---|---|---|
| Digital communications | Demand for travel & demand for home heating | Energy and emissions |
| UK economic growth | Demand for travel & demand for UK manufactured goods | Energy and emissions |
| Reshoring of manufacturing | Demand for UK manufactured goods | Energy and emissions |
Although we show the causal impacts of societal changes on energy demand and emissions here in Figure 7, there are also feedback loops that exist, particularly in relation to demands spurring innovation in new technologies.
The recent societal trends report focused on an illustrative set of trends that were selected based on: their importance for emissions, the public availability of datasets, and sector experts’ views. The report reviewed over 100 relevant pieces of research literature to identify and investigate the underlying societal drivers and disruptors of these trends.
Of the identified societal drivers of change, many are familiar and longstanding, including government policies, the state of the economy, and the associated costs and performance of low emission choices. However, other drivers that were identified have emerged more recently, including supply chain disruptions, availability of critical raw materials and parts, and limited familiarity with new technologies such as heat pumps. The top three drivers found to affect a large number of trends (such as traffic flows, home insulation rates and food waste) were:
- Economic growth, which is the increase in the value of goods and services produced within a population. It is related to the availability of new products/services and to household incomes. Higher economic growth is associated with higher levels of consumption and travel. For example, pre-pandemic, rising incomes and falling airfares were the main drivers of demand for aviation; distance flown internationally grew by 20% from 2010 to 2019.
- Environmental awareness, which is the understanding of the importance of the natural environment and its protection. Environmental awareness can often be a moderating force on the increases in consumption associated with economic growth. For example, environmental considerations are one of the main drivers for switching to plant-based diets, alongside health and personal ethical reasons. The number of people reporting following a meat-free diet increased by 11% between 2016 and 2022.
- Demographics, which includes population characteristics such as household size, age and income. Demographic changes in society are strongly correlated with trends in overall consumption of food, services and goods, although the direction of the impact varies for different demographic changes.
The complexity of these drivers is illustrated by Figure 8, which shows these drivers on the left, the trends they affect in the middle and the contribution of these trends to sectors on the right. This figure does not show specific effect sizes; the weight of the lines from the drivers are kept even and do not include information about the size of the contribution to the trends as these are not reliably quantifiable.
Figure 8. Societal drivers affecting the largest number of trends across the four sectors

The societal drivers affecting the largest number of trends across the four sectors used in modelling. The content of this figure is provided in three tables in the report in an accessible format.
Figure 8. Text version
| Sectoral driver: environmental awareness | |
|---|---|
| Sub-driver | Sector used in modelling |
| Home insulation rates | The built environment |
| Smart meters | The built environment |
| New EV sales | Travel and transport |
| Charging points | Travel and transport |
| Low-traffic neighbourhoods | Travel and transport |
| Rooftop solar PVs | The built environment |
| Non-residential energy efficiency | The built environment |
| Meat-free eating | Food and land use |
| Food waste | Food and land use |
| Sectoral driver: economic growth | |
|---|---|
| Sub-driver | Sector used in modelling |
| Traffic flow | Travel and transport |
| Loading factors for freight | Travel and transport |
| Demand for aviation | Travel and transport |
| Food waste | Food and land use |
| Construction and demolition waste | Work and industry |
| Consumption and trade | Work and industry |
| Non-residential floor area | The built environment |
| Sectoral driver: demographics | |
|---|---|
| Sub-driver | Sector used in modelling |
| Consumption and trade | Work and industry |
| Non-residential floor area | The built environment |
| Household size | The built environment |
| Residential floor area | The built environment |
| Calorie consumption | Food and land use |
Identifying drivers of change
Horizon scanning is the process of looking for early warning signs of change in the policy and strategy environment. A horizon scanning exercise was conducted to try and answer the question ‘What are the main drivers of societal and behavioural change that will directly or indirectly affect UK GHG emissions between now and 2050?’. Given the need to produce scenarios that can be used to test UK net zero policy, this exercise mainly focused on drivers of change outside of the decarbonisation policy space that could impact emissions. However, some drivers were considered that could be influenced by both policies and other external factors, such as the relative costs of ‘green’ choices (which are affected by policies and factors like inflation or technological innovation).
Candidate drivers of change were identified via desk-based research. Sources included academic literature, grey literature , and news articles. These were structured using a PESTLE framework , then sifted into a shortlist of 40 drivers (Annex 3).
Evidence on the extent to which drivers influence social trends, thereby leading to overall societal change, was considered in an evidence review (Annex 2). This review explored how change in complex systems (which UK society can be considered) works and what factors can drive change. It explores cases studies from previous societal changes to show how system change can be initiated at various levels (including through top-down government policy and bottom-up social movements) and how various factors may interact to produce different results. Sometimes these may be results that policy makers or shapers do not predict, especially in terms of the speed of changes. For example, some interventions may experience unexpected resistance from the system while others may pick up speed, cause spill-over effects or trigger a social tipping point. The review also provided supporting evidence for the project’s prior assumption that it is important to consider a wide range of trends and drivers when thinking about future societal change. Other insights from this evidence review were used to test the plausibility of the proposed effects of potential drivers, the internal coherence of scenario narratives and the setting of modelling inputs in later stages.
Stage two: Driver mapping
Identifying critical uncertainties
The next stage was to consider which drivers were most important and uncertain. To ensure the final scenarios were usable by a range of stakeholders, it was important to bring in a variety of relevant expertise and diverse perspectives at this stage. A workshop was held that brought together 35 individuals from national government, local government, industry, third sector organisations, citizen groups, and academia.
First, drivers were mapped in terms of importance and uncertainty, defined as follows:
-
Importance: Participants were asked to consider the potential scale and duration of impact of the driver on UK GHG emissions and/or energy consumption between now and 2050. As well as long-term impacts, short-term impacts were considered. In cases where the driver was uncertain, participants were asked to think about extreme plausible outcomes for that driver before deciding on its importance.
-
Uncertainty: Participants were asked whether they could imagine multiple different plausible outcomes for this driver, either because of a lack of evidence on the direction of travel, or because of deep uncertainty inherent in complex systems over long timescales. Uncertainty and importance were not necessarily correlated. For example, increased use of renewable electricity will be important for net zero targets but it is low in uncertainty (trends and current policies indicate a relatively clear path). Uncertainty was interpreted as the level of difference between these plausible outcomes (the wider the gap between plausible outcomes of a driver, the more uncertain it is).
Participants scored each driver in terms of importance and uncertainty. Average scores are shown in Figure 9 below. This exercise helped to identify critical uncertainties, which are drivers that are both highly important and also highly uncertain. Eighteen critical uncertainties were identified using importance/uncertainty scores and qualitative feedback from experts (see Figure 9 and Table 1 below).
Figure 9. Importance/uncertainty scores for shortlisted drivers of change

Axes of importance and uncertainty including 41 drivers of change identified using a PESTLE framework. 18 critical uncertainties shown as being highly important and uncertain. The content of this figure is provided in the report in accessible format.
Figure 9 data
| PESTLE factor | Driver label | Uncertainty Score (range: -4 to 4) | Importance Score (range: -4 to 4) |
|---|---|---|---|
| Political | P4: Business backlash in political decision making | -1 | 3 |
| Political | P5: Polarising trust in government | 0 | 1 |
| Political | P6: increasingly controversial and fractious geopolitics | 1 | 2 |
| Economic | Ec1: Macro-economic stability and growth | 0 | 3 |
| Economic | Ec2: Relative costs of ‘making the green choice’ | 0 | 4 |
| Economic | Ec6: Potential for increased localisation of production and economic activity | 2 | 1 |
| Societal | S1: Shifts in where and how people live – places, housing, and families | 0 | 1 |
| Societal | S2: Changing nature of work | 0 | 1 |
| Societal | S5: Real and perceived unfairness of impacts of climate change and paying for net zero | -1 | 3 |
| Technological | T1: Potential for net zero technology cost or performance changes that move the goal posts | 1 | 4 |
| Technological | T3: Increasing use of connected and autonomous vehicles | 0 | -1 |
| Technological | T4: Increasing use of artificial intelligence in energy systems and across the economy | 0 | 1 |
| Legislative | L2: Increasing cases of climate change litigation | 0 | 2 |
| Legislative | L3: Increasing financial costs for emissions | -1 | 3 |
| Legislative | L4: Other countries legislate to stop UK outsourcing its emissions | 0 | 3 |
| Environmental | En2: Increase in development and greening of liveable cities | 0 | 1 |
| Environmental | En3: Decreasing property value and increased internal displacement due to environmental concerns/extreme weather | -1 | 1 |
| Environmental | En5: Increasing tension in how land is used – housing, farming, power generation, afforestation, etc. | 0 | 3 |
While these 18 critical uncertainties form the basis for the scenarios, the other 22 drivers are still of relevance and in some cases were used to inform the final scenario narratives.
Developing axes of uncertainty
The critical uncertainties were then developed into ‘axes of uncertainty’. This involves exploring two alternative outcomes for each critical uncertainty that are both plausible and divergent from each other. The workshop participants developed these in breakout groups, and resulting ideas were then further refined by the net zero society project team. The full set of axes is included in Annex 3.
Table 1. Critical uncertainties sorted by PESTLE category
| Category | Critical uncertainty | Description |
| Political | P4: Business influence on political decision making | Reaching net zero requires change from the population, private sector, and public sector organisations. However, the extent of corporate involvement in these processes is unclear and could potentially influence political decision making. Understanding the overall direction of this as either an enabler or barrier to meeting net zero is vital in the future. |
| Political | P5: Polarising trust in government and institutions | In 2022, the ONS found 35% of the population stated that they trust the national government, although different levels are reported in various services provided by government. When people do not trust that decisions are being made with their interests at heart, they are less likely to be accepting of policy change. Therefore, polarised trust in the government, particularly across different sections of society, creates uncertainty about the extent that change can happen as a result of net zero policies. |
| Political | P6: Fractiousness of geopolitics | The UK’s geopolitical alliances are increasingly important in the context of ongoing conflicts, volatile energy prices and the impacts of climate change across the world. This context drives uncertainty in how effective multilateralism can be and could impact the implementation of global decarbonisation agreements (positively or negatively) depending on the fluctuating geopolitical state of play. |
| Economic | Ec1: Macro-economic stability and growth | A growing economy can drive production and consumption of more goods and services, and growing household incomes are associated with increased levels of travel. Although the exact impact on energy demand and emissions will depend on how quickly energy and emissions intensities are falling, more growth will mean more energy demand, all else equal. On the other hand, economic growth is also associated with investment and technological innovation, both of which are needed to meet net zero. The OBR has tended to forecast lower long-term growth since the 2008 financial crisis, which has been ‘baked into’ net zero pathways. The tension between this assumption and a desire to increase economic growth results in uncertain implications for emissions into the future. |
| Economic | Ec2: Relative costs of ‘making the green choice’ | The ‘green gap’ describes the gap between consumers’ stated intention to act sustainably and their actual behaviours, often due to the perceived or actual cost of making a sustainable choice. A variety of factors influence this, such as rising costs, inflation, and ease of access/use. It is unclear how changes in these factors will play out over the long term and impact societal trends in sustainable (‘green’) choices. This driver is focused on factors outside of government climate policy. |
| Economic | Ec6: Potential for increased localisation of production and economic activity | Driven by supply chain disruptions during the COVID-19 pandemic, it has been estimated that the manufacture of £4.2 billion worth of products could be reshored by UK retailers between 2020 and 2021. A UCL analysis highlighted a range of factors that would determine the impact of this on emissions, on both the supply and demand side. For example, UK domestic energy use and emissions would likely be higher in a scenario with increased reshoring relative to a scenario with lower levels of reshoring, but this could potentially lead to the UK’s overall carbon footprint being lower due to the use of less carbon-intensive energy in the UK. There could also be trends towards localisation of economic activity within the UK, driven by technology and societal trends, and triggered by such shifts during the pandemic. |
| Societal | S1: Shifts in where and how people live - places and housing | The ONS has found that family and household structures have been constantly changing. For example, there has been an increase in single-person households and multi-family households. These changes, along with how people work (see below driver), can have a range of impacts on emissions, complicated by the diverse range in the types of housing they inhabit, which influences energy efficiency. |
| Societal | S2: Changing nature of work (including remote working and changing sector mix) | Advances in automation and remote communication technology, as well as changes spurred on by the COVID-19 pandemic, have changed the nature of how and where people work. The changing cost of energy may also impact whether people choose to work at home or in the office. Ongoing uncertainty in these trends creates uncertainty in energy use and emissions in related sectors, such as buildings and transport. |
| Societal | S5: Real and perceived unfairness of impacts of climate change and paying for net zero | There is a growing emphasis on how to mitigate the unequal impacts of climate change. If net zero policies disproportionately affect the less well-off and consumption increases for the richest segments of society, this might lead to a backlash against such policies. At the same time, groups experiencing the worst effects of climate change might put pressure on governments to accelerate emission reductions. |
| Technological | T1: Potential for net zero technology cost or performance changes that move the goal posts | If low carbon technologies are adopted more rapidly than expected, such as due to lower costs and performance improvements, emissions could drastically reduce. Other technologies, such as geoengineering or direct air capture solutions, could also change government priorities in tackling climate change. However, it is uncertain (both on the demand and supply side) the extent to which these changes will occur, and whether they will be balanced out by other factors both domestic and internationally. |
| Technological | T3: Use of connected and autonomous vehicles (CAVs) | Experts predict that new automobiles will have autonomous capabilities under most conditions within 10-20 years. Automation facilitates the adoption of energy-saving driving practices and changes in vehicle design that enable emissions reductions. However, heavy uptake of CAVs could increase demand for travel by car, including by non-drivers. There is also uncertainty over their impacts on reconfiguration of streetscapes and the effect this could have on public transport and active travel options. |
| Technological | T4: Use of artificial intelligence in energy systems and across the economy | Increasing deployment of AI in electric power systems could optimise power grids and increase energy efficiency, thereby reducing emissions. However, powering and training AI in the first place is energy intensive, and there is considerable societal scepticism of AI, raising the question of how this tension will be balanced to optimise energy efficiency with public trust. |
| Legal | L2: Potential cases of climate change litigation | The cumulative number of climate change-related litigation cases has more than doubled from 2015 to 2022. Strategic litigation that targets governments, businesses and financial actors is on the rise. Increasingly, litigation is used as a tool to encourage a ‘just transition’, but also as a way for fossil fuel companies to litigate against governments. Depending on the source, volume and value of these litigations, the impact on government actions and societal emissions could be substantial. |
| Legal | L3: Financial costs for emissions | Civil penalties issued to businesses by the Environment Agency for non-compliance with climate change legislation increased from £1.4 million to £2.1 million between 2018 and 2021. UK carbon credits have been increasing since the UK Emissions Trading Scheme (ETS) started and are retailing at a higher cost than those in the EU ETS. All else equal, this might increase the financial incentive for companies to reduce their emissions, but it is not known to what extent this would happen, or if they could turn to offshore emission increases instead. |
| Legal | L4: Changes to the global carbon accounting regime | As of 2019, the UK is the biggest net importer of carbon dioxide emissions per capita in the G7. , Were the global accounting regime to change significantly it could lead to changes in how national policies have to respond to different sources of emissions. |
| Environmental | En2: Development and greening of liveable cities | A trend towards green and liveable cities is being seen in an effort to facilitate climate-friendly urban areas. Increasing urban tree cover, for example, improves resilience to climate change and improves perceived aesthetics and liveability of neighbourhoods. Improvements in city infrastructure also encourage active travel and discourage car use. However, it remains to be seen how widespread these developments will be in the UK and how significant an impact they will have on the behaviour of city residents. |
| Environmental | En3: Influence of environmental concerns / extreme weather on property values and internal migration | Economic theory suggests that climate-related risks (such as flooding and rising sea levels) should decrease property values in at-risk areas but, the relationship has been found to vary depending on the frequency and severity of extreme events. How this relationship develops with the increasing trends in extreme weather events and the fluctuating property market is uncertain. |
| Environmental | En5: Tension in how land is used - housing, farming, power generation, afforestation, etc | There is likely to be increasing competition between renewable energy generation, development, and urbanisation due to population expansion, afforestation, peatland restoration, and growing crops for bioenergy. However, there is uncertainty over how this will play out and how land will ultimately be used, particularly where uses such as solar, onshore wind and housing face opposition from the public being affected. |
Axis clustering and correlation analysis
Following the workshop to identify critical uncertainties, the net zero society project team assessed common themes and relationships between the 18 axes of uncertainty and identified two dominant axes of uncertainty which form the basis of the four scenarios:
- Social cohesion and institutional trust: This axis is concerned with long-term uncertainty over the strength of connections between different social groups along with the levels of trust in institutions (including businesses, local/national governments and intergovernmental organisations).
- Economic growth and technological progress: This axis is concerned with long-term uncertainty over the level and stability of economic growth (reflected in employment and productivity) along with the pace of development and adoption of new technologies.
The mapping of the 18 original axes of uncertainty is shown in Figure 10 below. These 18 were then used as ‘sub-axes’ to help provide further detail and nuance to the scenarios.
Figure 10. Mapping of the sub-axes of uncertainty against the two dominant axes of uncertainty: social cohesion and institutional trust (top) and economic growth and technological progress (bottom)

The content of this figure is provided in the report in an accessible format.

The content of this figure is provided in the report in an accessible format.
Figure 10 text
| Low social cohesion & institutional trust | High social cohesion & institutional trust |
|---|---|
| The low social cohesion & institutional trust direction is associated with weak connections between different social groups and low trust in institutions | The high social cohesion & institutional trust direction is associated with strong connections between different social groups and high trust in institutions |
| Economic centralisation | Economic decentralisation |
| Businesses act against targets and regulation | Businesses agree and act on strict emissions targets |
| People feel disproportionate impacts due to cost distribution | People trust the costs of action are fairly distributed |
| Increased number of legal losses for the environment | Increased number of legal wins for the environment |
| Less population pressure on urban centres | High urban population pressures |
| More dispersed population | More concentrated urban polarisation |
| Declining trust in government and its communications | Resurgence in trust in government and its communications |
| Goals of nations are in direct opposition | Common agreement between countries on priorities for humanity and the world |
| Low occupancy private ownership | High occupancy sharing with communal ownership |
| AI role is active and controlling with higher risk | AI role is primarily informative/ advisory with strong oversight |
| Flawed participatory mechanism resulting in no agreement on land use priorities | Well developed participatory mechanism to determine land use priorities |
| Low growth & tech progress | High growth & tech progress |
|---|---|
| The low growth & technological progress direction is associated with low economic growth and slower technological progress | The high growth & technological progress direction is associated with higher economic growth and faster technological progress |
| High carbon transport is cheapest choice | Low carbon transport is cheaper and more desirable |
| Economic costs of CC are largely ignored in decision making | Economic costs of CC considered are in decision making |
| Society relies on manual tech for daily tasks | Society relies on AI and automated processes |
| Low and fluctuating productivity growth | High and steady productivity growth |
| No investment into new builds, resulting in badly insulated old housing stock | Investment into new builds that are net zero compliant |
| Mercantilism (emissions) | Global commons (emissions) |
| Unregulated development planning with low investment in low carbon infrastructure and green spaces | Strong development control increasing investment in low carbon infrastructure and green space |
| Unmet promises by technology | Aggressive net zero technology development and adoption |
To incorporate aspects of these 18 sub-axes into the scenarios in a consistent and evidence-based way, the project team explored research literature for the evidence on the relationships between the two dominant axes and key themes represented within the sub-axes.
First, focusing on the sub-axis of ‘institutional trust’, key themes include:
- Social cohesion: Evidence suggests that social cohesion and institutional trust are highly correlated, with researchers suggesting that institutional trust is a component of social cohesion. , , , Data also show that these two factors are not just correlated at society-level but also within individuals; people who express higher institutional trust also perceive there to be higher social cohesion. Because of the high correlation between these factors, it is extremely difficult to disentangle them and, therefore, they have been considered together as one axis.
- Polarisation: Lower trust and interaction between different groups is associated with greater polarisation. They are correlated and interact in various ways, with neither being the definite driver for the other. For example, having stronger (more polarised) viewpoints may mean that an individual trusts fewer sources of information and, therefore, only relies on information within an ‘echo chamber’. However, the reverse may also be true, where an individual may find themselves within a certain limited group (online or in real life) and only having access to one viewpoint creates mistrust of others and results in greater polarisation.
- Interpersonal trust: There is a correlation between individuals trusting institutions and them trusting others (with those who have higher levels of institutional trust also having higher rates of interpersonal trust). Evidence suggests that there is a causal link, where an increase in institutional trust results in an increase in interpersonal trust, especially where there are positive interactions with representatives of institutions (for example, healthcare workers, police officers or government officials).20,65, Research suggests that the reverse effect (where greater interpersonal trust precipitates greater institutional trust) is either weak or unattested.65
- Isolation: Extended periods of social isolation is associated with lower trust in institutions. Loneliness and isolation are also correlated with lower interpersonal trust. , Evidence suggests both that being isolated makes people less trusting of others, but also that being less trusting (of institutions and individuals) may lead to becoming socially isolated. It has also been found such effects are reversable and that raising people’s trust in their neighbours can reduce loneliness and feelings of isolation.
- Urbanisation: Some research has shown that those living in cities have greater institutional trust than those living in rural areas and that when institutional trust is low, trust between groups (such as between urban dwellers and rural dwellers) is also low. , , Causality is less clear as it is difficult to establish whether higher trust leads to greater urbanisation (with more people choosing to move into cities) or whether more people living in close proximity increases trust.
- Decentralisation: Evidence suggests that administrative and fiscal decentralisation (where responsibilities and/or revenues are cascaded to more local/regional levels of government) is associated with greater levels of institutional trust. , Focusing on the sub-axis of ‘economic growth’, key themes include:
- Technological progress: Evidence shows that economic growth and technological progress are closely linked, with some research indicating that technological progress is the most significant driver for economic growth. , , Indications are that it is difficult, and likely counterproductive, to try to disentangle these two factors.
- Urbanisation: An increased proportion of the population of a country living in towns and cities (as opposed to in rural areas) is associated with higher economic growth. , Evidence shows that people moving into urban areas can increase economic growth. This effect is considered to be driven by economies of agglomeration (where costs decline and benefits increase when individuals and businesses are brought geographically closer together) and by increasing productivity in urban areas. , , , , Other related factors also contribute to the increased economic growth correlated with urbanisation, such as investment in transport infrastructure. However, the relationship between urbanisation and economic growth is non-linear and evidence suggests that greater effects are likely for countries with low urban populations and smaller effects are likely where significant urbanisation has already occurred.80, The size of an urban area also does not directly predict the productivity or economic activity in that area; larger cities are not necessarily more productive or prosperous cities.86,87
- Population health: Higher economic growth means more money available for services such as health. GDP (gross domestic product) per capita and life expectancy are correlated. A similar correlation is also found between expenditure on healthcare and both life expectancy and healthy life expectancy (average years spent living in ‘good’ health).90 However, the relationship between a nation’s GDP and its population’s health is complicated and countries with lower GDP per capita have similar health outcomes to the UK. Evidence has long shown that an increase in GDP delivers the biggest effect on life expectancy for the least economically developed countries with diminishing returns in more economically developed countries. , Isolating individual causal factors for increased life expectancy is also difficult. There are numerous factors that often co-occur with rising GDP that contribute to increased health and life expectancy, including better living standards, access to medical innovations (in treatment, diagnosis and prevention), improved education and higher incomes.90, , , , , Research shows that an individual’s income directly affects their overall health, including their healthy life expectancy. There is also some limited evidence suggesting that income inequality within a country can contribute to adverse health outcomes. Therefore, although growth may make positive health outcomes easier, we have not treated lower economic growth and better health as completely incompatible in our scenarios.
- Energy demand and GHG emissions: Increased economic growth has historically been correlated with increased energy demand and resulting GHG emissions within a country. , , , However, many countries, including the UK, have started to ‘decouple’ these factors by findings ways to increase economic growth while stabilising or reducing energy demand and GHG emissions.55, , Once net zero emissions has been achieved, GHG emissions will effectively be fully decoupled from economic growth, but in this case, society will still need to use a finite amount of energy, so the future relationship between economic growth and energy use remains uncertain. Energy demand in the UK has been reducing over the last decade and most projections assume demand will continue to fall. However, the level of demand reduction by 2050 will vary and depend on a range of factors, including economic growth. One of the key indicators used for economic growth is GDP. Higher GDP growth can be associated with higher consumption; increasing consumption can increase GDP, but also having higher incomes (often related to economic growth) increases consumption. , However, the relationship between consumption and GDP is weaker in high income countries. , Therefore, the relationship between future economic growth and future energy demand (both in the UK and globally) cannot be assumed without considering the types of activity/technology that are driving the economic growth and the energy system being used to support these activities.
Stage three: Scenario narrative development
Creating and refining scenario narratives
As part of stage three, a second workshop was held with the same group of participants, who were sent descriptions of how the two axes were combined to produce four high-level scenarios. The descriptions were initial sketches of each future world, aiming to provide enough detail for participants to be able to visualise what they might look and feel like, but not so much detail that their creativity was constrained in helping bring the scenarios to life through workshop exercises. Three workshop exercises were designed to help answer three questions:
- What would a 2050 society look like in each scenario? How will people live, work, play and consume?
- What will these scenarios mean for the way we use energy and resources in key emissions sectors (the built environment, travel and transport, work and industry, and food and land use)?
- What are plausible timelines for these scenarios between now and 2050? What would have to happen for us to end up in this world?
The workshop generated a rich set of outputs with suggestions from experts for factors to consider and possible interdependencies. These were captured on an online collaboration platform.
Finalising the scenarios
The final step was to build more detail into the scenario narratives, enhancing their plausibility and coherence as described above. This involved the following stages:
- Producing the narratives: Scenario narratives were drafted to describe what each 2050 society would look like and what the implications might be for how people in the UK live their lives. The narratives were also brought to life through illustrations.
- Identifying names: Scenario names were selected from workshop suggestions to help succinctly summarise each scenario and make it easier to refer to them in subsequent workstreams.
- Comparative analysis: Scenarios were compared side-by-side on a range of variables of interest to ensure they were sufficiently different from one another and helping to explore different policy issues.
- Consulting stakeholders: Key stakeholders inside and outside government were consulted on the drafts to ensure the outputs appropriately reflected the workshop participants’ views and tackled the issues the scenarios were expected to explore.
- Balancing positive and negative aspects: Work was undertaken to ensure the narratives and scenario names were relatively neutral and included a mix of positive and negative aspects. This was partly to enhance plausibility. It was also to ensure that all the scenarios create similar levels of interest. Ideology and individual preferences may make certain scenarios more appealing to some individuals, but no one scenario is intended to be ‘preferable’ or ‘better’ than any other.
The final scenario narratives are presented in the next chapter.
Stage four: Energy system modelling
This section provides a high-level overview of the modelling stage, with further details provided in Chapter 3 (modelling inputs summary), Chapter 4 (results), and Annex 4 (full modelling inputs).
The modelling framework
The qualitative scenario narratives give an indication of what a future UK society could look like by 2050. The challenges in achieving the net zero target vary by scenario and this means each scenario has a distinct energy system that meets the needs of its society. To translate the scenarios into models to explore the implications for energy, land and other resources, the net zero society project team worked with modellers from the Centre for Research into Energy Demand Solutions (CREDS).
The CREDS modelling framework’s depth, breadth and overlap with government models made it a suitable tool for representing the net zero society scenarios. The CREDS modelling framework (Figure 11) includes four sectoral models (Table 2).8 The UK TIMES model integrates these into a UK-wide energy system. The models have been harmonised through consistent high-level assumptions, such as future changes in population, economic growth, and household size (varying by scenario). In addition, interactions between the sectors have been captured through comparing demand profiles within specific sectoral models. For example, manufacturing levels in each scenario depends on the amount of construction activity in the built environment and the number of vehicles manufactured for use in the travel and transport sector.
Figure 11. CREDS modelling framework

The content of this figure is provided in the report in an accessible format.
Figure 11 text version
| Step | 1. Development of a scenario narrative provided to the modelling teams | 2. Sector level modelling relying on the most appropriate structure for each sector | 3. Identification of inter-linkages | 4. Integration into a central modelling system | 5. Coherent scenarios |
|---|---|---|---|---|---|
| Action | Considering factors such as digitalisation, sharing & circular economy, energy efficiency, healthy society, environmental awareness, globalisation, work & automation | Models used: •Work and industry- UK MRIO •Travel and transport – TEAM UK •Non-domestic built environment– TEAM UK •Food and land use – UK MRIO •Domestic built environment – National Household Model | For example, domestic built environment affects: •Non-domestic built environment •Travel and transport •Work and industry Non-domestic built environment affects: •Domestic built environment •Work and industry Work and industry affects: •Travel and transport Travel and transport affects: •Work and industry Food and land use affects: •Land use (bespoke analysis) •Work and industry | All five models integrate into UKTM | Four scenarios that are internally consistent and have a clear common narrative: •Atomised •Metropolitan •Self-preservation society •Slow lane |
Table 2. Models used for each of the sectors
| Modelling focus | Model |
| Overall energy system | UKTM (UK TIMES model) |
| The built environment | UK NHM (National Household Model) and a bespoke non-residential buildings model |
| Travel and transport | TEAM-UK (Transport Energy Air Pollution Model for UK) |
| Work and industry | Hybrid UK MRIO (Multi-Regional Input Output model) |
| Food and land use | Hybrid UK MRIO (Multi-Regional Input Output model) |
Translating scenario narratives into models
The scenario narratives provide a high-level description of each plausible future along with suggestions of what four different sectors (the built environment, travel and transport, work and industry, and food and land use) could be like in 2050. Using these qualitative descriptions as a starting point, the net zero society project team worked with modellers to develop a set of evidence-based model inputs for each sector, varying by scenario (Annex 4). High-level assumptions applicable across the sectors, such as economic and population growth, were also defined for each scenario, drawing on different projections from the Office for Budget Responsibility and the Office for National Statistics. , The sectoral inputs were used to run sectoral models. These models, alongside the pre-defined high-level assumptions, were fed into the UK TIMES Model (UKTM). UKTM is a technology-rich cost-optimisation model of the UK energy system developed by UCL and BEIS for decarbonisation scenarios.
The quantitative inputs for the sectoral models and the high-level assumptions by scenario are presented alongside the scenario narratives in the following section (Chapter 3). The parameters consist of a set of assumptions for each of the four sectors described earlier, as well as cross-cutting macro-economic assumptions that influence multiple sectors. For example, changes in household size and income affect: car ownership, demand for housing, and the composition of diets. Four sector-specific groups of parameters were identified in the scenario narratives as qualitative factors that could possibly be translated into quantitative inputs for modelling. Not all qualitative assumptions were ultimately represented in the models (because they did not fit into the specified models or there was a lack of robust evidence available to quantify these factors appropriately). However, the full set considered are listed below.
Each parameter could be set at one of five levels: low, medium-low, medium, medium-high, and high. The parameters for each scenario were:
- Cross-cutting: 1) Growth in GDP per capita: rate of change in the UK’s gross domestic product divided by its population. 2) Household size: the average number of individuals living in a UK household. 3) Household disposable income: the average income per household after taxes and other deductions. 4) Number of households: the total number of households in the UK.
- Built environment: 1) Floorspace per person: the UK’s building floor area divided by its population. 2) Home working: the use of computers to work remotely rather than from the office, increasing energy use per household, expressed as total number of business trips. 3) Insulation and energy efficiency: measures to prevent heat loss from a building and reduce energy use per household for a given energy service such as space heating. 4) Data processing demand: use of computing particularly through data centres increasing total final energy demand. 5) One person households: the number of households occupied by just one individual.
- Travel and transport: 1) International travel and aviation: travel that crosses the UK borders expressed in trips per capita and trip lengths. 2) Virtual interactions: communication through the use of remote and digital media, resulting in the overall reduction in motorised miles per person, expressed as percentage decrease in trips per capita. 3) Autonomous vehicle uptake and use: the rate of adoption of autonomous vehicles as well as their occupancy, their size, and whether vehicles are shared. Higher uptake can increase trip length, due to lower costs, and also influence vehicle size and occupancy, depending on how each society is likely to use the technology. 4) Active lifestyles: ways of living that involve a lot of physical activity such as cycling and walking, reducing motorised miles per person, expressed as a shift in distance travelled from x to y modes, by trip length category. 5) Shared travel options: sharing of transportation by a group of people, reflected in vehicle occupancy rates, expressed as a shift in distance travelled from x to y modes, by trip length category. 6) Urbanised populations: the number of people living in cities, which affects trip length and mode share.
- Work and industry: 1) Sharing economy: a system where resources such as equipment, vehicles and land are shared among individuals, reducing the share of manufacturing in the UK’s GDP. 2) Make do and mend: maintaining the condition of goods so that they are in use for as long as possible, reducing the share of manufacturing in the UK’s GDP, expressed as product longevity. 3) Reshoring of manufacturing: returning the production of goods back to the UK, reflected as an increased share of manufacturing in domestic GDP accompanied by reduced imports. 4) Automation: use of digital technologies to control machinery without, or with less, human input (this parameter was not used in the modelling). 5) Resource consumption: the country’s use of resources (such as energy, water and materials) divided by the country’s population. 6) Rebound effects: behaviours emerging in response to energy-saving measures that negate or reduce those energy savings (this parameter was not used in the modelling).
- Food and land use: 1) Meat consumption: changes in the amount of meat consumed as a proportion of total daily calories. 2) Reliance on food imports: the ability of the UK’s own food production to meet domestic demand for food, measured as the value of food production divided by the value of food consumption. 3) Alternative proteins uptake: replacement of red meat with cultured equivalents, measured as the market share of cultured meat. 4) Afforestation: the annual rate of tree-planting. 5) Greenfield development: property construction on previously undeveloped land (this parameter was not used in the modelling). 6) Food waste: the amount of discarded food that was otherwise suitable for consumption expressed as percentage change in the amount of food wasted (of the waste that is avoidable).
The full set of modelling inputs by sector and scenario, including a rationale for how the assumptions vary by scenario, is available in Annex 4. Examples of how levers were set within each sector are provided in tables throughout Chapter 3.
In addition to considerations for individual sectors, we used qualitative systems thinking maps to explore interactions between sectors to ensure the scenarios were represented as coherently as possible. More detail on this is provided at the end of Chapter 3.
Throughout the modelling process, quality assurance procedures were followed to check for errors and ensure that modelling inputs and outputs were suitable and supported by experts. The process included meetings with government officials with expertise in specific sectors to review levers and assumptions, discussions with government analysts to select appropriate scenario assumptions (such as economic growth and end-use demands), and both internal and external reviews of modelling assumptions and outputs.
We have implemented the modelling exercise using state-of-the-art and technically robust tools and methods, used by both leading academic groups and government departments, but as with any modelling exercise there are some limitations and aspects that could be accounted for in future work. As a key example, one limitation is that technology cost reductions are the same across all scenarios and are not driven by increased uptake, despite there being evidence of this, at least at the global level. This is discussed further in Chapter
3. Our futures
What might life in the UK be like in 2050? What are the implications of different futures for four key sectors in society (the built environment, travel and transport, work and industry, and food and land use)? How might events over the next few decades affect the path to net zero? This section aims to answer these questions by describing and illustrating the four net zero society scenarios. It sets out the scenarios in narrative form, which can help the reader conceptualise these different plausible futures. These narratives, and the implications discussed in the next chapter, can help policy makers and shapers anticipate the different expectations, attitudes, and behaviours of the future UK population.
3.1 Introduction
As discussed in the previous section, the net zero society scenarios were generated to create four plausible futures spanning two axes:
- Social cohesion and institutional trust: This axis is concerned with long-term uncertainty over the strength of connections between different social groups along with the levels of trust in institutions (including businesses, local/national governments and intergovernmental organisations).
- Economic growth and technological progress: This axis is concerned with long-term uncertainty over the level and stability of economic growth along with the pace of development and adoption of new technologies.
A summary of the four scenarios that were developed are shown in relation to these axes below in Figure 12. It is important to note that these positions across the two axes were a starting point for developing the scenarios; each possible future encompasses a wider range of critical uncertainties (highly important but highly uncertain potential future changes) so the representation below is a simplified two-dimensional plot of a more complex multi-dimensional space.
3.2 Scenario summaries
Below are narrative summaries of the scenarios followed by visual representations of levels of growth for key aspects of society for each scenario.
Figure 12. Summary of the four net zero society future scenarios

2x2 matrix, each cell represents a scenario. Top cell left is scenario A: The atomised society; bottom left C: The Self Preservation Society; bottom right D: The slow lane society; top right B: The metropolitan society.
The text from Figure 12 is laid out below:
-
The atomised society: Technological change has fuelled growth. Individual freedoms are prioritised, with people able to enjoy new experiences enabled by technology. However, more wealth has been accumulated by the richest and society is divided along income lines; the rich live in protected bubbles and the poor are more exposed to the effects of climate change.
-
The self-preservation society: economic growth and technological progress have failed to live up to expectations for rich and poor alike. People do that they need to get by, often using traditional methods and out-dated technology. Society is fragmented into many different groups. Some are more comfortable with the slow pace of change, particularly older and rural communities.
-
The slow lane society: Economic and technological growth are slow meaning there is less money to invest in beneficial infrastructure and limited new technology available. However, with high levels of social cohesion and institutional trust, people are willing to contribute more to improve their communities. There is also a growing culture of repair, recycling and the sharing economy.
-
The metropolitan society: Economic growth and technological change have delivered improvements in living standards for most, through inequalities remain. Geography shapes identity, with strong communities in the city regions that have driven growth. There is growing resentment in rural populations as they see funding directed towards urban areas but limited investment in the countryside.

The content of this figure is provided in the report in an accessible format.

The content of this figure is provided in the report in an accessible format.

The content of this figure is provided in the report in an accessible format.

The content of this figure is provided in the report in an accessible format.
| Atomised society | Metropolitan society | Self-preservation society | Slow lane society | |
|---|---|---|---|---|
| Income growth for the richest | High | Medium-high | Medium-low | Low |
| Income growth for the poorest | Medium-low | Medium-low | Low | Medium-low |
| Availability of advanced tech | High | High | Medium-low | Low |
| Availability of net zero tech | Medium-high | Medium | Medium-low | Low |
| Trust within the UK | Low | High | Low | High |
| Trust globally | Medium-low | High | Low | Medium-high |
| Population in urban areas | Low | High | Medium-low | Medium-high |
| Population in rural areas | Medium-high | Low | Low | High |
| Population in suburbs | Medium-high | Low | Medium-high | Medium-low |
| Localisation of economic activity | Low | Medium-high | Medium-low | High |
| Reshoring of manufacturing | High | Low | Medium-low | Low |
| Levels of automation | High | Medium-high | Low | Medium-low |
3.3 Full scenarios
This section includes the four full scenarios combining both the qualitative narratives and the quantitative parameters derived from these narratives.
Scenario narratives
The narratives for each scenario include an overview, a description of what UK society could be like in 2050 in that scenario, and an exploration of how different sectors (the built environment, travel and transport, work and industry, and food and land use) could have developed by 2050. Each scenario also includes some visualisations of the parameters derived from the narratives for each of these four sectors.
As mentioned previously, the scenarios were developed to meet three core principles:
- Plausible: Scenario end states should feel like they could happen by 2050 and the future changes depicted in an individual scenario should feel coherent. This requires narratives to consider what might happen between now and 2050.
- Stretching: Scenarios should feel stretching and, in some cases, uncomfortable, diverging from what policy makers consider to be the ‘business as usual’ trajectory.
- Answer important questions: The scenarios should be designed to help answer key questions for government, such as:
- What are the possible range of outcomes that could come from identified critical uncertainties and how can these be taken into account during planning?
- What if society starts to evolve in a way that increases (or decreases) energy demand significantly beyond current assumptions? What would the implications be for meeting net zero if that trend continues?
- What do decision makers who are considering supporting a particular societal change need to know about the wider benefits and costs?
- What will be needed in the wider system to ensure that possible negative impacts of any transitions are abated and positive impacts augmented?
To meet these principles and to construct a realistic view of possible future societies, the narratives are deliberately broad and encompass areas outside of the typical decarbonisation policy areas. As the societal change evidence review (Annex 2) indicates, taking a wide view of a complex system can help to identify elements that could have a significant, and sometimes unexpected, impact. Some societal changes outside of those typically receiving greatest focus (usually energy generation, manufacturing and transport) could have major implications on emissions. For example, a rise in cryptocurrency could result in higher energy demands, if current designs for them remain.
As these scenarios are designed to stretch and test policy thinking, they are deliberately extreme and divergent. The scenarios are neither predictions nor aspirations. It is likely that future UK society will contain a blend of elements from across the scenarios. There are also many permutations that have not been presented that are equally plausible and likely. All the scenarios described are illustrative of possible future societal changes. Although there are sometimes some suggestions for what could cause the changes being described, these are not considered definite nor the only way such a change could occur.
Domestic and international events can influence society and the likelihood of reaching net zero targets. The scenarios below do not rely on the occurrence (or lack of) specific critical events to reach their 2050 end state. However, there are such events that could expedite the path towards a future similar to those presented in the scenarios and other events that could make some of the scenarios implausible. Additionally, each scenario varies in how resilient it is to shocks (such as extreme weather events or supply chain disruption).
Scenario notes
As mentioned previously, the scenarios developed for this report focus on two main axes (social cohesion and institutional trust and economic growth and technological progress) but combine other identified critical uncertainties to create a richer and more cohesive future world. For the full set of drivers of changes and axes of uncertainty identified for this report, see Annex 3.
We created each scenario by assuming different theoretically possible combinations of axes. These scenarios do not represent the only possible combinations of axes, nor are they always the most plausible. Instead, they are designed to be very different from each other, so are useful for testing our assumptions. More optimistic scenarios, where all societal changes are positive, are possible. However, we have deliberately included some aspects in each scenario that most people will find negative to make them useful to stress-test policy against.
At the start of each scenario narrative, we provide some detail on the uncertainties included and the how we chose the combinations included. Importantly, these scenarios are not predictions and make no claims about what could cause the societal changes outlined. Instead, they are an exercise in asking: what if X and Y were true in 2050? There is no ‘right answer’ within the scenarios, instead they illustrate the impacts of different possible changes.
Embedded within the scenario narratives are a series of infographics showing how key parameters change in each scenario relative to the other scenarios (low, medium-low, medium, medium-high, or high). In some cases, where quantification is straightforward and values are easy to express (as an average, percentage share, or percentage growth by 2050), we have provided the numbers used in our analysis. This is provided for the convenience of readers keen to understand in more detail what assumptions have been made while they are reading these narratives, but a more comprehensive set of information on these parameter values is provided in Section 3.5 and in Annex 4.
The atomised society
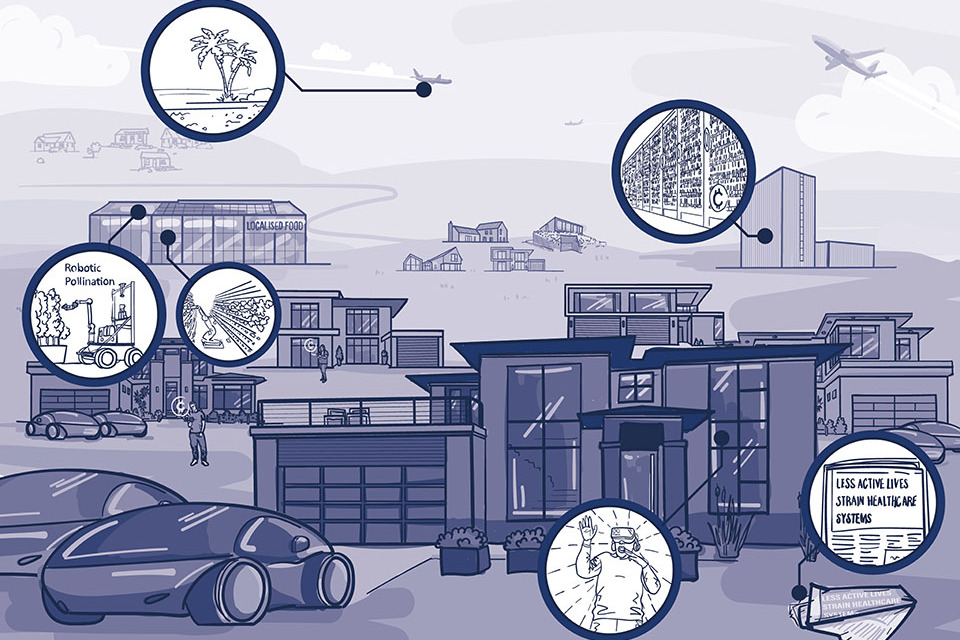
Artistic impression of the atomised society. Highlighted features are international holidays, robotic pollination, cryptocurrency, high levels of data use, VR and a newspaper article titled ‘Less active lives strain healthcare systems.’
How we developed this scenario
We created this scenario by assuming higher economic growth happened at the same time as lower institutional trust and more individualistic attitudes. The experts who participated in our scenario development workshops suggested that higher economic growth in this scenario could have been driven by rapid technological change and higher consumption. More dispersed living in larger suburban homes could be consistent with higher economic growth and households being more separated from their local communities, particularly when combined with use of advanced digital communications platforms that allow people to socialise from their home. Our experts also felt that, while everyone was likely to see some income growth, the lower levels of trust in this scenario were more likely to be associated with higher levels of inequality, with diverging lifestyles between low- and high-income households. In terms of what this combination of axes means for energy use, people generally enjoy more affordable goods, services and experiences (such as foreign travel) often enabled by technology. Individualistic attitudes mean people are less concerned with any downsides of consumption.
Life in the atomised society
The UK has experienced a period of economic growth, fuelled by technological innovation. For people on higher incomes, life in 2050 is good, but those with lower incomes have been disproportionately affected by the impacts of climate change. Those who are struggling financially express deep resentment towards those with greater wealth. The population has become more widely dispersed across urban, suburban and rural areas due to greater digital connectivity. People are increasingly living in virtual ‘bubbles’, which has reduced the variety of individuals they encounter; this has created mutual suspicion between groups.
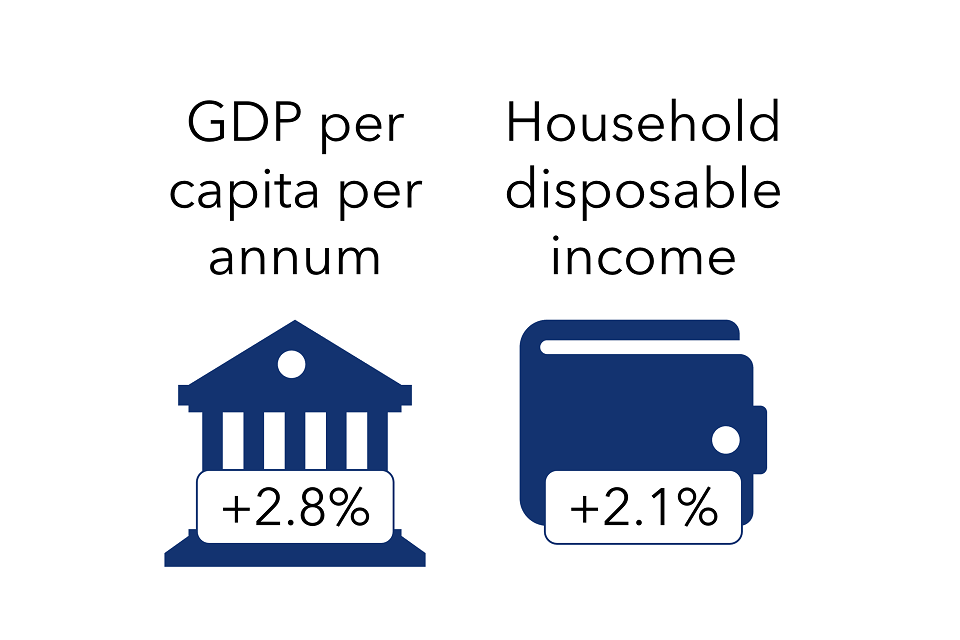
The content of this figure is provided in the report in an accessible format.
Living conditions have generally improved, but improvements have been maintained at the expense of the environment. Lowering emissions is not a priority and, even if it were, there is no consensus on how to do so. This has resulted in high levels of consumption, which have placed a strain on resources. Technological progress and generally benign economic conditions have led to improved living standards for the better off (who account for the bulk of energy use) and the middle classes. Those on lower incomes have not experienced the same benefits and income inequality has increased in the decades leading up to 2050. Other inequalities, including regional inequality and digital inequality (unequal access to and/or familiarity with technology for some groups), also remain. However, new technology has driven improvements in public sector services (including the benefits systems, healthcare and social care). Digital literacy has also improved, with most individuals managing to keep up with the rapid pace of change.
Society is spending more time online and this has led to fragmentation and less active lifestyles, with those who are unable to afford to travel using the immersive metaverse as a form of virtual escapism. This has had some knock-on impacts on the overall health of the population, with more sedentary lifestyles and time spent online in virtual environments impacting on both physical (primarily cardiovascular and metabolic) and mental health, placing strain on healthcare systems, and impacting the productivity of the workforce. Again, the poorest in society are disproportionately affected, with those with greater wealth being able to access treatments that improve longevity.
Automation of work has also been widespread, but the benefits of automation have not been distributed evenly, largely accruing to the owners of technology rather than the whole workforce. Upskilling and retraining initiatives have mostly failed to keep pace with the march of automation, leading to significant levels of precarity in work for the poorest.
International considerations: A breakdown in international cooperation has led to faltering global climate action with states prioritising the protection of their own societies and critical infrastructure over global commons. This has in turn led to increased levels of international conflict, particularly around competition for scarce resources and tensions of migration triggered by accelerated climate breakdown in the global south. Within this context of a lack of trust and international cooperation, many within society are blaming ‘the system’ (both governments and multinational companies) for the lack of equitable societal change.
Sectors
The built environment: The population has become relatively dispersed, with the rich increasingly living in larger homes in self-contained ‘bubbles’ in suburban and rural areas. There has also been an increase in people living alone. There has been some investment in new build homes, which has led to reduction in housing pressure and improved affordability. Many people are working from home and spending more time online, leading to increased demand for connectivity and data processing infrastructure. People have generally been spending less time in their local communities, resulting in a slow decline in local amenities.
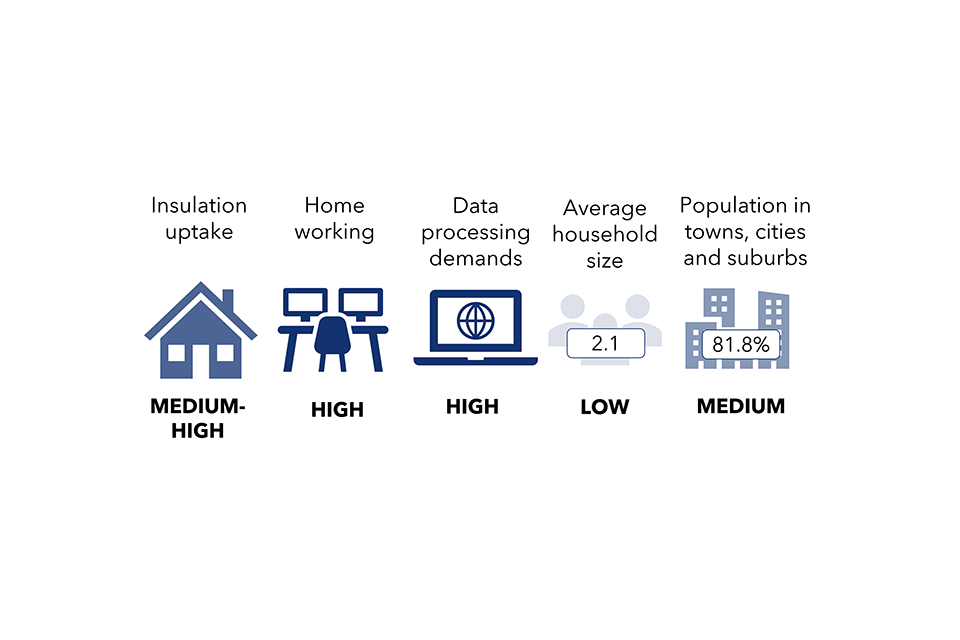
The content of this figure is provided in the report in an accessible format.
| Insulation uptake | Home working | Data processing demands | Average household size | Population in towns, cities and suburbs |
|---|---|---|---|---|
| Medium-high | High | High | Low (2.1) | Medium (81.8%) |
Travel and transport: Uptake of CAVs has been strong, particularly among the rich. The private ownership model continues to dominate, with only limited traction achieved for shared travel. Public transport has improved somewhat over the years, particularly between regions by high-speed rail. However, high fares have excluded the poorest from the network and competition from CAVs means usage is not as high as it could be. Flying (for leisure, in particular) has grown, offsetting some of the benefits of lower carbon technologies in aviation. The rich are travelling further afield, but poorer people are exploring new destinations in neighbouring countries. Some of the traditional ‘holiday in the sun’ destinations of the 2020s have become increasingly unappealing due to extreme heat.
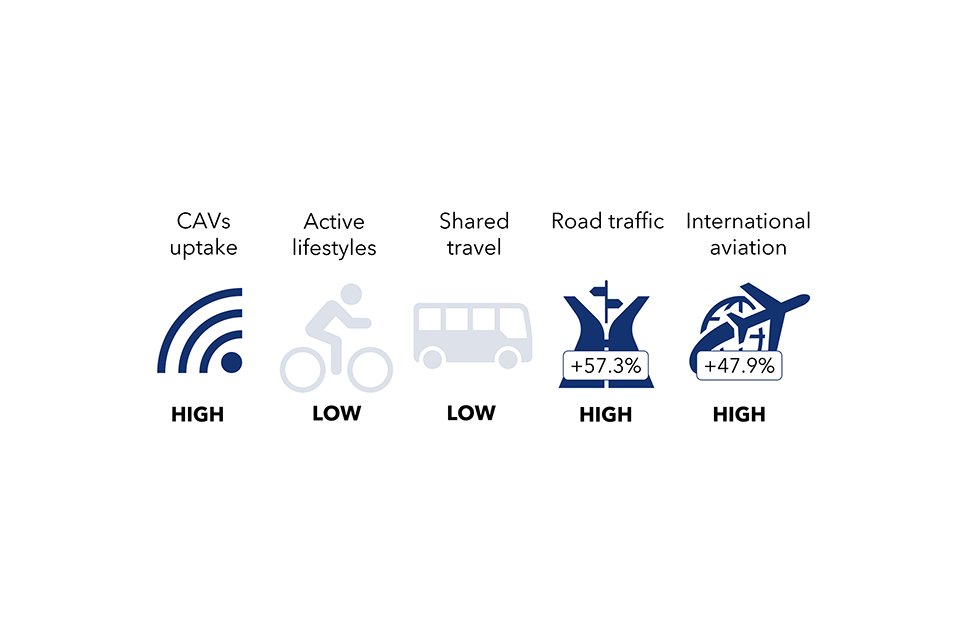
The content of this figure is provided in the report in an accessible format.
| CAVs uptake | Active lifestyles | Shared travel | Road traffic | International aviation |
|---|---|---|---|---|
| High | Low | Low | High (+57.3%) | High (+47.9%) |
Work and industry: Although there is better management of products across their entire lifecycle, consumption has remained high and technological obsolescence remains. In part, this is due to furious international competition to create the ‘next big consumer tech’. It is also caused by people becoming less concerned about throwaway culture thanks to better recycling solutions. International conflicts and progress in automation have led to some reshoring of manufacturing. There is a thriving economy for goods and services in the real and virtual worlds, with cryptocurrencies playing a growing role among those with less confidence in the global financial system and central banks.
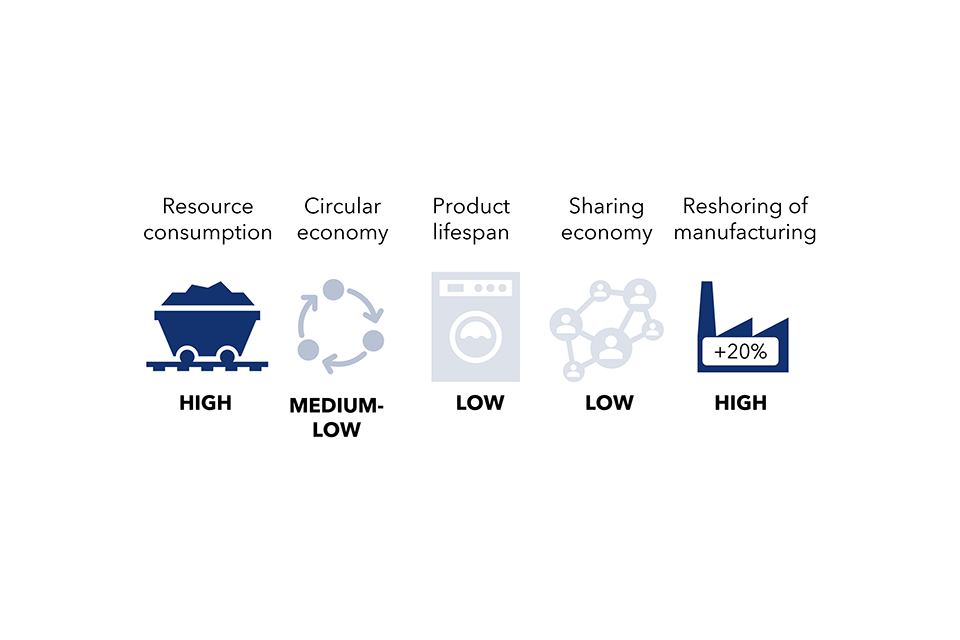
The content of this figure is provided in the report in an accessible format.
| Resource consumption | Circular economy | Product lifespan | Sharing economy | Re-shoring of manufacturing |
|---|---|---|---|---|
| High | Medium-low | Low | Low | High (+20%) |
Food and land use: Tech advances have ushered in greater dietary choices, including for meat-free protein. Cultured meat is widely available and, after initial hesitance, has been widely accepted by consumers as an acceptable alternative to farm-reared meat. In some wealthier urban areas, vertical farming has been adopted to provide locally grown food. Environmental degradation has significantly impacted biodiversity and there is less productive land available. However, tech solutions, such as genome-edited crops or robotic pollination, have preserved some self-sufficiency in food production.
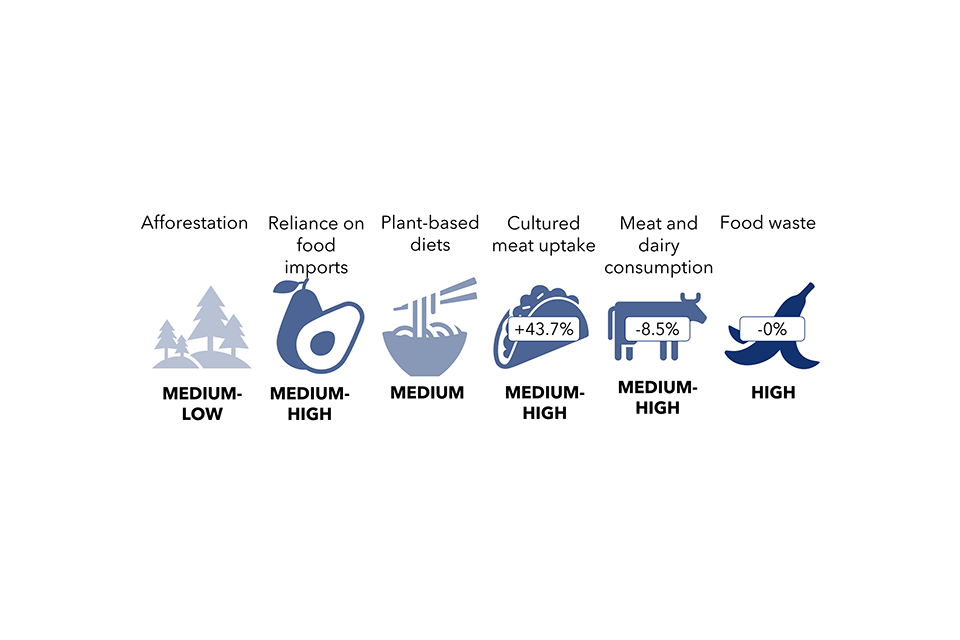
The content of this figure is provided in the report in an accessible format.
| Afforestation | Reliance on food imports | Plant-based diets | Cultured meat uptake | Meat and dairy consumption | Food waste |
|---|---|---|---|---|---|
| Medium-low | Medium-high | Medium | Medium-high (+43.7%) | Medium-high (-8.5%) |
High (-0%) |
The metropolitan society
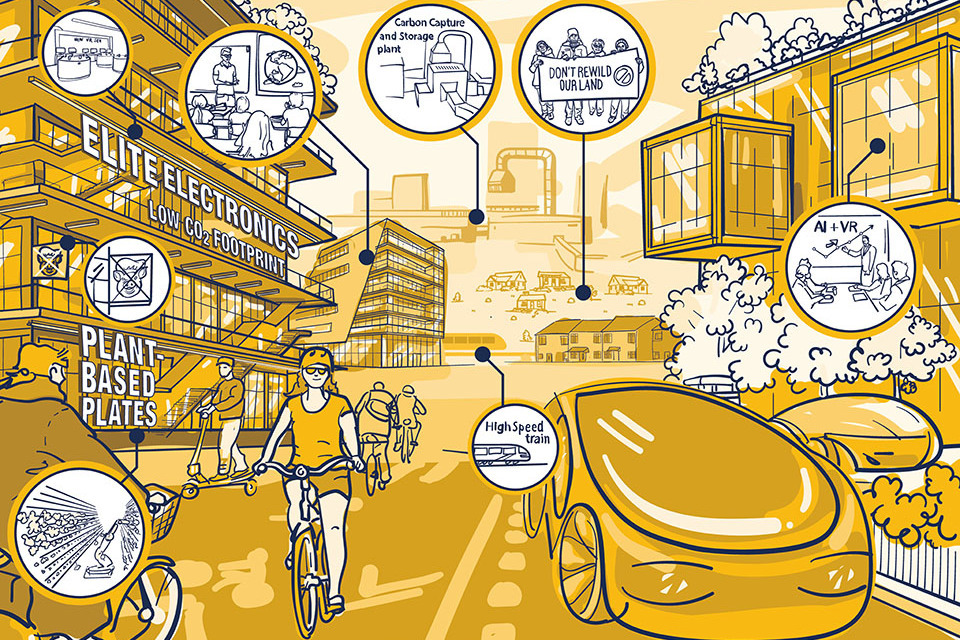
Artistic impression of the metropolitan society. Highlighted features are increased AI and VR, high speed trains, CCS, a shopfront reading ‘Elite electronics, low CO2 footprint’ selling VR, more plant-based meals, robotic pollination, and protestors.
How we developed this scenario
We created this scenario by assuming higher economic growth, increased availability of technology, higher institutional trust, and greater social cohesion within geographical areas all coincide in 2050. The experts who participated in our scenario development suggested that this could be a scenario in which dense, liveable cities thrive, providing both economic growth (through agglomeration) and a sense of local community. More infrastructure would be needed to support this urban densification, but this investment would be supported by higher levels of economic growth. Our experts also suggested that a plausible dynamic in this world could be those living in rural areas feeling ‘left behind’, resulting in a lack of cohesion between areas but high levels of trust within local communities. In terms of what this combination of axes means for energy use, there is a tension between the sustainable lifestyles enabled by cities (such as low car use) and the higher levels of consumption facilitated by higher incomes. This suggested that there would be a general preference for changes to activity that are facilitated by infrastructure or ‘behind the scenes’ processes (such as material-efficient supply chains), rather than people choosing to consume less.
Life in the metropolitan society
Economic growth and technological change have delivered improvements in living standards for most, although inequalities remain. There is a strong sense of community within the growing, diverse urban population and also within rural areas. However, there are divisions between these two communities, as rural populations resent the increased funding for urban areas (where new infrastructure is thought to have the biggest economic impact), which is not matched by similar investment in the countryside. Through technological advancements, focussed on efficiency, GDP growth has been increasingly ‘decoupled’ from emissions, energy demand and resource extraction. An agenda of infrastructure renewal has been largely realised, with significant upskilling programmes to support the transition towards ‘green economy’ sectors and to address the impacts of widespread adoption of automation technologies across many industries. However, the focus on construction, higher levels of disposable income and availability of exciting new consumer technologies mean energy consumption and material use is relatively high. Centralised government makes use of well-regulated and thoroughly tested artificial intelligence to support decision making. Widespread belief that this makes decisions fairer and more impactful, alongside other efforts to improve equality, has led to greater political engagement. However, some older people find the rapid pace of change exclusionary.
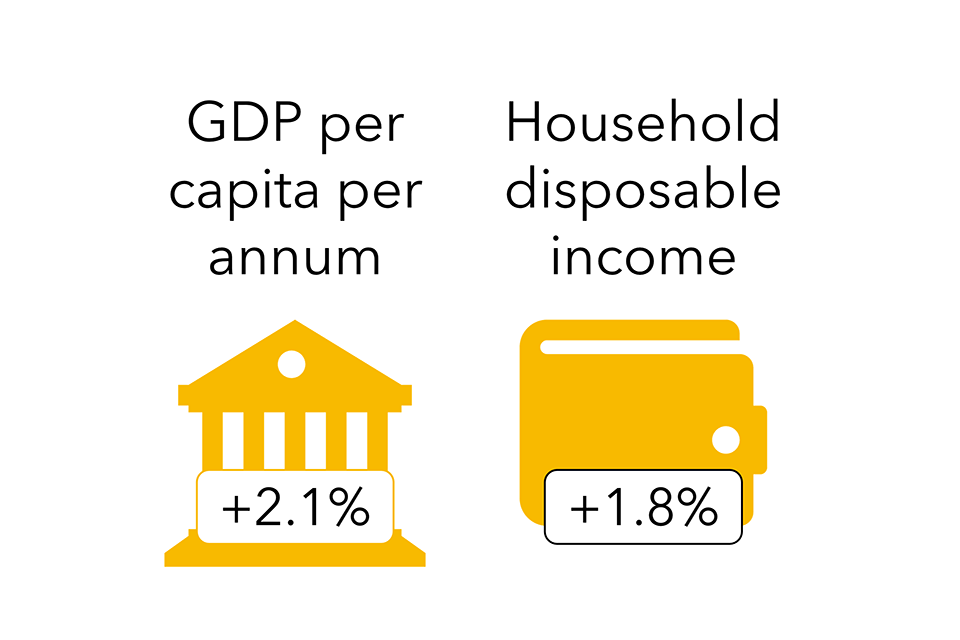
The metropolitan society GDP per capita and household disposable income. Left: GDP per capita is shown as +2.1%. Right: household disposable income is shown as +1.8%.
There is a better balance between resource consumption and rates of replenishment. Much resource reduction is data-driven and automated, making it easy for individuals to choose products that lower their material and carbon footprints. But this does not remove the temptation to buy more products (especially those with well-publicised sustainable production and supply chains). This leads to a rebound effect, with resource consumption initially dropping before rising again.
International societal considerations: This world is characterised by generally strong levels of international trust and collaboration around meeting climate targets and accommodating those displaced by climate impacts. States have worked in cooperation to drive and scale a range of technologies to mitigate the most severe impacts of climate change and minimise conflict around scarce resources. There is a strong and globalised economy served by complex global supply webs, with little reshoring of manufacturing to the UK, but supply chains remain somewhat fragile, fragmented, and vulnerable to external shocks.
Sectors
The built environment: Aside from ongoing devolution to large city regions, decision making remains largely centralised. Funding is channelled towards urban areas to drive economic growth with significant investment in the ‘greening of cities’, designed to allow easy access to essential services close to home. This attracts many to compact urban living, often in smaller households, but those in rural areas feel that they have been neglected and are often living in older houses with less access to modernised services and amenities. Most urban and rural homes are served by good and effective digital infrastructure, with some people doing hybrid work from their homes and local hubs.
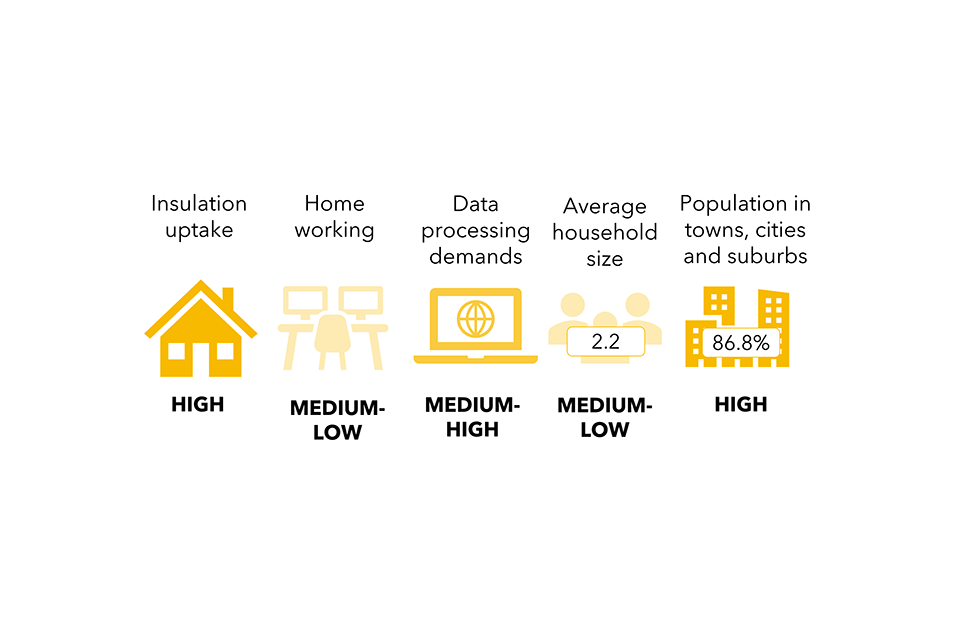
The content of this figure is provided in the report in an accessible format.
| Insulation uptake | Homeworking | Data processing demands | Average household size | Population in towns, cities and suburbs |
|---|---|---|---|---|
| High | Medium-low | Medium-high | Medium-low (2.2) | High (+86.8%) |
Travel and transport: Investment in convenient and low-cost micro-mobility and public transport encourages urban dwellers to forgo short car trips. CAVs are widely available in urban and rural areas and, although some private ownership remains, they tend to be used as on-demand shared services for domestic travel. Flying is still used, mostly internationally. However, it is less financially competitive and less socially acceptable for domestic travel. Zero carbon flying technology has recently become available but is still relatively high cost. There are better integrated rail services, making travel cheaper and easier, although mainly within or between cities. Remote working and telepresence technology are available and used widely, but many people still value face-to-face interactions in both work and leisure.
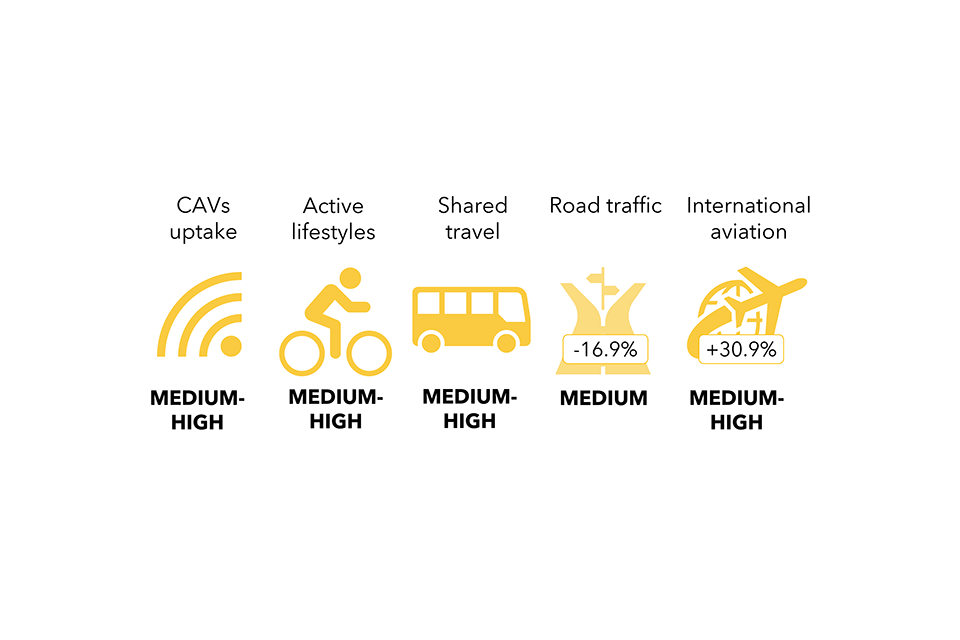
The content of this figure is provided in the report in an accessible format.
| CAVs uptake | Active lifestyles | Shared travel | Road traffic | International aviation |
|---|---|---|---|---|
| Medium-high | Medium-high | Medium-high | Medium (-16.9%) | Medium-high (+30.9%) |
Work and industry: Consumption continues to drive economic growth, via a mixture of physical products and intangible services. Although repair and mend culture has not taken off, circular economy measures are widely in place behind the scenes. Products and services are data rich, and it is possible to track provenance and product lifecycles using innovative technology combinations such as blockchains, AI and the internet of things, reducing the environmental impacts of continued consumption. AI technology is now embedded across the economy to drive efficiency in resource usage and all new products are required to account for full lifecycle resource and emissions implications. People do not often make consciously sustainable choices, but algorithms help make ‘greener decisions’ easier.
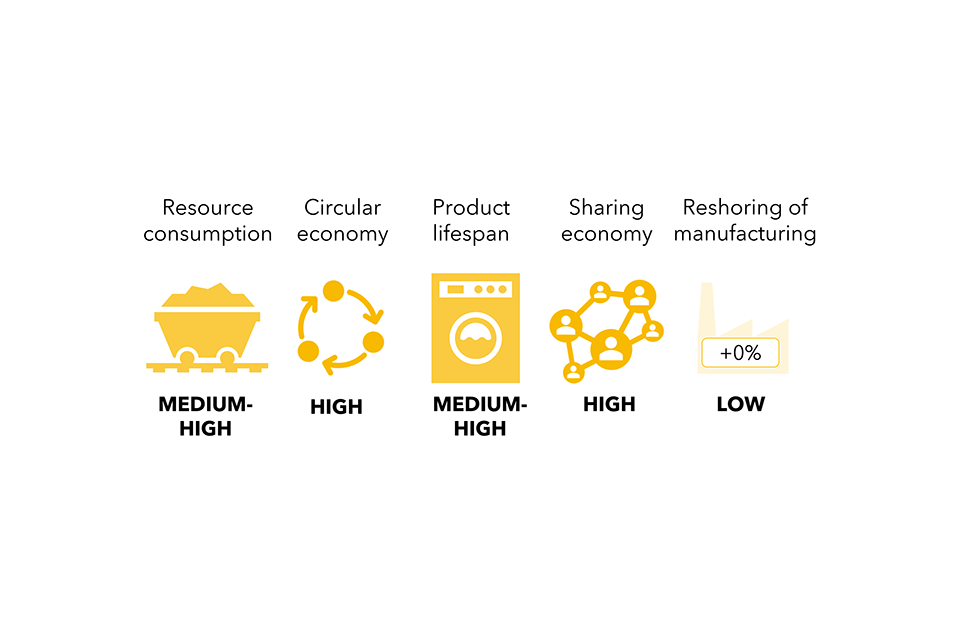
The content of this figure is provided in the report in an accessible format.
| Resource consumption | Circular economy | Product lifespan | Sharing economy | Reshoring of manufacturing |
|---|---|---|---|---|
| Medium-high | High | Medium-high | High | Low (+0%) |
Food and land use: A greater focus on protecting the natural environment has provided co-benefits, including for public health and the economy (for example, through increases in ecotourism and greater availability of natural resources, such as water). Progress with rewilding has been mixed, with tensions between supportive urban elites and rural communities who feel threatened by loss of what they see as ‘their’ assets. Significant advances in agricultural tech, such as genome editing and agricultural robotics, have led to reductions in land and pesticide use. Organic farming has also seen some growth with the combination of low- and high-tech approaches improving food self-sufficiency. Diets have broadly adjusted for improved sustainability with increased uptake of more plant-based diets and, after initial public hesitancy, cultured meat. There are concerns over the medium to long term implications of a shift to more synthetic diets, particularly around loss of micronutrients. Organically farmed meat is a rare, somewhat unaffordable, luxury item. Many livestock farmers have found their businesses are no longer profitable and have made use of reskilling programmes to move into other careers.
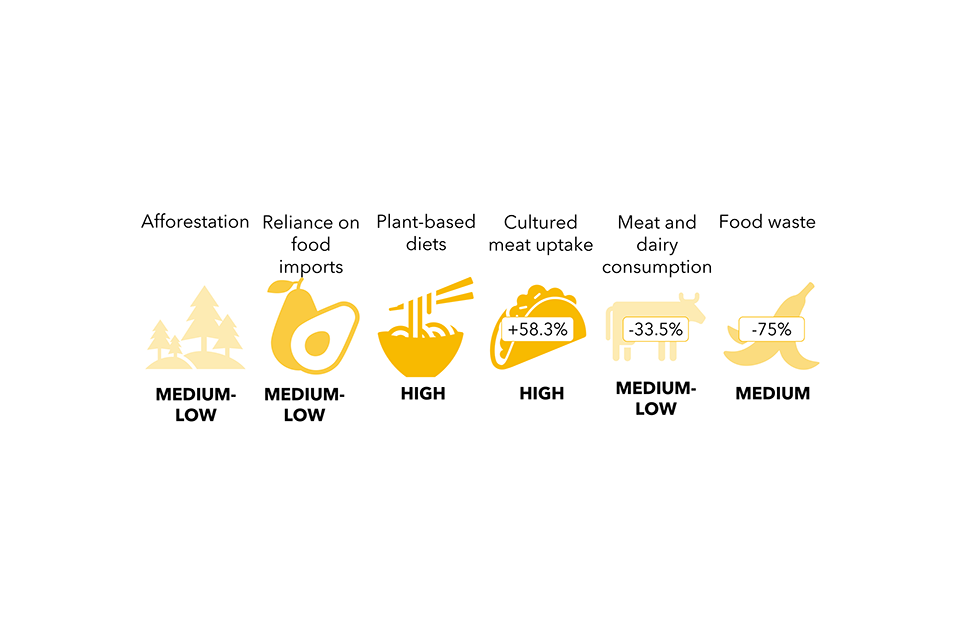
The content of this figure is provided in the report in an accessible format.
| Afforestation | Reliance on food imports | Plant-based diets | Cultured meat uptake | Meat and dairy consumption | Food waste |
|---|---|---|---|---|---|
| Medium-low | Medium-low | High | High (+58.3%) | Medium-low (-33.5%) | Medium (-75%) |
The self-preservation society
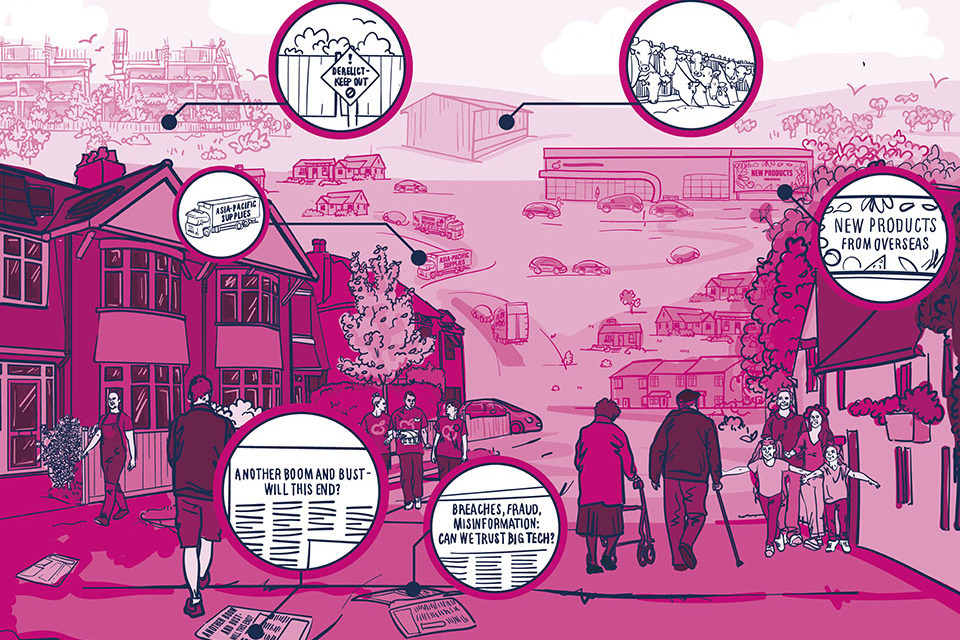
An artist’s impression of the Self Preservation Society. Highlighted features are derelict buildings, international trade, factory farming, and two newspaper articles, one of which is titled ‘breaches, fraud, misinformation: can we trust big tech?’
How we developed this scenario
We created this scenario by assuming lower economic growth occurs alongside lower institutional trust and social cohesion. The experts who participated in our scenario development felt it was possible that the UK could fail to achieve higher economic and technological growth than experienced recently for various reasons. In the future, our experts saw this contributing to reductions in social cohesion and lower trust in institutions. Although social cohesion overall is low in this society, our experts suggested that this could lead to stronger bonds within smaller groups and families, which could have certain benefits, such as for caregiving. They also felt that this scenario could have some positives for those within society who may feel overwhelmed by rapid change, and that a scenario in which not much has changed since today could be attractive to some, particularly some older people. In terms of what this combination of axes means for energy use, consumption levels would be likely to stay relatively high in a scenario such as this, without broader societal changes such as community infrastructure or technological efficiencies that might support consumption reductions.
Life in the self-preservation society
Since the early 2020s, there has been low overall growth and limited technological advancement. Social divisions have emerged following a period of political, societal and economic turbulence. Centralised governance dominates and there are regions that feel disenfranchised. Voter turnout is low and politics has become highly polarised. Some have been attracted to extreme political positions. People gain a sense of community and identity from these fragmented groups that they struggle to find in wider society.
GDP growth continues to be prioritised as a key measure, but there is a failure to achieve it. There have been cycles of boom and bust, recessions and stagflation to contend with over three decades. Income distribution is similar to that of 2020s with relatively high levels of inequality. There is limited overall growth, so the rich have not become vastly richer as everyone has seen their incomes squeezed.
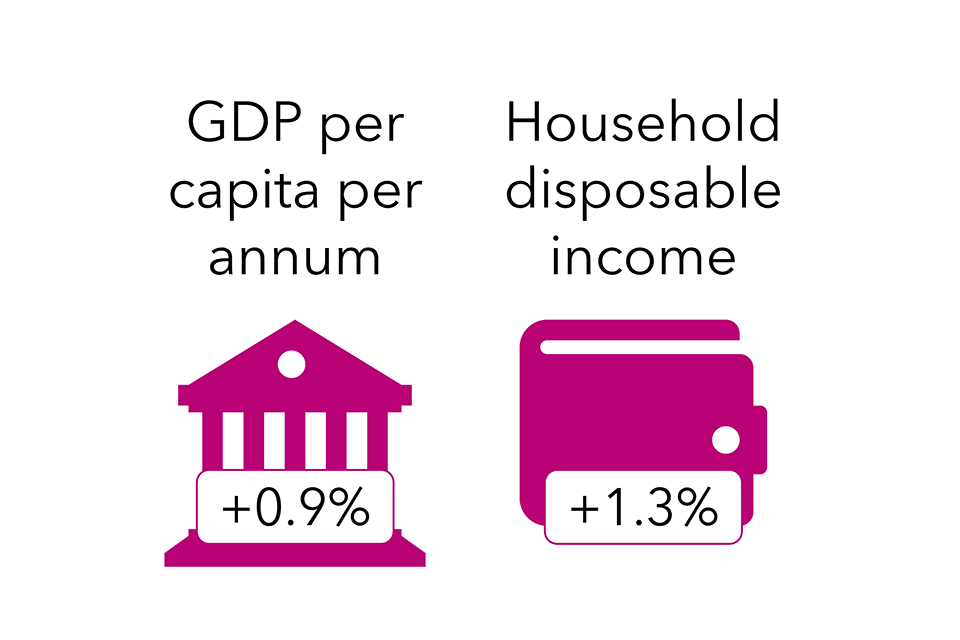
The Self Preservation GDP per capita and household disposable income. Left: GDP per capita is shown as +0.9%. Right: household disposable income is shown as +1.3%.
There has been slow technological progress. For some in society, there has been growing unease around the products and services of ‘big tech’ companies. This was fuelled by growing incidents of data breaches, fraud, misinformation, and other problematic online behaviours that characterised much of the 2020s and triggered increasingly widespread backlashes during the 2030s. Artificial intelligence is tightly regulated and has its uses carefully controlled following a series of high-profile cases of misuse, discrimination, and accidents. Some have abandoned big tech in favour of smaller niche (and often less regulated) communication and collaboration platforms, which has in some cases increased fragmentation and belief in conspiracy theories.
While some think more extremist political candidates could bring change, others are opting to stay disconnected and live their lives offline, especially younger generations, who are disillusioned by perceived stagnation. Although the decades to 2050 have been challenging for society as a whole, the relative lack of radical change has felt more comfortable for some in older generations.
International societal considerations: Ongoing mistrust and geopolitical and economic tensions between nations has acted as a brake on achieving the global consensus on the protection of environmental commons. Many within society are blaming multinational companies for the lack of equitable societal change. The UK remains reliant on imported goods, but geopolitical tensions have resulted in a global protectionist economy and supply chains are vulnerable to external shocks. Although plans are in place to reshore manufacturing, this has so far been limited.
Sectors
The built environment: High crime and lack of investment in infrastructure have made city centres less attractive, but the population in the suburbs around cities grows so the overall urban population remains high. The challenging economic backdrop has impacted the pace of building new homes, with demand generally outstripping supply in many areas. Overall, there are fewer people living alone than in previous decades. While older generations prefer rural areas, younger ones are increasingly moving to the suburbs. Although incipient, younger generations are increasingly opting for off-grid and self-sufficiency living, and there has been some increase in cohabitation and multigenerational living to make ends meet.
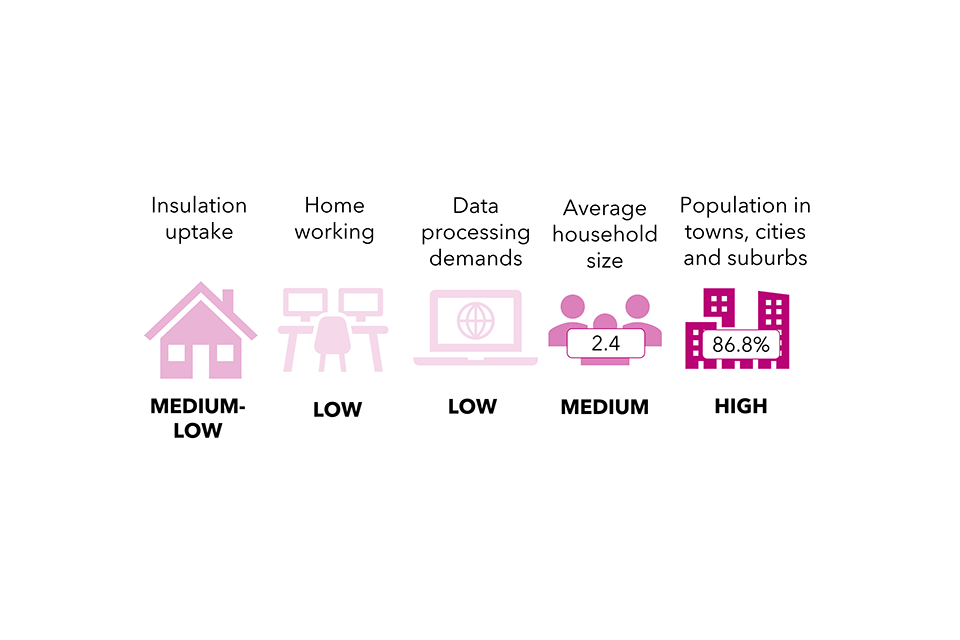
The content of this figure is provided in the report in an accessible format.
| Insulation uptake | Homeworking | Data processing demands | Average household size | Population in towns, cities and suburbs |
|---|---|---|---|---|
| Medium-Low | Low | Low | Medium | High |
Travel and transport: Transport options are fragmented and disconnected outside of major cities. Within cities, urban transport is placed under strain through lack of investment. Some towns and cities have seen moderate growth in low-tech transport infrastructure, especially for walking and cycling as many more citizens have opted for these as their primary means of transport. This has mainly been driven by people trying to lower their cost of living. By 2050, CAVs have just become available to the more affluent and private ownership remains the dominant model. Flying has not been decarbonised and, although it remains attractive for those that can afford it, some people are becoming increasingly priced out.
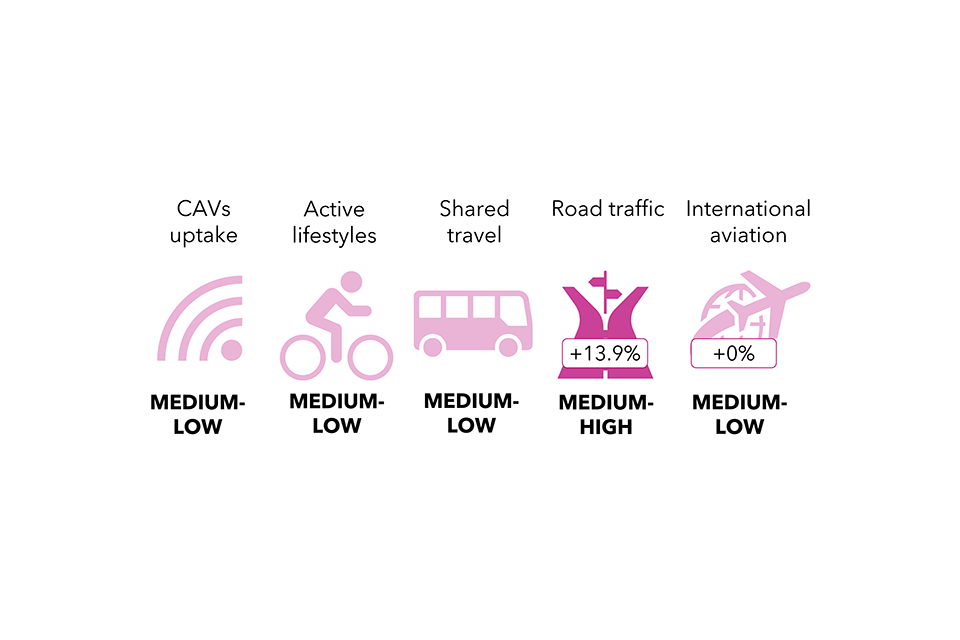
The content of this figure is provided in the report in an accessible format.
| CAVs uptake | Active lifestyles | Shared travel | Road traffic | International aviation |
|---|---|---|---|---|
| Medium-low | Medium-low | Medium-low | Medium-high (+13.9%) | Medium-low (+0%) |
Work and industry: Some types of work have been automated, but a significant proportion of the population is still working in face-to-face service and manual roles. Some parts of the economy have embraced mutual exchange of goods and services as an alternative to traditional payments. Remote working is still an option for those employed in higher paid ‘knowledge work’ and this is done both from home and from local shared workspaces. Repairability remains low. Many goods are still designed with inbuilt obsolescence and ‘greenwashing’ persists. Many people opt to buy new products because repair remains more costly than replacement, but a ‘make do and mend’ attitude is prevalent among those who have chosen to adopt more off-grid lifestyles.
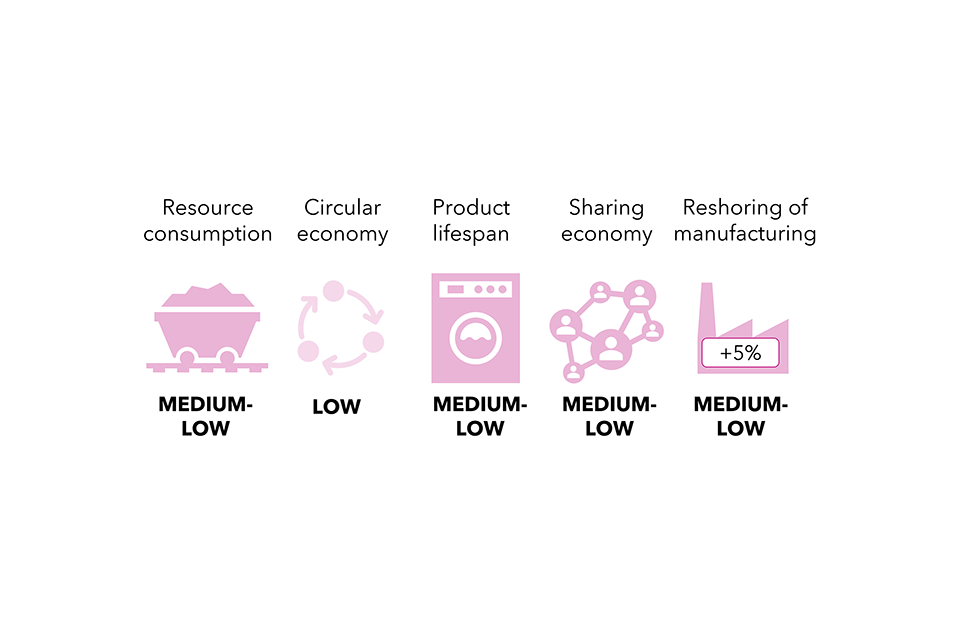
The content of this figure is provided in the report in an accessible format.
| Resource consumption | Circular economy | Product lifespan | Sharing economy | Reshoring of manufacturing |
|---|---|---|---|---|
| Medium-low | Low | Medium-low | Medium-low | Medium-low (+5%) |
Food and land use: Climate events and lack of progress on new technologies have put greater pressure on agriculture. Some farms have become unviable (exacerbated by extreme weather events like drought and flooding), increasing the UK’s reliance on imports. But abandoned British farms have also created opportunities for positive land use change such as rewilding and afforestation. As a result, more people can enjoy recreational use of land and rural communities in some areas are better able to support themselves through ecotourism and increased availability of some natural resources (such as lumber or foraged foods). Meat consumption has remained relatively stable since the 2020s and cultured alternatives have largely failed to take off. Demand is primarily being filled by intensively farmed meat, but organic options are available for those that can afford them.
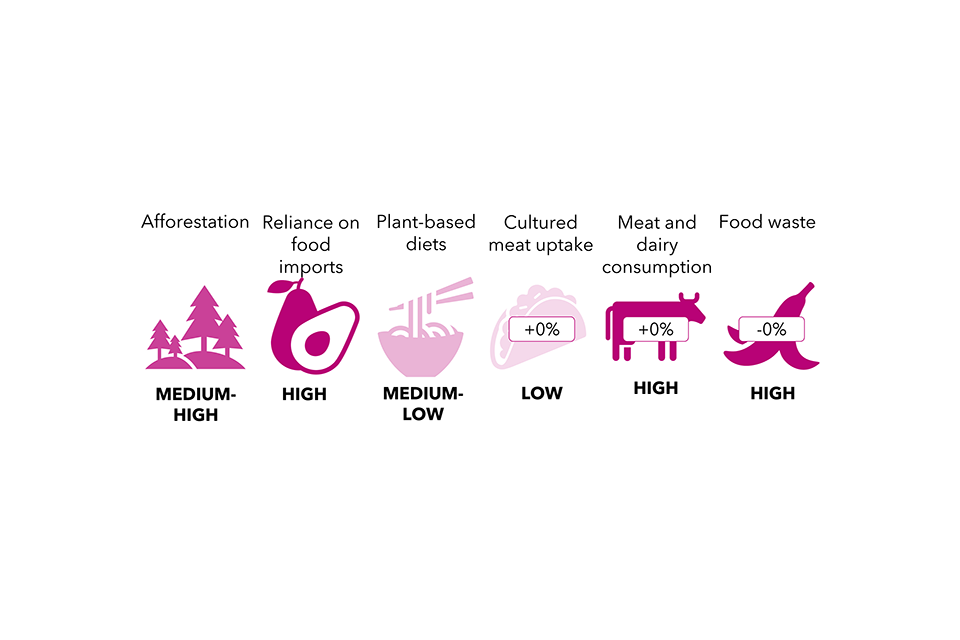
The content of this figure is provided in the report in an accessible format.
| Afforestation | Reliance on food imports | Plant-based diets | Cultured meat uptake | Meat and dairy consumption | Food waste |
|---|---|---|---|---|---|
| Medium-high | High | Medium-low | Low (+0%) | High (+0%) | High (-0%) |
The slow lane society
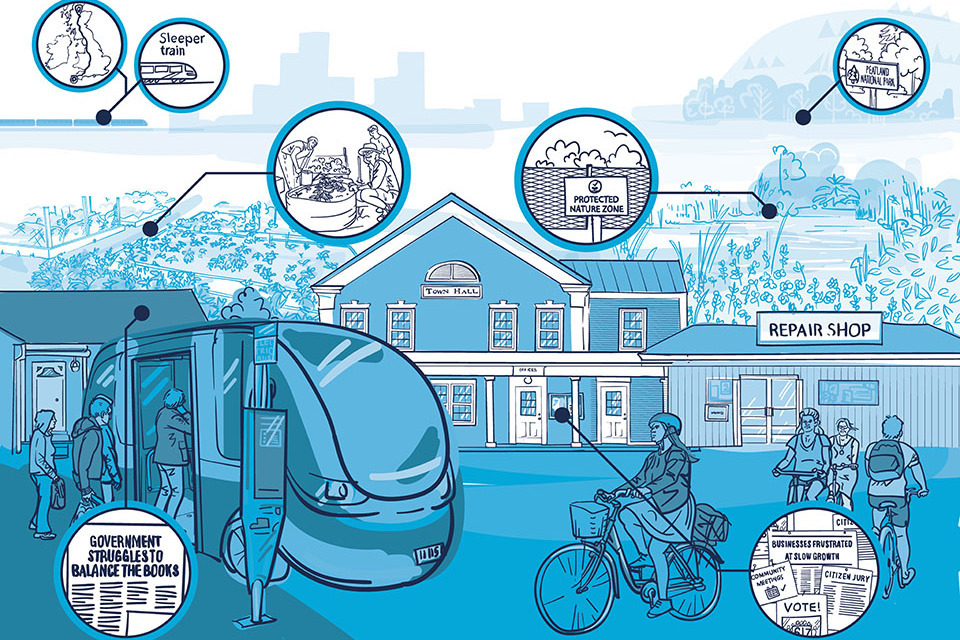
Artist’s impression of the slow lane society. Highlighted features; self-sufficient living, long-haul train travel, protected nature zones and rewilding, localised governance and a newspaper article titled ‘Government struggles to balance the books.’
How we developed this scenario
We created this scenario by assuming lower economic growth coincides with higher institutional trust and lower individualistic attitudes. Our experts felt lower growth could have been caused, in part, by antipathy towards consumption, which is perceived by some as linked to climate change. To create this scenario, we imagined what might need to be true for low growth and higher cohesion to happen at the same time. Often this meant assuming changes which improved citizens wellbeing but didn’t cost a lot. For example, this scenario assumes a health system that uses more low-cost, preventative public health measures because there are limited new treatments available (both because of a lack of technological advancement and reduced public sector spending power). Our experts also suggested a ‘make do and mend’ culture could emerge as a reaction to economic constraints, especially given the high levels of local community cohesion.
Life in the slow lane society
Economic growth in the UK has slowed over the last few decades. Public finances have been squeezed by low growth, reducing the UK’s ability to make significant strides in technology, innovation or infrastructure (including in transport, healthcare or education). This has also forced a focus on lower-tech, lower cost solutions in public services. The stalling of economic growth was particularly difficult for citizens in the first decade, especially when they compared living standards to those in other countries experiencing continued growth. Some people have continued to find the slow pace of change, and low availability of new consumer goods, frustrating. However, many citizens have come to accept low growth so long as the limited available resources are focussed on increasing health and wellbeing, improving planetary health, and reducing inequality.
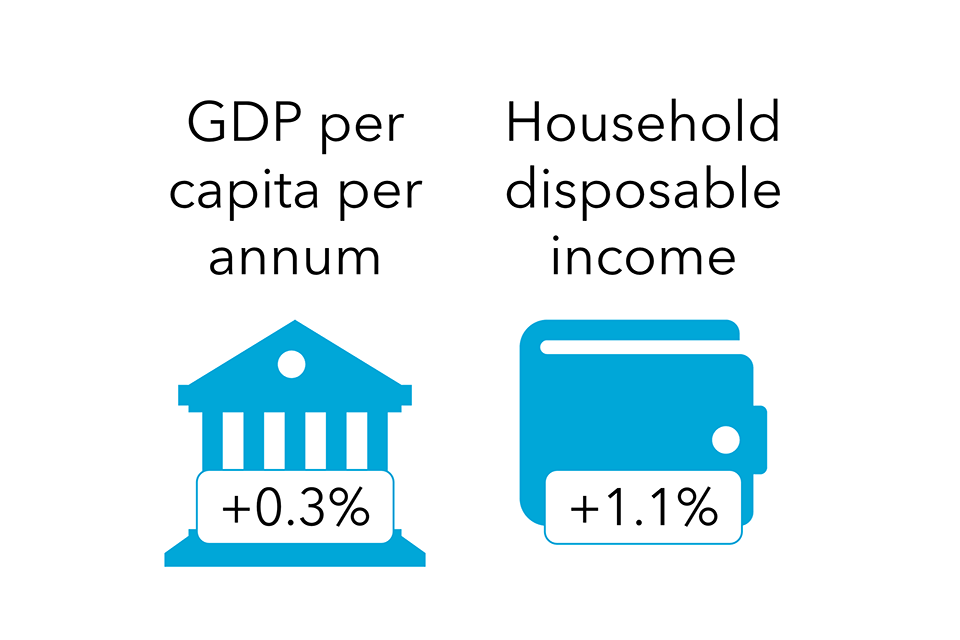
The slow lane GDP per capita and household disposable income. Left: GDP per capita is shown as +0.3%. Right: household disposable income is shown as +1.1%.
Wage stagnation and unfavourable economic conditions have led to reduced consumption and have contributed to a resurgence of a ‘make do and mend’ culture. Given the unaffordability of goods for many individuals, local areas have established a shared economy for more expensive items; for example, household appliances or modes of transport (such as on-demand electric mini-buses) are rented rather than owned.
Technological advances in all areas have been slow in this scenario. This means there is comparatively little net zero technology available, but also limited advances in other desirable areas, such as healthcare. Where there has been technological progress, efforts have been largely directed towards addressing sustainability and the wellbeing of society. Artificial intelligence, for example, is tightly regulated and used primarily for improvements in environmental monitoring, delivering more efficient public transport, and ensuring fairer prioritisation and allocation of resources.
In the late 2030s, governments began devolving more responsibility to local areas and regions, beginning with an expansion of city mayors, but ultimately filtering down to smaller towns. Given this scenario’s position on our key axes, we have assumed higher political engagement and voting at the local level, where people can clearly see that their choice makes a difference. This has also boosted localism and local engagement with strategies being shared, spread, and adopted between local governance and advocacy groups.
International societal considerations: By the early 2030s, global cooperation around net zero and the climate agenda made progress with the establishment of a new agreement for natural resources protection programme and global warming limits. However, despite improved international collaboration, big emitters such as China and Russia saw their efforts limited due to lack of technological progress.
Sectors
The built environment: The population is spread across city centres and rural areas living localised lifestyles. To compensate for continued wage stagnation, many businesses have adopted shorter working weeks for employees. Working from home also became widely adopted across many industries in the 2020s, allowing many to move out of cities and into rural areas. The plan to decentralise the government and give more responsibility to local areas in the 2030s supported more compact lifestyles within cities and towns. The growing rural population live as sustainably as they can, but travel further and live in bigger houses, often built on greenfield sites. Infrastructure investment programmes were not carried out in the late 2030s, making it challenging to deliver new homes at the pace and scale required. Although costly, many homes include ‘smart’ AI features, which have been normalised. This has resulted in better energy and resource consumption management.
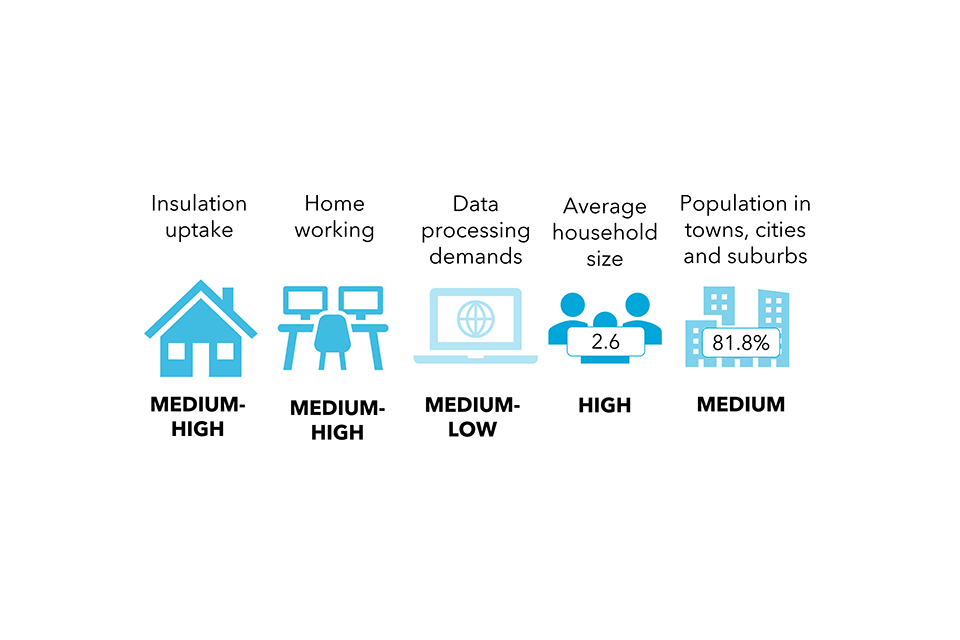
The content of this figure is provided in the report in an accessible format.
| Insulation and energy efficiency | Home working | Data processing demands | Average household size | Populations in towns, cities and suburbs |
|---|---|---|---|---|
| Medium-High | Low | Medium-low | High (2.6) | Medium (81.8%) |
Travel and transport: The expansion of clean air zones and the development of more efficient public transport made private ownership of cars less attractive. Therefore, most individuals walk or cycle to work. There was a short-lived dip in short- and long-haul travel during the COVID-19 pandemic but international travel resumed more intensely in the 2030s. However, the relatively high cost of flying alongside preferences for a ‘slower’ pace of life prompted more people to choose to trains and boats for long-haul travel. Even airships have seen a renaissance. Some people are frustrated by this slower pace, particularly where it holds back business productivity.
The content of this figure is provided in the report in an accessible format.
| CAVs uptake | Active lifestyles | Shared travel | Road traffic | International aviation |
|---|---|---|---|---|
| Low | High | High | Low (-32.3%) | Low (-7.3%) |
Work and industry: Bigger businesses have increasingly begun promoting positive societal values, although many multinational companies have reduced trading in the UK given the low spending power of its citizens. The resulting gap in the market, combined with the focus on community and spending locally, has created a friendlier operating environment for smaller businesses. However, given the backdrop of low growth, no business of any size is thriving, and wages follow. There is a reduced choice of new products and those that are available are unaffordable to many people. This has led to a ‘repair first’ model and widespread adoption of sharing of goods and services. Many local areas are now served by repair shops with some additive manufacturing capabilities that are geared towards extending the useful life of products and serving the needs of local economies.
The content of this figure is provided in the report in an accessible format.
| Resource consumption | Circular economy | Product lifespan | Sharing economy | Reshoring of manufacturing |
|---|---|---|---|---|
| Low | Medium-high | High | High | Low (+0%) |
Food and land use: Climate change impacts are still felt but are mostly better managed through adaptation measures. Regions have become more effective at meeting the triple challenge of balancing carbon reduction, biodiversity improvements and food production maintenance by finding the land use mix that works best in each landscape. More people enjoy access to protected nature zones. More food is grown in the UK for domestic consumption. Perhaps in part driven by lower incomes, meat consumption is low, and many people have transitioned to plant-based diets. Cultured meat has failed to gain traction with initial hesitance becoming widespread resistance that could not be overcome by businesses in unfavourable economic conditions.
The content of this figure is provided in the report in an accessible format.
| Afforestation | Reliance on food imports | Plant-based diets | Cultured meat uptake | Meat and dairy consumption | Food waste |
|---|---|---|---|---|---|
| Medium-high | Low | High | Medium-low (+14.6%) | Low (-50%) | Low (-99.9%) |
3.4 Sector comparisons

The content of this figure is provided in the report in an accessible format.
| The atomised society | The metropolitan society | The self-preservation society | The slow lane society |
|---|---|---|---|
| Many living in gated communities in suburban and rural areas | Investment prioritises development of urban areas | Declining urban investment drives people out of cities | Population dispersed across urban and rural areas |
| Rapid house-building improves affordability | More people living in cities, those in rural areas feel neglected | Housing demand outstrips supply | Low investment in new homes |
| More people living alone | Compact living in AI-enabled smart homes | More multi-generational living | More localised and compact lifestyles |
| Greater reliance on online goods and services | Push for essential services close to home | Focus on ‘self-sufficient’ living | Local amenities providing repair and sustainable living services |

The content of this figure is provided in the report in an accessible format.
| Insulation and energy efficiency | Home working | Data processing demand | Average household size | Urban/suburban population | |
|---|---|---|---|---|---|
| Atomised society | Medium-high | High | High | Low | Medium |
| Metropolitan society | High | Medium-low | Medium-high | Medium-low | High |
| Self-preservation society | Medium-low | Low | Low | Medium | High |
| Slow lane society | Low | Medium-high | Medium-low | High | Medium |

The content of this figure is provided in the report in an accessible format.
| The atomised society | The metropolitan society | The self-preservation society | The slow lane society |
|---|---|---|---|
| Flying abroad for leisure remains popular | Zero-carbon options maintain popularity of flying | Flying is increasingly expensive | Train and boats used for long-haul travel |
| Long-distance public transport has improved | Investment in low-cost urban public transport | Moderate investment in active travel infrastructure | Active travel is the dominant mode of travel |
| Public transport prices exclude the poorest | Train travel cheaper and easier between cities | Fragmented public transport outside of cities | Efficient public transport and clean air zones |
| Strong uptake of CAVs by the rich | CAVs available as on-demand shared travel | CAVs available for the rich | CAV use is less widespread |

The content of this figure is provided in the report in an accessible format.
| CAVs uptake | Active lifestyles | Shared travel | Road traffic | International aviation | |
|---|---|---|---|---|---|
| Atomised society | High | Low | Low | High | High |
| Metropolitan society | Medium-high | Medium-high | Medium-high | Medium | Medium-high |
| Self-preservation society | Medium-low | Medium-low | Medium-low | Medium-high | Medium-low |
| Slow lane society | Low | High | High | Low | Low |

The content of this figure is provided in the report in an accessible format.
| The atomised society | The metropolitan society | The self-preservation society | The slow lane society |
|---|---|---|---|
| International competition and high levels of reshoring | Local businesses and low levels of reshoring | Domestic competition and moderate levels of reshoring expensive | Smaller local businesses thriving and low levels of reshoring |
| Throwaway culture partially offset by technology enabled recycling | Growing circular economy | Throwaway culture due to cost of repair | Repair-first model, shared goods and services |
| Crypto-currencies, economy for virtual goods and services | Tech is used to track product provenance and lifecycles | Inbuilt obsolescence and ‘greenwashing’ commonplace | Some businesses struggle with lack of physical infrastructure investment |
| Constantly developing technology makes older products obsolete | AI enables accurate carbon labelling of products | Lack of traceability of carbon impact of products | Consumer tech not as readily available |

The content of this figure is provided in the report in an accessible format.
| Resource consumption | Circular economy | Product lifespan | Sharing economy | Reshoring of manufacturing | |
|---|---|---|---|---|---|
| Atomised society | High | Medium-low | Low | Low | High |
| Metropolitan society | Medium-high | High | Medium-high | High | Low |
| Self-preservation society | Medium-low | Low | Medium-low | Medium-low | Medium-low |
| Slow lane society | Low | Medium-high | High | High | Low |

The content of this figure is provided in the report in an accessible format.
| The atomised society | The metropolitan society | The self-preservation society | The slow lane society |
|---|---|---|---|
| Wide availability of cultured meat | Consumption of plant-based diets with cultured meat | High availability of intensively farmed meat | Plant-based diets are popular |
| Urban agriculture and vertical farming offer costly local produce | Food production combines low and high tech approaches | Some UK farmland has become unviable | Focus on protecting biodiversity in food production |
| Agriculture tech allows UK to maintain self-sufficiency | Tech reduces land and pesticide use and improves food self-sufficiency | Little use of new agricultural tech, but increased reliance on imports | Some agricultural tech with emphasis on adaptation and self-sufficiency |
| Reduced biodiversity from environmental degradation | Ecosystem services are valued, but tensions over rewilding | Rewilded farms, recreational use of rural land | Nature zones are protected and national parks restored |

The content of this figure is provided in the report in an accessible format.
| Afforestation | Reliance on food imports | Plant-based diets | Cultured meat uptake | Meat and dairy consumption | Food waste | |
|---|---|---|---|---|---|---|
| Atomised society | Medium-low | Medium-high | Medium | Medium-high | Medium-high | High |
| Metropolitan society | Medium-low | Medium-low | High | High | Medium-low | Medium |
| Self-preservation society | Medium-high | High | Medium-low | Low | High | High |
| Slow lane society | Medium-high | Low | High | Medium-low | Low | Low |
3.5 Translation into quantified ‘levers’
This section sets out how the scenario narratives have been translated into quantified ‘levers’. Levers are inputs to sectoral models that can vary by scenario. These levers collectively determine each scenario’s demand and technology availability. They enable our assessment of how net zero could be met in each scenario, which is covered in the next chapter. This section is most likely to be of interest to readers with a technical interest in the detail of the methods and assumptions used in the project.
Below, we cover a set of cross-cutting inputs, followed by inputs into our four sectoral models: the built environment, travel and transport, work and industry, and food and land use. For each sector, we also describe some of the key sectoral model ‘activity’ outputs that feed into the energy system model, UKTM, as energy demands.
A note on the base year for sectoral models
The choice of base year for modelling data is not straightforward, given the disruptive effects of the COVID-19 pandemic on society and the economy in 2020 and 2021. It is also not possible to use 2022 as data are usually finalised and published with a lag of several months. We have therefore opted to use 2019 as the base year for most modelling data. However, economic indicators have been sourced from March 2022 OBR projections, which account for the effects of the COVID-19 pandemic. The scenario narratives and related modelling input trajectories also aim to account for the wider effects of the pandemic in some way (for example, by explaining its effects on future digital communication).
Cross-cutting levers
Some high-level aspects of 2050 were assumed to stay consistent with current predictions across all the scenarios (for example, population size). However, there were other important overarching societal variations between the scenarios, which we translated into a series of variable cross-cutting levers (such as GDP and income growth, and geographical population distribution). These cross-cutting levers were used in all the sectoral models and UKTM.
The tables below illustrate some of the key levers to illustrate our approach. These tables cover the high and low ‘settings’ for each lever, which scenarios were chosen, a rationale for this choice, illustrative values, and a summary of the evidence used. The cross-cutting table (Table 3) also includes a description of how each variable feeds through in the sectoral models. The full detail is covered in Annex 4.
Table 3. Illustrative set of cross-cutting levers, used consistently across the sectoral models and UKTM (more detail is provided in Annex 4)
Cross-cutting input lever settings (based on OBR (2022) Economic and fiscal outlook — March 2022; ONS population)
| Lever (Unit) | Current values | Highest | Lowest | Examples of how these feed into demand |
| Annual average GDP per capita (average annual change 2022–2050) | £31,793 (2021) | Scenario: At Soc; Value: +2.8%; Rationale: Higher economic growth is a defining feature of this scenario, drawn from one of the two core scenario axes. | Scenario: SL Soc; Value: +0.3%; Rationale: Lower economic growth is a defining feature of this scenario, drawn from one of the two core scenario axes. | The built environment: Broadly, more growth means more construction and more emissions. Travel and transport: Growth is still coupled to freight and passenger transport, although there are limits. Work and industry: Broadly, more growth means greater industrial output and more emissions (all else being equal — circular economy measures could break this link). Food and land use: GDP (and therefore income) affects household spending patterns on food. |
| Average household size | 2.4 (2022) | Scenario: SL Soc; Value: 2.6 (+8.3%); Rationale: This scenario has higher levels of trust and lower incomes, with more people living together in bigger households. | Scenario: At Soc; Value: 2.1 (-13%); Rationale: This scenario has lower levels of trust and higher incomes, with more people choosing to live alone or in smaller households. | The built environment: Bigger households use less energy and water per person than smaller households. Travel and transport: More single households increase household car ownership and use. Work and industry: Smaller households are associated with a higher floorspace build rate. Food and land use: Household size can affect household spending patterns on food. |
| Household disposable income per capita (average annual change 2022-2050) | £31,000 (2022) | Scenario: At Soc; Value: +2.1%; Rationale: THigher incomes linked to higher levels of economic growth, which is a defining feature of this scenario (see above). | Scenario: SL Soc; Value: +1.1%; Rationale: TLower incomes linked to lower levels of economic growth, which is a defining feature of this scenario (see above). | The built environment: Increased capacity for investment and more construction. Travel and transport: Disposable income affects household car ownership and direct link to household car use. Increased income has been a main driver of demand for aviation.26 Income influences car distance travelled and van traffic. Work and industry: Household spending is the largest source of consumption in the economy, which relates to emissions. Food and land use: Changes in disposable income determine peoples’ ability to follow healthier diets. Inequality drives greater consumption of processed foods, and less consumption of fruit, vegetables, red meat and oily fish. |
| Urbanised populations in 2050 (% of total population in urban and suburban areas) | 84% (2021) | Scenario: Met Soc; Value: 87%; Rationale: Investment and funding in urban areas attracts many to compact urban living. | Scenario: At Soc; Value: 82%; Rationale: The population is more dispersed, with the rich choosing to live in suburban and rural areas. | The built environment: Changing demographics can affect demand for new homes. Travel and transport: More dispersed populations can be associated with higher car ownership and longer trip distances. Work and industry: As a population becomes increasingly urbanised, demand for construction increases. Food and land use: Urbanisation can be a key driver of agricultural demand, and reduced proportion of people living in rural areas leads to a shortage of agricultural workers and increases agricultural land conversion. |
The built environment
Key determinants of energy demand in buildings include the internal temperature, and total floorspace. Below are details of how these are assumed to vary across the scenarios.
Figure 13. Mean internal temperature (degrees Celsius) for comfort in 2020–2050 in the four net zero society scenarios (top) and floorspace (million square metres) in the non-domestic buildings sector in 2020–2050 in the four net zero society scenarios (bottom)
Please note: In this graph, the atomised society line is overwritten by the self-preservation society line

The content of this figure is provided in the report in an accessible format.
Figure 13 graph 1 data: Mean internal temperature, ˚ C
| AT Soc | Met Soc | SP Soc | SL Soc | |
|---|---|---|---|---|
| 2020 | 18.6 | 18.6 | 18.5 | 18.4 |
| 2021 | 18.6 | 18.5 | 18.4 | 18.4 |
| 2022 | 18.7 | 18.5 | 18.3 | 18.3 |
| 2023 | 18.7 | 18.4 | 18.2 | 18.2 |
| 2024 | 18.8 | 18.4 | 18.1 | 18.2 |
| 2025 | 18.8 | 18.3 | 18 | 18.1 |
| 2026 | 18.9 | 18.2 | 17.9 | 18.1 |
| 2027 | 18.9 | 18.2 | 17.8 | 18 |
| 2028 | 19 | 18.1 | 17.7 | 18 |
| 2029 | 19 | 18 | 17.6 | 17.9 |
| 2030 | 19.1 | 18 | 17.5 | 17.9 |
| 2031 | 19.1 | 17.9 | 17.5 | 17.8 |
| 2032 | 19.1 | 17.9 | 17.4 | 17.8 |
| 2033 | 19.1 | 17.9 | 17.4 | 17.7 |
| 2034 | 19.1 | 17.9 | 17.4 | 17.6 |
| 2035 | 19.1 | 17.9 | 17.4 | 17.6 |
| 2036 | 19 | 17.9 | 17.4 | 17.5 |
| 2037 | 19.1 | 17.8 | 17.4 | 17.5 |
| 2038 | 19.1 | 17.8 | 17.4 | 17.4 |
| 2039 | 19.1 | 17.8 | 17.4 | 17.4 |
| 2040 | 19.1 | 17.8 | 17.4 | 17.3 |
| 2041 | 19.1 | 17.7 | 17.4 | 17.3 |
| 2042 | 19.1 | 17.7 | 17.4 | 17.2 |
| 2043 | 19.1 | 17.7 | 17.4 | 17.1 |
| 2044 | 19.1 | 17.7 | 17.4 | 17.1 |
| 2045 | 19.1 | 17.6 | 17.4 | 17 |
| 2046 | 19.1 | 17.6 | 17.4 | 17 |
| 2047 | 19.1 | 17.6 | 17.4 | 16.9 |
| 2048 | 19.1 | 17.6 | 17.4 | 16.8 |
| 2049 | 19.1 | 17.6 | 17.4 | 16.8 |
| 2050 | 19.1 | 17.5 | 17.4 | 16.7 |

The content of this figure is provided in the report in an accessible format.
Figure 13 graph 2 data: Floorspace, million m2
| AT Soc | Met Soc | SP Soc | SL Soc | |
|---|---|---|---|---|
| 2020 | 1000 | 1100 | 1000 | 1100 |
| 2021 | 1000 | 1100 | 1000 | 1100 |
| 2022 | 1000 | 1100 | 1000 | 1100 |
| 2023 | 1000 | 1100 | 1000 | 1100 |
| 2024 | 1000 | 1100 | 1000 | 1100 |
| 2025 | 1000 | 1200 | 1000 | 1100 |
| 2026 | 1000 | 1200 | 1000 | 1100 |
| 2027 | 1000 | 1200 | 1000 | 1100 |
| 2028 | 1000 | 1200 | 1000 | 1100 |
| 2029 | 1000 | 1200 | 1000 | 1100 |
| 2030 | 1000 | 1200 | 1000 | 1100 |
| 2031 | 1000 | 1300 | 1000 | 1100 |
| 2032 | 1000 | 1300 | 1000 | 1200 |
| 2033 | 1000 | 1300 | 1000 | 1200 |
| 2034 | 1000 | 1300 | 1000 | 1200 |
| 2035 | 1000 | 1300 | 1000 | 1200 |
| 2036 | 1000 | 1400 | 1000 | 1200 |
| 2037 | 1000 | 1400 | 1000 | 1200 |
| 2038 | 1000 | 1400 | 1000 | 1200 |
| 2039 | 1000 | 1400 | 1000 | 1200 |
| 2040 | 1000 | 1400 | 1000 | 1200 |
| 2041 | 1100 | 1500 | 1100 | 1200 |
| 2042 | 1100 | 1500 | 1100 | 1200 |
| 2043 | 1100 | 1500 | 1100 | 1300 |
| 2044 | 1100 | 1500 | 1100 | 1300 |
| 2045 | 1100 | 1600 | 1100 | 1300 |
| 2046 | 1100 | 1600 | 1100 | 1300 |
| 2047 | 1100 | 1600 | 1100 | 1300 |
| 2048 | 1100 | 1600 | 1100 | 1300 |
| 2049 | 1100 | 1600 | 1100 | 1300 |
| 2050 | 1100 | 1700 | 1100 | 1300 |
Focussing on domestic buildings, the internal temperature is a function of both the thermostat temperature and the heat loss of the building. Poorly insulated buildings cool down quicker and so have a lower mean internal temperature. We have not made any specific assumptions about the effects of global warming on indoor temperatures in each scenario, because of significant uncertainties on how this would manifest across seasons, but it is likely that this would affect both heating and cooling demand in the UK.
Indoor temperature in the atomised society follows historical trends by increasing to 19°C in 2050 (Figure 13, top), leading to higher energy demands. The other scenarios see a reduced average indoor temperature by 2050, driven by a mix of environmental awareness, cost pressures, and levels of insulation, varying by scenario. The metropolitan society has higher average incomes, which reduces the incentive to turn down thermostats, but this is offset by increased environmental awareness. The self-preservation society has relatively high cost pressures and lower insulation, but also lower environmental awareness. The slow lane society has both high environmental awareness and the lowest incomes, leading to the lowest mean temperature by 2050.
The non-domestic floorspace expands in all four scenarios, although to different extents (Figure 13, bottom). The largest increase is observed in the metropolitan society, by more than 50% by 2050, due to a preference for face-to-face working that leads to development of city centre office space. The atomised and self-preservation societies have high levels of virtual living and working, and this leads to them having the lowest growth in non-domestic floorspace, at just under 5% by 2050. The residential buildings sector is not modelled based on floorspace but uses assumptions about the average household size, common across all sectors, to calculate household energy use. Table 4 sets out further details on a set of key levers and their settings for the built environment sector.
Table 4. An illustrative set of levers for the built environment sector, which have been used in the sectoral model (more detail is provided in Annex 4)
Built environment input lever settings
| Lever (Unit) | Most recent values | Highest | Lowest |
| Total non-domestic floorspace | 580.8 million m2 | Scenario: Met Soc; Value: 871.2 million m2 (+50%); Rationale: Preference of face-to-face working, leading to an increase in development of office space in city centres.; Evidence: CREDS report | Scenario: At Soc / SP Soc; Value: 608.1 million m2 (+4.7%); Rationale: High levels of virtual living and working, leading to low growth in floorspace.; Evidence: CREDS report |
| Home working (Average number of commuting and business trips per person) | 113 (2020) | Scenario: At Soc; Value: -20%; Rationale: Home working more common with greater availability of tech.; Evidence: There is a mixed picture on longer term effects on distance travelled. For example, fewer regular trips for work may mean fewer overall trips but longer distances travelled to workplace. | Scenario: SP Soc; Value: -5%; Rationale: Some types of work have been automated, but a significant proportion of the population is still working in face-to-face service and manual roles.; Evidence: Urban planning influences the environmental impacts of teleworking, enabling teleworkers to travel less to access essential facilities. |
| Average household energy use (combined gas and electricity use) | 15,400kWh/year (2017) | Scenario: SL Soc; Value: 9,086 kWh/year (-41%); Rationale: Investment in greater energy efficiency measures.; Evidence: UK National Household Model[v] and CREDS | Scenario: SP Soc; Value: 13,090 kWh/year (-15%); Rationale: More people choosing to live off grid. Lack of investment in energy efficiency measures.; Evidence: UK National Household Model and CREDS |
Travel and transport
Distance travelled by different vehicle types is a key determinant of energy demand in the transport sector. Below are details of how these are assumed to vary across the scenarios.
Figure 14. Demand for road transport in billion vehicle-kilometres per year in the four net zero society scenarios (top) and demand for aviation in billion passenger-kilometres per year in the four net zero society scenarios (bottom)

The content of this figure is provided in the report in an accessible format.
Figure 14. Graph 1 data: Road transport demand billion vkm/year
| AT Soc | Met Soc | SP Soc | SL Soc | |
|---|---|---|---|---|
| 2020 | 450 | 450 | 450 | 450 |
| 2025 | 560 | 500 | 540 | 470 |
| 2030 | 590 | 470 | 550 | 380 |
| 2035 | 630 | 450 | 560 | 370 |
| 2040 | 680 | 440 | 570 | 360 |
| 2045 | 740 | 430 | 580 | 350 |
| 2050 | 800 | 420 | 580 | 350 |

The content of this figure is provided in the report in an accessible format.
Figure 14. Graph 2 data: Aviation demand, billion pkm
| AT Soc | Met Soc | SP Soc | SL Soc | |
|---|---|---|---|---|
| 2020 | 240 | 240 | 240 | 240 |
| 2025 | 320 | 310 | 300 | 300 |
| 2030 | 350 | 340 | 310 | 300 |
| 2035 | 380 | 360 | 310 | 300 |
| 2040 | 410 | 380 | 310 | 300 |
| 2045 | 440 | 390 | 320 | 290 |
| 2050 | 470 | 410 | 320 | 290 |
Higher incomes, lower vehicle occupancy, and the availability of CAVs all lead to the highest demand for road transport in the atomised society (Figure 14, top). Higher GDP is also associated with more freight needing to be moved in this scenario. The self-preservation society also has relatively high levels of travel by car, but primarily due to a lack of public transport and active travel alternatives. The other two scenarios see a reduction in travel by road transport, due to a combination of environmental awareness and good availability of alternatives to car travel, particularly in urban areas in the metropolitan society. Lower income growth and improved public transport and active travel infrastructure also support reductions in car travel in the slow lane society, incentivising people to use rail, bus services, cycle or walk where possible.
Demand for aviation stabilises at the pre-pandemic levels in the lower-growth societies (self-preservation and slow lane) but increases substantially in the atomised society, nearly doubling by 2050 (Figure 14, bottom). Despite an increase in environmental awareness in the metropolitan society, high incomes and an ongoing preference for foreign holidays lead to relatively high increases in aviation demand in this scenario.
Table 5 below sets out further details on a set of key levers and their settings for the travel and transport sector.
Table 5. An illustrative set of levers for the travel and transport sector, which have been used in the sectoral model (more detail is provided in Annex 4)
Travel and transport input lever settings
| Lever (Unit) | Most recent values | Highest | Lowest |
| International travel and aviation (terminal passengers from UK airports) | 296,658 (2019 to account for pre-covid levels) | Scenario: At Soc; Value: 400,488 (+35%); Rationale: High incomes, strong attachment to international holidays, and technology that enables low carbon flying all contribute.; Evidence: Assume an initial shift downwards as industry recovers followed by continuation of pre-COVID trips and trip lengths with a slight increase in income elasticity (higher incomes, more people fly).; | Scenario: SL Soc; Value: 341,156 (+15%); Rationale: Relatively low incomes, shifting societal preferences for UK holidays, and increased environmental awareness reduce flying. Higher pricing of aviation (especially for frequent flyers) becomes acceptable during the 2020s.; Evidence: Reduction in air trip rates (people fly less but stay longer) thus reducing ‘hypermobility’ and ‘binge flying’. See CREDS Low Energy Demand report for details.; |
| Change in road traffic (percentage change, 2015–2050) | 297.6 billion vehicle miles driven (2021) | Scenario: At Soc; Value: 0.57; Rationale: The private ownership model continues to dominate, with only limited traction for shared travel.; Evidence: OECD data, CREDS shared mobility inquiry and commission.; | Scenario: Met Soc; Value: -0.17; Rationale: Expansion of clean air zones and the development of more efficient public transport made private ownership less attractive. Most people take up active travel options to lead healthier lifestyles.; Evidence: OECD data, CREDS shared mobility inquiry and commission.; |
| Car occupancy rate (average number of people per vehicle) | 1.6 -2018 | Scenario: Met Soc; Value: 2 (+25%); Rationale: Massive investment in shared and demand responsive transport (such as car clubs and ride sharing) lead to higher car occupancy rates and lower car ownership.; Evidence: OECD data, CREDS shared mobility inquiry and commission.; | Scenario: At Soc; Value: 1.37 (-14%); Rationale: Individual use preferred option coupled with higher incomes means more individual ownership, lower car occupancy rates, and little mode shift to shared options.; Evidence: OECD data, CREDS shared mobility inquiry and commission.; |
Work and industry
Energy demand from work and industry are in large part driven by the output of those sectors, a proxy measure for which is Gross Value Added (GVA). Below we give details of how this is assumed to vary across the scenarios.
Figure 15. Graphs showing activity in four key industrial subsectors, indexed to 2010, in 2020 and in 2050 for the four net zero society scenarios

The content of this figure is provided in the report in an accessible format.
Figure 15 data: GVA, indexed to 2010
| Cement | Iron and steel | Non-ferrous metals | Chemicals | ||
|---|---|---|---|---|---|
| 2020 | 0.88 | 0.74 | 0.7 | 0.48 | |
| 2050 | AT Soc | 1.08 | 1 | 0.62 | 0.45 |
| 2050 | Met Soc | 1.16 | 0.75 | 0.43 | 0.31 |
| 2050 | SP Soc | 1.06 | 0.6 | 0.32 | 0.23 |
| 2050 | SL Soc | 0.75 | 0.49 | 0.25 | 0.18 |
Compared to 2010, to which the industry data are indexed in the sectoral model, industrial activity falls in all scenarios as well as in 2020 due to ongoing offshoring of manufacturing (except in the atomised society) and improvements in material efficiency (Figure 15 illustrates four key industrial subsectors). For example, by 2050 the slow lane society’s industry sector is halved compared to 2010 and in the self-preservation society it shrinks by around two thirds. By subsector, ammonia and high-value chemicals dwindle most on average across all scenarios, to around a third of their 2010 levels. While chemicals is a large subsector in terms of its energy demand in 2010, its importance decreases by 2050 as its activity levels drop by between 55% (in the atomised society) and 82% (in the slow lane society) over that time period.
The main driver with the potential to offset the shrinking of the industry sector is reshoring. In the atomised society this adds 20% to manufacturing sector outputs by 2050 (with corresponding reductions in imports), due to increased automation and global conflict, whereas in the self-preservation society this additional growth is smaller at 5%, with automation less of a driver. Significant reshoring does not occur in the other two scenarios. In addition, cement production increases in the metropolitan, atomised and self-preservation societies because of expanded construction, driven by economic growth.
Table 6. An illustrative set of levers for the work and industry sector, which have been used in the sectoral model (more detail is provided in Annex 4)
Work and industry input lever settings
| Lever (Unit) | Most recent values | Highest | Lowest |
| Sharing economy: renting of clothing (percentage of market) | 2% (2022) | Scenario: Met Soc; Value: 0.28; Rationale: Higher use rate from sharing economy type approaches means fewer goods required and emissions savings from reduced production.; Evidence: Linked to previous modelling of available opportunities. | Scenario: At Soc; Value: 0.12; Rationale: Throwaway culture is prevalent, partially offset by recycling.; Evidence: Linked to previous modelling of available opportunities. |
| Product longevity | Average lifetime of large appliances is 13 years (2020) | Scenario: SL Soc; Value: Average lifetime of large appliances is 16 years (+23%); Rationale: Repair-first model, with shared goods and services. Extending the lifetime of electric appliances.; Evidence: Linked to previous modelling of available opportunities. | Scenario: At Soc; Value: Average lifetime of large appliances is 14.1 years (+8.5%); Rationale: Constantly developing technology makes older products obsolete. Throwaway culture partially offset by technology-enabled recycling.; Evidence: Linked to previous modelling of available opportunities. |
| Reshoring of manufacturing (Output from UK manufacturing sector) | £183bn (2022) | Scenario: At Soc; Value: £219.6bn (+20%); Rationale: International competition and high levels of reshoring.; Evidence: Determined by central GO-Science team, advised by Department for international Trade. | Scenario: SL Soc; Value: No or minimal change from current values.; Rationale: Domestic competition and low levels of reshoring. Smaller local businesses thriving.; Evidence: Determined by central GO-Science team, advised by Department for international Trade. |
Food and land use
Calorific intake by food group, driven by dietary preferences and food availability, is a key metric determining energy use and direct emissions from food and land use.
Figure 16. Average calorific demand by food group in 2020 and in 2050 for the four net zero society scenarios (kilocalories per capita per day

The content of this figure is provided in the report in an accessible format.
Figure 16 data: Average calorie intake per capita per day
| Meat (including cultured) | Dairy | Cereals | Fish | Confectionary | Misc | Drinks | Vegetables | Fruit and nuts | ||
|---|---|---|---|---|---|---|---|---|---|---|
| 2020 | 430 | 370 | 720 | 86 | 370 | 120 | 250 | 360 | 170 | |
| 2050 | At Soc | 520 | 370 | 790 | 95 | 410 | 130 | 280 | 380 | 190 |
| 2050 | Met Soc | 460 | 240 | 720 | 86 | 370 | 120 | 250 | 450 | 170 |
| 2050 | SP Soc | 450 | 380 | 750 | 90 | 390 | 120 | 260 | 380 | 180 |
| 2050 | SL Soc | 340 | 160 | 630 | 75 | 330 | 100 | 220 | 510 | 150 |
Figure 17. Average calorific demand by food group for meat in 2020 and in 2050 for the four net zero society scenarios (kilocalories per capita per day

The content of this figure is provided in the report in an accessible format.
Figure 17 data: Average calorie intake per capita per day
| Beef | Lamb | Pork | Processed pork | Poultry | Other processed meats | Cultured meat | ||
|---|---|---|---|---|---|---|---|---|
| 2020 | 86 | 29 | 57 | 29 | 170 | 57 | 0 | |
| 2050 | At Soc | 87 | 29 | 63 | 32 | 190 | 63 | 55 |
| 2050 | Met Soc | 57 | 19 | 57 | 29 | 170 | 57 | 67 |
| 2050 | SP Soc | 90 | 30 | 60 | 30 | 180 | 60 | 0 |
| 2050 | SL Soc | 38 | 13 | 50 | 25 | 150 | 50 | 15 |
Driven by higher incomes and high-consumption lifestyles, the average calorific intake in the atomised society grows by around 10% by 2050. The self-preservation society sees a smaller increase, due to the lower levels of income growth. The slow lane society is the only scenario that sees a decreasing total average calorific intake by 2050, by nearly 13%. This is driven in large part by the reduction in meat and dairy consumption (see below), but also because of reduced discretionary income. The slow lane society broadly follows the government recommendation of 2250 daily calories (kcal) per person on average, with a ‘buffer’ of 250 kcal to account for additional needs from more active lifestyles in that scenario.
By food group, the largest differences between scenarios are in meat and dairy and in cultured meat, the latter facing high technological uncertainty and untested customer demand. High levels of technological development in the metropolitan and atomised societies means that cultured meat starts to feature in diets by 2050, but the contribution is modest. Meat and dairy consumption falls most in the slow lane society, by around 50% compared to 2020, because of environmental awareness, a preference for healthy lifestyles, and lower incomes (although the income relationship is not explicitly modelled). There is a smaller reduction in meat and dairy consumption in the metropolitan society (of a third from today) with higher incomes stopping further drops. Meat and dairy consumption remains at today’s levels in the self-preservation society.
Table 7 sets out a set of key levers and their settings for the food and land use sector.
Table 7. An illustrative set of levers for the food and land use sector, which have been used in the sectoral model (more detail is provided in Annex 4)
Food and land use input lever settings
| Lever (Unit) | Most recent values | Highest | Lowest |
| Meat consumption (percentage reduction in meat consumption) | Red and processed meat consumption met the maximum recommendation for adults of 66g per day (2020) | Scenario: SL Soc; Value: -0.5; Rationale: Meat consumption is low, and many people have transitioned to plant-based diets; Evidence: CCC (2020) Sixth Carbon Budget Advice, Balanced Net Zero Pathway assumption. | Scenario: SP Soc; Value: No/minimal change from current values.; Rationale: Meat consumption has remained stable and alternatives, including cultured meat, have failed to take off.; Evidence: Based on National Diet and Nutrition survey (proportion of calorific intake from each food group) with the assumption that this is maintained to 2050. |
| Food self-sufficiency (production to supply ratio for all food in UK) | 60% (2020) | Scenario: SL Soc; Value: 0.75;Rationale: More food is grown in the UK for domestic consumption; Evidence: Based on the last highest food production-to-supply ratio of 75% in 1991. | Scenario: SP Soc; Value: No/minimal change from current values.; Rationale: Some farms have become unviable (exacerbated by extreme weather events like drought and flooding), increasing the UK’s reliance on imports.; Evidence: Based on current levels of self-sufficiency. |
| Food waste (% of avoidable food waste fraction) | 9.5Mt per year (2020) | Scenario: SL Soc; Value: 95,000t per year (-99%); Rationale: Elimination of all avoidable food waste.; Evidence: Extrapolation of recent food waste reduction trends to 2050. | Scenario: At Soc; Value: No/minimal change from current values.; Rationale: Current rates of food waste are maintained to 2050. No incentive to reduce.; Evidence: Based on current rates of food waste. |
Systems thinking across sectors
Systems thinking is a technique that can help to understand the interactions within a complex system, and the potential consequences if there are changes within that system. It can be particularly helpful to policy makers when thinking through the wider implications of different policy interventions, or the impacts of different scenarios. Systems thinking is already being used across government in the UK, including in the net zero strategy.3 GO-Science has also published guidance on its use to help promote more widespread application in UK policy making.
In this project, many such systemic relationships within each sector are already handled by the sectoral models. However, systems thinking was also used to explore the interactions between different sectors, particularly where broader societal changes could impact more than one sector. Here we highlight a few examples to illustrate the approach. These are important case studies that were explicitly used in our analysis, representing the effects of key drivers of change within the scenarios, but there are many others that policy makers could consider.
The example in Figure 18 shows how digital interactions interact with travel and heating demand. Guidance on reading systems maps has been published by GO-Science.
Figure 18. The impacts of digital interaction on energy use, via transport and building sectors

Top: level of digital interaction feeds into increased average temperatures in domestic buildings on right; and feeds into decreased number of trips per person on left. These two then feed into increased overall energy use.
Since remote working increased during the COVID-19 pandemic, several studies have shown that reductions in transport energy demand (due to less commuting and business travel) could be offset by increases in home heating energy demand. While the net impacts on energy use may be small, representing such a change in net zero analysis is likely important, as shifting energy use from one sector to another may mean a different energy source is used or that it is used at a different time of day. These changes may require different supportive policies.
Figure 19 shows another example of how income growth and reshoring of manufacturing could affect both travel demand and the number of cars produced in the UK, both of which could increase overall energy demand.
Figure 19. The impacts of income growth and reshoring on energy use, via transport and industry sectors

This graphic depicts the impacts of income growth and re-shoring on energy use, via transport and industry sectors. Income growth and increased re-shoring are both shown to increase overall energy use.
Figure 20 shows another example of how domestic food production and levels of meat consumption could affect land availability in the UK, which could then both increase residual emissions and reduce the potential for carbon removals from afforestation and bioenergy crop production. Taken together, this could substantially increase the level of direct air capture technology that is needed.
Systemic relationships that involve competition for a limited supply of a particular energy source are also already captured within UKTM (the energy system model used to calculate how net zero would likely be met in each scenario). The diagrams shown here could be extended to illustrate some of these relationships. For example, if there is less bioenergy available, this could increase the required amount of electricity generation and hydrogen production.
Figure 20. The impacts of domestic food production and meat consumption on direct air capture requirements, via food and land use sectors

This graphic depicts the impacts of domestic food production and meat consumption on DAC requirements, via food and land use sectors.
4. Implications for net zero
What do these possible future scenarios mean for the UK’s emissions in 2050? How will meeting net zero differ between scenarios? This section presents the outputs from the models and discusses the energy system implications for reaching net zero. All our scenarios meet net zero, but some have much greater cost and delivery challenges than others. We also find there is variation in the wider impacts of meeting net zero (for example, on health), and in the risks of missing net zero between the scenarios.
4.1 Recap of modelling approach
As described in Chapters 2 and 3, we translated the scenario narratives into a set of modelling assumptions. Section 3.5 provided key examples of how the variations between scenario narratives were translated into a set of cross-cutting assumptions and detailed ‘levers’ within the four sectoral models. The full detail on these assumptions is covered in Annex 4.
Using the UKTM model, we then identified how net zero and interim carbon budgets could be met through rollouts of technology and energy infrastructure, given the demands and technology availability in each scenario. UKTM calculates the lowest cost way of meeting net zero and provides detailed insight on how the target is met and what the costs are.
Unproven net zero technologies
Within this chapter, we refer to commercially ‘unproven net zero technologies’, which are a set of technologies that are in the early stages of development, and there is a high degree of uncertainty over how, whether and when they can be scaled-up and commercialised to deliver cost-effective emissions reductions. Key examples of these, including a very brief overview of the current state of development, are provided below:
- Carbon capture and storage (CCS): CCS is broadly recognised as playing a key role in meeting emissions reduction targets, particularly in the context of industrial processes that directly emit CO2 and potentially in electricity generation using fossil fuels. CCS is technically mature for specific applications (such as enhanced oil recovery) but has not been deployed on a large scale. Cost estimates for industrial CCS are highly uncertain, with estimates ranging from £30/tCO2 to £330/tCO2, and these costs can vary by location and by site.
- Bioenergy with carbon capture and storage (BECCS): Burning bioenergy fuels in a plant with CCS would provide negative emissions as the carbon removed by the crop during its life is sequestered. Current biomass-to-power plants often struggle with sustaining consistent domestic biomass supply with low life-cycle emissions, variable quality of sourced biomass and low power plant efficiency, which are among the main barriers to carbon negative BECCS. , , , There is considerable variation in BECCS costs depending on location, size and feedstock costs, cost of capital, and the ability to retrofit existing facilities.2 Some BECCS technologies are at higher levels of readiness than others, which means investors will see some of them to be lower risk.2 However, greater technological maturity does not relieve BECCS supply chain problems such as high life-cycle emissions of imported biomass145 and competition with other land uses (such as for food crops).
- Direct air capture (DAC): DAC technology allows CO2 to be extracted directly from the air and stored using a liquid or solid solvent. This process requires significant amounts of electricity and heating fuel. The first commercially ready DAC plant, capable of capturing 900tCO2 per year, opened in 2017.140 To date, this technology has had limited investment, but there are drives to develop these technologies further (see BEIS 2022). According to the Climate Change Committee’s sector summary on greenhouse gas removals in the Sixth Carbon Budget (2020), in a highly ambitious scenario, deployment could start in 2035 and costs could reach £120/tCO2 by 2050.1 In a less ambitious scenario, deployment could start closer to 2040 and costs could reach £180/tCO2 by 2050 (used as the CCC’s central assumption). The International Energy Agency highlights extreme uncertainty in estimating DAC costs, with a range of between £80/tCO2 and £800/tCO2.
- Synthetic fuels for aviation: Increased use of power-to-liquid fuels is viewed as a key longer-term strategy for reducing carbon emissions from aviation, compared to short-term measures, such as curtailing demand for flying. , , However, key barriers to widespread use include high costs and energy requirements for production. According to the US National Academies of Science report on Negative Emissions Technologies and Reliable Sequestration (2019), there will be few alternatives to chemical fuels for commercial aviation by 2050.142 The Department for Transport launched the £15 million Green Fuels, Green Skies competition in March 2021, focused on sustainable aviation fuels (with winners announced in December 2021). The 2021 Autumn Budget and Spending Review also committed £180 million to kick-start development of commercial-scale UK sustainable aviation fuel. These, and other initiatives such as the £1 million Net Zero Transatlantic Flight Fund, could help in developing gasification routes to jet fuel and have the potential to create jobs in the sector.141 This funding supports the early-stage development of these projects, and there is still uncertainty around the future of these fuels.
Given the future uncertainty in their feasibility, costs and plausible scale, we pay particular attention to the role these technologies play in meeting net zero in each scenario.
4.2 Meeting net zero
Emissions
Figure 21. Greenhouse gas emissions by sector in 2020 and for the four net zero society scenarios in 2030 and 2050 (MtCO2e/year)

The content of this figure is provided in the report in an accessible format.
Figure 21 data: Average calorie intake per capita per day
| Beef | Lamb | Pork | Processed pork | Poultry | Other processed meats | Cultured meat | ||
|---|---|---|---|---|---|---|---|---|
| 2020 | 86 | 29 | 57 | 29 | 170 | 57 | 0 | |
| 2050 | At Soc | 87 | 29 | 63 | 32 | 190 | 63 | 55 |
| 2050 | Met Soc | 57 | 19 | 57 | 29 | 170 | 57 | 67 |
| 2050 | SP Soc | 90 | 30 | 60 | 30 | 180 | 60 | 0 |
| 2050 | SL Soc | 38 | 13 | 50 | 25 | 150 | 50 | 15 |
UKTM was used to assess how all four scenarios could reach net zero by 2050, as well as interim carbon budgets. This was achieved as shown in Figure 21, with an average annual reduction in greenhouse gas emissions of 3% per year between 2020 and 2050.
Figure 22. Greenhouse gas emissions by sector in 2050 for the four net zero society scenarios (MtCO2e/year)

The content of this figure is provided in the report in an accessible format.
Figure 22 data: Greenhouse gas emissions, MtCO2e/year
| Power | Industry | Fuel supply | Heat and buildings | Domestic transport | International aviation and shipping | Agriculture and land use | Waste and F-gases | Removals | |
|---|---|---|---|---|---|---|---|---|---|
| At Soc | -4 | 7 | 5 | 0 | 1 | 19 | 36 | 14 | -78 |
| Met Soc | 0 | 18 | 6 | 10 | 5 | 18 | 8 | 14 | -80 |
| SP Soc | 0 | 11 | 1 | 0 | 1 | 13 | 21 | 14 | -62 |
| SL Soc | 0 | 7 | 5 | 7 | 5 | 14 | -6 | 13 | -45 |
The level of residual emissions in 2050 varies across sectors in each scenario (Figure 22), as does how much this needs to be balanced by carbon removals. Engineered removals are generally more feasible in technologically advanced scenarios (such as the metropolitan society) whereas in the low growth scenarios (particularly the self-preservation society) even a small amount of engineered carbon removals pushes the limits of feasibility (see carbon capture and storage section below).
The atomised society has high levels of residual emissions from agriculture, largely due to higher meat consumption, and from international aviation and shipping due to international travel preferences in this scenario. Residual emissions in industry are low, despite high levels of energy use (see below), because carbon capture technologies are used to sequester CO2 from this sector. Overall, the relatively high level of residual emissions has to be offset by high levels of carbon removal, requiring key unproven net zero technologies to be pushed above what are currently considered to be plausible levels (see carbon capture and storage section below).
The metropolitan society has relatively high levels of residual emissions from industry, buildings and international aviation. Residual industry and aviation emissions are driven by higher GDP and income growth in this scenario. Residual buildings emissions come from high energy use in the non-domestic sector. Agriculture and land use emissions are relatively low in this scenario, partly due to afforestation providing some negative emissions. Again, high residual emissions need to be offset by high levels of carbon removal.
The slow lane society sees relatively low levels of residual emissions in all sectors, due to low levels of energy use and other societal changes (such as reduced international travel), which reduces residual emissions from aviation. In addition, the high levels of afforestation and low levels of meat consumption mean that emissions from agriculture and land use are net negative. This means this scenario needs the lowest level of technologically removed carbon.
Our analysis takes a territorial perspective on emissions, considering only emissions produced within the UK borders. In other words, emissions and energy associated with sourcing materials and parts outside the country are not modelled (for example, for manufacturing EVs or wind turbines). Similarly, where scenarios (such as the slow lane and metropolitan societies) rely on some imported biomass for decarbonisation, its lifecycle emissions are likely to be higher than those of domestic biomass. However, it is worth noting that the lower imports in the atomised and self-preservation societies would reduce the UK’s consumption-based emissions.
Energy use
All scenarios show reductions in total final energy by 2050 (Figure 23), largely due to the electrification of sectors such as heat and transport, which allows energy to be used more efficiently. However, in some scenarios reductions in demand also play a role.
Figure 23. Total final energy use in 2020–2050 (Petajoule/year) for the four net zero society scenario

The content of this figure is provided in the report in an accessible format.
Figure 23 data: Total final energy use, PJ/year
| 2020 | 2025 | 2030 | 2035 | 2040 | 2045 | 2050 | |
|---|---|---|---|---|---|---|---|
| At Soc | 5600 | 5500 | 5000 | 4600 | 4500 | 4500 | 4600 |
| Met Soc | 5600 | 5300 | 4700 | 4200 | 3900 | 3700 | 3500 |
| SP Soc | 5700 | 5300 | 4600 | 4000 | 3600 | 3400 | 3300 |
| SL Soc | 5700 | 5200 | 4500 | 3800 | 3300 | 3000 | 2800 |
Between 2020 and 2050, total final energy use falls by 45% in the slow lane society and by 18% in the atomised society. It is notable that demand reductions in the atomised society level off around 2035 and energy demand increases slowly after 2045, as efficiency improvements begin to be offset by increases in demand (particularly due to reshoring of manufacturing). The self-preservation and metropolitan societies show similar levels of demand reduction overall, but for different reasons: the metropolitan society has higher demands (largely due to economic growth), offset by greater efficiency improvements.
While it would be useful to be able to attribute differences in final energy demands between the scenarios to specific sectoral levers, the complex interactions between levers within UKTM mean that it is not possible to trace this detail through to the final result. As an alternative, we present a disaggregation by sector of how efficiency changes (for example, home insulation or more fuel-efficient vehicles) interact with changes in activity or outputs (such as distance travelled, or the quantity of goods manufactured) to produce a net change in energy use. This is shown in Figure 24. While it is only feasible to carry out this analysis for energy use, is important to note that total energy use and the costs of meeting net zero are correlated, so the biggest energy reductions shown below will typically correspond to the biggest cost savings.
Figure 24. Decomposition of energy demand changes (2020-2050) by sector for the four net zero society scenarios

The content of this figure is provided in the report in an accessible format.
Figure 24 data
| Sector activity | Efficiency | Net energy change | ||
|---|---|---|---|---|
| Buildings- domestic | AT Soc | 5.40% | -18.00% | -12.00% |
| Buildings- domestic | Met Soc | -37.00% | -7.70% | -45.00% |
| Buildings- domestic | SP Soc | -4.10% | -22.00% | -26.00% |
| Buildings- domestic | SL Soc | -9.60% | -33.00% | -43.00% |
| Buildings- commercial | AT Soc | 3.80% | -38.00% | -34.00% |
| Buildings- commercial | Met Soc | 41.00% | -50.00% | -8.70% |
| Buildings- commercial | SP Soc | 3.70% | -39.00% | -35.00% |
| Buildings- commercial | SL Soc | 19.00% | -48.00% | -29.00% |
| Transport | At Soc | 50.00% | -79.00% | -29.00% |
| Transport | Met Soc | 23.00% | -65.00% | -42.00% |
| Transport | SP Soc | 17.00% | -67.00% | -50.00% |
| Transport | SL Soc | 2.00% | -56.00% | -54.00% |
| Work and industry | At Soc | 25.00% | -4.70% | 20.00% |
| Work and industry | Met Soc | -4.10% | -24.00% | -28.00% |
| Work and industry | SP Soc | -22.00% | -16.00% | -39.00% |
| Work and industry | SL Soc | -40.00% | -11.00% | -51.00% |
Key insights include:
- The built environment: Heat pump and insulation rollouts in all scenarios provide significant efficiency improvements. In the buildings sector, activity is a combination of average temperatures and floorspace, as well as use of electrical devices. The atomised society sees the largest output increase overall, but the lowest for commercial buildings largely due to high levels of home working. Conversely, the metropolitan society sees relatively high increases in heating demand in commercial buildings, as office-based working sees a resurgence, but a large decrease in residential heating demand due to a higher proportion of people living in flats and other dwellings with lower floorspace.
- Travel and transport: All scenarios see large efficiency improvements, mainly from the rollout of electric vehicles. In the transport sector, changes in activity are essentially changes in distance travelled. All scenarios see increases in distance travelled, but the increase varies significantly. The increase in the slow lane society is primarily due to population growth, with distance travelled per person falling due to people working and conducting leisure activities closer to home. The large increase in the atomised society is due to increased long-distance travel caused by an uptake of CAVs and a rise in foreign holidays.
- Work and industry: The atomised society is the only scenario that sees increases in output, due to high GDP and household income growth, and reshoring of manufacturing. The metropolitan society sees the most substantial efficiency gains, enabled by high levels of research and development investment, but also small net output reductions as circular economy measures offset demands driven by GDP and household income growth. Energy use reductions in the slow lane and self-preservation societies are largely driven by reductions in output due to lower economic growth in both cases, and also thanks to circular economy measures in the slow lane society.
To illustrate which changes make the biggest difference between the scenarios, we focus here on the atomised and slow lane societies as these are the scenarios with the highest and lowest energy demands overall. Table 8 shows the difference between these two scenarios in activity-based change, efficiency-based change and total energy change (activity-based and efficiency-based combined) for each sector. It also shows the percentage each sector contributes to the overall difference in energy change between the atomised and slow lane societies.
Table 8. Differences in the 2020–2050 energy demand changes in the atomised vs slow lane societies. A negative number indicates a larger reduction in energy use from 2020 to 2050 in the slow lane society compared to the atomised society
| Sector | Activity-based energy change, PJ | Efficiency-based energy change, PJ | Total energy change, PJ | Share of total, % |
|---|---|---|---|---|
| Industry | -553 | -57 | -610 | 37% |
| Domestic buildings | -293 | -300 | -593 | 36% |
| Transport | -892 | 433 | -459 | 28% |
| Commercial buildings | 122 | -99 | 23 | -1% |
| Food and land use | -26 | 19 | -7 | 0% |
The industry sector makes the biggest overall difference, as reshoring in the atomised society increases energy demand. Circular economy measures in the slow lane society have the opposite effect. This is reflected in large differences in activity levels as opposed to efficiency within this sector.
Domestic buildings are the sector with the second largest difference overall between the two scenarios, driven by extensive use of hydrogen boilers in the atomised society as opposed to much more efficient heat pumps in the slow lane society.
The transport sector shows the biggest difference in activity levels between the two scenarios. However, this difference is offset by the atomised society benefitting from more efficient vehicles.
Finally, differences in the food and land use sector are low in terms of energy use but large in terms of emissions (see emissions section above). In the atomised society, this sector has high residual emissions, largely due to livestock production to match high meat demand. By contrast, in the slow lane society, the food and land use sector has net negative emissions, due to low meat consumption and extensive tree-planting.
Energy mix by scenario
Figure 25. Total final energy use by energy source in 2020–2050 (Petajoules/year) for the four net zero society scenarios

The content of this figure is provided in the report in an accessible format.
Figure 25 data: Total final energy consumption, PJ/year
| Gas | Coal | Oil | Non-energy use | Syn. kerosene | Ammonia | Wastes | Solar | Hydrogen | Biogas | Biofuels | Bioenergy | Electricity | Heat | ||
|---|---|---|---|---|---|---|---|---|---|---|---|---|---|---|---|
| At Soc | 2020 | 2200 | 200 | 2000 | 110 | 0 | 0 | 66 | 0.88 | <0.01 | 49 | 1.8 | <0.01 | 1000 | 50 |
| At Soc | 2030 | 2000 | 93 | 1200 | 110 | 15 | 8 | 53 | 7.5 | 59 | 62 | 28 | 57 | 1300 | 80 |
| At Soc | 2040 | 670 | 73 | 400 | 99 | 67 | 37 | 52 | 27 | 690 | 69 | 23 | 53 | 2100 | 110 |
| At Soc | 2050 | 4.8 | 48 | 130 | 100 | 190 | 110 | 5.5 | 26 | 1700 | 27 | 13 | 9.5 | 2100 | 110 |
| Met Soc | 2020 | 2200 | 210 | 2000 | 110 | 0 | 0 | 64 | 0 | <0.01 | 48 | 1.8 | <0.01 | 1000 | 79 |
| Met Soc | 2030 | 1600 | 170 | 1300 | 97 | 8.5 | <0.01 | 67 | 0 | 2.6 | 57 | 35 | 38 | 1100 | 260 |
| Met Soc | 2040 | 1000 | 64 | 450 | 74 | 61 | <0.01 | 43 | <0.01 | 65 | 64 | 100 | 110 | 1400 | 460 |
| Met Soc | 2050 | 410 | 40 | 170 | 58 | 160 | <0.01 | 65 | <0.01 | 400 | 65 | 98 | 83 | 1600 | 500 |
| SP Soc | 2020 | 2100 | 200 | 2000 | 110 | 0 | 0 | 69 | 0.69 | <0.01 | 48 | 1.8 | <0.01 | 1000 | 51 |
| SP Soc | 2030 | 1700 | 170 | 1300 | 90 | 0 | 4.4 | 72 | 5.5 | 5.6 | 61 | 46 | 30 | 1100 | 75 |
| SP Soc | 2040 | 700 | 55 | 360 | 61 | 42 | 27 | 51 | 27 | 110 | 60 | 140 | 84 | 2100 | 110 |
| SP Soc | 2050 | 68 | 48 | 1.5 | 50 | 240 | 86 | 54 | 45 | 240 | 78 | 44 | 23 | 2500 | 110 |
| SL Soc | 2020 | 2200 | 210 | 2000 | 110 | 0 | 0 | 65 | <0.01 | <0.01 | 48 | 1.8 | <0.01 | 1000 | 93 |
| SL Soc | 2030 | 1700 | 150 | 1300 | 84 | <0.01 | <0.01 | 55 | 0.038 | 6.6 | 56 | 40 | 39 | 950 | 270 |
| SL Soc | 2040 | 890 | 40 | 410 | 52 | 26 | <0.01 | 36 | 0.69 | 68 | 65 | 170 | 140 | 1200 | 560 |
| SL Soc | 2050 | 180 | 36 | 230 | 34 | 65 | <0.01 | 63 | 12 | 190 | 66 | 120 | 140 | 1400 | 570 |
All scenarios see the use of fossil fuels fall away by 2050, but the low carbon energy sources used vary by scenario, particularly for home heating. High levels of hydrogen use in the atomised society is driven by relatively widespread use of hydrogen boilers, as in this scenario wealthier households in older houses were willing to pay more for heating costs to avoid the disruption of switching to a heat pump. Heat energy is used in the district heating systems that see widespread deployment in urban areas in the slow lane and metropolitan societies. More electricity is used in the self-preservation society, because electric boiler systems are used in some cases due to lower levels of heat pump availability and demand in this scenario.
Biofuel and bioenergy use varies across the scenarios. In the atomised and self-preservation societies, this drops significantly towards 2050 as these scenarios have less land available due to more livestock-focussed farming practices. These scenarios use synthetic kerosene in aviation, instead of biofuels, although it is worth noting this is an unproven net zero technology.
Carbon capture and storage
This section covers engineered carbon negative removals (such as BECCS and DAC), land-based solutions, as well as fossil CCS where total emissions from power and industry are significantly reduced by capturing and storing exhaust CO2.
Figure 26. Carbon dioxide sequestration by technology in 2020–2050 (MtCO2/year) for the four net zero society scenarios

The content of this figure is provided in the report in an accessible format.
Figure 26 data
Engineered removals, MtCO2/year
| Direct Air Capture (addition) | Direct Air Capture (DAC) | BECCS - Power generation | BECCS - H2 production | ||
|---|---|---|---|---|---|
| At Soc | 2020 | 0 | 0 | 0 | >-0.01 |
| At Soc | 2025 | 0 | 0 | >-0.01 | >-0.01 |
| At Soc | 2030 | 0 | >-0.01 | >-0.01 | >-0.01 |
| At Soc | 2035 | 0 | -0.76 | -3.9 | -2.9 |
| At Soc | 2040 | -1.9 | -7.8 | -3.9 | -5.8 |
| At Soc | 2045 | -11 | -14 | -3.9 | -9.7 |
| At Soc | 2050 | -45 | -18 | -2.4 | -13 |
| Met Soc | 2020 | 0 | 0 | 0 | >-0.01 |
| Met Soc | 2025 | 0 | >-0.01 | >-0.01 | >-0.01 |
| Met Soc | 2030 | 0 | -0.06 | >-0.01 | >-0.01 |
| Met Soc | 2035 | >-0.01 | -0.18 | -0.69 | -6 |
| Met Soc | 2040 | >-0.01 | -3 | -11 | -12 |
| Met Soc | 2045 | >-0.01 | -23 | -11 | -23 |
| Met Soc | 2050 | >-0.01 | -29 | -11 | -40 |
| SP Soc | 2020 | 0 | 0 | 0 | >-0.01 |
| SP Soc | 2025 | 0 | 0 | >-0.01 | >-0.01 |
| SP Soc | 2030 | 0 | 0 | >-0.01 | >-0.01 |
| SP Soc | 2035 | 0 | 0 | >-0.01 | >-0.01 |
| SP Soc | 2040 | -2 | 0 | >-0.01 | >-0.01 |
| SP Soc | 2045 | -11 | 0 | >-0.01 | -11 |
| SP Soc | 2050 | -46 | 0 | >-0.01 | -13 |
| SL Soc | 2020 | 0 | 0 | 0 | >-0.01 |
| SL Soc | 2025 | 0 | 0 | >-0.01 | >-0.01 |
| SL Soc | 2030 | 0 | 0 | >-0.01 | >-0.01 |
| SL Soc | 2035 | 0 | 0 | >-0.01 | >-0.01 |
| SL Soc | 2040 | 0 | 0 | >-0.01 | -0.14 |
| SL Soc | 2045 | 0 | 0 | -9 | -8.8 |
| SL Soc | 2050 | 0 | 0 | -26 | -19 |
Fossil CCS, MtCO2/year
| Fossil CCS - Power generation | Fossil CCS - H2 production | Fossil CCS - Industry | ||
|---|---|---|---|---|
| At Soc | 2020 | >-0.01 | >-0.01 | >-0.01 |
| At Soc | 2025 | >-0.01 | >-0.01 | -0.37 |
| At Soc | 2030 | >-0.01 | -3.7 | -1.3 |
| At Soc | 2035 | -2.5 | -9.9 | -3.7 |
| At Soc | 2040 | -2.5 | -24 | -7.4 |
| At Soc | 2045 | -1.6 | -51 | -11 |
| At Soc | 2050 | -3.5 | -71 | -10 |
| Met Soc | 2020 | >-0.01 | >-0.01 | >-0.01 |
| Met Soc | 2025 | >-0.01 | -0.11 | -0.49 |
| Met Soc | 2030 | >-0.01 | -0.11 | -2.4 |
| Met Soc | 2035 | -0.11 | -0.038 | -5.1 |
| Met Soc | 2040 | -1.6 | -0.038 | -8.3 |
| Met Soc | 2045 | -1.4 | -2.7 | -8.5 |
| Met Soc | 2050 | -2 | -4.6 | -7.1 |
| SP Soc | 2020 | >-0.01 | >-0.01 | >-0.01 |
| SP Soc | 2025 | >-0.01 | >-0.01 | >-0.01 |
| SP Soc | 2030 | >-0.01 | >-0.01 | -0.27 |
| SP Soc | 2035 | -0.11 | >-0.01 | -0.79 |
| SP Soc | 2040 | -0.11 | -0.72 | -2 |
| SP Soc | 2045 | -1.4 | -0.24 | -4.3 |
| SP Soc | 2050 | -0.11 | -0.24 | -5.8 |
| SL Soc | 2020 | >-0.01 | >-0.01 | >-0.01 |
| SL Soc | 2025 | >-0.01 | >-0.01 | >-0.01 |
| SL Soc | 2030 | >-0.01 | >-0.01 | >-0.01 |
| SL Soc | 2035 | -0.11 | >-0.01 | -0.47 |
| SL Soc | 2040 | -0.11 | -1.8 | -1.5 |
| SL Soc | 2045 | -0.2 | -2 | -3.7 |
| SL Soc | 2050 | -0.11 | -0.67 | -5.5 |
Land-based removals, MtCO2/year
| Soil sequestration | Energy forestry | Afforestation | ||
|---|---|---|---|---|
| At Soc | 2020 | -0.74 | -0.2 | -0.037 |
| At Soc | 2025 | -1.6 | -0.9 | -0.5 |
| At Soc | 2030 | -2.5 | -1.2 | -1.3 |
| At Soc | 2035 | -3 | -1.2 | -2 |
| At Soc | 2040 | -3.3 | -1.2 | -2.6 |
| At Soc | 2045 | -3.5 | -1.4 | -3 |
| At Soc | 2050 | -3.8 | -1.5 | -3.1 |
| Met Soc | 2020 | -0.74 | -0.12 | -0.037 |
| Met Soc | 2025 | -1.6 | -2.5 | -0.64 |
| Met Soc | 2030 | -2.5 | -6.2 | -3.2 |
| Met Soc | 2035 | -3 | -8.5 | -6.9 |
| Met Soc | 2040 | -3.3 | -8.8 | -10 |
| Met Soc | 2045 | -3.5 | -8.6 | -14 |
| Met Soc | 2050 | -3.8 | -8.4 | -18 |
| SP Soc | 2020 | -0.74 | -0.2 | -0.037 |
| SP Soc | 2025 | -1.6 | -2.5 | -0.57 |
| SP Soc | 2030 | -2.5 | -3.7 | -2.2 |
| SP Soc | 2035 | -3 | -4.2 | -4.5 |
| SP Soc | 2040 | -3.3 | -4.2 | -6.6 |
| SP Soc | 2045 | -3.5 | -4.4 | -8.8 |
| SP Soc | 2050 | -3.8 | -5.3 | -11 |
| SL Soc | 2020 | -0.67 | 0 | -0.037 |
| SL Soc | 2025 | -1.5 | 0.0017 | -0.71 |
| SL Soc | 2030 | -2.2 | -6.7 | -4.1 |
| SL Soc | 2035 | -3 | -12 | -9.4 |
| SL Soc | 2040 | -3.3 | -13 | -14 |
| SL Soc | 2045 | -3.5 | -12 | -19 |
| SL Soc | 2050 | -3.8 | -12 | -25 |
There are large differences between the four scenarios in both the means of capturing carbon dioxide, as well as the amounts captured (Figure 26). These depend on the size of the energy system, level of technological development, and availability of land for carbon sequestration.
One important feature of Figure 26 is the ‘direct air capture (addition)’ category, which was used as a backstop technology to meet net zero after all of the plausible measures had been used up. For example, in the atomised society, it was assumed that -18MtCO2 would plausibly be available by 2050 in this scenario, but to meet net zero a further -45MtCO2 (more than 200% extra) was found to be required. A similar level of additional DAC is required in the self-preservation society and, given the low levels of technology development in this scenario, this would likely be extremely challenging to deliver. This is an illustration of how challenging it would be to meet net zero in these scenarios.
The largest amount of carbon removed through engineering in 2050 is in the atomised society, followed by the metropolitan society. Land-based carbon removal is most dominant in the slow lane society, and in the metropolitan society.
There is little land available for bioenergy and afforestation in the atomised society, a scenario that also has higher energy demand than the other scenarios. For these reasons, the atomised society sees rapid deployment of hydrogen produced from fossil fuels and direct air capture (DAC). Additionally, as the energy use by the industry sector in the atomised society stays high, this scenario relies heavily on CCS, which is almost twice the amount of industry CCS in the slow lane and self-preservation societies.
The metropolitan society also uses significant amounts of DAC, but the key engineered removal solution in this scenario is bioenergy with carbon capture and storage (BECCS) for hydrogen production, accounting for around 40% of the scenario’s CO2 sequestration in 2050. The metropolitan society also benefits from an extensive tree-planting programme, compared to the atomised society.
The slow lane society does not have the option of using DAC, because of lower levels of technological development. There is significant land capacity for reforestation but questions remain about how this would be paid for in a low-growth world. The self-preservation society, where carbon removals are barely feasible technologically and come in just before 2050 in an attempt to meet net zero, uses a more even mix of engineered removals and land-based removals, compared to the atomised and metropolitan societies.
While the scenarios have 2050 as their endpoint, huge amounts of carbon would have to be captured annually after 2050 and stored indefinitely, unless energy demand is reduced and the energy system is decarbonised through other measures. The risk of relying on unproven technology (such as DAC) is significant given the possibility of unforeseen technical barriers. For technologies with a slightly more certain outlook (such as CCS), there remains a risk of associated high costs and energy use, even in 2050.
In the meantime, excessive focus on such uncertain technologies might crowd out progress on emission reductions that can be achieved in the short term with more confidence. This is discussed in more detail in Section 4.4.
Land use
Many of the measures required to meet net zero will need a significant amount of land, including for renewable electricity infrastructure, bioenergy crops, and afforestation. Land is a finite resource and there is competition for this resource from other activities (such as agriculture and housebuilding). Building energy infrastructure also requires a planning process, which can be time consuming and subject to challenge (including from local residents). The more land needed for infrastructure, the less land is available for other uses and the bigger the risk of planning-related delays and challenges. Therefore, policy makers may wish to consider the overall amount of land required for measures to meet net zero in different future scenarios.
Policy makers may also wish to consider the exact land-use mix involved in future scenarios. Some uses may have wider benefits (such as afforestation for biodiversity). This section provides illustrative, high-level estimates of the amount of land taken up by different uses in each scenario and sets out the likely implications.
Table 9 shows the land taken up by agriculture, bioenergy crops and afforestation in each scenario in 2050, as a percentage of the total UK land area. For comparison, the percentage of UK land used for agriculture in 2022 is 71%.
Table 9. Area taken up by agriculture, bioenergy crops and afforestation as a percentage of UK land in 2050
| Area taken up as a percentage of UK land area in 2050 | Atomised | Metropolitan | Self-preservation | Slow lane |
|---|---|---|---|---|
| Agriculture | 82% | 73% | 79% | 66% |
| Bioenergy crops | 0% | 6% | 2% | 6% |
| Afforestation | 1% | 6% | 3% | 9% |
| Total* | 83% | 84% | 84% | 80% |
*Constituent components appearing not to sum to totals is a result of rounding
Table 10 shows the land taken up by the main onshore and offshore renewable energy sources in each scenario in 2050 , as a percentage of the total UK land area. This is shown separately to the other land uses above, as they can be combined (for example, onshore wind can be used alongside crops or livestock). Offshore infrastructure does not compete for land used for other purposes (such as agriculture or housing), but there is a finite amount of space in the waters around the UK, and there are some environmental impacts from building infrastructure offshore, so it is important to consider the quantity required. Offshore surface area requirements are given as a percentage of UK land mass for ease of comparison.
Table 10. Area taken up by key renewable electricity capacity as a percentage of UK land in 2050
| Area taken up by renewables as a percentage of UK land area in 2050 | Atomised | Metropolitan | Self-preservation | Slow lane |
|---|---|---|---|---|
| Onshore wind and solar | 3% | 2% | 5% | 2% |
| Offshore wind | 8% | 4% | 5% | 2% |
In all the scenarios modelled, at least 2% of land is required for renewable electricity. This outcome could be avoided by, for example, increasing the amount of nuclear generation (noting this could also come with planning or delivery challenges). As noted above, land-uses can also be combined (for example, rooftop solar or crops alongside wind turbines).
The atomised society sees the highest overall agricultural land use due to high levels of meat consumption, which limits the land available for bioenergy crops and afforestation. Relatively high amounts of land are needed for onshore electricity generation, although this could be combined with the agricultural land use. The most significant energy-related impacts are for offshore wind, needed to meet the comparatively high energy demands in this scenario, requiring an area offshore equivalent to 8% of the UK’s land area.
The metropolitan society has comparatively low levels of agricultural land use due to lower meat consumption, which means bioenergy crops and afforestation can take up relatively more space. Low levels of onshore electricity capacity are needed, with the electricity demands driven by higher economic growth in this scenario met by relatively high levels of offshore wind.
The self-preservation society sees the highest onshore electricity capacity because it has a relatively high energy demand, but without the technological progress to roll out offshore wind to the levels seen in the atomised and metropolitan societies. This scenario also has the second highest agricultural land use due to high levels of meat consumption.
The slow lane society has the lowest overall land related to meet net zero due to its low energy use and meat consumption. This results in there being more land available for other purposes (such as for leisure or ecotourism uses).
Overall, the high level of land and offshore space required in the atomised and self-preservation societies is likely to create heightened delivery challenges in those scenarios. It is not possible to infer the value of having higher quantity of land available for other purposes (such as in the slow lane society). This is because it would depend on how this land was used (for example, whether it was used to generate revenue and/or improve wellbeing).
System costs
System costs cover all investment and operational expenditure associated with the energy system, including infrastructure, fuel, and other operating costs. Such costs are covered by a combination of private investment from energy companies, energy bills paid by consumers, and government funding.
Figure 27 presents the system costs in each scenario via two comparisons:
- as a percentage of GDP (which varies by scenario), reflecting the fact that higher costs are more affordable to a society with higher real incomes and associated tax revenue; and also
- relative to the system costs in a baseline scenario in which net zero is not met , recognising that building, maintaining, and running an energy system will always represent a significant national expenditure.
The baseline scenario used here is the same as for the government’s net zero strategy and only includes government policies which had been implemented, adopted, or planned as of August 2019. These policies are all assumed to be implemented as planned, but it is acknowledged in the net zero strategy that they are not sufficient to meet net zero. There are also differences in the macro-economic assumptions in this baseline and our scenarios, not least because the baseline scenario uses GDP growth assumptions from the OBR’s March 2020 economic and fiscal outlook. This means that it is necessary to compare the relative, rather than absolute, future cost changes. Nevertheless, this analysis does allow an illustrative comparison of the costs in each scenario, relative to an established baseline.
Figure 27. Annual system costs (2019 prices, undiscounted) as a percentage of GDP for the four net zero society scenarios, relative to those in the baseline scenario (expressed as a percentage point difference)

The content of this figure is provided in the report in an accessible format.
Figure 27 data: Annual energy system cost as a percentage of GDP, relative to baseline scenario
| The atomised society | The metropolitan society | The self-preservation society | The slow lane society | |
|---|---|---|---|---|
| 2019 | -0.0055 | -0.0055 | -0.0055 | -0.0055 |
| 2020 | -0.0084 | -0.0083 | -0.0084 | -0.0086 |
| 2021 | -0.0046 | -0.0059 | -0.0053 | -0.0072 |
| 2022 | -0.0026 | -0.0047 | -0.0028 | -0.0058 |
| 2023 | -0.0016 | -0.0042 | -0.00059 | -0.0044 |
| 2024 | -0.0014 | -0.0044 | 0.0011 | -0.0034 |
| 2025 | -0.0014 | -0.0047 | 0.0027 | -0.0025 |
| 2026 | -0.0019 | -0.0058 | 0.0033 | -0.0031 |
| 2027 | -0.0027 | -0.0071 | 0.0035 | -0.0041 |
| 2028 | -0.0036 | -0.0084 | 0.0037 | -0.005 |
| 2029 | -0.0044 | -0.0097 | 0.0039 | -0.0059 |
| 2030 | -0.0052 | -0.011 | 0.0041 | -0.0067 |
| 2031 | -0.0028 | -0.0099 | 0.0067 | -0.0049 |
| 2032 | -0.00058 | -0.009 | 0.0093 | -0.0031 |
| 2033 | 0.0015 | -0.0082 | 0.012 | -0.0013 |
| 2034 | 0.0034 | -0.0074 | 0.014 | 0.00043 |
| 2035 | 0.0052 | -0.0066 | 0.017 | 0.0022 |
| 2036 | 0.0031 | -0.0089 | 0.016 | 0.0014 |
| 2037 | 0.0011 | -0.011 | 0.016 | 0.00076 |
| 2038 | -0.00078 | -0.013 | 0.015 | 0.00021 |
| 2039 | -0.0026 | -0.015 | 0.015 | -0.00028 |
| 2040 | -0.0044 | -0.017 | 0.015 | -0.00073 |
| 2041 | -0.0044 | -0.017 | 0.016 | -0.00016 |
| 2042 | -0.0044 | -0.018 | 0.016 | 0.00044 |
| 2043 | -0.0045 | -0.018 | 0.017 | 0.001 |
| 2044 | -0.0046 | -0.019 | 0.018 | 0.0017 |
| 2045 | -0.0047 | -0.02 | 0.019 | 0.0023 |
| 2046 | -0.0033 | -0.02 | 0.024 | 0.0034 |
| 2047 | -0.002 | -0.02 | 0.03 | 0.0044 |
| 2048 | -0.0008 | -0.02 | 0.035 | 0.0055 |
| 2049 | 0.00031 | -0.02 | 0.041 | 0.0066 |
| 2050 | 0.0013 | -0.02 | 0.046 | 0.0077 |
Meeting net zero is found to be most affordable in the metropolitan society, where 2050 system costs as a percentage of GDP are 2 percentage point lower than in the baseline scenario, in other words more affordable than not meeting net zero. Energy demand and economic growth have been decoupled most significantly in this scenario, so even though the metropolitan society needs a larger energy system than the slow lane society, the higher GDP makes this more affordable.
Meeting net zero is also affordable in the slow lane and atomised societies, at only 0–1% above the baseline scenario in 2050. In the slow lane society this is because societal changes have led to lower levels of energy demand. In the atomised society this is because higher GDP helps to pay for the high levels of technology adoption and infrastructure needed to meet net zero in this scenario. In contrast, the self-preservation society has neither the societal changes to reduce demand, nor the technological innovation and economic resources to pay for it. As a result, the 2050 system costs are 5% higher than the baseline scenario.
It is also useful to compare the system costs in each scenario to one another in 2050:
- The highest cost scenario (self-preservation) is about 7% of GDP costlier than the lowest cost scenario (metropolitan), due to the significant differences in energy demand and how the net zero target is met between these scenarios.
- The atomised and metropolitan societies have a similar economic growth trajectory, so the main differences between them relate to how society is organised and what this means for energy efficiency and demand. The metropolitan society has a cost around 2% of GDP lower than the atomised society, as energy demand is reduced through measures like the circular economy and greater use of active travel and public transport.
- In absolute terms, the metropolitan society has a 20% higher system cost compared to the slow lane society, largely due to higher energy demands driven by economic growth. But when expressed as a percentage of GDP, the metropolitan society has a system cost about 3 percentage points lower than the slow lane society, meaning that meeting net zero will likely be more affordable in this higher growth scenario.
It is important to acknowledge some limitations of this analysis of costs. This includes the fact that we have not accounted for potential unit cost reductions for new technologies that could come about more rapidly in scenarios where the UK is leading technologically or where global decarbonisation drives faster innovation. We assume cost reductions over time in all scenarios, but the rates of reduction are likely to be higher in the scenarios with higher levels of technological development (atomised and metropolitan). Given this, we might be understating the affordability of meeting net zero in these scenarios. We have not been able to robustly quantify these differences due to high levels of uncertainty.
Meeting net zero will also likely add to GDP in ways not quantified in this report. Modelling commissioned by the CCC suggests that, driven by net zero, a combination of new capital investment, reduced fossil fuel imports and lower energy prices, could add about 0.1% additional GDP growth per year to 2050.9 However, GDP is an input assumption in our scenarios and, while we have not created a detailed breakdown of what drives the assumed growth in each case, it is plausible that this 0.1% could make up part of the input GDP growth assumptions across all our scenarios.
It should also be acknowledged that a ‘do-nothing’ scenario in which net zero is not met at the global level would lead to more costly impacts from climate change. For example, the LSE’s Grantham Institute estimates that climate change impacts would cost the UK around 3.3% of GDP by 2050 and around 7.4% of GDP by the end of the century. Scenarios with low levels of international trust (self-preservation and atomised) are likely to be at higher risk of missing global net zero and incurring higher adaptation costs.
In addition, some of the health co-benefits associated with some scenarios (see Section 4.3), particularly the slow lane society, could contribute to a reduction in overall costs to society, which again we are not able to quantify due to high levels of uncertainty.
Finally, this analysis has explored energy systems costs in each scenario and their relatively affordability only. We have not considered wider affordability questions, such as those for UK public services, although this is likely to be more challenging in both low-growth scenarios (slow lane and self-preservation).
Net zero strategy comparisons
HM Government’s 2021 net zero strategy included three scenarios for how net zero might be met, mainly focussed on which technologies might be available. Alongside this strategy, some modelling output data were published, including residual emissions by sector in 2050 across these three scenarios. Given that we have used the same energy system model that was used for this strategy (UKTM) we can make a direct comparison between the modelling outputs for the net zero society scenarios and these net zero strategy scenarios. Figure 28 shows the full range, from lowest residual emissions by sector in 2050 to highest, across the two sets of scenarios.
Figure 28. Range of residual emissions by sector in 2050 (lowest to highest) for the net zero strategy scenarios and the four net zero society scenario

The content of this figure is provided in the report in an accessible format.
Figure 28 data: Residual emissions, MtCO2e/year
| NZ strategy range | AT Soc | Met Soc | SP Soc | SL Soc | |
|---|---|---|---|---|---|
| Power | 1 — 3 | -3.5 | 0.41 | -0.05 | 0.12 |
| Fuel supply and hydrogen | 3.2 — 7.5 | 5.35 | 6.35 | 1 | 4.85 |
| Work and industry | 3.2 — 10.2 | 6.5 | 17.7 | 11.3 | 6.67 |
| Heat and buildings | 0 — 1.7 | 0 | 10.3 | 0.08 | 6.65 |
| Transport | 22.5 — 41 | 20 | 23 | 14 | 19 |
| Agriculture, land use, waste and F-gases | 26.2 — 33.8 | 50 | 22 | 35 | 7 |
| Greenhouse gas removals | -80.8 — 75.4 | -78.4 | -79.6 | -59.8 | -45.3 |
Key insights from this comparison are covered below. In most cases, explanations for differences are speculative, because the detailed assumptions underpinning the net zero strategy have not been published.
- The net zero strategy and our scenarios all assume the near-complete decarbonisation of the power sector by 2050. As a result, the societal changes we have modelled make very little difference to residual emissions from the power sector. As discussed above, they make a bigger difference to system costs.
- Were some of the changes we’ve modelled to come to pass, residual emissions from industry could be up to 73% higher than assumed in the net zero strategy. This would present a risk to meeting net zero. Changes likely to contribute to that include reshoring of manufacturing and failure to install CCS on industrial plants.
- Similarly, our scenarios suggest residual emissions from heat and buildings could be up to 5 times higher than assumed in the net zero strategy. Changes associated with this include an expansion of non-domestic buildings in the metropolitan society, which are harder to decarbonise.
- The changes to diet and land use assumed in the slow lane society (and to a lesser extent the metropolitan society) suggest residual emissions could be up to 73% lower than assumed in the net zero strategy. Were this to happen, this would create significant flexibility.
- Similar, although less significantly, in our scenarios where there are more significant changes to travel patterns, particularly lower levels of international travel, residual transport emissions are up to 38% lower than assumed in the net zero strategy.
- Taken together, our scenarios suggest the amount of GHG removals needed to meet net zero could be as little as 60% of that assumed in the net zero strategy (in the slow lane society). Less required GHG removals would mean less cost and less reliance on an unproven technology. However, it should be noted that this scenario is not without challenge, particularly in terms of low economic growth and its impacts on affordability. However, it should also be noted that the slow lane society is not the only way to achieve such outcomes, and it may be feasible to reduce reliance on GHG removals through energy demand reduction in a higher growth scenario.
4.3 Wider analysis and co-benefits
We explored a range of impacts resulting from the four scenario models, which are explored in greater detail in Annex 5. Below we discuss what the wider analysis shows in three areas: air quality, healthy life expectancy and energy equality.
There are many co-benefits relating to the transition to net zero, depending on the policies chosen to underpin the reducing emissions. These possible co-benefits include increased energy security, improved public health, and better water/air quality. Analysis suggests that the scenarios where societal changes have reduced demand have the greatest number of possible co-benefits, while the atomised society has the least.
Air quality
Air pollution is associated with burning a range of fuels. Here we focus on pollution from fossil-fuelled vehicles as the most significant source that the public are exposed to and will also be affected by achieving net zero. It should be noted that there are other significant sources that can affect public health, such as wood-burning stoves, but these have not been considered in the scenarios. Due to the focus on transport in this analysis, and the fact it uses national average values, it is not possible to say definitively whether any of the scenarios meet the UK’s air pollution targets, which are defined at a local level. Nevertheless, it is likely that the large reductions in roadside air pollution from meeting net zero would make a significant contribution to meeting these targets.
The main levers that drive pollution from vehicles are travel demand, the uptake of electric vehicles, road traffic speeds, and the location of emissions. Here we estimate changes in air pollution without translating them into impacts on morbidity and mortality. However, health benefits of reduced air pollution are well documented. For example, the Air Quality Life Index 2022 update estimates that 2.2 years would be added to global average life expectancy if the World Health Organisation’s new stringent targets on particulate matter were met.
Air pollution comes from direct emissions (from exhaust or particles from tyres/brakes wearing down) and from indirect emissions (from fuel production and vehicle production, maintenance and disposal). Direct Nitrogen Oxides (NOX) emissions (Figure 29, top) show downward trends for all four scenarios, largely due to lower emission plug-in vehicles replacing older, more polluting ones.
Even by 2030, direct NOX emissions from road transport would be expected to be half of those in 2019. In the longer term, direct NOX emissions are lowest in the atomised society due to higher rates of vehicle turnover and accelerated switch to EVs. However, once indirect emissions from fuel production as well as vehicle production, maintenance and end-of-life are considered, the atomised society has the highest NOX emissions out of the four scenarios modelled here, with total lifecycle NOX persisting at high levels into the 2050s (Figure 29, bottom).
While these high levels of indirect emissions counterbalance any benefits from direct emissions in the atomised society, a significant share of the vehicle and fuel lifecycle NOX emissions is emitted outside the UK, which is not considered in this analysis. In contrast, total lifecycle NOX emissions decrease furthest in the slow lane society as there are fewer vehicles and they are travelling fewer miles. Both the slow lane and metropolitan societies may have issues with higher NOX from motorcycles in urban areas, given relatively low electrification rates.
Figure 29. Direct NOX (top) and lifecycle NOX (bottom) emissions from all road transport (cars, vans, HGV, buses and coaches, motorcycles) in 2019 and for the four net zero society scenarios in 2030, 2040 and 2050

The content of this figure is provided in the report in an accessible format.
Figure 29 graph 1 data: NOx emissions, tonnes/year
| Car | Bus and coach | Vans | HGV | Motorcycle | ||
|---|---|---|---|---|---|---|
| 2019 | 58000 | 6600 | 15000 | 18000 | 1300 | |
| At Soc | 2030 | 22000 | 3900 | 7000 | 11000 | 1100 |
| At Soc | 2040 | 1100 | 1400 | 570 | 11000 | 1100 |
| At Soc | 2050 | 0 | 160 | 0 | 7300 | 1300 |
| Met Soc | 2030 | 17000 | 6500 | 7700 | 10000 | 3400 |
| Met Soc | 2040 | 1600 | 2300 | 3600 | 9300 | 3300 |
| Met Soc | 2050 | 2 | 380 | 61 | 4200 | 4000 |
| SP Soc | 2030 | 29000 | 4600 | 7700 | 10000 | 2500 |
| SP Soc | 2040 | 8200 | 2700 | 3800 | 9200 | 2800 |
| SP Soc | 2050 | 310 | 1400 | 140 | 6900 | 3700 |
| SL Soc | 2030 | 15000 | 9500 | 7000 | 9100 | 5500 |
| SL Soc | 2040 | 4900 | 5900 | 4500 | 7100 | 4700 |
| SL Soc | 2050 | 680 | 990 | 700 | 3400 | 5200 |

The content of this figure is provided in the report in an accessible format.
Figure 29 graph 2 data: NOx emissions, tonnes/year
| Car | Bus and coach | Vans | HGV | Motorcycle | ||
|---|---|---|---|---|---|---|
| 2019 | 150000 | 8800 | 29000 | 33000 | 1600 | |
| At Soc | 2030 | 110000 | 5800 | 25000 | 28000 | 1700 |
| At Soc | 2040 | 90000 | 2800 | 20000 | 39000 | 1600 |
| At Soc | 2050 | 85000 | 1100 | 19000 | 45000 | 1900 |
| Met Soc | 2030 | 90000 | 11000 | 23000 | 26000 | 4900 |
| Met Soc | 2040 | 57000 | 5900 | 18000 | 29000 | 4900 |
| Met Soc | 2050 | 48000 | 3200 | 13000 | 29000 | 5800 |
| SP Soc | 2030 | 110000 | 7000 | 22000 | 25000 | 3500 |
| SP Soc | 2040 | 67000 | 4700 | 17000 | 30000 | 4100 |
| SP Soc | 2050 | 51000 | 3100 | 11000 | 32000 | 5200 |
| SL Soc | 2030 | 62000 | 15000 | 20000 | 23000 | 7700 |
| SL Soc | 2040 | 37000 | 10000 | 15000 | 21000 | 6600 |
| SL Soc | 2050 | 29000 | 3900 | 9200 | 19000 | 7300 |
Ultra-fine particulate matter (PM2.5) stems from both tailpipe and non-tailpipe sources (tyre and brake wear, road abrasion) and is highly toxic to humans. As with NOX, the scenarios explored here would be expected to accelerate reductions in fine particulate matter (PM2.5) emissions in the short to medium term, and significantly reduce them in the long term. As Figure 30 (top) shows, by 2030, direct PM2.5 emissions are about half of the 2019 levels in all scenarios. PM2.5 emissions in 2030 are slightly higher in the slow lane and metropolitan societies, reflecting increased use of buses and express coaches. By 2050, PM2.5 emissions are highest in the self-preservation society, reflecting slower vehicle turnover and transition to zero tailpipe emission buses and HGVs.
Figure 30. Direct PM2.5 (top) and lifecycle PM2.5 (bottom) emissions from all road transport (cars, motorcycles, vans, HGVs, buses, and coaches) in 2019 and for the four net zero society scenarios in 2030, 2040 and 2050

The content of this figure is provided in the report in an accessible format.
Figure 30 data graph 1: Direct PM2.5 emissions, tonnes/year
| Car | Bus and coach | Vans | HGV | Motorcycle | ||
|---|---|---|---|---|---|---|
| 2019 | 1900 | 2700 | 2200 | 12000 | 96 | |
| At Soc | 2030 | 860 | 1700 | 1300 | 6600 | 86 |
| At Soc | 2040 | 45 | 550 | 68 | 4400 | 80 |
| At Soc | 2050 | 0 | 49 | 0 | 630 | 98 |
| Met Soc | 2030 | 700 | 2400 | 1600 | 6300 | 260 |
| Met Soc | 2040 | 75 | 810 | 540 | 4600 | 260 |
| Met Soc | 2050 | 0 | 93 | 7 | 410 | 310 |
| SP Soc | 2030 | 1100 | 1800 | 1500 | 6100 | 190 |
| SP Soc | 2040 | 320 | 1000 | 750 | 3400 | 220 |
| SP Soc | 2050 | 12 | 670 | 25 | 940 | 280 |
| SL Soc | 2030 | 630 | 3100 | 1400 | 5600 | 440 |
| SL Soc | 2040 | 210 | 1800 | 810 | 3500 | 370 |
| SL Soc | 2050 | 28 | 280 | 85 | 510 | 410 |

The content of this figure is provided in the report in an accessible format.
Figure 30 data graph 2: Lifecycle PM2.5 emissions, tonnes/year
| Car | Bus and coach | Vans | HGV | Motorcycle | ||
|---|---|---|---|---|---|---|
| 2019 | 3100 | 2800 | 2400 | 12000 | 100 | |
| At Soc | 2030 | 1800 | 1700 | 1600 | 6900 | 95 |
| At Soc | 2040 | 700 | 570 | 330 | 4700 | 88 |
| At Soc | 2050 | 660 | 58 | 190 | 850 | 110 |
| Met Soc | 2030 | 1500 | 2400 | 1700 | 6500 | 290 |
| Met Soc | 2040 | 490 | 840 | 690 | 4900 | 280 |
| Met Soc | 2050 | 350 | 120 | 140 | 580 | 340 |
| SP Soc | 2030 | 2000 | 1800 | 1700 | 6200 | 210 |
| SP Soc | 2040 | 860 | 1000 | 880 | 3600 | 240 |
| SP Soc | 2050 | 420 | 690 | 130 | 1100 | 310 |
| SL Soc | 2030 | 1200 | 3100 | 1600 | 5700 | 470 |
| SL Soc | 2040 | 510 | 1900 | 940 | 3700 | 400 |
Taken together, air pollution and its adverse impact on health would be lower in all scenarios we modelled. It is minimised in the scenarios where we have assumed higher levels of societal change in the transport sector where number of vehicles and miles travelled are both reduced.
Dietary impacts on healthy life expectancy
This section focuses only on the impacts on healthy life expectancy due to dietary changes, as these were the most readily quantifiable in the food and land use sector model used in this project. Many other changes in the scenarios, including physical activity and funding of healthcare services could also have impacts (as mentioned in the scenario narratives). However, these are less straightforward to quantify and beyond the scope of this work.
All four scenarios have a net positive health impact due to dietary changes, according to our modelling. In both the slow lane and metropolitan societies, we assumed large substitutions of meat and dairy consumption compared to the other two scenarios. As a result, they see the biggest health improvements. Life expectancy gains are largest in slow lane society (36 additional minutes of healthy life expectancy per day of eating that diet). The metropolitan society assumes slightly less significant shifts in diet, mainly due to the higher incomes assumed. As a result, the health benefits are smaller. However, there is no technical reason the higher dietary shift could not be achieved in this scenario. Furthermore, the metropolitan society does not have the public spending and innovation constraints that could offset some of the gain modelled in the slow lane society. Of course, individual results would vary based on personal dietary composition. Between 2019 and 2050, life expectancy increases in the atomised and self-preservation are less than half that seen in the metropolitan society.
Table 11. Life expectancy implications of average diets in 2050 per scenario (in minutes gained per capita per day of consuming the diet)
| Atomised | Metropolitan | Self-preservation | Slow lane | |
|---|---|---|---|---|
| Additional minutes of healthy life from dietary changes (per capita, per day of consumption) | 12 | 25 | 12 | 36 |
4.4 Risk of missing net zero
The scenarios are just four examples of many possible ways in which the future could play out. It is easy to think of other plausible futures that look very similar to our scenarios but are missing a key ingredient required in the modelling to meet net zero. For example, it is possible that efforts to develop commercially viable, carbon neutral aviation fuels are not successful by 2050 in the metropolitan society. Or in the slow lane society, levels of travel could start to increase between 2030 and 2050 due to a societal shift or an uptick in household incomes. Given such risks exist for all scenarios, it is important to consider the extent of contingency measures available in each scenario to be able to adapt and still meet net zero.
The table below provides a qualitative analysis of the most significant risks in each scenario, and the mitigations available. This assessment was undertaken by the GO-Science project team and reviewed by a panel of experts.
| Scenario | Risks of missing net zero | Mitigations if a key net zero ingredient is missing | Overall risk assessment after mitigations |
|---|---|---|---|
| At Soc | Meeting net zero in this scenario is highly dependent on unproven net zero technologies. Meeting the target is therefore vulnerable to unforeseen technical or cost barriers to developing these technologies, although the high levels of investment in research and development in this scenario reduce the likelihood of this happening. Energy demand is already very high in this scenario compared to the other scenarios, but there remains a possibility it could drift higher. | Unproven net zero technologies are already deployed at very high levels in this scenario, so stretching it further would be challenging. If DAC is not available, it would be extremely difficult to find another technology to bridge the emissions gap. There is a prioritisation of individual consumption in this scenario, particularly for people with higher incomes, which might make persuading people to use less energy more difficult than in other scenarios. One mitigation in this scenario could be to take advantage of the societal preference for interacting digitally, helping to reduce travel demand. | Medium |
| Met Soc | This scenario uses unproven net zero technologies, but at lower levels than in the atomised society, so any failure to develop these would leave a smaller emissions gap to bridge. Demand for energy and goods is relatively high in this scenario, and there is a risk this could drift even higher. | Unproven net zero technologies are not deployed at the highest levels, so failure of one of these could be offset by increases in others. As individual sustainable choices aren’t the primary driver of some societal shifts, any efforts to incentivise people to reduce energy use might not be fully successful. However, many of the societal changes are supported by structural and systemic changes (for example, the circular economy and urban infrastructure), which might make them easier to expand to offset underperformance in other areas. | Low |
| SP Soc | This scenario relies on unproven net zero technologies, but the lack of technological development means that cost reductions and delivery challenges are unlikely to have been fully resolved, so the risk of failure is high. Furthermore, people are drawn towards old ways of doing things, so there is a risk that some behavioural changes are slow to be fully rolled out (such as the use of low carbon heating). | This scenario has both limited technology availability and a society that is less amenable to change, so scope for mitigating any unexpected net zero barriers is low. Therefore, the risk of missing net zero is high. | High |
| SL Soc | Unproven net zero technologies are not available at commercial scale in this scenario. The scenario manages to meet net zero without them, because of the more significant societal shifts that support emissions and energy demand reductions. The main risk in this scenario is that one or more of these societal shifts does not fully materialise or reverses. | The lack of technological development in this scenario significantly reduces the scope for mitigating this risk. Society is amenable to making changes for the greater good in this scenario, and further behavioural change is likely to be the main mitigation that could be used to avoid missing net zero. However, society has already undergone significant shifts in this scenario, so there is uncertainty of whether this could be pushed further as a mitigation. | Medium |
4.5 Key messages from modelling
The four scenarios have been designed to highlight different challenges and opportunities to meeting net zero that could arise from societal shifts. None of the scenarios is without its challenges, and they should not be seen as a menu of options. These scenarios provide policy makers with a tool to think about potential societal changes that could present opportunities and risks for meeting net zero, as well as potential co-benefits. Anticipating those changes, deciding which to foster or avoid, which to track and what our contingency might be if they did or did not happen, will make net zero policy more resilient.

The content of this figure is provided in the report in an accessible format.
| Atomised | Metropolitan | Self-preservation | Slow lane | |
|---|---|---|---|---|
| New energy infrastructure needed to meet demand: More land for energy infrastructure will compete with other land uses (such as natural habitats, housing, or agriculture). | High | Medium-high | Medium-high | Low |
| Costs of delivering energy infrastructure, relative to GDP: Increasing costs of delivery will need to be paid for, e.g. through taxation (driven by quantity and unit cost reductions) | Medium-low | Low | High | Medium-low |
| Risks to meeting net zero: If a net zero measure doesn’t work out, how easy is it to reduce emissions in another way? | Medium | Low | High | Medium |
This figure summarises the key findings of our quantitative and qualitative analysis of the implications of each scenario for meeting net zero. This summary shows that all scenarios have some downsides.
For example, the slow lane society requires the least infrastructure but has a relatively high risk of meeting net zero, and the metropolitan society has lower risk, but needs a significant amount of land for energy infrastructure. These scenarios are intended to represent relatively extreme outcomes, and with the right planning, policy makers could have contingency measures in place to minimise the downsides of different societal changes.
Further key messages are summarised below.
- Net zero can be met in all the scenarios we modelled. Even in scenarios where societal changes lead to higher levels of energy demand, there are pathways to net zero. However, these higher demand scenarios rely on extensive use of carbon removal technologies that are yet to be proven at scale, which could be difficult and/or expensive to roll out at the pace required, introducing greater risk to this path to net zero.
- Societal change will affect the future level of demand for energy and goods and what technologies are available. There is around a 65% difference in 2050 energy demand between our scenarios. But exactly how society will change is, of course, uncertain. Many equally plausible scenarios exist, but ours represent some of the key potential changes that governments should be aware of as they plan.
- If societal changes reduce energy demand, meeting net zero could be cheaper than failing to do so. Compared to a baseline scenario, which fails to meet net zero and has limited societal changes, our scenario with higher economic growth and demand-reducing societal changes has 2050 energy system costs that are lower by 2% of GDP. In this scenario, changes to travel patterns and new models for consuming goods reduce energy demand. This in turn reduces the size, complexity and investment needs of the energy system.
- In scenarios where societal changes reduce energy demand, reliance on carbon removal technologies is reduced, less land is needed for infrastructure, and health co-benefits are higher. Scenarios that see lower energy demand and consumption, due to factors such as those outlined in the previous finding, have reduced reliance on direct air capture (DAC) technology to address residual emissions. These scenarios also require less land for energy infrastructure, which could make the energy system easier to deliver and allow the land to be used for other purposes. Significant health benefits could also flow from reduced meat consumption and increased physical activity.
- In contrast, in scenarios where societal changes do little to reduce demand, meeting net zero will be harder to deliver. This is partially due to the need for a larger energy system to be built rapidly to meet the demand. It is also due to the increased reliance on expensive technology such as DAC to compensate for higher energy use and emissions. Such large energy systems can be more affordable in scenarios with stronger economic growth. However, if economic growth is weak then this may mean net zero is less affordable (up to 5% of GDP costlier than the baseline).
- Economic growth and technological innovation are correlated. There is a risk that a low growth, low innovation world would have fewer technological options for meeting net zero. It is possible to meet net zero without further technological breakthroughs. However, without them, the route to net zero would require more significant societal changes, such as bigger reductions in the levels of flying and reduced consumption of meat and dairy. We have not explicitly estimated the potential economic benefits of the UK being a leader in green technology in our analysis. However, this could plausibly further enhance the relative cost reduction in some scenarios.
- Economic growth and energy demand can be further decoupled if other societal changes such as resource efficiency and other ‘circular economy’ measures take place in parallel. Our analysis suggests that meeting net zero in a high economic growth scenario with such societal changes could be around 2% of GDP less costly in 2050 than in a high economic growth scenario without them. All else being equal, economic growth is likely to increase overall energy demand, increasing the size and complexity of the energy system, with associated delivery challenges. With improving economic growth as a consistent government goal, net zero planning should account for how net zero can be met in a world with higher growth.
- High levels of innovation could lead to more rapidly falling unit cost reductions than assumed here. Cost reductions for key net zero technologies could come about more rapidly in scenarios where the UK is leading technologically or where global decarbonisation drives faster innovation. This may be more likely to happen in the scenarios with higher levels of technological development, in which case we might be understating the affordability of meeting net zero in these scenarios.
- The path to net zero will be affected by a wide range of societal factors that could be tracked as part of planning for net zero, including income distribution, sectoral mix in the economy, adoption of digital technologies, the level of urban versus rural living, and levels of cohesion between different social groups. Government will best be able to adapt its approach to net zero — seizing opportunities and mitigating some of the costs — with early signals of the direction of travel. To improve the resilience of its net zero strategy, the government could track these developments and adapt its approach to net zero accordingly.
5. Public dialogue
We held a public dialogue to understand what the public might think about the different future scenarios and the implications for how the UK could reach net zero. Reflections included that individuals would find making sustainable choices more difficult without enabling infrastructure. Participants were also acutely aware of the tensions involved in decision making around net zero, noting that involving the public could ensure trade-offs were better understood and addressed. They also raised cross-cutting themes they believed were important across all the scenarios, as well as their thoughts on each individual scenario.
5.1 Dialogue introduction
What are public dialogues?
Our approach in this report encompasses both a high-level overview of possible societal change (through our reviews and our modelling work) and a close-focus investigation on how individuals might experience societal change in the future. For the latter, we chose to hold a public dialogue. Public dialogues bring members of the public together to deliberate on policy-relevant issues. They are not a new approach for understanding public views on science and technology issues, with the Sciencewise programme having existed to support dialogue since 2004.
Greater public engagement in formal decision making processes has been suggested as a means to improve the acceptability and success of resulting legislation and policies. For example, in its progress report to Parliament on the net zero target, the CCC advocated for greater use of public dialogues in decision making.2 The House of Lords Environment and Climate Change Committee carried out an inquiry exploring the role of behaviour change in meeting climate and environmental goals. The resulting inquiry report suggested that public engagement work could improve the effectiveness of interventions for reaching net zero. The report also called for a public engagement strategy by April 2023 to fill the knowledge gaps around the changes required to meet net zero, and to initiate dialogues with the public to understand which policies can best enable these changes.
What did we want to discuss through this work?
The vast majority of the UK population are concerned about climate change. However, research has shown that the public’s reaction to possible societal changes depends on the perceived impact on their lifestyles, the possible cost implications and the framing.170, There have been various public dialogues on issues relating to net zero. Although some of these were tangentially relevant to our work, we wanted to learn about people’s reactions to the specific scenarios we had developed. To this end, the public dialogue documented here took a different approach to previous work as it immersed participants in four plausible future scenarios where net zero has been reached to understand their reactions to possible future societal changes. The net zero society project team, with support from Sciencewise, commissioned the research company Ipsos to carry out a public dialogue based on the four scenarios laid out above. The aim of the public dialogue was to gather:
- attitudes towards the four scenarios and the underlying values/principles that influenced them,
- feedback on the plausibility of the four scenarios,
- suggestions for the societal changes that could set the UK on a path to the different scenarios, and
- reflections on the perceived tensions presented in the scenarios.
5.2 Dialogue approach
A group of 29 participants from across the UK (Figure 31) took part in the public dialogue. This group was broadly reflective of UK population demographics (including age, income level, geographical location, ethnicity, and gender). The dialogue initially introduced participants to the process and the issues pertinent to the scenarios through a webinar. Following the webinar, participants participated in four three-hour online workshops (workshops 1–4) that each considered an individual scenario. Then they took part in a final three-hour online workshop (workshop 5) where they reflected on all the scenarios. The workshops included the use of various stimuli, including the four rich picture illustrations shown in Chapter 3 and ‘future artefacts’, which are materials that reflect the culture and daily life of an imagined future (see Annex 6 for the full set of artefacts used).
All workshops were recorded and every breakout room had a trained notetaker who made notes during the sessions. The transcripts of the recordings and the notes were then coded and thematically analysed.
The public dialogue results are presented in summary below, as follows:
- Plausibility and pathways, focusing on the aspects of the scenarios that participants felt were least plausible and the changes they believed would be needed between now and 2050 to make the scenario plausible.
- Cross-cutting themes, which were the four key topics that participants consistently raised across all the workshops.
- Reactions to the individual scenarios, including a short reminder of the modelling outputs for each scenario followed by participants’ reactions to each society as a whole and the sectors within it.
- Tensions and trade-offs, which covers the most difficult issues that participants suggested that decision makers working on net zero would need to consider when thinking about future societies.
Figure 31. Locations of participants on a map of the UK (locations in large cities, such as London, represent more than one participant)

Participant locations represented on a map of the UK. A range of locations are shown across the whole of the UK.
5.3 Plausibility and pathways
Most participants were worried about climate change and the risks it posed to current and future society. There were some participants who were sceptical about the possibility of reaching net zero by 2050, with some pointing out specific technological aspects (such as zero carbon flying) that seemed unrealistic to them. Others expressed strong doubts about the lifestyle changes shown in the scenarios, suggesting that the ‘status quo’ would not change in the implied timescales.
Although participants were encouraged in workshops 1–4 to accept the premise of the scenarios even where they might find some aspects implausible, there was an opportunity in workshop 5 to discuss plausibility. Participants often referenced the present day when considering plausibility, suggesting that some scenarios showed either too much or little difference between now and 2050.
When considering the scenarios overall, participants thought that the self-preservation society and the atomised society were the most plausible (often suggesting this was the path that UK society was already on). In other words, participants found the scenarios with lower social cohesion and less dramatic societal changes more plausible. Some suggested that the metropolitan society and the slow lane society were theoretically possible but were more aspirational than realistic.
[The self-preservation society] does seem like it could happen. […]. But also, [the slow lane society] if we’re optimistic, we could get to a place like that. Making do with what we have and not buying so much
Where participants expressed that they did not see a pathway from current society to a future scenario, they were asked what they thought would need to change and why they thought that change was unlikely. Below are the changes that they suggested could take place that would move society onto the pathway to some of the scenarios.
Increased investment
Key message for policy makers: Societal change is somewhat contingent on the infrastructure available to support it (such as accessible public transport and active travel infrastructure). Participants expressed the desire to make changes in their lifestyles but were concerned that this was not plausible without investment in the infrastructure to allow them to do so. Framed in reverse, investment in low carbon infrastructure was seen as a key to unlocking acceptable changes to meet net zero.
What the participants said: For all scenarios, except the self-preservation society, there was a general sense that for them to occur there would need to be significant investment in future technologies to bridge the gap between where technologies currently are and where they would need to be to realise the scenarios. Participants particularly highlighted that international travel does not have an efficient, low-carbon global transport network, which leaves no viable alternative to flying in some instances. This highlights that meeting net zero in a way that maximised public support would likely require either low carbon flight or viable alternatives. Both would require substantial investment.
To do so, we need to invest more in public transport in both rural and urban areas. The more we are connected by public transport the better for the whole community.
Participants also suggested substantially more investment in making UK public transport options more efficient and reliable would be needed if the scenarios with increased reliance on public transport were to come about. Rural participants further highlighted that for any scenarios with reduced access to private vehicles to be workable, there would need to be a far-reaching expansion of public transport networks and access to local amenities (schools, for example) into currently poorly connected areas.
Reskilling
Key message for policy makers: Participants only found scenarios with large societal changes (such as increases in automation or a greater emphasis on the circular economy) plausible if there were supporting efforts to reskill individuals. Clearly changes such as automation are not directly linked to net zero targets but could have an impact on emissions. Without the focus on education and training, supporting the public to navigate big economic shifts, participants believed that such societal changes were unlikely to take place or would be met with resistance.
What the participants said: When discussing scenarios that presented an increased focus on repairing goods rather than replacing them, participants highlighted that there is a large gap in the general public’s knowledge of how to repair certain items. They suggested that if these scenarios were to come about then there would need to be more upskilling to facilitate the broader societal change of wasting less and repairing more.
Reskilling was also referenced when participants discussed scenarios with high levels of automation. While most participants were concerned that people may lose their jobs, a few participants argued that scenarios with increased automation might present an opportunity to facilitate upskilling and retraining, but that this needed to be done cautiously and with sensitivity to those unwilling or unable to make those changes.
There will be the automation of peoples’ jobs, but I think government and other organisations would have to help people to reskill and retrain.
Some scenarios suggested an increase in individuals or local communities growing their own food. Participants were keen on this concept but again indicated that this was a big change from current society, where people are often separated from agricultural processes. Again, it was suggested that for these scenarios to be realistic, individuals would need to be educated in how to produce their own food.
Changing food preferences
Key message for policy makers: Participants assumed that the trend for citizens reducing their meat and dairy consumption would continue and many expressed a desire to reduce their own consumption. They were averse to having fewer food options available in the future but were generally supportive of incentivising people to choose less emissions-intensive options. Future policy makers will need to carefully navigate between the expressed dietary preferences of the day, decarbonising food production, and maintaining public support for some of the technical options to achieve this. Ongoing public engagement on this is likely to be necessary.
What the participants said: Most participants acknowledged that reducing meat and dairy consumption would reduce carbon emissions. This was also the case among participants working in agriculture. Although all participants wanted to keep meat and dairy as options for individuals in future societies, some were keen to encourage reduced meat and dairy consumption and incentivise people to choose less emissions-intensive options (for example, by making plant-based alternatives cheaper).
Participants struggled to accept the premise that alternative proteins (such as cultured meat) or novel agricultural techniques (such as vertical farming) would be widely accepted in the future. They often suggested that people would view this as less desirable than food grown or reared traditionally. Most participants believed that food produced using novel technologies (particularly cultured meat) was inherently less healthy than food grown in a traditional way. This affected how plausible they viewed scenarios with increased consumption of cultured meat. A few participants said that if the right checks were conducted to ensure cultured meat was safe for consumption, they would buy it. Others also acknowledged that their reaction may have been driven by a lack of understanding of the technology used in these processes. Reservations around moving towards products that relied on novel technologies affect the metropolitan and atomised societies to a greater extent. Concerns about the reliance on imports affects the self-preservation society most, while concerns about reduced food choice affects the slow lane society slightly more than the others.
We have the responsibility to do the right thing for the planet, but the government need to incentivise that choice as well.
Incentivising businesses
Key message for policy makers: As noted previously, participants expressed that some societal changes would be less likely to occur without changes in other sectors. For example, participants suggested that establishing a circular economy would require businesses to reduce inbuilt obsolescence, increase repairability and reduce waste associated with manufacturing. Participants suggested that businesses would likely need incentivising to develop these practices because the changes required could come into conflict with their profitability.
If companies are rewarded for producing things that are better for the planet, that would be a better way of attracting investment into that stream.
What the participants said: A few participants flagged that to facilitate the broader societal change outlined in some of the scenarios (especially those with a greater emphasis on the circular economy), businesses currently producing products with inbuilt obsolescence would need to be incentivised to change their operating model. Suggestions included standards for repairability and using the full lifecycle of products. This was particularly true for scenarios suggesting significant changes to how products are made, used and disposed of (such as the slow lane society or the metropolitan society).
5.4 Cross-cutting themes
Throughout discussions, participants explored what they saw as the advantages and challenges in the four scenarios presented to them and how these could impact their lives and those of others. Four main themes emerged in the participants’ discussions across the five workshops. These cross-cutting themes (technology, equality, health, and involvement) are outlined below. The themes that emerged during this dialogue also closely match those that have been found in previous public engagement work.175, 176
Technology
Key message for policy makers: In net zero pathways that rely on a high level of technology adoption, especially technology which is highly visible to citizens (such as novel food technologies or changes to work environments), policy makers will need to work to ensure public support. Participants suggest that promoting equity of access to (and impacts from) technology, preventing job losses, and careful regulation were important to ensuring public support. From stem cells to mitochondrial DNA transfers, successive UK governments have been able to craft policy positions that commanded broad support, in part through public dialogue. The rollout of consumer facing net zero technologies may benefit from similar work.
What the participants said: Many participants expressed wariness of advanced technologies, how they were used and who benefitted from their use. Participants indicated that significant technological innovation was expected by 2050 and were positive about less visible technological advancement (such as technology to facilitate a circular economy). However, they expressed concern about relying disproportionately on technology to reduce emissions. They were also highly critical of technologies they saw as automating jobs or contributing to social isolation.
I’m all for technology, but is it going to start controlling everything I do?
Self-preservation society
Participants typically exhibited low levels of trust in the agenda and priorities of large technology companies. This concern also came through in the opinions expressed around the use of advanced technologies in food production, where some participants expressed fear that a few influential companies could end up controlling the means of producing food.
You can’t trust big tech, it’s about their shareholders, not their world.
Metropolitan society
Participants were also concerned about the social and economic implications of technological innovations. They questioned whether technology would be affordable for all and if some technologies could reduce social contact between different groups. However, they also saw some benefits, relating to potential positive health outcomes and convenience, that could arise through the effective use of technologies. This theme was most often raised in relation to the atomised and metropolitan societies, which involve the highest uptake of novel technologies.
As easy as it is to submerge yourself in this virtual bubble, it can’t replace reality and it never should.
Atomised society
Equality
Key message for policy makers: Perceived fairness was extremely important to participants. If narratives were to emerge around a lack of fairness in how net zero is being delivered, whether by government action or as a result wider changes, it would likely create resistance and hold back progress. Future governments will need to be alert to, and address, concerns expressed by the public around fairness in relation to net zero pathways.
What the participants said: The theme of equality was brought up by participants in every workshop. All participants were deeply concerned by potential inequalities in the four scenarios. The concerns expressed around inequality can be broadly grouped into three categories:
- Income inequality: Participants were concerned that those who were less well off in the future could be excluded from certain aspects of society. For example, they were concerned that some individuals might not be able to access affordable transport options or might be at greater risk of losing their jobs to automation. There was a pervasive sense that there was a risk that those with less money could be ‘left behind’.
-
Place-based and geographic inequality: Participants were worried that there could be a widening of inequalities between urban and rural areas in the future. This sentiment was expressed most strongly by those from rural areas. There were two main concerns raised. Firstly, that rural areas would not have access to the amenities and funding enjoyed by urban areas. Secondly, that those currently living in rural areas would need to move into urban areas, resulting in a loss of access to nature or loss of livelihoods for those working in agriculture.
“If [food is] grown in a lab, they won’t need farmers anymore. Farmers will lose out.”
- Accessibility: Participants advocated strongly for increased accessibility in future scenarios and were positive about instances where they saw opportunities for increased accessibility. Participants suggested that that more disparate built environments would not adequately meet the needs of those with different accessibility needs. Typically, private vehicles were seen as being most advantageous for those with limited mobility, although a few participants highlighted the possibility that public transport advances may result in greater independence for those with different accessibility requirements.
Metropolitan society
The concerns around increased income equality most affects the atomised society (which has increased income equality) and to a lesser extent, the self-preservation and metropolitan societies (where inequality was assumed to stay roughly at today’s level). The concern around the widening divide between urban and rural areas mostly affects the metropolitan society, where investment has focused on urban areas for efficiency reasons.
Health
Key message for policy makers: As explored in the previous chapter, there are potential co-benefits to policies aimed at reducing emissions, including longer healthy life expectancies and improved air quality. Participants favoured scenarios that gave equal priority to public and planetary health. Given this, emphasising the health co-benefits associated with a net zero transition should benefit citizens and, in so doing, bolster support for the transition itself.
[I like the idea of] the natural fruit and veg, the health benefits and low meat consumption.
Slow lane society
What the participants said: Participants often explored the impacts that future societal changes may have on human health. Discussions about diet and food centred on the implications for health. In general, participants expressed the view that beneficial climate outcomes should be aligned with beneficial health outcomes.
Participants were particularly concerned with the health implications of the diets that different scenarios put forward, and many participants’ perspectives on the health implications of people’s diets were contingent on the quality and type of food different people were able to access.
Another key focus was the impact of social isolation on individuals’ mental health. There were concerns that reliance on technology would result in greater isolation. Participants highlighted this with the built environment too, noting that lack of access to greenery or nature can have negative impacts on mental and physical health. Concerns around isolation and loneliness particularly affected responses to the atomised and metropolitan societies.
I have concerns not just about health but mental health in this scenario.
Atomised society
Involvement
Key message for policy makers: Participants were aware that meeting net zero would likely come from people making changes to their lifestyles and were not averse to doing so. However, they expressed the strong desire to be consulted if policy makers were looking for ways to expedite these changes. They also noted that for policies to work, people had to trust the institutions designing and implementing them. Policy makers will likely find it easier to chart a course to net zero by working with and listening to citizens.
It’s great if you’re doing it voluntarily, but if you’re forced into it without any other option, it’s not so good.
Self-preservation society
What the participants said: Participants often emphasised the importance for individuals to be involved in the decisions that affected their lives and to be able to make their own, informed choices. Most participants recognised the importance of societal changes to reduce emissions. Some participants expressed positive views about changes in consumer behaviour, such as increased preference for plant-based diets or reducing consumption of goods. In general, there was emphasis on the importance for people and communities to take greater individual and collective responsibility, and for sustainable choices to be encouraged and incentivised. Concerns around low levels of involvement and institutional trust particularly affect the atomised and self-preservation societies.
5.5 Reactions to the scenarios
In this section there is a short reminder of the modelling outputs for each scenario followed by an overview of what challenges policy makers in this imagined future scenario would face. This is followed by greater detail on participants’ reactions to each society as a whole and the sectors within it.
Atomised society
Reminder of what the modelling tells us: As a percentage of GDP, the cost of delivering this energy system in 2050 is roughly the same a baseline scenario where net zero is not met, largely because GDP is higher in this scenario. Because of its high energy demand and low available land space, this scenario relies heavily on direct air capture, carbon capture and storage, and hydrogen produced from fossil fuels. The population imagined in this world has a preference for high levels of consumption. The high energy demand and reliance on unproven technologies place this scenario at a medium risk of missing net zero if the trends do not follow our assumptions.
Key challenges for policy makers in the atomised society: In a future like this, high economic growth and technological innovation affords choice for policy makers and the general public. Although this choice is likely to be desirable for many citizens (who may value having a range of transport options or food variety), there may be discontent among those on lower incomes who may find some options unaffordable. Societal divisions (including physical separation of different social groups) could make this future a difficult environment in which to create and implement policy, especially given that citizens may be more concerned about potential disproportionate impacts of any policy options. Policy making around agriculture and land use may be particularly complex, with citizens possibly being reluctant to accept the large changes to rural landscapes and green spaces needed to balance food production and carbon capture technology.
Society as a whole
Participants’ overall reactions: Participants’ initial reactions centred on concerns around income inequality. While some did note technology could be used to achieve positive outcomes (for example, to make healthcare more effective and efficient), many participants expressed concerns about the frequent use of virtual reality and other immersive technologies in contributing to the isolation. Even participants who welcomed the use of technologies for the reduction of emissions and greater convenience expressed concerns about technology being used to displace human interaction and communities.
[People] will be more disconnected and impersonal in their dealings, like detached robots. I find that really sad.
Atomised society
Sector-specific reactions
The built environment
Reminder of the built environment in the atomised society: People are increasingly living in self-contained ‘bubbles’ in suburban and rural areas, with more people living alone. New homes in dispersed locations have improved affordability. However, there are fewer local amenities.
It looks like the poorer are excluded from all types of transports Atomised society
Participants’ reflections: Participants shared a dislike for the perceived insularity of this society, expressing discomfort with the dispersed population and the high number of people living alone. They were also worried that those on higher incomes would move into gated communities or in some other way physically separate themselves from those on lower incomes, increasing segregation and reducing the sense of community.
Travel and transport
Reminder of travel and transport in the atomised society: In this world, long-distance public transport is efficient and convenient. However, the cost of using it is relatively high. There is a strong uptake of CAVs by those with higher incomes. International flights for holidays and leisure remain popular.
Participants’ reflections: Participants noted that there were many transport options for the highest earners in this society (for example, CAVs and public transport) but limited options for those on the lowest incomes. There were concerns that this could effectively exclude some people from various activities outside of the home.
Work and industry
Reminder of work and industry in the atomised society: High consumption and increased technological obsolescence have created a throwaway culture. However, there are also better recycling solutions for some products. Cryptocurrency is increasingly used to purchase services in both the physical and virtual world.
Participants’ reflections: There was concern from participants about inbuilt obsolescence in this society. Challenges around inequalities were also raised, especially concerns about whether there was equal access to digital infrastructure. Some participants were concerned about the jobs available in this society, noting that high levels of automation could result in some people losing their jobs. Other participants disagreed, suggesting that innovation would generate jobs and create opportunities to reskill.
I understand the worries of how some jobs are being taken over by technology, but I think with tech, that can generate more job opportunities for people so they can develop more skillsets.
Atomised society
Food and land use
Reminder of food and land use in the atomised society: There is an increase in the availability and affordability of cultured meat. Urban agriculture and vertical farming offer local produce for those with higher incomes. Genome-edited crops and robotic pollinators allow the UK to achieve self-sufficiency. However, environmental degradation has reduced biodiversity.
Participants’ reflections: Participants expressed reticence around increased agricultural technology in this society, particularly for genome-edited food, cultured meat and vertical farming (there were fewer concerns expressed about robotic pollinators). There were also concerns that rural landscapes and green spaces might not exist in this society, which was seen as undesirable.
Metropolitan society
Reminder of what the modelling tells us: The cost of delivering the energy system in 2050 is 2% of GDP lower than a baseline scenario where net zero is not met. In other words, this scenario is more affordable than not meeting net zero. Energy demand and economic growth have been decoupled most significantly in this scenario. This scenario uses unproven technologies to reach net zero, although it also uses nature-based removals. Demand for energy and goods is moderately high, driven in part by higher economic growth, but offset by resource efficiency. The energy demands in this scenario mean a relatively large area is needed to build the required energy infrastructure. The risk to missing net zero in this scenario is relatively low, as there is scope to push technology change or demand reduction further if needed.
Key challenges for policy makers in the metropolitan society: In this future, high economic growth, alongside high social cohesion and institutional trust, have created a relatively benign environment for rolling out new technologies and implementing new policies. However, there is likely to be continued reticence towards technologies seen to be infringing on people’s personal lives and policy makers would likely need to continue reassuring the public on the safety of new technologies in order not to lose support. Particular resistance may be apparent in food production, where the public may be least comfortable with technologies playing a major role without careful research and regulation. Rural populations may express dissatisfaction with policies seen to favour urban areas or to create divisions between urban and rural areas. In general, citizens’ need for green spaces and rural landscapes may come into conflict with increasing urbanisation and land being used for food production and/or nature-based carbon removal.
Society as a whole
Participants’ overall reactions to the metropolitan society: Participants’ initial thoughts on this scenario often revolved around the high use of technology in 2050. Some participants felt the scenario presented futuristic and exciting innovations, but others expressed some discomfort around increased use of some technologies (specifically AI and agricultural technology). Many participants were concerned that heavy reliance on technology might exclude some groups, especially older people and those in rural areas. They also expressed general concern about the rural and urban divide. Participants from rural areas were worried about being ‘left behind’, with limited access to the improvements in public transport efficiencies available in urban areas and with the perceived side-lining of their lifestyles and livelihoods (for example, through food production becoming divorced from rural areas).
I think people who don’t have an urban lifestyle have been forgotten about.
Metropolitan society
Sector-specific reactions
The built environment
Reminder of the built environment in the metropolitan society: Many people live in cities and fewer reside in rural areas. Funding is channelled to urban areas. There is compact living in small households and a push for essential services close to home.
Participants’ reflections: Participants were positive about the possibility of green cities and high economic growth in this society. However, they raised some concerns about potential isolation, with small or single-person households often being viewed negatively. They were also concerned about physical separation and a lack of interaction between different groups (especially between those on higher incomes and those on lower incomes and between those in urban and those in rural areas).
Travel and transport
Reminder of travel and transport in the metropolitan society: There has been greater investment in low-cost urban public transport and train travel is cheaper and easier between cities. CAVs are available as on-demand shared travel. There are zero carbon international flights available but less domestic flying.
Participants’ reflections: Participants welcomed the benefits that active travel and public transport could have on reducing pollution and improving air quality. However, some were concerned with what an increase in public transport (and to a certain extent, increased use of CAVs) would mean for transport infrastructure. In particular, they were concerned about the investment that would be required and whether new inter-city infrastructure would impinge on green spaces.
Work and industry Reminder of work and industry in the metropolitan society: There is a thriving market for goods and services alongside a growing circular economy. An increased focus on sustainability supported with technology assists people in making sustainable choices.
I quite like the way that it’s attempting to eliminate consumerism and the throwaway culture we have, such as fast fashion.
Metropolitan society
Participants’ reflections: The circular economy was seen as a positive aspect of this society. However, some participants were concerned that there would be an increase in automation in the workforce, which could result in people’s jobs changing or being lost. Others noted that it was possible for people to reskill to work in the new jobs that technological innovation might offer.
Food and land use
Reminder of food and land use in the metropolitan society: There has been an increase in plant-based diets and cultured meat. Organically farmed meat is a rare luxury. Genome editing and robotics have reduced land and pesticide use.
Participants’ reflections: Participants were generally averse to the use of novel technologies in food production in this society, particularly cultured meats and, to a lesser extent, genome-edited food. However, others saw potential positives in reducing pesticide use and lowering emissions.
In agriculture, we currently use a lot of pesticides and chemicals, so reducing those could be positive for the natural world and biodiversity. Metropolitan society
Self-preservation society
Reminder of what the modelling tells us: The cost of delivering this energy system in 2050 is the highest percentage of GDP of all the scenarios and is 5% of GDP higher than a baseline scenario where net zero is not met. More land will be needed to accommodate demand-led infrastructure as well as for increased livestock and agriculture. The level of carbon removal required necessitates both technological and nature-based approaches. There is also a relatively high reliance on unproven net zero technologies, combined with a society less amenable to change; these challenges are unlikely to be resolved and the risk of failure in meeting net zero is high.
Key challenges for policy makers in the self-preservation society: In this future, low growth and technological progress have left fewer options for policy makers to reach net zero. This has meant relying on relatively high-cost unproven technologies to reduce emissions. Lower growth also presents wider challenges to income and public services. Policy makers may find a population frustrated by a lack of innovation, opportunities, and sense of community. However, the relatively low use of visible technology may mean that policy makers need to make fewer decisions on regulation. The preservation of ‘traditional’ jobs and lifestyles may also mean policy makers need to tackle fewer issues around reskilling the population. Lower growth has resulted in relatively little new infrastructure or housing. Policy makers may find, therefore, that the major issues they face are around housing supply and reliable transport options. Although new building projects have not affected the rural landscape, policy makers may face discontent in rural areas where unviable agricultural land has been used for technological and nature-based carbon removal.
Society as a whole
Participants’ overall reactions: There was a strong feeling held by most participants that this society was ‘going backwards’ and showed no progress between the current day and 2050. Some expressed disappointment in the lack of the net zero technologies that they believed were important to reduce emissions. Participants were concerned about the income equality in this society and were worried that some aspects of daily living would be unaffordable for those on lower incomes. A few participants suggested that this society would be the least jarring for older people or for those who were strongly averse to change as it felt the most similar to the current day.
Sector-specific reactions
The built environment
Reminder of the built environment in the self-preservation society: Less investment in cities has driven people out to the suburbs and rural areas. Housing demand outstrips supply and there is more multigenerational living as a result. There is also a focus on ‘self-sufficient’ living.
I come from an already segregated society and gated communities will do nothing to integrate people from diverse backgrounds.
Self-preservation society
Participants’ reflections: Participants were worried that the combination of a lack of a sense of community and what they perceived as low living standards would lead to increased crime. They suggested this could result in those with the highest incomes moving into gated communities, exacerbating the social divisions they already felt were prevalent in this society. Some participants were fairly positive about the increase in multi-generational living, suggesting that this would reduce feelings of isolation. However, others expressed concern that this trend would be driven by economic circumstances rather than an increased desire to bring families closer together.
Travel and transport
I live in a small hamlet. The nearest big shop is over an hour’s drive away. It wouldn’t be possible for me to get around everywhere on a bike with young children.
Self-preservation society
Reminder of travel and transport in the self-preservation society: Public transport is available but is fragmented outside of cities and has received little investment. There has been moderate investment in active travel infrastructure. CAVs are not widespread but are available for the rich. Flying is increasingly expensive.
Participants’ reflections: Participants were concerned about how people who did not own a private vehicle would travel in this society, noting that an unreliable and fragmented public transport system would make life very difficult. There were also concerns that expensive flights would mean that foreign holidays would only be possible for the highest earners and that most people could not afford to visit family or friends they might have abroad.
Work and industry
Reminder of work and industry in the self-preservation society: Many goods are still designed with inbuilt obsolescence. ‘Greenwashing’ by companies is common. In general, there is a throwaway culture. However, those living ‘off grid’ have a ‘make do and mend’ attitude. There are also service exchange or mutual goods exchange systems.
Participants’ reflections: Participants disliked the throwaway culture in this society and expressed concern for how the waste would be managed. There were positive reactions towards groups who repaired their goods and towards mutual goods exchange systems. Participants also suggested that this society had the potential for the greatest number of ‘traditional’ and face-to-face jobs, which they expressed support for.
Food and land use
Reminder of food and land use in the self-preservation society: Meat is readily available through intensive farming. Organic options are available but are unaffordable for most people. Some UK farmland has become unviable, meaning there is an increased reliance on imported food. Some former farmland has been rewilded. There is little advanced agricultural technology available.
Participants’ reflections on food and land use in the self-preservation society: Participants were negative about the increased reliance on imports, noting a desire for self-sufficiency and food security. Many also advocated for ensuring that there was equal access to healthy foods for all groups in the future. They were concerned that quality produce would only be affordable for those on higher incomes and that those on lower incomes could end up having lower quality food and less choice in what they consumed. Although participants were generally positive towards rewilding, some were concerned that it could be detrimental to ‘traditional’ rural lifestyles.
I like to be self-sufficient in what we grow […] If you don’t produce your own reserves, you’re held captive by outside forces.
Self-preservation society
Slow lane society
Reminder of what the modelling tells us: The cost of delivering this energy system in 2050 is 1% of GDP higher than a baseline scenario where net zero is not met. It uses significantly less new energy infrastructure than other scenarios to meet the demand, and significant societal shifts have lowered energy demand and reduced the need for unproven net zero technologies. This includes a shift to a circular economy and nature-based carbon removal. However, the lack of technology availability means that there is a relatively high risk of not reaching net zero if demand reductions are short-lived. The society is amenable to making significant changes, and this is likely to be the main mitigation in case of risks.
Key challenges for policy makers in the slow lane society: In this future, low economic growth has meant fewer technology options are available for policy makers to reach net zero. Lower growth also presents wider challenges to income and public services. However, shifts in consumption have kept costs for meeting emissions targets low. Although there is high societal cohesion, policy makers may face a population that is at risk of becoming dissatisfied with a lack of progress in living standards, a lack of convenience, and limited choices (for example, in what to eat or how to travel). Challenges for policy makers in this society are likely to be about ensuring that public services can continue to meet demand in a future with relatively restricted public finances. However, they may face fewer challenges around perceived inequalities and land use, with this future having high social cohesion and protection of rural areas (including for traditional agriculture and preservation of natural landscapes).
Society as a whole
Participants’ overall reactions: Most participants highlighted that the focus on communities in this society was very positive. The availability of locally grown food was also popular, as was the extensive use of public transport, the shrinking income inequality, and the ‘repair and mend’ culture. Some participants were worried about a slow-down in production and new products being less frequently available. Most concerns centred on reduced convenience and perceived lower living standards.
I love the idea of getting us onto a more level playing field.
Slow lane society
Sector-specific reactions
The built environment
Reminder of the built environment in the slow lane society: Population is spread across urban and rural areas. There has been low investment in new homes. People are living more localised and compact lifestyles and relying on increased local amenities.
Participants’ reflections: Participants had positive reactions to the increased sense of community in this society. The move towards local amenities and close-knit communities spread across urban and rural areas was also seen positively. However, some feared the countryside would be fundamentally changed by the new infrastructure and housing that would be needed to facilitate population dispersal from towns and cities.
Travel and transport
Reminder of travel and transport in the slow lane society: Walking and cycling are common, and people can access an efficient and well-maintained public transport system. Private car ownership is less frequent and there are few CAVs in use. Flying domestically or internationally is less common with more options for slower and less emissions-intensive options (such as high-speed trains or boats).
If everyone is taking the same mode of transport, you need to create more railway lines, trains and routes. They need to be more reliable.
Slow lane society
Participants’ reflections: Participants were fairly positive about the high use of active travel and public transport in this society, noting this would be beneficial for public health and the environment. They also suggested that having sufficient infrastructure for active travel would create more flexibility in travel than either private or public transport. Some participants were unconvinced by alternatives to aviation for long-distance travel, suggesting it would be inconvenient and impractical for those working in jobs with limited leave. There were concerns that both private and public transport might not be affordable for those on low salaries.
Work and industry
Reminder of work and industry in the slow lane society: Small businesses are thriving and benefiting from localisation. Big businesses are promoting positive societal values to attract customers. There is an increased in shared goods and services. The cost of goods is high and there is an increase in repairing rather than replacing items.
Participants’ reflections: Most participants were very positive towards the concepts of a circular economy and sharing goods in a community (such as through a ‘library of things’). Some participants also argued that this shift would create jobs and lead to new skills to be developed. A small number of participants expressed concern that there would be limited opportunities to buy new goods in this society and suggested that this would reduce the convenience that they experience currently.
Food and land use
Reminder of food and land use in the slow lane society: There is an increase in plant-based diets and lower meat consumption. Little agricultural technology is available. More food is grown in the UK for domestic consumption. There are protected nature zones and restored national parks.
I do eat meat, but I do like a plant-based diet. To me, it seems pretty good. I’m happy not to have the same choice as at the minute. I would survive.
Slow lane society
Participants’ reflections: Participants were positive about locally grown food, consuming seasonal produce and reducing reliance on imports. However, some expressed that this would make the UK less resilient if there were extreme weather events that affected domestic production. Participants also highlighted that there would likely be regional differences in the ability to grow food, meaning some regions would be reliant on food from other areas or on more expensive imports. Some participants also noted that convenience food would be missing from this society, which was seen as negative for those who currently rely on it (such as working parents).
5.6 Tensions and trade-offs
Key message for policy makers: Participants were acutely aware of the tensions involved in decision making around net zero. When exploring inherent trade-offs, they noted that there was no way to resolve them fully. However, through exploring them, they generally became more receptive to a variety of options. In future, as governments articulate the next stages in our path to net zero, citizens may be most receptive to changes where they feel the tensions or trade-offs have been considered and not disguised. Involving citizens early may provide sustainable routes through any thorny trade-offs that future governments might face.
What the participants said: Participants often raised the tensions they saw within the different scenarios they were discussing. Some key themes emerged that participants suggested that decision makers working on net zero would need to consider when thinking about future society.
- Infrastructure and cost: Participants identified a tension around the investment needed in societies with large infrastructure changes and where the funding would come from. Participants generally agreed that higher costs would be tolerable if it would mean meeting climate targets, reducing inequalities, and maintaining a sense of community. For some, there was concern that infrastructure development would focus on urban areas because the cost of the same developments in rural areas would be deemed too high.
- Sustainability and choice: Participants recognised the need for individuals to make sustainable choices to reduce emissions by 2050. However, they noted that sustainable and less wasteful choices sometimes came with trade-offs (such as being less convenient or affordable). Participants in general wanted options for people in the future so that they could choose what worked for them. Some suggested that those with greater wealth who have the highest emissions needed to be incentivised to take responsibility too. Other participants suggested there was a role for incentivising and educating people to make more sustainable choices. Participants were willing to accept substantial and widespread changes so long as this did not occur at the expense of individual freedoms and result in individuals being mandated to live their lives in a certain way. “We have to put the building blocks into it, which might mean paying more. But in the long run, it would mean a cleaner, greener country.”
- Innovation and tradition: Participants were generally hesitant around societies with increased use of technology in ways that seemed to threaten what they deemed as ‘traditional’ ways of life. Some participants were accepting of the use of advanced technology provided there were the right checks and balances in place. These participants tended to be those who self-identified as earlier adopters of new technology. However, there were tensions identified around increased use of technology and jobs. For example, some participants were worried that if technology undermines traditional farming, it could mean the end of ‘traditional’ rural lifestyles. “Incentivise people, rather than force and push people […] Education might be a key factor in terms of people’s decision making.”
5.7 Key messages from public dialogue
After immersing themselves in the four future net zero scenarios, the key messages that could be drawn from the discussions of the public dialogue participants are:
- Participants recognised that societal change is somewhat contingent on the infrastructure available to support it (such as accessible public transport and active travel infrastructure). Citizens may want to make changes in their lives but need the infrastructure to allow them to do so.
- Participants believed that some of the large societal changes (such as increases in automation or a greater emphasis on the circular economy) could only happen if there are supporting efforts to reskill individuals.
- Having fewer food options available in the future would be unwelcome. Participants favoured incentivising people to choose less emissions-intensive options. There is likely an ongoing need to engage the public in balancing dietary preferences, decarbonising food production, and developing public support for potential technical solutions for this.
- Citizens are likely to be attentive to the perceived fairness of pathways to net zero. Future governments are likely to need to be alert to, and address, narratives around fairness. Participants favoured scenarios that gave equal priority to public and planetary health. Therefore, emphasising the health co-benefits associated with a net zero transition should benefit citizens and, in so doing, bolster support for the transition itself.
- Individuals are aware that people making changes to their lifestyles can help reduce emissions and are not averse to doing so. However, participants expressed the need to be consulted about the lifestyle changes they would favour and not to have changes imposed on them.
- Citizens may be more receptive to policies where they feel the tensions or trade-offs have been considered and not disguised.
6. Next steps
The research, insights and tools presented in this report are intended to help policy makers consider the role of societal change in both net zero strategy and a wider range of policy areas. This work has shown how the plausible societal changes could significantly affect the way that the UK will reach net zero by 2050. It has also explored the public perception of the likelihood and acceptability of societal changes. This final section considers how policy makers can use the outputs of the project to make their policy and strategy more resilient. Other organisations, such as businesses and local authorities, may also find these approaches helpful.
How to use the scenarios
The outputs of the project provide strategic insights into some important risks and opportunities associated with different pathways to net zero, but the evidence and scenarios can also be used by policy makers to help develop and refine specific net zero policies with more detailed and specific analysis. Approaches that could be used are described below.
Policy stress-testing
Stress-testing is a method for testing policy, strategy, or project objectives against a set of scenarios to see how well they stand up to a range of external conditions.
Purpose: The approach is used to:
- explore how different scenarios might affect strategic policy objectives, and
- identify which aspects of the policy are robust across the full range of scenarios and which will need to be modified if conditions change in the future.
Output: Feedback on how a new or existing policy, strategy, or project might be affected in different scenarios and how it might need to be adapted in the near term to ensure resilience across a range of future conditions.
Outcome: A more resilient policy, strategy or project.
Approach
- Work through the grid below (Table 12), discussing how your policy performs in the longer-term under the different conditions of each scenario.
- Take a step back to look across the full grid: What is imperative for us to do in the near term? What do we need to adapt or track to ensure the effectiveness of this policy across a range of possible futures?
Table 12. Example policy stress-testing exercise
| Policy proposal (That we do X to achieve Y) | Scenario 1 | Scenario 2 | Scenario 3 | Scenario 4 |
|---|---|---|---|---|
| What aspects of this scenario make delivering this policy easier or more difficult? (Think in terms of enablers and barriers) | ||||
| In 2050, is this policy intervention considered a success or a failure? Why? (What might a success narrative look like?) | ||||
| Who benefits from this intervention in this scenario? Who doesn’t? Who or what is adversely affected? | ||||
| What would we need to start, stop, change, or continue doing now/in the near term for this policy to achieve its objective in this scenario? |
The approach can also be used to help choose between a number of competing policy choices; an option which is assessed as performing well in most scenarios may be preferable to one that experiences more barriers.
Testing implications of wider goals
Some of the societal changes represented in the scenarios overlap with wider policy goals that current or future governments may choose to focus on, including boosting economic growth, strengthening UK manufacturing, and improving urban infrastructure to support population growth in cities.
Net zero planning does not typically consider how the UK’s approach to net zero would need to change if such goals were successfully achieved, but this project has illustrated that this could have important implications for the path to net zero.
If a set of agreed long-term goals can be identified, policy makers could translate these into a new future societal scenario using the approaches set out in this report, test the performance of their net zero strategy against this scenario, and then identify any changes in approach that might be needed.
As an illustrative example, this would allow policy makers to identify how they would meet net zero in a world where any targets for increased economic growth were successfully achieved or in a world where UK manufacturing is thriving.
Systems thinking
The project has demonstrated that applying systems thinking and modelling when planning for the future is critical to expose connections between parts of our energy system that may not be salient to policy makers working in individual sectors. For example, significant increases in digital communication could reduce demand for travel but increase demand for home heating and electricity use in data centres.
Government is already applying systems thinking in its net zero strategy, but this work could be built on to think about wider societal connections and cross-sector effects.3 This could be particularly important if analysis of a particular sector is handled by an individual government department that is not actively considering indirect effects from other sectors. To resolve this, development of cross-sector systems maps to inform systems thinking should involve people working in different government departments.
Chapter 3 of this report described how systems thinking was used in this project to identify cross-sector effects that would have implications for energy demand and emissions. As an example, Figure 32 shows a systems map illustrating how income growth and reshoring of manufacturing could affect both travel demand and the number of cars produced in the UK, both of which could increase overall energy demand. Development of such a map should involve policy makers working on growth, transport, and manufacturing to ensure all the connections are fully explored.
Figure 32. The impacts of income growth and reshoring on energy use, via transport and industry sector

This graphic depicts the impacts of income growth and re-shoring on energy use, via transport and industry sectors. Income growth and increased re-shoring are both shown to increase overall energy use.
Horizon scanning
Government already tracks a range of net zero indicators. Further societal indicators could also be tracked to assess whether the UK is headed towards one or other of the scenarios, providing intelligence on whether net zero might be harder or easier to meet than currently assumed, or if the strategy may need to adapt in some other way.
Indicators for uptake of net zero technologies and behaviours are already tracked by government, such as EV sales or homes insulated. New societal indicators important for net zero (some of which already have readily available data), could include:
- Public attitudes to net zero and willingness to take specific actions to help meet UK targets.
- GDP growth and its relationship to energy demand (as well as emissions) to understand the pace of decoupling of these metrics.
- Diets, including the share of meat and dairy, as well as attitudes to new meat and dairy substitutes.
- Uptake of new digital communications technologies and their effect on travel patterns.
- Willingness to use shared services (such as car clubs or a ‘library of things’).
- Availability of repairable products and public attitudes to repairing products.
- Changes in urban versus rural populations and the resulting impact on travel and home energy use.
- Data on uptake of emerging technologies and their likely effect on energy use, including CAVs, digital currencies, AI, vertical farms and cultured meat.
The data for many of these indicators have been or are being collected to inform policy makers (for example, public health insights from data on diets). Such data could be monitored from a net zero perspective to provide intelligence on changing trajectories in societal factors that might increase or decrease emissions, affecting the path to net zero.
Acknowledgements
GO-Science would like to thank everyone who contributed to the work of this project and generously provided their advice and guidance.
This project was led by Rowena Bermingham, Jack Snape and Tom Wells. The GO-Science team included Heather Ballard, Helen Blackbourn, Nina Grassmann, Cara Nicol, Maria Sharmina, Mattie Taylor and Emily White.
We are grateful to the individuals and organisations listed below for their time, effort, and invaluable contributions.
- GO-Science staff from a variety of teams who gave support at different stages in the project, including: Matthew Ball, Zach Banks, Jessica Bode, Mieke Buckley, Nuala Burnett, Mel Carlin, Kharug Cheema, Helen Doran, Kenneth Hawthorn, Carrie Heitmeyer, Melissa Jackson, Owen Jackson, Felix Langley, Maddi Mackay, Bee Morgan, Mary Phelan and Nathan Roberts.
- Government officials who contributed to the working group, steering group and scenario workshops, including the chair of the steering group Paul Monks (Chief Scientific Adviser, BEIS) and representatives from the Cabinet Office, Defra, DfT, DHSC, DLUHC, FCDO, Food Standards Agency, HM Treasury, National Infrastructure Commission, Natural England, Number 10, Office for Life Sciences, Ofgem and Scottish Government.
- The CREDS modelling team: John Barrett (University of Leeds), Christian Brand (University of Oxford), Oliver Broad (University College London), Alice Garvey (University of Leeds), Elliott Johnson (University of Leeds), Harry Kennard (University College London), Jonathan Norman (University of Leeds), Tadj Oreszczyn (University College London), James Price (University College London), Steve Pye (University College London) and Paul Ruyssevelt (University College London).
- External experts who took part in our scenarios workshops and/or who provided advice and guidance at various stages of the project: Emma Adler (Wildlife and Countryside Link), Friederike Andres (Federation of Small Businesses), James Asfa (Citizens UK), William Blomefield (Mars), James Bullock (UK Centre for Ecology & Hydrology), Richard Carmichael (Imperial College London), Duncan Cass-Beggs (OECD), Dexter Docherty (OECD), Michael Fell (UCL), Lía Flattery (E3G), Gabrielle Ginér (BT Group), Fay Holland (Groundwork UK), Kamila Izykowicz (John Lewis Partnership), Tim Lord (Phoenix Group), Rob Macquarie (Grantham Research Institute), Theresa Marteau (University of Cambridge), Ana Musat (Aldersgate Group), Emily Nurse (CCC), Kathy Peach (Nesta), Jonathan Rennie (Natwest), Olivia Rex (Centre for Net Zero), Andrew Richmond (Local Government Association), Amiera Sawas (Climate Outreach), Hugh Simpson (KPMG), John Vary (John Lewis Partnership) and Sarah Whitmee (London School of Hygiene and Tropical Medicine).
- Ipsos, Sciencewise and UKRI for their support and delivery of the net zero society public dialogue, the 29 members of the public who took time out of their busy lives to contribute to this project, and our expert advisory group: Jacob Ainscough (Lancaster University), Mette High (University of St Andrews), Justin Macmullan (Which?), Jonathan Marshall (Resolution Foundation), Theresa Marteau (University of Cambridge), Stuart McKinnon (Energy Systems Catapult), Doug Parr (Greenpeace UK), Jonatan Pinkse (University of Manchester), Nem Vaughan (University of East Anglia), Lorraine Whitmarsh (University of Bath) and Rebecca Willis (Lancaster University).
- The authors of the societal change evidence review, Simone Abram (Durham University) and Silvia Pergetti (University of Edinburgh), and the societal change workshop contributors/reviewers: Anna Carlsson (BEIS), David Edgerton (King’s College London), Stephen Evans (University of Cambridge), Frank Geels (University of Manchester), Alyssa Gilbert (Imperial College London), Chris Langdon (Think Unthinkable Ltd), David Newbery (University of Cambridge), Ralitza Nikolaeva (University of St Andrews), Ruth Pugh (University of Reading) and Charlie Wilson (University of Oxford).
We appreciate the immense pool of expertise we were able to access during this project and hope that the final report will be useful to these contributors and an even wider group.
Glossary
| Term | Definition |
|---|---|
| Afforestation | The process of artificially converting non-forest land into forest, often for carbon sequestration. |
| AI | Artificial intelligence. |
| Air quality life index | A measure of the impact of air pollution on life expectancy. |
| Assumptions | A collection of conventions and choices made when creating and running a computational model. |
| At Soc | The atomised society. |
| BECCS | Bioenergy with carbon capture and storage; a process for generating energy from biomass while extracting carbon dioxide from the atmosphere. |
| BEIS | Department for Business, Energy and Industrial Strategy. |
| Bioenergy with carbon capture and storage | Capturing and permanently storing carbon dioxide from bioenergy emissions, so that it becomes a source of negative emissions. |
| Blockchain | A shared decentralised system that can be used to underpin cryptocurrencies or similar initiatives requiring a decentralised ledger. |
| Bnpkm | Billion passenger kilometre; a unit of measurement representing a passenger travelling one kilometre. |
| Bnvkm | Billion vehicle kilometre; a unit of measurement representing a vehicle travelling one kilometre. |
| Carbon capture and storage | Capturing carbon dioxide before it enters the atmosphere and then storing it. |
| CAV | Connected and autonomous vehicle; a vehicle that can carry out some or all its the driving tasks, in place of the driver. |
| CC | Climate change. |
| CCC | Climate Change Committee; an independent non-departmental public body that advises the UK on tackling and preparing for climate change. |
| CCS | Carbon capture and storage; capturing carbon dioxide before it enters the atmosphere and then storing it. |
| CCU | Carbon capture and utilisation; the process of capturing carbon dioxide to be recycled for further usage (including for biofuels). |
| CCUS | Carbon capture, utilisation and storage; a set of technologies for capturing carbon dioxide either for storage or for further usage. |
| Connected and autonomous vehicle | A vehicle that can carry out some or all its the driving tasks, in place of the driver. |
| COP | United Nations Conference of Parties; a series of annual conferences, which have been running since 1995, to bring together members of the United Nations Framework Convention on Climate Change (UNFCCC) to review progress made on commitments to limit climate change. |
| CREDS | Centre for Research into Energy Demand Solutions |
| Critical uncertainties | Highly important but highly uncertain potential future changes. |
| DAC | Direct air capture; the process of capturing carbon directly from the atmosphere. |
| Defra | Department for Environment, Food and Rural Affairs. |
| Direct air capture | The process of capturing carbon directly from the atmosphere. |
| DIT | Department for International Trade. |
| Drivers of change | Events or shifts that may cause a societal trend to alter or change pace. |
| Ecotourism | A form of tourism that involves visiting natural areas via sustainable methods of transport. There is often a focus on environmental education. |
| Energy forestry | Forestry in which fast-growing trees or woody shrubs are grown with the purpose of providing biomass for energy use. |
| ETS | Emissions Trading Scheme; a market-based approach to controlling net emissions by providing economic incentives for reducing the emission levels. Also know as ‘cap and trade’ because emissions levels are capped for individual polluters but unused limits can be traded between polluters. |
| Fossil CCS – H2 production | Capturing carbon dioxide that results from the burning of fossil fuels used in hydrogen production. |
| Fossil CCS – industry | Capturing carbon dioxide that results from the burning of fossil fuels in industrial processes, such as steel and cement production. |
| Fossil CCS – power generation | Capturing carbon dioxide that results from the burning of fossil fuels for power generation. |
| GDP | Gross domestic product; a monetary measure of the market value of goods/services produced and sold in a country in a specific time period. |
| GHG | Greenhouse gases (including carbon dioxide, methane, nitrous oxide, ozone and others); gases in the earth’s atmosphere that absorb and emit radiant energy, causing the global warming. |
| Global commons | Resource domains that are shared across the world (such as the oceans, the atmosphere or outer space). These domains are outside of national jurisdictions and can be accessed by all nations. |
| GM | Genetically modified; any organism whose genetic material has been altered using genetic engineering techniques. |
| Greenwashing | A form of marketing used to persuade the public that an organisation’s products or policies are environmentally friendly when they are not. |
| Heat pump | A device that heats buildings by transferring in thermal energy from an outside source. |
| HGV | Heavy goods vehicle (any truck over 3.5 tonnes). |
| Internet of things | The network of everyday objects that are connected to the internet. The objects can connect and share data with each other and are embedded with sensors and software that enable them to do this. |
| Cultured meat | Meat produced by culturing cells outside of the animal’s body, through tissue engineering techniques. |
| Levers | Quantitative model settings that can be adjusted to match the descriptions of an imagined scenario, allowing computational modelling to take place. |
| Library of things | An organisation that owns items (such as equipment for gardening or home improvement) that can be lent to customers. |
| Met Soc | The metropolitan society. |
| Metaverse | A hypothesised future generation of the internet, in which there is a shared immersive and persistent 3D virtual reality space, acting as an extension to the physical world and allowing humans to interact with a computer-generated environment. |
| MtCO2e | Megatonne of carbon dioxide emissions. |
| NDNS | National Diet and Nutrition Survey. |
| NOx | Nitrogen oxides; toxic gas molecules contributing to pollution. |
| NTS | UK National Travel Survey. |
| OBR | Office for Budget Responsibility. |
| OECD | Organisation for Economic Co-operation and Development. |
| ONS | Office for National Statistics. |
| Parameters | A numerical value informed by data that can be used in a model. |
| PJ | Peta joule. |
| PM2.5 | Particulate matter less than 2.5 micrometres in diameter. |
| R&D | Research and development. |
| Reshoring | The process of moving manufacturing of a product from abroad to the country where it is sold. |
| Rewilding | The process of restoring land to its natural, uncultivated state. |
| SL Soc | The slow lane society |
| Soil sequestration | The process in which carbon dioxide is captured from the atmosphere and stored in the soil carbon store. |
| SP Soc | The self-preservation society. |
| Telepresence | Technology that allows people to carry out tasks from a virtual location, as if they were in a situation physically. |
| The atomised society | A stretching yet plausible future societal scenario, in which economic growth and technological progress are high, and social cohesion and institutional trust are low. |
| The metropolitan society | A stretching yet plausible future societal scenario, in which economic growth and technological progress are high, and social cohesion and institutional trust are also high. |
| The self-preservation society | A stretching yet plausible future societal scenario, in which economic growth and technological progress are low, and social cohesion and institutional trust are also low. |
| The slow lane society | A stretching yet plausible future societal scenario, in which economic growth and technological progress are low, and social cohesion and institutional trust are high. |
| Trends | General movements across society in an identifiable direction. |
| UK NHM | UK National Household Model. |
| UK TIMES model | A model for the energy system of the UK, developed by UCL and BEIS. |
| UKTM | UK Times Model. |
| VR | Virtual Reality. |
| Weak signals | Early indicators of change or emerging issues that may become more significant. |
References
CCC (2020). The sixth carbon budget: the UK’s path to net zero. Climate Change Committee
CCC (2022). Progress in reducing emissions: 2022 report to parliament. Climate Change Committee
BEIS (2021). Net zero strategy: build back greener. Department for Business, Energy and Industrial Strategy
Stark, C. & Thompson, M. (2019). Net zero: the UK’s contribution to stopping global warming. Climate Change Committee
National Grid ESO (2022). Future energy scenarios. National Grid ESO
BEIS (2021). Impact assessment for the sixth carbon budget. Department for Business, Energy and Industrial Strategy
OECD (2020). Tax policy reforms. Organization for Economic Cooperation and Development
Barrett, J., Pye, S., Betts-Davies, S., Broad, O., Price, J., Eyre, N., Anable, J., Brand, C., Bennett, G., Carr-Whitworth, R., Garvey, A., Giesekam, J., Marsden, G., Norman, J., Oreszczyn, T., Ruyssevelt, P. & Scott, K. (2022). Energy demand reduction options for meeting national zero-emission targets in the United Kingdom. Nature Energy, 7(8), 726–735.
Chewpreecha, U. & Summerton, P. (2020). Economic impact of the sixth carbon budget. Cambridge Econometrics
GO-Science (2018). Futures toolkit for policy-makers and analysts. Government O ffice for Science
BGS (2023). The greenhouse effect. British Geological Survey
BEIS (2022). UK greenhouse gas emissions: other technical reports. Department for Business, Energy and Industrial Strategy
IEA (2022). Global energy review: CO2 emissions in 2021. International Energy Agency
Bhanumati, P., de Haan, M. & Tebrake, J. (2022). Greenhouse emissions rise to record, erasing drop during pandemic. International Monetary Fund
The Climate Change Act 2008 (2050 Target Amendment) Order 2019.
CCC (2021). Progress in reducing emissions: 2021 report to parliament. Climate Change Committee
Schultz, P. (2022). Secret agents of influence: leveraging social norms for good. Current Directions in Psychological Science, 31(5), 443–450.
Yamin, P., Fei, M., Lahlou, S. & Levy, S. (2019). Using social norms to change behavior and increase sustainability in the real world: a systematic review of the literature. Sustainability, 11(20), 5847.
Kinzig, A. P., Ehrlich, P. R., Alston, L. J., Arrow, K., Barrett, S., Buchman, T. G., Daily, G. C., Levin, B., Levin, S., Oppenheimer, M., Ostrom, E. & Saari, D. (2013). Social norms and global environmental challenges: the complex interaction of behaviors, values, and policy. Bioscience, 63(3), 164–175.
Rothstein, B. & Stolle, D. (2008). The state and social capital: an institutional theory of generalized trust. Comparative Politics, 40(4), 441–459.
Sparkman, G., Howe, L. & Walton, G. (2021). How social norms are often a barrier to addressing climate change but can be part of the solution. Behavioural Public Policy, 5(4), 528–555.
Brown, A., Moodie, C. & Hastings, G. (2009). A longitudinal study of policy effect (smoke-free legislation) on smoking norms: ITC Scotland/United Kingdom. Nicotine and Tobacco Research, 11(8), 924–932.
BEIS (2021). Net zero societal change analysis project. Department for Business, Energy and Industrial Strategy
Barrett, J., Pye, S., Betts-Davies, S., Eyre, N., Broad, O., Price, J., Norman, J., Anable, J., Bennett, G., Brand, C., Carr-Whitworth, R., Marsden, G., Oreszczyn, T., Giesekam, J., Garvey, A. Ruyssevelt, P. & Scott, K. (2021). The role of energy demand reduction in achieving net-zero in the UK. Centre for Research into Energy Demand Solutions
ONS (2023). GDP expenditure components – real-time database. Office for National Statistics
Airports Commission (2013). Airports commission: interim report. Airports Commission
DfT (2022). Statistical data set: aviation (TSGB02). Department for Transport
Pillai, U. (2015). Drivers of cost reduction in solar photovoltaics. Energy Economics, 50, 286–293.
Bryant, C. (2019). We can’t keep meating like this: attitudes towards vegetarian and vegan diets in the United Kingdom. Sustainability, 11(23), 6844.
Jaciow, M., Rudawska, E., Sagan, A., Tkaczyk, J. & Wolny, R. (2022). The influence of environmental awareness on responsible energy consumption—the case of households in Poland. Energies, 15(15), 5339.
Fehér, A., Gazdecki, M, Véha, M., Szakály, M. & Szakály , Z. (2020). A comprehensive review of the benefits of and the barriers to the switch to a plant-based diet. Sustainability, 12(10), 4136.
Maggin, T. (2016). Vegan society poll. Ipsos
Johnson, G-R. (2022). How many vegetarians and vegans are in the UK?. Finder
ONS (2022). Families and households in the UK: 2021. Office for National Statistics
ONS (2019). The cost of living alone. Office for National Statistics
Marteau, T., Chater, N. & Garnett, E. (2021). Changing behaviour for net zero. BMJ, 375, n2293.
Shone, A. & Wilkinson, P. (2015). Corporate political engagement index 2015. Transparency International UK
ONS (2022). Trust in government, UK: 2022. Office for National Statistics
OBR (2022). Economic and fiscal outlook: November 2022. Office for Budget Responsibility
Lopez, R., Pastén, R. & Gutiérrez Cubillos, P. (2022). Climate change in times of economic uncertainty: A perverse tragedy of the commons?. Economic Analysis and Policy, 75, 209–225.
Lloyds Bank (2020). Business In Britain 2020. Lloyds Bank
Winning, M. & Willan, C. (2020). Towards net zero in UK manufacturing. University College London & HSBC
Trend-Monitor (2020). The structure of families and households in the UK. Trend-Monitor
ONS (2022). Is hybrid working here to stay?. Office for National Statistics
PWC (2022). State of climate tech 2021: scaling breakthroughs for net zero. PricewaterhouseCoopers
Preston, I., Banks, N., Hargreaves, K., Kazmierczak, A., Lucas, K., Mayne, R., Downing, C. & Street, R. (2014). Climate change and social justice: an evidence review. The Joseph Rowntree Foundation
Way, R., Ives, M., Mealy, P. & Farmer, J. (2021). Empirically grounded technology forecasts and the energy transition. Joule, 6(9), 2057– 2082.
DfT (2018). Road traffic forecasts 2018. Department for Transport
Wadud, Z. Mackenzie, D. & Leiby, P. (2016). Help or hinderance? The travel, energy and carbon impacts of highly automated vehicles. Transportation Research Part A: Policy and Practice, 86, 1–18.
Ahmad, T., Zhang, D., Huang, C., Zhang, H., Dai, N., Song, Y. & Chen, H. (2021). Artificial intelligence in sustainable energy industry: status quo, challenges and opportunities. Journal of Cleaner Production, 289, 125834.
Rainie, L., Anderson, J. & Vogels, E. (2021). Experts doubt ethical AI design will be broadly adopted as the norm within the next decade. The Pew Research Centre
Setzer, J. & Higham, C. (2022). Global trends in climate change litigation: 2022 snapshot. Grantham Research Institute.
Thomas-Peter, H. (2021). Fossil fuel firms sue governments across the world for £13bn as climate policies threaten profits. Sky News
EA (2022). Climate change civil penalties. Environment Agency
Agbugba, G., Okoye, G., Giva, M. & Marlow, J. (2019). The decoupling of economic growth from carbon emissions: UK evidence. Office for National Statistics
Partington, R. (2019). Britain now G7’s biggest net importer of CO2 emissions per capita, says ONS. The Guardian
Antunes, M., Barroca, J. & Oliveira, D. (2021). Urban future with a purpose: 12 trends shaping human living. Deloitte Insights
Beltrán, A., Maddison, D. & Elliott, R. (2018). Is flood risk capitalised into property values?. Ecological Economics, 146, 668–685.
Jenson, J. (2011). Defining and measuring social cohesion. Commonwealth Secretariat
Delhey, J., Boehnke, K., Dragolov, G., Ignácz, Z., Larsen, M., Lorenz, J. & Koch, M. (2018). Social cohesion and its correlates: a comparison of western and Asian societies. Comparative Sociology, 17(3–4), 426–455.
Charron, N. & Rothstein, B. (2018). Regions of trust and distrust: how good institutions can foster social cohesion. In: Bridging the Prosperity Gap in the EU (Eds. U. Bernitz, M. Mårtensson, L. Oxelheim & T. Persson, 220–242).
Janmaat, J. (2011). Social cohesion as a real-life phenomenon: assessing the explanatory power of the universalist and particularist perspectives. Social Indicators Research, 100(1), 61–83.
Andrews, R., Jilke, S., van de Walle, S. (2014). Economic strain and perceptions of social cohesion in Europe: does institutional trust matter?. European Journal of Political Research, 53(3), 559–579.
Arguedas, A. R., Robertson, C. T., Fletcher, R. & Nielsen, R. K. (2022). Echo chambers, filter bubbles, and polarisation: a literature review. The Reuters Institute for the Study of Journalism
Sønderskov, K. & Dinesen, P. (2016). Trusting the state, trusting each other? The effect of institutional trust on social trust. Political Behaviour, 38(1), 179–202.
Spadaro, G., Gangl, K., van Prooijen, J., van Lange, P. & Mosso, C. (2022). Enhancing feelings of security: how institutional trust promotes interpersonal trust. PLoS One, 15(9), e0237934.
Clair, R., Gordon, M., Kroon, M. & Reilly, C. (2021). The effects of social isolation on well-being and life satisfaction during pandemic. Humanities & Social Sciences Communications, 8(28).
Lieberz, J., Shamay‐Tsoory, S., Saporta, N., Esser, T., Kuskova, E., Stoffel‐Wagner, B., Hurlemann, R. & Scheele, D. (2021). Loneliness and the social brain: how perceived social isolation impairs human interactions. Advanced Science, 8(21), e2102076.
Rotenberg, K. (1994). Loneliness and interpersonal trust. Journal of Social and Clinical Psychology, 13(2), 152–173.
Rapolienė, G. & Aartsen, M. (2022). Lonely societies: low trust societies? Further explanations for national variations in loneliness among older Europeans. European Journal of Ageing, 19(3), 485–494.
Yang, J. & Moorman, S. (2021). Beyond the individual: evidence linking neighborhood trust and social isolation among community-dwelling older adults. The International Journal of Aging and Human Development, 92(1), 22–39.
Mitsch, F., Lee, N. & Ralph Morrow, E. (2021). Faith no more? The divergence of political trust between urban and rural Europe. Political Geography, 89, 102426.
Kenny, M. & Luca, D. (2021). The urban-rural polarisation of political disenchantment: an investigation of social and political attitudes in 30 European countries. Cambridge Journal of Regions, Economy and Society, 14(3), 565–582.
Xu, C. (2021). Effects of urbanization on trust: evidence from an experiment in the field. Journal of Economic Psychology, 87, 102450.
Ligthart, J. & van Oudheusden, P. (2015). In government we trust: the role of fiscal decentralization. European Journal of Political Economy, 37, 116–128.
Kim, S., Lee, Y. & Kim, T. (2022). The relationship between fiscal decentralization and trust in government: evidence from the South Korean case. International Review of Administrative Science, 88(2), 373–389.
Kaldor, N. (1957). A model of economic growth. The Economic Journal, 67(268), 591–624.
Pakes, A. & Sokoloff, K. (1996). Science, technology, and economic growth. PNAS, 93(23),12655–12657.
Maradana, R., Pradhan, R., Dash, S., Gaurav, K., Jayakumar, M. & Chatterjee, D. (2017). Does innovation promote economic growth? Evidence from European countries. Journal of Innovation and Entrepreneurship, 6(1).
Chen, M., Zhang, H., Liu, W. & Zhang, W. (2014). The global pattern of urbanization and economic growth: evidence from the last three decades. PLoS One, 9(8).
Nguyen, H. & Nguyen, L. (2018). The relationship between urbanization and economic growth: an empirical study on ASEAN countries. International Journal of Social Economics, 45(2), 316–339.
Brunt, L. & García-Peñalosa, C. (2022). Urbanisation and the onset of modern economic growth. The Economic Journal, 132(642), 512–545.
Miller, H. (2014). What are the features of urbanisation and cities that promote productivity, employment and salaries?. Department for International Development & EPS PEAKS
Quigley, J. (2008). Urbanization, agglomeration, and economic development. The World Bank
Fang, C. & Yu, D. (2017). Urban agglomeration: an evolving concept of an emerging phenomenon. Landscape and Urban Planning, 162, 126–136.
Wu, L., Jiang, Y., Wang, L. & Qiao, X. (2022). The two faces of urbanisation and productivity: enhance or inhibit? New evidence from Chinese firm‐level data. Asian-Pacific Economic Literature, 36(1), 126–142.
Turok, I. & McGranahan, G. (2019). Urbanisation and economic growth: the arguments and evidence for Africa and Asia. Urbanisation, 4(2), 109–125.
Venables, A., Laird, J. & Overman, H. (2014). Transport investment and economic performance. Department for Transport
Chen, M., Zhang, H., Liu, W. & Zhang, W. (2014). The global pattern of urbanization and economic growth: evidence from the last three decades. PLoS One, 9(8).
Roser, M., Ortiz-Ospina, E. & Ritchie, H. (2022). Life expectancy. Our World in Data
Preston, S. (1975). The changing relation between mortality and level of economic development. Population Studies, 29(2), 231-248.
Euromonitor International (2014). Economic growth and life expectancy: do wealthier countries live longer?. Euromonitor International.
Lutz, W. & Kebede, E. (2018). Education and health: redrawing the Preston curve. Population and Development Review, 44(2), 343–361.
Ecob, R. & Davey Smith, G. (1999). Income and health: what is the nature of the relationship?. Social Science & Medicine, 48(5), 693–705.
Rea, M. & Tabor, D. (2022). Health state life expectancies by national deprivation deciles, England: 2018 to 2020. Office for National Statistics.
Lichtenberg, F. (2015). The impact of biomedical innovation on longevity and health. Nordic Journal of Health Economics, 5(1), 45–57.
Aperion Care (2022). Inventions that drive modern life expectancy. Aperion Care
DfID (2010). Fair society, healthy lives: the Marmot Review: strategic review of health inequalities in England post-2010. Department for International Development
Kondo, N., Sembajwe, G., Kawachi, I., van Dam, R. M., Subramanian, S. & Yamagata, Z. (2009). Income inequality, mortality, and self-rated health: meta-analysis of multilevel studies. BMJ, 339, b4471–b4471.
Onofrei, M., Vatamanu, A. & Cigu, E. (2022). The relationship between economic growth and CO2 emissions in EU countries: a cointegration analysis. Frontiers in Environmental Science, 10.
Acheampong, A. (2018). Economic growth, CO2 emissions and energy consumption: what causes what and where?. Energy Economics, 74, 677–692.
Osadume, R. & University, E. (2021). Impact of economic growth on carbon emissions in selected West African countries, 1980–2019. Journal of Money and Business, 1(1), 8–23.
Yusuf, A., Abubakar, A. & Mamman, S. (2020)Relationship between greenhouse gas emission, energy consumption, and economic growth: evidence from some selected oil-producing African countries. Environmental Science and Pollution Research, 27, 15815–15823.
Ritchie, H. (2021). Many countries have decoupled economic growth from CO2 emissions, even if we take offshored production into account. Our World in Data
Agarwala, M. & Martin, J. (2022). Environmentally-adjusted productivity measures for the UK: working paper 28. The Productivity Institute
BEIS (2022). National statistics: energy consumption in the UK. Department for Business, Energy and Industrial Strategy
Topolewski, Ł. (2021). Relationship between energy consumption and economic growth in European countries: evidence from dynamic panel data analysis. Energies, 14(12), 3565.
Odugbesan, J. & Rjoub, H. (2020). Relationship among economic growth, energy consumption, CO2 emission, and urbanization: evidence From MINT countries. SAGE Open,10(2).
Diacon, P. & Maha, L. (2015). The relationship between income, consumption and GDP: a time series, cross-country analysis. Procedia Economics and Finance, 23, 1535–1543.
Osuntuyi, B. & Lean, H. (2022). Economic growth, energy consumption and environmental degradation nexus in heterogeneous countries: does education matter?. Environmental Sciences Europe, 34(1).
OBR (2022). Economic and fiscal outlook: March 2022. Office for Budget Responsibility
ONS (2022). Population projections. Office for National Statistics
ONS (2023). Gross domestic product (average) per head, CVM market prices: SA. Office for National Statistics
NIC (2016). The impact of population change and demography on future infrastructure and demand. National Infrastructure Commission
CCC (2018). Reducing UK emissions: 2018 progress report to parliament. Climate Change Committee
Maguire, E. & Monsivais, P. (2015). Socio-economic dietary inequalities in UK adults: an updated picture of key food groups and nutrients from national surveillance data. British Journal of Nutrition, 113(1),181–189.
World Bank (2022). Urban population (% of total population) United Kingdom. World Bank Group
DIT (2022). Analysis of trends in industrial sectoral demand. Department for International Trade
VOA (2022). Non-domestic rating: stock of properties including business floorspace. Valuation Office Agency
DfT (2022). National travel survey. Department for Transport
Shi, Y., Sorrell, S.R. & Foxon, T.J. (2022). Do teleworkers have lower transport emissions? What are the most important factors?. SSRN
BEIS (2021). Energy follow up survey (EFUS) 2017. Department for Business, Energy and Industrial Strategy
BEIS (2017). National household model. Department for Business, Energy and Industrial Strategy
Büchs, M. & Mattioli, G. (2021). Trends in air travel inequality in the UK: from the few to the many?. Travel Behaviour and Society, 25, 92–101.
Cohen, S. & Gossling, S. (2015). A darker side of hypermobility. Environment and Planning A: Economy and Space, 47(8),166–1679.
Cohen, S., Higham, J. & Cavaliere, C. (2011). Binge flying: behavioural addiction and climate change. Annals of Tourism Research, 38(3), 1070–1089.
DfT (2022). Road traffic estimates in Great Britain: 2021. Department for Transport
Marsden, G., Anable, J., Bray, J., Seagriff, E. & Spurling, N. (2019). Shared mobility: Where now? Where next? Second report of the commission on travel demand. Centre for Research into Energy Demand Solutions
OECD (2021). Exploring the impact of shared mobility services on CO2. Organization for Economic Cooperation and Development
Make UK (2022). UK manufacturing the facts: 2022. Make UK
PHE (2016). Government dietary recommendations: government recommendations for food energy and nutrients for males and females aged 1–18 and 19+ years. Public Health England
PHE (2021). NDNS: diet and physical activity a follow-up study during COVID-19. Public Health England
Defra (2021). United Kingdom food security report 2021: theme 2 UK food supply sources. Department for Environment, Food and Rural Affairs
Parry, A., LeRoux, S., Quested, T. & Parfitt, J. (2014). UK food waste: historical changes and how amounts might be influenced in the future. WRAP
Defra (2022). Food statistics in your pocket. Department for Food, Environment and Rural Affairs
GO-Science (2022). Systems thinking for civil servants. Government Office for Science
Hook, A., Court, V., Sovacool, B. & Sorrell, S. (2020). A systematic review of the energy and climate impacts of teleworking. Environmental Research Letters, 15(9).
O’Brien, W. & Yazdani Aliabadi, F. (2020). Does telecommuting save energy? A critical review of quantitative studies and their research methods. Energy Build, 225.
Kikstra, J. S., Vinca, A., Lovat, F., Boza-Kiss, B., van Ruijven, B., Wilson, C., Rogelj, J., Zakeri, B., Fricko, O. & Riahi, K. (2021). Climate mitigation scenarios with persistent COVID-19-related energy demand changes. Nature Energy, 6(12), 1114–1123.
Bui, M., Adjiman, C., Bardow, A., Anthony, E., Boston, A., Brown, S., Fennell, P., Fuss, S., Galindo, A., Hackett, L., Hallett, J., Herzog, H., Jackson, G., Kemper, J., Krevor, S., Maitland, G., Matuszewski, M., Metcalfe, I., Petit, C., Puxty, G., Reimer, J., Reiner, D., Rubin, E., Scott, S., Shah, N., Smit, B., Trusler, J., Webley, P., Wilcox, J. & Mac Dowell, N. (2018). Carbon capture and storage (CCS): the way forward. Energy & Environmental Science, 11(5), 1062–1176.
Pershad, H., Standen, E., Durusut, E. & Slater, S. (2013). Carbon capture and storage (CCS) costs for UK industry: high level review. Department for Business Innovation and Skills & Department of Energy and Climate Change
National Academies of Science, Engineering and Medicine (2019). Negative emissions technologies and reliable sequestration: a research agenda. National Academies of Science, Engineering and Medicine
Gough, C., Garcia-Freites, S., Jones, C., Mander, S., Moore, B., Pereira, C., Röder, M., Vaughan, N. & Welfle, A. (2018). Challenges to the use of BECCS as a keystone technology in pursuit of 1.5⁰C. Global Sustainability, 1, e5.
Fajardy, M. & Mac Dowell, N. (2017). Can BECCS deliver sustainable and resource efficient negative emissions?. Energy & Environmental Science, 10(6), 1389–1426.
Welfle, A., Gilbert, P. & Thornley, P. (2014). Increasing biomass resource availability through supply chain analysis. Biomass and Bioenergy, 70, 249–266.
Muscat, A., de Olde, E., de Boer, I. & Ripoll-Bosch, R. (2020). The battle for biomass: a systematic review of food-feed-fuel competition. Global Food Security, 25, 100330.
BEIS (2022). Direct air capture and other greenhouse gas removal technologies competition. Department for Business, Energy and Industrial Strategy
IEA (2022). Direct air capture. International Energy Agency.
Scheelhaase, J., Maertens, S. & Grimme, W. (2019). Synthetic fuels in aviation: current barriers and potential political measures. Transportation Research Procedia, 43, 21–30.
Bows-Larkin A., Mander S., Traut M., Anderson K. & Wood F. (2016). Aviation and climate change: the continuing challenge. Encyclopaedia of Aerospace Engineering
Sharmina, M., Edelenbosch, O., Wilson, C., Freeman, R., Gernaat, D., Gilbert, P., Larkin, A., Littleton, E., Traut, M., van Vuuren, D., Vaughan, N., Wood, F. & Le Quéré, C. (2021). Decarbonising the critical sectors of aviation, shipping, road freight and industry to limit warming to 1.5–2°C. Climate Policy, 21 (4), 455–474.
The Royal Society (2019). Sustainable synthetic carbon based fuels for transport. The Royal Society
DfT (2021). Green fuels, green skies competition: winners. Department for Transport
HM Treasury (2021). Autumn budget and spending review 2021. HM Treasury
DfT (2022). Net zero transatlantic flight fund. Department for Transport
Defra (2022). Research and analysis: farming and environment evidence packs latest editions. Department for Environment, Food and Rural Affairs
Bailey, H., Brookes, K. & Thompson, P. (2014). Assessing environmental impacts of offshore wind farms: lessons learned and recommendations for the future. Aquatic Biosystems, 10(1), 8.
OBR (2019). Economic and fiscal outlook: March 2019. Office for Budget Responsibility
Rising, J., Dietz, S., Dumas, M., Khurana, R., Kikstra, J., Lenton, T., Linsenmeier, M., Smith, C., Taylor, C. & Ward, B. (2022). What will climate change cost the UK? Risks, impacts and mitigation for the net-zero transition. Grantham Research Institute on Climate Change and the Environment.
Greenstone, M., Hasenkopf, C. & Lee, K. (2022). Air quality life index (AQLI) annual update. Energy Policy Institute at the University of Chicago
Stylianou, K.S., Fulgoni, V. & Jolliet, O. (2021). Small targeted dietary changes can yield substantial gains for human health and the environment. Nature Food, 2(8), 616–627.
Sciencewise (2023). Welcome to Sciencewise. Sciencewise
King, M., Padmanabhan, C. & Rose, K. (2021). Engaging the public on climate change: a literature review. Centre for Public Impact
Demski, C. (2021). Net zero public engagement and participation. Department for Business, Energy and Industrial Strategy
Willis, R., Curato, N. & Smith, G. (2022). Deliberative democracy and the climate crisis. Wiley Interdisciplinary reviews: Climate Change, 13(2), e759.
Wells, R., Howarth, C. & Brand-Correa, L. (2021). Are citizen juries and assemblies on climate change driving democratic climate policymaking? An exploration of two case studies in the UK. Climate Change, 168(1–2), 5.
University of Lancaster (2022). The role of deliberative public engagement in climate policy development A report for the Climate Change Committee. Climate Change Committee
House of Lords Environment and Climate Change Committee (2022). In our hands: behaviour change for climate and environmental goals. UK Parliament
ONS (2021). Three quarters of adults in Great Britain worry about climate change. Office for National Statistics
Thompson, S. (2022). UK public still broadly supports most net zero policies. Ipsos
Flynn, C., Yamasumi, E., Fisher, S., Snow, D., Grant, Z., Kirby, M., Browning, P., Rommerskirchen, M. & Russell, I. (2021). People’s climate vote. United Nations Development Programme
Climate Outreach (2022). Net zero, fairness and climate politics. Climate Outreach
Mellier-Wilson, C. & March S. (2020). UK climate change citizens’ assemblies and citizens’ juries. Involve
Lucien, M. (2021). What a citizen-led low carbon vision looks like. Shared Future
Climate Assembly UK (2020). Climate assembly UK: The path to net zero. House of Commons & Involve
Deloitte (2021). Futures we want. UN Climate Change Conference UK 2021
ONS (2021). Measuring UK greenhouse gas emissions. Office for National Statistics
PHE (2016). National diet and nutrition survey. Public Health England