United Kingdom Food Security Report 2021: Theme 2: UK Food Supply Sources
Updated 22 October 2024

© Crown copyright 2024
This publication is licensed under the terms of the Open Government Licence v3.0 except where otherwise stated. To view this licence, visit nationalarchives.gov.uk/doc/open-government-licence/version/3 or write to the Information Policy Team, The National Archives, Kew, London TW9 4DU, or email: psi@nationalarchives.gov.uk.
Where we have identified any third party copyright information you will need to obtain permission from the copyright holders concerned.
This publication is available at https://www.gov.uk/government/statistics/united-kingdom-food-security-report-2021/united-kingdom-food-security-report-2021-theme-2-uk-food-supply-sources
Part of the United Kingdom Food Security Report 2021
Presented to Parliament pursuant to Section 19 of the Agriculture Act 2020
© Crown copyright 2021
ISBN 978-1-5286-3111-2
This chapter of the UK Food Security Report looks at food security in terms of where the UK gets its food from. It focuses specifically on the UK’s principal sources of food at home and overseas. It describes the UK’s domestic production, and trends in agricultural productivity, fisheries and food waste both before and after the “farm gate”. It considers important factors in maintaining domestic productivity, such as soil health, fertiliser use, agricultural inputs, and biodiversity. The chapter also discusses the principal sources on which the UK relies for its food imports. It considers data points which will help future UK Food Security Reports assess the food security impacts of the UK’s 2020 departure from the EU, in terms both of changes to domestic production practices and to the UK’s trading relationship with the world. These impacts are likely to take some time to become apparent in statistics.
In terms of this theme, food security means strong and consistent domestic production of food combined with a diversity of supply sources that avoids overreliance on any one source.
Key messages
-
The UK has diverse and longstanding trade links that meet consumer demand for a range of products at all times of the year. Trade is dominated by countries in the EU and it is too early to say what effect leaving the EU might have on that trade.
-
Domestic production is also stable, with variations in yield and consumer demand balanced by imports and exports. Both agricultural production and manufacturing have become increasingly efficient and are geared towards meeting consumer demand, although food waste is still high.
-
The biggest medium to long term risk to the UK’s domestic production comes from climate change and other environmental pressures like soil degradation, water quality and biodiversity. Wheat yields dropped by 40% in 2020 due to heavy rainfall and droughts at bad times in the growing season. Although they have bounced back in 2021, this is an indicator of the effect that increasingly unreliable weather patterns may have on future production.
Domestic production
To ensure a consistent supply of food, the UK relies both on its own production and on imports. Home-grown produce is the largest source of food for the UK. Resilience is ensured through a combination of strong domestic production from the UK’s productive agriculture and food manufacturing sectors, and a diverse range of overseas supply sources.
The UK currently produces about 60% of its domestic food consumption by economic value, part of which is exported. This means just under half of the actual food on plates is produced in the UK, including the majority of grains, meat, dairy, and eggs. This figure would be higher without exports. UK supply comprises domestic production excluding exports, plus imported food. The production to supply ratio, important for understanding the UK’s self-sufficiency, has remained stable over the last two decades, and for crops that can be commercially grown in the UK has been around 75%.
The UK has a productive agricultural sector and a domestic agri-food manufacturing industry that produces food to high standards. The amounts and types of food produced are driven by market forces and consumer demand for goods, rather than by assessment of overall quantity of food or of self-sufficiency. Many factors affect the output of domestic production, including:
-
The availability and suitability of land for particular forms of production.
-
Inputs such as labour, water, fertiliser, pesticides, and seeds.
-
Climate and environmental factors such as soil health and rainfall.
In 2020 71% of UK land area was used for agricultural production, the majority of this being grassland for grazing rather than crops. Not all land is suitable for growing crops, and some is suitable only for specific crops. Land use overall has changed little in the last thirty years, with annual variation between specific crops due to factors such as the weather and prices rather than long-term or systematic variation. Domestic production faces a number of long-term and short-term risks, including soil degradation, drought and flooding, diseases, risks to fuel and fertiliser supplies, and changing labour markets. In the long term, climate change impacts are likely to have a negative effect on the proportion of high-grade arable farmland available in the UK.
Diverse international supply sources
Overreliance on one geographical area and dependence on particular supply sources makes food supply more vulnerable, while diversity of sources makes it more resilient. UK consumer preferences and diets include a range of products that cannot be grown in the UK or cannot be grown year-round. Therefore, the UK does not produce everything it eats or eat everything it produces.
In 2020, the UK imported 46% of the food it consumed. Having a diverse range of international sources makes food supply more resilient, as if the production or output of one source is disrupted, other sources can meet demand. No one country provided more than 11% of those imports, a picture which has been stable for some time. By value, £48 billion of food, feed, and drink (FFD) was imported and £21.4 billion was exported.
Overall, the UK’s food supply is concentrated on the UK and Europe, with over 80% of supply coming from these main sources. The remainder is mostly spread between Africa, Asia, North America, and South America. This picture has changed little in the last 10 years. EU countries continue to be the main source for FFD imports and are therefore essential to the UK’s food security. 39% of FFD imports by value were despatched from 4 EU countries (the Netherlands, Republic of Ireland, Germany, and France) in 2020.
The landscape of UK imports and domestic production is currently in a state of change after leaving the European Union, the UK’s largest trading partner in agri-food. The impact of the UK’s new trading relationship is not yet visible in data. Domestic production may also change in future with the removal of subsidies managed through the European Common Agricultural Policy (CAP) and through the planned introduction of new environmental land management schemes in parts of the UK.
The UK is more reliant on particular countries or regions for specific foodstuffs at different times of the year, due to a variety of growing seasons across the world. Seasonality is complex and product specific. The UK depends on diverse supply lines to meet demand for out-of-season products throughout the year, following growing seasons across the world. Year-round access to out of season fresh fruit and vegetables (FFV) has increased in the last 20 to 30 years, leading to longer and more complex supply chains.
Focusing on food categories:
-
The UK is largely self-sufficient in production of grains, producing over 100% of domestic consumption of oats and barley and over 90% of wheat. Average yields over recent decades have been broadly stable but fluctuate from year to year as a result of better or worse weather. Increasingly unpredictable and extreme weather as a result of climate change is likely to exacerbate these fluctuations. Wheat yields in 2020 were the lowest since 1981 due to of unusually bad weather. However, preliminary data indicates they have since increased in 2021.
-
In meat, milk, and eggs, the UK produces roughly equivalent volume to what it consumes. In 2020 it produced 61kg of meat, 227L of milk and 172 eggs per person per year. By value, the UK is a net importer of dairy and beef. This reflects UK consumer preferences for eating higher value products, while lower value products are exported.
-
The UK produces a significant proportion of its other crop needs, including around 60% of sugar beet, 70% of potatoes and 80% of oilseeds. Apart from a recent pest-related reduction in oilseeds, these proportions have remained stable over the last ten years. Climate change represents a risk to production both in terms of making conditions unsuitable for some crops and allowing new pests to proliferate but it may also benefit new types of crops.
-
The UK produces over 50% of vegetables consumed domestically, but only 16% of fruit. 93% of domestic consumption of fresh vegetables was fulfilled by domestic and European production, while fruit supply is more widely spread across the EU, Africa, the Americas, and the UK.
-
The UK both produces and consumes fish and seafood, but is a net importer overall. UK consumer preference is for fish mainly caught outside UK waters, such as cod, haddock, tuna, and shrimp and prawns. This means that the UK exports much of what it catches and imports much of what it eats. Supply sources for imports are diverse, with northwest Europe and China the most significant sources. Most of the fisheries which supply UK imports are well managed and have sustainable stocks, although climate change presents a risk to fish stocks. The UK has a significant fishing fleet which mainly exports to the EU, US and China. Important exports include herring, mackerel, salmon and nephrops (scampi).
Inputs and waste in domestic production
There are a range of contributing inputs and risk factors which can affect the UK’s domestic production capacity and food security both in the short and medium term.
Agriculture relies on specific inputs to produce food. The cost of these inputs varies year to year. This presents a significant risk to farming economies, and therefore to food security. Profit margins in agriculture are low and so fluctuations in prices can cause problems. Feed is both the most significant expense for UK farmers and the least stable in terms of price. The overall supply, diversity, and sustainability of fertilisers, pesticides, seeds, and fuel amongst other inputs are also important and vary in different degrees for different categories.
Inefficiencies and wastage in food production and processing reduce both the quantity of food that can be consumed domestically or be exported. They also represent unnecessary land and resource use, contributes millions of tonnes of carbon emissions, and involves billions of pounds of wasted value.
Estimated annual combined surplus and waste in primary production is 3.6 million tonnes (Mt), which is between 6 and 7% of total output. Wastage in households and post farm gate businesses also reduces the effective supply of UK food. Waste post-farmgate is estimated at 9.5Mt, of which 7.7Mt is in households and hospitality and 1.8Mt in manufacturing and retail. These figures compare to around 43Mt of food purchased for consumption in the UK. The highest contributor to this total by weight were UK households, with 70% of post-farmgate waste arising in the home. Long term trends do show a reduction in UK household food waste but average waste of 4 key products was generally around 20% between 2018 and 2021. Household food waste fell sharply at the outset of the coronavirus (COVID-19) pandemic with improved food management behaviours leading to a significant reduction in self-reported household food waste in 2020. These positive changes, however, have started to decline with people returning to a pre-pandemic lifestyle and food waste levels have increased again in 2021 to pre-pandemic levels.
Long term sustainability of UK food production
The UK’s agriculture sector relies on natural capital, and the degradation of this natural capital poses an underlying threat to the UK’s ability to produce food. The ecosystems services from natural capital provide key inputs to food production, which often go uncounted, as does the impact of agriculture on the environment which produces them. The UK is not unique in this around the world and understanding and adapting to produce food sustainably and to maintain and improve natural capital stocks in the long term is key.
Sustainable production methods help to ensure the UK’s long term food security by protecting the natural capital embedded in soil, water, and biodiverse ecosystems. In England, three new environmental land management schemes will incentivise producers in to farm more sustainably. A Sustainable Farming Scheme is currently being considered by the Welsh Government. The impacts of these schemes on agricultural land use are not currently clear but will be monitored in future UK Food Security Reports.
Key natural capital assets for food production are soils. Estimates suggest soil degradation, erosion, and compaction are costing about £1.2 billion each year and reducing the capacity of UK soils to produce food. Whilst trends appear to be negative, specific data is currently lacking.
The wider impacts of human exploitation of the atmosphere as a natural asset through climate change and emissions also pose significant risks to production and food security. As a consequence of unusual weather patterns linked to climate change, wheat yields in 2018 were 7% below the 2016 to 2020 average, and 17% down in 2020. Total economic losses for wheat, potatoes and oilseed rape in the UK caused by ozone were calculated to be £185 million in 2018, with more than 97% of those losses occurring in England. Based on modelling by the Met Office, significant future risks to UK food production include heat stress to livestock, drought, pests and pathogens, and increased soil erosion risks.
Indicator 2.1.1 UK Production Capability
Headline
The UK currently produces the equivalent of about 60% of domestic consumption by value, part of which is exported. About 54% of food on plates is produced in the UK, including the majority of grains, meat, dairy, and eggs. Self-sufficiency is about 54% in fresh vegetables, and 16% in fruit, as subsequent indicators will set out. UK food production is driven by market forces rather than aiming to maximise calorie production from available land.
Context and Rationale
The Food Production to Supply Ratio is calculated as the farmgate value of raw food production divided by the value of raw food for human consumption. Essentially it compares the value of what is produced in the UK with what is consumed. The production to supply ratio is higher for indigenous type food, the food products which can be produced in the UK. For all food it is lower because this accounts for consumption of food types which cannot be produced in the UK for reasons of climate, soil, or other factors.
Data and Assessment
Figure 2.1.1a: UK food production to supply ratio

Production to Supply Ratio
Source: Defra Agriculture in the United Kingdom (AUK) 2020
The production to supply ratio is estimated to be 60% for all food in 2020 and 76% for indigenous type food (that which can be commercially grown domestically). Actual consumption of UK-produced food is closer to 54%, as a part of UK production is exported.
Trends
From a peak in the mid-1980s the production to supply ratio declined into the early 2000s and has not changed significantly since then. Market prices and the economics and risks inherent in agricultural production have led the ratio to settle at about 60%. Alterations in the proportion of domestic production to supply would change the level of exposure to national scale risks, including climate change and extreme weather events.
Indicator 2.1.2 Current land area in production
Headline
In June 2020, 71% of the UK’s land, or 17.3 million hectares, was used for agricultural production, of which 72% was grassland and 26% cropland, with the remainder being set-aside or fallow land. Trends in land use have been generally stable over the last 30 years, but climate change poses a threat to high quality arable farmland and competition for land use is increasing.
Context and Rationale
Measuring the land area in production gives a sense of the place of food production in overall land use. The definition of land used for agricultural production includes arable, horticultural, uncropped arable, common rough grazing, grassland (temporary and permanent), and land for outdoor pigs, but not woodland or other non-agricultural land.
It is important to recognise that not all land is created equal. Grass will grow almost anywhere, but gradient, soil quality, rainfall, water levels, and other factors make much of the UK’s agricultural area unsuitable for crops, while other parts are suitable only for specific crops.
Data and Assessment
Figure 2.1.2a: UK agricultural land use

Land Usage
Source: Defra AUK 2020
Total agricultural land use, divided here into grassland and cropland, has declined a little since 1990. The high proportion of grassland primarily reflects the unsuitability of much of the UK’s land for growing crops, and the relative suitability of those areas for grazing. As illustrated by the next figure, a small proportion of this grassland (1.2 million ha) is temporary grassland on croppable land, for example in crop rotations.
Figure 2.1.2b: Breakdown of UK croppable area on agricultural holdings

Crop Areas
Source: Defra AUK 2020
The majority of the UK’s croppable land is used for grain production (3 million ha), with 415,000 ha used for oilseed, 142,000 ha for potatoes, 166,000 ha for horticultural crops, and 719,000 ha for other crops in 2020. Much of the annual variation between specific crops is due to factors such as the weather and prices rather than any long-term and more systematic variation. An exception is the decline since 2018 in land given to oilseeds, which partly reflects increased pesticide resistance among stem flea beetles and the withdrawal of neonicotinoid insecticides. An increase in ‘Other crops’ suggests farmers are planting a larger variety of crops than previously.
Trends
Over the last 30 years land use has been fairly stable for most crops, allowing for fluctuations in prices and weather conditions. However, Defra-commissioned research suggests climate change impacts under a medium emissions scenario could reduce the proportion of ’best and most versatile’ arable farmland (ALC 1, 2, and 3a) from 38.1% of agricultural land on a 1961 to 1990 baseline to 11.4% by 2050, with consequences for food production and meeting Net Zero. Under a high emissions scenario it could reduce to 9.2% of agricultural land; however there is quite high uncertainty about projections of this kind.[footnote 1] Meeting Net Zero, climate change mitigation, and biodiversity goals will increasingly add to existing, competing pressures on land use.
Indicator 2.1.3 UK food imports and exports
Headline
In 2020, the UK imported 46% of the food it consumed. No one country provides more than 11% of those imports, a picture which has been stable for some time. By value, £48 billion of FFD was imported and £21.4 billion was exported.
Context and Rationale
The scale of the UK’s imports highlights the value to the UK of imported food and drink. Being well connected with producer countries and having a strong internal economy to compete for their exports puts the UK in a more secure position in terms of food security.
Imports and exports also support consumer preference for particular types of products. In the meat industry, for example, international supply chains allow UK consumers to buy their preferred cuts, while others are exported for profit. Exports also make valuable economic contributions to the sector, helping to sustain domestic production and local economies all around the UK. For food security purposes, considering exports alongside imports gives perspective to the scale of imports, as well as providing an overview of the value of UK production which is not consumed in the UK. It should be noted that this economic value is not equivalent to nutritional value for consumers when considering imports and exports; for example, whisky is the UK’s most valuable FFD export.
Data and Assessment
Figure 2.1.3a: UK imports of FFD by value and by country of dispatch,2020

Imports by country
Source: Defra AUK 2020
Figure 2.1.3b: UK exports of FFD by value and by country of destination,2020

Exports by country
Source: Defra AUK 2020
The UK’s top trading partners in value terms, with the exception of the USA, are all close geographical neighbours. In the case of Ireland, there is a shared land border, whilst France and the Netherlands represent the shortest sea crossing and a major international port facility respectively. In addition, the climate in Italy, southern France, and Spain, coupled with UK consumer expectations for year-round availability, mean that these countries are essential for trade in fresh produce.
Figure 2.1.3c: Values of UK FFD trade EU and non-EU, 2019 to 2021

Imports Exports EU Non EU
Source: HMRC
From the latest available data, which covers the period up to September 2021, the overall value of FFD trade has recovered from the low levels seen in early 2021 and is largely back to levels seen in previous years. In Q3 2021, the total value of exports was 6% lower than Q3 2020 and the total value of imports was 2% lower than Q3 2020.
For many commodities, imports were higher than usual at the end of 2020, suggesting that some trade may have been brought forward to avoid potential issues at the border in early 2021. In addition, for some sectors (including meat and fish), imports have continued to be affected by reduced requirements for hospitality as a result of the pandemic.
Trends
The make-up of leading trading partners has been very stable over many years, with occasional intermittent small changes to the order of the top 10. The departure of the UK from the European Union and the Single Market on 1 January 2021 has changed the rules and regulations that govern export and import processes with the EU, and in 2020, COVID-19- had a temporary impact on availability of some products, like pasta and eggs. Changes have also been evident to trade patterns between GB and Northern Ireland as a result of the Northern Ireland Protocol (NIP). Geographical proximity will still be a major factor in trading arrangements, particularly for relatively low-value short shelf-life products.
Indicator 2.1.4 EU share of UK imports
Headline
EU countries continue to be the main source for FFD imports and are therefore essential to the UK’s food security. 39% of FFD imports by value were despatched from 4 EU countries (the Netherlands, Republic of Ireland, Germany, and France) in 2020.
Context and Rationale
Data on imports shows the continued importance of the EU for food imports. In winter months countries in the south of the EU are particularly significant in terms of fruit and vegetables and the nutritional value and consumer choice those products provide.
Data and Assessment
Figure 2.1.4a: Balance of EU and non-EU imports by value

Percentage EU RoW Trade
Source: HMRC
The geographical proximity of the EU influences the amount of trade that it accounts for, and for some animal products like bacon and ham, milk, cream, and eggs, all imports are sourced from the EU. But there are also products where imports are more diverse, such as rice, spices, coffee, and citrus fruits.
Trends
The EU’s share of UK imports has remained very stable at around 70% in recent times. It remains to be seen if this will be affected by the UK having left the EU in January 2021. Whilst there appears to be some shift in 2021 from EU to non-EU, this shift is not necessarily new sources of goods. For some items such as fish, coffee, and some fruit, this is thought to be a “trade hub” effect with some imports (including third country origin material) now coming directly to the UK (or recorded as doing so) rather than being previously cleared in the EU before moving to the UK.
Indicator 2.1.5 Overall diversity of supply
Headline
The UK’s food supply is concentrated on the UK and EU countries, with over 80% of supply coming from these main sources. The remainder is mostly spread fairly evenly between Africa, Asia, North America, and South America. This picture has changed little in the last 10 years.
Context and Rationale
Diversity of supply reflects the range of supply sources the UK has, including domestic production. Tracking this data allows the UK to prepare in case environmental, economic, or political changes affect the ability of a given country to produce or export a key product, for example due to a natural disaster.
Data and Assessment
Figure 2.1.5a: Origins of food consumed in the UK, 2009-to 2020

UK Percentage Trade
Source: HMRC
Supply includes domestic production plus imports, and excludes exports of home production. In 2020, 54% of domestic consumption came from UK production (based on unprocessed value at farmgate), 28% from the EU and the remaining 18% from the rest of the world. 42 countries accounted for 90% of imported supply, and 27 for 80%. Some countries or regions are uniquely important to supply of particular products like bananas from the Caribbean and Central America, reducing the security of this supply.
Trends
These percentages have changed little over the last 10 years (longer term trends in domestic production as a percentage of supply can be found in the indicators that follow). The vagaries of the weather and harvest impact UK production from year to year, as they do throughout the world. Underlying trends in consumption and demand evolve very slowly over time and structural shifts in trading arrangements also lag.
Indicator 2.1.6 Domestic grain production
Headline
The UK is largely self-sufficient in grain production. Production of grains is dependent on weather conditions and can be volatile year to year but is fairly stable in the long term. Yields were unusually low in 2020 due to bad weather, but provisional results for 2021 show a return to the 5-year average.
Context and Rationale
Wheat plays a vital part in the UK’s diet, environment and economy, accounting for about 30% of daily food energy intake per person in the UK during 1961 to 2011.[footnote 2] It is consumed in bread and bakery products, in breakfast cereals, in pasta, and indirectly (via animal feed) in meat and some types of alcohol such as beer and whisky. Grain is generally also the most efficient form of production in terms of calories per hectare, though the bulk of it is grown intensively, relying on inputs in the form of fertilisers, pesticides, and tractor diesel. Grain production has a significant environmental impact, due to the lack of biodiversity in conventional grain fields, damage to the soil through ploughing, environmental harms caused by fertilisers and pesticides, and the oil use embedded in fertilisers and field operations.
Data and Assessment
Figure 2.1.6a: Domestic UK grain production

Grain Production
Source: Defra AUK 2020
The UK grows roughly 15 million tonnes of wheat annually, occupying nearly 2 million hectares with some of the highest yields in the world at around 8 tonnes per hectare. The 2018 financial value of wheat produced in the UK was roughly £2 billion, representing a significant contribution to the total value of £9.3 billion for all crops produced by the UK that year.
Production of barley and oats has been fairly stable, with wheat (primarily a winter-grown crop) a little more volatile depending on weather patterns during planting and growing, as seen in 2020. At 9.6 million tonnes, wheat production was its lowest since 1981 due to unusually poor weather conditions at critical points of crop production: very wet weather for preparing the soil and sowing, too dry in the spring when the crops should have established, and bad weather for harvesting. This appears to be an outlier compared to recent years, and provisional results for 2021 indicate a return to the 5-year average; however, climate change is projected to increase the frequency of such events. Barley production on the other hand was 1 million tonnes higher than the 2015 to 2019 average.
In 2020, 11.9 million tonnes of wheat, barley, and oats were used as animal feed, 5.9 million tonnes of wheat and 0.6 million tonnes of oats were milled, while 1.6 million tonnes of barley went into brewing and distilling, and about 0.5 million tonnes of these three grains were used for seed.
Figure 2.1.6b: Domestic UK grain production as percentage of consumption

Grain Percentage of Consumption
Source: Defra AUK 2020
The UK is largely self-sufficient in barley and oats, and 81% self-sufficient in milling wheat (slightly higher for wheat overall), which is the most significant grain crop for food consumption in the UK. It is not likely or desirable for this figure of 81% to rise much higher, as the remaining percentage is largely made up of hard wheat types not suited to the UK’s climate and soils. Further to this, global competition in wheat production and prices means there is significant economic risk involved with trying to fully meet domestic milling needs, since any surplus could be undervalued relative to the costs incurred during production. UK farmers instead grow what they are best able to, a mix of milling and feed wheat according to market demand and prevailing weather conditions.
For these reasons, the mix of grain grown in the UK differs somewhat from the grain consumed in the UK. Grain alone does not provide a healthy and nutritious diet or meet consumer demand for a varied diet. However, from a purely calorific perspective, the (below average) grain yield in 2020 of 19 million tonnes would be sufficient to sustain the population. It is equivalent to 283kg per person, 0.8 kilos per day. A kilo of wheat provides 3,400 calories (and barley slightly more at 3520 calories), making 0.8 kilos of grain over 2,600 calories, compared to recommended calorie intake of 2 to 2500 for adults. From these figures it is easy to demonstrate that, even without accounting for other domestic products like potatoes, vegetables, grass-fed meat and dairy, and fisheries, current UK grain production alone could meet domestic calorie requirements if it was consumed directly by humans in a limited choice scenario.
Defra currently supports a long-term research platform for the genetic improvement of arable crops and fresh produce. These Genetic Improvement Networks (GINs) aim to improve the productivity, sustainability, resilience, and nutritional quality of UK crops, including wheat, oilseed rape, leafy vegetables, and pulses. This includes significant research to enhance resilience to climate change risks such as drought and heat stress. Overall resilience is supported by trading with a variety of external partners and the UK imports and exports flexibly as production and prices dictate.
Trends
Long term grain production is stable, though the 40% reduction in wheat production in 2020 shows the sensitivity of the sector to unusual weather patterns, and therefore to climate change. Water stress is already a significant factor for wheat yields in southern and eastern England, and is likely to worsen in future, while excess wetness is also expected to rise in the winter season, preventing access to fields for cultivation and sowing.
Indicator 2.1.7 Livestock
Headline
In meat, milk, and eggs, the UK produces a roughly equivalent volume to what it consumes. In 2020 it produced 61kg of meat, 227 litres of milk and 172 eggs per person per year. By value the UK is a net importer of dairy and beef, reflecting consumer preferences for eating higher value products and exporting lower value products.
Context and Rationale
Meat, dairy, and eggs make up an important part of the UK’s overall diet and agricultural economy and are areas where the UK is largely self-sufficient in volume. Imports of high value dairy and beef allow consumers their preferred cuts of meat and dairy products. These products are all contributors to a healthy diet, providing important proteins, amino acids, omega oils, vitamins, and minerals such as calcium.
Livestock sectors have higher average greenhouse gas emissions than plant-based products, though the impact of livestock varies greatly depending on the production method. Well-managed livestock can provide benefits like supporting biodiversity, protecting the character of the countryside, generating important income for rural communities, and contributing to production of other crops as part of rotational systems.
High UK production of animal products partly reflects the large proportion of UK land suited to both extensive and intensive grass production. Grass-based livestock production is often augmented by the feeding of both domestic and imported grain and to a reducing degree imported soyameal, particularly in intensive systems – for example, some dairy, chicken, and pig farms. Animal feed is considered in more detail in the section below on inputs.
Data and Assessment
Figure 2.1.7a: Domestic UK meat production

Meat Production
Source: Defra AUK 2020
There are noticeable dips in beef production in the mid-1990s and early 2000s, showing the effects of the bovine spongiform encephalopathy (BSE) and foot and mouth crises. An increasing proportion of beef, currently estimated at over 50%, is produced as a by-product of dairy farming, rather than from specialist beef herds. At 1.5 million, the number of beef cows in the national herd is similar to in the 1980s, having peaked at just under 2 million in the late 1990s. This herd supports sales for beef of 2.9 million animals per year, down from 4.5 million in 1980; the numbers sold for beef dropped from 3.8 million to 2.4 million between 1995 to 1996 due to the impact of BSE on sales. Total cattle and calf numbers including beef and dairy have been around 10 million head in June (when the data is collected) for the last 20 years.
Pig and poultry production has increased substantially over the last 12 years, which may reflect higher demand for cheaper meats in more economically challenging times, and greater efficiency in poultry production. Total head count for pigs in June has reduced from 7.8 million in 1980 to 5.1 million in 2020, with a steep decrease of over 3 million between 1998 and 2003; annual sales are around 10 million head. Poultry population for meat in June has doubled from 60 million in 1984 to about 120 million in 2020, with over 1 billion birds sold for meat.
Mutton and lamb production has remained stable throughout this period and while demand has varied, production generally met or exceeded demand over the last decade. Total flock size in June rose from 31.4 million in 1980 to about 45 million throughout the 1990s, then declined again to 32.7 million by 2020; sales per year are at about 15 million head.
For all four species there has been an improvement in yield relative to number of animals.
Figure 2.1.7b: Domestic UK meat production as percentage of consumption

Meat Percentage of Consumption
Source: Defra AUK 2020
The UK is close to self-sufficient in lamb and poultry. Most beef consumption is also met by domestic production, with imports from the Republic of Ireland making up the bulk of the remainder, though there is some trade reflecting consumer preference for particular cuts. Pigmeat is lowest in terms of self-sufficiency at 66% of consumption. Considering production and percentages of consumption together, it seems overall meat consumption has increased over the period, driven by increased poultry consumption.
Figure 2.1.7c: Domestic UK raw milk production and consumption

Milk Production
Source: Defra AUK 2020
Raw milk production has held steady and generally exceeded consumption, with a notable rise following the end of milk quotas in March 2015. Herd size has decreased from 3.5 million to 1.9 million since 1973, while yield per animal has more than doubled.
Figure 2.1.7d: Domestic UK egg production and consumption

Egg Production
Source: Defra AUK 2020
Egg production has also been consistent, meeting between 89% and 98% of domestic demand and increasing substantially over the last decade, despite a significant move to free range methods, which now make up about half of production. It is likely that a slight dip in 2020 was caused by the COVID-19 pandemic reducing demand from hospitality and canteens. Although production has increased slightly, laying fowl numbers have decreased from 53 million in 1984 to 40 million in 2020, with the main reduction taking place in the 1980s and 1990s.
Trends
Poultry, pigmeat, and egg production is increasing, while beef, lamb, and milk remains largely stable. The UK now consumes less milk and more eggs relative to production. Changing domestic production is broadly reflected in consumption percentages for beef, pigmeat, and mutton and lamb, with a slight decrease in demand for beef and mutton and lamb in the last two years. Poultry production has increased considerably but is still a smaller percentage of consumption than in 1985, indicating a marked dietary shift towards poultry.
Climate change is projected to cause more than tenfold increases in thermal heat-stress for livestock across the UK. For example, risk of dairy cattle thermal heat stress is projected to increase in the next 30 to 50 years by over 1000% in the South West, the region with the most dairy cattle (see Theme 2, Indicator 2.3.3, Case Study 2.1.).
Indicator 2.1.8 Other domestic crops
Headlines
The UK produces a significant proportion of the other domestic crops it needs, including 54% of fresh vegetables, 67% of sugar beet, 71% of potatoes, and 79% of oilseeds, though only 16% of fresh fruit. Apart from a reduction in oilseeds, these proportions have remained stable over the last ten years. Climate change represents a risk to existing production both in terms of making conditions unsuitable for some crops and allowing new pests to proliferate, although it may also benefit new types of crops.
Context and rationale
Cooking oil, sugar, potatoes, other vegetables, and fruit are significant for domestic consumption, with fruit and vegetables particularly important for a healthy diet. Fruit and vegetables are areas where the UK is more dependent on imports, as detailed in Indicators 2.1.9 and 2.1.10.
Data and assessment
Figure 2.1.8a: Domestic UK production of other crops

Crop Production
Source: Defra AUK 2020
Production of most of these crops is fairly stable. The most noticeable change is a reduction in oilseed production in recent years due to stem flea beetle damage, as discussed under Indicator 2.1.2. However, longer-term trends over the last 35 years show that oilseed production is still comparable to the 1990s. Sugar beet trends follow demand from processing factories (dominated by British Sugar (Silver Spoon)), overall down slightly through this period but still higher than in the 1980s, with annual variations due to weather. Sugar beet yields per hectare have improved, suggesting greater production efficiency. Fresh fruit production is small in terms of tonnage and percentage of domestic consumption, but as a crop it is among the most valuable, so should not be underestimated as an economic contributor to the sector. In 2019, horticulture, including potatoes, contributed 17% of farm gate output in value from less than 2% of farmed land.
Figure 2.1.8b: Domestic UK production of other crops as percentage of consumption

Crop Percentage of Consumption
Source: Defra AUK 2020
Despite the dip in oilseed production, domestic production still fulfils 79% of consumption. Some imported vegetable oils can be linked to tropical deforestation, so there is a risk of offshoring environmental and social harms if domestic production were to reduce further. For sugar beet (63% in 2020), the remaining percentage of sugar demand can vary significantly and is primarily met by imported cane sugar. Potato production to consumption is at 71%. Fresh vegetables are at 54%, and fresh fruit are at 16%, making the UK more reliant on imports for these products.
Figure 2.1.8c: Domestic UK production of fresh vegetables

Vegetable Production
Source: Defra Horticulture Statistics 2020
For field vegetables overall there has been a steady decline in production (down 10%), which varies between crops following consumer tastes. For example, brassica production has halved over this period, but within this category cauliflower production has fallen to approximately a third of 1990 production while broccoli production has nearly tripled over the same period. Production of root crops has increased, notably onions (by 80%) and carrots (by 60%) while turnips and swedes (down 25%) are no longer as much in favour.
Figure 2.1.8d: Domestic UK production of fresh vegetables as percentage of consumption

Vegetable Percentage of Consumption
Source: Defra Horticulture Statistics 2020
The UK is essentially self-sufficient in root vegetables and cabbage but produces a smaller but rising proportion of other greens, such as cauliflowers and broccoli than in 1990. Domestic fulfilment of demand is also lower for lettuce, mushrooms and especially tomatoes, domestic production of which has halved since 1990. Detailed percentage of consumption data for onions is not available but is believed to be around the 50% mark. Over the last 15 years imports of onions have hovered between about 300,000 tonnes and 400,000 tonnes (with exceptionally high years beyond that in 2013, 2014 and 2019), varying in relation to domestic production.
Figure 2.1.8e: Domestic UK production of fresh fruit

Fruit Production
Source: Defra Horticulture Statistics 2020
Total volume of fruit production is more volatile than vegetable production. Fruit production fell in the 1990s but recovered from about 2000 onwards and, with a couple of dips (most likely due to adverse weather) increased slowly up to 2020. Fruit production has doubled in real term value from approximately £0.5bn to £1bn, while production increased from below 300,000 tonnes in the early 2000s to 657,000 tonnes in 2020.
There has been significant change to the variety of apples grown, with a move away from traditional varieties such as Cox’s and Discovery to new higher-yielding varieties such as Gala and Braeburn. Apple production has increased during a period when the production area has nearly halved. For soft fruits, strawberry production has more than doubled due to new varieties and longer growing seasons and partly due to innovations like LED lighting and table-top production. Raspberry production has almost halved, blackcurrant production is stable, and overall production of other soft fruit not covered in the chart has nearly doubled.
Figure 2.1.8f: Domestic UK production of fresh fruit as percentage of consumption

Fruit Percentage of Consumption
Source: Defra Horticulture Statistics 2020
Demand for soft fruit has increased, with the domestic strawberry supply to use ratio similar to 1990 despite production being two to three times greater. Raspberry demand also grew slightly despite a reduction in domestic production, bringing the supply ratio down sharply from 100% to 40%. Supply ratios for apples, pears and plums is more consistent, and reflects trends in production year on year.
Trends
Changing and extreme weather will have varied effects on different crops. Potato yields are vulnerable to hot dry summers, as the 20% fall in the 2018 harvest shows, but other new crops like red wine grapes are already benefitting from changing weather patterns. A related risk is of imported pests and diseases; Plant Health checks at borders are already important and will become more so as climate changes expose the UK to new threats of this kind. The changing UK climate will likely alter the emergence, survival rates, and spread of both indigenous and invasive pests, weeds, and diseases (see Indicators 2.3.3 and 2.3.4).
Indicator 2.1.9 Supply sources of UK fresh fruit and vegetable imports
Headlines
The UK produces over 50% of vegetables consumed domestically, but only 16% of fruit. In 2020, 93% of domestic consumption of fresh vegetables was fulfilled by domestic and EU production, while fruit supply was more widely spread across the EU, Africa, the Americas, and the UK.
Context and rationale
The UK has a high dependency on FFV, so monitoring the diversity of supply is necessary to ensure supply routes are adequate. Many imported products (tomatoes, courgettes, and oranges for example) are part of the regular diet of UK consumers, so are important for nutritional value and consumer choice.
Data and assessment
Figure 2.1.9a: Origins of fresh vegetables in UK domestic consumption

Vegetable Import Origin
Source: HMRC
93% of domestic consumption of fresh vegetables was fulfilled by domestic and EU production, reflecting the importance of geographical proximity for importing fresh produce of relatively low value. UK production to consumption has declined slightly over the last decade, while reliance on EU and African supply sources has increased.
Figure 2.1.9b: Origins of fresh fruit in UK domestic consumption

Fruit Import Origin
Source: HMRC
Origin of fresh fruit consumption is more diverse, with 97% by volume from the UK, EU, South America, North America, and Africa. This reflects UK consumer demand for tropical and out-of-season fruit which cannot be sourced domestically or from Europe. UK production to consumption has increased a little since 2009 but remains low.
Trends
There are concerns about water availability for fruit and vegetable production in many of the countries on which the UK currently depends, for example in the Mediterranean region.[footnote 3] The spread of plant diseases could also be significant for fruit and vegetable imports. For example, diseases such as Fusarium wilt (Panama TR4) could significantly affect the future availability of bananas in the UK and worldwide. While this might not impact directly on food security, the disruption of supply chains for staple foods such as bananas could have a serious impact on consumer confidence and trust.
Indicator 2.1.10 Seasonality
Headlines
The relationship of supply to the time of year is complex and depends on the product. The UK has diverse supply lines to meet demand throughout the year.
Context and rationale
Seasonality varies with product, growing season, and growing method, and is important for understanding how the UK’s fresh fruit and vegetable (FFV) supply changes during the year. Domestic production is concentrated in the summer months, particularly for higher value crops like berries.
There is year-round FFV production in the UK, but winter crops are more limited in range, being dominated by root vegetables and leafy greens. In winter months the UK is particularly dependent on imports to keep supermarkets stocked with diverse out-of-season FFV. Over the last thirty years consumer preferences have developed, favouring more ingredients which cannot be grown in the UK and expecting access to out-of-season fruit all year round.
Data and assessment
Figure 2.1.10a: UK citrus fruit imports seasonal variation

Citrus Imports
Source: HMRC
Citrus fruit imports reflect global harvest seasons, which are generally in winter months, so EU imports are highest in the UK winter when produce comes from the Mediterranean countries. In the UK summer, imports are sourced from the southern hemisphere, especially South Africa.
Figure 2.1.10b: UK lettuce imports seasonal variation

Lettuce Imports
Source: HMRC
Other seasonal effects for some products reflect the UK growing season. Imports of lettuce come almost exclusively from the EU during the autumn and winter, whilst domestic production reduces trade in the spring and summer, as shown in the large dip in imports during those months.
Figure 2.1.10c: UK tomato imports seasonal variation

Tomatoes Imports
Source: HMRC
For many products seasonality is less marked. For example, tomatoes can be produced year-round, including in greenhouses in the UK but domestic production capacity is far below total demand and is supplemented throughout the year by imports.
Trends
The UK continues to rely on seasonal supplies of some products in order to meet consumer demand, particularly fresh fruit and vegetables. The seasonality of supplies can be driven by a number of factors, including global and domestic production seasons. The examples presented above show that the EU has previously been an important source of supply for those products for much of the year. It is not yet apparent whether UK supply chains have changed permanently after 31 December 2020. Future Food Security Reports will note if there has been a change in the balance of EU and non-EU imports.
Year-round access to a full range of FFV in all seasons has increased over the last 20 to 30 years, leading to longer and more complex supply chains, alongside a drop in domestic supply ratio of fresh vegetables from 76% to 54% since 1990 (see Indicator 2.1.8).
Indicator 2.1.11 Fish
Headlines
The UK is a net importer of fish, and heavily dependent on imports for the types of fish consumers prefer, as these are different to the main types caught domestically. Fisheries in general are threatened by overfishing and climate change, but most of the fisheries which export to the UK are sustainably managed and have healthy stocks.
Context and rationale
Fish represent a small but significant part of UK production and consumption. The picture of UK imports and exports is complicated by the fact the consumption of fish in the UK is dominated by non-native species, so much of the UK’s catch is exported and fish for domestic consumption are imported instead.
Data and assessment
Figure 2.1.11a: UK fish imports and exports by weight
Fish Imports Exports Trade Gap
Source: HMRC
The UK exports around 452,000 tonnes and imports around 721,000 tonnes of fish globally. The UK is a net importer with imports exceeding exports by 269,000 tonnes (the trade gap).
Figure 2.1.11b: UK fish imports and exports by species 2020

Fish Species Imports Exports
Source: HMRC
The UK relies on imports to meet domestic demand, especially for cod, haddock, tuna, and shrimp and prawns but is a net exporter of herring, mackerel, salmon, nephrops (langoustines), and scallops. Salmon is the only species which is both imported and exported in significant quantities.
Figure 2.1.11c: Domestic production of wild fish native to UK waters

Domestic Production
Source: Seafish
Domestic fish yields of four main species fished and consumed in Britain can vary significantly year-to-year, as a snapshot of 2016 and 2017 shows (this data is older than the import and export data, but allows a reasonable comparison). Compared with figure 2.1.11b, showing imports and exports, it is apparent that the UK produces only a small amount of the cod it consumes, and less than half of haddock consumption also. A surplus of mackerel beyond domestic needs is exported, while shrimp and prawns are caught domestically and imported in similar volumes. During the Covid-19 pandemic industry-led initiatives to link buyers with the UK fleet led to an increase in availability of British-caught fish in some supermarkets; sales of (primarily imported) canned and frozen fish increased.
Figure 2.1.11d: UK fish imports by country 2019
Fish Imports
Figure 2.1.11e: UK fish exports by country 2019

Fish Exports
Source: HMRC
EU countries are the largest export market, followed by the US and China (a key processing hub), while China and the UK’s North Sea neighbours are the main sources of fish imports. A shift in diet to more locally sourced fish and shellfish would make the UK more self-sufficient in marine protein. However, from a food security perspective, having strong trade links and a diversity of supply is beneficial.
Trends
There are risks to fishing and marine sustainability from overfishing. Continuing international management of stocks and quota is necessary – for example, any unilateral increase in quota by other nations has a direct impact on food security for the UK nations who also fish in those sectors. A summary of stock health by species for the UK’s main sources is as follows (as of 2017) – note salmon and warm water prawns are primarily farmed, so not included:[footnote 4]
-
Cod (Iceland, Norway): healthy
-
Haddock (UK, Iceland): variable but healthy, with UK stocks now being managed sustainably.
-
Skipjack tuna (Mauritius, Ecuador, Seychelles, Philippines, Ghana): healthy and underexploited. Note that other species of tuna (making up about 7% of UK tuna imports) are often overfished, with illegal, unregulated, and unreported catch.
-
Cold water prawns (Canada and Greenland): variable stocks but managed stably.
-
Mackerel (UK, North Sea nations): stocks good but trend uncertain.
Climate change presents a separate risk. The Climate Change Committee’s Independent Assessment of UK Climate Risk projects warming of 0.2-0.4°C per decade to 2100 and beyond in the shallow shelf seas around the UK, particularly in the English Channel and southern North Sea. Warming seas, ocean acidification, and changes in salinity impact the entire marine biosphere and food chain on which commercial fishing depends. Fish farms face separate climate-related risks.
Climate change impacts are projected to include range shifts, decline in fish stock recruitment for species such as cod and herring, and risk of passing critical temperature thresholds for salmonid populations including Atlantic salmon, Arctic charr, and brown trout. Climate change impacts are also likely to impact abundance, distribution, and nutritional quality of prey species, which can indirectly affect commercially valuable fish stocks (for example cod). Climate change impacts can also increase risk and prevalence of pests and pathogens, potentially reducing quality and survivability of targeted fish species. Changing conditions can encourage the presence of invasive species (such as Pacific oysters), creating increased competition for resources for native fisheries.
However, there may also opportunities for increases in warmer water species like mackerel, anchovies, and sardines. Under the Fisheries Act 2020, the UK is committed to fishing within sustainable limits, avoiding wasteful bycatch and supporting marine ecosystems. A climate change objective in the Act aims to encourage management policies to mitigate against the effects of climate change.
Indicator 2.2.1 Essential inputs
Headlines
The cost of inputs varies year to year and is a significant risk to farming economies due to the narrow margins on which they operate – and therefore to food security. Out of £26.7 billion gross agricultural output in 2020, £17.3 billion was spent on ‘intermediate consumption’ (costs and inputs). In 2020, seeds cost UK farmers £922m, fertilisers £1,147m, energy and fuel £1,290m, pesticides £1,097m, and animal feed £5,586 million. Animal feed is both the most expensive input across the entire sector and the one for which prices fluctuate most.
Context and rationale
Production of food requires several essential inputs. For crops these include natural and chemical fertilisers, pesticides, and seeds for crops, vegetables, and pasture leys. Animal feed is required for livestock production, from direct grazing, farm-grown fodder, or through buying in feed. Feed varies in cost and environmental impact from locally grown hay and silage, to UK-grown grain, and to imports of grain and soyameal. These inputs all represent significant costs to farmers. Reducing them while maintaining yields is desirable from an economic and environmental point of view.
Soil and water are the most important inputs of all for primary food production. They have already been discussed in a global context in Theme 1 and will be further addressed in the Sustainability and Environment (2.3) section of this chapter, along with biodiversity-related ecosystem services which are also essential to food production. Labour and energy, two other key inputs, are discussed in Theme 3.
Data and assessment
Figure 2.2.1a: UK principal farm costs

Farm Costs
Source: Defra AUK 2020
Animal feed is the single largest input cost for UK agriculture, with 30 million tonnes costing livestock farmers £5.6 billion in 2020. Fertiliser costs were £1.1 billion in 2020, the lowest since 2007 and reflected low oil prices as well as the reduced capacity of farmers to grow wheat in 2020. Fertiliser prices are volatile, being subject to global production and markets and dependent on production inputs like natural gas. Application levels of mineral fertilisers are affected annually by price of fertiliser and crops, crop type, and weather, with oil prices particularly affecting costs. The total cost of agricultural pesticide products was over £1 billion in 2020.
Seeds are another of the main expenses in crop production. Costs in 2020 were abnormally high due to weather conditions preventing autumn sowing and winter crops failing and being resown in spring. Seeds are required for planting crops and re-sowing grassland in rotations and are typically purchased from specialist suppliers (especially for higher value crops). Much of the required vegetable seed is imported, as are some young plants for propagation, for example tomato plants. Seed saving remains a small but important part of the UK’s food production and security, varying with production and market demands.
Figure 2.2.1b: UK animal feed

Animal Feed
Source: Defra AUK 2020
Animal feed is the most important input for livestock production. It can be grown on farm or bought in as grain, protein crops (for example beans and soya), or grass in the form of hay, silage, or haylage. As highlighted in indicator 2.1.6 on grain production, 11.9 million tonnes, over 60% of UK grain, was used for animal feed in 2020, making up 40% of total animal feed. Dependency on grain is reduced where grazing livestock have access to grassland (including in all-grass systems) and is affected by annual fluctuations in the growth of such forage due to weather and climate.
Total feed use increased in the 1990s and continues to climb, now about 76% higher than in the mid-1970s and 50% higher than the early 1990s and correlates only a little with price changes (for example in 200 to 2008 and 2011 to 2012) – as livestock need feeding regardless of cost. Over the same period most livestock outputs have remained stable, though there has been intensification, for example in milk production, where 24% fewer cows now produce 9% more milk than in 2020. Production of poultry and eggs have also increased. Comparing the 2020 cost of feed (£5.6 billion) with the £13.8 billion combined value of livestock production it is clear that livestock production remains vulnerable to changes in feed prices, for example through competition with energy crops, poor harvests, and global competition for grain. In 2020, £2.5 billion of animal feed was imported, and £1.1 billion exported, about 60% of both with EU countries. This means net dependency on imports is about 25% of total feed cost but actual use of feed imports is closer to 45%.
In terms of land and energy use, there is also an opportunity cost when feeding these calories to animals rather than directly to humans, considering a substantial proportion are cereals and other high protein and energy crops. Reducing their use as feed crops would free up land and resources for other land uses. However, animal feed can play a role in making use of surplus foodstuffs that would otherwise be wasted. There may also be opportunities for novel feedstuffs for animals that could be more efficient, such as insect protein.
Figure 2.2.1c: Fertiliser use in UK agriculture 1966-2020

Fertiliser Usage
Source: British Survey of Fertiliser Practice
Plant growth requires three main elements: nitrogen, phosphorous (commonly in the form of phosphate), and potassium (commonly in the form of potash). The use of these elements for agriculture, in the form of fertilisers, peaked in the mid-1980s following a rapid increase in use in the 1960s and 1970s of nitrogen and steady increase of the others. Use of all reduced between 1990 and 2010 but has been fairly steady over the last decade. In 2020, overall fertiliser application rates reduced by an estimated 6.2% due primarily to increased spring sowing, which uses less fertiliser.
Inorganic fertilisers, especially ammonium nitrate for nitrogen, are often imported, so global availability of the key minerals is an important factor, as covered in Theme 1. Organic fertilisers (primarily manure) make up just under half of nitrogen applications and are typically sourced on farm in mixed holdings, or from other local sources.[footnote 5] Generally speaking, manures are more often used on grassland and inorganic fertilisers on crops.
The UK imports roughly 50% of its ammonium nitrate, with 75% of imports for fertiliser use coming from the EU (primarily from Lithuania, Poland, and the Netherlands) and the remaining 25% from Georgia and Russia. If the only UK manufacturer were to close, demand for imports would increase. Dependency on other suppliers like Russia or China is only likely to occur if EU suppliers could not increase their supply to the UK. There are also alternative nitrogen-based fertilisers that could potentially be used. More than 90% of the UK’s total Calcium Ammonium Nitrate and Urea Ammonium Nitrate supply is imported from the EU, while only about 40% of Urea arrives from the EU. Urea imports from outside the EU are currently sourced from Algeria, Russia, and Egypt, with supplies also coming from Belarus and Bahrain. Importing ammonium nitrate requires specialist port facilities due to its explosive nature, so an issue at a major port could be challenging (see further discussion of port substitutability in Theme 3).
Fertilisers have the potential to cause environmental damage to water and air quality as well as contributing to climate change through nitrous oxide emissions. These effects can be exacerbated and mitigated by application method and rate.
Figure 2.2.1d: Pesticide use on cereals, Great Britain and UK

Pesticide Usage
Source: Defra. Figures from 2010 onwards include Northern Ireland, prior to that coverage is GB only. 2018 figure for pesticides does not exclude desiccants.
Pesticides (or ‘plant protection products’) are used to protect crops from a variety of plant, fungal, and animal pests that can affect yields. Application volume can vary year to year depending primarily on pest, disease, and weed incidence, and is also influenced by the weather at key crop development stages when pesticide applications are most often made. There is significant variation crop to crop, but approximately 90% of pesticides used in agriculture are applied to arable crops.
The weight of pesticides used reduced from 1990 to 2010, largely down to declines in the use of sulphuric acid as a desiccant on potatoes. Since 2010 it has gradually increased, but the weight applied remains lower than pre-2010 levels. Since 1998, when the relevant data collection began, the frequency of pesticide application and the number of active substances applied has increased. For arable crops the average number of spray rounds has increased from 4.8 in 2000 to 6.2 in 2018, with the average number of active substances applied rising from 11.6 to 16.7 over the same period. This translates into increases in the total area treated (which represents the area multiplied by number of treatments made). This is partly driven by greater use of mixtures of products in spray tanks to overcome challenges around resistance.
Pesticides are subject to regulatory controls which may alter the way in which products are permitted to be used (range of crops, frequency, or rate of application). Such changes usually reflect post-registration concerns arising from unforeseen environmental effects (for example the impact of neonicotinoid insecticides on bee behaviour and survival) or operator and consumer exposure. The use of pesticides can have direct and indirect effects on soil health, water quality, and biodiversity.
Trends
Seed supply is generally resilient in the sense that additional seed can be sourced from stocks held by suppliers. In future, seed that provides resilience to the changing climate will be needed.
Feed volumes used continue to rise steadily while the price per tonne is falling slowly (in real terms). The use of grain and imported soya for livestock feed may questions about the environmental sustainability of this practice, including substantial resource use in the UK and abroad, and a risk of exporting harms.
Changing weather patterns and climate will impact nutrient cycles with implications for fertiliser application patterns. Lower oil prices have made fertilisers cheaper in recent years, but sudden fuel price increases can lead to production halting at short notice, as experienced with gas in autumn 2021 (see Theme 3).
Tensions between environmental protection and crop yields are likely to increase as climate change fuels warmer and damper conditions that are more likely to encourage disease and pests, like potato blight and peach-potato aphids. Climate change will also likely change pesticide use and impacts through changing temperatures and rainfall patterns.
Indicator 2.2.2 Agriculture and supply chain waste
Headlines
Food waste in agriculture and in the supply chain is an economic and environmental loss, as well as being a factor in understanding overall domestic production and efficiency, and therefore food security. It represents unnecessary land and resource use, millions of tonnes of carbon emissions, and billions of pounds of wasted value.
Estimated annual combined surplus and waste in primary production is 3.6 million tonnes (Mt), 6-7% of total harvest. Waste post-farm gate is estimated at 9.5Mt, of which 7.7Mt is in households and hospitality and 1.8Mt in manufacturing and retail. These figures compare to around 43Mt of food purchased for consumption in the UK.
Context and rationale
The Waste and Resources Action Programme (WRAP) is a charity established in 2000 which works on reducing food, clothing, and packaging waste, recycling, and improving the entire lifecycle of food consumed in the UK. WRAP monitors food waste throughout the supply chain and has produced several reports on which the main indicators here are based. It should be noted that whilst the UK evidence base on food waste has been recognised as one of the strongest in the world, there remain significant uncertainties associated with the data. The quality of data varies by sector, in order of robustness from households and retail (both relatively accurate), to manufacture and hospitality and food service (relatively weak) and primary production (weak, and partly modelled using non-UK data).[footnote 6]
Data and assessment
Figure 2.2.2a: Central estimate for annual food waste and surplus in UK primary production in 2020

Annual food waste and surplus in primary production
Source: WRAP: Food waste in primary production in the UK
Surplus and waste in primary production compares to approximately 55 million tonnes total UK food production in 2020, making it about 6-7% of production. A distinction is made between food waste (1.6Mt) and surplus food (2Mt), which rather than reaching its intended market is instead redistributed, becomes animal feed or goes into bio-based materials. Food waste in primary production is hard to estimate, and there is no definitive data. WRAP’s estimates are based on applying the ‘best available data’ from comparable geographies around the world to UK production quantities. As a result, there is a wide possible range, from 2.2Mt to 5.0Mt. Based on the central estimate of 3.6Mt, up to £1.2 billion value of food is lost, of which part is recovered in sales for animal feed.
Figure 2.2.2b: Post farmgate food waste arising in the UK in 2018 by sector

Post farmgate food waste 2018 by sector
Source: WRAP: Food surplus and waste in the UK
The 9.5Mt of food wasted annually post-farmgate compares to 43Mt of food purchased for consumption in the UK, and has a value estimated at over £19 billion, primarily in household waste. However, only 70% of that was intended for consumption, with 30% the ‘inedible parts’ (fruit and vegetable peelings etc). Between farm and fork, 1.5Mt are wasted in manufacture (0.7Mt of which is ‘inedible parts’), 1.1Mt in hospitality and food service (HaFS), and 0.3Mt in retail. Around 0.7Mt of food surplus from manufacturing, retail, and hospitality and food service is either redistributed via charitable and commercial routes or diverted to produce animal feed (up about 10% since 2015).[footnote 7]
Trends
Since 2007, there have been large-scale interventions aimed at reducing food waste across supply chains and households in the UK. WRAP estimates that this may have contributed to a reduction in post farmgate total food waste between 2007 and 2018 of around 15% (1.7Mt). Total post farmgate food waste in the UK was 476,000 tonnes lower in 2018 compared to 2015 which equates to a 4.8% reduction (10Mt down to 9.5Mt). This can be partly attributed to consumer campaigns like WRAP’s ‘Love Food Hate Waste’ and the UK Food Waste Reduction Roadmap (aimed at businesses), along with better labelling and storage guidance, and also more widespread food waste collections from councils.[footnote 8] Food waste in manufacturing reduced by around 395,000 tonnes between 2011 and 2018 (an approximate 20% reduction, from around 1.9Mt), whilst levels of food waste reported by retailers were around 290,000 tonnes in 2009 compared to 259,000 tonnes in 2020.
The UK has a commitment to UN Sustainable Development Goal 12.3 and the Courtauld Commitment 2030 to reduce per capita food system waste by 50% by 2030 (alongside targets on greenhouse gas emissions and water use).[footnote 9] Compared to the 2007 baseline, total per capita food waste had reduced by 20% by 2018, and 27% if ‘inedible parts’ are excluded. Climate change could have an impact, with extreme weather events, pests, diseases, and warmer temperatures all risks for increased food waste in production and the supply chain, unless adaptations are put in place.
Indicator 2.2.3 Household food waste
Headlines
Average waste of four key products was generally around 20% between 2018 and 2021. This fell sharply at the outset of the COVID-19 pandemic, with improved food management behaviours leading to a significant reduction in self-reported household food waste in 2020. These positive changes, however, have started to decline with people returning to a pre-pandemic lifestyle, and food waste levels have increased again in 2021 to pre-pandemic levels.
Context and rationale
WRAP estimates that in 2018, total annual food waste across the UK reached 9.5 million tonnes. The highest contributor to this total by weight were UK households, with 70% of post-farmgate waste arising in the home.
There are various approaches to measuring household food waste. For the purposes of this report, statistics have been chosen that are frequently updated to make tracking changes easier. The WRAP research used here estimates that bread, chicken, milk, and potatoes are some of the products most likely to be wasted, and therefore asked consumers to estimate the percentage that was thrown away uneaten of these four products following the last time they purchased each item.
Data and Assessment
Figure 2.2.3a: Estimated UK percentage of bread, chicken, milk, and potatoes wasted

Estimated percentage bread, chicken, milk, and potatoes wasted
Source: WRAP food waste trends survey 2021[footnote 10]
There was a 10% decrease in reported levels of food waste, from almost a quarter (24.1%) of four key products in November 2019 to 13.7% in April 2020. This was mainly due to improved food management behaviours adopted during lockdown. Levels of food waste then rebounded to some degree but remained consistently below pre-lockdown levels across 2020. Self-reported food waste in June 2021 is now back in line with the levels recorded in 2018. It remains below the results for 2019 but shows a return to pre-pandemic levels.
Trends
WRAP’s research in 2020 provided important insights into was how well UK households responded to the pandemic by adopting positive food management behaviours. The decline in food waste in 2020 indicates how important it is to foster and maintain behavioural change to reduce food waste in the long-term. The gradual increase in food waste observed in 2021 could be an indication that returning to a pre-pandemic lifestyle, where people spend more time outside the house and experience higher levels of time pressure, has a negative influence on behaviours and waste levels.
WRAP also produces more in-depth research into household food waste but at a less frequent rate than the self-reported household levels presented in this report. Based on their data, there has been an overall 31% per capita reduction in edible household food waste with the majority of the reduction having occurred between 2007 and 2010.[footnote 11]
Indicator 2.3.1 Sustainable agriculture
Headlines
Sustainable production methods ensure the UK’s long term food security by protecting the natural capital embedded in healthy soil, water, and biodiverse ecosystems. Food security rests ultimately not on maximising domestic production (which is market driven), but on making best use of land types which vary in quality and potential uses. Balancing and integrating food production with environmental factors supports efficient and sustainable land use without offshoring harms associated with lower production standards. Following the UK’s departure from the EU, new government incentives are being developed or considered across the four UK nations to support sustainable production.
Context and Rationale
Food production does not happen in isolation from society or the environment. Farming can damage soil, air, and water, drive species loss and contribute to climate change, all of which threaten the current and future productivity and sustainability of agriculture, and therefore food security itself. On the other hand, good farming practices can reduce or reverse these harms, encourage biodiversity, and capture carbon all while producing healthy food.
Agricultural policy is devolved across the four UK nations. Following the UK’s departure from the EU, the UK governments are able to set their own agricultural support schemes. The Scottish Government is currently consulting on a future policy, and the Welsh Government plans to launch a Sustainable Farming Scheme in 2025. In England, Defra has announced three new environmental land management schemes to pay farmers for land management and environmental services. The environmental impacts of these schemes may also affect productivity and Defra is investigating different methodologies to assess these. Future Food Security Reports will aim to show the effect these schemes have on food security.
Organic farming is in broad terms an indicator for current environment-orientated food production in the UK. Other systems such as no and low-till farming, agroecology, and agroforestry also contribute towards balancing sustainability and food production. Organic farming practices do not allow the application of chemical fertilisers or pesticides, or the routine feeding of antibiotics to animals, and they also have high standards for animal welfare. Consequently, productivity tends to be lower than in conventional systems. One of the core principles of organic farming is that by good land management, such as crop rotation, environmental harms can be reduced and soil health improved, offering greater sustainability in the long run.
Data and Assessment
Figure 2.3.1a: UK area of land in-conversion and fully organic

Area of Land in Conversion and Fully Organic
Source: Organic certification bodies collated by Defra statistics
In 2020, organically farmed land represented 2.8% of total UK farmed area, at a little under 500,000 hectares. Organically farmed land has declined from a peak in 2008, but risen slightly again since 2018, while the number of organic processors and producers continues to fall, now down over 25% since 2008. These trends seem to indicate movement towards fewer farmers managing larger areas of land, mirroring trends across agriculture.
Figure 2.3.1b: UK organic livestock numbers

Organic Livestock
Source: Defra AUK 2020
AUK data also shows that permanent pasture (grassland) is by far the biggest proportion of organic land at 62%, followed by temporary pasture (for example grass-clover leys in crop rotations) at 20% and cereals at 9%. The high proportion of grassland indicates that grazing livestock remain significant for organic producers. However, steady declines in sheep numbers may demonstrate the wider economic challenges of farming on marginal land, while an increase in poultry has been fuelled by massive growth in laying hens, presumably the result of consumer demand for organic eggs.
Trends
Total land area allocated to organic farming peaked in the 2000s and has declined slightly since, perhaps partly due to tougher economic times since 2008. With new environmental land management schemes promising alternative rewards for balancing productivity with environmental benefits, sustainable production in the UK is likely to grow in scale and importance.
Indicator 2.3.2 UK soil health
Headlines
Estimates suggest soil degradation, erosion, and compaction result in losses of about £1.2 billion each year and reduce the capacity of UK soils to produce food.
Context and Rationale
Soil health is essential to the long-term security of food production globally and in the UK, and the Climate Change Committee has also identified it as one of the key concerns for climate change. Soil health is affected by several factors, including structure, water retention, soil organic matter, mineral content, and damage through erosion, compaction, and contamination. There is some data available, but the challenge of covering it graphically reflects the difficulties of adequately representing the complexity of soil health with any single indicator, and the great variety of soil types in the UK. Consequently, this section relies on qualitative analysis.
Data and Assessment
Two soil health factors tracked by Defra are soil nitrogen and phosphorus levels, which have remained broadly stable over the last ten years at around 90kg/hectare and 6kg/hectare respectively.[footnote 12] Indicators on nitrogen and phosphorus levels in soil are useful for judging optimum fertiliser application rates but have little to say about soil health more generally.
Soil erosion reduces productive capacity and causes nutrient loss, as well as off-site environmental harms such as water pollution. Improving soil organic matter can benefit long term soil health and sustainable productivity. For example, with some cereals, planting early in the autumn to establish soil cover reduces soil erosion risk while increasing yields.
It has been estimated that soil degradation costs England and Wales £1.2 billion per year and that intensive agriculture has already caused arable soils to lose 40% to 60% of their organic carbon. Soil erosion in England and Wales is lower than many other countries, but it is estimated that 2 million hectares are still at risk. Around 3.9 million hectares are at risk of soil compaction in England and Wales – nearly twice the total area of Wales – with a potential yield penalty of £163 million every year; the risk is highest on clay soils during wet periods.[footnote 13] Similar impacts have been recorded in Scotland.[footnote 14]
Soil health is perhaps the single most important factor for future domestic food production. It is hoped that future editions of the UK Food Security Report will cover soil health with quantitative data as well as qualitative analysis, as filling this data gap will be important for understanding future food security.
Trends
Soil health in the UK is an extensive and costly problem, but without proper indicators it is difficult to determine the speed and direction of change. Climate is a key factor in soil formation and processes, and severe degradation of soil would have long-term, potentially irreversible, implications considering the critical importance of soil for protecting the environment and providing high quality farmland. Conversely, well-planned mitigation activities around soil management have the potential to contribute to climate adaptation through, for example, increased soil organic matter and water holding capacity, contributing to ‘sustainable intensification’.
Indicator 2.3.3 Climate change impacts on yields
Headlines
Climate change and emissions pose significant risks to production and food security. As a consequence of unusual weather patterns associated with climate change, wheat yields in 2018 were 7% below the 2016 to 2020 average, and in 2020 were 17% below that average. Ozone in the low atmosphere has a separate, ongoing effect on yields; total economic losses for wheat, potato, and oilseed rape in the UK caused by damage due to ozone may have been over £185 million in 2018, with more than 97% of losses occurring in England.
Context and Rationale
As the UK Climate Risk Independent Assessment (CCRA3) sets out in Chapter 3 of the Technical Report, agriculture is highly dependent on climate, affecting the productivity and viability of crops and livestock.[footnote 15] Weather and climate variations affect both utilised land area and yields. The effects of heat, cold, wetness, and drought can have positive effects on production, but most of the consequences of a changing climate are negative.
Longer growing seasons and warmer temperatures may have some positive effects for particular crops and regions, but overall risk magnitude is assessed to increase from medium at present to high in future. Increased climate exposure (including heat stress, drought risk, and wetness-related risks) is modifying productive capacity and will continue to do so in future in line with the degrees of warming experienced. The severity of risk to agriculture from climate change could further increase if mitigation efforts are ineffective in preventing non-linear threshold effects and ‘tipping points’ in global systems.
A separate consequence of polluting emissions is an increase of ozone in the troposphere (the low atmosphere, including at ground level). Ozone is not directly emitted but is formed in the atmosphere by the action of sunlight on ozone precursors (nitrogen oxides, volatile organic compounds (VOCs), methane, and carbon monoxide). With the exception of VOCs, ozone precursor emissions are dominantly human-caused, resulting especially from industrial activity.[footnote 16] While important for absorbing ultra-violet radiation in the high atmosphere, ozone at ground level is harmful to human and plant life and is calculated to have a significant effect on crop yields.
Data and Assessment
The CCRA3 provides examples of productivity in years with unusual climatic features. The 5-year average for UK wheat yields in 2016 to 2020 was 8.4 tonnes per hectare, but a hot, dry summer in 2018 (7.8 tonnes per hectare) and a very wet winter and dry spring in 2020 (7 tonnes per hectare and 40% down compared with 2019), resulted in significant yield losses. By contrast, 2015 and 2019 had above average UK wheat yields, demonstrating volatility from year to year. The hot, dry summer of 2018 also affected other crops, with carrot yields down 25% to 30% and onion yields down 40% on a normal year, whilst potato yields were down on average 20% in England and Wales. Climate sensitivity can also affect the quality of produce, with consequences for food security. For example, weather conditions prior to harvest can impact the quality of milling flour and its protein content. Changes in temperature and humidity can also exacerbate problems with pests, diseases, and heat stress, as set out in the next case study.
On the positive side, warmer temperatures may open opportunities for new crops, and a reduction in the frequency of frost days across the UK has benefits for both arable agriculture and horticulture, through reduced incidence of frost damage for vulnerable crops. However, many tree species and other crops need a period of cold weather to produce a good crop every year, and therefore suffer from a lack of proper cold temperatures over winter.
Beyond unusual temperatures, rainfall and drought, the consequences of climate change also include increased risk of wildfires, flooding, coastal erosion, and high winds. All of these can have severe impacts on agricultural production in affected areas.
A report for the UK Centre for Ecology and Hydrology calculates that the ozone impact on crops in 2018 reduced UK wheat production by 5.5%, amounting to a production loss of 800,000 tonnes with an economic value of approximately £125 million (at average prices for 2018).[footnote 17] The highest production losses were indicated for eastern and southern counties of England, particularly Cambridgeshire, Essex, Suffolk and Lincolnshire, and parts of Hampshire, Wiltshire and Dorset. It also reduced UK potato yield by 6.5%, resulting in a loss of 305,000 tonnes of potato tubers worth £50 million, with the highest production losses in parts of North Yorkshire, Cambridgeshire, Hertfordshire and Bedfordshire. Ozone reduced UK oilseed rape production by 1.9% in 2018, amounting to 39,000 tonnes of lost production, worth £11 million; the highest production losses were predicted for central England.
Ozone also affects other plants, reducing flower numbers in perennial grassland by 10%, annual total biomass increment in perennial grassland in the UK by 2.7%, and annual biomass increment in managed broadleaf woodland by 7.3%. These impacts could affect overall biodiversity, and livestock and biomass yields, with consequences for land use.
Trends
Climate change poses a risk to UK food production already, and this risk will grow substantially over the next 30 to 60 years. Minimising the extent of global warming and addressing the risks it poses to food production are both essential to future food security. Ozone causes yield loss every year, particularly in Southern and Eastern England.
Case Study 2.1 Climate change: farming impacts and risks[footnote 18]
Understanding how the climate is projected to change across the UK during the 21st century is vital for UK agriculture, food security, and commercial food sectors. Plants, animals, and soils are affected by the weather through variations in temperature, rainfall, and humidity. Climate-related impacts may occur through gradual change, or as a result of more rapid changes triggered by extreme weather events such as drought and flood.
The UK climate is changing, average temperatures have increased, and seasonal rainfall is highly variable. To understand how the climate may change in the future, the UK Climate Projections (UKCP18) use a range of climate models to provide probabilistic simulations of UK climate to the end of the 21st century in a high concentration climate scenario known as RCP 8.5.
How might temperature change in the future?
From the UKCP18 data, all areas of the UK are projected to experience warming, particularly in the summer, which could have implications for growing season duration, crop yield, and quality. Regional projections for 2061 to 2080, using the RCP 8.5 scenario, show greater warming in Southern England compared to northern regions of the UK.
Warmer temperatures will increase the occurrence of heat stress, which can impact livestock productivity, fertility, welfare, and mortality. The area of greatest risk for thermal heat stress in dairy cattle now and in the future is South West England. Other key areas of high future risk and large risk increases include Northern Ireland, Wales, the Midlands, North West England and North West Scotland. Risk of thermal heat stress in dairy cattle is projected to increase by over 1000% in South West England, the region with the most dairy cattle.
Warmer temperatures can also encourage fungal diseases such as potato blight (in combination with higher relative humidity), and other pests and pathogens, including the peach-potato aphid (Myzus persicae) which is a risk to over 400 plant species, including potatoes and sugar beet.
The Met Office is currently researching how increasing future temperatures may impact different livestock types, combined with changes in grass productivity.
Figure 2.1a: Increases in risk for future climate (2051 to 2070) compared with current climate (1998 to 2017) for thermal heat stress in cattle (red) and potato blight (brown).
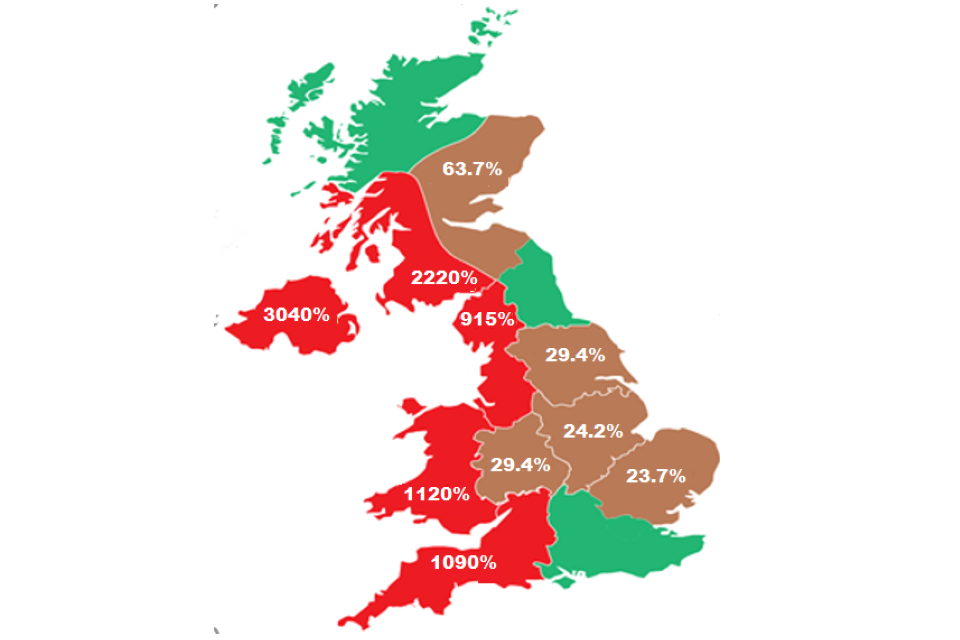
Future Climate Risks Potatoes and Cattle
Risks to soils from changes in UK rainfall
Understanding climate impacts on soil erosion is vital for ensuring a sustainable and resilient food system. Using the UKCP18 climate simulations, the Met Office looked at the potential future impacts of climate change on soil erosion risk through changes to rainfall erosivity.
Figure 2.1b: Categorisation of erosion risk using mean annual precipitation totals and annual mean erosion values derived from hourly precipitation data for the UKCP18 convection permitting models. Regions with low rainfall-high erosivity density and high rainfall-high erosivity density are considered at the greatest risk of erosion.
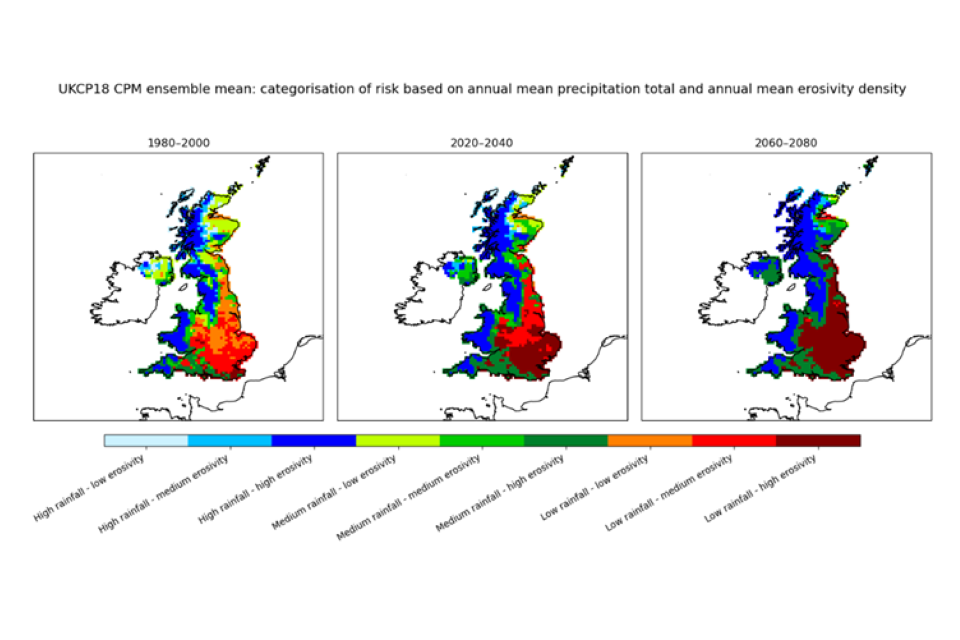
Categorisation of Erosion Risk
Rainfall erosivity is the measure of rainfall total and intensity, and is one of five main predictors that can be used to describe soil loss rates. To identify regions at risk of soil erosion, information on present-day soil erodibility is combined with rainfall erosivity.
The study looked at rainfall total and erosivity across the UK for three time periods (1980 to 2000, 2020 to 2040, and 2060 to 2080) in a high concentration climate scenario (RCP8.5). Key findings include:
-
Large projected increases in areas of relatively high erosion risk and potential soil degradation across South and East England.
-
By 2060 to 2080, regions considered at the greatest risk of soil erosion, due to rainfall, included the Midlands, East Anglia, and the Yorkshire coastline.
-
Combined with the soil erodibility data, a large area of Southern England is at risk of increased rates of soil erosion.
Potential impacts: Arable farming in East Anglia is likely to be adversely affected by soil erosion, due to the entire region being considered at relatively high risk of erosion by 2060 to 2080. The results shown in the figure below only consider meteorological factors, and further work is needed to incorporate land cover and land management practices for a comprehensive assessment of erosion risk.
How might seasonal and spatial rainfall patterns change in the future?
Rainfall is the largest source of water for growing grass and crops in the UK. Changes in rainfall patterns can impact water storage, plant productivity, and cause soil erosion and waterlogging. Using data from UKCP18, the Met Office looked at how annual rainfall across the UK may change in the future. As highlighted in the figure below, by 2051 to 2070 average 12-month rainfall accumulations are projected to increase across North West England, Scotland, and coastal regions around Wales. In contrast, rainfall accumulations across the rest of England and Wales are projected to decrease. Annual rainfall variability is projected to increase with greater potential for both extremely high and low national rainfall totals. South-central England and North West Scotland are projected to experience the greatest annual rainfall variability, which may require changes in water management.
Figure 2.1c: Difference in average 1-year rainfall accumulations (measured in mm) compared to baseline period (1991–2010) under RCP8.5, using bias corrected UKCP18 convection-permitting climate model projections.
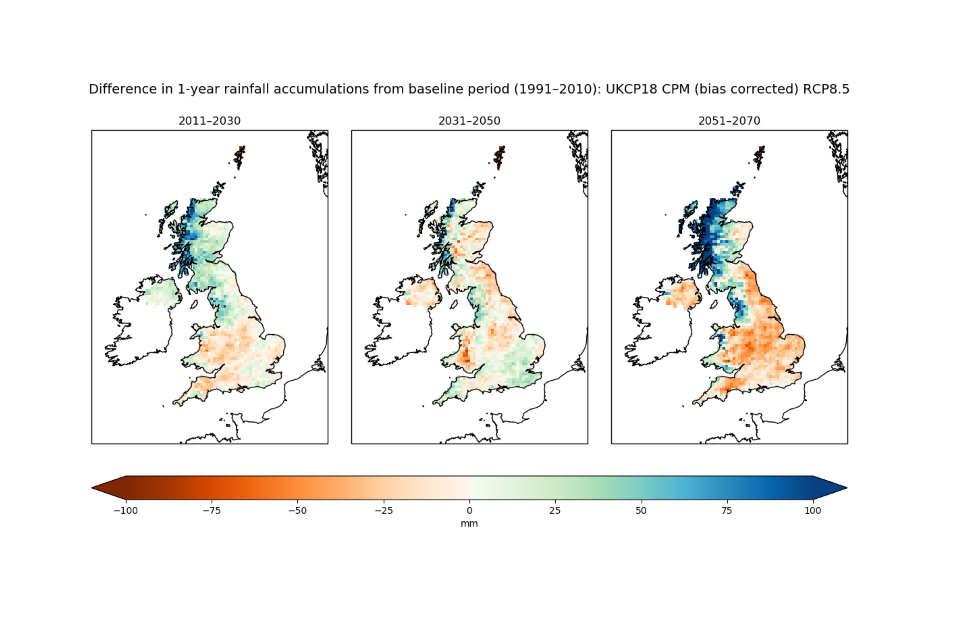
Difference in Rainfall
Risks to UK agricultural areas from drought
Seasonal drought can lead to significant reductions in crop yield and there is currently a 3% chance per year that at least 80% of the UK wheat area could experience drought. Wheat varieties that are tolerant to a range of weather conditions, such as flooding and drought, may need to be considered in the future.
Recent Met Office research used UKCP18 simulations to assess the future impact of drought in the UK, focusing on the period 2041 to 2070. Key findings include:
-
Winters are projected to be slightly wetter, on average, while all other seasons are projected to be typically drier, particularly June to September.
-
During the summer months, the South East showed the greatest increase in severe drought conditions.
-
Between April and October drought conditions are more likely, suggesting that a changing climate will affect water availability during the UK’s main crop growing season.
Indicator 2.3.5 Environmental impacts of agriculture
Headlines
Agriculture is impacted by the environment and climate change, but it also affects them in turn. The UK has environmental standards and targets relating to water quality, meeting Net Zero, and biodiversity, all of which continue to be areas where agriculture has a negative impact on the environment.
Context and Rationale
As well as soil health (discussed at Indicator 2.3.2), agriculture also has an impact on water, air, and living things.
In some areas an abundance of water falls and flows, whereas in other areas it is a scarce and valuable resource and is abstracted for agricultural use. As a percentage of total water abstraction this is tiny (around 1% in England), but this abstraction is highly regionally and seasonally concentrated and represents a substantial burden in some areas, particularly in summer months. Furthermore, agriculture can have a negative effect on water bodies that provide other vital services, especially through pollution caused by soil and fertiliser run-off.
The farming sector is a significant source of greenhouse gases, such as methane and nitrous oxide from livestock and fertilisers. Carbon dioxide emissions are largely caused by farm vehicles and machinery and can also result from poor soil management.
Biodiversity is an important indicator for understanding the overall sustainability of food production, fisheries, and farming practices in the UK. Good biodiversity also provides important ecosystem services to agriculture. Biodiversity is difficult to measure, so Defra has tended to rely on the long-standing Farmland Bird Index, which tracks the numbers of 19 bird species: 7 ‘generalist’ species that thrive in many environments, and 12 ‘specialist’ birds which rely heavily on farmland habitats. Birds sit at the top of the food chain and reflect the diversity and availability of insect and plant species; however, they directly show only a part of the biodiversity picture, and do not in themselves provide ecosystem services to agriculture.
Data and Assessment
WRAP’s 2019 progress report on the Courtauld 2025 Water Ambition notes that 14% of rivers are over-abstracted and nearly a quarter of rivers in England are at risk from unsustainable water abstraction; a similar proportion of aquifers are classed as in ‘poor quantitative status’.[footnote 19] The same study asserts that 86% of rivers do not meet good ecological status and over 50% of England’s freshwater and wetland species have declined since 1970.
For water availability, the UK is vulnerable to drought and flooding. The 2018 drought severely affected harvests, resulting in costly alternatives such as sourcing onions from New Zealand to fill supply gaps. UKCP18 show projected patterns of hotter, drier summers and a risk of more frequent and intense periods of aridity, which will have an impact on water availability for agriculture and food production. Building resilience reduces risk but could also have positive effects. For example, WRAP estimates that better water management could boost crop production by 20% globally.
Agriculture contributes to the pollution of water bodies through run-off and soil absorption of fertilisers and manure nutrients, pesticides, sediments, and faecal bacteria. High nutrient concentrations damage aquatic ecosystems and must be removed from drinking water, which is expensive. The same WRAP report estimates that it costs approximately £1.2 billion each year to remove pollutants from water so that it is safe to drink. At the same time, soils and nutrients are lost into watercourses through diffuse pollution. It has been estimated that agriculture accounts for around 61% of the total nitrogen in river water in England and Wales and around 28% of the total phosphorus load in river water in Great Britain. Diffuse water pollution from agriculture and rural land use has been directly attributed to 28% of failures to meet Water Framework Directive (WFD) standards in England.[footnote 20] This is monitored separately across the four nations.[footnote 21]
Figure 2.3.5a: UK nitrous oxide emissions

Nitrous Oxide Emissions
Source: Defra AUK 2020 (Department for Business, Energy and Industrial Strategy)
Figure2.3.5b: UK methane emissions

Methane Emissions
Source: Defra AUK 2020 (Department for Business, Energy and Industrial Strategy)
Agriculture accounted for about 11% of total greenhouse emissions in the UK in 2019, with agricultural emissions 13% lower than in 1990. This was primarily the result of reduced livestock numbers following BSE and foot and mouth outbreaks in the 1990s and early 2000s, and have not reduced significantly since 2008. A recent WRAP report estimates that total UK food system emissions are equivalent to 35% of UK territorial emissions; over a third of food system emissions are from production overseas.[footnote 22]
Agricultural emissions of nitrous oxide and methane declined through the 1990s and 2000s and have remained fairly stable since. The majority of nitrous oxide emissions from agriculture result from manure management and application of organic and mineral fertilisers to land, and have fallen with lower fertiliser application rates. The majority of methane emissions come from enteric ruminant digestion in livestock, which has fallen and then remained level just as livestock numbers have. There is research underway to investigate the link between ruminant diet and emissions to see if food additives like Bovaer 3-NOP or dietary supplements such as seaweed might help mitigate methane emissions. Even between systems producing the same outputs (like beef or dairy), greenhouse gas emissions vary greatly, and average emissions are not necessarily that informative. A nuanced, full lifecycle approach to policy on agriculture and greenhouse gases is required to understand the complexities.
It is also important to consider greenhouse gases in a global context to ensure the UK does not export emissions (and other environmental harms) to other parts of the world by replacing domestic production with imports from more environmentally damaging systems.
Note: An index number is a statistical measure that reflects a price or quantity compared with a standard or base value. The base usually equals 100 and the index number is usually expressed as 100 times the ratio to the base value. For example, if a bird population in 1980 was twice as large as it was in 1970, its index number would be 200 relative to 1970.
Figure 2.3.5c: UK farmland bird index

Wild Bird Index
Source: Defra AUK 2020 (BTO/RSPB)
Data is limited, but from farmland bird numbers it appears that biodiversity on UK farms may have fallen to about 30% of what it was in 1970. There was a sharp decline in farmland birds during the 1970s and 1980s as farming became more intensive. The decline has continued more gradually ever since and remains concerning. The ‘specialist’ species like corn buntings and yellowhammers are the better measure for understanding the impacts of farming on biodiversity as they rely most heavily on farm habitats, whereas ‘generalists’ like wood pigeons thrive in a variety of habitats. While birds are only a part of the biodiversity picture, their reliance on the food chain below them makes them a proxy indicator for plant, mammal, and insect biodiversity.
Biodiversity is key to stable farming systems. The right plants in the right place can reduce nutrient leeching, and a healthy ecosystem with insects like spiders, beetles, and earwigs can reduce pesticide use. Warmer temperatures and excess or reduced water availability has an impact on species and habitats; climate modelling and analysis of 402 species in England found that 36% were at risk of range loss and 41% may expand their range in future. This can be aggravated through agriculture and food production driving land use change, habitat loss, and fragmentation. Between 2010 and 2018, 58 recorded non-native species have become established in the UK. Though some (like the tree bumblebee) can have positive effects, overall these are one of the top 5 threats to England’s natural environment, with estimates of the economic cost at around £1.3bn per annum.[footnote 23] Farming practices and global supply chains have accelerated their spread.
A fuller view of biodiversity indicators, including pollinators, marine environment, non-native species, and many others can be found in a new report on UK biodiversity indicators by the Joint Nature Conservation Committee.[footnote 24]
Trends
Water health and abstraction are both expensive societal costs, and important issues for agriculture to address for a sustainable, food-secure future. WRAP is working towards the Courtauld 2030 Water Ambition to improve water quality and availability through sustainable water management; a progress report on a series of UK (and international) case studies on water use can be found in the 2021 annual report.[footnote 25]
Greenhouse gas emissions from agriculture have reduced overall since 1990, but have not changed in recent years. The newly published Net Zero Strategy sets out areas where innovation and emerging technologies may support the sector in adapting to climate change, and also discusses alternative proteins (Chapter 3, sections 22 and 33).[footnote 26] WRAP’s Courtauld Commitment 2030 aims to reduce UK food system greenhouse gas emissions by 50% by 2030 (alongside targets on water and waste).[footnote 27]
The continued decline of farmland birds shows that the agricultural intensification which accelerated in the 1970s continues to harm the UK’s biodiversity and, consequently, ability to produce food sustainably and in symbiosis with nature. A changing climate also increases the threat to specific species and ecosystem services through spread of new pests, pathogens, and invasive non-native species. Farming and food production can exacerbate these risks but could also play a major role in supporting the UK’s natural ecosystems, delivering mutual benefits to biodiversity and society.
About the UK Food Security Report
The UK Food Security Report sets out an analysis of statistical data relating to food security, examining past, current, and predicted trends relevant to food security to present the best available understanding of food security. It fulfils a duty under Part 2, Chapter 1 (Section 19) of the Agriculture Act 2020 to prepare and lay before Parliament “a report containing an analysis on statistical data relating to food security in the United Kingdom”. The first report must be published before Christmas Recess 2021, and subsequent reports must be published at least once every three years thereafter.
It contains statistics for different time periods, but always using latest available data at the time of release. Data comes from surveys run by Defra and from a wide range of other sources including government departments, agencies and commercial organisations, in the UK and internationally.
Associated datasets from this publication are also available. Data are a mixture of National Statistics, Official Statistics and unofficial statistics. Unofficial statistics are used where there are gaps in the evidence base. Further information on National Statistics can be found on the Office for Statistics Regulation website.
Contact and feedback
Enquiries to: foodsecurityreport@defra.gov.uk
You can also contact us via Twitter: @DefraStats
We want to understand the uses that readers make of this new report. To help us ensure that future versions of this report are better for you, please answer our short questionnaire to send us feedback.
Production team: Michael Archer, Matt Bardrick, Jasmin Eng, Ros Finney, Luke Hamilton, Jenny Kemp, David Lee, Jeremy Levett, Will Norman, Maria Prokopiou, Andrew Scaife, Chris Silwood, Jonathan Smith, Beth White, Isabella Worth.
We are extremely grateful to the following for their expert contributions and guidance throughout the synthesis of this Report, helping to ensure it delivers a thorough analysis of a robust evidence base:
-
Professor Tim Benton, Chatham House
-
Dr Tom Breeze, University of Reading
-
Professor Bob Doherty, University of York and FixOurFood
-
Selvarani Elahi MBE, UK Deputy Government Chemist, LGC
-
Dr Pete Falloon, Met Office, Climate Service Lead - Food Farming & Natural Environment
-
Alan Hayes, Food Systems and Sustainability Advisor
-
Dr John Ingram, University of Oxford
-
Professor Peter Jackson, Institute for Sustainable Food, University of Sheffield
-
Dr Ian Noble, Mondelez International
-
Dr Bill Parker, Head of Technical Programmes, AHDB
-
Dr Maddy Power, Wellcome Trust
Continue to Theme 3: Food Supply Chain Resilience
Return to Theme 1: Global Food Availability
Return to the United Kingdom Food Security 2021 home page to download the data for charts
-
Keay and others, ‘The impact of climate change on the suitability of soils for agriculture as defined by the Agricultural Land Classification - SP1104’ (2014), http://sciencesearch.defra.gov.uk/Document.aspx?Document=13364_SP1104Finalreport.pdf, page 65. ↩
-
Shewry, P.R. and S.J. Hey, ‘The contribution of wheat to human diet and health’, Food and Energy Security 2015: volume 4, https://www.ncbi.nlm.nih.gov/pmc/articles/PMC4998136/, pages 178 to 202. ↩
-
WRAP, ‘Working together to protect critical water resources’, https://wrap.org.uk/resources/report/working-together-protect-critical-water-resources. ↩
-
Seafish, ‘Market insight reports’, https://www.seafish.org/insight-and-research/foodservice-data-and-insight/. ↩
-
Defra, ‘Soil nutrient balances UK, 2020’, https://www.gov.uk/government/statistics/uk-and-england-soil-nutrient-balances-2020/soil-nutrient-balances-uk-2020-statistics-notice. ↩
-
Further information on progress in reducing food waste and details on interventions with that aim, as well as water use and other issues, can be found on the WRAP website, for example on UK food surplus and waste https://wrap.org.uk/resources/report/food-surplus-and-waste-uk-key-facts) and updates on the food waste reduction roadmap https://wrap.org.uk/resources/report/food-waste-reduction-roadmap-progress-report-2021). ↩
-
WRAP, ‘Surplus food redistribution in the UK 2015 to 2020’, https://wrap.org.uk/resources/report/surplus-food-redistribution-uk-2015-2020. ↩
-
WRAP, ‘Love Food Hate Waste’, https://www.lovefoodhatewaste.com/; ‘Food Waste Reduction Roadmap’, https://wrap.org.uk/taking-action/food-drink/initiatives/food-waste-reduction-roadmap. ↩
-
WRAP, ‘The Courtauld Commitment 2030’, https://wrap.org.uk/taking-action/food-drink/initiatives/courtauld-commitment. ↩
-
WRAP, ‘Food waste trends survey’, https://wrap.org.uk/resources/report/food-waste-trends-survey-2021. ↩
-
WRAP, ‘UK progress against Courtauld 2025 targets and UN Sustainable Development Goal 12.3’, https://wrap.org.uk/resources/report/uk-progress-against-courtauld-2025-targets-and-un-sustainable-development-goal-123. ↩
-
Defra, ‘Soil nutrient balances UK 2020’, https://www.gov.uk/government/statistics/uk-and-england-soil-nutrient-balances-2020/soil-nutrient-balances-uk-2020-statistics-notice. ↩
-
Environment Agency, ‘State of the Environment: Soils’, https://www.gov.uk/government/publications/state-of-the-environment/summary-state-of-the-environment-soil. ↩
-
CREW (Scotland’s centre of expertise for waters), ‘Effect of Soil Structure and Field Drainage on Water Quality and Flood Risk’, https://www.crew.ac.uk/sites/www.crew.ac.uk/files/publication/CRW2014_03_Soil_Structure_Drainage_Flood_Risk_Main_Report.pdf. ↩
-
UK Climate Risk Independent Assessment, ‘Technical Report: Chapter 3: Natural Environment and Assets’, https://www.ukclimaterisk.org/independent-assessment-ccra3/technical-report/. ↩
-
European Environment Agency, ‘Tropospheric ozone’, https://www.eea.europa.eu/publications/92-826-5409-5/page032new.html. ↩
-
Centre for Ecology and Hydrology, ‘NECD Reporting 2020 – Quantifying and mapping exceedances of ozone flux-based critical levels for vegetation in the UK in 2018’, forthcoming, https://uk-air.defra.gov.uk/library/, pages 4 to 5. ↩
-
Met Office Hadley Centre Climate Programme 2018 to 2021, Developed from Joanna Jones, Edward Pope, Debbie Hemming, Freya Garry, James Bacon and Jemma Davie, ‘Future climate risk to UK agriculture from compound events’, https://www.sciencedirect.com/science/article/pii/S2212096321000115. ↩
-
WRAP, ‘Working together to protect critical water resources, https://wrap.org.uk/resources/report/working-together-protect-critical-water-resources. ↩
-
Parliamentary Office of Science and Technology, ‘Diffuse pollution of water by agriculture’ https://researchbriefings.files.parliament.uk/documents/POST-PN-478/POST-PN-478.pdf. ↩
-
Environment Agency, ‘2021 River Basin Management Plan: Nitrates’, https://consult.environment-agency.gov.uk/++preview++/environment-and-business/challenges-and-choices/user_uploads/nitrates-pressure-rbmp-2021.pdf; SEPA, ‘Nitrates monitoring’, https://www.sepa.org.uk/environment/water/monitoring/nitrates-monitoring/; Natural Resources Wales, ‘Diffuse Water Pollution Action Plan’, https://naturalresources.wales/guidance-and-advice/environmental-topics/water-management-and-quality/water-quality/diffuse-water-pollution-action-plan/?lang=en; DAERA, ‘Nitrates Directive’, https://www.daera-ni.gov.uk/articles/nitrates-directive. ↩
-
WRAP, ‘UK Food System GHG Emissions’, https://wrap.org.uk/resources/report/uk-food-system-ghg-emissions. ↩
-
UK Climate Risk Independent Assessment, ‘Technical Report: Chapter 3: Natural Environment and Assets’, https://www.ukclimaterisk.org/independent-assessment-ccra3/technical-report/, pages 24 and 47 to 48. ↩
-
JNCC, ‘UK Biodiversity Indicators 2021 Revised’, https://jncc.gov.uk/our-work/uk-biodiversity-indicators-2021/. ↩
-
WRAP, Courtauld Commitment Annual Report 2021, https://wrap.org.uk/resources/report/courtauld-commitment-annual-report-2021. ↩
-
BEIS, ‘Net Zero Strategy: Build Back Greener’, https://www.gov.uk/government/publications/net-zero-strategy. ↩
-
WRAP, ‘Courtauld Commitment 2030’, https://wrap.org.uk/taking-action/food-drink/initiatives/courtauld-commitment. ↩