Largest national providers of private and voluntary social care (March 2021)
Updated 9 October 2024
Applies to England

© Crown copyright 2024
This publication is licensed under the terms of the Open Government Licence v3.0 except where otherwise stated. To view this licence, visit nationalarchives.gov.uk/doc/open-government-licence/version/3 or write to the Information Policy Team, The National Archives, Kew, London TW9 4DU, or email: psi@nationalarchives.gov.uk.
Where we have identified any third party copyright information you will need to obtain permission from the copyright holders concerned.
This publication is available at https://www.gov.uk/government/publications/inspection-outcomes-of-the-largest-childrens-social-care-providers/largest-national-providers-of-private-and-voluntary-social-care-march-2021
Main findings
-
The private sector has continued to increase its investment in children’s homes and fostering services.
-
The largest private owners of children’s homes (CHs) have continued to grow. These companies now own a larger number of homes and offer a larger number of places through these homes.
-
The top 10 companies accounted for 33% of all private children’s homes.
-
The largest company, CareTech Holdings PLC, accounted for almost 10% of all private children’s homes.
-
The 21 largest companies owned 880 homes, which is 38% of all private children’s homes. These same companies accounted for 45% of all growth in the private sector this year.
-
Just one in 8 private children’s homes (239 or 12%) was a single provider that is not in the ownership chain of a larger company.
-
Among privately owned independent fostering agencies (IFAs), 3 in 5 were single providers (156, or 61%). The remaining 101 agencies were within the ownership chain of a company that owns 2 or more IFAs.
-
Among the 101 privately owned IFAs that were within a company ownership chain, the majority (71 IFAs) were owned by 7 large providers. Large providers are companies that offer more than 1,000 places through the IFAs they own.
-
The 7 largest providers accounted for 61% of all private IFA places in England as at 31 March 2021 (21,600 out of 35,600 places).
-
The largest provider of IFA places, the Outcomes First Group (SSCP Spring Topco Ltd), provided 6,270 places. This is 18% of all IFA places provided by the private sector.
-
There are 4 companies that appear on the list of largest providers for both children’s homes and IFAs. These companies are: CareTech Holdings PLC, the Outcomes First Group (SSCP Spring Topco Ltd), Nutrius UK Topco Ltd (Polaris), and Compass Community Ltd.
Introduction
This release provides information about the ownership of children’s homes and IFAs in England, as at 31 March 2021. Children’s homes and IFAs, run by the private and voluntary sector, are the most common types of children’s social care settings in England.
According to the latest available Department for Education (DfE) data, there were just over 32,000 children in private or voluntary sector provision in England, as at 31 March 2020. Of these children, around 28,000 were in private provision and around 3,500 in voluntary provision. These figures exclude children who live in provisions run by organisations that provide the children’s services function of the council, including trusts.
The private sector, then, accounted for the vast majority of the children, 28,000, or around 35% of all children in care. This figure included around 17,500 in IFAs, around 5,000 in children’s homes, as well as around 5,300 in semi-independent and independent living. These first 2 groups are the focus of this paper, as semi-independent and independent living are neither regulated nor inspected by Ofsted.
This release describes the picture of private and voluntary ownership across children’s homes and IFAs, as at 31 March 2021. This includes information about the largest providers, which are the companies that own the largest number of children’s homes, or provide the largest number of fostering places through the IFAs they own. These providers looked after around 25,000 children in private or voluntary children’s homes and IFAs, or just under one third of all children in care in England.
We extracted the ownership data for this release from the ‘get information about a company’ tool on Companies House. The information on Companies House is provided by companies themselves, and neither Companies House nor Ofsted verify its accuracy. The company names used throughout this release are as presented at source.
Private ownership is dominant across both children’s homes and IFAs. For this reason, privately-owned provisions are the central focus of this release. Among children’s homes, when we exclude the 3 smaller sub-groups (secure homes, residential special schools registered as children’s homes, and short-break-only homes), the picture as at March 2021 remains similar to recent years. However, viewing the data year-by-year shows a slow and steady increase of private investment into the ownership of children’s homes. A similar pattern is seen among IFAs, with the number of fostering places provided by private companies increasing steadily. This incremental increase is sometimes obvious, such as when one company announces its purchase of another. But often it is not easy to identify, even by triangulating data from Ofsted and from Companies House.
Due to coronavirus (COVID-19), Ofsted suspended all routine inspections of social care providers on 17 March 2020, at the request of the Secretary of State. This meant we were unable to carry out routine inspections during the 2020 to 2021 inspection window. For this reason, inspection profiles have changed very little since the publication of Inspection profiles of the largest private and voluntary providers of children’s homes and independent fostering agencies March 2020. Any small changes to the inspection profiles are due to settings that have deregistered in year.
Despite the suspension of routine inspections in March 2020, many settings did receive a monitoring and/or assurance visit from Ofsted between 1 April 2020 and 31 March 2021. Information about these visits is included within this release, along with the inspection profile of these provisions.
Children’s homes
As at 31 March 2021, there were a total of 2,706 children’s homes of all types actively operating in England, offering a total of 12,700 places for children. Of these, 2,096 homes (77%) were in the private sector and 469 (17%) were run by local authorities and health authorities. The remaining 141 (5%) were in the voluntary sector.
The number of homes run by the private sector has increased by 12% from 31 March 2020, from 1,869 homes to 2,096 in 2021. In the same period, the number of homes run by the voluntary sector has declined by 12% from 160 to 141 homes. Local- and health-authority-run homes grew 9% from 430 to 469 homes. Local-authority-owned (LA) homes includes those operated by trusts on behalf of LAs.
This paper focuses on private ownership of children’s homes as at 31 March 2021. It is useful, though, to break down ownership by types of children home provided, as they are not a single group.
Secure children’s homes
Secure children’s homes were the smallest group, with 13 homes in England, offering a total of 230 places. Most secure children’s homes owned by local authorities (12 out of 13), with the remaining home being voluntary.
Figure 1: Number of secure children’s homes and places, by sector

Figure not to scale
Residential special schools registered as children’s homes
There were 69 residential special schools (RSS) registered as children’s homes, with a total of 1,790 places. The majority of these were under private organisations, owning 51 (74%) of the schools with 1,240 (69%) of the places. Voluntary organisations owned 15 homes (22%) with a total of 480 places (26%). Local authorities owned 3 homes (4%), offering a total of 80 places (4%).
Figure 2: Number of RSS registered as children’s homes (CHs) and places, by sector

Figure not to scale
May not sum due to rounding
Short-break-only children’s homes
These homes offer short periods of care for disabled children who usually live with their parents. There were 162 homes that provided care only for short-breaks, offering a total of 1,010 places. The majority of these (114 homes, 70%) were owned by local authorities, with some owned by health authorities, which offered a total of 710 places (70%). Voluntary organisations ran 34 homes (21%) offering 230 places (22%), with the remaining 14 homes (9%) run by the private sector (80 places, 7%).
Figure 3: Number of short-break-only children’s homes and places, by sector

Figure not to scale
May not sum due to rounding
These homes are a distinct service. As a result, the number of children’s homes owned by local authorities and voluntary organisations is even smaller than the private sector.
Children’s homes
The remaining 2,462 children’s homes were the largest group of homes (91% of all types of home). These offered the largest number of residential places (9,700 places, 76% of all places). Within this group, different homes specialise in meeting different needs. Some are more generic (for example, working with children with a range of complex needs). Some can be specialised (for example, working with those who have experienced child sexual exploitation). Children’s homes typically provide group care but can vary in size from 1 to 20 beds.
More than 4 in 5 of these homes were owned by private companies (2,031 homes, 82%), which accounts for 7,550 places (78%). Of the remaining children’s homes, 340 (14%) were owned by the local authority (1,650 places, 17%), and 91 (4%) were owned by voluntary organisations (500 places, 5%).
Figure 4: Number of children’s homes and places, by sector

Figure not to scale
For the rest of this release, analysis will include only the 2,462 children’s homes. This excludes short-break-only homes, RSS registered as children’s homes, and secure children’s homes. This maximises comparability between sectors. Figure 5 shows the sector breakdown of these children’s homes compared with last year. There was a marked rise in the private sector, from 1,804 to 2,031 homes. The voluntary sector declined from 99 to 91 homes and the LA sector grew somewhat from 307 to 340 homes.
Figure 5: Comparison of the sector breakdown of children’s homes as at 31 March 2020 and 31 March 2021

Ownership of private children’s homes
There is a wide range of ownership among children’s homes. Some homes are single providers (existing as a single entity, not owned by a larger company). Others are nested within a larger company’s ownership chain. Some of these companies own only a few homes but some own a considerably larger number.
As at 31 March 2021, there were a total of 277 private companies owning multiple homes. The majority of these (218 companies, 79%) owned 5 or fewer homes each. The company with the most, CareTech Holdings PLC, owned 196. Because there is such variation in the number of homes that companies own, we have analysed the largest providers separately. We looked at how homes owned by these companies differ from all children’s homes nationally.
We have data, extracted from Companies House, about the ownership of 2,020 of the 2,031 private children’s homes. For the remaining 11, there was no data available on Companies House.
Of these 2,020 privately owned children’s homes, as at 31 March 2021:
-
239 (12%) were single providers
-
1,781 (88%) were owned as part of another top company with at least 2 homes
-
937 (46%) were owned by companies that each owned 10 or more separate children’s homes, and of these 937 homes, 880 were owned by just 21 top companies
Figure 6: Number of private children’s homes in England as at 31 March 2021, by ownership type

Overall, the top 10 companies accounted for 33% of all private children’s homes. CareTech Holdings PLC – the largest – alone accounted for almost 10% of all private children’s homes.
Table 1: The 10 largest providers of private children’s homes as at 31 March 2021, compared with 31 March 2020
| Position | Position change | Top company | Number of children’s homes | Net change in number of homes | Places | Net change in places |
|---|---|---|---|---|---|---|
| 1 | Position unchanged | CareTech Holdings PLC | 196 | +14 | 670 | +40 |
| 2 | Position unchanged | Keys Group Ltd (G Square Healthcare Private Equity LLP) | 106 | +8 | 390 | +20 |
| 3 | Increase on last year’s position | The Outcomes First Group (SSCP Spring Topco Ltd) | 67 | +21 | 310 | +70 |
| 4 | Decrease on last year’s position | The Priory Group (Partnerships in Care UK 1 Ltd) | 58 | -2 | 290 | -20 |
| 5 | Decrease on last year’s position | Horizon Care and Education Ltd | 48 | +1 | 160 | 0 |
| 6 | Position unchanged | Sandcastle Care Ltd (SC Topco Ltd) | 47 | +10 | 130 | +20 |
| 7 | Position unchanged | Hexagon Care Services Ltd (HCS Group Ltd) | 45 | +8 | 200 | +20 |
| 8 | Position unchanged | The Partnership of Care Today (Care Today Children’s Services) | 34 | +1 | 130 | 0 |
| 9 | Position unchanged | Esland Group Holdings Ltd | 33 | +3 | 110 | +10 |
| 10 | Increase on last year’s position | Wordsworth Midco 1 Ltd (Witherslack) | 32 | +6 | 200 | +30 |
The largest providers have continued to grow both in terms of the number of homes owned and places provided. Only 1 of the top 10 has experienced a reduction in size since the previous year – The Priory Group (Partnerships in Care UK 1 Ltd).
The company Wordsworth Midco 1 Ltd (Witherslack) joined the list of the 10 largest providers this year, adding 6 new homes since 31 March 2020. This meant it surpassed The Shaw Trust Ltd, which dropped to the 11th largest company, despite opening 1 new home itself. The next companies ranked 11 to 21, in terms of the number of children’s homes they own, are detailed in table 2.
Table 2: Next 11 largest providers of private children’s homes as at 31 March 2021, compared with 31 March 2020
| Position | Position change | Top company | Number of children’s homes | Net change in number | Places | Net change in places |
|---|---|---|---|---|---|---|
| 11 | Decrease on last year’s position | Homes2Inspire Ltd (The Shaw Trust Ltd) | 28 | +1 | 110 | 0 |
| 12 | Increase on last year’s position | Compass Community Ltd | 26 | +7 | 140 | +40 |
| 13 | Decrease on last year’s position | Ardenton Capital Ltd | 26 | 0 | 70 | 0 |
| 14 | Decrease on last year’s position | Meadows Care Holdco Ltd | 21 | +2 | 70 | +10 |
| 15 | Position unchanged | Reflexion Care Group Ltd | 19 | 0 | 50 | 0 |
| 16 | Increase on last year’s position | Time Out Property Ltd | 18 | +2 | 30 | 0 |
| 17 | Increase on last year’s position | Ashridge Capital (Phoenix) Ltd Partnership | 17 | +3 | 50 | +10 |
| 18 | Decrease on last year’s position | Care 4 Children Holdco Ltd | 16 | -1 | 70 | 0 |
| 19 | Increase on last year’s position | Blue Mountain Homes Ltd | 15 | +4 | 50 | +20 |
| 20 | Position unchanged | Ethelbert Specialist Homes Ltd | 14 | 0 | 60 | 0 |
| 21 | New to the list of largest providers | Nutrius UK Topco Ltd (Polaris) | 14 | Not previously in data as top company | 50 | Not previously in data as top company |
Nutrius UK Topco Ltd has also been included in this and subsequent tables as it was a completely new entry into the children’s homes market this year, taking ownership of 2 previously separate companies and entering 21st place in the rankings. This highlights how companies can quickly gain a foothold in the market via buying other businesses out.
The 11 to 21st largest companies owned 214 homes, 18 more than CareTech Holdings PLC owned alone.
Overall, the 21 largest companies owned 880 homes – 43% of all private children’s homes. These top companies accounted for 38% of the net growth in the private sector this year. This is 21 companies out of 515 private businesses in total. This further highlights the relative size and continuing growth of these top companies. Almost half of all private homes are now under the ownership of just 21 companies.
Inspection outcomes of privately owned children’s homes
Due to COVID-19, Ofsted suspended all routine inspections of social care providers on 17 March 2020, at the request of the Secretary of State. This meant we were unable to carry out routine inspections during the 2020 to 2021 inspection window. For this reason, inspection profiles have changed very little since the publication of Inspection profiles of the largest private and voluntary providers of children’s homes and independent fostering agencies March 2020. Any small changes to the inspection profiles are due to settings that have deregistered in year.
As at 31 March 2021, the inspection profile for the 1,617 private children’s homes with judgments, were as follows:
-
244 (15%) were graded outstanding
-
1,058 (65%) were graded good
-
297 (18%) were graded requires improvement to be good
-
18 (<2%) were graded inadequate
While this release only includes inspection activity up to 31 March 2021, more visits and inspections have happened since. Routine inspection of social care providers restarted on 12 April 2021. Some settings inspection grades may have improved or declined since 31 March 2021.
Nationwide, 81% of the 1,617 children’s homes inspected were graded outstanding or good. Of the top 21 companies, 16 (76%) had higher or equal proportions of these grades at their homes.
Most companies in the top 21 have added new homes to their respective organisations in the past year. In the same period, Ofsted has not been operating its usual inspection window, due to the COVID-19 pandemic. Ofsted did carry out on-site monitoring visits as necessary. This included follow-up on urgent safeguarding concerns. As part of a phased return to routine inspection, from 1 September 2020 Ofsted started carrying out assurance visits to children’s social care services.
Monitoring visits
We carried out on-site monitoring visits as necessary to settings inspected under the social care common inspection framework (SCCIF) in line with usual guidance. This included follow-up on urgent safeguarding concerns.
Of the 2,031 privately owned children’s homes active as at 31 March 2021, 697 homes (34%) had received a total of 911 monitoring visits since 1 April 2020. Among the homes that received a monitoring visit were 14 of the 18 homes previously judged to be inadequate.
Of the 697 homes that received monitoring visits, 276 (40%) were owned by the 21 largest providers of private children’s homes. Of these, 66 (24%) were owned by the single largest provider, CareTech Holdings PLC.
Assurance visits
As part of a phased return to routine inspection, from 1 September 2020, Ofsted started carrying out assurance visits to children’s social care services. At these visits, inspectors evaluated the extent to which:
- children were well cared for
- children were safe
- leaders and managers were exercising strong leadership
We prioritised visits based on the provider’s most recent inspection judgements, other information we held about the provider, the amount of time since the last inspection and whether the provider was newly registered and therefore had not yet received a judgement.
Of the 2,031 privately owned children’s homes that were active as at 31 March 2021, 648 (32%) received an assurance visit between 1 September 2020 and 31 March 2021. Of these homes, 556 had a full inspection judgement as at 31 March 2021 and 92 had not yet received a full inspection. Some of the homes that received a monitoring visit were 16 of the 18 homes previously judged to be inadequate, and 277 (93%) of the 297 homes previously judged to be requires improvement to be good.
Although assurance visits did not result in an overall effectiveness judgement, they were used to identify any serious and widespread concerns. Of the 648 private children’s homes that received an assurance visit, 71 (11%) had serious and widespread concerns identified.
The 21 largest companies had 29% (258 homes) of their 880 homes receive an assurance visit, just below the national figure (32%). Of these, 19 (7%) had serious or widespread concerns identified. This was a lower proportion than among all privately owned homes nationally (11%). Table 3 below breaks down these visits for the 21 companies.
Table 3: Number of homes owned by the 21 largest providers that received an assurance visit, and where serious and widespread concerns were identified
| Position | Top company | Number of homes that received an assurance visit | Serious and widespread concerns identified at assurance visit |
|---|---|---|---|
| 1 | CareTech Holdings PLC | 67 | 5 |
| 2 | Keys Group Ltd (G Square Healthcare Private Equity LLP) | 33 | 1 |
| 3 | The Outcomes First Group (SSCP Spring Topco Ltd) | 23 | 0 |
| 4 | The Priory Group (Partnerships in Care UK 1 Ltd) | 17 | 0 |
| 5 | Horizon Care and Education Ltd | 18 | 2 |
| 6 | Sandcastle Care Ltd (SC Topco Ltd) | 4 | 1 |
| 7 | Hexagon Care Services Ltd (HCS Group Ltd) | 9 | 3 |
| 8 | The Partnership of Care Today (Care Today Children’s Services) | 6 | 0 |
| 9 | Esland Group Holdings Ltd | 13 | 0 |
| 10 | Wordsworth Midco 1 Ltd (Witherslack) | 6 | 0 |
| 11 | Homes2Inspire Ltd (The Shaw Trust Ltd) | 7 | 3 |
| 12 | Compass Community Ltd | 9 | 0 |
| 13 | Ardenton Capital Ltd | 11 | 1 |
| 14 | Meadows Care Holdco Ltd | 3 | 0 |
| 15 | Reflexion Care Group Ltd | 5 | 0 |
| 16 | Time Out Property Ltd | 3 | 0 |
| 17 | Ashridge Capital (Phoenix) Ltd Partnership | 3 | 0 |
| 18 | Care 4 Children Holdco Ltd | 9 | 2 |
| 19 | Blue Mountain Homes Ltd | 5 | 1 |
| 20 | Ethelbert Specialist Homes Ltd | 6 | 0 |
| 21 | Nutrius UK Topco Ltd (Polaris) | 1 | 0 |
Ownership of voluntary children’s homes
As at 31 March 2021, there were 91 voluntary children’s homes. Of these:
- 18 (20%) were single providers
- 73 (80%) were owned as part of another top company with at least 2 homes
- 41 (45%) were owned by companies with 5 or more separate children’s homes
Compared with the private sector, there were much fewer large companies in terms of number of homes. Only one top company, The Together Trust, had more than 10 homes under their ownership.
Table 4: The 5 largest providers of voluntary children’s homes, as at 31 March 2021
| Position | Top company | Number of children’s homes | Places |
|---|---|---|---|
| 1 | The Together Trust | 11 | 50 |
| 2 | St. Christopher’s Fellowship | 8 | 40 |
| 3 | Break | 8 | 30 |
| 4 | The Caldecott Foundation Ltd | 7 | 40 |
| 5 | Birtenshaw | 7 | 20 |
Inspection outcomes
Due to COVID-19, at the request of the Secretary of State, Ofsted suspended all routine inspections of social care providers on 17 March 2020. Therefore, we were not able to complete the 2019 to 2020 or the 2020 to 2021 inspection windows as normal, and we completed fewer inspections than in previous years as a result.
The latest full graded inspection outcomes for the 79 voluntary children’s homes with judgments were as follows:
- 18 (23%) were graded outstanding
- 48 (61%) were graded good
- 12 (15%) were graded requires improvement to be good
- 1 (1%) was graded inadequate
Monitoring visits
Of the 91 voluntary-sector-owned children’s homes that were active as at 31 March 2021, 25 homes (27%) received a total of 30 monitoring visits since 1 April 2020. Of the 25 homes visited, 17 (68%) had a full inspection judgement as at 31 March 2020, and the remaining 8 homes (32%) had not yet been inspected. The only voluntary home previously graded inadequate was one of the homes visited.
Assurance visits
Of the 91 voluntary-sector-owned children’s homes that were active as at 31 March 2021, 28 homes (31%) had received an assurance visit since 1 April 2020. Of the 28 homes visited, 26 (93%) had a full inspection judgement as at 31 March 2020, and the remaining 2 homes (7%) had not yet been inspected. The only voluntary home previously graded inadequate was one of the homes visited.
Independent fostering agencies
Most children in care (72%) are in foster care. This can be provided by either local authority fostering agencies or IFAs. According to our most recent statistics, over a third of all fostered children (around 19,400) are fostered through IFAs.
As at 31 March 2021, there were 307 IFAs operating in England. This number excludes the 10 IFAs owned by trusts that operate on behalf of local authorities. We have excluded these 10 IFAs throughout the rest of this release. The 307 IFAs offered a total of 39,800 fostering places for children. This was a net increase of 15 IFAs (5%) from the previous year, when there were 292 IFAs (excluding 8 operated by trusts). This net increase was the result of 24 new registrations and 9 deregistrations. The number of IFA places increased by 5,030, a 14% increase on the previous year.
Data on the number of places provided by each IFA comes from Ofsted’s annual fostering data collection. As the 2021 collection is ongoing, data included here reflects the 2020 returns. This means we do not know the number of places offered by the 24 agencies that registered during 2020 to 2021. Due to the impact of COVID-19, a small number of agencies did not submit data in the 2020 collection, although the response rate was still high at 94%. Because this lower response rate may have decreased the number of reported places, we calculated estimated figures for missing agencies. We calculated estimates by taking an average of the data submitted by agencies for the previous 3 years. In this release, we included the estimated number of places for 13 IFAs.
Either private or voluntary organisations can own IFAs, but the majority are privately owned (259 IFAs, 84%). As at 31 March 2021, the 259 private IFAs offered a total of 35,700 fostering places (90% of all IFA places). Voluntary organisations accounted for the remaining 48 IFAs (16%), and offered 4,010 places (10% of all IFA places).
Figure 7: Proportion of IFAs and IFA places provided by the private sector

The private sector has grown from 2020 to 2021, with a net increase of 19 IFAs. This resulted from 24 new registrations and 5 deregistrations. These new private IFAs accounted for all the IFAs registered in 2020 to 2021, as there were no new registrations within the voluntary sector. There was also an increase of 4,630 places offered by private companies.
In the voluntary sector, there was a net decrease in the number of IFAs. This was the result of no new registrations and 4 deregistrations. However, the number of places offered by voluntary IFAs increased by 400 places. As a result, the private sector has increased its share in IFA ownership by 2%; from 82% in 2020 to 84% in 2021. Its share in IFA places remained the same at 90%.
Figure 8: Change in the number of IFAs and IFA places, by sector, from 31 March 2020 to 31 March 2021

Numbers may not sum due to rounding.
Ownership of private IFAs
Although many IFAs are single providers not owned by a larger company, a number are nested within a larger company’s ownership chain. Some of these companies own only a few IFAs, but some own a considerably larger number.
As at 31 March 2021, there were a total of 16 private companies that owned at least 2 IFAs. The majority of these (11 companies) owned 5 or fewer IFAs each, while the company with the most, Nutrius UK Topco Ltd (Polaris), owned 24. Because there is such variation in the number of IFAs that companies own, and the number of fostering places they provided, we have analysed the largest providers separately.
As a result, throughout the following section of the release, we have described IFAs as having 3 different types of ownership:
- Single provider: those IFAs that exist as a single entity, and are not owned by a larger company.
- Small provider: those IFAs that are within the ownership chain of a small company. For this release, we defined a small company as one that owns multiple IFAs, but offers fewer than 1,000 fostering places through all of the IFAs it owns.
- Large provider: those IFAs that are within the ownership chain of a large company. For this release, we defined a large company as one that owns multiple IFAs, and offers more than 1,000 fostering places through all of the IFAs it owns. This is consistent with the definition used in previous releases on this topic.
When determining the size of companies, we chose to use the number of IFA places offered by each company, rather than the number of IFAs that it owns. This best captures the reach of a company, in terms of how many children it could offer care. We calculated the total number of places a company offers as the sum of all places, offered by all IFAs within their ownership chain. For example, if a company has 4 IFAs in their ownership chain, and each of these offered 25 places, the total places offered by the company is 100.
We have extracted data from Companies House about the ownership of 257 of the 259 privately-owned IFAs. For the remaining 2, there was no data available on Companies House. Of the 257 IFAs, 156 (61%) were single providers, 30 (12%) were owned by 9 small providers, and 71 (28%) were owned by 7 larger providers.
Figure 9: Number of private IFAs as at 31 March 2021, by ownership type

Number of IFAs excludes 2 agencies for whom there was no data available on Companies House.
The largest number of private IFAs were single providers (156 agencies, 61%). However, these IFAs accounted for less than a third (29%) of the 35,600 places provided by all private IFAs.
The majority of private fostering places (61%) were provided by the 71 IFAs owned by large providers (28% of all private IFAs). This is because IFAs owned by large providers generally offered greater numbers of places. On average these IFAs offered 310 places each, compared with 130 places per IFA owned by a small provider, and 70 per single provider.
Figure 10: Number of private IFAs and private IFA places as at 31 March 2021, by ownership type

Number of IFAs excludes 2 agencies for whom there was no data available on Companies House.
May not sum due to rounding.
Among the private sector, small providers accounted for the smallest number of both IFAs (30, 12%) and places (3,760, 11%). The total combined number of places offered by all small providers, was smaller than that of each of 3 largest providers. These were: the Outcomes First Group (SSCP Spring Topco Ltd), 6,270 places; Nutrius UK Topco Ltd (Polaris), 5,690 places; and Compass Community Ltd, 4,250 places.
The largest private providers of IFA places
There were 7 private companies that offered over 1,000 fostering places, and are therefore included on our list of largest providers. These 7 providers accounted for 61% of all private IFA places in England as at 31 March 2021 (21,600 out of 35,600 places).
The list of largest providers in 2021 is the same as that in 2020, except for 1 extra company, Five Rivers Ireland Ltd, which was the seventh largest provider of IFA places in 2021. It offered a total of 1,070 places through the 8 IFAs in its ownership chain. This is an increase of 150 places since 2020, when it offered a total of 920 places through 8 IFAs. In 2020, it did not meet the threshold to be considered a large provider.
Table 5: The largest providers of private IFA places as at 31 March 2021, compared with 31 March 2020
| Position | Position change | Top company | Number of IFA places, 2021 | Change in number of IFA places since 2020 |
|---|---|---|---|---|
| 1 | Position unchanged | The Outcomes First Group (SSCP Spring Topco Ltd) | 6,270 | -30 |
| 2 | Position unchanged | Nutrius UK Topco Ltd (Polaris) | 5,690 | +450 |
| 3 | Position unchanged | Compass Community Ltd | 4,250 | +1,130 |
| 4 | Position unchanged | Alderbury Holdings Ltd | 1,640 | +260 |
| 5 | Position unchanged | Capstone Eot Trustee Ltd | 1,430 | +70 |
| 6 | Position unchanged | CareTech Holdings PLC | 1,300 | +100 |
| 7 | New to the list of largest providers | Five Rivers Ireland Ltd | 1,070 | +150 |
Of the 7 largest providers, Compass Community Ltd had the most growth in the past year: an increase of 1,130 places. This is likely the result of having opened 2 more IFAs, to now own a total of 8. Compass Community Ltd was the only large provider that opened new IFAs during 2020 to 2021. As a result, large providers accounted for just 2 of the 24 new private IFAs registered in year. Of the remaining 22 new IFAs, 3 were opened by small providers, and 19 were single providers.
The Outcomes First Group (SSCP Spring Topco Ltd) was the only large provider to offer a smaller number of places in 2021, compared with 2020 (30 fewer places). This is likely the result of having deregistered 2 IFAs, reducing the number under its ownership from 21 to 19. Among the other large providers, 2 others had deregistrations during 2020 to 2021. Nutrius UK Topco Ltd (Polaris) closed 2 IFAs, and Alderbury Holdings Ltd closed 1 IFA. Despite these closures, the total number of places offered by these companies still increased, because their remaining IFAs expanded in size.
Small private providers of IFA places
In addition to the 7 large providers, there were 9 smaller private companies that owned 2 or more IFAs each. These small providers accounted for 30 IFAs (12% of all privately owned IFAs) and 3,760 places (11% of all private IFA places). The number of IFAs owned by these companies ranged from 2 to 5, and the total number of places provided through their IFAs ranged from 175 to 860.
Table 6: Small providers of private IFA places as at 31 March 2021
| Position | Position change | Top company | Number of IFA places, 2021 | Change in number of IFA places since 2020 |
|---|---|---|---|---|
| 8 | Position unchanged | Swiis International Ltd | 860 | +130 |
| 9 | Position unchanged | Sunbeam Fostering Agency Ltd | 730 | +110 |
| 10 | Position unchanged | Fusion Fostering Ltd | 480 | +100 |
| 11 | New to the list of small providers | UK Fostering Ltd | 440 | +50 |
| 12 | Position unchanged | The Hazel Project Ltd | 290 | +40 |
| 13 | Decrease on last year’s position | Regional Foster Families Ltd | 290 | +30 |
| 14 | New to the list of small providers | Positive Aspirations Ltd | 260 | +40 |
| 15 | Position unchanged | Futures for Children Ltd | 240 | +160 |
| 16 | Decrease on last year’s position | Young People at Heart Ltd | 180 | +90 |
As at 31 March 2021, there were 2 small providers that had previously been single providers (the companies owned only 1 IFA each). These were UK Fostering Ltd and Positive Aspirations Ltd. Since 31 March 2020, both of these companies have expanded, with Positive Aspirations Ltd now owning 3 IFAs, and UK Fostering Ltd owning 2. Only 1 other small company, Futures for Children Ltd, opened an additional IFA since March 2020. This took the number of IFAs under its ownership to 3, and resulted in an additional 160 places. Despite this increase in IFAs and places, this company remained at number 15 on the list.
The 6 remaining small providers all owned the same number of IFAs as in the previous year. However, all had an increase in the total number of places provided by these IFAs.
Inspection profile of the largest private providers of IFAs as at 31 March 2021
According to regulations, Ofsted has a duty to inspect IFAs at least once within a 3-year inspection window. Agencies judged inadequate or requiring improvement to be good are usually re-inspected within a shorter time frame.
Due to COVID-19, Ofsted suspended all routine inspections of social care providers on 17 March 2020, at the request of the Secretary of State. As a result, the grade profile of IFAs as at 31 March 2021 has changed very little since March 2020. Any small changes are the result of IFAs that deregistered in the year.
The largest private providers of IFAs continue to have a better grade profile than among all private IFAs nationally. Of the IFAs that had received an inspection grade as at 31 March 2021, 99% of those owned by large providers were good or outstanding, compared with 94% of all private IFAs nationally. The same was true for IFAs owned by small private providers, of which 96% were good or outstanding.
Although we had to suspend routine inspections in March 2020, 17% of private IFAs (44) received a monitoring and/or assurance visit from Ofsted between 1 April 2020 and 31 March 2021.
This release includes inspection activity up to 31 March 2021 only. However, visits and inspections have occurred since this date. Routine inspection of social care providers restarted on 12 April 2021. As a result, some settings inspection grades may have improved or declined since 31 March 2021.
Monitoring visits
We carried out on-site monitoring visits to settings inspected under the SCCIF, as necessary. This is in line with usual guidance, including to follow up on urgent safeguarding concerns.
Between 1 April 2020 and 31 March 2021, 16 (6%) of the 259 private IFAs had received a total of 19 monitoring visits. Among the IFAs that received a visit were all 4 IFAs that were judged inadequate at their most recent full inspections. The remaining 12 homes that received visits were previously judged good (11), or had not yet been inspected (1).
Among the 16 private IFAs that received monitoring visits, 5 were owned by large providers. Of these, 3 were owned by the second largest provider, Nutrius UK Topco Ltd (Polaris). The remaining 11 private IFAs that received a monitoring visit were independently owned.
Assurance visits
From 1 September 2020, Ofsted started carrying out assurance visits to children’s social care services as part of a phased return to routine inspection. Between 1 September 2020 and 31 March 2021, 35 (14%) of the 259 private IFAs received an assurance visit. Of these IFAs, 6 were owned by the largest providers.
Although assurance visits did not result in inspection judgements, they were used to identify any serious and widespread concerns. Only 2 of the 35 private IFAs that received an assurance visit, and were active as at 31 March 2021, had serious and widespread concerns identified. One of these IFAs was a single provider, and 1 was owned by a large provider.
Figure 11: Number of monitoring visit and assurance visits received by private IFAs active as at 31 March 2021, by ownership type

Numbers of IFAs owned by large providers, small providers, and single providers, excludes the 2 IFAs for whom there was no data available on Companies House.
Figure not to scale.
Ownership of voluntary IFAs
Of the 48 voluntary IFAs that were active as at 31 March 2021, 20 (42%) were single providers. The remaining 28 were within the ownership chains of 6 companies. This is a different pattern of ownership to that seen in the private sector, where 61% of IFAs were single providers.
All 6 of the voluntary companies that owned multiple IFAs offered fewer than 1,000 fostering places in total, so are considered small providers. The 28 voluntary IFAs that were owned by small providers accounted for over two thirds of all fostering places provided by voluntary IFAs (2,740, 68%).
Figure 12: Proportion of IFAs and IFA places provided by voluntary and private IFAs, by ownership type
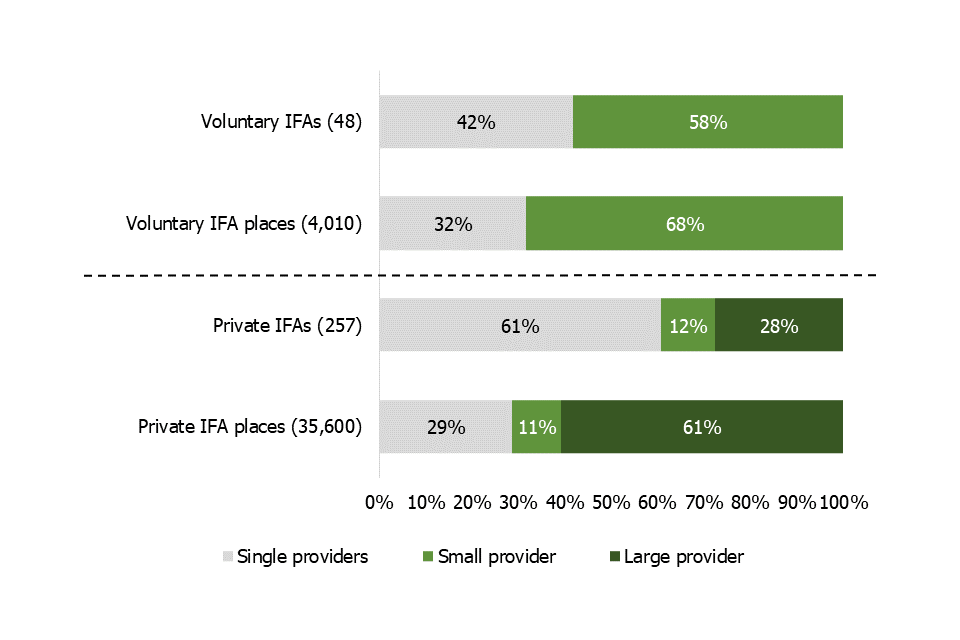
Number of IFAs excludes 2 agencies for whom there was no data available on Companies House.
Numbers may not sum due to rounding.
The number of IFAs owned by each small voluntary provider ranged from 2 to 7. The total number of places provided by these providers ranged from 130 to 960. The biggest voluntary company, The Adolescent and Children’s Trust, owned the most IFAs (7), and provided the most places (960). This number accounts for 35% of voluntary places offered by small providers (960 out of 2,740), and 24% of all voluntary places (960 out of 4,010). It is also almost double the number offered by the next biggest voluntary provider (Barnardo’s, 560 places).
Inspection profile of voluntary IFAs, owned by small providers and single providers, as at 31 March 2021
Similar to privately owned IFAs, the inspection profile of voluntary agencies has changed very little since 31 March 2020. Any small change is due to the 4 IFAs that deregistered in year. IFAs owned by small voluntary providers also continue to perform better than all voluntary IFAs nationally, with 96% judged good or outstanding, compared with 89% of voluntary agencies owned by single providers.
Monitoring visits and assurance visits
Although we had to suspend routine inspection in March 2020, 7 of the 48 voluntary IFAs received some inspection activity between 1 April 2020 and 31 March 2021. Six IFAs received an assurance visit, and 1 IFA received both a monitoring and assurance visit. These 7 IFAs were split between the different ownership types, with 4 being owned by small providers and 3 being single providers. No serious and widespread concerns were identified at any of the assurance visits.
Companies among the largest providers of both children’s homes and IFA places
There were 4 companies that appeared on the list of largest providers for both children’s homes and IFAs. These were: CareTech Holdings PLC; Outcomes First Group (SSCP Spring Topco Ltd); Nutrius UK Topco Ltd (Polaris); and Compass Community Ltd.
- CareTech was the largest provider of children’s homes (196 homes, offering 670 places), and the sixth largest provider of IFA places (4 IFAs, offering 1,300 places).
- The Outcomes First Group (SSCP Spring Topco Ltd) was the third largest provider of children’s homes (67 homes, offering 310 places), and the largest provider of IFA places (19 IFAs, offering 6,270 places).
- Nutrius UK Topco Ltd (Polaris) was a new entry at number 21 on the list of largest providers of children’s homes (14 homes, offering 50 places), and the second largest provider of IFA places (24 IFAs, offering 5,690 places).
- Compass Community Ltd was number 12 on the list of largest providers of children’s homes (26 homes, offering 140 places), and the third largest provider of IFA places (8 IFAs, offering 4,250 places).
These 4 companies accounted for: 15% of private children’s homes; 15% of private children’s home places; 21% of private IFAs; and 49% of private IFA places.
Contacts
If you are a member of the public and have any comments or feedback on this publication, contact Adam King adam.king@ofsted.gov.uk or the social care team socialcaredata@ofsted.gov.uk.
Acknowledgements
Thanks to Jenny Bird, Leonard Tippetts, Klara Davies and Jade Davies for their contribution to this release.
Annex: data tables for figures
This section contains the underlying data in an accessible table format for all figures.
Data for Figure 1: Number of secure children’s homes and places, by sector
| Number of homes | Number of places | |
|---|---|---|
| Local authority | 12 | 220 |
| Voluntary | 1 | 10 |
| Total | 13 | 230 |
See Figure 1.
Data for Figure 2: Number of RSS registered as children’s homes and places, by sector
| Number of homes | Number of places | |
|---|---|---|
| Private | 51 | 1,240 |
| Local authority | 3 | 80 |
| Voluntary | 15 | 480 |
| Total | 69 | 1,790 |
See Figure 2.
Data for Figure 3: Number of short-break-only children’s homes and places, by sector
| Number of homes | Number of places | |
|---|---|---|
| Private | 14 | 80 |
| Local authority | 105 | 660 |
| Health authority | 9 | 60 |
| Voluntary | 34 | 230 |
| Total | 162 | 1,010 |
See Figure 3.
Data for Figure 4: Number of children’s homes and places, by sector
| Number of homes | Number of places | |
|---|---|---|
| Private | 2,031 | 7,550 |
| Local authority | 340 | 1,650 |
| Voluntary | 91 | 500 |
| Total | 2,462 | 9,700 |
See Figure 4.
Data for Figure 5: Comparison of the sector breakdown of children’s homes as at 31 March 2020 and 31 March 2021
| As at 31 March 2020 | As at 31 March 2021 | |
|---|---|---|
| Private | 1,804 | 2,031 |
| Voluntary | 99 | 91 |
| Local authority | 307 | 340 |
| Total | 2,210 | 2,462 |
See Figure 5.
Data for Figure 6: Number of private children’s homes in England as at 31 March 2021, by ownership type
| Type of ownership | Number of Homes | |
|---|---|---|
| Single providers | 239 | |
| Under ownership of a company that owns 2 or more homes | 901 | |
| Owned by a top 21 company | 880 | |
| Total | 2,020 |
See Figure 6.
Data for Figure 7: Proportion of IFAs and IFA places provided by the private sector
| % of IFAs | % of IFA places | |
|---|---|---|
| Private | 84 | 90 |
| Voluntary | 16 | 10 |
See Figure 7.
Data for Figure 8: Change in the number of IFAs and IFA places, by sector, from 31 March 2020 to 31 March 2021
| As at 31 March 2020 | As at 31 March 2021 | |
|---|---|---|
| Number of private IFAs | 240 | 259 |
| Number of private IFA Places | 31,100 | 35,700 |
| Number of voluntary IFAs | 52 | 48 |
| Number of voluntary IFA Places | 3,610 | 4,010 |
See Figure 8.
Data for Figure 9: Number of private IFAs as at 31 March 2021, by ownership type
| Type of ownership | Number of private IFAs | % of private IFAs | |
|---|---|---|---|
| Single provider | 156 | 61 | |
| Small provider | 30 | 12 | |
| Large provider | 71 | 28 |
See Figure 9.
Data for Figure 10: Number of private IFAs and private IFA places as at 31 March 2021, by ownership type
| Type of ownership | Number of private IFAs | % of private IFAs | Number of private IFA places | % of private IFA places | |
|---|---|---|---|---|---|
| Single providers | 156 | 61 | 10,200 | 29 | |
| Small provider | 30 | 12 | 3,760 | 11 | |
| Large provider | 71 | 28 | 21,600 | 61 |
See Figure 10.
Data for Figure 11: Number of monitoring visit and assurance visits received by private IFAs active as at 31 March 2021, by ownership type
| Private IFAs by ownership type | Number of monitoring visit and assurance visits |
|---|---|
| All active private IFAs as at 31 March 2021 | 259 |
| Large providers | 71 |
| Small providers | 30 |
| Single providers | 156 |
| Large providers with a monitoring visit | 5 |
| Large providers with an assurance visit | 6 |
| Large providers with an assurance visit where serious and widespread concerns were identified | 1 |
| Small providers with a monitoring visit | 0 |
| Small providers with an assurance visit | 3 |
| Small providers with an assurance visit where serious and widespread concerns were identified | 0 |
| Single providers with a monitoring visit | 11 |
| Single providers with an assurance visit | 26 |
| Single providers with an assurance visit where serious and widespread concerns were identified | 1 |
See Figure 11.
Data for Figure 12: Proportion of IFAs and IFA places provided by voluntary and private IFAs, by ownership type
| % Independently owned | % Small provider | % Large provider | |
|---|---|---|---|
| Voluntary IFAs (48) | 42 | 58 | 0 |
| Voluntary IFA places (4,010) | 32 | 68 | 0 |
| Private IFAs (257) | 61 | 12 | 28 |
| Private IFA places (35,600) | 29 | 11 | 61 |
See Figure 12.