Fostering in England 2019 to 2020: main findings
Published 12 November 2020
Applies to England

© Crown copyright 2020
This publication is licensed under the terms of the Open Government Licence v3.0 except where otherwise stated. To view this licence, visit nationalarchives.gov.uk/doc/open-government-licence/version/3 or write to the Information Policy Team, The National Archives, Kew, London TW9 4DU, or email: psi@nationalarchives.gov.uk.
Where we have identified any third party copyright information you will need to obtain permission from the copyright holders concerned.
This publication is available at https://www.gov.uk/government/statistics/fostering-in-england-1-april-2019-to-31-march-2020/fostering-in-england-2019-to-2020-main-findings
The Fostering in England 1 April 2019 to 31 March 2020 release also includes:
- data tables
- methodology
- pre-release access list
Summary
This release covers:
- the numbers of foster carers and foster places and placements, in both local authority (LA) and independent fostering agencies (IFA)
- data relating to types of foster care, registrations, de-registrations and a range of other subjects
- the period between 1 April 2019 and 31 March 2020
Due to the impact of coronavirus (COVID-19), a small number of agencies did not submit data this year. Because of this, numbers may be lower than in previous years, though we have tried to estimate where possible, and any yearly comparisons must be used with caution. For more information, visit the Ofsted guidance and information relating to COVID-19.
Overall, net capacity increased in both number of households and places. However, this differs across the 2 sectors. Net capacity increased in IFAs, but decreased in LAs.
As at 31 March 2020, IFAs have seen a net increase in capacity as a result of 330 additional households and 560 additional places. In contrast, LAs have seen a slight decrease in capacity of 230 households and 490 places.
The number of filled fostering places has increased, while the number of vacant places decreased.
As at 31 March 2020, we estimate that there has been a 3% increase in the number of filled fostering places, and a 13% decrease in the number of vacant places.
The majority of foster carers in England are over the age of 50.
As at 31 March 2020, of the 71,150 approved foster carers, 65% were over 50 years old and 25% were over 60.
Younger carers have higher levels of occupancy than older carers.
As at 31 March 2020, carers aged 20 to 39 had 67% of available places with children in them, while those aged 55+ had 62%. The older the carer, the more likely that there was a greater proportion of ‘not available’ places.
Around half of IFA fostering households are registered with agencies owned by just 6 ‘top companies’.
On 31 March 2020, there were 14,995 fostering households within the IFA sector. Around half of these (7,652) were registered with IFAs that are owned by the 6 largest providers of IFA places in England. These top 6 companies therefore account for 51% of all IFA households, and 18% of households nationally.
Introduction
This statistical release covers local authority (LA) fostering agencies and independent fostering agencies (IFA) in England in the year 1 April 2019 to 31 March 2020. It includes data about foster carers, recruitment and capacity of providers. In the latest Department for Education (DfE) published data covering 2018 to 2019, fostered children represented nearly three quarters of all children in care, or fewer than 1% of all children in England.
This release uses data that agencies have returned to Ofsted and so may reflect changes that have happened both in the sector and in how agencies are recording and reporting data. The data helps inform fostering policy and serves as a point of reference for all fostering agencies in the country.
Throughout this release, we have included historical trend data for at least 4 years before 2019 to 2020, where available.
Due to COVID-19, a number of fostering agencies were unable to submit data. We collected data from 410 agencies (LA and IFA), or 94% of all eligible agencies, 138 LA fostering agencies and 272 IFAs.
We estimate that, at the end of March 2020, there were around 44,500 fostering households, in 431 agencies, with around 75,300 approved foster carers looking after about 56,500 children. There continues to be a great interest in enquiries about becoming a foster carer. We estimate that there were around 137,200 initial enquiries from prospective fostering households, an increase of around 7%. Despite this, there was a 10% decrease in applications to become a carer from March 2019.
The number of households and the number of approved foster carers increased very slightly. We estimate that there were around 89,200 fostering places, a small increase in approved places. Capacity increased overall, with a 3% estimated increase of filled places, while the number of ‘not available places’ grew slightly too. The majority of fostering places are still approved by LA fostering services. LAs reported 59% of all approved places with 41% in IFAs, similar to March 2019.
While LAs continued to have a two thirds share of foster care the number of LA foster carers fell by around 1,500, or 4%. The number of IFA carers grew by 430, or around 2% overall, but all the growth was in private IFAs since voluntary IFAs had around 100 fewer carers than last year. The age of foster carers showed that most carers were over 50 and one quarter were over 60. This is the first time that we have had data relating to the age of foster carers.
The number of households and carers has remained similar at a time when the number of children in care is at its highest level, and children are entering the system at an older age than before, resulting in a growing adolescent care population.
Fostering households
We estimate that there were around 44,500 fostering households at 31 March 2020. We collected data on 42,125 fostering households from 410 agencies (LA and IFA), or 94% of all eligible agencies. If a full submission had been possible, we estimate that the number of fostering households would have remained similar to 31 March 2019 (44,450). This suggests that the number of fostering households is at its highest level since 2015.
The sector split of fostering households as at March 2020 remained similar to that in 2019 and 2018 (66% LA households and 34% IFA households). We estimate that LAs accounted for around 29,200 households (66%), and IFAs for around 15,300 households (34%).
Figure 1: Proportion of all households by sector, as at 31 March 2020

Of the 42,125 households, 7,695 were newly approved during 2019 to 2020. In line with 2018 to 2019, LAs accounted for just over two thirds of newly approved households (5,200 households or 68%).
As at 31 March 2020, the majority of fostering households had 2 carers. Single carer households accounted for less than one third (31%) of all households, the same proportion as in 2019.
Households by primary placement type
As at 31 March 2020, 3 primary placement types accounted for 91% of all fostering households in England: not permanent (43%), permanent (32%) and family and friends (16%). ‘Not permanent’ care refers to care that is not currently planned to last until the child ceases to be looked after or until the child reaches 18.
The proportion of households with the primary placement type of ‘not permanent’ increased by 2 percentage points since 31 March 2019, whereas households with ‘permanent’ decreased by 3 percentage points. The proportion of households whose primary offer is for family and friends care remained the same.
Family and friends care is only offered by households within the LA sector, and involves a separate approval process to other types of foster care. Households providing family and friends care usually receive this separate approval in order to care for a specific child or children, and 99% of these households were not approved to offer other types of care.
As at 31 March 2020, a quarter of LA households had family and friends care as their primary placement offer (25%), a small increase from the previous year, and this form of care accounted for 59% of newly approved LA households. All commentary from now on will exclude family and friends.
The other primary placement types (short breaks, emergency, parent and child, multi-dimensional treatment, fostering to adopt, remand, shared care and ‘other’) accounted for less than 10% of fostering households in England.
Households offering a range of foster care
Along with a primary placement type, many households are approved to offer additional types of care. This enables households to provide different placement types dependant on the needs of the child.
As at 31 March 2020, 60% of fostering households offered multiple types of foster care, a 2 percentage point decrease from 31 March 2019. Of all fostering households in England, 33% were approved for 2 types of care, 14% for 3 types of care and 13% for 4 or more types of care.
In line with previous years, the proportion of households approved for multiple types of care was much higher in the IFA sector: 85%, compared to 42% for LAs. The care types short breaks, emergency, parent and child, ‘other’ and multi-dimensional treatment are all offered by a higher proportion of IFA households, compared to LAs.
More than half (58%) of LA households were approved for only one type of care compared with a minority (15%) of IFA households.
Table 1: Number and percentage of households approved to offer each type of care (inclusive of primary and additional offers), as at 31 March 2020
| Type of fostering | Number of households in England (35,115) | Percentage of households in England | Number of LA households (20,120) | Percentage of LA households | Number of IFA households (14,995) | Percentage of IFA households |
|---|---|---|---|---|---|---|
| Not permanent | 29,020 | 83% | 15,580 | 77% | 13,440 | 90% |
| Permanent | 20,130 | 57% | 8,375 | 42% | 11,755 | 78% |
| Short breaks | 10,240 | 29% | 4,445 | 22% | 5,795 | 39% |
| Emergency | 7,305 | 21% | 1,390 | 7% | 5,915 | 39% |
| Parent and child | 2,135 | 6% | 275 | 1% | 1,860 | 12% |
| Other | 1,365 | 4% | 165 | 1% | 1,200 | 8% |
| Shared care short breaks | 1,045 | 3% | 930 | 5% | 120 | 1% |
| Multi-dimensional treatment | 650 | 2% | 65 | 0% | 585 | 4% |
| Fostering to adopt | 325 | 1% | 215 | 1% | 110 | 1% |
| Not known | 305 | 1% | 20 | 0% | 285 | 2% |
| Remand | 210 | 1% | 15 | 0% | 195 | 1% |
Percentages reflect the proportion of all households that are approved to offer each type of care. As some households are approved to offer multiple types of care, percentages will not add up to 100.
As seen in previous years, short breaks and emergency foster care placements were much more likely to be additional, rather than primary, placement offers. On 31 March 2020, only 1% of fostering households offered emergency care as their primary offer, but the figure was 21% when including the additional offers. IFA households being 4 times more likely to do so (39% compared to 7% for LAs). Similarly, only 4% of households have short breaks as their primary offer, increasing to 29% when considering all households approved for short breaks.
Fostering household sizes
As at 31 March 2020, the majority (72%) of fostering households were approved to care for 2 or 3 children. In line with previous years, IFA households were more likely to be approved to care for larger numbers of children. Almost half (47%) of IFA households were approved to care for 3 or more children, compared to 29% of LA households.
Within both LA and IFA sectors, newly approved households were more likely to be approved to look after smaller numbers of children. Forty per cent of newly approved households that were approved in 2019 to 2020 were for one child, compared to 27% of all approved households.
Figure 2: Proportion of all households and newly approved households by household size, as at 31 March 2020

Download a zip file with the underlying data in csv format.
Foster carers
Approved foster carers
We estimate that the number of approved foster carers was around 75,300, a very similar figure to March 2019 (75,260). This is based on the 71,150 foster carers who we have data for, submitted from the 94% of agencies that completed the data collection.
As in previous years, LA agencies continue to account for almost two thirds of all carers (64%) and almost two thirds (64% or 34,190) of children in placements.
The number of foster carers in the LA sector, though, decreased and those in the IFA sector increased.
Figure 3: Estimated number of foster carers by sector, as at 31 March 2020

Download a zip file with the underlying data in csv format.
When looking at the number of carers per household, the majority of carers (82%) live in 2 carer households. Single carers (13,100) account for 18% of the carer population, but look after a disproportionate number of children, around 25% (14,500). This was more likely to happen in LAs than IFAs.
Of the 71,150 approved foster carers, 12,585 (18%) were newly approved between 1 April 2019 and 31 March 2020, the same proportion as 2018 to 2019. Again, LA agencies accounted for a third (66%) of these new approvals in 2019 to 2020.
Overall, for the 138 LAs that there was data for, there were fewer LA carers in March 2020 than in March 2019. Eighty-eight LAs saw a decline in the number of carers, and 49 LAs saw an increase, resulting in a net loss of 1,515 carers (4%).
Overall, for the 272 IFAs that there was data for, there were more carers in March 2020 than in March 2019. Of these IFAs, 143 saw an increase in the number of foster carers, and 102 saw a decrease in numbers, resulting in a net gain of 430 carers.
When looking at the split by IFA sector, private IFAs had a net gain of 530 and voluntary IFAs had a net loss of 100 carers.
Ethnicity
On 31 March 2020, in line with previous years, most foster carers were White (82%). This is less than the proportion of White people in the adult (aged 25 and older) population (88%). This figure includes 2,070 foster carers who are White ethnic minorities representing 4% of White carers and 3% of all carers, the same as March 2019.
As with previous years, there was a greater proportion of foster carers from non-White ethnic groups in IFAs than in the LA sector. In IFAs, 21% were from non-White ethnic groups, compared with 12% in LAs, the same as March 2019. As at 31 March 2019 (when we last collected children’s data on ethnicity), IFAs also accounted for a slightly larger proportion of children from non-White ethnic groups (27%) than LAs (21%).
Of all newly approved foster carers during 2019 to 2020, 79% were White and 15% were from non-White ethnic groups, in line with 2018 to 2019. The remaining 6% were reported with their ethnicity marked as ‘Not known’. The large majority of these were with LA agencies, half of which are accounted for by family and friends carers.
In the LA sector, 82% of newly approved carers were White, compared with 74% in IFAs. In line with previous years, IFAs accounted for a larger proportion of non-White ethnic groups (25%) than LAs (10%).
Figure 4: Ethnicity of foster carers by sector, as at 31 March 2020 and approved during 2019 to 2020

Of all foster carers approved at 31 March 2020, 2% had an ethnicity of ‘Not known’ recorded. As a result, the percentages relating to ethnic groups do not always add up to 100%.
Download a zip file with the underlying data in csv format.
Age
For 2020, we collected the age of foster carers for the first time.
The largest group (41%) of foster carers were in their 50s. Almost one quarter (23%) were in their 40s and one quarter (25%) were over 60. Those over 65 made up around one tenth (11%) of all carers, as did those in their 20s and 30s (12%).
The age split across both the LA and IFA sectors is in line with the national split.
Figure 5: Age of foster carers by sector, as at 31 March 2020

Download a zip file with the underlying data in csv format.
When looking at the age split of newly approved foster carers, we see a higher percentage of carers in the younger age brackets. Foster carers in their 20s and 30s accounted for one quarter (25%) of all newly approved foster carers. Just over one quarter (27%) of newly approved foster carers were in their 40s and one third (33%) were in their 50s. Newly approved foster carers over 60 accounted for 14%.
Figure 6: Age of newly approved foster carers by sector, as at 31 March 2020

Download a zip file with the underlying data in csv format.
Age and ethnicity
When looking at the age of foster carers by ethnicity, both White and non-White ethnic groups are mostly in line with the national picture.
Figure 7: Age of foster carers by ethnicity and sector, as at 31 March 2020

Two per cent of ethnicity data was recorded as ‘Not known’ and is excluded from the chart.
Download a zip file with the underlying data in csv format.
Age and number of carers in households
Single carers accounted for 18% of all foster carers, as at 31 March 2020. The ages of both single carers and those in 2 carer households are generally in line with the national picture, with the majority of carers aged 50 and above. However, a greater proportion of single carers are aged over 50 (70%), compared to carers in 2 carer households (65%).
Single carers aged 50 and above account for just 13% of all carers, but look after 19% of all children placed.
Figure 8: Age of foster carers by number of carers in household, as at 31 March 2020

Download a zip file with the underlying data in csv format.
Age and type of care
Family and friends care accounted for 48% of LA households with carers aged 20 to 39, compared to 22% with carers aged 40 and above.
Across both sectors, households with younger foster carers were less likely to offer permanent care as the primary offer: 28% of households with foster carers aged 20 to 39, compared to 39% of households with foster carers aged 40 and above.
Age and approvals
Fostering households with younger foster carers were more likely to be approved to look after a smaller number of children. Just over one third (37%) of households with carers aged 20 to 39 were approved to care for 1 child, compared to a quarter (25%) of households with carers aged 40 and above. This can be partially explained by the fact that younger carer households were more likely to be newly approved (30%) than older carer households (11%).
Age and places
Overall, 64% of fostering places had children in them. The highest occupancy, though, tended to occur with the younger age groups of foster carers. This can be partially accounted for by the smaller household sizes seen in these younger age groups. The carers aged 20 to 39 had 67% of available places with children in them, while those aged 55+ had 62%. The older the carer, the more likely that there was a greater proportion of ‘not available’ places.
Table 2: Age of foster carers by occupancy of places
| Age group | Number of vacant places | Number of ‘not available’ places | Number of children in placements | Total |
|---|---|---|---|---|
| 20–24 | 10 | 25 | 195 | 230 |
| 25–29 | 165 | 225 | 905 | 1,295 |
| 30–34 | 455 | 510 | 1,880 | 2,850 |
| 35–39 | 760 | 760 | 3,000 | 4,520 |
| 40–44 | 1,135 | 1,325 | 4,490 | 6,950 |
| 45–49 | 1,855 | 2,005 | 7,490 | 11,350 |
| 50–54 | 2,720 | 3,280 | 11,640 | 17,635 |
| 55–59 | 2,700 | 3,650 | 11,665 | 18,010 |
| 60–64 | 1,890 | 2,670 | 7,670 | 12,230 |
| 65+ | 1,450 | 2,110 | 4,645 | 8,205 |
| Total | 13,135 | 16,555 | 53,585 | 83,275 |
Age and length of time as a carer
Households with older carers were more likely to have been fostering for longer: 27% of households with carers aged 40 and above had been caring for 10 years or more, compared to just 3% of households with carers aged 20 to 39. Around half (51%) of households with carers aged 20 to 39 had been caring for less than 2 years.
Figure 9: Length of time households have been caring for children, by carer age

Download a zip file with the underlying data in csv format.
Age and de-registrations
Proportionally, the highest rates of de-registration were those carers in their early 30s (30 to 34) and those aged 65+, both at 14%. Carers in their 50s had the lowest proportions of de-registrations at 10% for each age bracket.
Figure 10: Proportion of carers who de-registered in 2019 to 2020, by age of foster carer.

Download a zip file with the underlying data in csv format.
The age profiles of de-registered carers were very similar among LAs and IFAs. Excluding family and friends and fostering to adopt households, IFAs and LAs de-registered similar numbers of households across each age bracket, although LAs de-registered more in the 65 and older age group (350), compared to IFAs (245).
Training and development
As at 31 March 2020, 71% of approved foster carers (50,855) had completed their training, standards and development (TSD). This is in line with previous years and shows little progress. As in previous years, a higher proportion of foster carers had completed this training in the IFA sector (81%) than in the LA sector (66%). Of those carers who were overdue to complete their training, 55% (10,090) were in progress, 40% (7,270) had not yet started and 5% (2,020) were awaiting sign-off, all in line with previous years.
A higher proportion of carers in the LA sector (13%) were yet to start their training compared with IFAs (6%). For 2,020 foster carers, their training status was unknown. Family and friends carers in the LA sector accounted for just over half of these.
Figure 11: Training, standards and development status of foster carers by sector, as at 31 March 2020

Download a zip file with the underlying data in csv format.
Fostering capacity
Approved places
We estimate that there were 89,200 fostering places in England as at 31 March 2020. This equates to a small increase in approved places (from 88,370). This is based on figures, collected from 94% of all agencies, of 84,545 approved fostering places.
Over the last 6 years, the general trend is a slow increase in numbers of places. It is estimated that total places in England may have increased by 11% since 31 March 2015. LA places are estimated to have increased by 10% overall, while IFA places are estimated to have increased by 12%.
The majority of fostering places are still approved by LA fostering services. LAs reported 59% of all approved places, with 41% in IFAs, which is similar to 31 March 2019.
There were 1,750 household places used exclusively for short breaks.
Figure 12: Approved fostering places on 31 March by sector, 2016 to 2020

Estimates have been used for the number of places as at 31 March 2020.
Download a zip file with the underlying data in csv format.
Occupancy
Of the 84,545 approved fostering places for which we have data, excluding short-break only places:
- 64% were filled (53,585)
- 16% were vacant (13,135)
- 20% were ‘not available’ (16,555)
Patterns of occupancy have maintained a steady trend since 2016. Increasingly, there have been more children living with foster carers (5 percentage points increase) and fewer places vacant (a decrease of 8 percentage points).
We estimate that the total number of filled places on 31 March 2020 was around 56,500, which would represent a 3% increase in filled places from 31 March 2019. The DfE reported a very similar figure for the previous year 56,160 children in foster placements.
Figure 13: Proportion of fostering places, by occupancy status on 31 March

Estimates have been used for the number of places as at 31 March 2020.
Download a zip file with the underlying data in csv format.
When looking at levels of occupancy within both sectors, we can see a distinct difference in patterns. LAs continue to have an increasing proportion of filled places, while their vacant places have decreased. Not available places have remained proportionally very similar. In IFAs, although their number of vacant places are also decreasing, their number of not available places has increased over time. Filled places within IFAs have remained proportionally similar.
Figure 14: Proportion of fostering places, by occupancy status and sector, on 31 March

Download a zip file with the underlying data in csv format.
Unavailable fostering places
We estimate that around 20% of places (17,200) were ‘not available’. This marks an increase since March 2019 and this would have been true even without our estimate and with the raw data (16,555).
There can be a number of reasons why a place is ‘not available’ for fostering. These are listed in the table below. Though the numbers are greater than March 2019, proportionally the reasons were similar to last year.
Table 3: Number and percentage of ‘not available’ places by reason, at 31 March 2020
| Reasons for ‘not available’ places | Number at 31 March 2020 | Percentage at 31 March 2020 |
|---|---|---|
| Carer reasons (not otherwise specified) | 4,025 | 24 |
| Carer(s) taking a break/pending resignation | 2,950 | 18 |
| Needs of child currently in placement (not otherwise stated) | 2,705 | 16 |
| Only available if sibling group placed | 2,395 | 14 |
| Reason unknown/other | 1,625 | 10 |
| Used by children and young people (CYP) staying put after turning 18 | 1,385 | 8 |
| Carer(s) under investigation | 735 | 4 |
| Used for short breaks – CYP not otherwise looked after | 390 | 2 |
| Reserved for pending placement | 335 | 2 |
| Total | 16,555 | 100 |
New approvals by type
In total, there were 9,510 fostering households successfully approved during 2019 to 2020, of which 7,695 were still approved on 31 March 2020. The other 1,815 households were both approved and de-registered during the year, the majority of which were family and friends or fostering to adopt households. Two in every 5 households (40%) that were both approved and still active in the year ending 31 March 2020 were family and friends households.
In line with previous years, family and friends households represented the majority (59%) of new households approved and still active among LAs. The number of newly approved households for non-permanent foster care was similar among LAs and IFAs. In contrast, IFAs approved almost 3 times more households for permanent foster care, 875 new households in IFAs compared to 300 in LAs.
Table 4: Types of foster care offered by newly approved households during 2019 to 2020, by sector
| Types of foster care | Number of new households – England | Number of new households – LAs | Number of new households – IFAs | Percentage of new households – LAs | Percentage of new households – IFAs |
|---|---|---|---|---|---|
| Family and Friends | 3,065 | 3,065 | 0 | 59 | 0 |
| Non-permanent foster care | 2,735 | 1,425 | 1,310 | 27 | 53 |
| Permanent foster care | 1,175 | 300 | 875 | 6 | 35 |
| All other types of foster care | 720 | 405 | 305 | 8 | 12 |
Retention of foster carers
As at 31 March 2020, a greater proportion of LA households had been caring for children for 10 years or more (24%), compared to IFA households (15%). Family and friends carers were more likely to provide care for shorter periods of time, accounting for 60% of newly approved LA households, but only 4% of LA households that had been caring for children for 10 years or more.
Figure 15: Length of time households have been caring for children, by sector

Download a zip file with the underlying data in csv format.
In the year ending 31 March 2020, the number of newly approved households was greater than the number of de-registered households. This led to a net increase in capacity of 1,040 households (1,355 places) overall. There were also the 1,815 households (2,390 places) that were both approved and de-registered during the year, the majority of which were family and friends or fostering to adopt households.
The overall increase, though, masked some changes between the sectors. In total, 8,465 fostering households de-registered during the year. A quarter (27%) of these de-registered from IFA services, while 73% had been with LA fostering services.
Of the 6,205 household de-registrations among LAs, the majority (60%, 3,730) were family and friends foster carers.
Around 13,700 foster carers de-registered over the period. IFAs had 3,820 (28%) carers de-register. LAs had 9,850 (72%) de-register, of which over half (5,710) were family and friends.
Recruitment and retention among IFA services has led to a net increase in capacity: 330 additional households and 560 additional places. In contrast, excluding family and friends and fostering to adopt households, the LA sector has seen a slight decrease in capacity of 230 households and 490 places.
Overall, there was net loss of 1,515 LA carers (4% of the total) and a net gain of 430 IFA carers.
Figure 16: Number of de-registered and approved places during 2019 to 2020, by sector

Download a zip file with the underlying data in csv format.
De-registrations and length of time being a foster carer
Excluding family and friends and fostering to adopt households, 29% of de-registered fostering households (1,300) de-registered within 2 years of their approval dates.
Family and friends foster carers were far more likely to de-register within 6 months of approval, compared to other fostering households. Almost half (46%) of the de-registered family and friends households de-registered within 6 months, compared to only 3% among other fostering households.
This means that there were high levels of approvals and de-registrations among family and friends fostering households in LA fostering services. These households accounted for 59% of new approvals and 60% of de-registrations. The chart below shows the tendency towards shorter terms of approval for de-registered family and friends households. This might be explained because these households are more likely to be intended for temporary arrangements and also more likely to lead to permanency options, such as adoption or special guardianship.
Figure 17: Family and friends de-registrations during 2019 to 2020, by length of approval

Download a zip file with the underlying data in csv format.
The length of service between approval and de-registration tended to be longer among LA fostering services than in IFAs. LA services reported that 23% of de-registrations were within 2 years since approval, while 28% had been with their services for more than 10 years. In contrast, a higher proportion of de-registrations were within 2 years among IFAs (35%), which was mostly offset by the lower proportion de-registered after 10 years (13%).
Figure 18: De-registration during 2019 to 2020, by length of approval and sector

This chart and table excludes family and friends and fostering to adopt de-registered households.
Download a zip file with the underlying data in csv format.
Recruitment
Enquiries
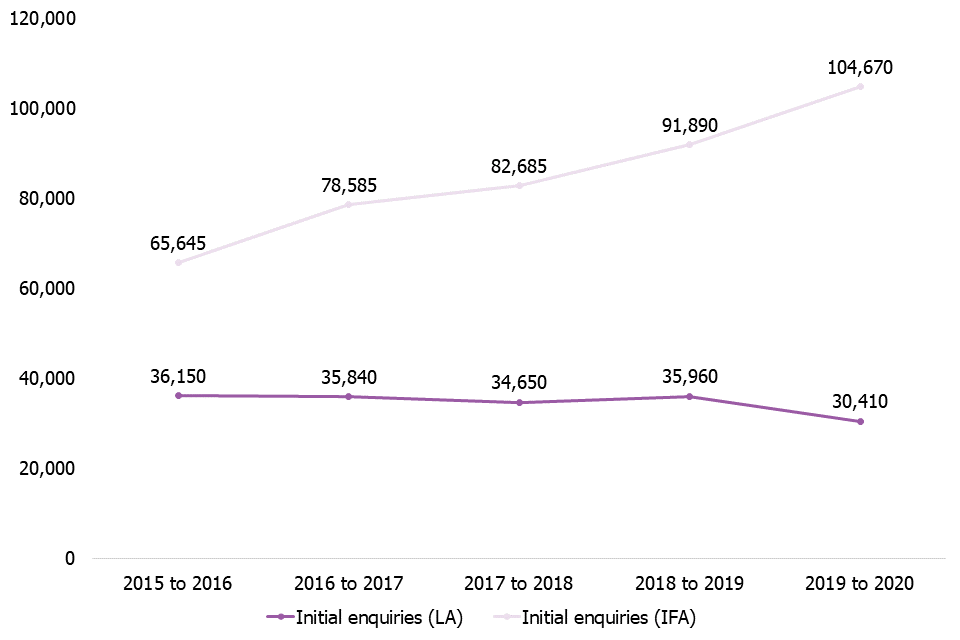
We estimate that there were around 137,200 initial enquiries from prospective fostering households in the year ending 31 March 2020. This was an increase of around 7% compared to 2018 to 2019. The reported figure of 135,075, from the data provided by 94% of all eligible agencies, was itself an increase on the previous year (127,850).
We estimate that around three quarters (76%) were within the IFA sector, up from 72% in 2018 to 2019. This results from a 14% increase in enquiries to the IFA sector, and a 10% decrease for LAs, compared with last year.
Figure 19: Enquiries since 1 April 2015, by sector
Download a zip file with the underlying data in csv format.
Applications and approvals
During 2019 to 2020, despite the increase in enquiries, there was a 10% decrease (8,805) in the number of applications received to become a foster carer compared with 2018 to 2019 (9,740).
Across the sectors, there is a distinct difference in conversion rates of initial enquiries to applications. IFAs reported receiving 20 initial enquiries per application received, while LAs reported less than 9 initial enquiries per application. This explains how IFAs reported over 4 times more initial enquiries than LAs, but only 47% extra applications.
Of the 8,805 applications received, 5,650 (64%) were completed in-year. The outcomes of those 5,650 completed applications were: 38% approved (2,135), 62% withdrawn (3,475) and 1% rejected (40). Of the 3,475 withdrawn applications, 72% (2,490) were withdrawn by the applicant, an increase from 66% in 2018 to 2019. The remaining 28% (985) were withdrawn by the service.
Figure 20: Applications received in 2019 to 2020, by status on 31 March 2020

This chart is not to scale.
Across the sectors, the conversion rate of applications received to applications approved was very similar. Around 1 in 4 applications were approved in both sectors. However, IFAs accounted for both more applications and approvals than LAs.
Figure 21: Applications and approvals since 1 April 2015, by sector

Download a zip file with the underlying data in csv format.
The proportion of completed applications that were approved, however, differs across the sectors.
Among LAs, 43% of completed applications were approved, while 35% were approved among IFAs. The difference is mostly accounted for by a higher proportion of withdrawals by applicants among IFAs (49% compared to 36% for LAs).
Figure 22: Outcomes of completed applications during 2019 to 2020, by sector

Download a zip file with the underlying data in csv format.
Fostering agencies
We collected data for 2019 to 2020 from 138 LA fostering agencies and 272 independent fostering agencies.
There were 224 private IFAs and 48 voluntary IFAs.
Agency size
The largest single agencies are LA ones: Leeds (810 households and 1,290 carers) and Kent (680 households and 1,230 carers). The largest IFA, and third largest agency in the country overall, is 1 of the 5 national fostering agencies (600 households and 985 carers).
The 5 national fostering agencies, if their resources are added together, would form an agency with more households (1,265) and foster carers (2,150) than the very largest LAs. Meanwhile, the 3 smallest, single agencies are IFAs with 1 household and 2 carers each.
The large majority of IFAs are small. On average, LA agencies had 330 carers and the median was 265 carers. On average, IFAs had 95 and the median was 60. Private IFAs are, on average, larger than voluntary IFAs.
Table 5: Agencies, by sector and number of carers, at 31 March 2020
| Agencies | 0–50 | 51–100 | 101–200 | 201–300 | 301–400 | 500–600 | 600+ | Total |
|---|---|---|---|---|---|---|---|---|
| LA | 0 | 5 | 40 | 35 | 20 | 20 | 15 | 140 |
| IFA | 120 | 70 | 55 | 10 | 5 | 10 | 0 | 270 |
| Total | 110 | 75 | 90 | 40 | 30 | 30 | 15 | 400 |
Numbers may not add up exactly due to rounding.
Independent agencies ownership
Although many IFAs are small, a number are nested within a larger company or organisation ownership. Some of these companies only own a few IFAs, but some own a considerably larger number.
Of the 272 IFAs that we have data for, 128 (or 47%) are owned by 21 larger companies or organisations. Seven of these larger organisations are voluntary non-profit and 14 are private companies.
Just over half (144 or 53%) of all IFAs were not owned by larger organisations or companies. These single IFAs account for 4,475 households and 7,555 carers in total, or around one third of non-LA run foster care.
The voluntary sector accounted for a small proportion of foster care. There were a total of 48 voluntary IFAs, with 1,695 households and 2,890 carers. This equated to around 4% of foster care capacity. The IFAs run by the 7 voluntary organisations make up over two thirds (71%) of all voluntary foster care. The Adolescent and Children’s Trust is the largest voluntary organisation with 370 households and 630 carers.
The private sector accounted for 135 IFAs, with 13,060 households and 22,965 carers. This equated to around 31% of all foster care capacity. The largest single IFA was 1 of the 21 agencies owned by Sscp Spring Topco Limited (The Outcomes First Group) and made up around 22% of that company’s nearly 4,400 carers.
In July 2020, we published management information regarding the largest private and voluntary providers of children’s social care in England, using data on the number of fostering places from 2019. We looked at companies (as listed on Companies House) that offered the most fostering placements through the IFAs they owned, with a capacity for more than 1,000 children.
As at 31 March 2020, of the 14,995 fostering households registered with IFAs, half (51%) were registered with IFAs owned by the 6 largest providers. The 7,650 households associated with these large providers accounted for 13,340 registered foster carers: 52% of all IFA carers and 19% of carers nationally. Similarly, the number of children placed within these households (10,035) made up 52% of all children placed in IFAs and 19% of all children placed in foster care nationally.
The households associated with the 6 largest providers were less likely to be newly approved (14%) than other households (20%) and were more likely to have been registered for 5 years or more: 47% compared to 36%.
Figure 23: Proportion of households by sector and proportion registered with agencies owned by the 6 largest providers of IFA places, as at 31 March 2020

Download a zip file with the underlying data in csv format.
Safeguarding
Restraint
During 2019 to 2020, there were 990 reported incidents of physical restraint.
As with previous years, the IFA sector reported most incidents of physical restraint (79% of all instances). Some of the differences between sectors may be affected by variations in reporting processes between IFAs and LAs.
Allegations of abuse
During 2019 to 2020, there were 2,495 allegations of abuse made against foster carers.
Just under two thirds of allegations of abuse in 2019 to 2020 (1,580 or 63%) were made by fostered children against their foster carers, which is a similar proportion as 2018 to 2019 (65%). The other third came from other sources.
In the same way as previous years, more allegations (56%) were made in the LA sector, which is to be expected because more children are placed with LAs (64% of filled places).
Physical abuse has continued to account for the largest number of allegations. In 2019 to 2020, 56% of all allegations were related to physical abuse, this percentage has remained very similar since 2014 to 2015.
Allegations of sexual abuse continue to be the least common, accounting for 8%. This is a slight increase from 2018 to 2019 (6%) but returns to the level seen in years before this.
Over half (58%) of all allegations resulted in an outcome of no further action, in line with the previous year. This outcome was more common for IFAs (67%) than for LAs (51%). A slightly lower proportion of allegations were subject to continued monitoring of foster carers (13%) than in previous years (17% in 2018 to 2019). A slightly higher proportion (28%) were referred on to the fostering panel for review compared with previous years (26% in 2018 to 2019). This outcome was more common for LAs (32%) than for IFAs (25%).
Figure 24: Outcomes of investigations into allegations of abuse in 2019 to 2020 split by sector

Download a zip file with the underlying data in csv format.
Half of all investigations into allegations were resolved in less than 21 days. A quarter of allegations took more than 50 working days to conclude. On average, allegations were concluded more quickly in IFAs than in LAs. Of all allegations in IFAs, 59% were resolved in less than 21 days, compared with 46% in LAs.
Revisions to previous release
This is the first release of this data for the period 1 April 2019 to 31 March 2020
The Fostering in England 1 April 2019 to 31 March 2020 page also includes:
- data tables
- methodology
- pre-release access list
Contacts
If you are a member of the public and have any comments or feedback on this publication, contact Adam King adam.king@ofsted.gov.uk or the social care team socialcaredata@ofsted.gov.uk.
Acknowledgements
Thanks to the following for their contribution to this statistical release: Klara Davies, Jenny Bird, Adam King and Kathryn Kaal.
If you have any comments or feedback on this publication, please contact Adam King on 03000 130020 or socialcaredata@ofsted.gov.uk
Glossary
Definitions of terms are within the statistical glossary.