How many people come to the UK each year (including visitors)?
Updated 22 August 2019

© Crown copyright 2019
This publication is licensed under the terms of the Open Government Licence v3.0 except where otherwise stated. To view this licence, visit nationalarchives.gov.uk/doc/open-government-licence/version/3 or write to the Information Policy Team, The National Archives, Kew, London TW9 4DU, or email: psi@nationalarchives.gov.uk.
Where we have identified any third party copyright information you will need to obtain permission from the copyright holders concerned.
This publication is available at https://www.gov.uk/government/statistics/immigration-statistics-year-ending-june-2019/how-many-people-come-to-the-uk-each-year-including-visitors
Back to ‘Immigration Statistics, year ending June 2019’ content page.
This is not the latest release. View latest release.
Data in this section relate to the year ending June 2019 and all comparisons are with the year ending June 2018, unless indicated otherwise.
This section contains data on:
- Passenger arrivals by people entering the UK
- Grants of Entry clearance visas to individuals outside the UK
- Visitors to the UK
Data on visitors were previously found in a separate section ‘Why do people come to the UK? To visit’.
1. Immigration to the UK
There were an estimated 144.7 million passenger arrivals in the year ending June 2019 (including returning UK residents), a 4% increase compared to the previous year and the highest number on record. The latest available data relating to year ending March 2019 show:
- British, other European Economic Area (EEA) and Swiss nationals increased by 7% to 124.4 million; around one-third of these were EEA and Swiss nationals
- Non-EEA nationals decreased by 7% to 19.6 million; data from 2018 (the latest available by nationality) suggest that around 30% of these were US nationals
Most non-EEA nationals do not require a visa to visit or transit the UK, although they do still require a visa to come for other reasons. Therefore, the number of arrivals will be much higher than the number of visas granted.
Figure 1: Passenger arrivals to the UK in 2018, by nationality group and reason for arrival

The chart shows the number of passenger arrivals to the UK in 2018 (in thousands).
Source:
Admission table ad 01 and ad_02
Chart notes:
‘ : ‘ = data not available due to data quality issues.
- The data show the number of occasions when a person entered the UK, not the number of distinct individuals.
- Data on reason for arrival for British, EEA and Swiss nationals are not collected.
Figure 2: Passenger arrivals to the UK, by nationality group
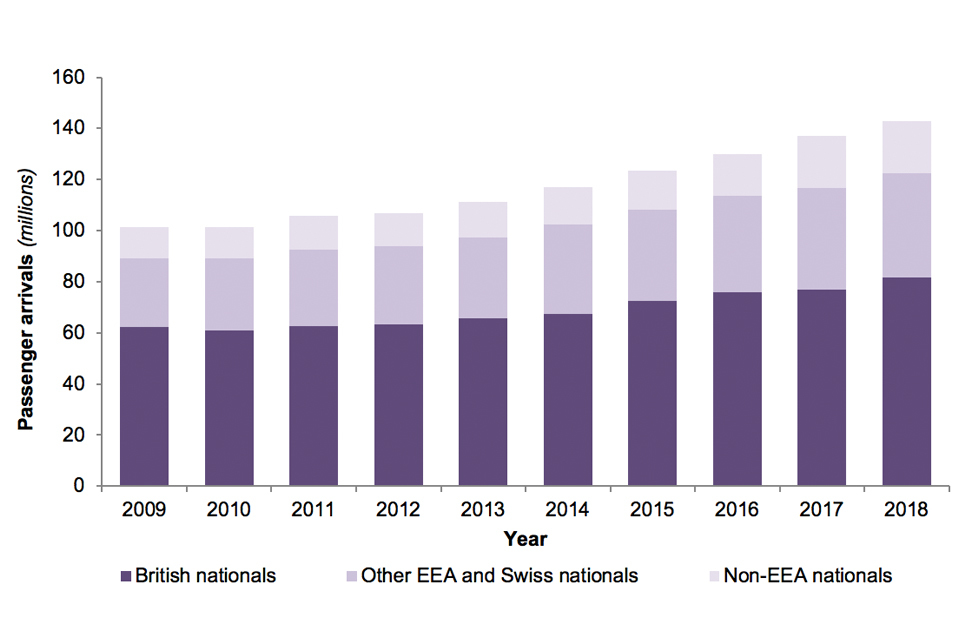
The chart shows the number of passenger arrivals to the UK, by nationality group over the last 10 years.
Source:
1.1 Non-EEA passenger arrivals
Data in this section relate to the period 2018. This is the latest period for which data on non-EEA nationals arriving in the UK, broken down by nationality, are available.
Of the 20.4 million non-EEA nationals granted leave to enter the UK in 2018, 36% (7.4 million) were nationals of North American countries and a quarter (5.2 million) were nationals of South and East Asian countries. The vast majority of arrivals relate to visitors (tourists), with the next largest category being people returning to the UK already being or having previously been resident.
The nationalities that were most commonly granted leave to enter the UK in 2018 were:
- US Citizens (6.06 million, up 6% compared with the previous year)
- Chinese (1.58 million, up 12%)
- Australian (1.47 million, down 1%)
- Indian (1.45 million, down 2%)
- Canadian (1.33 million, no change)
These top 5 nationalities accounted for 58% of all non-EEA nationals arriving into the UK in 2018.
Table 1: Non-EEA Passenger arrivals (thousands) by purpose of journey
| Purpose of journey | 2014 | 2015 | 2016 | 2017 | 2018 | Change (latest year) | % change |
|---|---|---|---|---|---|---|---|
| Work | 163 | 171 | 181 | 158 | 158 | -1 | -0% |
| Study (excl short term) | 193 | 185 | 180 | 188 | 199 | +11 | +6% |
| Short-term study2,3 | 280 | 306 | 251 | 229 | : | : | : |
| Family | 22 | 22 | 20 | 21 | 16 | -5 | -23% |
| Visitors3 | 9,160 | 9,440 | 10,100 | 13,400 | 13,900 | +473 | +4% |
| Persons in-transit | 1,200 | 1,190 | 743 | 932 | 845 | -87 | -9% |
| Passengers returning1 | 3,240 | 3,510 | 4,310 | 4,810 | 4,315 | -495 | -10% |
| Other | 398 | 462 | 478 | 469 | 587 | +117 | +25% |
| Total | 14,600 | 15,300 | 16,300 | 20,200 | 20,400 | +214 | +1% |
Source:
Table notes
‘ : ‘ = data not available due to data quality issues.
- Passengers returning are people who have previously arrived in the UK on a non-visit visa. They include those settled in the UK and who have been absent for less than two years, and those subject to a limited leave to enter who have returned within the time limit of that leave. Their initial arrival will have been counted in one of the specific arrival categories in the relevant time period.
- The Short-term study category (previously described as ‘Student visitor’) allows individuals to come to the UK for 6 months (or 11 months if they will be studying an English Language course) and cannot extend their stay (further details are available on GOV.UK and in the Study section).
- For both visitors and short-term study, non-visa nationals do not require a visa for visits of up to 6 months, so total figures for arrivals are not directly comparable with total visitor or student visitor visas.
1.2 Entry Clearance visas
Only certain nationalities are required to obtain an entry-clearance visa before coming to the UK. There were 3.0 million visas granted in the year ending June 2019, a 9% increase of 249,279 compared with the previous year, continuing the upward trend seen over the last decade. Of these, over three-quarters (77%) were to visit, 8% were to study (excluding short-term study), 6% were to work and 2% were for family reasons.
Figure 3: Total entry clearance visas granted
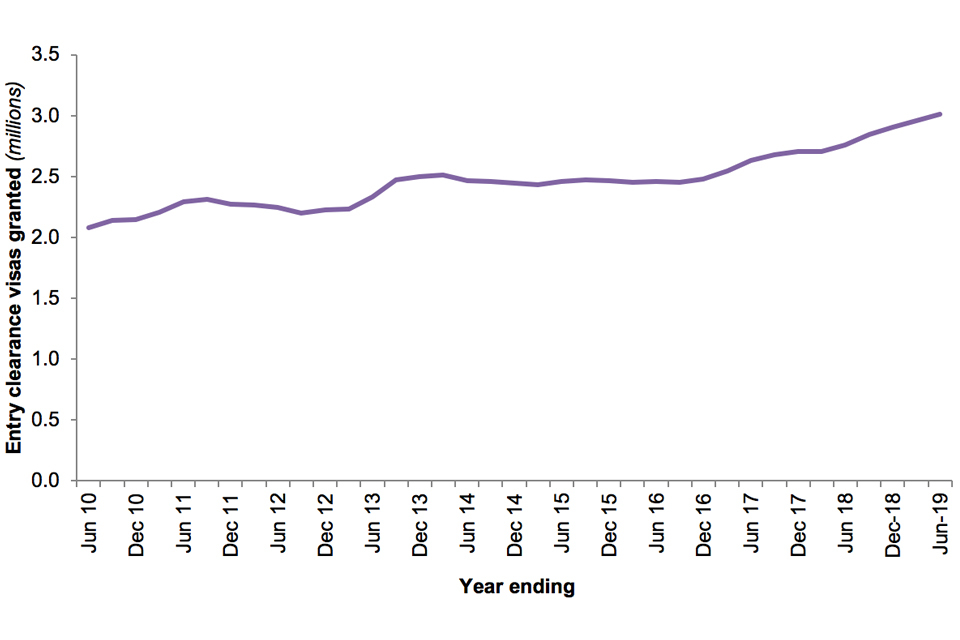
The chart shows the number of entry clearance visas granted over the last 10 years.
Source:
Table vi 01 q, (Entry clearance visas tables, volume 1)
Figure 4: Entry clearance visa applications and outcomes2,3, by visa type, year ending June 2019
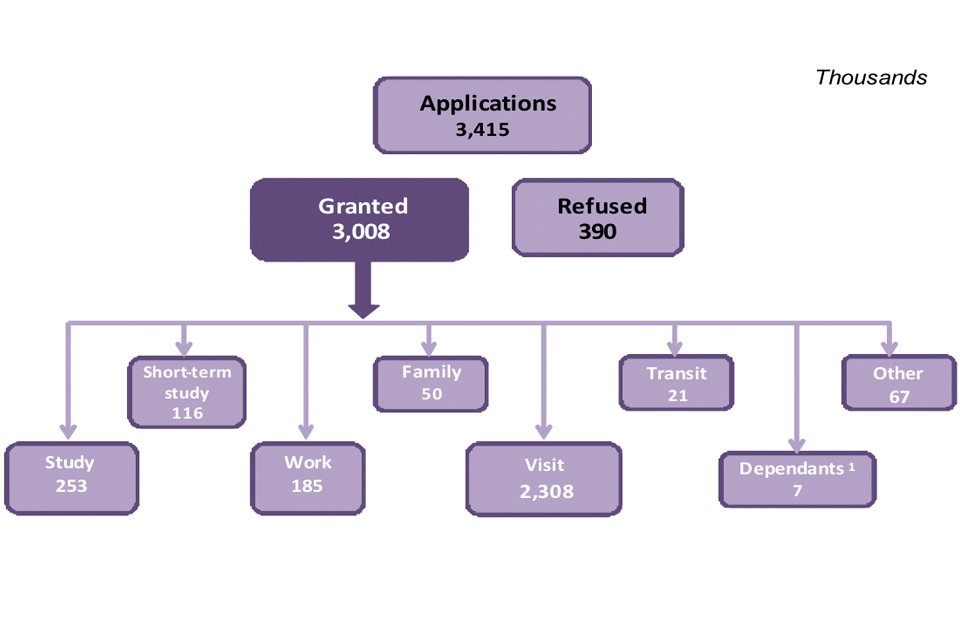
The chart shows the number of entry clearance visa applications and grants in year ending June 2019 (in thousands).
Sources:
Table vi 01 q, (Entry clearance visas tables, volume 1)
Table vi 06 q o, (Entry clearance visas tables, volume 3)
Chart notes:
- Dependants joining or accompanying family members.
- The volume of visas granted is lower than the non-EEA national arrivals, as some nationalities do not need a visa (for a visit of 6 months or less) to enter the UK. Individuals may also enter the country multiple times on one visa.
- Applications are based on date of application, whereas grants and refusals are based on date of decision. Therefore, data on applications and decisions are not directly comparable.
2. Visitors to the UK
Data in this section was previously included in the section ‘Why do people come to the UK? To visit’
In the year ending June 2019, there were 2.6 million applications for Visitor visas, an increase of 9% on the previous year.
Over the same period, there were 2.3 million Visitor visas granted (including dependants), an increase of 8% to the highest level on record, following a general upward trend over the last 10 years. In the latest year, there were notable increases in Visitor visas granted to:
- Chinese nationals, up 96,581 (18%) to 625,801
- Indian nationals, up 48,907 (11%) to 503,599
- Nigerian nationals, up 10,645 (17%) to 74,359
Chinese and Indian nationals together accounted for just under half (49%) of all Visitor visas granted.
In 2018 (latest available arrivals data by purpose of journey), the number of non-EEA visitor arrivals increased by 4% to 13.9 million. Data for 2018 show US nationals accounted for 33% of all non-EEA visitor arrivals compared to 29% in 2017 and 26% in 2016. Many nationalities, including US nationals, do not normally require a visa to visit the UK; consequently, the number of Visitor visas granted is much lower than the total number of visitor arrivals.
Additional information on visitors to the UK are published by the Office for National Statistics in their quarterly Tourism statistics.
Figure 5: Visitor passenger arrivals and Visitor visas granted1
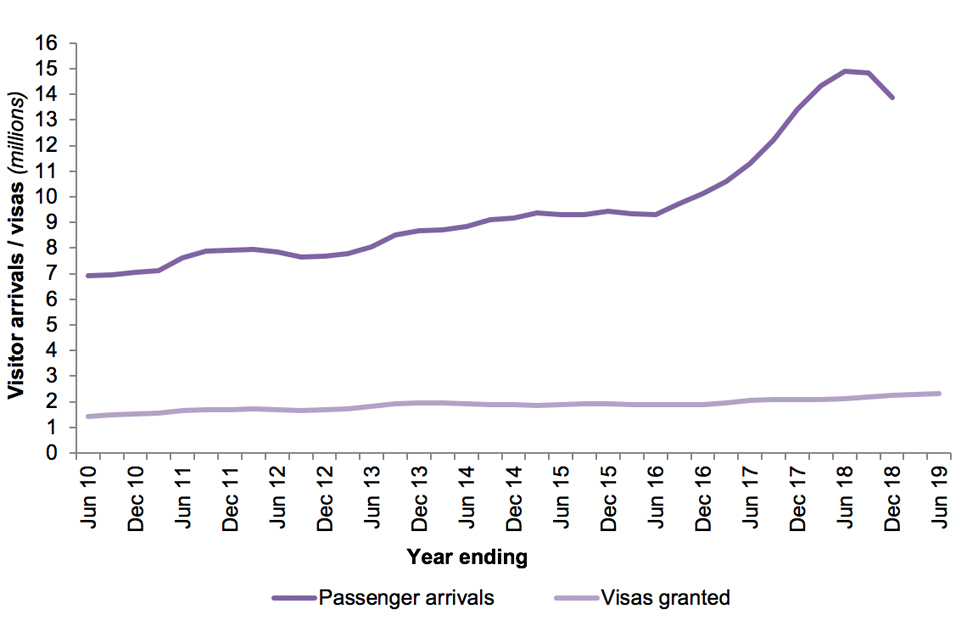
The chart shows Visitor passenger arrivals and Visitor visas granted over the last 10 years.
Sources:
Entry clearance visas table vi 01 q (volume 1) and Admission table ad 02 q
Chart note:
- Data on passenger arrivals relate to the end of 2018, whereas data on visas cover up to the year ending June 2019.
3. About these statistics
The statistics in this section provide an indication of the number of people who enter the UK.
The data do not show whether, or when, an individual arrived in the UK, what they did on arrival to the UK, or how long they stayed in the UK.
Many non-EEA nationals do not normally require a visa to visit the UK. As a result, they will be counted in the passenger arrivals data, but not in the visa data. A list of designated nationalities referred to as ‘visa nationals’ who do require a visa in order to visit the UK can be found in Immigration Rules Appendix V: visitor rules.
EEA and Swiss nationals do not require a visa to come to the UK for any reason.
Data on passenger arrivals are not directly comparable with data on Entry clearance visas granted for several reasons. A summary of what each dataset counts is provided below.
3.1 Passenger arrivals
Data on passenger arrivals relate to the number of arrivals into the UK. The data include British, EEA and Swiss nationals, as well as non-EEA nationals. For non-EEA nationals who are subject to immigration controls, more detailed information is available on their nationality and purpose of their journey.
Passenger arrivals are counted each time an individual enters the UK. Where an individual enters the UK more than once in a period, they will be counted each time they enter (but if they arrive each time on the same visa, they will be counted once in the visas data).
Visitor arrivals data are currently based on landing cards completed as people cross the border. In light of the introduction of new digital systems at the border, the use of landing cards is currently being reviewed. See the Home Office’s Response to media reporting on landing cards for more information.
3.2 Entry clearance visas
Data on Entry clearance visas in this section refer to the number of visas granted for all reasons within the period. If an individual was granted a visa more than once in a given period, this has been counted as multiple grants in the statistics. If an individual entered the UK multiple times within the period for which a visa was valid, this has been counted as one grant in the visa statistics (but multiple arrivals in the passenger arrivals data).
Year-on-year comparisons of the number of decisions can be affected by quarterly fluctuations in the data. Such fluctuations can be examined in more detail in the quarterly data that are available in the published tables.
Several known factors may have affected the number of applications and outcomes of visit-related visas over time. For example, the Home Office launched a two-year Chinese visa pilot in January 2016 for Chinese nationals. The increase in longer-term Visitor visas may affect the number of subsequent re-applications by Chinese nationals.
More information on non-visitor arrival and visa data by category is included in ʻWhy do people come to the UK? To work’, ʻWhy do people come to the UK? To study’ and ʻWhy do people come to the UK? For family reasons’.
3.3 Landing cards
On 5 August 2017, the Home Office launched a consultation on a proposal to end the requirement for non-EEA passengers to present a paper landing card on arrival into the UK from 1 October 2017. The consultation set out the statistical implications of the change and how to respond to the consultation, which closed on 2 September 2017. The Government confirmed in the Spring Statement that to coincide with the ePassport gates expansion, the government will begin to abolish landing cards for non-EEA travellers, and on Monday 20 May 2019, it removed the need for all non-EEA travellers to fill in landing cards upon arrival in the UK and expanded the use of ePassport gates to 7 more countries. The government’s response to the consultation was published in May 2019. As anticipated in the original consultation, the withdrawal of landing cards has resulted in a temporary loss to some data, ahead of new data sources being developed.
4. Data tables
Data on arrivals are available in:
Data on Entry clearance visas and sponsored visa applications for the Work, Study and Family routes (described further in the Work topic, Study topic and Family topic) can be found in the following tables:
- Entry clearance visas tables (volume 1)
- Entry clearance visas tables (volume 2)
- Entry clearance visas tables (volume 3)
- Sponsorship tables
We welcome your feedback
If you have any comments or suggestions for the development of this report, please provide feedback by emailing MigrationStatsEnquiries@homeoffice.gov.uk. Please include the words ‘PUBLICATION FEEDBACK’ in the subject of your email.
See section 7 of the ‘About this release’ section for more details.