Summary of latest statistics
Updated 21 March 2018

© Crown copyright 2018
This publication is licensed under the terms of the Open Government Licence v3.0 except where otherwise stated. To view this licence, visit nationalarchives.gov.uk/doc/open-government-licence/version/3 or write to the Information Policy Team, The National Archives, Kew, London TW9 4DU, or email: psi@nationalarchives.gov.uk.
Where we have identified any third party copyright information you will need to obtain permission from the copyright holders concerned.
This publication is available at https://www.gov.uk/government/statistics/immigration-statistics-october-to-december-2017/summary-of-latest-statistics
Back to ‘Immigration statistics October to December 2017’ content page.
This is not the latest release. View latest release.
1. How many people come to the UK each year?
There were 135.2 million passenger arrivals in 2017, including returning UK residents, an increase of 5.3 million compared to the previous year: a record number. This increase was divided between:
- 2.4 million more arrivals by British, other EEA and Swiss nationals (up 2% to 116.0 million)
- 2.9 million more non-EEA nationals (up 18% to 19.2 million)
There were over 2.7 million visas granted in 2017. Of these, nearly 2.1 million (77%) were to visit and 8% were for study.
1.1 Entry clearance visa applications and outcomes, by visa type, 2017
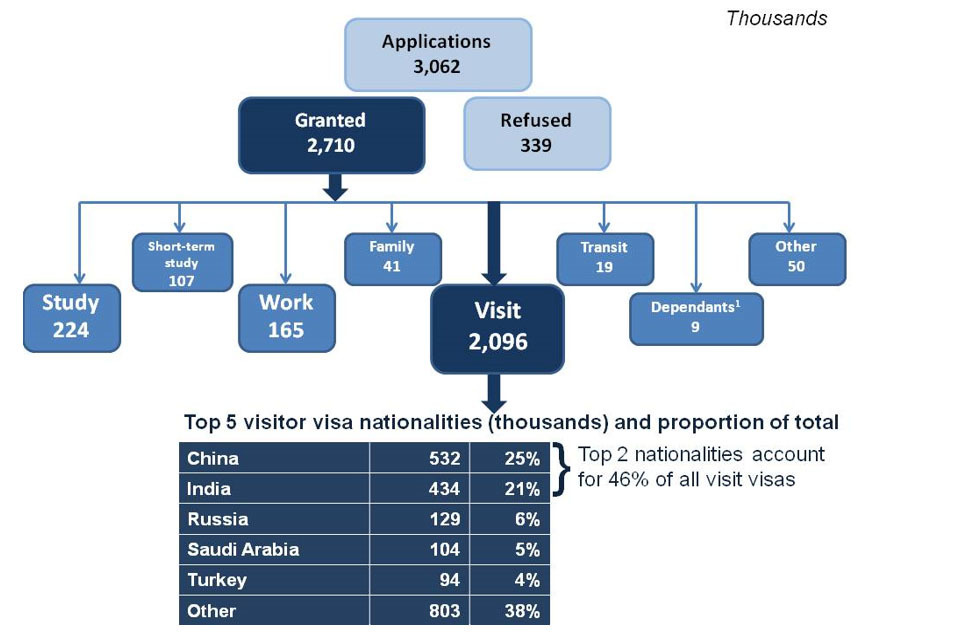
The chart shows the number and type of visas granted for the latest year available. The data are available in Visas tables vi 01 q and vi 06 q o.
Sources:
Table vi 01 q (Entry clearance visas tables, volume 1).
Table vi 06 q o (Entry clearance visas tables, volume 3).
2. Why do people come to the UK?
2.1 Visit
In the year ending 30 June 2017, the number of non-EEA visitor arrivals increased by 2.0 million (21%) to 11.3 million compared to the previous year.
Many nationalities, including United States (US) nationals, do not normally require a visa to visit the UK. Consequently the number of Visitor visas granted is much lower than the total number of arrivals.
Over 2.7 million visas were granted in 2017, of these, 2.1 million (77%) were to visit.
There were 193,609 (10%) more Visitor visas granted in 2017. Of these, there were notable increases in Visitor visas granted to:
- Chinese nationals, up 53,837 (11%) to 531,967 (excluding Hong Kong)
- Indian nationals, up 43,816 (11%) to 433,852
- Russian nationals, up 30,828 (31%) to 129,467
Chinese and Indian nationals alone accounted for just under half (46%) of all Visitor visas granted.
For further details see ʻWhy do people come to the UK? (1) To visit’ and the data tables.
2.2 Work
There were 165,131 Work-related visas granted in 2017, an increase of 1% on the previous year. These included:
- 5,127 high-value (Tier 1) visas, up 13%
- 94,247 Skilled (Tier 2) visas, up 1%
- 40,864 youth mobility and temporary workers (Tier 5), down 3%
- 24,893 non-points-based system (PBS) / other Work visas, up 3%
There were 99,999 sponsored visa applications for work in 2017. Of these, 54,658 were Tier 2 Skilled applications (non-EEA main applicants, Certificates of Sponsorship (CoS) used), 2% less than the previous year (56,058). This included a 24% increase (1,264 more visas) in the Human health and social work activities sector, which is largely likely to reflect the addition of nurses to the government’s shortage occupation list in November 2015. The largest fall was in applications for the Information and communication sector (down 1,584 or 7%).
In the year ending 30 September 2017, ONS estimates there were 76,000 non-European Union (EU) long-term immigrants coming to the UK for work, an 8,000 increase compared with the previous year (the difference was not statistically significant).
For further details see ʻWhy do people come to the UK? (2) To work’ and the data tables.
2.3 Study
In 2017, there were 223,536 Study-related visas granted, excluding Short-term students (formerly known as Student visitors), an increase of 8% (16,435).
Over the same period, the number of University-sponsored study visa applications rose 6% to 177,775. This included a 9% increase for Russell Group universities to 87,236.
Three nationalities (China, US and India) accounted for over half (53%) of the 223,536 Study-related visas granted in 2017, with the largest number going to Chinese nationals (88,456 or 40% of the total).
There were notable increases in the number of Study-related visas granted to:
- Chinese nationals (up 15% to 88,456)
- Indian nationals (up 28% to 14,445)
In the year ending 30 September 2017, ONS estimates that there were 113,000 non-EU long-term immigrants coming to study and who had an intention to remain a year or more, a 30% rise (26,000), which is statistically significant but subject to a ±20,000 confidence interval. The comparable number of Study visas issued over the same period rose by 8% to 153,033.
2.4 Study-related sponsored visa applications, by sector1,2, 2010 to 2017
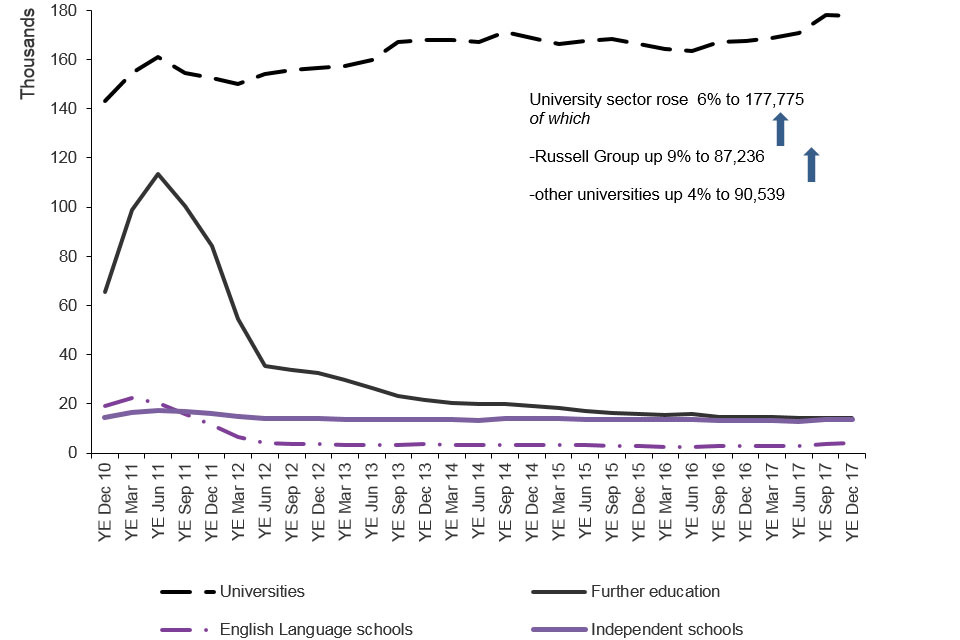
The chart shows the trends in confirmations of acceptance of studies used in applications for visas by the education sector since 2010 to the latest data available. The chart is based on data in Table cs 09 q.
Source:
Table cs 09 q (Sponsorship tables).
Chart notes:
- ‘Universities’ relate to UK-based higher education institutions.
- ‘Further education’ relates to tertiary, further education or other colleges.
For further details see ʻWhy do people come to the UK? (3) To study’ and the data tables.
2.5 Family
The combined total number of Family-related visas granted, including EEA Family permits granted to non-EEA nationals, and visas granted to dependants of other visa holders (excluding visitors) was 134,857, a similar level to the previous year (134,694).
In the year ending 30 September 2017, ONS estimates that 48,000 non-EU nationals immigrated long term to the UK to accompany or join others, with the intention of staying for a year or more. This was not a statistically significant change on the previous year (45,000). These estimates for those arriving to accompany or join others are not directly comparable with visa statistics.
For further details see ʻWhy do people come to the UK? (4) For family reasons’ and the data tables.
3. How many people do we grant asylum or protection to?
In 2017, there were 14,767 grants of asylum, alternative forms of protection and resettlement, compared with 15,156 in the previous year. This comprised:
- 7,469 grants of asylum to main applicants and dependants (down 11%)
- 1,086 grants of alternative form of protection to main applicants and their dependants (down 29%)
- 6,212 people provided with protection under a resettlement scheme (up 19%)
Of the 14,767 people granted asylum, protection or resettlement, 5,866 were children (under 18 years old).
Additionally, 5,218 Family reunion visas were issued to partners and children of those granted asylum or humanitarian protection in the UK, a 14% decrease compared to the previous year. Of these, 2,677 were issued to children.
The number of asylum applications in the UK from main applicants decreased by 14% to 26,350 in 2017. The number of asylum applications in the UK has been lower for two consecutive years, following a steady increase in the number of applications that coincided with the start of the Syrian civil war in 2011.
There were 845 grants of asylum, or alternative forms of protection to Syrian nationals (including dependants), at initial decision in 2017.
A total of 6,212 people were resettled in the UK in 2017 under various schemes. This included 4,832 Syrian nationals provided protection under the Vulnerable Persons Resettlement Scheme (VPRS), making a total of 10,538 Syrians resettled since the scheme began in 2014.
For further details see ʻHow many people do we grant asylum or protection to?’ and the data tables.
4. How many people continue their stay in the UK?
There were 234,419 decisions on applications to change or extend an existing visa in 2017, 2% more than in the previous year. Of these:
- 91% were grants (214,140)
- 9% (20,279) were refusals
There were 63,941 people granted permission to stay permanently in the UK in 2017, 5% more than in the previous year. The number of grants is low relative to the peak in the year ending September 2010 (241,586).
In 2017, 168,913 documents certifying permanent residence and permanent residence cards were issued to EEA nationals and non-EEA family members. This is the highest recorded annual figure and more than twice the figure for the previous year (65,068).
Total applications for British citizenship rose by 8% (to 141,302) in 2017 compared to the previous year. This was 39% lower than the peak in 2013 (232,262). Applications made by non-EU nationals fell by 12,756 to 102,774, and applications by EU nationals more than doubled from 15,460 to 38,528.
For further details see ʻHow many people continue their stay in the UK?’ and the data tables.
5. How many people are detained or returned?
In 2017, 27,331 individuals entered the detention estate (down 5% compared with the previous year), and 28,244 left the detention estate (down 2%).
As the end of December 2017, there were 2,138 persons held in the detentions estate (excluding HM Prisons), this was a fall of 22% compared with the same time the previous year. Additionally, 407 individuals were held in HM Prisons.
The number of EU nationals who were returned, or voluntarily departed the UK on leaving detention, was 4,612 in 2017, compared with 4,048 in the previous year.
The total number of enforced returns from the UK, including those not directly from detention, decreased by 1% to 12,321 in 2017 compared with 12,469 in the previous year.
Provisional data show that 5,835 Foreign National Offenders (FNOs) were returned in 2017 compared to 6,171 in the previous year, down 5%, of these:
- 67% were EU nationals (3,881)
- 33% were non-EU nationals (1,954)
For further details see ʻHow many people are detained or returned’ and the data tables.