Why do people come to the UK? (2) To work
Updated 21 March 2018

© Crown copyright 2018
This publication is licensed under the terms of the Open Government Licence v3.0 except where otherwise stated. To view this licence, visit nationalarchives.gov.uk/doc/open-government-licence/version/3 or write to the Information Policy Team, The National Archives, Kew, London TW9 4DU, or email: psi@nationalarchives.gov.uk.
Where we have identified any third party copyright information you will need to obtain permission from the copyright holders concerned.
This publication is available at https://www.gov.uk/government/statistics/immigration-statistics-october-to-december-2017/why-do-people-come-to-the-uk-2-to-work
Back to ‘Immigration statistics October to December 2017’ content page.
This is not the latest release. View latest release.
Data relate to 2017 and all comparisons are with 2016, unless indicated otherwise.
This section contains data on:
- Work-related visas granted to non-EEA nationals
- ONS estimates of non-EU long-term immigration to work
We provide a more detailed commentary on an annual basis. This is included in ‘Immigration Statistics, April to June 2017’.
1. Key facts
There were 165,131 Work-related visas granted in 2017, an increase of 1% on the previous year. This included:
- 5,127 high-value (Tier 1) visas, up 13%
- 94,247 Skilled (Tier 2) visas, up 1%
- 40,864 youth mobility and temporary workers (Tier 5), down 3%
- 24,893 non-points-based system (PBS) / other Work visas, up 3%
There were 99,999 Work-sponsored visa applications in 2017. Of these, 54,658 were for Tier 2 Skilled applications (non-EEA main applicants, Certificates of Sponsorship (CoS) used, 2% fewer than the previous year (56,058). This included a 24% increase (1,264 more visas) in the Human health and social work activities sector, which is largely likely to reflect the addition of nurses to the government’s shortage occupation list in November 2015. The largest fall was in applications for the Information and communication sector (down 1,584 or 7%).
In the year ending 30 September 2017, ONS estimates there were 76,000 non-EU long-term immigrants for work, an 8,000 increase compared with the previous year (the difference was not statistically significant).
Additionally, according to estimates from Labour Force Survey, UK and non-UK people in the labour market: February 2018, the number of people employed in the UK increased in the last quarter of 2017 by 328,000 as compared to the last quarter of 2016, reaching 32.23 million, this being the highest since the series began in 1981. 90% of the increase was accounted for by UK nationals with an increase of 294,000 to 28.70 million, also the highest since the series began in 1981. There were 2.35 million EU nationals in employment in the UK (up 101,000) and 1.17 million non-EU nationals (down 68,000).
2. Work immigration
2.1 Trends in Work-related visa granted, by visa type, 2016 to 2017
| 2016 | 2017 | Change | Percentage change | |
|---|---|---|---|---|
| Work-related visas granted | 163,922 | 165,131 | +1,209 | +1% |
| of which: | ||||
| High-value (Tier 1) visas | 4,536 | 5,127 | +591 | +13% |
| Skilled (Tier 2) visas | 93,306 | 94,247 | +941 | +1% |
| Youth mobility and temporary workers (Tier 5) visas | 41,999 | 40,864 | -1,135 | -3% |
| Non-PBS / other Work visas | 24,081 | 24,893 | +812 | +3% |
| Year ending 30 September 2016 | Year ending 30 September 2017 | Change | Percentage change | |
| Long-term immigration for work (ONS estimates)1 excluding dependants | 68,000 | 76,000 | +8,0002 | +12% |
| Long-term (1 year or more) Work-related visas excluding dependants | 75,687 | 75,644 | -43 | 0% |
2.2 Sources:
Table vi 04 q (Entry clearance visas tables, volume 1).
ʻMigration Statistics Quarterly Report’, ONS.
2.3 Table notes:
- Long-term immigration for work data are estimates of the number of non-EU nationals intending to change their residence to the UK for at least 12 months based on the International Passenger Survey (IPS).
- The increase of 8,000 in non-EU work-related immigration for the year ending 30 September 2017 had an estimated confidence interval of ±16,000.
3. Long-term trends in work-related immigration
There was a long-term reduction in Work-related visas granted and non-EU immigration from 2006 to 2012. Since 2013, the number of Work-related visas granted has gradually increased, with some fluctuations.
The chart below shows that ONS estimates of non-EU immigration to work are lower than the number of long-term Work-related visas granted, as they include only those migrants who state they intend to remain in the UK for a year or more. However, the two series show broadly similar trends over recent years.
3.1 Work-related visas granted and long-term immigration to work, 2005 to 20171
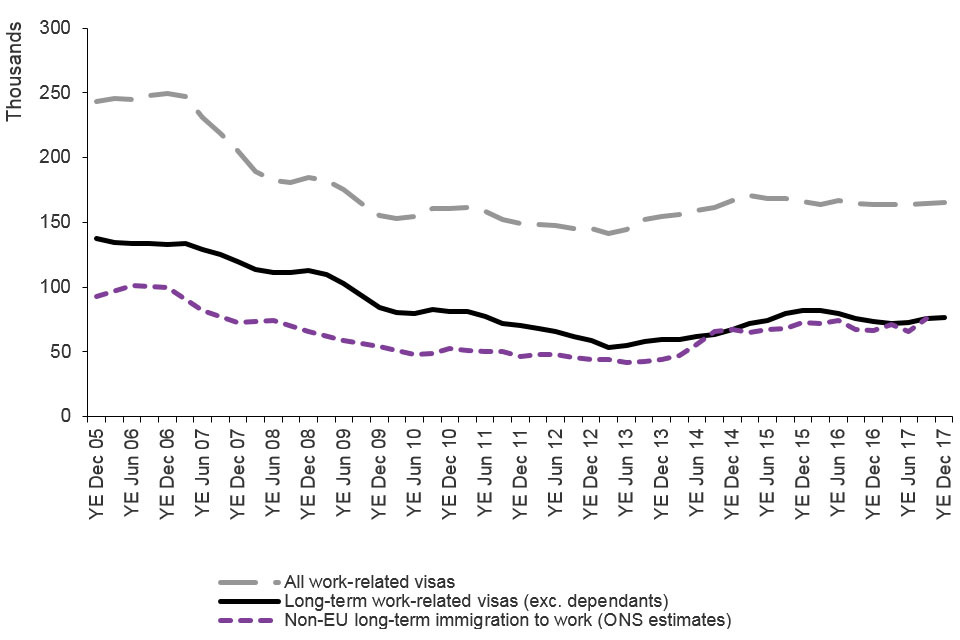
The chart shows the trends for Work visas granted and IPS estimates of non-EU immigration between 2005 and the latest data published. The data are sourced from Visas table vi _04_ q and corresponding datasets.
3.2 Sources:
Table vi 04 q (Entry clearance visas tables, volume 1), and corresponding datasets ʻMigration Statistics Quarterly Report’, ONS
3.3 Chart note:
- ‘All work-related visas’ include long-term Work-related visas, dependants of those granted work-related visas, and short-term Work-related visas (those issued for less than a year).
There are a number of reasons why ONS estimates differ from Home Office visas figures, details of which can be found in the user guide.
4. Skilled work
In 2017, 97% of the 96,718 decisions made on entry clearance visa applications for Skilled work were grants (94,247). The number of grants was 1% higher than the previous year.
The nationalities that were granted the largest number of Skilled work visas in 2017 were:
- Indian, accounting for 56% of all grants (down 2%)
- American, accounting for 10% of all grants (up 1%)
- Japanese, accounting for 4% of all grants (down 3%)
4.1 Sponsored visa applications, by nationality and industry sector
The number of sponsored visa applications for Skilled work decreased by 2% to 54,658 (main applicants, CoS used). This includes:
- a 24% increase (1,264 more visas) in the Human health and social work activities sector, which is largely likely to reflect the addition of nurses to the government’s shortage occupation list in November 2015
- a 7% fall in the Information and communication sector, (down 1,584).
- a 14% decrease in the Professional, scientific and technical activities sector (down 1,430).
There were 21,782 applications from the Information and communication sector in 2017, and this sector alone accounted for 40% of all Skilled work-sponsored visa applications.
Sponsored visa applications1, by industry sector, 2017
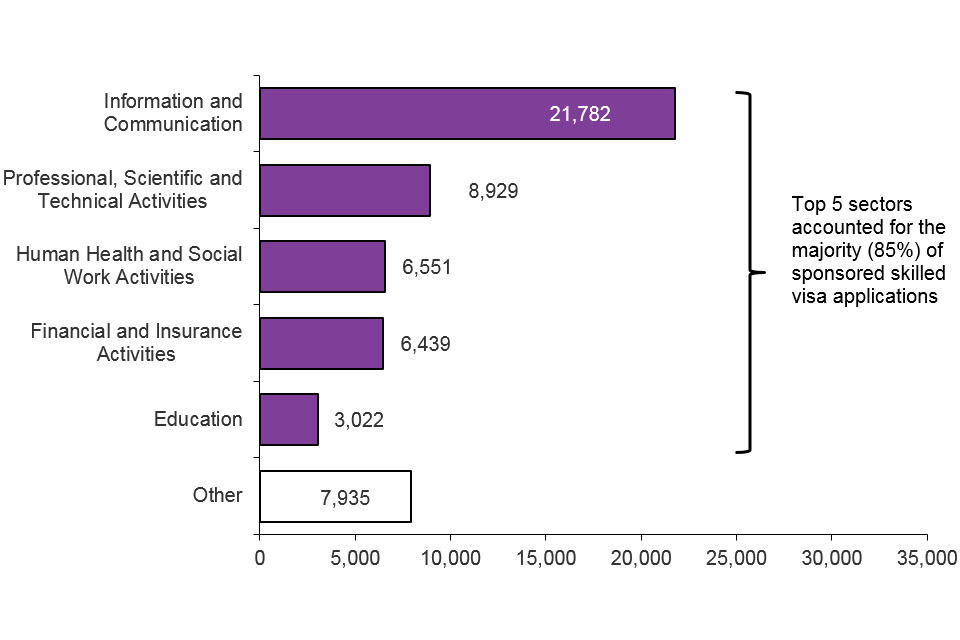
The chart shows the sponsored visa applications by industry sector for 2017. The data are sourced from the Sponsorship tables. The top 5 sectors accounted for the large majority (85%) of sponsored Skilled work visa applications.
Source:
Table cs 03 q (Sponsorship tables)
Chart note:
- Main applicants only.
UK Visas and Immigration produce monthly reports on allocations of restricted certificates of sponsorship under the permanent limit on migration through Tier 2 (General).
5. Data tables
Data on immigration for work, sourced from Home Office administrative systems, can be found in the following tables:
Sponsorship tables
Visas tables volume 1
Visas tables volume 2
Visas tables volume 3
Admissions tables
Extensions tables
Settlement tables
European Economic Area (EEA) tables