How many people continue their stay in the UK?
Updated 21 March 2018

© Crown copyright 2018
This publication is licensed under the terms of the Open Government Licence v3.0 except where otherwise stated. To view this licence, visit nationalarchives.gov.uk/doc/open-government-licence/version/3 or write to the Information Policy Team, The National Archives, Kew, London TW9 4DU, or email: psi@nationalarchives.gov.uk.
Where we have identified any third party copyright information you will need to obtain permission from the copyright holders concerned.
This publication is available at https://www.gov.uk/government/statistics/immigration-statistics-october-to-december-2017/how-many-people-continue-their-stay-in-the-uk
Back to ‘Immigration Statistics, October to December 2017’ content page.
This is not the latest release. View latest release.
Data relate to 2017 and all comparisons are with 2016, unless indicated otherwise.
This section contains data on:
- extensions of temporary stay in the UK
- staying permanently (settlement)
- British citizenship
- residence documentation issued to EEA nationals and their family members
We provide a more detailed commentary on an annual basis. This is included in ‘Immigration Statistics, April to June 2017’.
1. Key facts
There were 234,419 decisions on applications to change or extend an existing visa in 2017, 2% more than the previous year. Of these:
- 91% were grants (214,140)
- 9% were refusals (20,279)
There were 63,941 people granted permission to stay permanently in the UK in 2017, 5% more than in the previous year. The number of grants is low relative to the peak in the year ending 30 September 2010 (241,586).
In 2017, 168,913 documents certifying permanent residence and permanent residence cards were issued to EEA nationals and non-EEA family members. This is the highest recorded annual figure and more than twice the figure for the previous year (65,068) but little changed on the figure for the year ending 30 September 2017 (168,198) reflecting quarter-on-quarter falls in decisions from a peak of 51,695 in the first quarter of 2017 to 33,152 in the last quarter.
Total applications for British citizenship rose by 8% (to 141,302) in 2017 compared to the previous year. This was 39% lower than the peak in 2013 (232,262). Applications made by non-EU nationals fell by 12,756 to 102,774, and applications by EU nationals more than doubled from 15,460 to 38,528.
2. Extension grants
Extensions of stay relate to individuals inside the UK extending or changing the status of their stay in the UK. An individual is required to apply for an extension or change in status before their existing permission to enter or stay expires.
There were 234,419 decisions on applications to change or extend an existing visa in 2017, 2% more than the previous year. Of these:
- 91% were grants (214,140)
- 9% were refusals (20,279)
In 2016, 152,044 main applicants were granted an extension to their stay. Of these, 80% (121,026 individuals) stayed within their original broad category (e.g. students continuing to study), while the other 20% switched categories (e.g. 6,037 students who were subsequently employed in the UK).
Additional detailed analyses on extension grants in 2016 by previous category of leave were included in the Immigration Statistics January to March 2017 release ‘How many people continue their stay in the UK?’ topic. Data for grants by previous category in 2017 are planned to be published in ‘Immigration Statistics January to March 2018’, due to be released on 24 May 2018.
3. Settlement grants and refusals
Settlement relates to people, subject to immigration control, given permission to stay permanently in the UK. The settlement figures comprise people granted settlement on arrival and people who have applied for settlement having completed qualifying periods of residence in the UK in a category leading to settlement. The number of years an individual must have been in the UK before they can apply for settlement varies depending on the type of visa currently held; for example, currently 5 years for workers in certain routes. Those granted settlement are able, without restriction, to work or study, travel into and out of the UK, access state benefits, and register their UK-born child as a British citizen. It does not entitle the person to a British passport (which requires British citizenship) or to vote in general elections, which requires Commonwealth or Irish Republic citizenship.
There were 63,941 people granted permission to stay permanently in the UK in 2017, 5% more than in the previous year.
- there was a fall of 5,229 Work-related grants, mainly accounted for by a fall in grants to Tier 1 High-value individuals (by 6,899 to 3,758)
- Family-related grants to stay permanently fell by 24% to 5,265 in 2017; recent decreases are likely, in part, to reflect changes to the family Immigration Rules in July 2012; for details see the Family section of the user guide
- Asylum-related grants rose by 3,268 (23%) to 17,722
- grants to stay permanently for ‘Other’ reasons rose by 43% to 22,843 but remain significantly lower than in 2010 (82,686)
3.1 Decisions, grants and refusals of applications to stay permanently in the UK, by reason for grant
| Total decisions1 | Total grants | Work | Asylum | Family | Other2 | Refusals | |
|---|---|---|---|---|---|---|---|
| 2013 | 161,375 | 154,701 | 59,288 | 21,274 | 59,654 | 14,485 | 6,674 |
| 2014 | 109,072 | 104,057 | 38,712 | 17,801 | 32,846 | 14,698 | 5,015 |
| 2015 | 95,922 | 90,839 | 39,791 | 18,895 | 16,808 | 15,345 | 5,083 |
| 2016 | 66,024 | 60,670 | 23,340 | 14,454 | 6,927 | 15,949 | 5,354 |
| 2017 | 67,806 | 63,941 | 18,111 | 17,722 | 5,265 | 22,843 | 3,865 |
| Change: latest 12 months | +1,782 | +3,271 | -5,229 | +3,268 | -1,662 | +6,894 | -1,489 |
| Percentage change | +3% | +5% | -22% | +23% | -24% | +43% | -28% |
3.2 Source:
Table se 02 q (Settlement tables).
3.3 Table notes:
- The number of decisions in a given year can be affected by changes in casework resource allocation. Such fluctuations can be examined in more detail in the quarterly data that are available in the published Settlement tables.
- Includes grants on the basis of Long Residence and grants on a discretionary basis.
4. EEA nationals and their family members
Under European law, EEA nationals do not need to obtain documentation confirming their right of residence in the UK.
EEA nationals and their family members can apply for documents certifying permanent residence and permanent residence cards as confirmation of a right of permanent residence in the UK. There is no need to apply for a residence card as a family member but it can:
- help residence card holders to re-enter the country more quickly and easily if travelling abroad
- show employers that residence card holders are allowed to work in the UK
- help prove residence card holders qualify for certain benefits and services
EEA nationals only need to apply for a permanent residence document if they want to either:
- apply for British citizenship
- sponsor their partner’s visa application under the Immigration Rules
More information about applying for residence documentation is available at EU, EEA and Commonwealth, GOV.UK.
After 12 November 2015, a person applying for citizenship who is claiming to have permanent residence as an EEA national or the family member of an EEA national has been required to provide a permanent residence card or a document certifying permanent residence as evidence that they meet the requirement to be free of immigration time restrictions. These rule changes, along with EEA nationals’ response to perceived uncertainty follow the 2016 EU referendum, are likely to have contributed to the steep increase in demand for EEA residence documentation during 2016 and 2017.
In 2017, there were 122,248 registration certificates and registration cards issued, 64% more than the previous year (74,342). Most of the rise is attributed to EU nationals rather than non-EEA family members.
Also in 2017, 168,913 documents certifying permanent residence and permanent residence cards were issued. The majority of these (89%) were issued to EU nationals. This is the highest recorded annual figure and more than twice the figure for 2016 (65,068) but little changed on the figure for the year ending 30 September 2017 (168,198) reflecting quarter-on-quarter falls in decisions from a peak of 51,695 in the first quarter of 2017 to 33,152 in the last quarter.
4.1 Documents issued certifying permanent residence and permanent residence cards for EEA nationals and their family members, 2014 to 20171
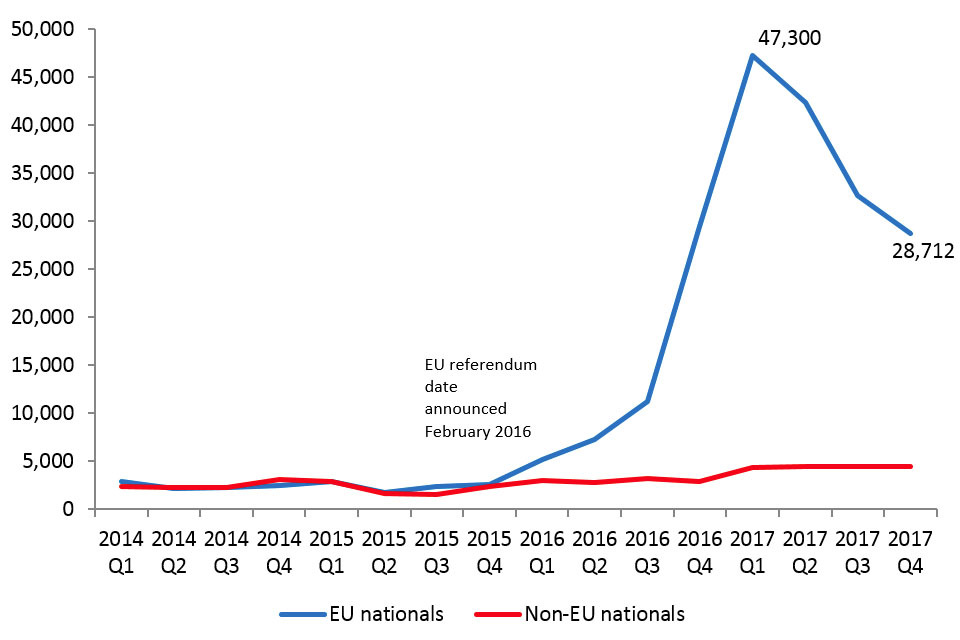
The chart shows the number of documents certifying permanent residence and permanent residence cards issued to EEA nations and their non-EEA family members. The data are available in EEA table ee 02 q.
4.2 Source:
Table ee 02 q (EEA tables).
4.3 Chart note:
- Non-EU includes family members of EEA nationals and small numbers of EEA nationals from Iceland, Lichtenstein and Norway, and Swiss nationals.
Variations in numbers of decisions can be affected by changes in resources and the mix of cases, as well as policy changes and application levels in earlier periods.
Figures on applications received and cases currently outstanding in the European casework route (along with other information such as percentage processed within service standards) can be found on the UK Visas and Immigration Migration transparency data web page, In-country migration data.
5. Citizenship applications, grants and refusals
There are different ways to become a British citizen. The most common is called ‘naturalisation’. To apply for British citizenship by naturalisation you must usually have:
- lived in the UK for at least the 5 years before the date of your application
- spent no more than 450 days outside the UK during those 5 years
- spent no more than 90 days outside the UK in the last 12 months
- had settlement in the UK for the last 12 months if you are from outside the EEA
- had permanent residence status for the last 12 months if you are a citizen of an EEA country
- not broken any immigration laws while in the UK
There are different requirements if your spouse or civil partner is a British citizen.
Total applications for British citizenship rose by 8% to 141,302 in 2017 compared to the previous year. This was 39% lower than the peak in 2013 (232,262).
Almost three quarters (73%) of citizenship applications are from non-EU nationals. Applications made by non-EU nationals fell by 12,756 to 102,774, and applications by EU nationals more than doubled from 15,460 to 38,528.
5.1 Applications for British citizenship, EU and non-EU nationals
| Total applications | Non-EU | EU nationals | EU nationals as % of total | |
|---|---|---|---|---|
| 2012 | 181,410 | 170,972 | 10,438 | 6% |
| 2013 | 232,262 | 210,586 | 21,676 | 9% |
| 2014 | 127,259 | 115,688 | 11,571 | 9% |
| 2015 | 150,767 | 133,421 | 17,346 | 12% |
| 2016 | 130,990 | 115,530 | 15,460 | 12% |
| 2017 | 141,302 | 102,774 | 38,528 | 27% |
| Change: latest year | +10,312 | -12,756 | +23,068 | - |
| Percentage change | +8% | -11% | +149% | - |
5.2 Source:
Table cz 01 q (Citizenship tables).
5.3 Table note:
- Series are based on current EU membership, i.e. Croatians are included in EU total throughout the time series.
Variations in numbers of decisions can be affected by changes in resources and the mix of cases, as well as policy and other changes and application levels in earlier periods.
For more information on the impact of rule changes and longer-term trends in British citizenship applications and decisions see ‘Immigration Statistics, April to June 2017: How many people continue their stay in the UK’.
6. Staying in the UK
In February 2018 the Home Office published ‘Statistics on changes in migrants’ visa and leave status: 2016’, which shows how non-EEA migrants change their immigration status, achieve settlement in the UK, or have their status expire.
This analysis shows that the majority (68%) of migrants issued a Study visa in 2004 no longer had valid leave to remain in the UK 5 years later. This proportion has increased in each cohort arriving from 2005, to 86% for those issued a Study visa in 2011.
Of those issued a Work visa in 2011, 13% (15,428) had been granted settlement 5 years after their initial visa had been granted; a further 12% (14,262) still had valid leave to remain in the UK.
The analysis also showed that most people who arrive on a Family visa end up applying for and being granted settlement; around 4 out of 5 people (79% or 28,402) issued a Family visa in the 2011 cohort had been granted settlement 5 years later, with a further 7% recorded as still having valid leave to remain in the UK.
Of those granted settlement in the 2016 cohort, 28% had originally been issued an initial starting visa for Study, 26% for Work and a further 12% were granted settlement on arrival. The remaining 34% had originally entered on other routes, including Family and Dependants joining or accompanying visas.
7. Data tables
Data referred to here can be found in the following tables:
Extensions tables
Settlement tables
Citizenship tables
European Economic Area (EEA) tables