Why do people come to the UK? (3) To study
Updated 21 March 2018

© Crown copyright 2018
This publication is licensed under the terms of the Open Government Licence v3.0 except where otherwise stated. To view this licence, visit nationalarchives.gov.uk/doc/open-government-licence/version/3 or write to the Information Policy Team, The National Archives, Kew, London TW9 4DU, or email: psi@nationalarchives.gov.uk.
Where we have identified any third party copyright information you will need to obtain permission from the copyright holders concerned.
This publication is available at https://www.gov.uk/government/statistics/immigration-statistics-october-to-december-2017/why-do-people-come-to-the-uk-3-to-study
Back to ‘Immigration statistics October to December 2017’ content page.
This is not the latest release. View latest release.
Data relate to 2017 and all comparisons are with 2016, unless indicated otherwise.
This section contains data on:
- Study-related entry clearance visas
- Study-related sponsored visa applications
- ONS estimates on long-term immigration for study
- arrivals for Short-term study
ONS publishes figures on long-term immigration to study for EU and non-EU nationals. ONS data are published in the ‘Migration Statistics Quarterly Report’. In August 2017, ONS also published its latest ‘International student migration research update’.
In January 2018, the Higher Education Statistics Agency (HESA) published its latest ‘Higher Education Student Statistics UK’, for the academic year 2016 to 2017. HESA publishes data on new entrants to UK higher education providers.
We provide a more detailed commentary on an annual basis. This is included in ‘Immigration Statistics, April to June 2017’.
1. Key facts
In 2017, there were 223,536 Study-related visas granted, excluding Short-term students (formerly known as Student visitors), an increase of 8% (16,435).
Over the same period, the number of University-sponsored study visa applications rose 6% to 177,775. This included a 9% increase for Russell Group universities to 87,236.
Three nationalities (China, US and India) accounted for over half (53%) of the 223,536 Study-related visas granted in 2017, with the largest number going to Chinese nationals (88,456 or 40% of the total).
There were notable increases in the number of Study-related visas granted to:
- Chinese nationals (up 15% to 88,456)
- Indian nationals (up 28% to 14,445)
In the year ending 30 September 2017, ONS estimates that there were 113,000 non-EU long-term immigrants coming to study and who had an intention to remain a year or more, a 30% rise (26,000), which is statistically significant but subject to a ±20,000 confidence interval. The comparable number of Study visas issued rose by 8% to 153,033.
2. Study immigration
Aside from Visitors, the most common visa granted was for Study (8% of all visas granted, and 36% of all non-visit visas).
Trends in Study-related visas granted, by visa type, 2016 to 2017
| 2016 | 2017 | Change | Percentage change | |
|---|---|---|---|---|
| Study-related visas granted excluding Short-term study visas1 | 207,101 | 223,536 | +16,435 | +8% |
| Short-term study visas1 | 87,353 | 106,934 | +19,581 | +22% |
| Year ending 30 September 2016 | Year ending 30 September 2017 | Change | Percentage change | |
| Long-term immigration for study (ONS estimates)2,3 excluding dependants | 87,000 | 113,000 | +26,000 | +30% |
| Long-term (1 year or more) Study-related visas excluding dependants | 141,239 | 153,033 | +11,794 | +8% |
Sources:
Table vi 01 q (Entry clearance visas tables, volume 1) and corresponding datasets.
ʻMigration Statistics Quarterly Report’, ONS.
Table notes:
- The Short-term study category (previously described as Student visitor) allows individuals to come to the UK for 6 months (or 11 months if they will be studying an English language course) and cannot extend their stay (further details at Short-term study visa. For consistency and comparability over time, Short-term study visas have been excluded from Study-related totals.
- The rise of 26,000 in non-EU study-related immigration for the year ending 30 September 2017 had an estimated confidence interval of ±20,000.
- Immigration for study data are estimates of the number of non-EU nationals intending to change their residence to the UK for at least 12 months based on the IPS.
Nationalities granted the highest number of Study-related visas, 2017 compared with 2016
| 2016 | 2017 | Change | Percentage change | |
|---|---|---|---|---|
| China | 76,620 | 88,456 | +11,836 | +15% |
| United States | 14,168 | 14,856 | +688 | +5% |
| India | 11,328 | 14,445 | +3,117 | +28% |
| Hong Kong | 9,007 | 9,268 | +261 | +3% |
| Saudi Arabia | 8,414 | 8,011 | -403 | -5% |
Source:
Table vi 06 q (Entry clearance visas tables, volume 2).
Table note:
- The Short-term study category (previously described as Student visitor) allows individuals to come to the UK for 6 months (or 11 months if they will be studying an English language course) and cannot extend their stay (further details at Short-term study visa. For consistency and comparability over time, Short-term study visas have been excluded from study-related totals.
The nationalities with the largest increase in the number of Study-related visas granted were:
- Chinese (up 11,836 or 15%)
- Indian (up 3,117 or 28%)
- Pakistani (up 965 or 29%)
- US (up 688 or 5%)
The nationalities with the largest decrease in the number of Study-related visas granted were:
- Indonesian (down 763 or 24%)
- Saudi Arabian (down 403 or 5%)
- Nigerian (down 393 or 6%)
For the academic year 2016 to 2017, HESA reported a 7% increase in the number of new entrants from India and China into higher education institutions, but no change overall in the total number of non-EU new entrants.
3. Long-term trends in student immigration
The chart below shows that ONS long-term immigration estimates, while being substantially lower as they cover only those intending to remain a year or more, have for many years followed a broadly similar trend to Student visas granted and passenger arrivals over the longer-term. However, in recent years ONS estimates have been noticeably lower, although less so in the most recent year. These fluctuations in the estimates have not been seen in the most comparable visa data which showed a steadier pattern.
Study-related visas granted and long-term immigration to study, 2005 to 20171
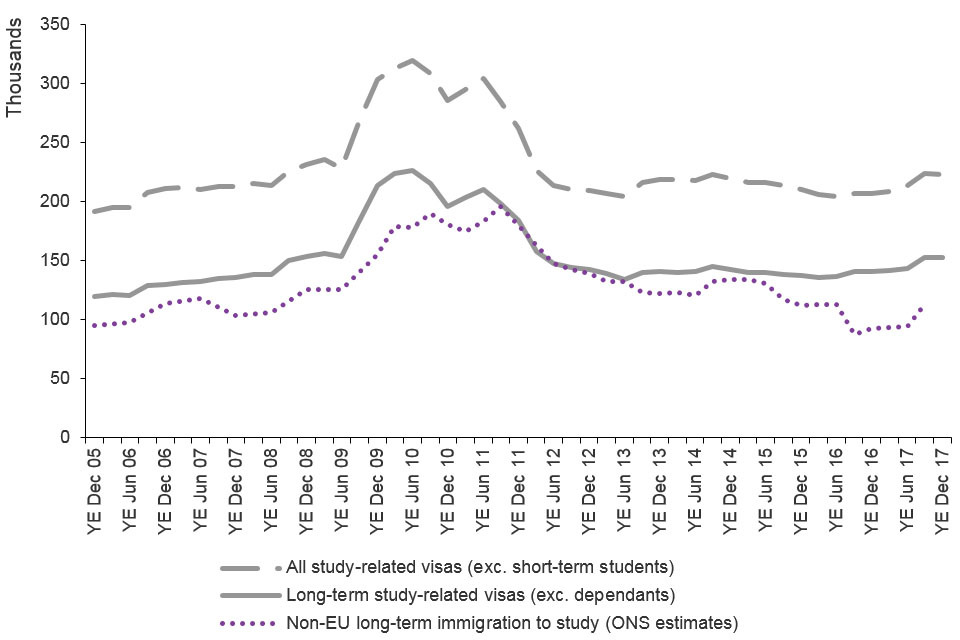
The chart shows the trends for Study of visas granted and IPS estimates of non-EU immigration. The data are sourced from Table vi 04 q and corresponding datasets. Estimates from the IPS are available from the Office for National Statistics.
Sources:
Table vi 04 q (Entry clearance visas tables, volume 1), and corresponding datasets.
ʻMigration Statistics Quarterly Report’, ONS.
Chart note:
- ‘All study-related visas’ includes long-term study, dependants of those coming on long-term study visas, and those granted study visas for less than a year, and excludes Short-term study visas. A proportion of Tier 4 Student visas are also short-term (under 1 year), but are not included within the Short-term students category (see ‘Entry clearance visas by length’ for details).
4. Sponsored study visa applications by education sector
In 2017, the number of Study-related sponsored visa applications (main applicants) rose 6% to 212,298, compared with 200,840 in the previous year. This included:
- a 6% rise in sponsored visa applications for the University sector as a whole (to 177,775), made up of a 9% increase for Russell Group universities (to 87,236) and a 4% rise for other universities to (90,539)
- a 3% increase for the Independent school sector (to 13,736)
- a 40% increase for English language schools (to 3,962)
- a 2% fall for the Further education sector (to 14,253)
Most of the fall in the Further education sector’s sponsored visa applications since the peak in mid-2011 has been accounted for by licences issued to sponsors which have since been revoked.
Sponsored applications from students to study at universities in the UK are 24% higher in 2017 than in 2010. Use of Confirmation of Acceptance for Study (CAS) by sponsoring educational institutions only became mandatory from February 2010. There has been a 14% increase in Student visa applications since the beginning of 2012 following the bedding down of the new system.
Study-related sponsored visa applications, by sector1,2, 2010 to 2017
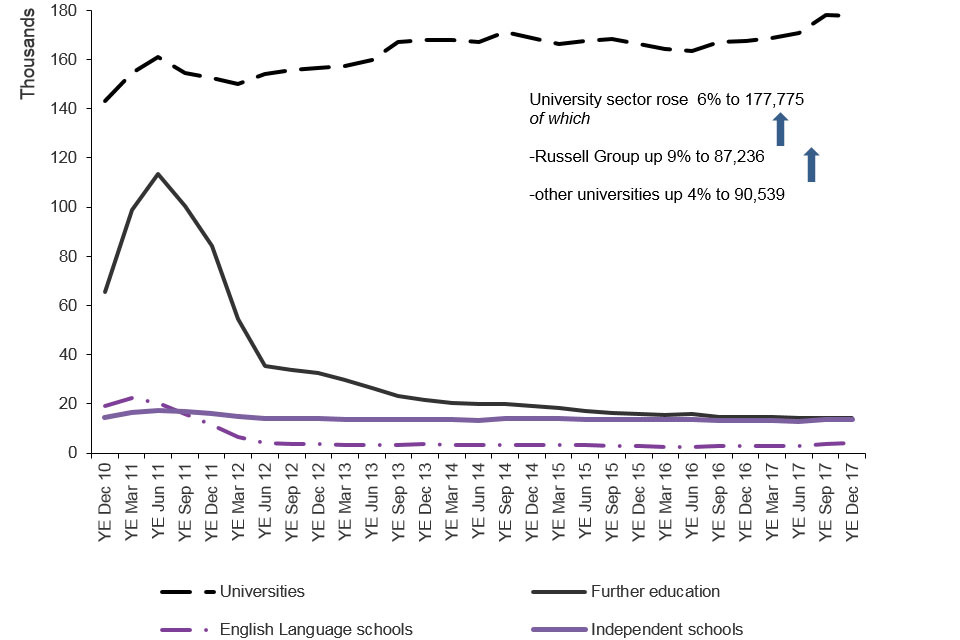
The chart shows the trends in confirmations of acceptance of studies used in applications for visas by the education sector since 2010 to the latest data available. The chart is based on data in Table cs 09 q.
Source:
Table cs_09_q (Sponsorship tables).
Chart notes:
- ‘Universities’ relate to UK-based higher education institutions.
- ‘Further education’ relates to tertiary, further education or other colleges.
5. Short-term students
There were 208,000 Short-term student admissions in the year ending 30 June 2017, much higher than the numbers of Short-term student visas granted (103,456 over the same period). This is due to many student visitor admissions being from nationalities (such as the US) that are not required to obtain a visa if they wish to come to the UK as a short-term student for 6 months or less.
6. Data tables
Data on student immigration, sourced from Home Office administrative systems, can be found in the following tables:
Sponsorship tables
Visas tables volume 1
Visas tables volume 2
Visas tables volume 3
Admissions tables
Extensions tables