Housing Benefit speed of processing statistics: methodology note
Updated 30 October 2024
Applies to England, Scotland and Wales

© Crown copyright 2024
This publication is licensed under the terms of the Open Government Licence v3.0 except where otherwise stated. To view this licence, visit nationalarchives.gov.uk/doc/open-government-licence/version/3 or write to the Information Policy Team, The National Archives, Kew, London TW9 4DU, or email: psi@nationalarchives.gov.uk.
Where we have identified any third party copyright information you will need to obtain permission from the copyright holders concerned.
This publication is available at https://www.gov.uk/government/publications/housing-benefit-speed-of-processing-statistics-methodology-note/housing-benefit-speed-of-processing-statistics-methodology-note
1. Context of the Statistics
What is Housing Benefit?
Housing Benefit (HB) is an income related benefit which is provided to households in order to help them meet housing costs for rented accommodation.
The claimant may get help with all or part of their rent. There is no set amount of HB for claimants as entitlement is dependent on whether they are renting privately or from a Local Authority (LA) or council.
Eligibility requirements for claiming Housing Benefit
The eligibility requirements for making a new HB claim are:
-
they are single and have reached State Pension (SP) age
-
they are living with a partner and both have reached SP age
-
they are living with a partner and one has reached SP age and started claiming Pension Credit before 15 May 2019. The partnership must have also existed prior to 15 May 2019
-
they are in supported, sheltered or temporary housing
Existing claimants can continue to receive HB if they were in receipt of it before 15 May 2019 and have reached SP age, irrespective of the age of their partner. However, if a claimant reports a change of circumstance to an existing HB claim and it is subsequently stopped, a claimant cannot reapply for HB unless they – and their partner, where applicable - meet the current eligibility criteria.
Read more information about HB eligibility.
If ineligible for HB, individuals may still be able to claim Universal Credit (UC) if they meet the eligibility criteria for doing so. UC is replacing many legacy benefits, including Housing Benefit for most working age customers, and existing HB claimants may receive a Migration Notice letter with guidance on how to make a UC claim to continue receiving financial support. Not all HB claimants will be eligible to move to UC, and therefore will continue to receive support with housing costs via HB.
Read more information about the Move to UC.
What is Housing Benefit Speed of Processing?
HB Speed of Processing (SoP) refers to how long it takes for LAs to process a new HB claim or a change of circumstances to an existing HB claim.
The average time taken to process each claim or change of circumstances to an existing claim is calculated as the total number of processing days divided by the total number of cases processed, rounded to the nearest calendar day.
Monthly, quarterly and annual figures are provided at Great Britain (GB) level, as well as regional and LA level.
2. Purpose and Relevance
The HB SoP official statistics are released quarterly in:
- January
- April
- July
- October
These statistics provide users with the volume of new HB claims and change of circumstances to existing HB claims processed by each LA, per month and quarter, and the associated total amount of time (in calendar days) to process them. These statistics include all claims processed, irrespective of their outcome. Users can also use these statistics to see how SoP performance differs across LAs for working age and pension age claims.
Year-end figures are provided in the July publication to show the financial year as a whole. These figures are also rounded to the nearest calendar day.
Internal Users
DWP’s Local Authority Partnership, Engagement and Delivery division use this data to monitor local authority (LA) speed of processing times and to manage performance at an individual LA level.
These statistics are used within DWP’s fraud and error publication, specifically to provide an adjustment for the underlying data.
DWP also provides information for relevant parliamentary questions and freedom of information requests relating to HB SoP statistics. Responses to these are published in Hansard and on the DWP statistical Freedom of Information page
External Users
Local authorities use these statistics to analyse and publicly report on their HB SoP performance.
Findings from DWP’s user consultation exercise in 2019 showed that these statistics are used in debates on the UC and HB systems.
User Engagement
There is a clear user engagement strategy in place to ensure statistics are improved through meeting increased user needs.
DWP would like to hear your views on our statistical publications. If you use any of our statistics publications, we would be interested in hearing what you use them for, and how well they meet your requirements Specifically views on content, presentation, and suggestions for future developments on the series.
DWP is also making use of improving technology to better understand and improve user experience of the landing page, downloads of the statistical release and the most popular queries, as well as the technology that users employ (desktops, mobile phones, laptops) and the type of users accessing data via looker studio.
3. Data Sources
The Single Housing Benefit Extract (SHBE) is the most comprehensive administrative DWP dataset for HB. It contains data for all individual HB claims and is collated from returns from administrating LAs.
The data returns are monthly and cover a range of different characteristics such as the status of each claim, the personal characteristics of claimants and the LA administrating the claim.
The data received is classified as ‘unmasked’; meaning it contains unencrypted information including personal identifiers such as a claimants national insurance number and full address.
In order to comply with DWP’s personal information charter, the individual level data is encrypted by DWP Data Delivery Team (DDT). Personal identifiers are removed and replaced with non-identifiable markers, for example, encrypted national insurance numbers, which guards against the identification of an individual claimant.
The Customer Information System (CIS) is a system used by DWP to collect information about customers. It provides information on personal characteristics such as National Insurance Number, date of birth, and sex, as well as benefit awards. In cases where information such as date of birth is missing from a claim on the SHBE extract, CIS is used to populate missing information.
Data collection
LAs use a range of software suppliers to provide the systems to administer HB and subsequently provide data to DWP. Each month, LAs will submit an extract of all claims on their HB system including details of all claims live or awaiting decisions on the extract date, claims closed since the previous extract, and various details of activity since the last extract, such as records for changes of circumstances, appeals and overpayments. This information is compiled into a single, encrypted data extract by DDT and provided to DWP analysts on a monthly basis.
It is important to note that data submissions by an LA are not mandatory, however are encouraged.
Data structure
SHBE data variables used in production of HB SoP statistics
| Field | Note |
|---|---|
| LCLASER | Unique identifier for each LA |
| SED_DATE* [footnote 1] | Date of SHBE data extract |
| REC_TYPE | Status of claim (for example, live, closed or withdrawn) |
| LCHBREF | HB claim reference number |
| CCNINO | Encrypted National Insurance number |
| LDHBREC | Date most recent HB claim was received |
| LDHBDEC | Date of first decision on most recent HB claim |
| LXHBOUT | Decision outcome |
| LDSTARTDAT | HB claim entitlement start date |
| CDHBMADE | HB claim Treat as Made Date |
| CCCHGTYP | Type of Change (for example, automated uprating, other) |
| CDCHGNOT | Date LA first notified of change in claim details |
| CDCHGEFF | Date changes are effective from |
| CCCHGIDT | If not annual uprating, how was the change identified |
| CDHBSUPER | Date supersession decision was made on the claim |
| LCLHA | Local Housing Authority regulations applied |
| CCTEN | Geographical region |
| PASSPORTIND | Passported / standard claim indicator |
| CDDOB | Claimant date of birth |
| CCSEX | Claimant gender |
| CCHBSOURCE | Source of the most recent HB claim (for example, LA form, telephone, electronic channel) |
| LCSOFTWARE | Software company |
Data reference area
SHBE data for individual claims is aggregated and reported at LA, regional and GB levels in the HB SoP statistics.
Confidentiality and Security
Before statistical release, only a small number of authorised internal colleagues can access the statistics, in line with Code of Practice protocols and these cannot be shared wider.
4. Methodology
Data flow
Local authorities submit their data to an online system once a month. DWP DDT collate these extracts to create one monthly, encrypted SHBE extract.
DWP analysts receive the encrypted data scan from DWP DDT and access this through a statistical software package called SAS Enterprise Guide. On receipt of the data, analysts conduct a number of methodological processes and quality assurance checks.
Data compilation
For any single, reported quarter of HB SoP statistics, 5 SHBE scans are used to capture the latest HB claim position and incorporate any retrospection beyond the main reference quarter.
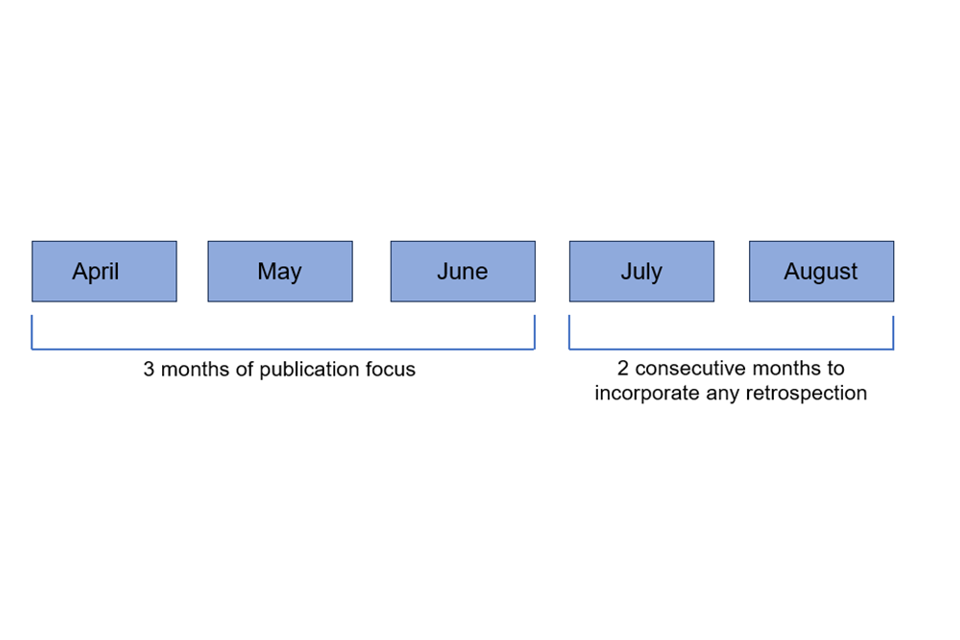
The above diagram shows that data from the three months in the publication quarter – in this case, quarter 1 of the financial year - along with the two consecutive months following the quarter (July and August) are required. This ensures that the most up to date information is included in the HB SoP calculation at the time it is made.
Data validation
DWP analysts excludes cases from the HB SoP statistics that appear on SHBE to have taken more than 365 days to process. Quality assurance (QA) work indicated that the majority of these cases are a result of processing or software errors. Therefore, their inclusion in the HB SoP statistics would distort the calculation and provide an inaccurate picture of HB SoP performance.
Statistical code is also run against individual level data to clean the data; ensuring any duplications are removed.
Further SAS coding is run to link the data to other sources such as CIS to verify and populate date of birth and gender variables, attach geographical markers, calculate state pension age and identify whether a claimant is of working age or pension age, before the HB SoP measure is calculated and aggregated to monthly, quarterly and annual totals.
Statistics calculations
The ‘total number of processing days’ for each new claim or a change of circumstance for an existing HB claim, is calculated by looking at the difference between the ‘date of receipt’ to the ‘date of decision’ for each claim.
For most new claims, the total number of processing days is calculated by looking at the difference between the date of receipt and the date of decision for a claim.
For changes of circumstance to existing claims, processing time is calculated as the difference between the date a supersession decision was made and either the day of first notification or the day the change is effective from.
The HB SoP is then calculated by dividing the ‘total number of processing days’ by the ‘total volume of claims’ for a given geography (LA, region or GB).
Quarterly average year-end calculations are also used throughout the statistical release to help describe trends. This can be thought of as a moving average and helps to smoothen any seasonality in the volume and speed of processing timeseries. The table below uses synthetic data to illustrate how year-end figures are calculated.
| Quarter | New claims total processing days | New claims volumes | Average SoP | Year-end average SoP |
|---|---|---|---|---|
| Q1 2023 to 2024 | 1871211 | 100952 | 19 | - |
| Q2 2023 to 2024 | 1669012 | 98623 | 17 | - |
| Q3 2023 to 2024 | 1455059 | 90836 | 16 | - |
| Q4 20193to 2024 | 1548740 | 92706 | 17 | 17 |
The table above shows how the quarterly SoP at year-end is calculated, by summing the four previous quarters of total days processed and dividing by the four previous quarters of volumes to give an average year-end SoP. The quarterly SoP is shown as a comparison. All SoP figures have been rounded to the nearest calendar day.
Note, average year-end figures for the first three quarters shown have been omitted as four quarters’ worth of data are required to produce the figure.
Taking the Q4 FYE 2024 SoP at year-end as an example, using the figures from the table above, this is calculated as:
Quarter 4 SoP at year-end = (1871211 + 1669012 + 1455059 + 1548740) / (100952 + 98623 + 90836 + 92706)
Quarter 4 SoP at year-end = 17.08 = 17 days (rounded to nearest calendar day)
5. Quality Management
Quality assurance during development
Data is analysed using SAS and excel software, before the population of statistical tables.
-
a 40-month historical summary of each LA’s HB SoP for both change of circumstances and new claims is produced
-
SAS software will identify any LAs that it considers to have fallen outside of an acceptable tolerance range, and prints these as graphical summaries which are subject to human (manual) intervention. Any ‘spikes’ or ‘dips’ on the graph can indicate a high or low speed of processing outside of normal range.
-
any LA that has deviated from the tolerance range is analysed against data from the previous months
-
for any LAs identified as potentially having outliers, the underlying data can be investigated alongside the data issues log provided by the LA data experts for HB SoP, colleagues in DWP’s Local Authority Partnership and Engagement Division, and DDT. If there is a valid reason for a deviation in the SoP for an LA, such as a backlog of cases or staff shortage, then a decision will usually be made for the LA data to remain in the publication, as the increase in SoP can be explained. In cases where an LAs data cannot be explained, or the LA has suffered a severe cyber-attack, the LA may be omitted from the statistics
Routine quality assurance checks
Further additional QA processes are in place that are consistent across all DWP statistical production processes. These include:
-
ensuring updates to code have been done correctly
-
checks for data completeness
-
comparing figures with previous publications
-
ensuring all figures are correctly cited in each of the statistical documents
-
ensuring commentary is impartial and accurate
All issues are recorded on a quality log and rated according to their impact. Any issues that are detrimental to the quality of the statistics are made aware to users in the statistical bulletin.
Exclusions
For any LAs that cannot be identified as having genuine outliers, there is an option of excluding them.
DWP retain the right to remove any figures that are questionable and where investigation/resolution of these figures would become a proportionate burden. This is assessed on a case by case basis.
Exclusions are made where data is not fit for purpose and DWP reserves the right to withhold any figures that are not fit for purpose in line with the code of practice for statistics. Individual explanations for the exclusion of data in each publication are not routinely published.
The existing aggregation method means that quarterly data will not be available if all underlying months of that quarter are not available. Similarly, with annual data, if all underlying quarters are not available. This is to ensure that any current data are comparable with historical data.
When DWP analysts have agreed exclusions with DWP colleagues working in Local Authority Partnership and Engagement division, a final caseload dataset is created.
6. Statistical Presentation
ODS tables
After successful QA, DWP runs code that populates a set of ODS (spreadsheet) tables, containing one tab for each output measure – a quarterly summary all in one table, monthly totals by LA for total number of processing days, number of claims and the calculated average speed of processing, a quarterly timeseries, a quarterly summary of speed of processing broken down by working age and pension age claims and the quarterly total number of claims broken down by working age and pension age claims. Furthermore, for the final quarter of each financial year, the publication includes an annual table with the monthly data aggregated to annual level for the entire financial year.
HTML statistical bulletin
Important trends are discussed in the statistical bulletin which includes charts. This statistical bulletin is produced by compiling a draft Microsoft Word, this then goes through several iterations of QA and liaison with internal stakeholders. Finally, it is then converted into HTML (web page) format by DWP analysts and uploaded to GOV.UK by DWP web content managers. This is consistent with the standard DWP statistical release procedures.
Statistical charts and maps
Within the statistical bulletin are several charts which are created using the raw (unrounded) output data. The latest quarter data is appended to the previous data in the case of the time series charts. These are at a GB level.
The maps are created using individual average SoP LA level data. If any LA has an average SoP of zero, then their data is omitted from the maps. The map ranges (keys or bins) are created by allocating LAs to one of five bins based on an equal proportion of LAs being allocated to each bin, where possible.
Accessibility and Clarity
The statistical bulletin, charts, and ODS (spreadsheet) tables are in accessibility compliant format – meeting the guidelines within DWP’s accessibility statement.
The statistics are reviewed each quarter, and improvements to the ODS tables and statistical bulletin are identified to further improve accessibility. The statistics are described in an objective manner and use plain English to assist users. All graphical elements have a written text alternative.
If you have any comments on how you feel this publication could be improved to better meet accessibility standards, please contact cbm.stats@dwp.gov.uk
7. Limitations of these Statistics
Known issues
Users of these statistics should be aware of the following limitations of the statistics:
-
the quarterly statistics are produced at a point in time, they do not include later data retrospection
-
inconsistency across tables due to suppression or omission of data. Users are advised to pick the right set of tables for their specific needs and be aware of differences in aggregated totals. Monthly figures may not sum to quarterly totals, and quarterly figures may not sum to annual totals. This is because LAs may have suppressed or missing data at a monthly level that is not included in the reported quarterly totals. If data is supressed at quarterly level then it will always be supressed in the year-end annual table totals
-
totals in the tables containing data for working age and pension age claimants may not sum to quarterly or monthly totals for an LA. This is because the date of birth or gender variable may not always be populated on a claimant’s record, and therefore the client marker (whether a claimant is working age or pension age) will be missing. Any claims without a client marker are not included in the breakdowns within the working age and pension age tables. In order to minimise missing information, all claims are checked and verified with DWP’s CIS database and if this information is available, it will be populated
-
though it is encouraged, it is not mandatory for LAs to supply a monthly extract of their HB claims. As a result, there are instances in which some LA level data will be unavailable within the statistics. Similarly, situations such as changes to an LAs administrative systems or cyber-attacks may impact an LA’s supply of data and can result in statisticians omitting LA level data due to concerns over data quality. Although missing data from individual LA’s do not materially affect the main stories, there may be a slight impact on regional trends
Coherence
Coherence with other DWP publications that use HB data such as the HB caseload, HB Debt Recovery and Benefit Cap statistics to ensure that all publications are consistent. Where approaches are used in one publication, these are also used across other publications, where appropriate. For example, the handling of missing data, rounding policy and perturbation of data. In some instances, it is deemed in the best interests of stakeholders and DWP statistical producers to take a different approach to other publications – this is always outlined and explained in the publication if this approach has been taken.
Where possible, HB SoP statistics are comparable to historical data due to the use of consistent methodology. The total number of claims reported in the HB SoP statistics cannot be compared to the HB caseload statistics which only report claims that are live and in payment, as the HB SoP statistics report on all claims, regardless of their outcome.
Statistical release map ranges – LAs are allocated to one of five groups (bins) based on their average speed of processing for new claims and change of circumstances to an existing HB claim. Although we aim to allocate an equal proportion of LAs to each bin, where the range of average speed of processing (in calendar days) is small across all LAs, this becomes more difficult. When these situations arise, then the best nearest split of LAs are allocated across the bins. This is more evident with change of circumstances to an existing HB claim.
The following changes are excluded from the speed of processing information:
-
automatic uprating of the HB applicable amounts and social security benefits
-
revisions to earlier decisions, e.g. following a reconsideration, appeal and accuracy/management check
8. Statistical Release Strategy
Punctuality
The HB SoP publication is released at 9:30am on the final Wednesday of the publish month noted below.
| Data to | Published |
|---|---|
| September | January |
| December | April |
| March | July |
| June | October |
The release calendar is updated at the earliest opportunity to inform users of any change to the date of the statistical release and will include a reason for the change.
Timeliness
There is a four-month lag in data availability, due to the way the SHBE data source is obtained, and the final aggregated analytical dataset is constructed (to provide the most up to date base data to calculate accurate SoP). Therefore, taking January’s publication for example, data would include up to the end of September of the previous year.
Data revision
There are no revisions planned for the Housing Benefit Speed of Processing statistics.
Revisions due to conceptual or methodological changes will be announced at least three months before publication and this document will be updated accordingly.
Although extensive quality assurance is conducted on both the raw data and statistical outputs, errors can occur on rare occasions. In these cases, we thoroughly investigate how they occurred and strengthen our processes where necessary. In line with statistical protocols, any unplanned situation which requires a revision or change to the published official statistics will be published transparently on the HB SoP collection page detailing any implications for users.
9. Rounding Policy
The volume of claims and the number of processing days are unrounded in the statistical ODS tables. The average speed of processing is calculated using unrounded numbers, and then presented rounded, to the nearest whole day.
n the statistical bulletin, the number of processing days and volumes data are rounded as follows.
| Range | Rounded to the nearest |
|---|---|
| 0 to 1,000 | 10 |
| 1,001 to 10,000 | 100 |
| 10,001 to 100,000 | 1,000 |
| 100,001 to 1,000,000 | 10,000 |
| 1,000,001 to 10,000,000 | 100,000 |
| 10,000,001 to 100,000,000 | 1,000,000 |
Sometimes figures are rounded differently in the narrative in the bulletin where comparisons between figures are made based on different rounding precisions, or where the rounding of figures could potentially give a misleading picture of the statistics and trends. When figures are rounded differently, they are always rounded to at least a greater degree of precision than the policy set out above. These are rounded on a case-by-case basis.
Percentages shown within the statistical release are calculated using unrounded numbers and are rounded to the nearest whole percentage point.
10. Changes to these Statistics
Any data, publication or process issues that may affect these statistics will be highlighted on the HB SoP collection page.
Planned changes to the statistics will be announced at least one quarter prior to the statistical release which contains the changes. Any other changes will be made with at least 28 days’ notice, in line with standard statistical practices.
Changes will also be announced in the DWP statistical work programme.
-
impact of UC roll-out – the number of new people claiming HB is decreasing as many are now eligible for Universal Credit instead
-
we are looking into whether it is possible to publish these statistics via Stat-Xplore in the future and development work is currently taking place. Further user announcements around the availability of this data on Stat-Xplore will be made in line with our standard user notification protocols (as outlined above)
-
information on LA mergers can be found in the footnote of the ODS tables. Where LAs have merged, only figures for the merged LA will be shown.
-
a breakdown by working age and pension age for average speed of processing and claim volumes was introduced in the July 2024 release and will be included in forward routine releases
11. Status of these Statistics
The HB SoP statistics are badged as official statistics.
Our statistical practice is regulated by the Office for Statistics Regulation (OSR). OSR sets the standards of trustworthiness, quality and value in the Code of Practice for Statistics that all producers of official statistics should adhere to.
You are welcome to contact us directly cbm.stats@dwp.gov.uk with any comments about how we meet these standards.
Alternatively, you can contact OSR by email regulation@statistics.gov.uk or through the Office for Statistics Regulation website.
12. Glossary
Number of processing days
When calculating the number of processing days, all calendar days should be counted including weekends and public holidays, not just working days. This must include any days when there are reasons for additional processing days beyond the LA’s control, for example, a customer’s failure to provide additional information and delays between offices. The processing time also includes the day the claim was received and the day the claim was decided.
Speed of processing
The speed of processing is calculated by dividing the number of processing days by the number of cases processed.
New claims
A new claim is any claim received by a local authority whereby the claimant is not already in receipt of Housing Benefit.
Change of circumstances
A change event means any notification or information received during the course of a benefit award from the customer or third party which leads to a decision on a claim, regardless of whether entitlement is affected.
State pension age
State pension age is calculated under current legislation, dependent on a claimant’s date of birth and gender. At present, the state pension age for both men and women is 66. More information can be found on the State pension age timetable.
Working age and pension age
Date of birth is recorded as part of the Housing Benefit claim process. Analysts derive age at the time of the SHBE extract from this date of birth variable. Pension age includes claimants who are above state pension age, and working age are those who are below state pension age.
Effective dates
If a change is notified in advance - that is before the date from which the change takes effect - the count for the processing time will start from the implementation date. If a decision is made on the change on or before the date the change takes effect, the time taken to process the change will be one day. However, if a decision is not made on the change by the date the change comes into effect, processing time will continue until the date a decision is made.
13. Related Statistics
The DWP publishes related statistics on:
-
DWP also publishes historic and forecast benefit expenditure and caseload data which is usually consistent with the Autumn Budget and Spring Statement
-
Read details of other National and Official Statistics produced by the Department for Work and Pensions
14. Feedback
These statistics are published by the Department for Work and Pensions.
If you would like to offer feedback or require further information on these statistics, please contact cbm.stats@dwp.gov.uk or kate.walker@dwp.gov.uk
For media enquiries on these statistics, please contact the DWP Press Office
-
Fields marked with an asterisk (*) are derived and added by DDT before statistical production. ↩