HMRC monthly performance update: January 2017
Published 23 February 2017

© Crown copyright 2017
This publication is licensed under the terms of the Open Government Licence v3.0 except where otherwise stated. To view this licence, visit nationalarchives.gov.uk/doc/open-government-licence/version/3 or write to the Information Policy Team, The National Archives, Kew, London TW9 4DU, or email: psi@nationalarchives.gov.uk.
Where we have identified any third party copyright information you will need to obtain permission from the copyright holders concerned.
This publication is available at https://www.gov.uk/government/publications/hmrc-monthly-performance-report-january-2017/hmrc-monthly-performance-update-january-2017
These figures show how we’re performing against our main customer service objectives.
These objectives are all about:
- how we’re helping customers to do things online
- how quickly we answer your phone calls
- how quickly we handle your letters
- how we handle complaints
Our objectives are set by the Chancellor of the Exchequer and are published in our single departmental plan.
1. Performance at a glance
Below is the full set of figures for our performance against our customer service objectives for January 2017.
| January 2017 | Change from December 2016 | Year-to-date (since April 2016) | Target | |
|---|---|---|---|---|
| Average speed of answering a customer call | 03:00 | + 01:18 | 03:58 | 06:00 mins |
| % of call attempts handled | 93% | - 3.5% | 91% | 85% |
| % of post handled within 15 days | 78% | - 5.0% | 81% | 80% |
| % of post handled within 40 days | 96% | + 1.4% | 97% | 95% |
| Number of customers using their personal tax account | 0.9m | + 0.5m | 8.3m | 7m |
| Customer satisfaction with digital services | 72% | - 2.3% | 74% | 80% |
| i-Forms responded to within seven days | 98% | + 0.2% | 99% | 95% |
| Number of Tier 1 complaints received | 5,427 | + 374 | 63,431 | - |
Notes:
- Call attempts in December 2016 were 2.7 million, and in January 2017 were 4.7 million, in line with expectation
- Data for post handled within 40 days is one month lagged and shows December 2016 performance, the change from November 2016 and year-to-date figure to December 2016
- Personal tax account performance measured from the launch of the personal tax account in December 2015
2. Digital services
2.1 Personal tax account
We want at least 7 million people using their personal tax account by April 2017.
At the end of January 2017, the number of people using their personal tax account was:
8.3 million
There were 0.9 million new users of the personal tax account during January 2017.
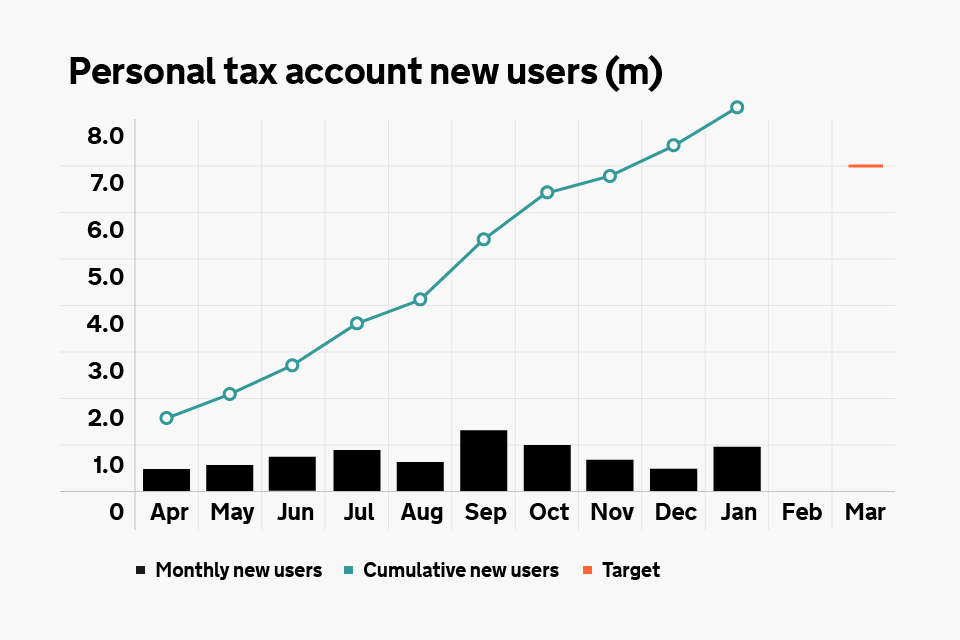
Graph displaying numbers of new users of the personal tax account
2.2 Customer satisfaction
We want to achieve an average of 80% customer satisfaction for our digital services across the year.
During January 2017, our average customer satisfaction rate for all digital services was:
72%
3. Phones
Our aim is to achieve a consistent level of service across our phone helplines.
We aim to:
- answer answer customer calls to our helplines within an average speed of answer of 6 minutes across the year
- handle on average at least 85% of call attempts across the year
We received 4.7 million telephone calls in January 2017, which was in line with our expectations. January is the busiest month for phone calls due to the deadline for submitting Self-Assessment tax returns.
3.1 Speed of phone answering
During January 2017 we answered our phones in an average of:
3 mins 0 seconds
Our overall average speed of answer since April 2016 is 3 minutes 58 seconds.
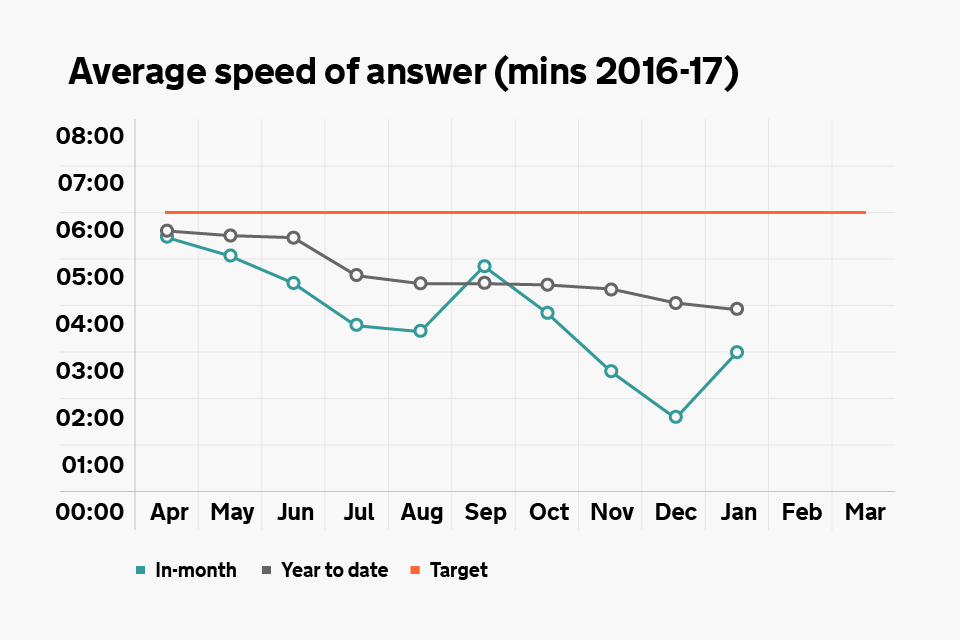
Graph showing the average speed of answer for our phone lines
3.2 Phone calls handled
During January 2017 we handled on average:
93% of our calls
Our overall average call handling rate since April 2016 is 91%.
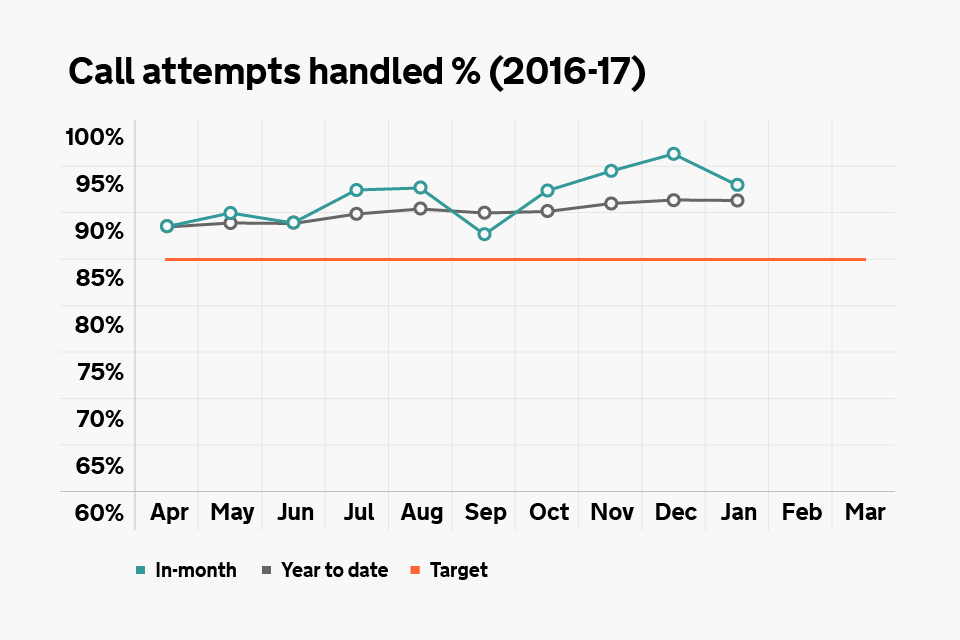
Graph showing our phone call handling rates
4. Post
We received 0.9 million targeted post items in January 2017.
We aim to reply to at least 80% of customer correspondence and complaints within 15 working days across the year.
During January 2017 we responded to:
78% of customer post within 15 days
Overall since April 2016 we have responded to 81% of post within 15 days.
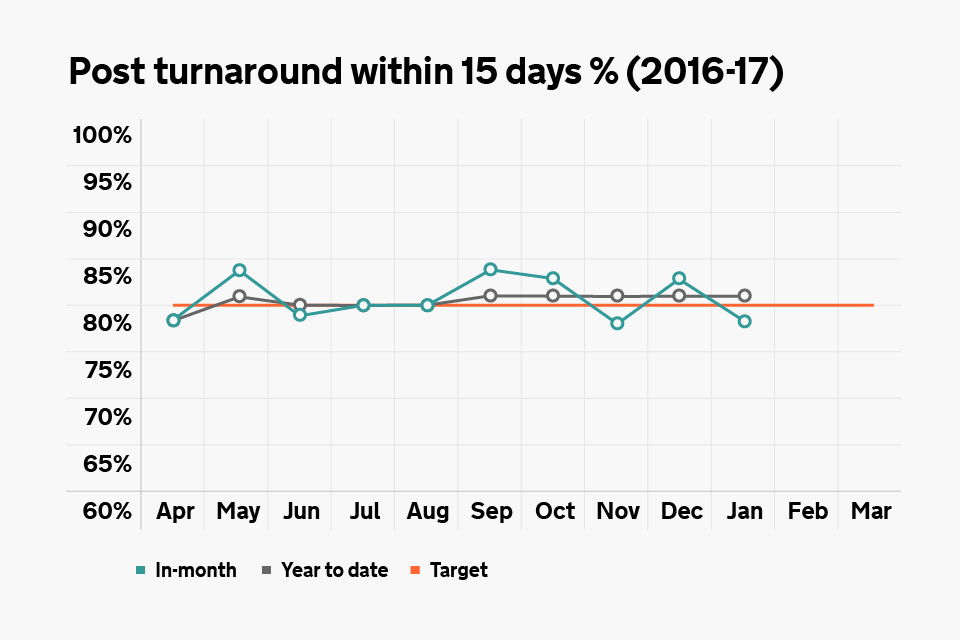
Graph showing percentage of post handled within 15 working days
5. Complaints
We want to get all our interactions with customers right first time. We deal with 45 million individuals and more than 5.4 million businesses. Each year we receive more than 60 million phone calls and 15 million letters.
If a customer is unhappy with our service, we aim to resolve a customer’s complaint at the first stage (Tier 1), but if they are still dissatisfied, they can ask us to look at their concerns again (Tier 2). We treat complaints seriously and learn lessons from them.
In 2015 to 2016, we received 80,391 complaints and resolved 98.5% of these internally.
If a customer thinks our decision is incorrect after the second review, they can contact the Adjudicator’s office which is independent of HMRC.
If a customer still remains dissatisfied, they can approach the Parliamentary & Health Service Ombudsman via their MP.
There’s more detailed guidance on how we handle and resolve complaints.
Definitions:
- ‘Fully upheld’ means we agree with the key part of the customer’s complaint
- ‘Partially upheld’ means we agree with some but not all of the customer’s complaint
- ‘Not upheld’ means we don’t agree with the customer’s complaint
5.1 Tier 1 complaints - since April 2016
Tier 1 complaints received
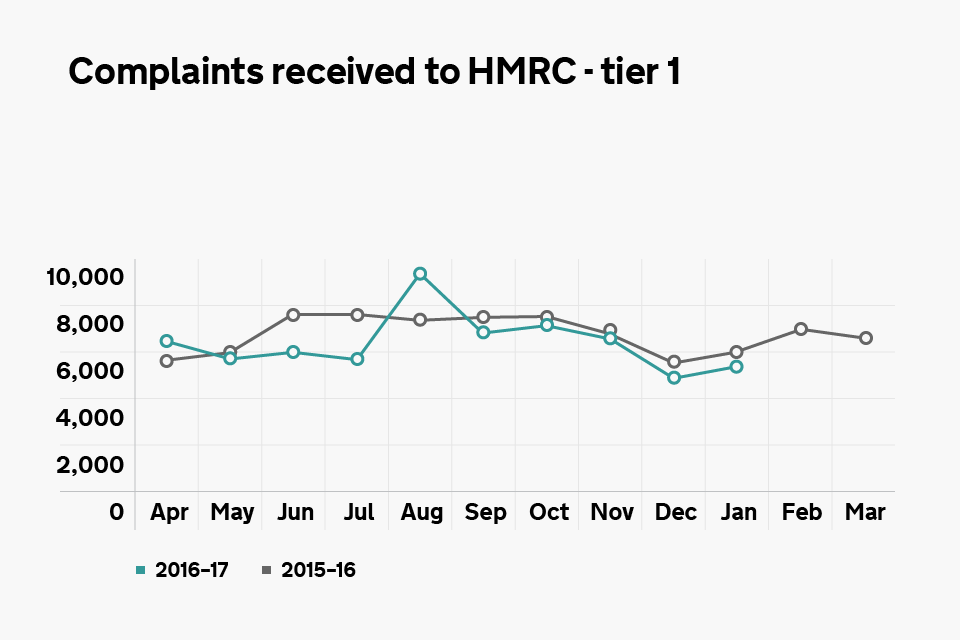
Graph showing the number of tier 1 complaints received
Tier 1 complaints cleared
| Apr 2016 | May 2016 | Jun 2016 | Jul 2016 | Aug 2016 | Sep 2016 | Oct 2016 | Nov 2016 | Dec 2016 | Jan 2017 | Feb 2017 | Mar 2017 | ||
|---|---|---|---|---|---|---|---|---|---|---|---|---|---|
| Tier 1 complaints not upheld | 52% | 49% | 50% | 50% | 51% | 50% | 55% | 52% | 50% | 50% | |||
| Tier 1 complaints partially upheld | 16% | 15% | 16% | 17% | 16% | 18% | 16% | 17% | 16% | 17% | |||
| Tier 1 complaints fully upheld | 33% | 36% | 34% | 33% | 33% | 32% | 29% | 31% | 34% | 34% |
Note: Due to rounding these figures may not add up to 100%.
5.2 Tier 2 complaints - since April 2016
Tier 2 complaints received
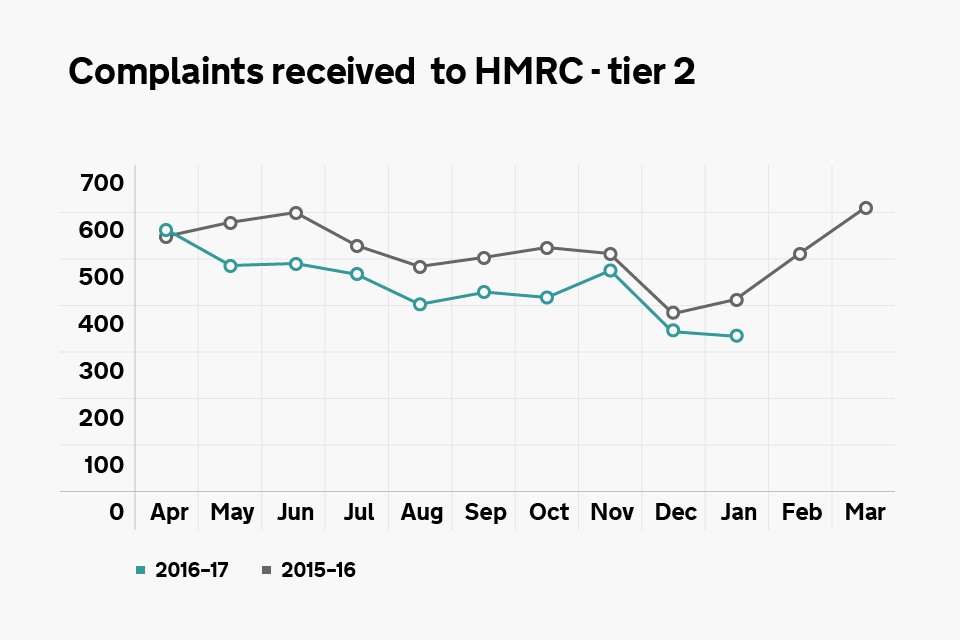
Graph showing the number of tier 2 complaints received
Tier 2 complaints cleared
| Apr 2016 | May 2016 | Jun 2016 | Jul 2016 | Aug 2016 | Sep 2016 | Oct 2016 | Nov 2016 | Dec 2016 | Jan 2017 | Feb 2017 | Mar 2017 | |
|---|---|---|---|---|---|---|---|---|---|---|---|---|
| Tier 2 complaints not upheld | 60% | 58% | 53% | 57% | 58% | 55% | 57% | 61% | 51% | 48% | ||
| Tier 2 complaints partially upheld | 23% | 23% | 28% | 25% | 25% | 28% | 25% | 22% | 24% | 26% | ||
| Tier 2 complaints fully upheld | 17% | 19% | 19% | 19% | 17% | 16% | 17% | 18% | 25% | 26% |
Note: Due to rounding these figures may not add up to 100%.
The in-year figures reported are initial management information to provide an indication of our performance. They are subject to revision and audit. Final full-year performance figures will be made available in our annual reports.