
Long-term investment scenarios (LTIS) 2026
Updated 13 November 2026
Applies to England

© Crown copyright 2026
This publication is licensed under the terms of the Open Government Licence v3.0 except where otherwise stated. To view this licence, visit nationalarchives.gov.uk/doc/open-government-licence/version/3 or write to the Information Policy Team, The National Archives, Kew, London TW9 4DU, or email: psi@nationalarchives.gov.uk.
Where we have identified any third party copyright information you will need to obtain permission from the copyright holders concerned.
This publication is available at https://www.gov.uk/government/publications/flood-and-coastal-risk-management-in-england-long-term-investment/long-term-investment-scenarios-ltis-2026
1. Introduction
Long-term investment scenarios (LTIS) is an economic assessment of the costs and benefits of investing in flood and coastal erosion risk management (FCERM). It considers the next 50 years (to 2075) and 100 years (to 2125).
It assesses investment in a range of FCERM measures. These include:
- maintaining existing assets
- building new defences
- catchment storage and natural flood management (NFM) measures
- property flood resilience (PFR)
- sustainable drainage systems (SuDS)
It does this across 3 sources of risk:
- fluvial (river) flooding
- coastal flooding
- surface water flooding
LTIS uses a range of possible future states to account for uncertainty in climate change. The scenarios have been selected using a risk-based and precautionary approach, reflecting the long lifetimes of flood and coastal infrastructure and the long-term consequences of decisions made today. Two climate scenarios are applied across all investment scenarios. The design climate scenario provides the main planning and investment baseline, based on 2°C warming by the middle of the century and consideration of 4°C warming by the end of the century. An extreme climate scenario is used for stress testing.
These scenarios are not predictions of future climate policy or an assumption that international mitigation targets will not be met. Rather, LTIS uses a range of possible futures to test the resilience of long-term investment decisions.
The results demonstrate the potential reductions in economic damages and the wider benefits that can be achieved through different levels of cost-beneficial investment. LTIS does not assess where the funding would come from or which funding sources would be most appropriate.
In this report:
- section 2 explains the context for flood and coastal investment
- section 3 outlines the approach to LTIS
- section 4 explores optimised investment scenarios with climate change
- section 5 describes changes in flood damages in optimised investment scenarios
- section 6 summarises natural capital results
- section 7 summarises social equity results
- section 8 outlines the peer review process
2. Context for flood and coastal investment
In 2024 we published the National assessment of flood and coastal erosion risk in England. Presently, around 6.3 million properties (homes and businesses) are in areas at risk of flooding from one or a combination of sources:
- rivers
- the sea
- surface water
With climate change, the total number of properties in areas at risk could increase to around 8 million, or around 1 in 4 properties, by mid-century.
Around 3,500 properties are in areas at risk of coastal erosion in the period up to 2055. This increases to about 10,100 properties in the period up to 2105. This assumes shoreline management plans (SMPs) are funded and implemented. SMPs set out a planned approach to managing flood and coastal erosion risk around the coast of England to 2105. If SMP actions are not carried out this would cause the number of properties in areas at risk to be 9 times greater in the period up to 2055, reaching up to 32,800 properties.
We use these risk assessments to:
- inform the flood and coastal investment programme
- prioritise investment in places which face the greatest risk today and into the future
England has a long history of investing in FCERM. Existing schemes continue to prevent flooding to hundreds of thousands of homes and businesses, even during severe weather events. For example, during the 7 named storms of winter 2024 to 2025, around 5,000 properties were reported as flooded. At the same time flood and coastal defences protected around 167,000 properties across the country. These avoided impacts demonstrate the substantial benefits provided through sustained government investment.
Over the past decade, successive FCERM investment programmes have significantly increased the number of properties better protected from flooding and coastal erosion. The 2015 to 2021 programme better protected more than 300,000 properties. Since 2021 a further 150,000 properties have benefited.
Measuring the number of properties better protected or benefitting provides a clear and accessible means of demonstrating the benefits of investment over relatively short parliamentary timescales. Broader societal benefits are also achieved through measures that manage and adapt to a changing climate.
While properties will continue to benefit from investment, the level of flood risk reduction achieved is unlikely to remain constant over the long term. Climate change is increasing the frequency and severity of flooding and coastal erosion. This means:
- rising sea levels
- more intense rainfall
- more frequent storms
At the same time, flood and coastal defence assets naturally deteriorate and age over time. This reduces their effectiveness unless they are maintained, upgraded or replaced. This means that maintaining current levels of flood protection and resilience will become increasingly challenging as future risks grow.
As a result, over longer timescales such as 50 to 100 years, performance measures based solely on the number of properties benefiting become less effective in describing the broader benefits of FCERM investment. Longer-term assessments instead need to consider how investment reduces and avoids flood damages over time. LTIS provides an economic framework for assessing how different levels of investment mitigate future flood and coastal erosion damages across England over the next 100 years.
3. Approach
3.1 What LTIS is
LTIS is a national economic assessment of long-term FCERM in England. It considers the next 50 years (to 2075) and 100 years (to 2125). It explores what can be achieved for different levels of investment, under different climate futures.
LTIS provides an evidence base for long-term FCERM investment and policy options. LTIS also informs the evidence for the long-term objectives in the National FCERM Strategy.
3.2 How LTIS has evolved
LTIS 2009 provided an estimate of the investment needed in traditional FCERM defences to inform risk-based, long-term planning.
LTIS 2014 identified the optimum level of investment in traditional FCERM defences under different climate and development futures.
LTIS 2019:
- added NFM measures
- added PFR
- added a higher climate change scenario
- updated the optimum investment estimate
LTIS 2026 is a major step forward. It:
- uses the Environment Agency’s updated data and information for current and future flood risk (the National Flood Risk Assessment, or NaFRA) and coastal erosion risk (the National Coastal Erosion Risk Map, or NCERM)
- uses up-to-date cost estimates that reflect inflation and other cost changes
- uses the latest climate projections from the UK Climate Projections (UKCP18)
- assesses how much investment is needed for different types of flooding (like rivers, surface water, or the sea)
- looks at flooding in a joined-up way - from whole river catchments to local communities, down to individual properties
- estimates the wider benefits from investment, such as reduced carbon emissions, improvements to nature, and how benefits are distributed in terms of social equity
Previous versions of LTIS considered population growth and development scenarios at a broad, generalised level. However, significant uncertainty remains around the population projections provided by the Office for National Statistics over the next 50 to 100 years. As a result, the LTIS 2026 results presented here do not include population growth or development scenarios.
3.3 Investment terms
We use the following terms to describe how we express the costs, benefits and residual damages of flood and coastal erosion risk investment over a 100‑year period.
Present value (PV) costs
These are the total costs over 100 years with all future spending converted into 2025 prices. This allows us to make a fair comparison of costs occurring at different times. Costs include investment and carbon costs.
Present value (PV) benefits
These are the total benefits over 100 years, with all future benefits converted into 2025 prices. This means they can be directly compared to costs. Benefits are the flood damages avoided.
Long-term annual average cost
This is the average investment per year over the whole 100‑year period, after converting all future costs into 2025 prices.
Net Present Value (NPV)
This is a measure of the total economic value of an investment over time - in the case of LTIS over a 100-year period. It compares the present value of all benefits with the present value of all costs, taking account of when those costs and benefits occur. In simple terms, if the benefits of a project are greater than its costs, the NPV is positive. NPV discounts future costs and benefits. It does this to reflect the principle that costs incurred and benefits realised today are worth more than the same costs or benefits occurring in the future.
Benefit–cost ratio (BCR)
This is the present value benefits divided by the present value costs over a 100-year period. It shows how much benefit is achieved for every pound spent.
Average annual damages (AAD)
This is the average potential economic impact of flooding in any given year. LTIS uses average annual damages to describe:
- benefits - the flood damages avoided due to investment
- residual risk - the economic damages from flooding that remain after investment
LTIS uses AAD estimates from the NaFRA. NaFRA estimates the potential economic costs of flooding to properties in any given year.
The benefits of FCERM investment are measured in terms of the damages avoided. They include:
- property damages, which are around 59% of the total - both residential and non-residential properties (this includes infrastructure such as power stations, water treatment works and electricity substations)
- transport damages, which are around 20% of the total - they include road and rail disruption
- impacts to mental health, risk to life, evacuation and emergency response, which are around 18% of the total
- damage to vehicles and economic costs of disruption to businesses, which are around 2% of the total
- flood damage to natural capital, which is around 1% of the total, with the vast majority of these impacts to agriculture
This is summarised in Figure 1.
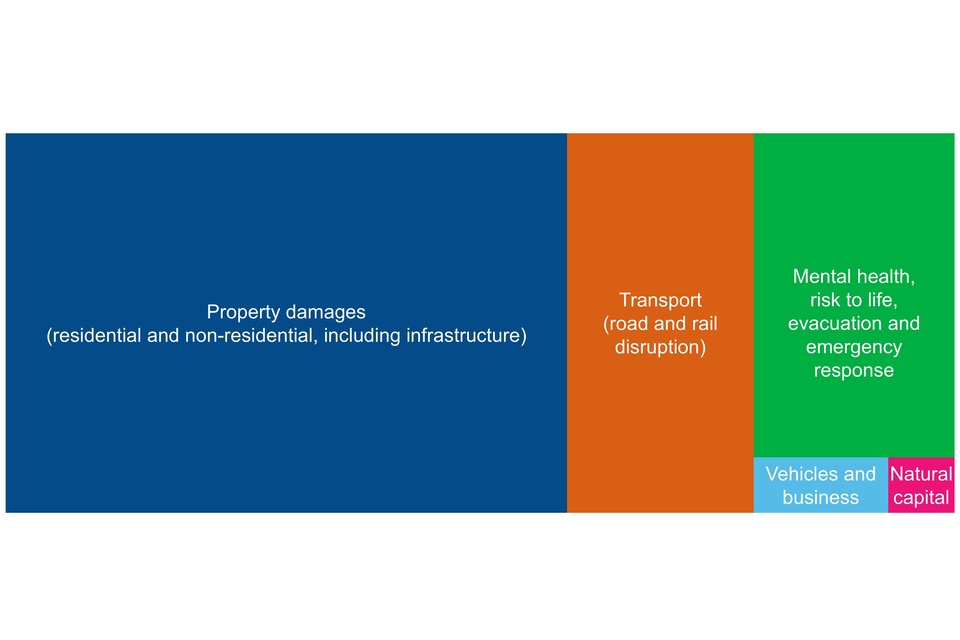
Figure 1: proportions of types of flood damages avoided. Credit project team.
3.4 What LTIS does
Investment options
LTIS is an economic assessment of the costs and benefits of investing in a wide range of FCERM measures that are cost beneficial.
These include:
- significant maintenance activities associated with the refurbishment or replacement of existing assets
- building new defences
- catchment storage and NFM measures
- property flood resilience
- sustainable drainage systems
Each measure has a defined set of investment options that can be combined to identify the best-value combination of investment options tested in LTIS.
Investment options for existing and new defences in LTIS reflect specific standards of protection. This refers to the level of flood severity a defence is designed to withstand and is typically described using an annual exceedance probability:
- for fluvial flooding, LTIS tests the 2% and 1% annual exceedance probabilities (1-in-50 and 1-in-100 annual probabilities)
- for coastal flooding, LTIS tests the 1% and 0.5% annual exceedance probabilities (1-in-100 and 1-in-200 annual probabilities)
Investment options for catchment storage and NFM include:
- woodland planting
- floodplain and river restoration
- leaky barriers
- increasing vegetation
- soil and land management
- runoff management
Investment options for PFR include a:
- basic package which includes air brick covers and demountable door guards
- more substantial package which includes flood resilient doors, raised electrical sockets, and resilient building materials
Investment options for SuDS include:
- swales
- filter drains
- green roofs
- attenuation systems
These are applied according to:
- the area of land available
- other considerations such as property and land use types
LTIS applies these investment options across catchment, asset and property scales to understand the best value combination of investment options.
The analysis considers a mixture of inland, coastal, rural, urban, upland and lowland catchments. For example, rural parts of Devon and Suffolk, dense urban parts of central London, and lowland areas of Hull and Lincolnshire.
Investment decisions
The LTIS optimisation process identifies the combination of investment options that maximises NPV for each level of funding. In practice, this means selecting the portfolio of measures that achieves the greatest overall net economic value for a given level of investment. The measures are listed in the previous section.
Investment decisions within LTIS are informed by both the BCR and NPV. These serve different purposes in the optimisation process. The BCR is used as an initial screening measure to identify options where the estimated benefits exceed the costs. Costs include investment and carbon costs, consistent with current HM Treasury guidance. Measures with a BCR greater than 1 are considered economically beneficial and have positive NPVs. However, in practice, investment decisions may also reflect wider considerations beyond economic performance alone. HM Treasury’s Green Book makes it clear that value for money is not determined solely by BCR. This means investment decisions are not based on economic viability alone.
NPV is then used to determine which combination of investment options provides the greatest total net economic value for a given level of investment. The optimisation process begins by identifying all measures with positive NPVs to establish a hypothetical investment scenario. The model then tests different levels of investment and identifies the combination of investment options that maximises total NPV. In other words, it identifies the portfolio that provides the greatest total economic value for each level of investment. This means that, for any given level of investment, the model ranks investment options by their NPV. It selects options starting with the highest NPV and works down the list until the available budget is allocated.
In practice, investment decisions are influenced by economic benefits as well as:
- local priorities
- practical implementation considerations
- wider policy objectives
As a result, real-world investment choices may differ from the NPV-maximising portfolio identified through LTIS, and flood damage outcomes may also vary. However, the LTIS results indicate that strong economic returns can still be achieved even where investment decisions depart from the economically optimal portfolio.
LTIS also incorporates climate change scenarios to assess how future conditions could affect the:
- preferred combination of measures
- total NPV achieved
- level of residual flood damages remaining over the long term
The outputs from LTIS are a set of optimised national investment scenarios. Each one represents the most economically efficient allocation of resources for a given long-term investment level. This is what makes LTIS distinctive: it provides a consistent, England-wide assessment of how to maximise overall economic value while managing flood and coastal risks over the long term.
LTIS helps us understand how:
- much long-term investment is needed to manage flood and coastal risks
- much economic damage different investment levels avoid
- investment could be allocated across different FCERM measures and different sources of flood risk to maximise value for money
- damages increase because of the deterioration of existing flood defences and climate change
3.5 What LTIS does not do
LTIS assesses the costs and benefits of long-term investment options for specific sources of flood risk, as described above.
LTIS is an England-wide, national-level assessment and therefore does not capture the detailed, long-term cost requirements of specific geographies. Localised requirements are assessed separately through more detailed studies. For example, the cost of replacing major assets such as the Thames Barrier is considered under the Thames Estuary 2100 Plan rather than within LTIS. LTIS includes the costs of maintaining existing flood defence infrastructure, such as:
- embankments
- walls
- other linear flood assets
However, it excludes costs specifically associated with the replacement of barriers such as the Thames Barrier. Any future expenditure on replacing the Thames Barrier would therefore be additional to the 100-year present value costs presented here.
The national investment options exclude the costs and benefits of relocation in areas of significant flooding. Some of these areas are unlikely to be sustainably defended in the long-term. Relocation may be required to support communities at risk to adapt and transition away from them.
LTIS doesn’t consider wider policy or societal priorities, so it is designed to be neutral rather than influenced by them.
LTIS does not:
- account for government policy preferences, future funding priorities, or strategic policy objectives for flood and coastal risk management
- consider how practical it is to deliver the investment - such as whether there are enough skilled workers, available land, or capacity
- assess the optimal timing of FCERM investment within the 100-year timeframe
- assess where the funding would come from or which funding sources would be most appropriate
- account for the costs of routine maintenance in the results presented here. Routine maintenance is regular, planned activities to keep flood defence assets and watercourses operating effectively, including inspections, vegetation management, debris clearance, and minor repairs
3.6 Levels of investment
Current government investment in FCERM is around £1.3 to £1.4bn per year. This estimate is based on recent and planned expenditure:
- £2.65bn across the 2 years from April 2024 to March 2026 equates to approximately £1.3bn per year
- £4.2bn over the 3 years from April 2026 to March 2029 equates to approximately £1.4bn per year
You can read FCERM funding and performance for more information on FCERM expenditure.
The investment scenarios compare different levels of spending over the next 100 years. The highest level is a scenario which includes all investments where the benefits are greater than the costs. This represents a hypothetical maximum in which every cost-effective resilience measure is completed, although it is not expected to reflect a real-world situation. Other scenarios are then expressed as a percentage of this hypothetical maximum (100%).
This maximum is 100% of investment where BCR is greater than 1, but not the maximum possible investment. In practice, investment below a BCR of 1 might be preferred due to wider considerations. The HM Treasury Green Book is clear that value for money means more than only BCR. This means that investment decisions are not based on economic viability alone. It is important to recognise that LTIS is an economic analysis only.
In this summary, we focus on three scenarios:
- 30% investment scenario - broadly similar to the current level of investment
- 60% investment scenario - around double the current investment level
- 100% investment scenario - hypothetical investment level, all investment with BCR greater than 1
Where we refer to a ‘do nothing’ scenario, this assumes that no investment at all is made beyond the essential health and safety maintenance required to keep existing flood and coastal defences safe.
3.7 Levels of investment for coastal erosion
The optimised investment scenarios focus on flood risk.
Separate economic analysis used the NCERM which shows the risk of coastal erosion with and without implementing SMPs. It used the ‘with SMP’ analysis to estimate the investment needs and benefits for coastal erosion over the long term.
Carrying out SMP outcomes for properties at risk of coastal erosion costs £1.4 billion (in 2025 prices) over 50 years. This provides benefits of £4.4 billion in avoided property damage.
The ‘without SMP’ scenario assumes no future investment is made to manage coastal erosion. This would cause the number of properties in areas at risk and economic damages to increase significantly. The total damages over this period would increase to £6.4 billion.
3.8 Understanding uncertainty
LTIS is a complex assessment that uses many different pieces of data, information and assumptions to create the scenarios. This can create uncertainty and bias within the results.
For the first time, LTIS has measured the level of uncertainty in its optimised results. The uncertainty around the main results is quite large and should be considered when using the findings. The uncertainty is greater with higher levels of investment. Results include a range of possible outcomes, so this summary focuses more on the overall scale and direction of change rather than precise figures. For instance, there is:
- a 70% chance that the NPV is within ±60% of the reported figures
- a 70% chance that the PV benefits are within ±50% of the reported figures
- a 70% chance that the PV costs are within ±40% of the reported figures
All values in this summary should therefore be treated as estimates rather than exact values.
There are also uncertainties about what the future will look like over the next 100 years. For example, LTIS accounts for this by testing different projections of climate change. These projections are not forecasts, and LTIS does not comment on how likely each is. Instead, they represent ‘what if?’ scenarios to inform investment decisions.
3.9 Climate change scenarios
Like other UK government departments and agencies, LTIS uses the UKCP18 to explore future climate change. Representative Concentration Pathways (RCPs) are emissions scenarios that describe possible future greenhouse gas emissions based on assumptions about human activity. LTIS uses the RCP8.5 projection. This represents a precautionary planning assumption, reflecting a high-emissions future and ensuring that long-term investment needs can be assessed against future climate uncertainties.
Two climate scenarios are applied to all investment scenarios. The main scenario is the design climate scenario which is used for planning and investment baselines. This is in accordance with advice from the Climate Change Committee to prepare for 2°C warming by 2050, and that 4°C by the end-of-century should be considered as part of effective adaptation planning.
The other scenario is an extreme climate scenario which is used for stress testing. Stress testing helps us to consider whether plans remain robust if climate impacts are more severe than expected.
Design climate scenario
This is used for planning and investment baselines. This scenario represents around:
- 2°C to 2.5°C warming by the 2060s
- 3.5°C to 4°C warming by 2100
- 0.5m sea level rise by 2060
- 1m sea level rise by 2100
- 20% to 30% higher river flows by the 2080s
- 10% to 30% more rainfall by the 2080s
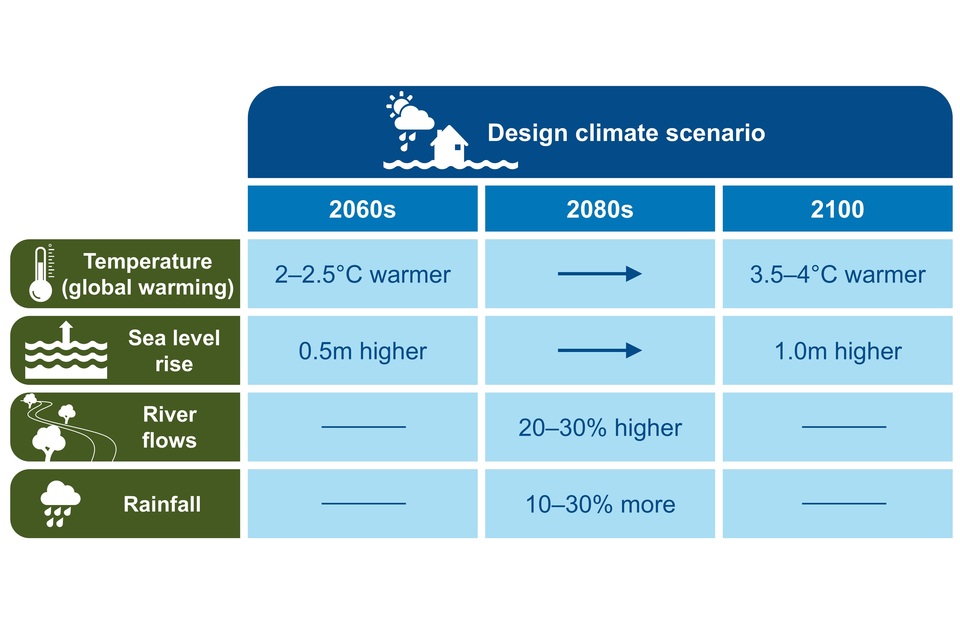
Figure 2: design climate scenario represented in LTIS. Credit project team.
Extreme climate scenario
This is used for stress testing. This scenario represents around:
- 2.5°C to 3°C warming by the 2060s
- 4°C to 5°C warming by 2100
- 0.6m sea level rise by 2060
- 1.2m sea level rise by 2100
- 30% higher river flows by the 2080s
- 40% to 60% more rainfall by the 2080s
These climate change scenarios are consistent with the HM Treasury Green Book. They also reflect those adopted in the:
- climate change allowances guidance the Environment Agency uses for flood and coastal risk projects, schemes and strategies
- long-term shoreline management plans which look out to the end of the century
LTIS is aligned with wider UK infrastructure practice through its use of:
- UKCP18 projections
- the stress testing of high-end climate scenarios
It adopts a risk-based approach that considers a range of plausible futures rather than relying on a single trajectory. This is similar to the approach taken by other sectors such as:
- rail
- highways
- energy
- water
- nuclear
- telecommunications
The results from the investment scenarios considering both design and extreme climate change are presented in section 4.
4. Optimised investment scenarios with climate change
This section outlines the optimised investment scenarios and explores results for both design and extreme climate change.
4.1 Value for money
Across all scenarios, the NPV remains strongly positive. This shows that investment provides substantially greater benefits than the costs over the 100-year appraisal period. As the level of investment increases, more measures are implemented, including options with a lower BCR - though always a BCR greater than 1.
This is shown in figure 3 and table 1.
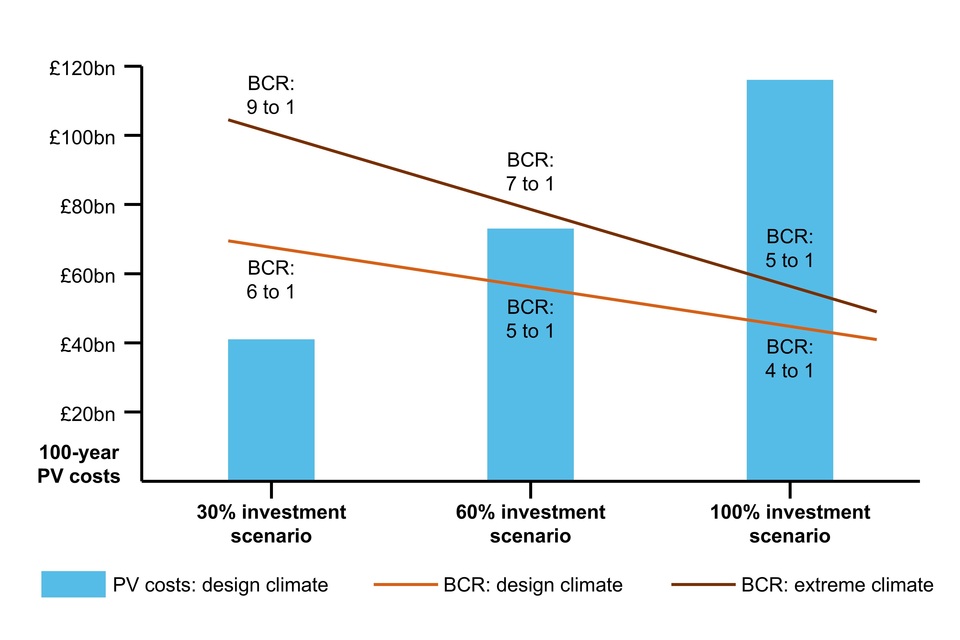
Figure 3: BCR results for 3 optimised investment scenarios: 30%, 60% and 100%. Credit project team.
| Optimised investment scenario | 100-year PV costs (£bn) | Long-term annual average cost (£bn) | NPV (£bn) | BCR |
|---|---|---|---|---|
| 30% | 41 (46) | 1.4 (1.6) | 191 (372) | 6 (9) |
| 60% | 73 (83) | 2.5 (2.8) | 282 (474) | 5 (7) |
| 100% | 116 (131) | 3.9 (4.4) | 305 (504) | 4 (5) |
Table 1: results for 3 optimised investment scenarios: 30%, 60% and 100%. Results are for the design climate scenario, with results for the extreme climate scenario in brackets.
The ranges reflect the design climate change scenario and the extreme climate change scenario. Under the extreme scenario, PV costs, long-term annual average costs, NPV and BCR are all higher. This reflects increased flood damages avoided through investment.
Under the design climate change scenario the:
- 30% investment scenario has a long-term annual average cost of £1.4 billion per year, with an NPV of £191 billion over 100 years
- 60% investment scenario has a long-term annual average cost of £2.5 billion per year, with an NPV of £282 billion over 100 years
- 100% investment scenario has a long-term annual average cost of £3.9 billion per year, with an NPV of £305 billion over 100 years
The LTIS analysis indicates that all investment scenarios continue to provide strong value for money over the long term. There are high BCRs across both climate change scenarios. Under the design climate change scenario, the BCR is 6:1 for the 30% investment scenario compared to 5:1 for the 60% investment scenario.
These positive BCRs are achieved despite rising costs over time. Since 2015, inflation has increased by approximately 40%, while the cost per property better protected has grown at an even faster rate. Nevertheless, the benefits generated by the investment scenarios continue to substantially outweigh their costs, demonstrating the strong economic justification for long-term investment.
Overall, across all scenarios, every £1 invested in FCERM provides approximately £4 to £9 in avoided damages to property, infrastructure, and the environment over 100 years.
4.2 Investment across FCERM measures
As the level of optimised investment increases, the proportion of investment across the different FCERM measures tested in LTIS changes. The proportions do not change much in different climate scenarios. This is shown in figure 4, table 2 and table 3.
Investments are grouped by:
- catchment scale measures, for example NFM and flood storage
- asset system scale measures, for example maintaining, raising and building new fluvial and coastal flood defences and SuDS for surface water flooding
- property scale measures, for example PFR
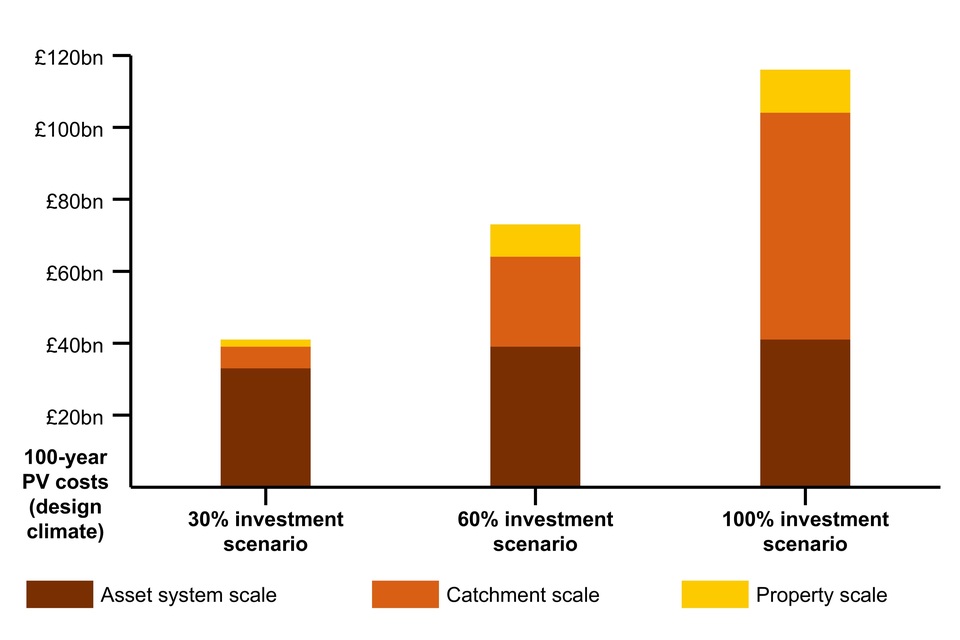
Figure 4: total investment across 3 scales of FCERM measures for the 30%, 60% and 100% investment scenarios over 100 years (design climate). Credit project team.
| Optimised investment scenario | 100-year PV costs for catchment scale measures (£bn) | 100-year PV costs for asset system scale measures (£bn) | 100-year PV costs for property scale measures (£bn) | Total 100-year PV costs (£bn) |
|---|---|---|---|---|
| 30% | 6 (5) | 33 (37) | 2 (4) | 41 (46) |
| 60% | 25 (23) | 39 (48) | 9 (12) | 73 (83) |
| 100% | 63 (64) | 41 (50) | 12 (17) | 116 (131) |
Table 2: total investment across 3 scales of FCERM measures for the 30%, 60% and 100% investment scenarios over 100 years. Results are for the design climate scenario, with results for the extreme climate scenario in brackets.
| Optimised investment scenario | Proportion of 100-year PV costs for catchment scale measures | Proportion of 100-year PV costs for asset system scale measures | Proportion of 100-year PV costs for property scale measures |
|---|---|---|---|
| 30% | 14% (12%) | 80% (80%) | 6% (8%) |
| 60% | 34% (28%) | 54% (58%) | 12% (14%) |
| 100% | 54% (49%) | 35% (38%) | 11% (13%) |
Table 3: proportion of total investment across 3 scales of FCERM measures for the 30%, 60% and 100% investment scenarios over 100 years. Results are for the design climate scenario, with results for the extreme climate scenario in brackets.
An optimal mix of FCERM measures is needed for adapting to the climate challenges of the future. LTIS shows that when investment is optimised, the balance of spending across these measures shifts as total funding changes.
At current investment levels, funding is concentrated on maintaining and upgrading existing defences. These typically provide higher benefit-cost ratios (BCRs). As total investment increases, a greater share is directed towards NFM and PFR, particularly to address surface water flood risk. This reflects the lower BCRs of surface water interventions, which are only selected at scale once options for higher-value fluvial and coastal measures have been exhausted.
This can be observed when comparing the 30% and 60% investment levels under the design climate change scenario.
The 30% investment scenario (design climate change)
LTIS shows the mix of FCERM measures in the optimised 30% investment scenario aligns closely with the proportions expected as a result of the 2025 FCERM funding policy.
The profile of spending is weighted towards traditional asset-based approaches, including maintaining, raising and building new defences (around 80% of total investment). The rest is directed to NFM (14%) and PFR (6%).
NFM is relatively targeted, covering around 80,000 hectares. This is around 1% of England’s land area, or roughly half the size of Greater London. This implies limited land-use change, with interventions focused on important locations where they are most effective.
PFR is also targeted, reaching around 108,000 properties, equivalent to about 2% of those at risk of flooding. While national baseline data on current PFR installations is limited, this still represents an increase compared to current uptake. This is currently estimated to be in the low tens of thousands.
The 60% investment scenario (design climate change)
By contrast, the 60% investment scenario shows a clear shift in the balance of investment.
In the 60% investment scenario, asset-based approaches still account for the largest share but their proportion falls to around 54%. More funding is directed towards NFM and PFR. At this level, NFM rises to around 34% of total investment and PFR to around 12%.
This represents a significant expansion in the use of NFM, increasing to approximately 480,000 hectares. This is around 4% of England’s land area, comparable in size to Norfolk. At this scale, NFM moves beyond targeted interventions to more widespread adoption across catchments. However, it is still broadly compatible with productive agricultural use.
PFR also expands substantially, reaching around 420,000 properties, equivalent to about 7% of those at risk of flooding.
Overall, the shift from 30% to 60% investment reflects a transition from an investment programme dominated by asset-based measures to a more balanced approach. This places greater emphasis on catchment-scale and property-level resilience.
4.3 Investment across sources of flooding
As total optimised investment increases, the share allocated to coastal, fluvial, and surface water flooding changes. This pattern is broadly consistent across different climate scenarios. This is shown in figure 5, table 4 and table 5.
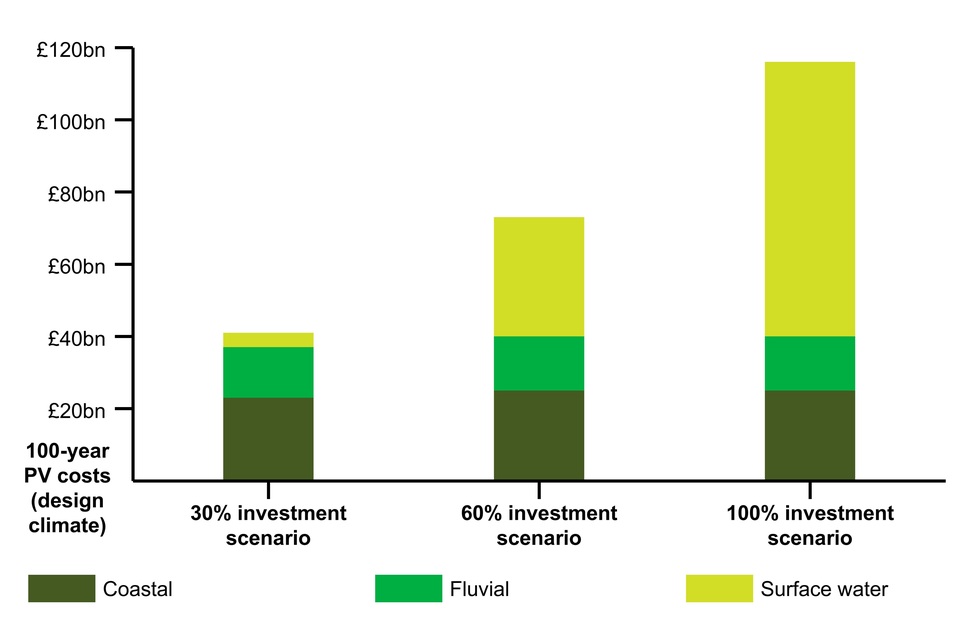
Figure 5: total investment across 3 sources of flood risk for the 30%, 60% and 100% investment scenarios over 100 years (design climate). Credit project team.
| Optimised investment scenario | 100-year PV costs for coastal flood risk (£bn) | 100-year PV costs for fluvial flood risk (£bn) | 100-year PV costs for surface water flood risk (£bn) | Total 100-year PV costs (£bn) |
|---|---|---|---|---|
| 30% | 23 (30) | 14 (15) | 4 (2) | 41 (46) |
| 60% | 25 (31) | 15 (16) | 34 (36) | 73 (83) |
| 100% | 25 (31) | 15 (16) | 76 (84) | 116 (131) |
Table 4: total investment across 3 sources of flood risk for the 30%, 60% and 100% investment scenarios over 100 years. Results are for the design climate scenario, with results for the extreme climate scenario in brackets.
| Optimised investment scenario | Proportion 100-year PV costs for coastal flood risk | Proportion 100-year PV costs for fluvial flood risk | Proportion 100-year PV costs for surface water flood risk |
|---|---|---|---|
| 30% | 57% (64%) | 34% (32%) | 9% (4%) |
| 60% | 34% (37%) | 20% (19%) | 46% (44%) |
| 100% | 21% (24%) | 13% (12%) | 66% (64%) |
Table 5: proportion of investment across 3 sources of flood risk for the 30%, 60% and 100% investment scenarios over 100 years. Results are for the design climate scenario, with results for the extreme climate scenario in brackets.
Continuing current spending levels would prioritise coastal and fluvial flooding due to higher BCRs earlier in the LTIS optimisation process. As these higher-value opportunities are progressively exhausted, investment shifts towards surface water flood risk which typically has lower BCRs. This shift becomes more pronounced beyond the 60% scenario.
Overall, coastal and fluvial measures are prioritised first, while surface water measures become increasingly prominent as higher-return opportunities are exhausted. This has implications for changes in damages outlined in section 5, because additional investment beyond the 60% scenario reduces damages at a lower rate.
In the 30% investment scenario, the value and proportion of investment for surface water decreases in the extreme climate scenario, compared to the design scenario. This is a consequence of increases in investment for coastal flood risk being prioritised even more with extreme climate change.
Fluvial flooding
In the 30% investment scenario, fluvial flooding accounts for approximately one-third of total investment (£14bn) in the design climate scenario.
As total investment increases, the absolute level of investment in fluvial measures remains broadly stable. However, its share declines as additional funding is allocated to other sources of flood risk. In the 60% investment scenario, fluvial flooding accounts for around one-fifth of total investment (£15bn) in the design climate scenario.
Overall, fluvial investment remains relatively stable in absolute terms across scenarios. However, its proportional share decreases as higher levels of investment are increasingly directed towards surface water flooding.
Surface water flooding
LTIS shows that these measures can help reduce damages from surface water flooding:
- natural flood management
- sustainable drainage systems
- property flood resilience
However, these measures typically provide lower returns on investment compared to fluvial and coastal interventions. This is because surface water flooding generally causes smaller damages due to shallower flood depths. This is reflected in relatively low benefit-cost ratios (BCRs) for surface water measures from around 2.5:1, compared to BCRs from around 4:1 for fluvial measures and from around 7:1 for coastal measures. This is consistent with the National Infrastructure Commission (2022) findings.
Across both climate scenarios, investment in surface water flooding increases significantly from the 30% to 100% investment levels. In the 30% investment scenario, surface water flooding accounts for less than a tenth of total investment. As total investment increases, a substantially greater share is directed towards surface water flooding. In the 60% investment scenario, surface water accounts for just under a half of total investment (£34bn).
Overall, investment at current levels provides limited outcomes for surface water risk reduction. Within LTIS, surface water flooding is only addressed at scale once optimised investment reaches around the 60% investment scenario. This is because higher-BCR coastal and fluvial opportunities are progressively exhausted, and additional funding is then reallocated to lower-BCR surface water measures.
Coastal flooding
Investment options for coastal flooding align with the SMPs, which define sustainable management approaches for each stretch of coast over the course of this century. LTIS applies these options within a national economic optimisation framework, using benefit-cost analysis to allocate investment. In contrast, SMPs consider a wider range of factors beyond economic efficiency, including:
- land ownership
- environmental constraints
- community preferences
- practical implementation opportunities
In practice, these factors also play an important role in shaping how SMPs are implemented.
In LTIS, investment in coastal flooding remains relatively stable in absolute terms as total investment increases from the 30% to the 100% investment scenario. This happens across both the design and extreme climate scenarios.
In the 30% investment scenario, coastal flooding accounts for the largest share of investment, at over half of total investment (£23bn) in the design climate scenario.
As total investment increases, although the absolute value of investment in coastal measures remains broadly similar, its proportion of total investment declines. This happens as additional funding is allocated to other flood sources. In the 60% investment scenario, coastal flooding accounts for just over a third of total investment (£25bn).
Overall, coastal investment remains relatively stable in absolute terms. Its share of total investment decreases as higher levels of funding are progressively directed towards other flood risk sources, particularly surface water flooding.
Coastal defence vulnerability
Separate, supplementary analysis undertaken for LTIS considers the vulnerability of the existing coastal defence system to sea level rise. This is done outside of the investment analysis and enables us to explore rises in sea level greater than those in the extreme climate change scenario.
By 2100, approximately 11-14% of existing coastal defences are projected to become vulnerable to overtopping or damage during storms. This is with sea level rise of around 0.5 to 1.0 metres. Under more severe sea level rise scenarios exceeding 1 metre, vulnerability continues to increase. At 1.5 metres sea level rise approximately 23% of existing coastal defences are vulnerable, rising to 31% at 2 metres sea level rise. The damages associated with this vulnerability increase sharply above 1 metre sea level rise.
5. Changes in flood damages over time
5.1 Overall damages from all sources of flooding
The LTIS analysis demonstrates that sustained investment in flood risk management can significantly slow the growth in flood damages over the coming decades. However, the extent to which damages can be maintained at or close to present-day levels depends on both investment levels and climate change severity.
Over the next 25 years (to 2050), the 60% investment scenario is broadly able to maintain overall flood damages at around present-day levels. This is under the design climate change scenario. This reflects the availability of relatively low-cost, high-value measures that can still provide substantial reductions in flood risk over the near term. By comparison, under a ‘do nothing’ scenario, overall damages are projected to increase by around 2.9 times over the same 25-year period.
Looking further ahead over the next 50 years (to 2075), maintaining flood damages close to present-day levels becomes increasingly challenging. Under the 60% investment scenario, overall damages increase to around 1.1 times present-day levels under the design climate change scenario. By comparison, under a ‘do nothing’ scenario, overall damages are projected to increase by around 4.2 times over the same 50-year period.
Under the LTIS optimisation approach, over 50 years, confidence in maintaining overall damages close to present-day levels increases as investment progressively rises between the 60% and 100% scenarios. This is under the design climate change scenario.
Over the next 100 years (to 2125), climate change, particularly sea level rise, increasingly causes higher flood damages across all investment scenarios. Continued investment remains highly beneficial in slowing the rate of growth in damages, but it becomes progressively more difficult to offset long-term increases in risk. This is shown in table 6.
| Optimised investment scenario | Long-term annual average investment (£bn) | Change in damages over 25 years | Change in damages over 50 years | Change in damages over 100 years |
|---|---|---|---|---|
| Do nothing | Not applicable | 2.9× (3.6×) | 4.2× (5.6×) | 11× (22×) |
| 30% | 1.4 (1.6) | 1.2× (1.7×) | 1.4× (2.0×) | 2.3× (3.8×) |
| 60% | 2.5 (2.8) | 1.0× (1.3×) | 1.1× (1.5×) | 1.9× (3.2×) |
| 100% | 3.9 (4.4) | 0.8× (1.1×) | 1.0× (1.3×) | 1.8× (3.0×) |
Table 6: changes in overall flood damages under different optimised investment scenarios. Results are for the design climate scenario, with results for the extreme climate scenario in brackets.
5.2 Change in damages by source of flood risk
The LTIS analysis highlights substantial differences between the 3 principal sources of flood risk:
- fluvial
- surface water
- coastal flooding
Fluvial flood risk
Fluvial flooding is the only source of flood risk where sustained optimised investment can reduce damages below present-day levels over the long term. This reflects the continued effectiveness of fluvial flood risk management measures under future climate conditions.
Under the 30% investment scenario, over 50 years, damages from fluvial flooding are around 0.7 times present-day levels under the design climate change scenario (one third lower). By comparison, under a ‘do nothing’ scenario, damages from fluvial flooding are projected to increase by around 2.6 times over the same 50-year period.
Increasing investment beyond the 30% scenario achieves relatively limited additional reductions in fluvial damages. This reflects the LTIS optimisation approach, under which the most cost-beneficial opportunities to reduce fluvial flood risk are assumed to be implemented early in the investment programme. Additional investment is therefore increasingly directed towards other sources of flood risk, particularly surface water flooding.
Overall, the analysis indicates that fluvial flood risk remains relatively manageable through sustained investment in flood protection and resilience measures.
Surface water flood risk
Surface water flooding presents a substantially greater long-term challenge. The analysis suggests that mitigation of surface water flooding will increasingly depend on investment in SuDS, wider urban design adaptation, and PFR measures in addition to traditional flood defences.
Even with sustained and optimised investment, damages continue to rise over time. This is due to increasing rainfall intensity and growing pressure on urban drainage systems.
Under the 30% investment scenario, over 50 years, damages from surface water flooding are around 2.1 times present-day levels under the design climate change scenario.
Higher levels of investment can slow the rate of increase but cannot fully prevent growth in damages. Under the 60% investment scenario, over 50 years, damages from surface water flooding increase to around 1.4 times present-day levels under the design climate change scenario.
By comparison, under a ‘do nothing’ scenario, damages from surface water flooding are projected to increase by 2.2 times over the same 50-year period.
The economic benefits per pound spent to reduce surface water flood risk are significantly lower than those associated with fluvial and coastal flooding. As a result, additional investment in surface water flood risk management delivers more modest reductions in flood damages.
Coastal flood risk
Coastal flooding becomes the dominant driver of long-term flood damages within the LTIS analysis. Under all climate change scenarios, we can expect to see a significant rise in sea levels after 2060. Impacts will become increasingly pronounced as we approach the end of the century. Rising sea levels progressively reduce the effectiveness of existing coastal defences and increase both the frequency and severity of coastal flooding events.
Under the 30% investment scenario, over 50 years, damages from coastal flooding are around 1.5 times present-day levels under the design climate change scenario.
Even under the 60% investment scenario, over 50 years, damages from coastal flooding rise to around 1.4 times present-day levels under the design climate change scenario.
By comparison, under a ‘do nothing’ scenario, damages from coastal flooding are projected to increase by around 12 times over the same 50-year period.
Beyond the end of the century, coastal flood damages are projected to increase substantially as sea levels continue to rise. In the 100% investment scenario, over 100 years, annual damages from coastal flooding are estimated to reach more than 5 times present-day levels under the design climate change scenario.
These findings underline the scale of the long-term adaptation challenge facing coastal areas over the period to 2125. Continued investment remains essential to slow the growth in damages and maintain protection over coming decades. However, that investment alone is unlikely to fully offset the impacts of long-term sea level rise. In many coastal locations, adaptation and transition planning are likely to become increasingly important alongside traditional flood defence approaches.
5.3 Overall conclusions for changes in flood damages
The LTIS results demonstrate that sustained investment in flood risk management can substantially reduce the growth in future flood damages over the next 25 to 50 years.
Maintaining damages near present-day levels becomes increasingly dependent on both investment levels and climate change severity. In summary, under the design climate change scenario, over:
- 25 years, a 60% investment scenario is broadly sufficient to maintain overall damages close to present-day levels
- 50 years, confidence in maintaining overall damages close to present-day levels improves as investment progressively rises between the 60% and 100% scenarios
The analysis also highlights clear differences between flood sources:
- damages from fluvial flooding remain comparatively manageable through continued investment in flood defences and resilience measures
- increased investment can help slow the growth of damages from surface water flooding but it cannot prevent them from rising, reflecting the growing pressures on urban drainage and rainfall management systems
- coastal flooding becomes the dominant long-term cause of damages over the next 50 to 100 years and will increasingly require coastal adaptation and transition planning
6. Natural capital
Natural capital is the stock of natural assets like:
- soils
- agricultural land
- water
- habitats
Together they provide:
- services such as carbon storage, water regulation, habitat provision, recreation
- improved resilience to flooding and climate change
In economic assessments, these services can be measured and valued alongside traditional economic benefits. For the first time in a national-scale flood economics assessment, we have evaluated natural capital alongside property and wider economic damages and benefits.
LTIS has assessed:
- the benefits to natural capital through FCERM measures
- the negative impact of flooding on natural capital
Across all investment scenarios assessed, the benefits to natural capital provided through FCERM measures are greater than the negative impacts caused by flooding.
Natural capital losses resulting from flooding are primarily associated with damage to agricultural land used for food production. Overall, these losses account for approximately 1% of the total AAD caused by flooding from all sources.
LTIS shows most natural capital benefits through investment in FCERM measures come from:
- reduced air pollution
- increased biodiversity
- improved water quality
These benefits are mostly provided by:
- NFM measures
- catchment storage
- sustainable drainage systems
At around current levels of investment (the 30% scenario), the natural capital benefits provided through FCERM investment contribute 2% of benefits. Over a 100-year period, this equates to approximately £5 billion in benefits compared with around £2 billion in damages. The proportion of benefits increases with greater levels of investment (which enable more NFM).
7. Social equity
In addition to the economic outcomes of the investment scenarios, LTIS has considered in relative terms the outcomes of the investment scenarios for socially vulnerable communities.
Analysis of flood risk exposure and social deprivation found inequalities in exposure to flooding. There were 2 main findings:
- people who are more socially deprived experience more flood risk in England than people who are less socially deprived
- based on economics alone, optimised investment scenarios tend to direct investment towards the least socially vulnerable areas
Coastal communities experience some of the worst inequality. The LTIS analysis shows a lower proportion of investment over the long term reaches the most vulnerable coastal communities. This is compared to those vulnerable to fluvial and surface water flooding.
This is also a recognised challenge for coastal erosion. The NCERM shows that:
- nearly 20,000 properties in England may still face erosion risk by 2100
- 1 in 6 of these homes are in the country’s most deprived areas
LTIS has not explored reasons for these challenges. Similar findings about the correlation between social deprivation and the likelihood of flooding have been published in the past. These include:
- Present and future flood vulnerability, risk and disadvantage - Joseph Rowntree Foundation (2017)
- Social deprivation and the likelihood of flooding - Environment Agency (2022)
- Flood risk and social deprivation research - Environment Agency (2026)
The 2026 research shows that more than 2.5 million people both live in highly deprived areas and are vulnerable to flooding.
Government’s FCERM funding policy (2025) helps to mitigate this by setting a strategic funding objective directing investment to the most deprived areas. It requires that at least:
- 20% of FCERM investment will be directed to the most deprived quintile
- 40% of FCERM investment will be directed to the 2 lowest quintiles combined
8. Peer review process
LTIS 2026 has undergone an exceptionally high level of both internal and independent scrutiny. This provides strong assurance that its methods and findings are robust, credible, and grounded in the best available evidence.
This scrutiny has operated at 2 levels, which are:
- a detailed review of specific topic areas
- a wider, programme-level assessment
At the detailed level, over 100 experts reviewed individual subject areas. Experts included:
- representatives from the Environment Agency, Defra and Natural England
- nine Independent Technical Experts (ITEs)
This involved close examination of:
- method development - how the analytical methods were designed, including whether they were appropriate and aligned with best practice
- input data - the quality, relevance, and reliability of the data used in the analysis
- documented assumptions and approaches - the main assumptions made and the overall approach taken, including whether these were reasonable and consistent
- early investment results (including benefits and costs) - the initial findings on the proposed investments, including the estimated costs and expected benefits
Draft topic area reports were shared iteratively, and feedback incorporated through multiple rounds of refinement.
At the programme level, the nine ITEs fed into an overall peer review led by Jaap Flikweert. This reflected on the strengths and weaknesses of the work. The review commented on:
- technical accuracy
- clarity
- completeness
- robustness of conclusions
- evidence supporting results
- bias and uncertainty
- opportunities for improvement
The review concluded that LTIS ‘is very impressive technically. Its development has followed a robust process, and its inclusion of stretch topics illustrated its ambition to explore step-change approaches’.
The Independent Technical Experts were:
- Jaap Flikweert (Royal Haskoning) - Chair of group
- Frans Klijn (Deltares)
- Ferdinand Diermanse (Deltares)
- Jarl Kind (Dewaterwerkers)
- Mike Panzeri (HR Wallingford)
- Daniel Bernet (Moody’s)
- Paul Sayers (Sayers and Partners)
- Fola Ogunyoye (Tjay Consulting)
- Ilona Kirhenšteine (Wood Group)
- Kim Yates (Mott MacDonald)