National assessment of flood and coastal erosion risk in England 2024
Updated 22 January 2025
Applies to England

© Crown copyright 2025
This publication is licensed under the terms of the Open Government Licence v3.0 except where otherwise stated. To view this licence, visit nationalarchives.gov.uk/doc/open-government-licence/version/3 or write to the Information Policy Team, The National Archives, Kew, London TW9 4DU, or email: psi@nationalarchives.gov.uk.
Where we have identified any third party copyright information you will need to obtain permission from the copyright holders concerned.
This publication is available at https://www.gov.uk/government/publications/national-assessment-of-flood-and-coastal-erosion-risk-in-england-2024/national-assessment-of-flood-and-coastal-erosion-risk-in-england-2024
1. Executive Summary
1.1 Overview
Understanding of current and future flood and coastal erosion risk is vital to ensuring that policy makers, practitioners and communities are ready to adapt to a changing climate.
We have built a new National Flood Risk Assessment (NaFRA). It provides a single picture of current and future flood risk from rivers, the sea and surface water for England. The last full update to NaFRA was in 2018. It uses the best available data both from the Environment Agency and local authorities. Our new data on depth of flooding also provides more information to help people understand the potential flood hazard they could face.
Alongside this, we have also updated our National Coastal Erosion Risk Map (NCERM). The last update to NCERM was in 2017. Our new NCERM provides the most up to date national picture of current and future coastal erosion risk for England. It uses the best available evidence from the National Network of Regional Coastal Monitoring Programmes.
For the first time, both NaFRA and NCERM account for the latest UK Climate Projections (UKCP18) and the potential impact of climate change on flood and coastal erosion risk.
1.2 Reasons behind the changes
There are a variety of reasons for the changes to flood and coastal erosion risk seen in this report. This includes:
- both NaFRA and NCERM using much better data and improved modelling methodologies
- an improved assessment of the risk to properties, infrastructure and agricultural land
The changes we are seeing in the total number of properties in areas at risk of surface water flooding doesn’t reflect a real-world increase in risk. It is almost entirely due to improvements in:
- data
- modelling
- use of technology
A huge step in our understanding is how we can now incorporate the UK Climate Projections into our assessment of future flood and erosion risk. Under future warming scenarios, the projection of properties in areas at flood risk and coastal erosion risk is likely to increase.
1.3 How our assessment of flood risk is changing
The new NaFRA shows that around 6.3 million properties (homes and businesses) in England are in areas at risk of flooding from one or a combination of sources:
- rivers
- the sea
- surface water
With climate change the total number of properties in areas at risk from rivers and the sea or surface water could increase to around 8 million by mid-century. In other words, 1 in 4 properties in England will be in areas at risk of flooding from rivers and the sea or surface water by mid-century.
There are wide regional variations in flood risk. From early 2025 we are making the detailed local mapping available through GOV.UK digital services. This will help our customers understand what this new information means for them.
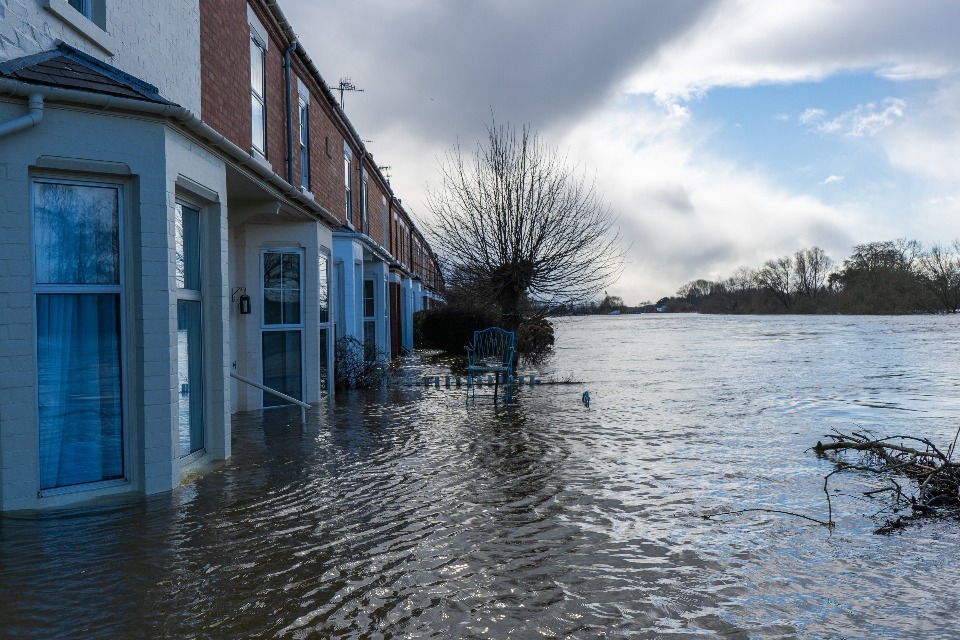
Flooded riverside. Credit: Flood Re
1.4 Properties in areas at risk of flooding from rivers and the sea
- total properties in areas at risk of flooding from rivers and the sea is around 2.4 million – slightly fewer than our previous assessment (see section 4.1)
- properties in areas at high risk of flooding from rivers and the sea increases to 367,900 – an 88% increase from our previous assessment (see section 4.1)
- of properties in areas at high risk, 163,300 are likely to flood to depths of 30cm or higher from rivers and the sea – over two fifths (44%) of all properties in areas at high risk
- with climate change, we estimate the total number of properties in areas at risk of flooding from rivers and the sea will increase from 2.4 million to around 3.1 million – a 27% increase between 2036 and 2069
- with climate change, properties in areas at high risk of flooding from rivers and the sea could increase to 637,600 – a 73% increase between 2036 and 2069
- of properties in areas at high risk, 288,800 could flood to depths of 30cm or higher from rivers and the sea between 2036 and 2069 – a 77% increase from the present day
1.5 Properties in areas at risk of flooding from surface water
- total properties in areas at risk of flooding from surface water is around 4.6 million - a 43% increase on our previous assessment (see section 4.1)
- properties in areas at high risk of flooding from surface water increases to about 1.1 million - 3 times greater than our previous assessment (see section 4.1)
- of properties in areas at high risk, 184,200 properties are likely to flood to depths of 30cm or higher from surface water – this is 1 in 6 (17%) of all properties in areas at high risk of flooding
- 83% of properties in areas at high risk are in areas with likely flood depths of less than 30cm – this suggests that the typical impacts from surface water flooding are likely to occur at shallower levels than flooding events from rivers and the sea
- with climate change, we estimate that the total number of properties in areas at risk of flooding from surface water could increase from 4.6 million to 6.1 million – a 30% increase between 2040 and 2060
- with climate change, properties in areas at high risk of flooding from surface water could increase to 1.8 million – a 66% increase between 2040 and 2060
- of properties in areas at high risk, 288,400 properties could flood to depths of 30cm or higher from surface water between 2040 and 2060 – an increase of more than half (57%) from present day
1.6 Flood risk to infrastructure and agriculture
Around a third (38%) of all roads are in areas at risk from one or more sources of flooding. If we apply the climate change projections the percentage of the road network in areas at risk rises to 46% by the mid-century. This is an increase of 21%.
Around a third (37%) of all railways are in areas at risk from one or more sources of flooding. If we apply the climate change projections the percentage of the rail network in areas at risk rises to 54% at risk by the mid-century. This is an increase of around half.
About a third (34%) of water pumping stations and treatment plants are also in areas at risk of flooding from multiple sources.
Around 13% of all agricultural land and about 59% of grade 1 agricultural land is at risk of flooding from rivers and the sea. If we apply the climate change projections, this rises by 5% by mid-century.
1.7 How our assessment of coastal erosion risk is changing
The new NCERM shows that 3,500 properties are in areas at risk of coastal erosion in the period up to 2055. This increases to about 10,100 properties in the period up to 2105. About half of these properties are residential. The other half are non-residential properties such as:
- schools
- hospitals
- retail businesses
- leisure businesses
Our assessment of properties in areas at risk assumes that funding and implementation of all actions in Shoreline Management Plans (SMPs) for the coast are delivered. SMPs set out a planned approach to managing flood and coastal erosion risk around the coast of England to 2105.
In the worst case scenario SMPs actions would not be carried out and no future investment made to manage coastal erosion. This would cause the numbers of properties in areas at risk to increase significantly. The total number of properties in areas at erosion risk would be 9 times greater in the period up to 2055, reaching up to 32,800 properties.
The new NCERM shows that coastal erosion risk will increase with climate change. This is mainly due to the effects of sea level rise on erosion rates. Even with SMPs delivered there could be 19,700 properties in areas at risk of erosion in the period up to the end of the century. Without any of the investment set out in SMPs being delivered, this figure is expected to be 5 times greater.
1.8 Next steps
We are committed to a rolling programme of data improvements. This will let us consider the latest local modelling evidence and national data improvements.
We are also developing a new flood and coastal investment programme using the best available evidence. This includes the new NaFRA and new NCERM. This will allow us to assure that our investment programmes are prioritising the places and projects where current and future risk is greatest.
2. The context: flooding and coastal erosion risk in a changing climate
Communities are on the frontline of flooding and coastal erosion. We have lived with and seen the effects of flooding and coastal erosion over many decades. This includes devastating events such as the east coast tidal surge in 1953 which resulted in hundreds of fatalities.
We know that flooding can cause significant economic damages to:
- people
- businesses
- landowners
- infrastructure
For instance, following the flooding caused by Storms Ciara and Dennis in 2020, it was estimated that the average insurance claim per household was £32,000.
We estimate the total economic damages for all floods between January 2016 and November 2019 in England and Wales to be between £504 million and £924 million. The best estimate is £708 million in 2024 prices. Research also shows that flooding can have severe long-lasting mental health consequences including:
- depression
- anxiety
- post-traumatic stress disorder (PTSD)
April 2023 to March 2024 saw wet, windy and stormy weather across the country. There were 13 named storms compared to just one in 2022 to 2023 and 7 in 2021 to 2022.
Over winter 2023 to 2024, storms Babet, Ciarán and Henk impacted hundreds of homes, businesses and farms. During:
- storms Babet and Ciarán we issued over 750 flood warnings including 5 severe flood warnings
- storm Babet, our Flood Warning System (FWS) recorded its busiest day ever - more than 5,500 new users registered for warnings and almost 400,000 messages were sent in a single day
- storm Henk several of our biggest river systems - the Trent, Thames, Severn and Avon - saw record levels, or close to record levels, as they drained huge volumes of rain from their catchments
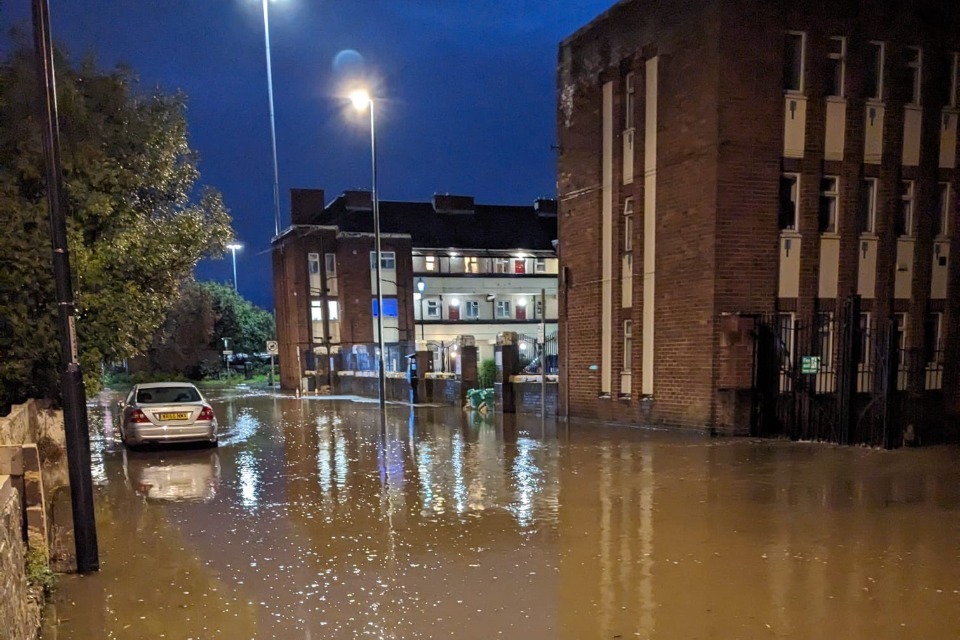
Chesterfield, Derbyshire. Storm Babet - October 2023. Credit: Environment Agency
Our flood defences operated well during the winter 2023 to 2024 storms, protecting around 250,000 properties. Sadly around 5,000 properties were flooded. This protection is a result of the investments we have made in flood and coastal defences.
The frequency and severity of flooding and storm surges will get worse with climate change. To keep pace with a changing climate, we need to both cut emissions and adapt to climate risks.
Even if we reach net zero, we can still expect more intense rainfall, more frequently.
In all future climate scenarios, we will experience a continued rise in sea level well into the next century. For example, by 2100:
- extreme once-a-century sea-level events are expected to become annual
- UK sea levels could rise by over a metre
The Intergovernmental Panel for Climate Change have advised that a global sea level rise of 2 metres by 2100 cannot be ruled out.
This means it is essential we prepare for the unavoidable impacts of climate change. We can do this by adapting and helping the nation to prepare for future flooding and erosion risks.
3. Flood and coastal erosion risk information
Flooding comes from several sources including:
- rivers - where heavy rainfall leads to overtopping of river embankments
- the sea - where high tides and storm surges lead to coastal flooding
- surface water - where there is so much rainwater that it overwhelms drainage systems collecting over the ground causing surface water runoff, also known as flash flooding
- groundwater - where water under the ground (the water table) rises to the surface causing flooding which can persist for days, weeks or even months after heavy or prolonged rainfall
Coastal erosion is where there is loss or displacement of land, or the long term removal of sediment and rocks along the coastline. This can be due to the action of:
- waves
- currents
- tides
- storms
The Environment Agency is required to update our understanding of current and future flood and coastal erosion risk as part of our ‘strategic overview’ role. This is described in the Flood and Water Management Act 2010. This means we have a duty to provide the nation with the best available understanding of flood and coastal erosion risk. We must do this alongside our day-to-day operational role for managing flood risk from rivers and the sea.
Providing the best available flood and coastal erosion risk information is a vital part of our statutory overview role. It helps:
- individuals, communities and organisations prepare and adapt to flooding and coastal change
- planners decide where to build new homes, roads, railway lines and other critical infrastructure
- identify locations that need more flood risk protection or resilience measures
- prepare our response to flooding, for example defining our flood warning areas or planning evacuation routes
Our assessment of flood and coastal erosion risk has been based on 3 important sources of information:
- the National Flood Risk Assessment for England and the Risk from Flooding from Rivers and the Sea maps – an assessment of present-day risk of flooding from rivers and the sea, often referred to a ‘NaFRA’ and first published in 2004.
- the National Coastal Erosion Risk Map for England – an assessment of properties at present day risk of coastal erosion, often referred to as NCERM and first published in 2011
- the Risk of Flooding from Surface Water maps - first published in 2013
Our flood and coastal erosion risk data and mapping information is available on GOV.UK and the Data Services Platform. We also share this risk information through several well-established digital services which are aimed at different customers:
The public use check your long term flood risk for an area in England.
This service:
- provides a summary of long term flood risk for an area (which can be searched by postcode) – for rivers and the sea, surface water, reservoirs and groundwater
- displays the information on a map and provides the name of the risk management authority (RMA) responsible for managing flood risk in an area
Over the last 12 months, this service was used by around 1.2 million users.
Coastal local authorities and practitioners use check coastal erosion management in your area. This service:
- provides a link to a map which can be searched by place name or postcode
- shows the coastal management approach that is specific to the shoreline location
- shows the projected rates of erosion through this century if the location is on an erodible coast
Town and country planners and developers use flood map for planning. This service allows developers and planners to find the data they need to undertake a flood risk assessment. This is usually done for a planning application for a new development proposal.
Over the last 12 months, the service was used around 1.5 million times.
For the coast we have recently updated our plans for managing flood and coastal erosion risk around our coastline. In January 2024 we published updated SMPs. These set out a planned approach to managing flood and coastal erosion risk around the coast of England to 2105. The SMPs set out sustainable management approaches for each stretch of coast.
The 4 approaches are:
- hold the line - maintain or upgrade protection from flooding or erosion by holding the shoreline in broadly the same position
- advance the line - actively move shoreline defences significantly seawards
- managed realignment - change the position of the shoreline in a controlled way, such as by slowing erosion or creating areas of habitat to help manage flooding
- no active intervention - maintain or encourage a more natural coastline, which may involve discussing adaptation to the risk from flooding or erosion
In January 2024, we also launched SMP Explorer, a new map-based digital tool to make SMPs easier to access and understand.
Part of our public commitments in the FCERM Strategy and Roadmap to 2026 are that between now and 2025 the Environment Agency will have better evidence to:
- inform future risk
- understand investment needs for managing all sources of flooding and coastal change
We are updating our national assessment of risk to achieve this. We are doing this by updating NaFRA and NCERM using the best available national and local risk information.
4. Our updated assessment of flood and coastal erosion risk in England
This report provides an updated picture of current flood and coastal erosion risk in England. It also shows how risk could change in future. It provides the latest information on the:
- source and characteristics of flood and coastal erosion risk
- distribution of risk across England
- potential for these to change in the future due to climate change
Our updated national assessment of risk includes flooding from:
- rivers
- the sea
- surface water
- coastal erosion
It does not include groundwater flooding. This is because there are too many gaps in our understanding and evidence for groundwater flood risk at this time.
Our new national assessment:
- is an objective assessment of areas that are at risk of flooding and coastal erosion in the present day
- is based on the best available local and national mapping and modelling
- uses the latest data on current properties and other infrastructure to assess the possible impact of flooding and coastal erosion
- provides an overall risk assessment that combines the probability of flooding and coastal erosion with the potential impact
- reflects current housing, infrastructure and land use
- accounts for the current condition of existing flood and coastal defences
For the first time our new national assessment of risk also identifies areas that may be at risk in the future. This is based on climate change leading to increased frequency of storms that can worsen flooding and coastal erosion impacts. We use the UK Climate Projections 2018 (UKCP18) from the Met Office. These projections indicate how flooding and erosion may increase in future due to changes in:
- rainfall
- river flows
- high tides
- wave conditions
Our assessment of possible risk in the future does not consider:
- any additional development that may occur in future
- where new flood protection and resilience investments could change future risk
Our estimates of future risk due to climate change are therefore based on the potential for risk to increase rather than a prediction.
It is important to recognise that our assessment of risk is not static. Our national assessment of flood and coastal erosion risk will be regularly reviewed and updated. This will allow us to board the latest local modelling evidence and national data improvements.
4.1 Our previous assessment of flood and coastal erosion risk
We publish our latest information on the properties in areas at risk of flooding from different sources in our annual flood and coastal erosion risk management report.
In 2023 to 2024 we reported:
- 2.6 million properties in areas at risk of flooding from rivers and the sea
- 3.2 million properties in areas at risk of surface water flooding
Around twice as many properties in areas were at high risk of flooding from surface water flooding compared to flooding from rivers and the sea.
Some properties are in areas at risk from flooding from multiple sources. For example, around 642,000 properties were in areas at risk from flooding from rivers, the sea, and surface water.
In addition, between 122,000 and 290,000 properties were estimated to be in areas at risk of groundwater flooding. This may include properties also in areas at risk of surface water flooding.
For all sources of flooding, this totalled around 5.5 million properties at risk. Table 1 shows this information.
Our new assessment is not directly comparable with previous assessments (see section 4.1). This is because we now have much better data and improved modelling methodologies.
Table 1: Properties in areas at risk of flooding from rivers and the sea (as of December 2023), and from surface water flooding (as of January 2024)
| Flood risk band | Total number of properties in areas at risk of flooding from rivers and sea | Number of residential properties in areas at risk of flooding from rivers and sea | Total number of properties in areas at risk of flooding from surface water | Number of residential properties in areas at risk of flooding from surface water |
|---|---|---|---|---|
| High risk | 196,100 | 122,700 | 344,100 | 272,300 |
| Medium risk | 623,800 | 454,900 | 504,000 | 416,900 |
| Low risk | 1,069,500 | 851,700 | 2,370,700 | 1,985,500 |
| Very low risk | 717,300 | 612,800 | Not assessed | Not assessed |
| Total | 2,606,600 | 2,042,000 | 3,218,900 | 2,674,600 |
This information comes from the flood and coastal erosion risk management report: 1 April 2023 to 31 March 2024.
The level of risk, or flood risk bands are:
- high risk – this means that each year an area has a chance of flooding of greater than 3.3% (greater than a 1 in 30 chance of flooding)
- medium risk – this means that each year an area has a chance of flooding between 1% and 3.3% (1 in 30 to a 1 in 100 chance of flooding)
- low risk – this means that each year an area has a chance of flooding of between 0.1% and 1% (1 in 100 to a 1 in 1,000 chance of flooding)
- very low risk – this means that each year an area has a chance of flooding of less than 0.1% (less than a 1 in 1,000 chance of flooding)
For national coastal erosion risk we reported that there were 2,000 properties are at risk of being lost to coastal erosion by 2060. This assumed that the management approaches and actions in the SMPs are funded and carried out.
We conducted a survey of public attitudes to flooding over 2023 to 2024. This showed that:
- around half of households at risk of flooding do not believe it will happen to them
- 2 out of 3 people at risk believed that flooding will be more likely with climate change
These results show that considerable effort is still needed to raise awareness of flood risk in England amongst the public. It also highlights that a significant proportion of the population are anxious about the long-term impacts of adapting to a changing climate.
4.2 Why our assessment of flood and coastal erosion risk needs updating
Our first national assessment of flood risk was published 20 years ago in 2004. It was based on technology dating back to that time. The last full update to this assessment was in 2018, using some improvements to the data.
Our first national coastal erosion risk map was produced 13 years ago in 2011. Again, it was based on technology from that time. The erosion risk map was last updated in 2017, using new local data.
Our new assessment is not directly comparable with previous assessments (see section 4.1). It will look different for the following reasons:
Much better data
- the new national assessment of flood risk uses the most up to date local flood risk modelling for both surface water and rivers and the sea
- the new national coastal erosion risk map uses a further 10 years of data from the National Network of Regional Coastal Monitoring Programmes
Improved modelling methodologies
- we have created new software which allows us to better combine very detailed local modelling studies into a national assessment - this provides a more accurate assessment of risk
- digital terrain modelling now provides us with a much more detailed and accurate map of England - for example we can now identify the way water flows over roads accounting for the kerb level
- computing has also advanced so that, along with improved data and modelling methods, mapping risk at a more detailed 2 metre resolution is now possible
Improved assessment of properties, infrastructure and assets
- we have factored in new building development since our last analysis
- we are now able to better understand risk for a wider range of properties, infrastructure and other public assets - table 2 shows the types now included
Table 2: Types of property, infrastructure and assets included in NaFRA and NCERM data
| Asset type | Included in the category |
|---|---|
| Residential properties | houses, apartments, caravans with an address, care homes |
| Non-residential properties | schools, hospitals, industry, retail, leisure |
| Infrastructure | road, rail, water, electricity, gas |
| Other assets | heritage assets, sites of special scientific interest (SSSIs), landfill sites |
Climate change projections
We are now able to incorporate the UK Climate Projections 2018 (UKCP18) future warming scenarios from the UK Met Office. We consider different climate change scenarios for different sources of flood risk to reflect the UKCP18 ranges. These are shown in table 3.
Table 3: UK climate change scenarios for different sources of flood risk
| Flood risk source | Mid century range | End of century range |
|---|---|---|
| Rivers and the sea | 2036 to 2069 | 2070 to 2125 |
| Surface water | 2040 to 2060 | 2061 to 2080 |
| Coastal erosion | Now to 2055 | Now to 2105 |
For potential coastal erosion risk projections, we have based the climate change scenarios on the long term planning periods in the SMPs. The mid-century time period runs from 2025 to 2055 whilst the end of century period runs to 2105.
For coastal erosion, the new assessment is from now (present day) to either 2055 or 2105. This reflects the reality that coastal erosion impacts could occur following a one-off tidal surge or storm event. It is not always possible to predict when these storm events will happen.
The information presented for climate change is based on percentiles from the UK Climate Projections 2018 (UKCP18) data. A percentile is a measure used in statistics. They describe the proportion of possible scenarios that fall below an allowance level. Representative Concentration Pathways (RCPs) are emissions scenarios that describe possible future greenhouse gas emissions based on assumptions about human activity.
For the purposes of this report:
- for river and surface water flooding, we are using the central allowance, based on the 50th percentile from UKCP18, RCP 8.5
- for sea flooding and coastal erosion, we are using the higher central allowance, based on the 70th percentile from UKCP18, RCP 8.5
We are using the same climate change scenarios for all the data in this report:
- properties
- infrastructure
- public buildings
- agricultural land
5. The new national flood risk assessment
Our new NaFRA:
- provides a single picture of current and future flood risk from rivers, the sea and surface water
- uses both existing detailed local information and improved national data
- includes the potential impact of climate change on flood risk
It provides clearer detail than our current risk assessment on the areas at risk. This gives much higher resolution maps that make it easier to see where there is risk.
The current Risk of Flooding from Rivers and Sea maps are limited to a 50 metre resolution. The better modelling in the new NaFRA provides a 2 metre resolution.
The new NaFRA will also be able to show characteristics such as:
- potential flood depths
- likelihood and impacts
- economic damages of flooding
We have not previously had information to share on the possible depth of flooding from rivers and sea at a national scale. One of the advantages of our new NaFRA is that we now have information on the chance of flooding to different depths. We will now be able to let people know their chance of flooding:
- to a depth of less than 30cm
- between 30cm and 60cm
- greater than 60cm
This allows people to consider the possible impacts on their property, and whether they can use property flood resilience measures.
Our assessment of flood depths is based on outside ground levels. It is important to note that property floor levels are generally higher than the surrounding land – often by around 20cm. Also, in high flood risk areas developers are often required by planning authorities to raise the floor levels of buildings to mitigate the impacts of internal flooding.
Some properties will be identified by our new NaFRA as being in an area at risk of flooding to a certain flood depth. However, this does not necessarily mean that floodwaters will enter the property in a flooding event.
A fundamental principle of the new assessment is that the methods and data standards should be consistent around the country. This allows us to have a credible and robust understanding of risk.
We have also benefited from significant improvements made to the quality of flood risk mapping and modelling in recent years. This has come from both the Environment Agency and local authorities. It has included a 4-year local model data improvement programme which has successfully incorporated around 1,000 existing local flood models.
The new NaFRA outputs and methods are nationally consistent by design, so that they can be:
- regularly and easily updated
- improved to take on board the latest local model and data improvements.
In future we will be able to make regular national updates to NaFRA to account for the best available evidence.
In summary the new NaFRA is better because it:
- covers all sources of flood risk - rivers, the sea and surface water
- includes future flood risk due to climate change projections
- combines national models with local flood risk models from the Environment Agency and local authorities to provide more detail
- has clearer detail on the areas at risk through much higher resolution maps
- shows characteristics such as potential flood depths, and the likelihood and impacts, including the economic damages of flooding
- provides better impact analysis for properties and infrastructure
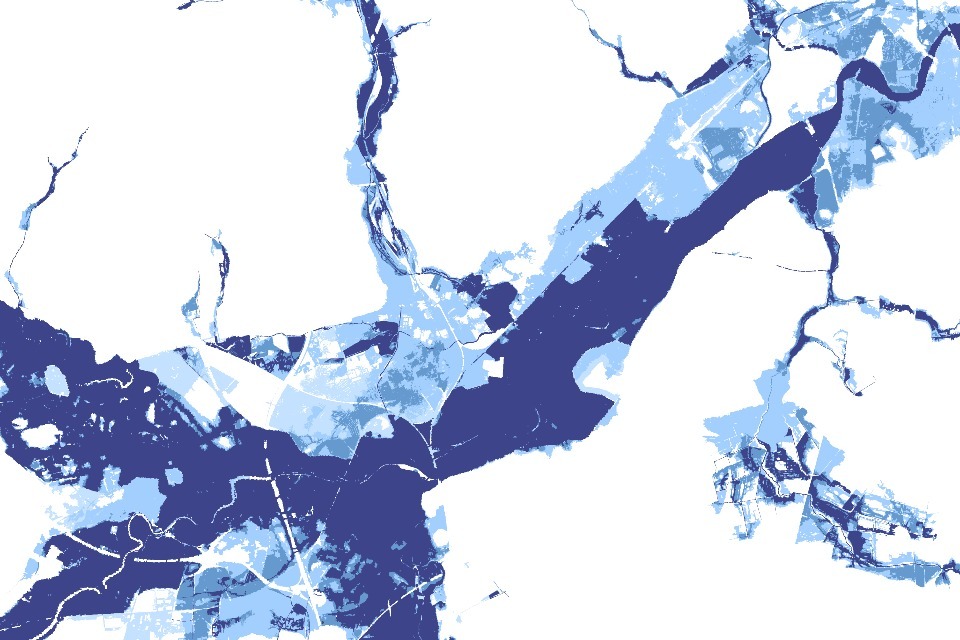
An example output from the new NaFRA - better methods and input data allow us to produce our data at a much higher resolution
6. Rivers and sea: how our assessment of flood risk from rivers and the sea is changing
6.1 Total properties in areas at risk of flooding from rivers and the sea
Total properties in areas at risk of flooding from rivers and the sea is around 2.4 million. This is slightly fewer than our previous assessment (see section 4.1).
Properties in areas at high risk of flooding from rivers and the sea increases to 367,900. This is an 88% increase from our previous assessment (see section 4.1).
In the new assessment there are a significant number of properties moving from being in areas at medium flood risk to high flood risk. There are 48% fewer properties in areas at medium risk, many of which we now consider to be in high risk areas. This information is shown in table 4.
Table 4: Properties in areas at risk of flooding from rivers and the sea - new present day risk information without climate change
| Flood risk band | Number of properties | Percentage of total | Percentage change compared to previous assessment (see section 4.1) |
|---|---|---|---|
| High risk | 367,900 | 15.1% | 87.6% |
| Medium risk | 323,300 | 13.3% | - 48.2% |
| Low risk | 966,500 | 39.7% | - 9.6% |
| Very low risk | 777,300 | 31.9% | 8.4% |
| Total | 2,435,000 | 100% | - 6.6% |
Our new data on depth of flooding provides more information to help people understand the potential flood hazard they could face.
Of properties in areas at high risk, 163,300 are likely to flood to depths of 30cm or higher from rivers and the sea. This is over two fifths (44%) of all properties in areas at high risk. A depth of just 30cm of flood water can be enough to move a car during a heavy rainfall event.
There are 87,500 properties in areas at high risk that are likely to flood to depths of 60cm or higher. This is around 24% of all properties in areas at high risk. This information is shown in table 5.
Table 5: Properties in areas at high and medium risk of flooding from rivers and sea, by depth of flooding
| Depth of flooding | Present day risk assessment, high risk | Present day risk assessment, medium risk |
|---|---|---|
| Less than 30cm | 204,600 | 142,600 |
| Between 30cm and 60cm | 75,800 | 77,400 |
| More than 60cm | 87,500 | 103,300 |
| Total | 367,900 | 323,300 |
6.2 Reasons behind the changes
There are a variety of reasons for the changes in risk. The major reasons are:
- improved data and modelling methods for assessing the likely frequency of flooding
- we have updated the information on the condition of our flood defence assets - this includes improved methods for estimating the chances and impacts of flood defences failing under extreme pressure from flood waters
- we have a better understanding of the natural extents of flood waters in U shaped river valleys or steep coastlines - they may be more susceptible to deeper or more frequent flooding but the number of properties at risk is likely to remain unchanged
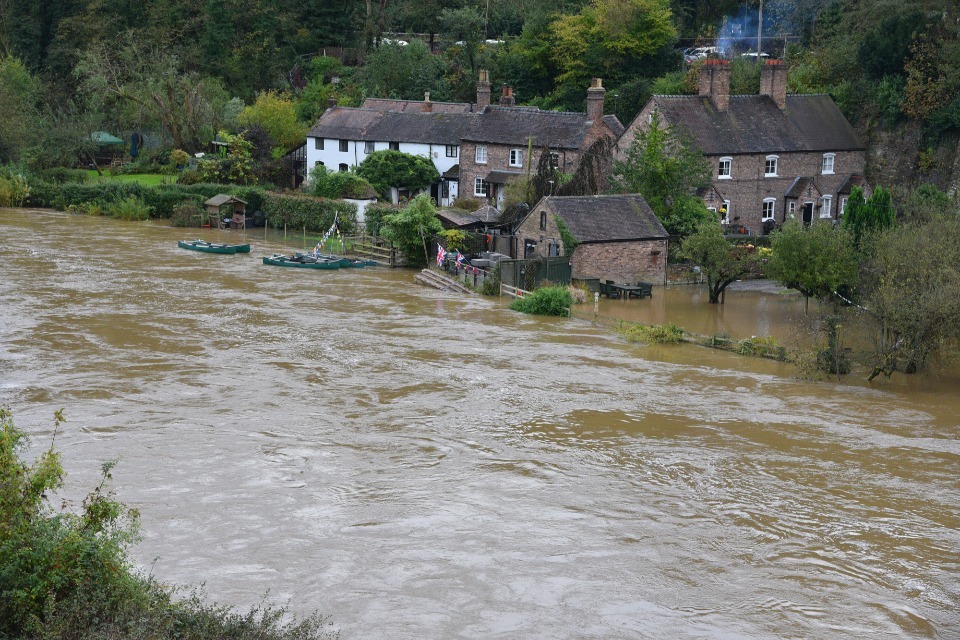
Flooding in Ironbridge, Shropshire, credit: Environment Agency
6.3 Regional distribution of properties in areas at risk of flooding from rivers and the sea
The East Midlands, Yorkshire and the Humber, and South East regions (Office for National Statistics regions) have the highest number of properties in areas at high or medium flood risk. These regions account for about a half (52%) of the total number of properties in areas at high or medium flood risk.
Less than 1 in 10 of properties in areas at high and medium flood risk are in London. This is largely due to the presence of major flood defences such as the Thames Barrier.
This information is shown in tables 6 and 7.
Table 6: Regional distribution of properties in areas at high risk of flooding from rivers and the sea - new present day information without climate change
| Region | Number of properties in areas at high flood risk | Percentage of national properties in areas at high flood risk | As a percentage of total number of properties in each region | Total property count per region |
|---|---|---|---|---|
| East Midlands | 67,900 | 18.5% | 2.5 % | 2,758,200 |
| East of England | 28,100 | 7.6% | 0.8 % | 3,540,400 |
| London | 27,800 | 7.6% | 0.6% | 4,315,900 |
| North East | 8,600 | 2.3% | 0.6% | 1,520,600 |
| North West | 34,900 | 9.5% | 0.8% | 4,168,500 |
| South East | 68,100 | 18.5% | 1.4% | 5,011,800 |
| South West | 47,200 | 12.8% | 1.4% | 3,495,000 |
| West Midlands | 20,700 | 5.6% | 0.7% | 3,184,300 |
| Yorkshire and The Humber | 64,600 | 17.6% | 2.0% | 3,159,800 |
| Total | 367,900 | 100.0% | 1.2% | 31,154,500 |
Table 7: Regional distribution of properties in areas at high or medium risk of flooding from rivers and the sea - new present day risk information without climate change
| Region | Number of properties in areas at high or medium flood risk | % of national properties in areas at high or medium flood risk | As a % of total number of properties in each region | Total property count per region |
|---|---|---|---|---|
| East Midlands | 127,500 | 18.4% | 4.6% | 2,758,200 |
| East of England | 79,000 | 11.4% | 2.2% | 3,540,400 |
| London | 51,100 | 7.4% | 1.2% | 4,315,900 |
| North East | 13,200 | 1.9% | 0.9% | 1,520,600 |
| North West | 68,000 | 9.8% | 1.6% | 4,168,500 |
| South East | 113,900 | 16.5% | 2.3% | 5,011,800 |
| South West | 86,200 | 12.5% | 2.5% | 3,495,000 |
| West Midlands | 37,100 | 5.4% | 1.2% | 3,184,300 |
| Yorkshire and The Humber | 115,200 | 16.7% | 3.6% | 3,159,800 |
| Total | 691,200 | 100.0% | 2.2% | 31,154,500 |
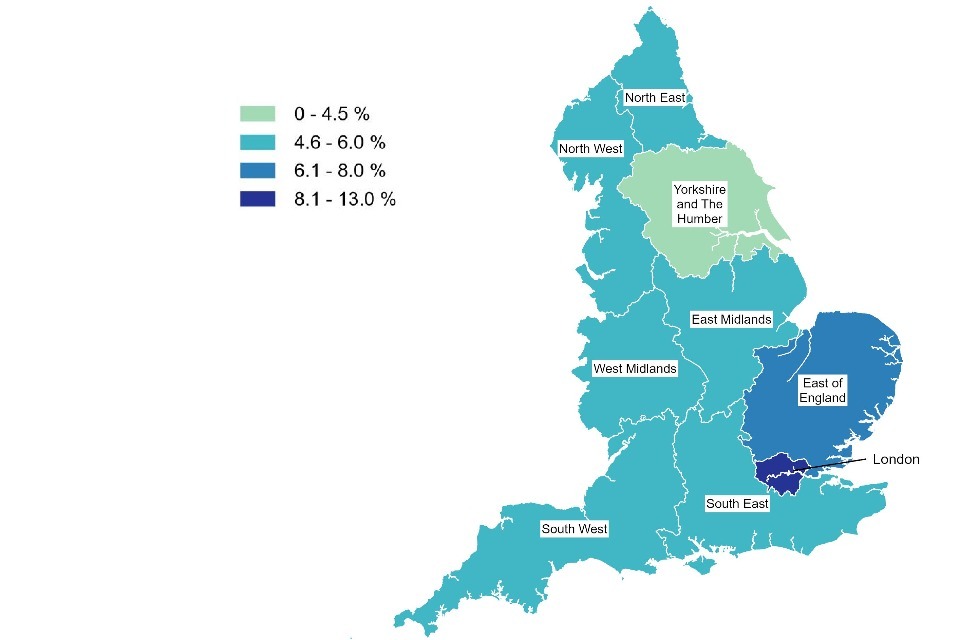
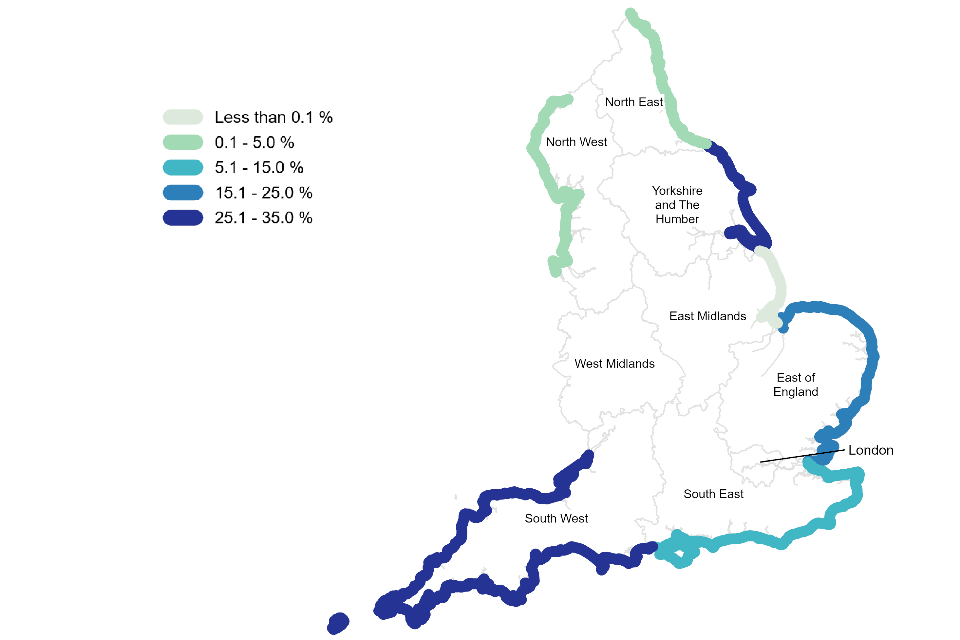
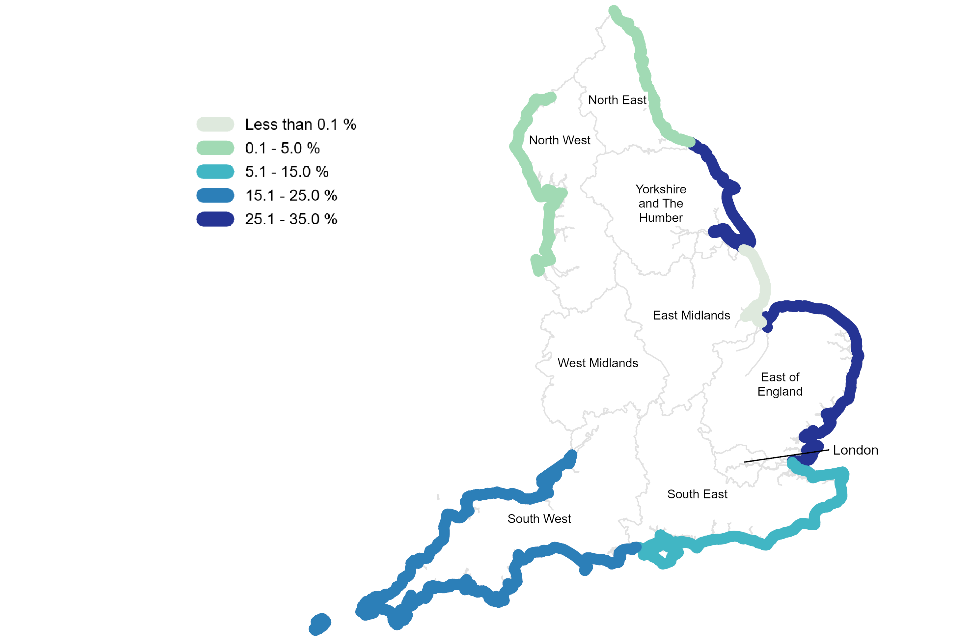
The maps show the importance of considering flood risk relative to population size. For instance, 3.6% of properties in Yorkshire and the Humber are in areas at a high or medium chance of flooding. In contrast, only 0.9% of properties in the North East face the same level of risk.
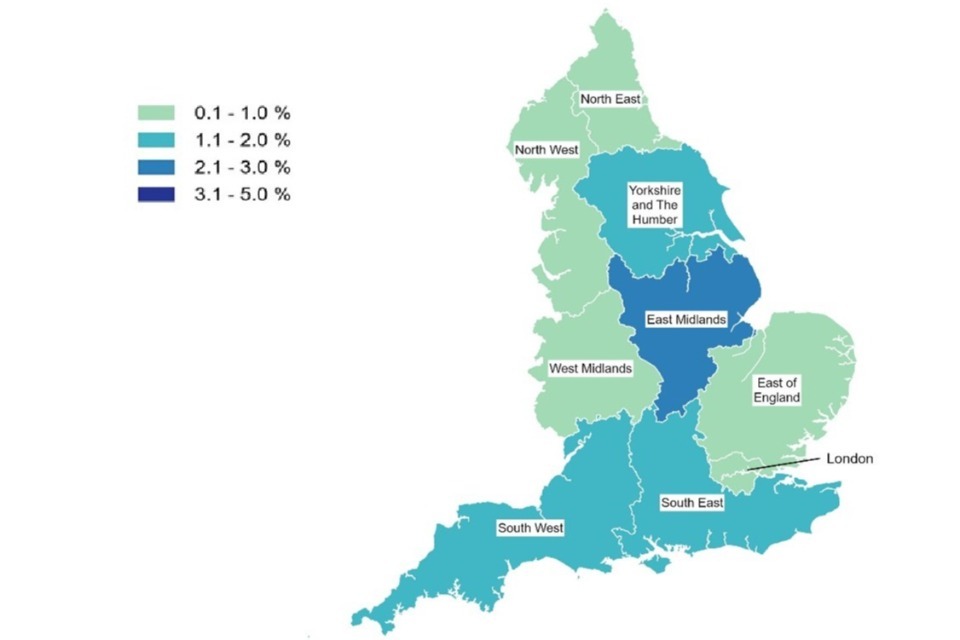
Properties in areas at high risk of flooding from rivers and sea, as a percentage of total number of properties per region
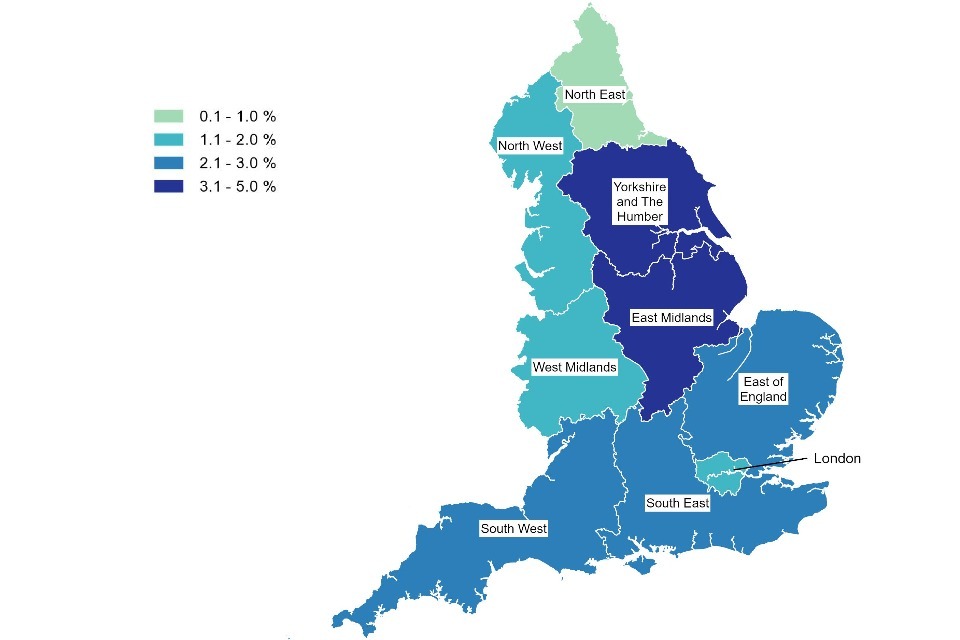
Properties in areas at high/medium risk of flooding from rivers and sea, as a percentage of total number of properties per region
6.4 Properties in areas at risk of flooding from rivers and the sea with climate change
Overall, climate change will increase the chance of flooding. In many locations which are already at risk, flooding may occur more frequently and to greater depths. This is in line with projections that climate change is driving sea level rise and increases of extreme flows in rivers.
With climate change, we estimate that the total number of properties in areas at risk of flooding from rivers and the sea will increase. We expect this to be from 2.4 million to around 3.1 million, which is a 27% increase. Properties in areas at high risk could increase by around three quarters (73%) between 2036 and 2069.
This is shown in table 8.
Table 8: Properties in areas at risk of flooding from rivers and the sea with climate change between 2036 to 2069 - with climate change compared to the new present day risk information
| Risk band | Number of properties in areas at risk between 2036 and 2069 | Percentage of all properties in areas at risk | Percentage change compared to new present day assessment |
|---|---|---|---|
| High risk | 637,600 | 20.6% | 73.3% |
| Medium risk | 538,800 | 17.4% | 66.7% |
| Low risk | 1,209,400 | 39.1% | 25.1% |
| Very low risk | 710,900 | 22.9% | - 8.5% |
| Total | 3,096,700 | 100% | 27.2% |
We also expect climate change to affect likely flood depths for properties already at risk from flooding from rivers and the sea.
Of properties in areas at high risk, 288,800 could flood to depths of 30cm or higher from rivers and the sea between 2036 and 2069. This is a 77% increase from the present day. The percentage of properties in areas at high risk that could flood to depths of 60cm or higher could increase by 87% between 2036 and 2069.
This is shown in table 9.
Table 9: Properties in areas at high and medium risk of flooding from rivers and sea, by depth of flooding with climate change between 2036 to 2069
| Depth of flooding | Present day, high risk | Present day, medium risk | With climate change, 2036 to 2069, high risk | With climate change, 2036 to 2069, medium risk |
|---|---|---|---|---|
| Less than 30cm | 204,600 | 142,600 | 348,800 | 239,000 |
| Between 30cm and 60cm | 75,800 | 77,400 | 125,600 | 120,700 |
| More than 60cm | 87,500 | 103,300 | 163,200 | 179,100 |
| Total | 367,900 | 323,300 | 637,600 | 538,800 |
7. Surface water: how our assessment of flood risk from surface water is changing
7.1 Total properties in areas at risk of flooding from surface water
Total properties in areas at risk of flooding from surface water is around 4.6 million. This is a 43% increase on our previous assessment (see section 4.1).
Our new assessment of risk of flooding from surface water shows about 1.1 million properties in areas at high risk of surface water flooding. This is 3 times greater than our previous assessment of 344,100 (see section 4.1).
There are now 3 times as many properties at high risk of flooding from surface water than there are from flooding from rivers and the sea.
The number of properties in areas at medium risk of surface water flooding has also increased by about three quarters (76%) to 884,800 properties. Unlike flooding from rivers and the sea, this is a very significant increase in properties in areas at medium flood risk from surface water flooding.
This is shown in table 10.
Table 10: Properties in areas at risk of flooding from surface water - new present day risk without climate change
| Risk band | Number of properties | Percentage of total | Percentage change compared to previous assessment (see section 4.1) |
|---|---|---|---|
| High risk | 1,071,800 | 23.3% | 211.5% |
| Medium risk | 884,800 | 19.2% | 75.6% |
| Low risk | 2,644,000 | 57.5% | 11.5% |
| Total | 4,600,600 | 100% | 42.9% |
Our new flood depth information shows that 184,200 properties in areas at high risk are likely to flood to depths of 30cm or higher from surface water. This is 1 in 6 (17%) of all properties in areas at high risk of flooding. In comparison, over two fifths (44%) of properties in areas at high risk from rivers and the sea face a 30cm or greater depth hazard.
83% percent of properties at high risk are in areas with likely flood depths of less than 30cm. This suggests that the typical impacts from surface water flooding are likely to occur at shallower levels than flooding events from rivers and the sea. As a result of this, the economic costs are likely to be less damaging.
This is shown in table 11.
Table 11: Properties in areas at high and medium risk of flooding from surface water, by depth of flooding
| Depth of flooding | Present day, high risk | Present day, medium risk |
|---|---|---|
| Less than 30cm | 887,600 | 660,500 |
| Between 30cm and 60cm | 153,900 | 174,900 |
| More than 60cm | 30,300 | 49,400 |
| Total | 1,071,800 | 884,800 |
7.2 Reasons behind the changes
The changes we are seeing in the total number of properties in areas at risk of surface water flooding doesn’t reflect a real-world increase in risk. It is almost entirely due to improvements in:
- data
- modelling
- use of technology
We do not think that risk has been significantly under-estimated until now. Rather, we are now able to describe it with more confidence and detail.
The main reasons are as follows.
Updated data and methods
We have updated the data and methods to determine frequency of heavy rainfall and flood response.
We have invited some local authorities to provide local evidence about the ability of drainage systems to carry away flood water. This has shown that in some places urban drainage systems do not have the capacity to manage surface water.
Revised approach to determining what is surface water
We have revised our approach when a series of puddles on the ground becomes surface water flooding, and the impacts that can have on people and property.
This has resulted in more locations being at risk but we believe it is a more useful reflection of actual risk to communities. The new information on depth allows us to identify for the first time places where there is a high chance of relatively shallow flooding.
Accounting for surface water deflection
Our previous surface water flood risk maps were limited in the way they deflected water around the walls of buildings. This meant that the properties themselves did not appear to be at risk of flooding on the maps.
The new mapping removes this limitation, making it a more realistic local assessment of surface water flood risk.
Surface water flooding. Credit: Environment Agency
7.3 Regional distribution of properties in areas at risk of surface water flooding
Over one quarter of properties in areas at high flood risk from surface water flooding are in London – nearly a third of a million. This is over 11 times as many properties as are in areas at high risk of flooding from rivers and the sea.
Other regions with a significant number of properties in areas at high and medium risk from flooding from surface water are the:
- East of England
- North West
- South East
These regions account for 38% of the total number of properties at risk. This is shown in tables 12 and 13.
Table 12: Regional distribution of properties in areas at high risk of surface water flooding - new present day information without climate change
| Region | Properties in areas at high risk of surface water flooding | Percentage of national properties in areas at high risk of surface water flooding | As a percentage of total number of properties in each region | Total property count per region |
|---|---|---|---|---|
| East Midlands | 67,600 | 6.3% | 2.5% | 2,758,200 |
| East of England | 170,600 | 15.9% | 4.8% | 3,540,400 |
| London | 319,800 | 29.9% | 7.4% | 4,315,900 |
| North East | 39,900 | 3.7% | 2.6% | 1,520,600 |
| North West | 123,300 | 11.5% | 3.0% | 4,168,500 |
| South East | 127,900 | 11.9% | 2.6% | 5,011,800 |
| South West | 86,500 | 8.1% | 2.5% | 3,495,000 |
| West Midlands | 73,900 | 6.9% | 2.3% | 3,184,300 |
| Yorkshire and The Humber | 62,300 | 5.8% | 2.0% | 3,159,800 |
| Total | 1,071,800 | 100% | 3.4% | 31,154,500 |
Table 13: Regional distribution of properties in areas at high or medium risk of surface water flooding - new present day information without climate change
| Region | Properties in areas at high or medium risk of surface water flooding | Percentage of national properties in areas at high or medium risk of surface water flooding | As a percentage of total number of properties in each region | Total property count per region |
|---|---|---|---|---|
| East Midlands | 136,900 | 7.0% | 5% | 2,758,200 |
| East of England | 270,200 | 13.8% | 7.6% | 3,540,400 |
| London | 543,500 | 27.8% | 12.6% | 4,315,900 |
| North East | 77,800 | 4.0% | 5.1% | 1,520,600 |
| North West | 240,200 | 12.3% | 5.8% | 4,168,500 |
| South East | 236,100 | 12.0% | 4.7% | 5,011,800 |
| South West | 159,800 | 8.2% | 4.6% | 3,495,000 |
| West Midlands | 157,600 | 8.0% | 4.9% | 3,184,300 |
| Yorkshire and The Humber | 134,500 | 6.9% | 4.3% | 3,159,800 |
| Total | 1,956,600 | 100% | 6.3% | 31,154,500 |
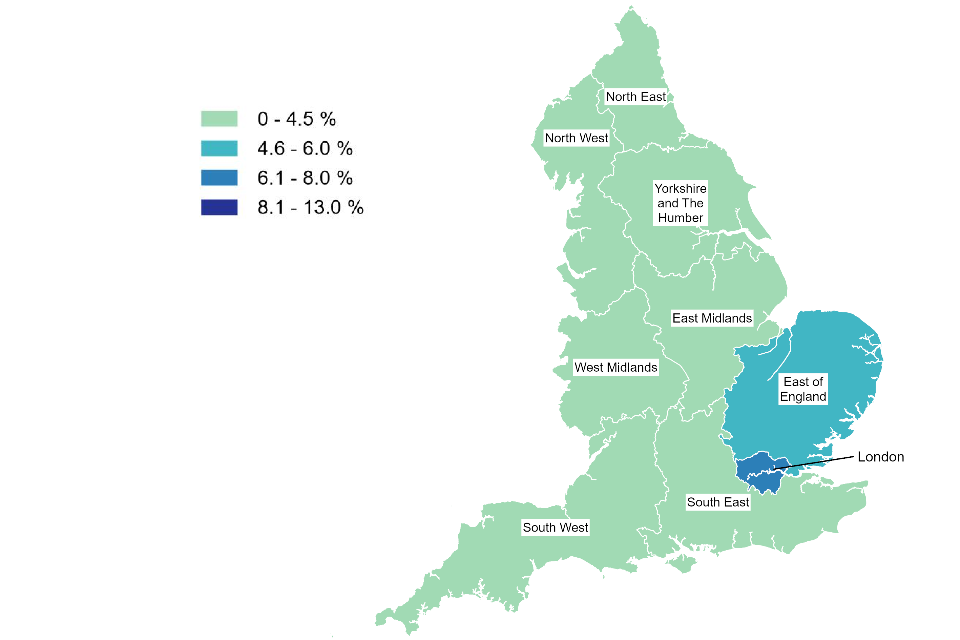
The maps show the importance of considering flood risk relative to population size. Surface water flood risk is greater in cities where drainage systems are less able to deal with intense rainfall. 1 in 8 (13%) of properties in London are in areas at high or medium risk of surface water flooding. This is twice the rate compared to the national total, and a far higher rate than any other region.
Properties in areas at high risk of flooding from surface water, as a percentage of total number of properties per region
Properties in areas at high/ medium risk of flooding from surface water, as a percentage of total number of properties per region
7.4 Properties in areas at risk of flooding from surface water with climate change
With climate change, we estimate that the total number of properties in areas at risk of flooding from surface water could increase from 4.6 million to 6.1 million. This is an increase of one third. Properties in high risk areas could increase by two thirds (66%) between 2040 and 2060.
This is shown in table 14.
Table 14: Properties in areas at risk of flooding from surface water with climate change between 2040 and 2060 - with climate change compared to the new present day risk information
| Risk band | Number properties in areas at risk between 2040 and 2060 | Percentage of all properties at risk | Percentage change compared to new present day assessment |
|---|---|---|---|
| High risk | 1,784,300 | 29.5% | 66.5% |
| Medium risk | 972,300 | 16.0% | 9.9% |
| Low risk | 3,299,600 | 54.5% | 24.8% |
| Total | 6,056,200 | 100% | 31.6% |
We also expect climate change to affect likely flood depths for properties already in areas at risk from surface water flooding. We estimate that 288,400 properties in areas at high risk could flood to depths of 30cm or higher between 2040 and 2060. This is an increase of more than half (57%) on the present day.
The proportion of high risk properties flooding to depths of 60cm or deeper could increase by over two thirds (73%) between 2040 and 2060.
This is shown in table 15.
Table 15: Properties in areas at high and medium risk of flooding from surface water, by depth of flooding with climate change between 2040 and 2060
| Depth of flooding | Present day, high risk | Present day, medium risk | With climate change, 2040 to 2060, high risk | With climate change, 2040 to 2060, medium risk |
|---|---|---|---|---|
| Less than 30cm | 887,600 | 660,500 | 1,495,900 | 620,500 |
| Between 30cm and 60cm | 153,900 | 174,900 | 236,000 | 268,500 |
| More than 60cm | 30,300 | 49,400 | 52,400 | 83,300 |
| Total | 1,071,800 | 884,800 | 1,784,300 | 972,300 |
8. Flood risk from multiple sources – rivers, the sea and surface water
8.1 Properties in areas at risk of flooding from multiple sources
Our new national flood risk assessment shows that in total around 6.3 million properties in England are at risk of flooding from one or a combination of sources:
- rivers
- the sea
- surface water
This figure is based on our new assessment showing:
- 2.4 million properties in areas at risk of flooding from rivers and the sea - this is slightly fewer than our previous assessment (see section 4.1)
- 4.6 million properties in areas at risk of flooding from surface water - this is a 43% increase on our previous assessment (see section 4.1)
Our new mapping identifies about 750,000 properties in areas at risk both from rivers or the sea, and surface water.
In reality flooding to properties and places often comes from more than one source. For example, high river levels can impede surface water drainage. This causes increased flood impacts in areas where the main risk is from rivers. This means it is common to find the same properties impacted by multiple sources of flooding.
We have not included the groundwater figures in our new total as this estimate has not been updated for some time. Our next annual report for 2024 to 2025 will reflect the updated assessment from the new NaFRA.
With climate change the total number of properties in areas at risk from rivers and the sea or surface could increase to:
- 3.1 million properties in areas at risk of flooding from rivers and the sea between 2036 and 2069
- 6.1 million properties in areas at risk of flooding from surface water between 2040 and 2060
With climate change, our new mapping identifies about one million properties in areas at risk both from rivers or the sea, and surface water.
This could take the total number of properties at risk of flooding from rivers and the sea or surface water to around 8 million by mid-century. In other words, 1 in 4 properties in England will be at risk of flooding from rivers and the sea or surface water by mid-century.
8.2 Infrastructure and other public buildings in areas at risk of flooding from multiple sources
Flood risk from rivers, sea and surface water impacts on infrastructure and other public buildings in England.
Our new assessment shows that 113,900 kilometres (km) out of 302,100km of roads in England are at risk of flooding. This is around a third (38%) of all roads at risk from one or more sources of flooding. Of that, about 18% of roads are at high or medium risk of flooding. If we apply climate change projections the road network at risk rises to 137,700km or 46% at risk by mid-century. This is an increase of 21%.
Our new assessment shows that 4,300km out of 11,700km of railways in England are at risk of flooding. This is over a third (37%) of all railways at risk from one or more sources of flooding. Of that, around 18% of railway lines are at high or medium risk of flooding. If we apply the climate change projections the rail network at risk rises to 6,300km or 54% at risk by mid-century. This is an increase of around half. Compared to other major infrastructure sectors, the railways see the largest increase in future risk due to climate change.
A significant proportion of water pumping stations and treatment plants are also at risk of flooding from multiple sources – about a third (34%). Other important public buildings, such as schools and hospitals, are also at flood risk from multiple sources at about 21% and 26% respectively.
This information is shown in tables 16, 17 and 18.
Flooding at Matlock Green, Derbyshire (Credit: Environment Agency)
Table 16: Infrastructure and other public buildings in areas at flood risk from rivers, sea and surface water - present day and with climate change
| Infrastructure type | Present day | Present day, percentage of total | With climate change, 2040 to 2060 | With climate change, 2040 to 2060, percentage of total at risk | Percentage change with climate change, 2040 to 2060 |
|---|---|---|---|---|---|
| Roads | 113,900km | 37.7% | 137,700km | 45.6% | 20.9% |
| Railways | 4,300km | 36.8% | 6,300km | 53.8% | 46.5% |
| Education facilities | 30,000 | 21.4% | 37,000 | 26.4% | 23.3% |
| Medical facilities | 11,800 | 25.5% | 14,600 | 31.5% | 23.7% |
| Emergency services | 2,000 | 26.0% | 2,400 | 31.2% | 20.0% |
| Water pumping stations or treatment works | 12,800 | 34.4% | 14,200 | 38.2% | 10.9% |
| Electricity infrastructure | 52,600 | 22.1% | 61,600 | 25.9% | 17.1% |
| Gas infrastructure | 1,300 | 35.1% | 1,400 | 37.6% | 7.7% |
8.3 Present day assessment
Table 17: Percentage of infrastructure and other public buildings in areas at flood risk from rivers, sea and surface water - present day, by level of risk
| Infrastructure type | High risk (%) | Medium risk (%) | Low risk (%) | Very Low risk (%) | Total risk (%) |
|---|---|---|---|---|---|
| Roads | 12.3 | 5.9 | 15.9 | 3.6 | 37.7 |
| Railways | 11.8 | 6.6 | 14.8 | 3.6 | 36.8 |
| Education facilities | 4.6 | 4.2 | 11.5 | 1.1 | 21.4 |
| Medical facilities | 5.6 | 4.8 | 13.6 | 1.5 | 25.5 |
| Emergency services | 6.9 | 4.8 | 12.9 | 1.4 | 26.0 |
| Water pumping stations or treatment works | 11.4 | 6.6 | 13.3 | 3.1 | 34.4 |
| Electricity infrastructure | 5.3 | 4.1 | 10.4 | 2.3 | 22.1 |
| Gas infrastructure | 7.0 | 5.1 | 13.1 | 9.9 | 35.1 |
8.4 Climate change assessment (between 2040 and 2060)
Table 18: Percentage of infrastructure and other public buildings in areas at flood risk from rivers, sea and surface water - with climate change, by level of risk
| Infrastructure type | High risk (%) | Medium risk (%) | Low risk (%) | Very low risk (%) | Total risk (%) |
|---|---|---|---|---|---|
| Roads | 16.4 | 7.7 | 18.6 | 2.9 | 45.6 |
| Railways | 20.5 | 9.7 | 20.5 | 3.1 | 53.8 |
| Education facilities | 8.0 | 4.3 | 13.2 | 0.9 | 26.4 |
| Medical facilities | 9.6 | 6.0 | 14.9 | 1.0 | 31.5 |
| Emergency services | 11.4 | 5.4 | 13.2 | 1.2 | 31.2 |
| Water pumping stations or treatment works | 16.4 | 6.4 | 13.5 | 1.9 | 38.2 |
| Electricity infrastructure | 8.3 | 4.6 | 11.3 | 1.7 | 25.9 |
| Gas infrastructure | 11.6 | 7.1 | 15.1 | 4.0 | 37.8 |
8.5 Agricultural land in areas at risk of flooding from rivers and the sea
Our new assessment shows that of the 85,000 kilometres squared (km2) of agricultural land in England, 11,200km2 is in areas at risk of flooding from rivers and sea. This is around 13% of all agricultural land and about 59% of grade 1 agricultural land. If we apply the climate change projections, this rises to 11,700km2, an increase of nearly 5% by the mid-century.
Table 19 shows this information.
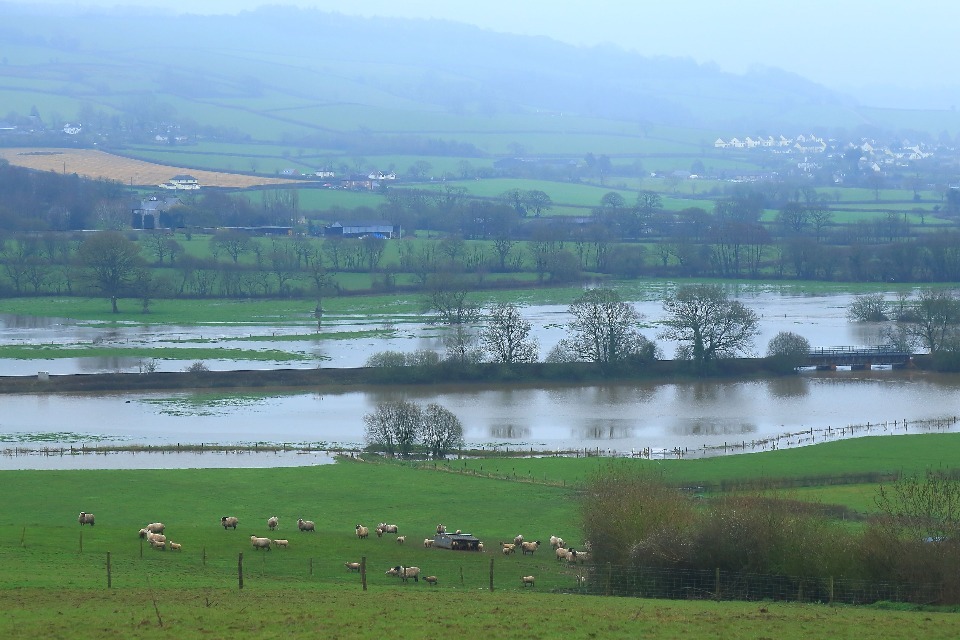
Flooded fields. Credit: Environment Agency/Getty images
Table 19: Agricultural land (by grade) in areas at flood risk from rivers and sea - present day and with climate change - for agricultural land we are only presenting the risk of flooding from rivers and the sea
| Present day risk (km2) | Percentage of agricultural land at risk | With climate change, 2036 to 2069 (km2) | Percentage of agricultural land at risk, with climate change, 2036 to 2069 | |
|---|---|---|---|---|
| Grade 1 | 2,100 | 59.2% | 2,100 | 59.2% |
| Grade 2 | 3,300 | 17.8% | 3,400 | 18.4% |
| Grade 3 | 5,800 | 9.2% | 6,200 | 9.9% |
| Total | 11,200 | 13.2% | 11,700 | 13.8% |
9. The new national coastal erosion risk map
The new National Coastal Erosion Risk Map (NCERM) provides the most up to date national picture of coastal erosion risk for England.
Our new NCERM:
- is based on coastal monitoring data from the National Network of Regional Coastal Monitoring Programmes - this includes 10 years more evidence on coastal processes since the original map was published
- accounts for the UKCP18 climate projections which includes allowances for sea level rise
The new NCERM reflects the latest coastal management approaches set out in SMPs. Our assessment identifies the impacts of coastal erosion. It does this with SMPs being completed compared to the worst case where the SMPs are not funded or delivered.
The projections of erosion risk around the coast are set to the time periods defined in the SMPs:
- mid-century year of 2055
- the end of century year of 2105
Where a part of the coast is mainly at risk from sea flooding, no erosion projections are provided.
We have worked in collaboration with coastal local authorities to produce the new NCERM. The new erosion risk information will also be used by policy makers and practitioners. It will help them with coastal planning and the designation of Coastal Change Management Areas (CCMAs).
CCMAs are identified in strategic local plans as areas:
- likely to be affected by coastal erosion and coastal change
- where the local planning authority can require constraints on new development
In summary the new NCERM is better because it:
- makes erosion information more accessible to coastal managers, planners and the public by providing clearer online visualisations
- includes climate change impacts on coastal erosion risk
- uses improved methodologies, more recent data and new research on the acceleration of erosion due to rising sea levels
- includes new information on areas of land instability at the coast caused by rainfall and rising groundwater levels which can contribute to cliff erosion and landslides
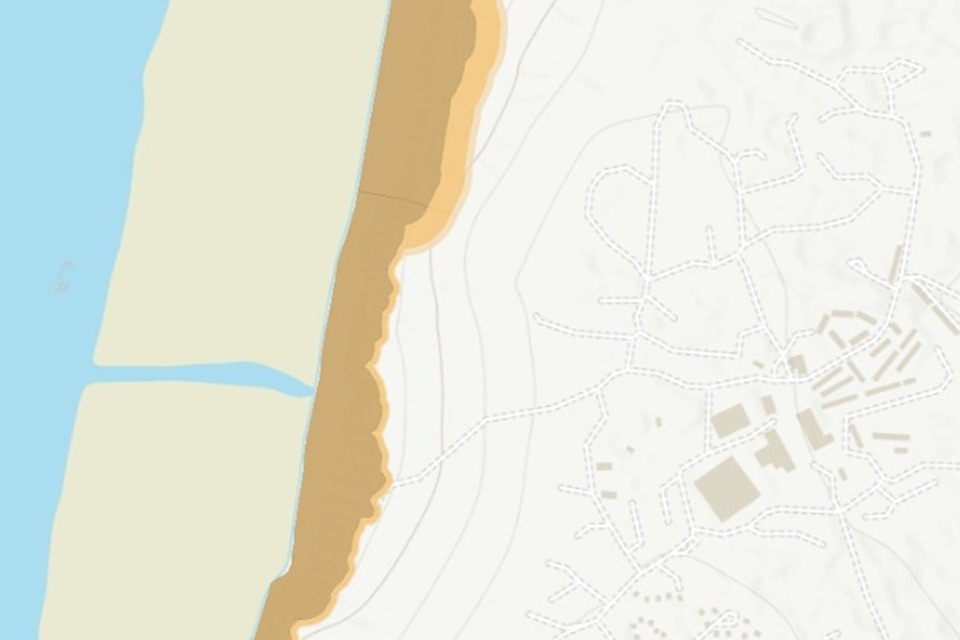
An example map from NCERM - users will be able to see the area of land that could erode between now and 2055 and 2105.
10. Coastal erosion: how our assessment of coastal erosion risk is changing
10.1 Properties in areas at risk of coastal erosion between now and 2055 and 2105
The new NCERM shows that 3,500 properties are in areas at risk of coastal erosion in the period up to 2055. This increases to about 10,100 properties in the period up to 2105.
About half of these properties are residential. The other half are non-residential properties such as:
- schools
- hospitals
- retail
- leisure businesses
The properties in areas at risk numbers assume that all actions in the SMPs are funded and carried out.
The worst case scenario is where the SMPs are not delivered and no future investment is made to manage coastal erosion. In this case the numbers of properties in areas at risk increases significantly. The total number of properties in areas at risk of coastal erosion would be 9 times greater in the period up to 2055, reaching up to 32,800 properties.
The new NCERM shows that coastal erosion risk will increase with climate change. This is because of sea level rise on erosion rates. Even with SMPs completed there could be 19,700 properties at risk of coastal erosion in the period up to the end of the century. Without any of the investment set out in SMPs being carried out, this figure is expected to be 5 times greater.
This is shown in table 20.
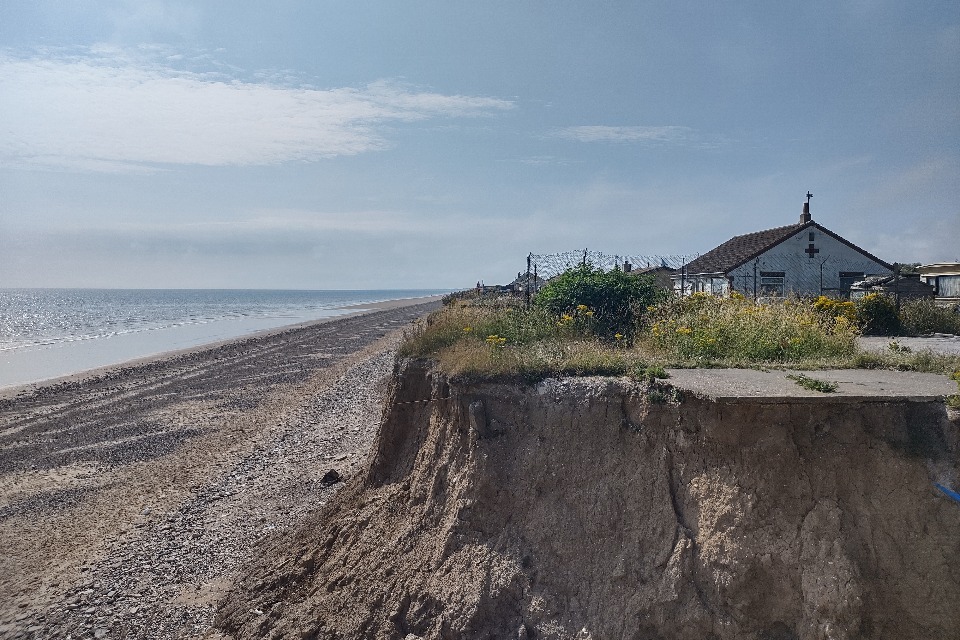
Coastal erosion at Aldbrough, East Riding of Yorkshire (Credit: Environment Agency)
Table 20: Properties in areas at risk of coastal erosion between now and 2055 and 2105 - with and without SMPs completed
| Property type | With SMPs being delivered, now to 2055, present day | With SMPs being delivered, now to 2055, with climate change | With SMPs being delivered, now to 2105, present day | With SMPs being delivered, now to 2105, with climate change | Without SMPs being delivered, now to 2055, present day | Without SMPs being delivered, now to 2055, with climate change | Without SMPs being delivered, now to 2105, present day | Without SMPs being delivered, now to 2105, with climate change |
|---|---|---|---|---|---|---|---|---|
| Residential | 1,900 | 2,900 | 6,400 | 13,000 | 25,200 | 34,300 | 51,000 | 80,100 |
| Non residential | 1,600 | 2,300 | 3,600 | 6,800 | 7,600 | 10,200 | 14,000 | 22,000 |
| Total properties | 3,500 | 5,200 | 10,100 | 19,700 | 32,800 | 44,500 | 65,100 | 102,100 |
10.2 Reasons behind the changes
Our understanding of the impacts of coastal erosion has been improved by better evidence as well as accounting for future climate change.
The main reasons are:
- we are using more sophisticated coastal analysis techniques to assess coastal erosion at approximately 8,000 locations along the coast
- we are using a further 10 years of coastal monitoring data from the National Network of Regional Coastal Monitoring Programmes - this provides a more detailed and accurate dataset to assess recent changes to the coast
- we have updated the information on the condition of coastal defences including improved methods for estimating the chances and impacts of defence failure
- we have better information on a wider range of properties at erosion risk in coastal locations - this includes accounting for caravans as well as tourist, leisure and businesses that have located to the coast over time
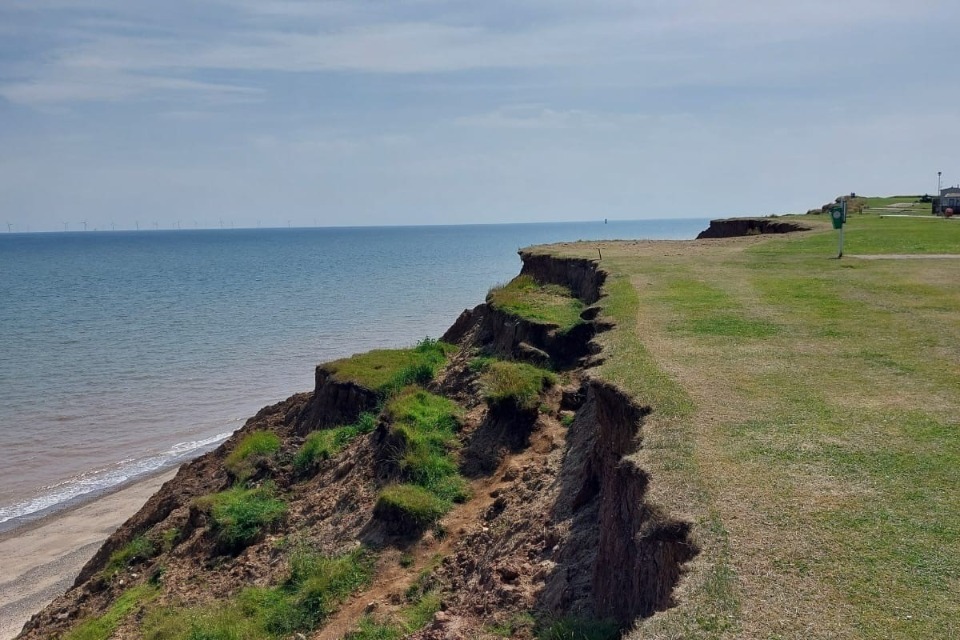
Green Lane, Skipsea, East Riding of Yorkshire (Credit: Environment Agency)
10.3 Regional distribution of properties in areas at risk of coastal erosion between now and 2055 and 2105
England already has some of the fastest eroding coastlines in Europe. In some parts of the east coast, erosion rates can be up to 4 metres per year. The rates of erosion are likely to increase with sea level rise and climate change through this century.
The new NCERM shows that the highest number of properties in areas at risk of coastal erosion are in:
- Yorkshire and the Humber
- the South West
- the East of England
Places such as East Riding of Yorkshire, North Norfolk and Cornwall have some of the highest numbers of properties in areas at risk of coastal erosion.
These 3 local authorities contain two-thirds of all residential properties in areas at risk of coastal erosion in England. This is why we are working with these local authorities as part of the £36 million Coastal Transition Accelerator Programme (CTAP). CTAP is exploring how coastal communities and businesses can adapt to the effects of erosion and climate change on the coast.
This is shown in table 21.
Table 21: Properties in areas at risk of coastal erosion between now and 2055 and 2105 - with SMPs delivered and without climate change
| Region | Properties in areas at risk of coastal erosion, now to 2055, with SMPs being delivered | Percentage of total properties in areas at risk of coastal erosion, now to 2055, with SMPs being delivered | Properties in areas at risk of coastal erosion, now to 2105, with SMPs being delivered | Percentage of total properties in areas at risk of coastal erosion, now to 2105, with SMPs being delivered |
|---|---|---|---|---|
| East Midlands | Not applicable | Not applicable | Not applicable | Not applicable |
| East of England | 860 | 25% | 2,760 | 27% |
| London | Not applicable | Not applicable | Not applicable | Not applicable |
| North East | 160 | 4% | 410 | 4% |
| North West | 150 | 4% | 300 | 3% |
| South East | 290 | 8% | 1,290 | 13% |
| South West | 940 | 27% | 1,850 | 18% |
| West Midlands | Not applicable | Not applicable | Not applicable | Not applicable |
| Yorkshire and The Humber | 1,100 | 32% | 3,490 | 35% |
Properties in areas at risk of coastal erosion to 2055, as a percentage of total properties in areas at coastal erosion risk in England
Properties in areas at risk of coastal erosion to 2105, as a percentage of total properties in areas at coastal erosion risk in England
Other local authorities with significant ‘pockets’ of erosion risk include:
- Great Yarmouth
- Swale
- South Hams
- Dorset
- New Forest
- Southampton
- the Isle of Wight
Additionally, there are related challenges from ground instability affecting whole communities, especially on the south and north east coasts.
Parts of the Isle of Wight are at high risk of landslides and cliff falls. Significant land movements happened in 2023 and 2024 because of:
- erosion at the base of the cliff
- large amounts of winter rainfall raising ground water levels
As well as property, coastal erosion can also affect the natural environment. Erosion can result in the loss and makeup of habitats along the coast.
The new NCERM shows over 6 km2 of Sites of Special Scientific Interest (SSSI) are within areas of coastal erosion risk by 2055. Erosion and the movement of sediment along the coast is a natural feature of the coastal environment. However, where losses occur due to flood and erosion defences being in place, we support wildlife in adapting to coastal change.
Over recent decades we have created over 2,300 hectares of coastal habitats through our Habitat Compensation and Restoration Programme.
10.4 Infrastructure and agriculture in areas at risk of coastal erosion between now and 2055 and 2105
Road networks along the coast mainly consist of minor and unclassified roads but these are often important access routes for coastal communities. A roads, B roads and motorways (‘major roads’) normally stop short of coastal areas. Where they do feature along the coast there are often sea defences or other beach management protection measures in place. This is also the case for railways which run along the coast.
Much of England’s primary (grade 1 and 2) agricultural land at the coast is in low lying areas where flooding is the main risk. Lower grade agriculture in many parts of the coast is at risk of erosion with some areas eroding naturally. This is in line with the approach set out in SMPs.
This is shown in table 22.
Table 22: Infrastructure and agricultural land (by grade) in areas at risk of coastal erosion between now and 2055 and 2105 - with SMPs delivered and without climate change
| Infrastructure/land type | Now to 2055 with SMPs being delivered | Now to 2105 with SMPs being delivered |
|---|---|---|
| Major roads, motorway, A and B roads | Over 1km | Over 10km |
| Minor roads and local access roads | Over 55km | Over 173km |
| Railways | Over 2km | Over 6km |
| Grade 1 and 2 agricultural land | 0.7km2 | Over 2km2 |
| Grade 3 agricultural land | Over 7km2 | Over 17km2 |
11. How the new national flood and coastal erosion risk information and data will be made available
11.1 Early 2025: new NaFRA and NCERM data published
In early 2025 we will publish:
- the new NaFRA data on check your long term flood risk and on data.gov.uk
- the new NCERM data on check coastal erosion risk for an area in England, SMP Explorer and on data.gov.uk
For the first time check your long term flood risk will show information for users on:
- future flood risk taking into account climate change
- potential flood depths both for present day flood risk and with climate change
The improved service will make it easier for users to understand both the chances and potential impacts of current and future flood risk in the places in which they live or work.
11.2 Spring 2025: new NaFRA data published on Flood Map for Planning
In spring 2025 we will be updating our flood map for planning service which displays the flood zones. The flood zones are defined by government in planning guidance and will continue to show present day flood risk from rivers and the sea. We will be updating the flood zones using the data from the new NaFRA.
The improved service will use the data from the new NaFRA to:
- assist planners and developers towards the most appropriate sites for development
- make it easier for developers to produce flood risk assessments as part of the process to obtain planning permission
For the first time, we will be:
- adding new information to show how climate change may affect the extent of flood risk from rivers and the sea in future
- including mapping showing areas at flood risk from rivers and the sea taking into account the presence of existing flood defences
- displaying surface water flood risk
Following these Spring 2025 improvements to flood map for planning, we will plan further updates to include other helpful information from the new NaFRA. This will include adding information on how climate change could affect surface water flood risk as well as information on flood depths.
12. Next steps: continuous improvement in our understanding of risk
We have assessed that nearly 90% of properties at flood risk in England are in areas that are suitable for the new NaFRA data and mapping. The remaining areas require either new detailed local modelling, or gaps and errors in the input data to be rectified. For areas that are not yet able to benefit from the new NaFRA we are temporarily retaining the existing flood risk information. Local Environment Agency teams will make sure that the best available local understanding of risk is also factored into decisions about future investment options. We are continuing to refine our modelling and data with the aim of reach 100% coverage with the new NaFRA data by Summer 2026.
We are committed to a rolling programme of data improvements so we can take into account the latest local modelling evidence and national data improvements. Following publication of the new NaFRA data in early 2025, the first update will be in summer 2025. While details are to be confirmed, we expect updates to then follow quarterly.
Following publication of the new NCERM data in early 2025 on SMP Explorer, the first update is expected to be later in 2025. While details are to be confirmed, we expect updates to then follow yearly.
13. How we will use the new risk information to inform future investments
For the first time, our new national flood and coastal erosion risk assessment gives us an understanding of risk for both:
- the present day
- future climate projections
This new information is vital for our future planning, especially given climate change projections and aging flood and coastal defences.
13.1 Informing our future investment programme
We are currently developing a new flood and coastal investment programme using the best available evidence which includes the new NaFRA and NCERM.
This will allow us to assure that our investment programmes are prioritising the places and projects where current and future risk is greatest.
13.2 Long term investment scenarios
At a national scale, both the new NaFRA and NCERM will provide the underpinning evidence to inform our new Long Term Investment Scenarios (LTIS). These are due to be published by the end of 2025.
LTIS will produce detailed insights into future flood and coastal risk, options for managing risk as well as an assessment of the likely long-term costs. The new scenarios will provide important evidence for informing future policy and investment choices for improving resilience and adaptation to future climate risks.