Flood and Coastal Erosion Risk Management (FCERM): Central Government Funding and Performance
Updated 15 July 2026
Applies to England

© Crown copyright 2026
This publication is licensed under the terms of the Open Government Licence v3.0 except where otherwise stated. To view this licence, visit nationalarchives.gov.uk/doc/open-government-licence/version/3 or write to the Information Policy Team, The National Archives, Kew, London TW9 4DU, or email: psi@nationalarchives.gov.uk.
Where we have identified any third party copyright information you will need to obtain permission from the copyright holders concerned.
This publication is available at https://www.gov.uk/government/statistics/flood-and-coastal-erosion-risk-management-in-england-central-government-funding-and-performance/flood-and-coastal-erosion-risk-management-fcerm-central-government-funding-and-performance
1. Introduction
This publication presents statistics on Flood and Coastal Erosion Risk Management (FCERM) in England. It includes central government budget allocations for 2023/24 to 2025/26, historical expenditure from 2005/06 to 2024/25 and performance information on flood asset condition and the number of properties protected from flooding.
Funding figures are taken from Defra and Environment Agency (EA) accounting systems and historical management information. Expenditure figures are presented with and without the effects of inflation.
Funding for FCERM is predominantly administered through Defra and the EA and forms the main focus of this publication. The Ministry of Housing, Communities and Local Government (MHCLG), formerly the Department for Levelling Up, Housing and Communities, also provides FCERM revenue funding to Lead Local Flood Authorities (LLFAs), but this is largely un-ringfenced. Other sources of funding are raised locally and are excluded from the main allocation and expenditure figures. These figures can be found in Section 8: ‘Other Funding for Flood and Coastal Erosion Risk Management’.
2. Explanation of funding sources
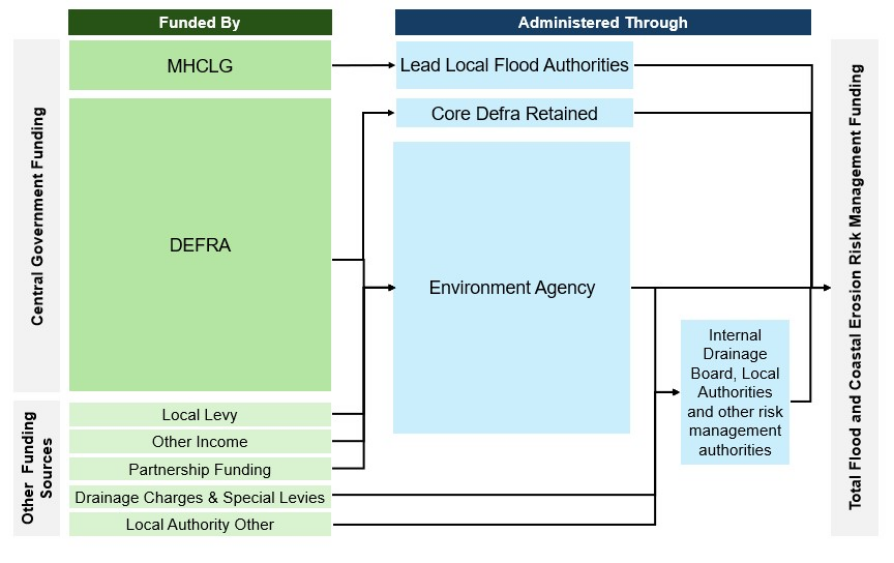
Figure 1 – Diagram of Flood and Coastal Erosion Risk Management funding
Central Government Funding
Defra provides most of its funding for FCERM to the EA as Grant-in-Aid (GiA), which is the mechanism for financing non-departmental public bodies (NDPBs). The EA spends this funding directly on managing flood risk, mainly through:
• The FCERM Investment Programme, which funds new flood and coastal erosion risk management schemes and major refurbishments. This primarily uses capital (CDEL) funding, with some associated resource (RDEL) funding.
• Routine maintenance and repairs to existing EA flood and coastal defence assets. Primarily delivered using resource (RDEL) funding.
It also passes some of this funding on as capital grants for flood or coastal erosion defence improvements to local authorities or Internal Drainage Boards – local public authorities established in areas of special drainage need which manage water levels within their respective drainage districts.
Defra retains a small proportion of its funding for FCERM. This is referred to in this document as Core Defra retained.
From 2011/12, LLFAs received funding to support their new roles under the Flood and Water Management Act 2010. The Flood and Water Management Act 2010 defined LLFAs for specific areas and gave those authorities the role of managing local flood risk. The funding made available by the Act enabled LLFAs to carry out their new duties, including developing and applying a local flood risk strategy. This funding is not ring-fenced and is therefore not reported in this publication.
In 2013, Defra transferred budget for a proportion of this funding to MHCLG; the remaining budget was transferred to MHCLG in 2016. Between 2013 and 2016, LLFAs therefore received part of their funding from Defra and part of their funding from MHCLG. The Defra component was paid via MHCLG’s Local Services Support Grant (LSSG), which is one of the mechanisms for central government to give funding to local authorities. The MHCLG component is now provided to LLFAs through the overall Fair Funding Assessment (FFA) for local authorities.
Until 2020/21, the government published notional funding allocations for local authorities, including for FCERM, in the Visible Lines of Funding publication. Following consultation in December 2020, the government announced that it would no longer produce Visible Lines for historical grants that had already been incorporated into local authorities’ general funding settlements before 2016/17. These allocations were entirely notional, as the core settlement is not ring-fenced. The ‘Visible Lines’ did not affect the settlement distribution or represent an expectation from central government of local expenditure levels.
Other Sources of Funding
As well as central government funding, there are several other funding sources for FCERM. These include a levy on local authorities (local levy) raised by the EA. EA FCERM local levies are subject to approval of the relevant Regional Flood and Coastal Committee (RFCC). RFCCs guide flood and coastal erosion risk management activities within their river catchments and along the coastline.
Funding is also sourced from partners outside government. Such ‘partnership funding’ or ‘contributions’ helps to boost a project’s prioritisation under the new floods funding rules, which came into effect in April 2026. Under this mechanism, local communities raise funding towards a scheme and either channel it through the EA or use it directly on FCERM projects, with central government also contributing via GiA. This allows central government to contribute to a range of flood schemes rather than meeting the full costs of a limited number of schemes and ensures total investment in defence improvements is not restricted to what central government alone can afford over any period.
As well as receiving funding from the EA, internal drainage boards raise funds from Drainage Charges and Special Levies on properties in their areas. The EA also raises other income from outside of central government including through internal drainage board precepts; General Drainage Charges; and the sale of assets.
Finally, local authorities (district authorities in county council areas and unitary authorities) retain powers to carry out flood risk management works on ordinary watercourses (any river, stream, brook, ditch, drain, culvert or pipe through which water flows that has not been designated as a “Main River” by the Environment Agency) under the Land Drainage Act 1991 as amended by the Flood and Water Management Act 2010. They can also use their general funding provided by MHCLG through the Settlement Funding Assessment for flood management. This is in addition to the element of the Settlement Funding Assessment provided to LLFAs specifically to meet their roles and responsibilities under the Flood and Water Management Act 2010.
3. Financial Terminology
Government spending is split between Departmental Expenditure Limits (DEL) and Annually Managed Expenditure (AME). DEL covers expenditure that can reasonably be planned and controlled over the Spending Review period and is allocated to departments by HM Treasury. AME covers expenditure that is demand-led, volatile or otherwise difficult to control within fixed multi-year budgets. Examples include certain pension costs and other items designated by HM Treasury. Unless otherwise stated, the figures in this publication relate only to DEL expenditure and exclude AME.
Funding within DEL is further split into Resource DEL (RDEL) funding and Capital DEL (CDEL) funding.
• Resource DEL (RDEL) reflects the day-to-day costs of delivering services and operating flood risk management activities. For FCERM, this includes routine asset maintenance, inspections, operational activities and programme costs. Historically, certain non-cash items such as depreciation have also formed part of resource budgets, although HM Treasury budgeting rules have changed over time.
• Capital DEL (CDEL) supports investment in assets that provide benefits over more than one financial year. Within FCERM, this includes the construction of new flood and coastal erosion risk management assets, major refurbishments, asset replacement and other expenditure that meets HM Treasury’s definition of capital investment.
Changes to HM Treasury budgeting guidance and accounting requirements over time can affect the classification of some expenditure between resource, capital and AME budgets. Readers should therefore exercise caution when comparing expenditure categories across long time periods, as movements may reflect changes in budgeting treatment as well as underlying flood risk management activity.
To focus on frontline FCERM activity, the figures presented in this publication exclude Core Defra retained administration costs, evidence and research expenditure, and depreciation. Consequently, totals presented here will differ from figures published in Defra and Environment Agency Annual Reports and Accounts and from Parliamentary Estimates, which include these items.
The totals in Tables 2 and 3 of this publication are shown with and without the effects of inflation, based on 2024/25 market prices where applicable. Inflation rates are taken from the most recent publication (June 2026) of HM Treasury’s GDP Deflator, which is widely used to track price changes in public sector spending and is the most appropriate inflation measure for this national-level time series.
4. Budget Allocations
Table 1 – Budgets for Flood and Coastal Erosion Risk Management 2023/24 to 2025/26 (£m)
| Financial Year | Core Defra Retained Resource | Core Defra Retained Capital | EA Resource | EA Capital | Total |
|---|---|---|---|---|---|
| 2023/24 | 2.4 | 0.5 | 371.0 | 887.2 | 1,261.2 |
| 2024/25 | 2.4 | 0.8 | 586.5 | 748.4 | 1,338.0 |
| 2025/26 | 2.6 | 8.7 | 571.9 | 925.2 | 1,508.4 |
Table 1 details the resource and capital budgets allocated for the 2023/24 to 2025/26 financial years. These figures show budget allocations only. Actual expenditure is presented in Section 3 of this publication. The allocations shown in Table 1 represent the total FCERM funding within the scope of these statistics.
In March 2020, the previous administration announced it would invest £5.2 billion in the six-year FCERM investment programme from April 2021 to March 2027. In addition, £200 million was allocated to the Flood and Coastal Resilience Innovation Programme (FCRIP), which commenced in April 2021. From 2026/27, FCRIP funding will be reported through the Climate, Adaptation and Resilience Programme.
Following the change of government in 2024, it was announced that the 2021/22 to 2026/27 programme would end a year early, in 2025/26. The government announced a £2.65 billion investment in flood resilience across 2024/25 and 2025/26. This announced funding covered the EA’s FCERM Investment Programme, including supporting and enabling activity, the Asset Management Programme and the Flood and Coastal Resilience Innovation Programme (FCRIP). The total EA and Core Defra retained funding for the same period is £2.85 billion (see Table 1), which is higher than the £2.65 billion announcement. This is because Table 1 also includes investment in navigation assets, flood incident management, spatial planning and internal drainage board grants, as well as Core Defra retained funding.
A new FCERM investment programme began on 1 April 2026, supported by the new funding rules announced by the government in October 2025. The reforms are intended to simplify the funding rules, make it easier to deliver flood defences and help optimise funding between new flood projects and maintenance of existing defences.
In 2026/27, the first year of the new programme, £1.4 billion is planned to be invested across the FCERM Investment Programme and the Asset Management, Climate, Adaptation and Resilience, and support and enabling programmes. Over the three-year Spending Review period (April 2026 to March 2029), the government plans to invest £4.2 billion in these FCERM programmes. While full spending figures beyond 2028/29 will be subject to future Spending Reviews, the National Infrastructure Strategy announced a commitment of £7.9 billion in capital spending over the lifetime of the new ten-year programme (2026/27 to 2035/36). Resource funding for the period 2028/29 to 2035/36 will be confirmed at future Spending Reviews.
Points to note:
• Table 1 no longer includes reference to funding allocated to MHCLG for resource paid to LLFAs. Local councils will still be spending revenue on floods from their settlement allocations; however, the budget for flood risk management is not ring-fenced, in recognition of local authorities being best placed to spend according to local priorities. Previously, this table included notional figures from the Visible Lines for grants publication, but this is no longer published.
• The £8.7 million capital allocation for Core Defra retained in 2025/26 was allocated for grants to support flooding caused by Storm Babet and Storm Henk.
• EA resource budget allocations do not include funding for Defra Corporate Services. FCERM GiA funding for Corporate Services was transferred to Defra budgets in 2017. It is not recharged to EA but does appear in EA’s Annual Reports and Accounts to comply with accounting rules for financial statements.
• Initial allocations and final expenditure can differ for various reasons, for example because of the government’s response to a flood incident or other in-year funding allocations due to changes in resource need.
5. Historical Expenditure
Table 2 – Expenditure on Flood and Coastal Erosion Risk Management, 2005/06 to 2024/25 (£m)
| Financial year | Core Defra retained resource (£m) | Core Defra resource paid to LLFAs (£m) | Core Defra capital (£m) | MHCLG resource paid to LLFAs (£m)4 | EA resource (£m) | EA capital (£m) | Total (£m) | Total real terms (£m)5 |
|---|---|---|---|---|---|---|---|---|
| 2005/06 | 0.1 | 63.5 | 228.3 | 216.8 | 508.7 | 829.1 | ||
| 2006/07 | 0 | 67.2 | 232.6 | 207.0 | 506.9 | 802.1 | ||
| 2007/08 | 1.1 | 39.3 | 240.2 | 219.2 | 499.8 | 775.7 | ||
| 2008/09 | 0.9 | 1.1 | 249.6 | 316.0 | 567.6 | 849.3 | ||
| 2009/10 | 11.2 | 1.8 | 260.0 | 360.1 | 633.1 | 935.2 | ||
| 2010/11 | 13.6 | 4.9 | 291.6 | 360.0 | 670.1 | 973.3 | ||
| 2011/12 | 3.4 | 21.0 | 0 | 287.8 | 260.7 | 572.9 | 814.7 | |
| 2012/13 | 3.2 | 36.0 | 0 | 268.0 | 269.1 | 576.3 | 805.6 | |
| 2013/14 | 4.3 | 15.0 | 0 | 21.0 | 250.6 | 315.3 | 606.2 | 830.1 |
| 2014/15 | 6.0 | 15.0 | 11.6 | 20.7 | 282.6 | 466.7 | 802.6 | 1,083.7 |
| 2015/16 | 2.6 | 10.0 | 12.4 | 20.6 | 274.5 | 390.7 | 710.8 | 953.1 |
| 2016/17 | 2.4 | -0.1 | 31.1 | 314.6 | 446.9 | 794.9 | 1,045.0 | |
| 2017/18 | 2.5 | 0.8 | 32.4 | 338.2 | 403.1 | 777.0 | 1,008.7 | |
| 2018/19 | 2.3 | 0 | 32.3 | 304.8 | 453.0 | 792.4 | 1,005.7 | |
| 2019/20 | 2.5 | 0.5 | 33.0 | 329.5 | 501.3 | 866.7 | 1,071.8 | |
| 2020/21 | 3.4 | 2.5 | 33.5 | 413.4 | 610.4 | 1,063.2 | 1,249.5 | |
| 2021/22 | 4.0 | 4.8 | - | 349.4 | 742.1 | 1,100.2 | 1,289.9 | |
| 2022/23 | 2.3 | 3.1 | - | 476.5 | 583.8 | 1,065.7 | 1,167.3 | |
| 2023/24 | 2.5 | 0.1 | - | 611.9 | 621.7 | 1,236.2 | 1,286.5 | |
| 2024/25 | 2.5 | 1.4 | - | 609.2 | 788.8 | 1,402.0 | 1,402.0 |
Table notes
(1) A blank cells indicates that the funding stream was not in operation or not applicable for that year; a value of zero indicates that the funding stream existed but no expenditure was recorded for that year; - indicates that expenditure data are not available.
(2) Figures for “Resource – Paid to LLFAs” by DLUHC to support their roles under the Flood and Water Management Act 2010 are no longer available. This follows the discontinuation of DLUHC’s Visible Lines for grants publication.
(3) Inflation-adjusted figures in this table are expressed in 2024/25 prices using HM Treasury’s GDP Deflator (June 2026). Real and nominal quantities are not identical in the base year because quarterly deflators have been used.
Table 2 provides a summary of central government spending on FCERM from 2005/06 to 2024/25. The totals are shown with and without the effects of inflation to give an indication of the “real-terms” value of funding in today’s prices. Points to note: • Core Defra Retained capital figures to 2010/11 related to expenditure through local authorities to support a limited number of coastal change pathfinder projects. These projects finished in 2010/11. • The capital figures in 2014/15 and 2015/16 relate to the Repair and Renew Grant scheme, set up following the winter 2013/14 flooding.
• The -£0.1 million capital figure in 2016/17 relates to refunds from local authorities under the Repair and Renew Grant scheme following receipt of their audit reports. The £0.8 million capital figure in 2017/18 relates to a Flood Asset Register (FAR) grants scheme.
• The £0.5 million capital figure for Core Defra retained in 2019/20 was for the Defra Property Flood Resilience (PFR) repair scheme launched following the November 2019 flooding.
• The capital figures for Core Defra retained in 2020/21 and 2021/22 were for Property Flood Resilience (PFR) repair grants.
• In total, local authorities spent approximately £166 million on flood and coastal erosion risk management in 2024/25. This figure includes funding spent by LLFAs from MHCLG, but would also include local authority spending raised from other sources, including the EA. A portion of this figure may therefore include some double counting with total EA expenditure due to the funding structure. Further details on local authority spending on flooding can be found here.
• In 2023/24, the difference between EA’s initial resource and capital allocations and actual expenditure was predominantly due to the reclassification of capital funding to resource following changes to HM Treasury’s budgeting guidance and accounting rules.
• In 2024/25, EA expenditure exceeded allocation by £63 million. Differences in resource and capital were mainly driven by in-year changes to funding for IDB grant schemes.
6. Programme Performance
Asset Maintenance and Capital Investment Programme
The Environment Agency’s flood and coastal risk management funding allocation from Defra for 2023/24 to 2025/26 is set out in Table 1. This was used to deliver:
• The FCERM Investment Programme, which funds new flood and coastal erosion risk management schemes and major refurbishments. This primarily used capital (CDEL) funding, with some associated resource (RDEL) funding.
• Routine maintenance and repairs to existing flood and coastal defence assets. This was primarily delivered using resource (RDEL) funding.
Asset Condition
The condition of flood and coastal defence assets is a key indicator of how effectively FCERM funding is being delivered. Funding for asset maintenance is delivered using RDEL funding as part of the routine maintenance programme, alongside capital investment for major repairs, refurbishment and reconditioning of assets.
National targets are set to achieve a balance between the efficient use of available funding and the level of flood risk reduction achieved.
There are around 271,000 assets with a flood and coastal erosion risk management purpose in England. Around 259,000 of these manage risk from flooding; the remainder manage coastal erosion risk. Around 95,000 of these are maintained by the Environment Agency, which inspects and reports on flood risk management assets in England. This includes its own assets and some third-party assets that work together to protect people and property.
The asset condition key performance indicator (KPI) reports on a specific named set of assets that the Environment Agency maintains and that are in a high consequence system. High consequence systems are those where the assets protect a high concentration of properties. All flood and coastal risk management assets are assigned a target condition grade between 1 and 5. Nearly all assets have a target grade of 3. If an asset is below required condition (BRC), it is usually in grades 4 to 5.
If an asset is listed as below required condition, it does not mean that it has structurally failed or that performance in a flood is compromised. A more detailed assessment is undertaken of below required condition assets to determine the repairs needed, the urgency of the repair, how it will be funded and, most importantly, what mitigation measures are needed to ensure the asset can operate until the full repair is complete.
Asset condition data underpins a risk-based approach to asset management. The EA target resources to areas at highest risk and assess the condition of flood defence assets at a frequency rate based on risk, taking account of factors such as the status, nature and significance of the flood defence. A visual asset inspection looks at the asset as a whole by breaking it down into elements, with each element given a weighting which reflects the importance of that element to the overall condition of the asset.
Due to changes in target condition, inspection approaches, condition assessment, asset inventories and recording systems, the asset condition figures from 2009/10 to 2017/18 are not directly comparable with the quarterly data published from 2018/19 onwards. This data can be viewed separately in Figure 2 and Figure 3 below.
Figure 2 - Condition of High Consequence Flood Defence Assets in England, 2009/10 to 2017/18
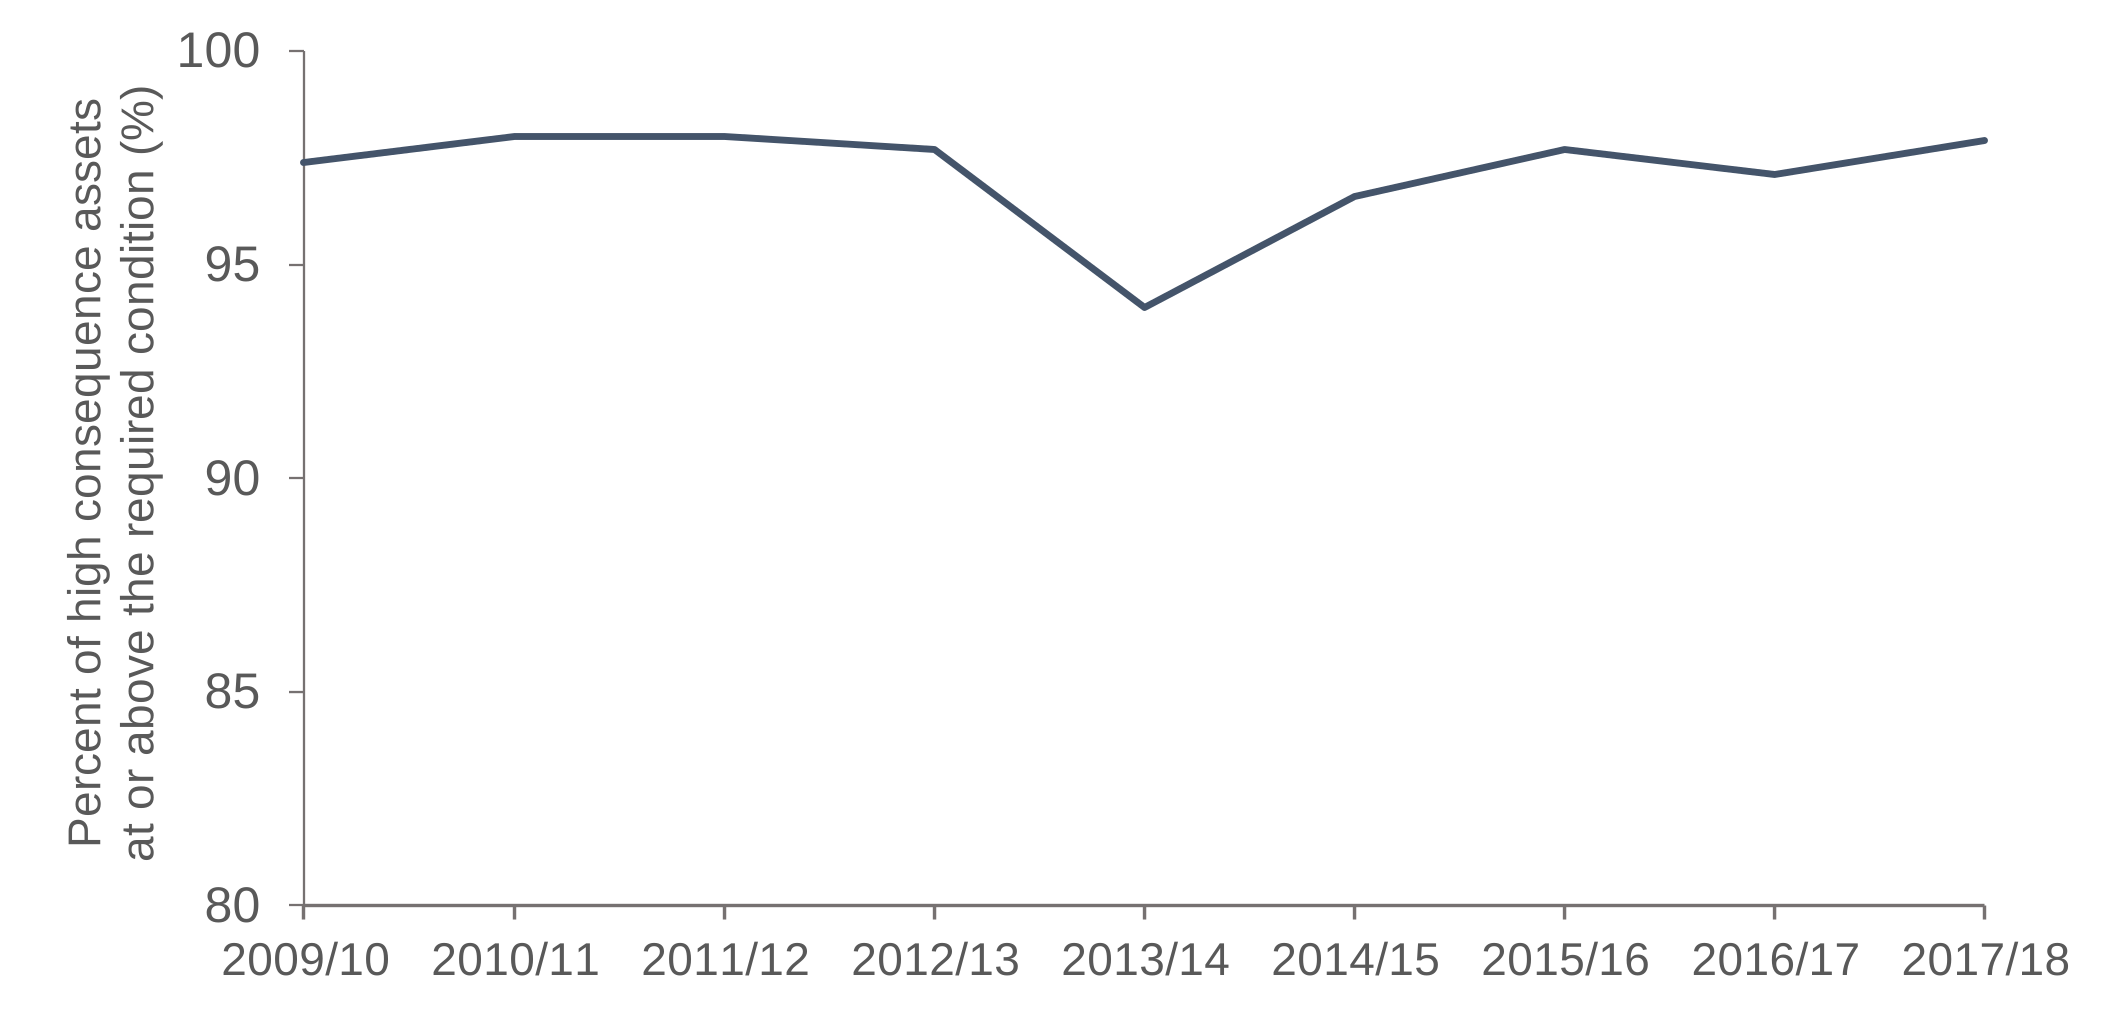
Figure 3 – Condition of High Consequence Flood Defence Assets in England, Q1 2018/19 to Q4 2025/26
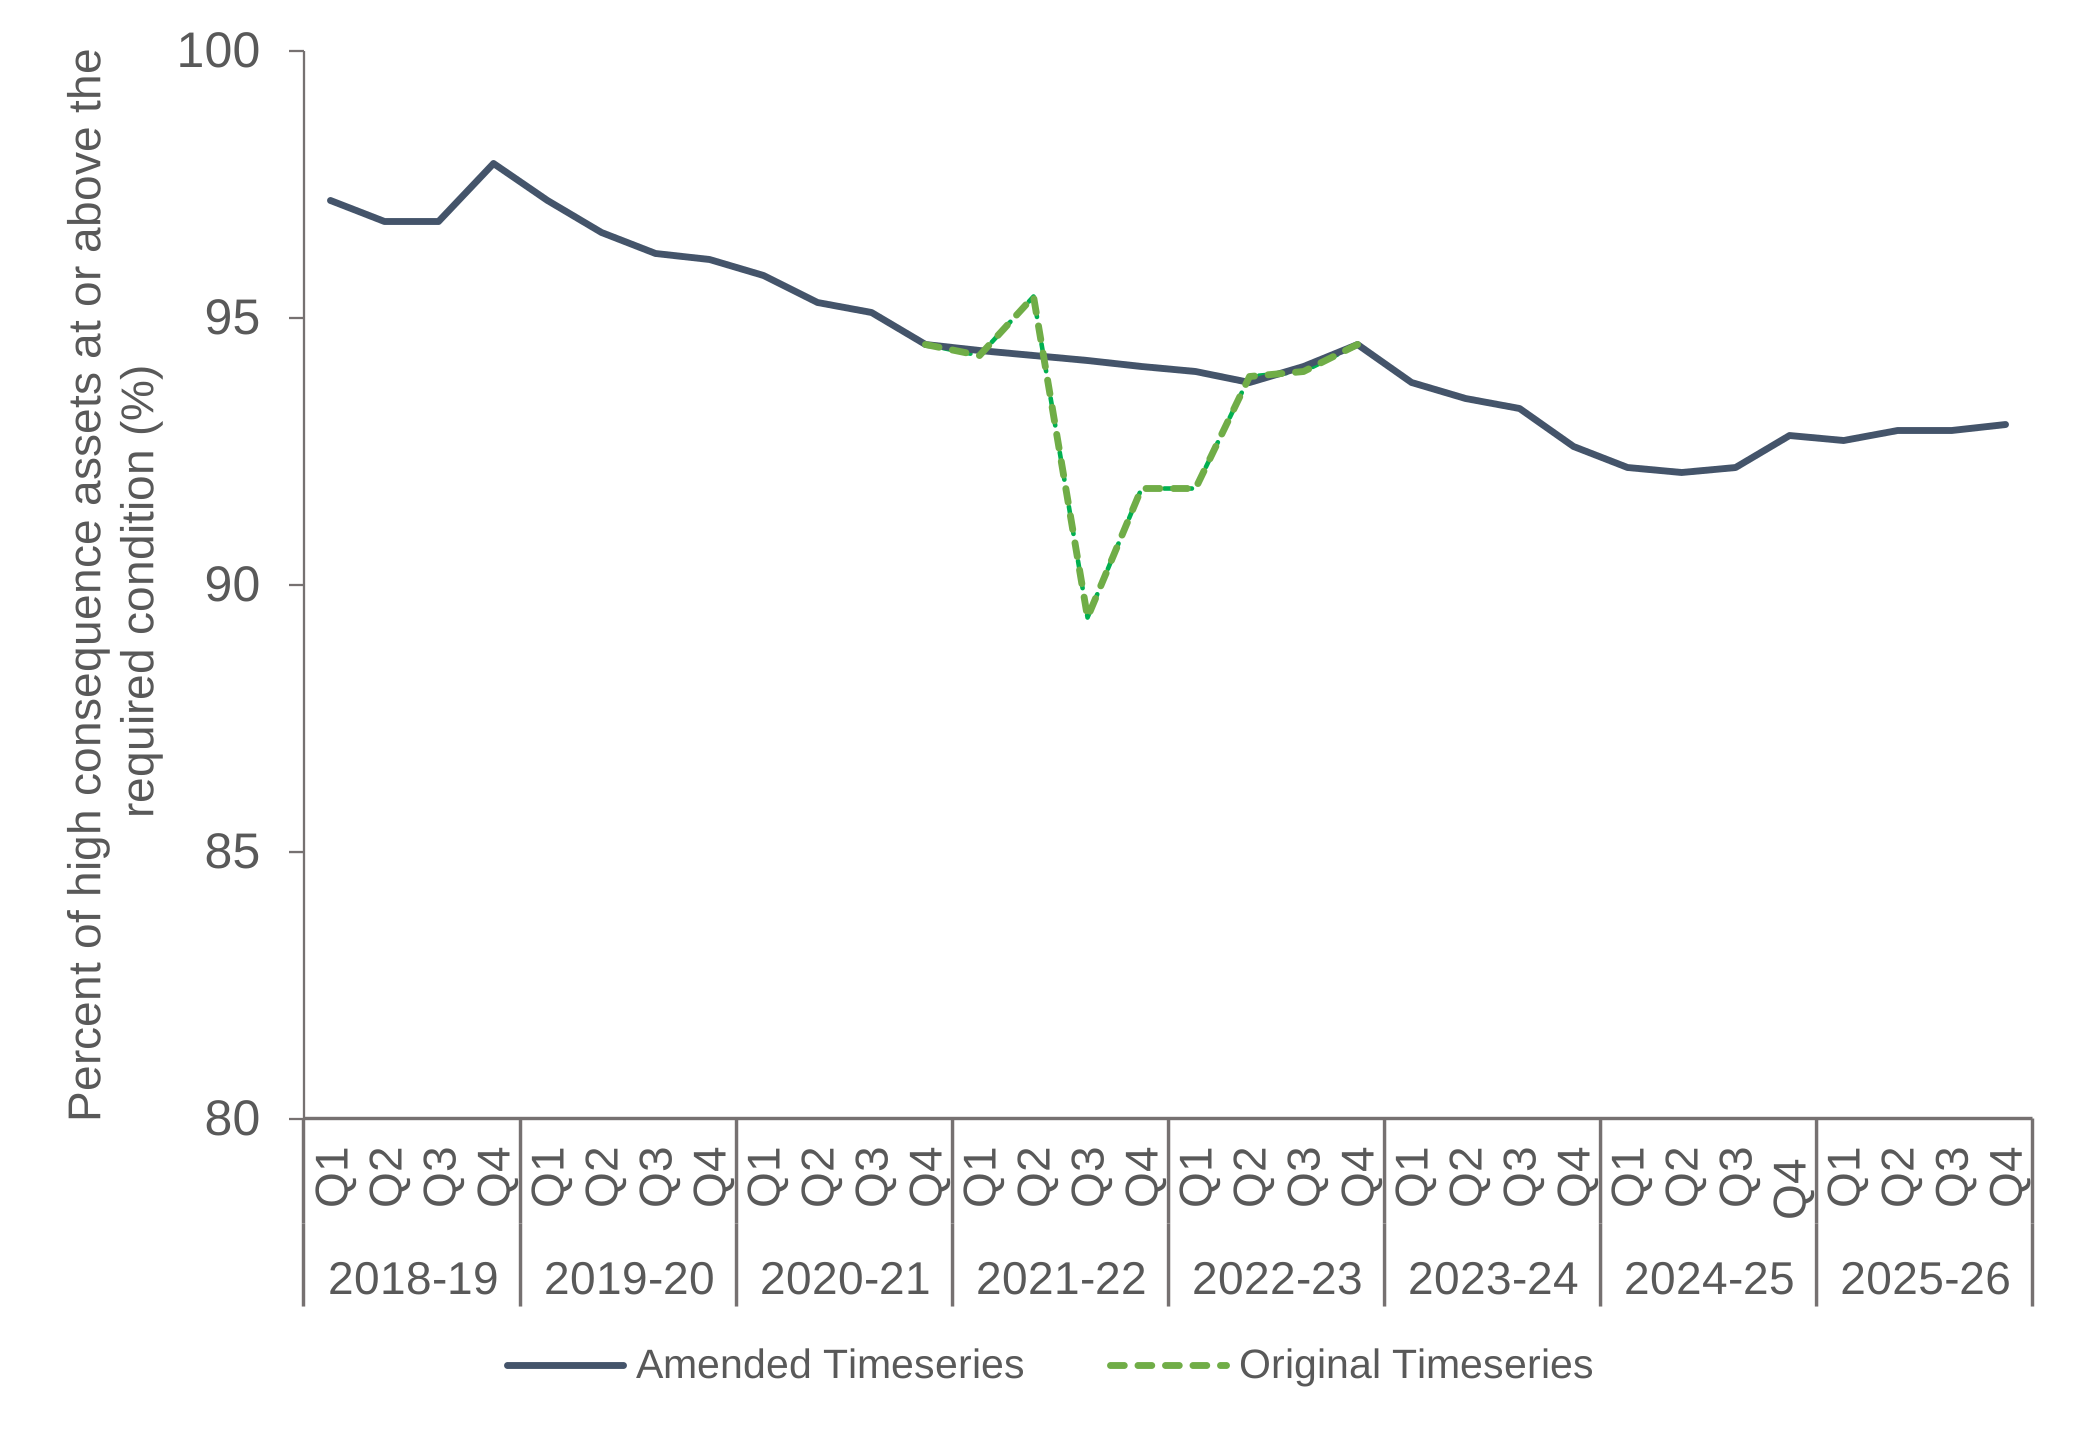
Figure 3 shows that flood defence condition steadily declined from 96.9% in Q1 2018/19 to 92.1% in Q2 2024/25. Since then, condition has stabilised and improved marginally to 93.0% at the end of the 2025/26 financial year.
From Q1 2021/22 to Q4 2022/23, Figure 3 presents the original reported figures for the condition of high consequence assets in England from the Environment Agency’s corporate scorecard, alongside an amended time series. The original figures reflect some anomalies, which resulted from the transition to a new asset system. The amended time series therefore more accurately reflects the true condition of assets during this timeframe.
From April 2028, the Environment Agency plans to replace the current asset condition metric with a new asset health metric. Asset condition is a component of asset health and will be retained as an operational measure, but will no longer be reported as a KPI. From April 2028, the Environment Agency will report asset health as the KPI for existing EA and third-party assets. In addition, the Environment Agency will replace the current three-tier asset system consequence process (high, medium and low consequence) with a five-tier process called asset criticality, which prioritises assets based on the impact of failure. With asset health, each asset type will have a number of health indicators and will be assigned a target health score based on its criticality. The new asset health metric, together with asset criticality, will enable the Environment Agency to better understand asset performance and support better targeting of limited funding to the most critical assets.
Properties Better Protected
The number of properties better protected from flooding and coastal erosion risk is used to measure the output delivered through the FCERM investment programme.
Prior to April 2021, the Environment Agency reported on the number of ‘homes better protected’ (see Figure 4). This was a narrower metric focusing solely on residential dwellings. This has since been replaced by ‘properties better protected’, reflecting a broader approach to risk management that includes businesses, infrastructure and public buildings, alongside homes. A ‘property’ is therefore defined as either a home or a business, including commercial properties and public buildings, at risk of flooding.
A property is ‘better protected’ if its likelihood of flooding has been reduced by investment. This can include the creation of new flood or coastal defences, or the improvement, refurbishment or replacement of existing ones. To be counted, properties must move into a lower flood likelihood band as a result of the investment[footnote 1]. Properties are counted in the year a scheme, or the relevant part of a scheme, completes, although the benefit to the property is over the lifetime of the asset. The figures represent a modelled estimate of the number of properties benefiting from an intervention over the lifetime of an asset[footnote 2].
Figure 4 – Total Homes Better Protected from Flooding 2010/11 to 2020/21
| Financial Year | Homes Better Protected |
|---|---|
| 2010/11 | 79,000 |
| 2011/12 | 43,300 |
| 2012/13 | 55,700 |
| 2013/14 | 40,500 |
| 2014/15 | 32,600 |
| 2015/16 | 54,500 |
| 2016/17 | 42,500 |
| 2017/18 | 45,900 |
| 2018/19 | 50,800 |
| 2019/20 | 48,700 |
| 2020/21 | 72,000 |
Figure 4 – Total Properties Better Protected from Flooding 2021/22 to 2025/26
| Financial Year | Properties Better Protected |
|---|---|
| 2021/22 | 32,900 |
| 2022/23 | 26,400 |
| 2023/24 | 28,900 |
| 2024/25 | 27,500 |
| 2025/26 | 34,400 |
A total of 150,170 properties have been better protected across the full five-year programme since April 2021. Between April 2024 and March 2026, almost 62,000 properties were better protected from flooding, exceeding the Environment Agency’s original target of 52,000.
The number of properties better protected each year can vary depending on the profile of projects within the investment programmes, including their size, complexity and stage of delivery. As the programme progresses, annual totals reflect when schemes are completed and become operational, with larger schemes often delivering protection to a greater number of properties in a single year.
The Environment Agency and Defra have developed new outcome and output metrics for the new investment programme to drive the best FCERM outcomes and communicate the benefits of FCERM investment to different audiences. As of April 2026, Defra replaced the old headline metric of ‘properties better protected’ (PBP) with the new output metric ‘properties benefiting’ (PB).
The new PB metric counts the number of all properties directly benefiting from a reduction in flood or coastal erosion risk due to new flood defences, or from prevented increases in risk due to the refurbishment and replacement of existing assets. It counts all properties where the likelihood or consequence of flooding has been reduced by investment by any measurable amount, not just those that have moved to a lower risk band. This will better capture the impact of a wider range of resilience measures, such as nature-based solutions, property flood resilience and sustainable drainage systems, in line with Defra’s new flood funding policy.
7. Funding Trends
Table 3 – Total Flood and Coastal Erosion Risk Management Expenditure, 2005/06 to 2024/25 (£m)
| Financial Year | Total | Total Real Terms | Rolling 5-year Average (Real Terms) |
|---|---|---|---|
| 2005/06 | 508.7 | 829.1 | n/a |
| 2006/07 | 506.9 | 802.1 | n/a |
| 2007/08 | 499.8 | 775.7 | n/a |
| 2008/09 | 567.6 | 849.3 | n/a |
| 2009/10 | 633.1 | 935.2 | 838.3 |
| 2010/11 | 670.1 | 973.3 | 867.1 |
| 2011/12 | 572.9 | 814.7 | 869.6 |
| 2012/13 | 576.3 | 805.6 | 875.6 |
| 2013/14 | 606.2 | 830.1 | 871.8 |
| 2014/15 | 802.6 | 1,083.7 | 901.5 |
| 2015/16 | 710.8 | 953.1 | 897.4 |
| 2016/17 | 794.9 | 1,045.0 | 943.5 |
| 2017/18 | 777.0 | 1,008.7 | 984.1 |
| 2018/19 | 792.4 | 1,005.7 | 1,019.2 |
| 2019/20 | 866.7 | 1,071.8 | 1,016.9 |
| 2020/21 | 1,063.2 | 1,249.5 | 1,076.1 |
| 2021/22 | 1,100.2 | 1,289.9 | 1,125.1 |
| 2022/23 | 1,065.7 | 1,167.3 | 1,156.8 |
| 2023/24 | 1,236.2 | 1,286.5 | 1,213.0 |
| 2024/25 | 1,402.0 | 1,402.0 | 1,279.0 |
Table notes
(1) Real terms figures are shown in 24/25 prices, using HM Treasury’s GDP Deflator (June 2026 publication). Real and nominal quantities are not identical in the base year because quarterly deflators have been used.
Government funding varies from year to year. This is partly because the need for work varies, including in response to significant flood events. This means that comparing any two years in isolation may not give a good indication of trends in spending.
Spending in real terms dropped between 2021/22 and 2022/23 but increased in 2023/24 and 2024/25. The five-year average shows funding sustained at over £1 billion for the last seven years. The five-year rolling figure is calculated using the figures for the five years ending in the financial year for which the average is given.
8. Other Funding for Flood and Coastal Erosion Risk Management
Table 4 – Total expenditure through central government, 2005/06 to 2024/25 (£m)
| Financial Year | Total Central Government | EA Local Levy | EA Funding from Other Sources | Total | Total Real Terms |
|---|---|---|---|---|---|
| 2005/06 | 508.7 | 19.7 | 41.6 | 570.0 | 929.1 |
| 2006/07 | 506.9 | 26.1 | 34.5 | 567.5 | 898.0 |
| 2007/08 | 499.8 | 17.0 | 25.8 | 542.6 | 842.1 |
| 2008/09 | 567.6 | 33.2 | 22.1 | 622.9 | 932.0 |
| 2009/10 | 633.1 | 38.0 | 18.5 | 689.6 | 1,018.6 |
| 2010/11 | 670.1 | 30.8 | 17.1 | 718.0 | 1,042.8 |
| 2011/12 | 572.9 | 33.7 | 16.9 | 623.5 | 886.7 |
| 2012/13 | 576.3 | 20.2 | 27.2 | 623.7 | 871.8 |
| 2013/14 | 606.2 | 29.1 | 39.4 | 674.7 | 923.9 |
| 2014/15 | 802.6 | 24.1 | 42.9 | 869.6 | 1,174.2 |
| 2015/16 | 710.8 | 18.2 | 55.8 | 784.8 | 1,052.4 |
| 2016/17 | 794.9 | 27.1 | 55.0 | 877.0 | 1,152.9 |
| 2017/18 | 777.0 | 29.3 | 49.8 | 856.1 | 1,111.3 |
| 2018/19 | 792.4 | 35.5 | 42.8 | 870.7 | 1,105.1 |
| 2019/20 | 866.7 | 38.9 | 38.0 | 943.6 | 1,166.8 |
| 2020/21 | 1,063.2 | 26.6 | 71.0 | 1,160.8 | 1,364.2 |
| 2021/22 | 1,100.2 | 30.0 | 51.7 | 1,181.9 | 1,385.6 |
| 2022/23 | 1,065.7 | 27.4 | 53.2 | 1,146.3 | 1,255.6 |
| 2023/24 | 1,236.2 | 35.7 | 42.9 | 1,314.9 | 1,368.3 |
| 2024/25 | 1,402.0 | 40.0 | 58.7 | 1,500.6 | 1,500.6 |
In addition to the funding provided by central government, the EA’s Regional Flood and Coastal Committees raise funding through a local levy for flood management schemes. This is spent through the EA but is not included in Table 1, Table 2 or Table 3, as it is raised locally rather than provided through central government.
The EA also raises other funding for flood and coastal erosion risk management from outside central government. This includes a proportion of income raised through the partnership funding scheme that comes through the EA, internal drainage board precepts, General Drainage Charges and the sale of assets.
Table 4 shows all expenditure by central government, as set out in Table 3, together with other expenditure by the EA funded from the local levy and other sources, including partnership funding contributions to EA schemes that are partially funded by Defra.
The table does not include partnership funding raised by other risk management authorities, internal drainage board funding raised from drainage charges and special levies, or local authority funding from their Fair Funding Allocation (FFA) spent on flood or coastal erosion risk management, except for the element of FFA given to LLFAs detailed in Table 1 and Table 2 above. This funding is not reported here because it is a matter for local authorities, which are free to set their own priorities and are accountable to local communities for the effectiveness of their spending decisions.
9. Regional breakdown
Table 5a – Total expenditure through central government by Regional Flood and Coastal Committee (RFCC), 2022/23 (£m)
| RFCC | All EA FCERM funding excluding Local Levy Resource | All EA FCERM funding excluding Local Levy Capital | EA Local Levy | Total |
|---|---|---|---|---|
| RFCC Anglian Great Ouse | 17.6 | 9.7 | 0.6 | 27.9 |
| RFCC Anglian Eastern | 34.3 | 43.6 | 0.7 | 78.5 |
| RFCC Anglian Northern | 33.9 | 40.9 | 0.9 | 75.6 |
| RFCC Trent | 34.5 | 46.6 | 1.9 | 83.0 |
| RFCC Severn and Wye | 15.0 | 14.5 | 0.2 | 29.8 |
| RFCC Northumbria | 10.1 | 13.4 | 0.8 | 24.3 |
| RFCC Yorkshire | 39.6 | 93.9 | 1.0 | 134.6 |
| RFCC North West | 44.4 | 77.8 | 3.9 | 126.2 |
| RFCC Southern | 35.3 | 93.5 | 0.7 | 129.5 |
| RFCC Thames | 60.7 | 53.3 | 12.0 | 126.1 |
| RFCC South West | 15.3 | 42.3 | 0.7 | 58.3 |
| RFCC Wessex | 27.1 | 49.4 | 3.9 | 80.3 |
| Total EA RFCC Spend | 367.7 | 579.1 | 27.4 | 974.2 |
Table 5b – Total expenditure through central government by Regional Flood and Coastal Committee (RFCC) 2023/24 (£m)
| RFCC | All EA FCERM funding excluding Local Levy Resource | All EA FCERM funding excluding Local Levy Capital | EA Local Levy | Total |
|---|---|---|---|---|
| RFCC Anglian Great Ouse | 17.1 | 5.5 | 0.7 | 23.3 |
| RFCC Anglian Eastern | 40.6 | 58.9 | 1.7 | 101.1 |
| RFCC Anglian Northern | 42.5 | 56.9 | 0.4 | 99.9 |
| RFCC Trent | 39.6 | 29.1 | 1.9 | 70.6 |
| RFCC Severn and Wye | 21.2 | 14.0 | 0.9 | 36.2 |
| RFCC Northumbria | 13.6 | 13.8 | 3.1 | 30.6 |
| RFCC Yorkshire | 43.3 | 56.9 | 2.1 | 102.3 |
| RFCC North West | 45.3 | 74.5 | 5.9 | 125.7 |
| RFCC Southern | 47.7 | 102.1 | 1.7 | 151.5 |
| RFCC Thames | 67.8 | 67.3 | 9.9 | 145.0 |
| RFCC South West | 18.3 | 37.2 | 1.3 | 56.8 |
| RFCC Wessex | 40.0 | 77.4 | 6.0 | 123.4 |
| Total EA RFCC Spend | 437.0 | 593.7 | 35.6 | 1,066.4 |
Table 5c – Total expenditure through central government by Regional Flood and Coastal Committee (RFCC) 2024/25 (£m)
| RFCC | All EA FCERM funding excluding Local Levy Resource | All EA FCERM funding excluding Local Levy Capital | EA Local Levy | Total |
|---|---|---|---|---|
| RFCC Anglian Great Ouse | 17.9 | 9.3 | 0.8 | 28.0 |
| RFCC Anglian Eastern | 39.5 | 100.6 | 3.0 | 143.1 |
| RFCC Anglian Northern | 42.9 | 49.9 | 0.9 | 93.7 |
| RFCC Trent | 39.2 | 32.7 | 2.1 | 74.0 |
| RFCC Severn and Wye | 22.0 | 13.4 | 0.7 | 36.2 |
| RFCC Northumbria | 12.9 | 21.5 | 1.8 | 36.3 |
| RFCC Yorkshire | 47.0 | 97.5 | 3.3 | 147.8 |
| RFCC North West | 43.4 | 89.6 | 5.5 | 138.6 |
| RFCC Southern | 47.6 | 94.9 | 2.3 | 144.8 |
| RFCC Thames | 68.3 | 78.1 | 15.7 | 162.1 |
| RFCC South West | 23.3 | 26.4 | 1.2 | 50.9 |
| RFCC Wessex | 31.1 | 125.3 | 2.6 | 159.0 |
| Total EA RFCC Spend | 435.1 | 739.3 | 40.0 | 1,214.4 |
Table 5 shows central government expenditure through the EA in RFCC areas, together with expenditure by the EA funded from the local levy. The Capital figures in this table include expenditure funded from partnership funding contributions to EA-led schemes.
There are 12 RFCCs across England, each covering a distinct regional area. These areas are different from the 9 English regions as used by the Office for National Statistics (ONS) for statistical purposes. More information regarding the role and responsibilities of RFCCs can be found here.
The table does not include expenditure funded from partnership funding raised by other risk management authorities, Internal Drainage Board funding raised from drainage charges and special levies, or local authority funding from their Fair Funding Allocation (FFA) spent on flood or coastal erosion risk management (except the element of FFA given to LLFAs detailed in Tables 1 and 2 above), for the reasons set out above.
The amount of Local Levy raised by the EA varies across areas because levies are dependent on geographic area, the number of B and D properties, the RFCC local choices to deliver area-based flood protection and the history and choice RFCCs exercise in agreeing to annual levy increases. Amounts of levies raised in areas can also vary from year to year because RFCCs agree on annual levy increases, which considers balance of funds held, the local choices to fund local flood protection initiatives and the committed funding of Flood Schemes. This means that comparing levies raised in any given year in isolation does not give a good indication of trends in spending.
Table 6 – Total EA FCERM expenditure 2022/23 to 2024/25 (£m)
| Category | 2022/23 Resource | 2022/23 Capital | 2023/24 Resource | 2023/24 Capital | 2024/25 Resource | 2024/25 Capital |
|---|---|---|---|---|---|---|
| Total EA RFCC Spend | 367.7 | 579.1 | 437.0 | 593.7 | 435.1 | 739.3 |
| EA National Spend | 71.9 | 36.4 | 137.7 | 49.7 | 134.0 | 89.4 |
| FCERM Income | -21.6 | -31.7 | -21.3 | -21.7 | -18.3 | -40.3 |
| Total EA Expenditure | 418.1 | 583.8 | 553.4 | 621.7 | 550.8 | 788.4 |
Table 6 shows total expenditure by the EA for both Resource and Capital, split by spend on regional and national level between 2022/23 and 2024/25.
Total EA RFCC Resource expenditure is incurred to principally deliver an asset maintenance programme to ensure operational assets provide agreed standards of protection to the environment, people and properties and the provision of resource to support delivery of the FCRM capital programme. This figure does not include wider Resource funding as shown in Table 4, which also includes Resource spend on nationally led projects, EA national services and the EA’s contribution to Defra’s Corporate Services.
EA national spend includes Capital expenditure for national-led projects such as the Asset Information Management Systems (AIMS), Flood Warning Systems and other IT based solutions that help manage and drive efficiencies in ways of working that support the capital and maintenance programmes. National Resource expenditure covers the EA National Teams including the FCERM Directorate, the Incident Management and Resilience Directorate, Major Projects and Programme Delivery and the Chief Operating Officer Directorate as well as contributions to Defra Corporate Services.
FCERM Income includes contributions received for EA-led projects, such as Partnership Funding contributions.
10. Updates to this document
This document will typically be updated on an annual basis following the publication of Defra’s Annual Report and Accounts. The prior financial year’s actual spend will be updated, together with the current and next years’ budget figures.
Statistics on FCERM budget and expenditure were last published in 2022/23. This publication including data for the three subsequent years with actual expenditure up to 2024/25 and agreed budget to 2025/26. For the first time, this publication also brings together statistics on the funding allocated to flood asset maintenance and condition of flood assets, as well as the number of properties better protected from flooding.
These statistics have been produced to the high professional standards set out in the Code of Practice for Statistics. More information on the Code of Practice for Statistics can be found at Code of Practice for Statistics (statisticsauthority.gov.uk).
In addition to staff in Defra and the Environment Agency who are responsible for the production and quality assurance of the statistics, a limited number of people were granted 24 hours pre-release access to this release. You can find a list of the job titles and organisations of these people here.
The responsible statistician is Lauren Elias – lauren.elias@defra.gov.uk
11. Sources and other relevant publications
The figures in this document have been taken from Defra and EA accounting systems and historical management information. Details of other relevant publications are set out in the table below:
| Publication | Relevance |
|---|---|
| Defra Annual Report and Accounts 2024/25 | Figures in the Consolidated ARA include Local Levy, Depreciation, AME, Evidence and Core Floods Admin. They exclude the Settlement Funding Assessment element of expenditure by LLFAs and Capital Assets. |
| EA Annual Report and Accounts 2024/25 | Figures in EA’s ARA include local levy and Evidence. |
| Introductory Guide to Partnership Funding | Separate Defra guidance on the FCERM funding policy. |
| Local authority revenue expenditure and financing | Showing latest local authority budgets in 2026/27 relating to their Settlement Funding Assessment. |
| Local authority capital expenditure, receipts and financing | Showing latest local authority revenue expenditure and financing in England: 2024 to 2025 individual local authority outturn. |
| Main Estimates and Supplementary Estimates | The Main Estimates show the budgets approved by Parliament for a given financial year. The Supplementary Estimates update these amounts in-year. The Estimates have a discreet heading for the EA element of FCERM spend: ‘Prepare for and Manage Risk from Environmental Emergencies (NDPB)’, whereas Core Defra FCERM spend is wrapped up in the heading ‘Prepare for and Manage Risk from Environmental Emergencies’. The Estimates include Local Levy, Depreciation, Evidence and Core Floods Admin. They exclude the Settlement Funding Assessment element of funding to LLFAs and any agreed over/underspends against budget. The Supplementary Estimate differs from the Main Estimate as it includes any agreed in-year budget movements. |
| Public Expenditure Statistical Analyses (PESA) and Country and Regional Analysis 2025 (CRA) | The figures used in these statistical publications cover the EA element of FCERM spend only. These figures are not discreet in the publications but are wrapped up in the heading ‘Environment Protection’. They include Local Levy, Depreciation and Evidence and make additional adjustments, including for grants to and from local government, impairments/revaluation of assets, and profit on disposal of assets. |
| Transparency publications of the OSCAR database | EA spending data is separately identifiable in this database, which underlies the PESA and CRA publications. |
| GDP Deflator June 2026 | Produced quarterly by HM Treasury and used as a measure of general inflation in the domestic economy to produce an inflation-adjusted figure for public sector spending. |
| Managing Public Money and Consolidated Budgeting Guidance | HMT guidance on managing and accounting for public funds. |
Footnotes: