Impacts on Local Area Broadband Performance: Output Area Analysis
Published 1 October 2026

© Crown copyright 2026
This publication is licensed under the terms of the Open Government Licence v3.0 except where otherwise stated. To view this licence, visit nationalarchives.gov.uk/doc/open-government-licence/version/3 or write to the Information Policy Team, The National Archives, Kew, London TW9 4DU, or email: psi@nationalarchives.gov.uk.
Where we have identified any third party copyright information you will need to obtain permission from the copyright holders concerned.
This publication is available at https://www.gov.uk/government/publications/final-evaluation-of-bduk-legacy-vouchers-schemes/impacts-on-local-area-broadband-performance-output-area-analysis
1. Summary of key findings
This report measures the effect of vouchers on the performance of broadband in output areas, as measured by change in the average download speed. A summary of key findings is provided below, structured around the three key research questions that the report aims to address.
What changes in coverage and average download speeds have been achieved through the schemes, and what proportion of these improvements would have occurred in the absence of vouchers (deadweight)?
It has not been possible to assess voucher impacts on coverage outcomes. At very local levels the Connected Nations data show inconsistencies, including cases where gigabit coverage appears to fall in voucher areas, suggesting that the effects of vouchers are not being accurately or consistently recorded. For this reason, the report focuses on average download speeds, which provide a more reliable proxy for access. This method is still imperfect as average download speeds are influenced by household and business take-up.
The analysis shows that output areas that received vouchers consistently experienced much larger changes in average download speeds than similar control areas, indicating that vouchers generated additional effects. The scale of these effects varies depending on treatment year, and the timeframe considered. For areas that received their first voucher in 2018 and 2021, around half of the change in download speeds after one year at output area level can be attributed to vouchers. Effects in 2019 and 2020 were smaller but still statistically significant, implying a higher level of deadweight, but that vouchers still played an important role.
Over what timeframe have these impacts emerged and persisted?
The evidence shows that the impacts of vouchers persist well beyond the year of connection. For areas supported in 2018, 2019 and 2020, average download speeds remained around 50% higher than control areas even three years after treatment. This demonstrates that voucher effects were not short-lived but provided durable improvements in broadband performance.
Was the design of voucher schemes effective?
The report also considers whether different voucher schemes and voucher types were more effective in delivering additional improvements in broadband performance. In this report, effectiveness is defined in terms of the additional change in download speeds attributable to vouchers, and therefore the extent to which vouchers minimised deadweight. The findings are summarised below:
-
Voucher schemes: Overall, the analysis suggests that Rural Gigabit Connectivity(RGC) vouchers were more effective and cost-effective than Gigabit Broadband Voucher Scheme(GBVS) vouchers at delivering additional improvements in download speeds, although results vary by year. This is consistent with the design of RGC, which was targeted at rural areas where deadweight was expected to be low. By contrast, GBVS was designed to stimulate an emerging gigabit market, including in more commercially attractive areas, where some deadweight may have been anticipated. As a result, assessing effectiveness in terms of additional speed gains naturally favours RGC. The market-stimulation role of GBVS is assessed separately in Report 6.
-
Voucher types: The results indicate that project vouchers were generally more effective and cost-effective than standard vouchers, particularly in later years. While there are some year-to-year inconsistencies, the overall pattern suggests that project vouchers became more effective over time, reflecting their growing focus on rural areas.
-
Voucher value (top-ups): The analysis finds no evidence that top-up vouchers led to greater improvements in average download speeds compared with standard vouchers. Areas receiving top-ups had higher average voucher values, but this did not consistently translate into greater speed improvements. However his should be interpreted with care. Top-ups were designed to support more remote and higher-cost premises, where achievable speeds may be lower and wider network expansion less likely. As a result, changes in average download speed are a limited indicator of the effectiveness of top-up vouchers.
2. Purpose of report
This report measures the effect of vouchers on the performance of broadband in output areas, as measured by the average download speed. It does this using counterfactual analysis of data from Connected Nations, a dataset released annually by Ofcom on the coverage and usage of fixed broadband and mobile networks within the UK. This compares the change in average download speeds in areas that were supported by vouchers (treatment areas) with similar areas that had not received support (control areas). By measuring the difference between these two groups it allows us to estimate the additional impact on broadband performance that can be attributed to vouchers (referred to as the additional effect).
The section updates the analysis included in the 2023 report, which measured annual changes up to 2021. The analysis in this report measures change up to 2023, allowing a longer-term analysis of the effects of vouchers. Connected Nations stopped reporting average download speeds from 2024 onwards, meaning it is not possible to analyse change beyond 2023.
There is a separate chapter in this evaluation which reports on the effect of vouchers on the performance of broadband by postcode, instead of by output area.
The rationale for undertaking analysis at postcode level as well is that postcodes are smaller geographic units and contain fewer premises than output areas. As a result, observed changes in broadband performance are less affected by premises that did not receive voucher-supported connections, reducing noise in the data and allowing the effects of vouchers to be identified more clearly. Output areas are generally more consistent than postcodes however, so both have merits.
As well as analysing change in average download speeds at output area level, this report includes analysis of vouchers effects at postcode level. This allows a more granular analysis of the effects of vouchers in the specific locations where they were used.
3. Limitations in assessing availability
Unlike the 2023 report, this evaluation does not assess the impact of vouchers on the availability of gigabit-capable or ultrafast broadband. The 2023 analysis highlighted inconsistencies and gaps in the Connected Nations data at a local level, which made it unreliable for measuring changes in availability over time (see the 2023 report for a discussion of the main issues). An updated review of Connected Nations data (see Appendix A) confirms these issues persist, preventing robust longitudinal analysis.
While alternative datasets such as Open Market Review data exist, they also suffer from inconsistencies and do not provide coverage for the full evaluation period (2018–2025). As a result, it has not been possible to analyse availability impacts in this phase.
This is a notable evidence gap. Although changes in average download speeds offer a useful proxy, they reflect both availability and consumer take-up, and therefore cannot isolate the effect of vouchers on infrastructure coverage.
4. Methodology and data limitations
This analysis uses the same approach as the 2023 report to estimate the impact of vouchers on broadband performance. The full method is detailed in the technical annex, but is summarised below:
-
Output Areas (OAs) are the lowest level of geographical area used by the Office for National Statistics and typically have a population between 100 and 625. Due to the availability of datasets aggregated at the OA level, these can be used for evaluation purposes. For this evaluation, an OA is considered ‘treated’ if at least one premise received a voucher, with the voucher-issued date used to establish the year of connection. The exact date of connection is not recorded in Building Digital UK(BDUK) monitoring data, but it was agreed with BDUK that the issue date is the best estimate.
-
The ‘treatment year’ for this analysis runs to end of September, so the treatment year 2018 relates to the period 1 October 2017 to 30 September 2019. This was done to align with the dates of voucher delivery.
-
Propensity Score Matching is used to identify similar, untreated areas to act as control groups.
-
Nine models were developed using different combinations of matching variables and sample pools. These were the same models used in the 2023 report and more details on each model can be found in the technical annex. Key variables used in the matching exercise included urban/rural category, the median estimated cost to build to premises, income and employment in digital sectors and pre-treatment download speed. A full list is provided in the technical annex.
-
Changes in download speeds in treated and control areas are compared using Connected Nations data.
-
If differences are statistically significant we attribute them to the vouchers. When we say a result is statistically significant, we mean that there is a difference between the voucher group and the control group, and that testing has shown that this is unlikely to have occurred by chance. In tables in the report, we show where results are significant to 1%, 5% and 10%. This represents the likelihood of these results occurring by chance, so a lower percent is better. 5% is generally considered the acceptable standard within statistical analysis.
The report presents the full range of estimates from nine models, with the median used as the central estimate. All models have been tested and found to be robust, so the median is not chosen because it is the most reliable, but as a representative midpoint. The estimated effects are consistent across different model specifications, with no conflicting findings; where results vary, they do so in ways that are in line with theoretical expectations. The true effect is likely to fall anywhere within the reported range.
5. Numbers of vouchers and output areas in scope
BDUK monitoring data shows that 41,272 premises were connected via a voucher between 2018 and 2021; 28,940 through the GBVS scheme and 12,332 through the RGC scheme. As shown in the table below most connections in 2018 and 2019 were via GBVS, with a more even split between the schemes in 2020. By 2021, GBVS had closed, so all connections that year were through RGC.
Since the 2023 report, there have been significant revisions to the voucher data, particularly the dates on which vouchers were issued. Many now appear earlier than previously recorded. For example, the number of vouchers issued in 2018 and 2019 has increased (from 2,122 to 4,859 in 2018 and from 11,880 to 16,628 in 2019), while the number for 2021 has decreased (from 9,301 to 3,840). These changes mean the results in this report differ from those reported in 2023 for the same years.
Number of vouchers used by year of connection
| Treatment year | GBVS – standard vouchers | GBVS – project vouchers | RGC vouchers | All vouchers |
|---|---|---|---|---|
| 2018 | 1,773 | 3,031 | 55 | 4,859 |
| 2019 | 6,680 | 8,549 | 1,399 | 16,628 |
| 2020 | 4,019 | 4,888 | 7,039 | 15,946 |
| 2021 | 0 | 0 | 3,839 | 3,840 |
| Total | 12,472 | 16,468 | 12,332 | 41,272 |
| Source: BDUK |
As in the 2023 evaluation, the analysis groups vouchers by the OAs where they were delivered. Often OAs received more than one voucher, and in some cases these vouchers were funded through different schemes. This approach allows us to track how support was distributed geographically and to compare outcomes across areas with varying levels and types of voucher activity.
From 2020 onwards, analysis is complicated by the overlap between the two schemes in scope (GBVS and RGC) and a third scheme, UK Gigabit Voucher(UKGV) scheme, which is being evaluated separately. UKGV vouchers were sometimes used in the same output areas as GBVS and RGC, occasionally in the same treatment year, meaning they may influence the results. These areas are included in the overall analysis but excluded from scheme-level comparisons, which focus only on areas treated exclusively by either GBVS or RGC in the first treatment year. We also present a separate analysis which excludes all areas where UKGV vouchers were used from treatment and control groups.
Each output area is assigned a treatment year based on when it first received a voucher. Many areas received additional vouchers in later years, but these are not treated as separate interventions. However, subsequent vouchers may still affect results over longer time periods, especially where we analyse impacts at the two- and three-year point. This is accounted for in the assessment of treatment-intensity and scheme cost-effectiveness.
The table below shows the number of vouchers used in each output area during its first year of treatment, excluding any additional vouchers received in later years. This is why the number of GBVS, RGC and total vouchers is lower than the previous table. It also presents the number of output areas treated for the first time each year and the average number of vouchers per area, reflecting the intensity of support. The data shows a notable increase in 2021, with average vouchers per area rising from around 3 in 2018–2020 to 9.1 in 2021. Much of this increase is due to UKGV vouchers being used alongside RGC vouchers in the same areas.
Number of vouchers and treated output areas by first treatment year
| GBVS | RGC | UKGVS | Total vouchers | Treated output areas | Mean vouchers per output area | |
|---|---|---|---|---|---|---|
| 2018 | 4,804 | 55 | - | 4,859 | 1,617 | 3.0 |
| 2019 | 11,566 | 1,300 | 59 | 12,925 | 4,650 | 2.8 |
| 2020 | 4,521 | 4,635 | 1,037 | 10,193 | 3,120 | 3.3 |
| 2021 | - | 1,833 | 1,052 | 2,885 | 318 | 9.1 |
| Total | 20,891 | 7,823 | 2,148 | 30,862 |
| Source: BDUK |
6. Overall effects
This section measures the effects of all vouchers on average download speeds in voucher supported areas, including GBVS, RGC and UKGV vouchers where they were used in the same output areas. We then present analysis for GBVS and RGC individually.
The table below summarises the estimated impact of vouchers on average download speeds in output areas one year after connection, by treatment year. The columns show:
-
Gross change – the overall increase in average download speeds in voucher-supported areas one year after connection. This figure is the same across all models.
-
Median additional change – the extra improvement in speeds in voucher areas compared with matched control areas. This represents the part of the speed increase that can be attributed to vouchers. Because nine different sets of control areas are used, the figure shown is the median result. Asterisks indicate statistical significance, with more asterisks showing higher confidence in the result.
-
Additional change range – the lowest and highest estimates of additional change across all nine models, along with whether these were statistically significant.
-
Models significant – the number of models in which the difference between voucher and control areas was statistically significant, defined as significance at the 5% level which is the standard threshold used in evaluation.
-
Median additionality – the share of the gross change that can be attributed to vouchers in the median model (for example, a value of 49% means about half of the observed speed increase is due to vouchers).
Nearly all models found a statistically significant positive effect across all years i.e. voucher areas experienced greater increases in average download speeds than similar areas without vouchers. There was only one model in the treatment year 2020 which found a greater increase in speed, but the change was not statistically significant.
The greatest impact was observed in 2021, with effects ranging from 16.8 to 19 Megabits per second(Mbps) and a median effect of 17.4 Mbps. This was nine times higher than in 2019 and 2020, and nearly double the 2018 effect. However, this does not indicate that vouchers were more effective in 2021. Two factors help explain the larger effect:
-
Download speeds increased across all areas (treated and control areas) over time, as demand for higher bandwidth grew.
-
The intensity of support in 2021 was much higher; average vouchers per output area were roughly three times greater than in earlier years.
The figures for median additionality in 2018 and 2021 show that additionality in each of these treatment years was broadly similar. In 2021, 48% of the speed increase was due to vouchers, more than three times higher than in 2019 and 2020, but similar to 2018 (49%). Given the much higher voucher intensity in 2021, this suggests individual vouchers may have been more effective in 2018.
One possible explanation for this is that early vouchers were taken up by ‘early adopters’ - mainly businesses with an urgent need for faster broadband. In the early phase of vouchers, both suppliers and BDUK reported that take-up was more demand-led, whereas in later years, suppliers relied more on having to identify and generate demand through promotion and marketing. The early voucher schemes were also more heavily focused on businesses; 83% of vouchers in 2018 were used by businesses, compared to just 14% in 2021. It is therefore plausible that these early users made more intensive use of the connection as they already had an identified need for higher bandwidth, leading to a greater observed impact per voucher.
However, we find no evidence in BDUK monitoring data to confirm this. If early users had higher bandwidth needs, we would expect them to access faster speeds after connection. In fact, the opposite is true: the median download speed for voucher recipients increased from 100 Mbps in 2018 to 330 Mbps in 2021, and the mean from 243 Mbps to 380 Mbps. While national broadband speeds also increased over this period, the rise among voucher users was much greater; across the UK, the median speed rose from 37 Mbps to 61 Mbps, and the mean from 49 Mbps to 87 Mbps.
Additional change in average download speeds after one year in voucher supported output areas (Mbps)
| Treatment year | Gross change (Mbps) | Median additional change | Additional change range | Models significant | Median additionality |
|---|---|---|---|---|---|
| 2018 | 18.4 | 9.0*** | 3.8** to 10.8*** | 9 out of 9 | 49% |
| 2019 | 13.0 | 1.9*** | 1.3** to 2.1*** | 9 out of 9 | 14% |
| 2020 | 14.8 | 1.9*** | 1.2 to 2.6*** | 8 out of 9 | 13% |
| 2021 | 36.5 | 17.4*** | 16.8*** to 19.0*** | 9 out of 9 | 48% |
| Source: Belmana |
| Note: Significance levels are 1% (***), 5% (**) and 10% (*). |
The table below analyses the effects of vouchers over a two-year period. This shows a similar pattern to effects over one year. All of the models found that vouchers had a statistically significant effect on average download speeds in supported areas. The additional change was greatest for output areas treated in 2021. However, the proportion of speed change attributable to vouchers (median additionality) was similar for areas treated in 2018 and 2021, and much greater than in 2019 and 2020. Given the higher number of vouchers per OA in 2021, this suggests the early vouchers were most effective at increasing average download speeds.
Additional change in average download speeds after two years in voucher supported output areas (Mbps)
| Treatment year | Gross change (Mbps) | Median additional change | Additional change range | Models significant | Median additionality |
|---|---|---|---|---|---|
| 2018 | 33.0 | 12.2*** | 6.5*** to 14.4*** | 9 out of 9 | 37% |
| 2019 | 29.7 | 4.8*** | 4.0*** to 6.1*** | 9 out of 9 | 16% |
| 2020 | 45.2 | 9.7*** | 7.6*** to 11.3*** | 9 out of 9 | 22% |
| 2021 | 80.7 | 31.4*** | 27.9*** to 36.9*** | 9 out of 9 | 39% |
| Source: Belmana |
| Note: Significance levels are 1% (***), 5% (**) and 10% (*). |
The table below presents results over three years. It is not possible to analyse change for vouchers connected in 2021 over three years as Connected Nations stopped reporting average download speeds from 2024. Again this shows that most models found vouchers had a statistically significant effect with the exception of two models for vouchers connected in 2020, meaning the effects of vouchers persist for at least three years from the date of voucher connection. This also suggests that vouchers connected in 2018 were more effective than voucher connections in 2019 and 2020.
Additional change in average download speeds after three years in voucher supported output areas (Mbps)
| Treatment year | Gross change (Mbps) | Median additional change | Additional change range | Models significant | Median additionality |
|---|---|---|---|---|---|
| 2018 | 47.7 | 13.7*** | 8.0*** to 16.2*** | 9 out of 9 | 29% |
| 2019 | 56.3 | 7.4*** | 6.6*** to 10.2*** | 9 out of 9 | 13% |
| 2020 | 77.6 | 6.3*** | 3.8 to 9.3** | 7 out of 9 | 8% |
| Source: Belmana |
| Note: Significance levels are 1% (***), 5% (**) and 10% (*). |
6.1 Results when UKGV areas are removed
As noted earlier in the report, the results in the table above include OAs where UKGV vouchers were used alongside GBVS or RGC vouchers in the first treatment year. The table below shows how the median effects of vouchers on average download speeds changes when any output area where UKGV vouchers were used are excluded from the analysis. This analysis also excludes areas that were initially supported by GBVS or RGC but then received vouchers through UKGV within three years.
Excluding UKGV areas reduces the apparent impact of GBVS and RGC vouchers. In some cases, no statistically significant difference remains between treated and control areas, implying that vouchers had no measurable effect. This is particularly evident for treatment years 2020 and 2021, when many OAs received a mix of UKGV and in-scope vouchers.
Several factors help explain this. First, removing UKGV areas reduces sample sizes, which weakens statistical confidence. For 2021, the number of treated OAs falls from 1,853 to just 181, highlighting the substantial overlap between RGC and UKGV. Second, UKGV areas typically received a higher intensity of support. For example, in 2020 the average number of vouchers per OA in the first treatment year drops from 3.3 to 1.6 when UKGV areas are excluded, and total support over three years falls from 6.8 vouchers per OA to 2.2. Finally, UKGV vouchers tended to be used in more rural and hard-to-reach areas, particularly when compared to GBVS vouchers, so the OAs remaining in the sample in 2020 are more likely to be commercial areas with a higher probability of being connected through the market roll-out, meaning deadweight (improvements in broadband speeds that would have happened in the absence of vouchers) is likely to be higher.
Taken together, these factors show that GBVS and RGC effects cannot be cleanly separated from UKGV. The schemes were highly interwoven, particularly RGC and UKGV, and excluding overlapping areas removes those OAs where vouchers had the greatest impact. We therefore conclude that it is not possible to fully isolate the effects of GBVS and RGC vouchers without substantially distorting the results.
Median additional change in average download speeds over one, two and three years when UKGV output areas are excluded
| Treatment year | UKGV included or excluded | Number of OAs | 1 year median effect | 2 year median effect | 3 year median affect |
|---|---|---|---|---|---|
| 2019 | Including UKGV | 3,887 | 1.9*** | 4.8*** | 7.4*** |
| Excluding UKGV | 3,557 | 0.7 | 2.5*** | 4.9*** | |
| 2020 | Including UKGV | 2,851 | 1.9*** | 9.7*** | 6.3*** |
| Excluding UKGV | 2,167 | 1.8** | 0.3 | -0.5 | |
| 2021 | Including UKGV | 1,853 | 17.4*** | 31.4*** | n.a. |
| Excluding UKGV | 181 | 12.1*** | 4.1 | n.a. |
| Source: Belmana |
| Note: Significance levels are 1% (***), 5% (**) and 10% (*). |
6.2 Relationship between value of voucher investment and change in average download speeds
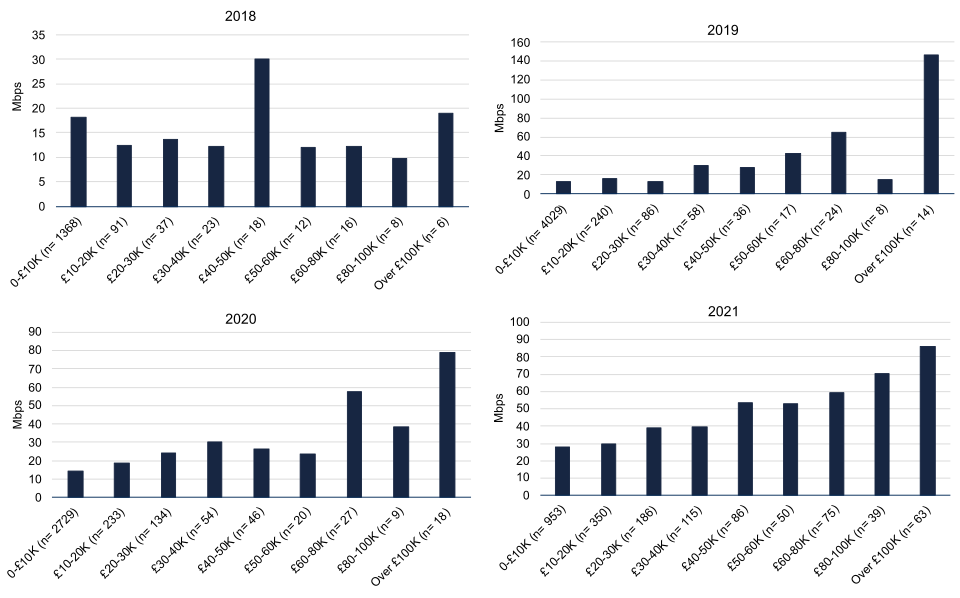
The charts below show notable differences in the relationship between the value of voucher investment output areas received and the change in average download speeds for different treatment years. In 2018, there is no clear correlation between the value of investment and the speed increase one year after connection. However, in later years, particularly 2021, there is much stronger evidence of a correlation, suggesting that higher investment was more consistently associated with greater improvements in download speeds.
The findings should be interpreted with caution, as sample sizes for areas receiving higher levels of investment (over £50,000) are very small in some years. Sample sizes are larger for 2021, which may partly explain the more consistent relationship observed between investment values and changes in speeds in that year. It should also be noted that the quality and completeness of speed data used by Ofcom to produce Connected Nations has improved in recent years. There is evidence to support this in the Postcode-Level Analysis chapter, which shows that the completeness of average download speed data for treated postcodes has increased over time.
This analysis also suggests there is not an optimum value of investment in an area (a point at which the marginal effects of additional investment starts to diminish). This may occur above £100,000 per OA, but the sample sizes become too small for us to be able to assess this.
Change in average download speed after one year by number of vouchers per output area
Source: GC insight analysis of BDUK data and Connected Nations
6.3 Change in download speeds by level of local deprivation
The Ministry of Housing, Communities and Local Government’s 2019 Index of Multiple Deprivation (IMD) has been used to assess the levels of deprivation in areas where vouchers were used, and whether areas with vouchers experienced greater improvements in download speeds than similarly deprived areas.
The IMD uses data at the Lower Super Output Area (LSOA) level, which presents a challenge for this evaluation. LSOAs are typically made up of four or five OAs and comprise of around 1,500 residents, which would be harder to detect the impact from vouchers in given their relatively small scale. To resolve this, we have assigned each treated OA the same deprivation decile as its parent LSOA. Because the IMD ranks LSOAs in England, this analysis only covers England, and excludes vouchers used in Wales, Scotland or Northern Ireland. The IMD ranks all LSOAs using seven weighted domains: income, employment, education, health, crime, and the living environment.
The table below shows that vouchers were more commonly used in less deprived areas (relative to the England average). In total, 63% of vouchers were issued in LSOAs ranked in the sixth decile or higher. The data also show a shift over time. In 2018, 8% of vouchers were used in the most deprived areas, but this proportion steadily declined, with no vouchers issued in these areas by 2021. This trend reflects the programme’s increasing focus on rural and hard-to-reach premises, which are typically located outside of the most deprived, urban areas.
Distribution of vouchers by deprivation decile and treatment year
| Deprivation decile | 2018 | 2019 | 2020 | 2021 | Total |
|---|---|---|---|---|---|
| 1 (most deprived) | 8% | 4% | 3% | 0% | 4% |
| 2 | 5% | 5% | 3% | 8% | 4% |
| 3 | 7% | 6% | 3% | 7% | 5% |
| 4 | 7% | 9% | 8% | 13% | 9% |
| 5 | 18% | 14% | 14% | 6% | 15% |
| 6 | 11% | 19% | 15% | 18% | 16% |
| 7 | 13% | 14% | 18% | 21% | 16% |
| 8 | 13% | 12% | 15% | 10% | 13% |
| 9 | 10% | 10% | 12% | 12% | 11% |
| 10 (least deprived) | 8% | 6% | 8% | 4% | 7% |
| Total vouchers | 11,250 | 21,521 | 15,038 | 3,066 | 50,875 |
| Source: MHCLG 2019: Index of Multiple Deprivation and BDUK voucher database |
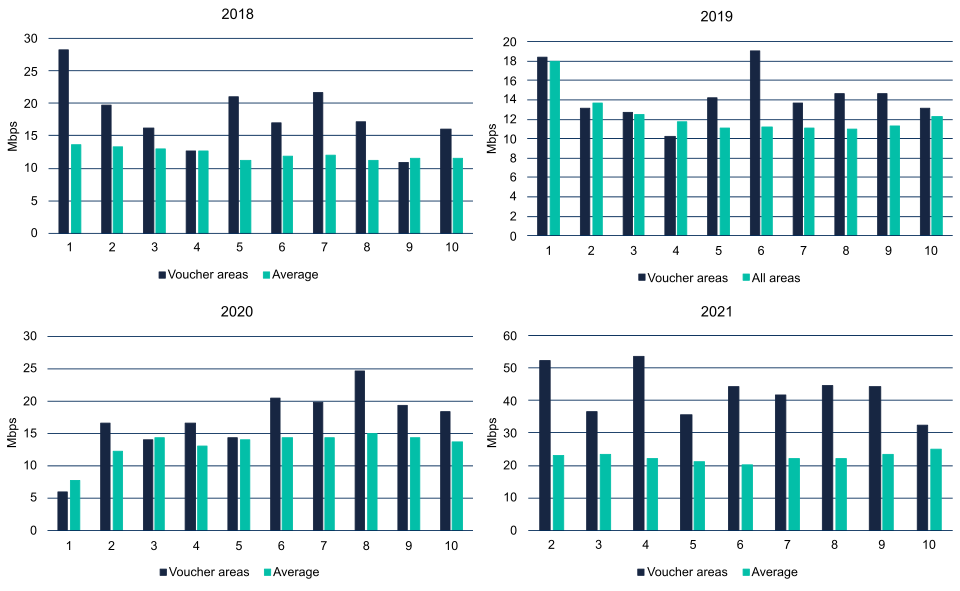
The charts below compare the one-year change in average download speeds for treated areas with the England average for all output areas in the same deprivation decile. Overall, the results suggest that vouchers have been effective in increasing download speeds in more deprived areas, though the pattern varies by year.
The strongest effects were observed in 2018, when treated areas in the three most deprived deciles saw much larger increases in download speeds than the average for similarly deprived areas. In 2021, treated areas in the second, third, and fourth most deprived deciles still experienced significantly greater improvements than the average, although this was also the case for vouchers connected in all other deciles, including less deprived LSOAs.
In contrast, results for 2019 and 2020 are less clear. While there are instances where treated areas in deprived deciles saw above-average improvements, there are also many cases where the changes were in line with, or even below, the national average for their decile.
In summary, these findings do not provide definitive evidence that vouchers used in more deprived areas deliver additional speed benefits compared to less deprived areas.
Change in average download speed by deprivation decile
Source: BDUK, Connected Nations, Index of Multiple Deprivation
Note: 1 is most deprived and 10 is least deprived. There were no vouchers issued to the most deprived LSOAs in 2021 so this decile is not shown
7. Impacts by voucher scheme
Before comparing results across the two voucher schemes, it is important to note that GBVS and RGC were designed with different objectives. GBVS was primarily intended to stimulate the emerging gigabit market, and was therefore used in many commercially attractive areas. By contrast, RGC was designed to maximise additionality by targeting investment on rural and harder-to-reach premises where commercial rollout was less likely.
This section assesses differences between the schemes in terms of additional improvements in broadband performance. This framing favours RGC, as it aligns more closely with its core objective of minimising deadweight. The role of vouchers in supporting market stimulation is considered separately in Report 6.
The table below shows how the effects of vouchers on average download speeds differ between the two voucher schemes, focusing on the change after one year. A direct comparison is only possible for 2019 and 2020. In 2018, only two output areas were treated solely through RGC which makes comparison unreliable. In 2021, no output areas were treated through GBVS.
This analysis focuses on areas first supported through GBVS or RGC i.e. in the first treatment year. Some of these areas later received UKGV vouchers but excluding them would reduce the RGC sample to the point where comparison with GBVS is not possible. This limitation should be kept in mind when interpreting the findings.
The results are inconclusive about which voucher scheme was more effective at increasing download speeds after one year.
-
In 2019, all models found a statistically significant increase in average download speeds for areas supported by GBVS vouchers, with a median effect of 3.92 Mbps, based on a sample of 3,188 output areas. In contrast, none of the models found a statistically significant difference for areas supported by RGC vouchers. However, the sample of RGC areas was very small (n=66), meaning results should be treated with caution, as they may not provide a reliable picture of the scheme’s impact.
-
In 2020, the pattern was reversed. Areas supported by GBVS vouchers (n = 1,698) showed no statistically significant impact on download speeds in any of the models. However, for areas supported by RGC vouchers (n = 389), five out of nine models identified a statistically significant improvement, with a median effect of 4.09 Mbps.
This suggests neither scheme consistently outperformed the other across both years.
Additional change in average download speeds after one year by voucher scheme
| Treatment year | Voucher scheme | Number of OAs | Median effect (Mbps) | Range of effect (Mbps) | Models significant |
|---|---|---|---|---|---|
| 2018 | GBVS | 1,615 | 9.0*** | 3.8** to 10.8*** | 9 out of 9 |
| RGC | 2 | n.a. | n.a. | n.a. | |
| 2019 | GBVS | 3,188 | 3.92*** | 2.55** to 4.68*** | 9 out of 9 models |
| RGC | 66 | 1.18 | -0.04 to 2.42 | 0 out of 9 models | |
| 2020 | GBVS | 1,698 | 0.45 | -1.61 to 0.89 | 0 out of 9 models |
| RGC | 389 | 4.09** | 1.55 to 5.31*** | 5 out of 9 models | |
| 2021 | GBVS | 0 | n.a | n.a | n.a |
| RGC | 109 | 15.99*** | 12.86*** to 19.58*** | 9 out of 9 models |
| Source: Belmana |
| Note: Significance levels are 1% (***), 5% (**) and 10% (*). |
The table below shows how average download speeds changed for each voucher scheme per year up to three years. The results vary depending on the year the vouchers were first issued and the length of time since treatment.
In 2018, almost all output areas were treated using GBVS vouchers, which had a statistically significant and sustained effect on download speeds. The average increase was 9 Mbps after one year, rising to 13.7 Mbps after three years.
In 2019, both schemes show longer-term effects, but the scale of impact differs substantially:
-
GBVS vouchers led to a statistically significant increase in download speeds, from 3.92 Mbps after one year to 9.77 Mbps after three years.
-
In contrast, RGC vouchers, which showed no significant effect after one year, had a much greater impact after two and three years. All models found significant effects at these later points, with increases of 23.6 Mbps after two years and 30.8 Mbps after three years - more than three times the effect observed in GBVS areas.
This delayed but much larger impact for RGC areas could be due to two factors:
-
Later voucher support: Although 460 RGC vouchers were issued in 2019, a further 97 were issued in 2020 and 2021 (87 in 2020 and ten in 2021). All of the vouchers connected in 2021 were through UKGV. These later vouchers may have contributed to speed improvements, but they represent only 17.5% of the total voucher support, so are unlikely to explain the full scale of the effect.
-
Timing of reporting: RGC vouchers issued in 2019 were often issued late in the year; 74% were issued in August or September 2019, which is close to the cut-off date for an area to be treated in 2019 (30 September 2019). Since this is based on the voucher issue date the actual connection could have occurred later than this. Therefore the improvements in download speeds might not have been picked up in Connected Nations data until a year or more later. This could explain why the effect of RGC vouchers only becomes visible from year two onwards.
GBVS vouchers delivered in 2020 had no statistically significant effect on download speeds in any year. RGC vouchers from the same year produced significant improvements in year one and year two, but not in year three. This suggests that control areas may have caught up by the third year, possibly because they too gained access to improved broadband infrastructure over that period.
In 2021, no GBVS vouchers were issued. However, RGC vouchers had a statistically significant impact on download speeds over one- and two-year periods, with average speeds increasing from 16 Mbps to 17.3 Mbps. A three-year effect cannot be measured, as Connected Nations stopped reporting average download speeds in 2024.
Overall this suggests that both GBVS and RGC vouchers have been effective at increasing average download speeds. GBVS appears to have been more effective in earlier treatment years, particularly 2018, than in 2020. In 2019 and 2020 where direct comparisons are possible , RGC areas performed better overall, experiencing much higher increases in average download speeds. However, these results are complicated by delayed effects for areas treated in 2019, and by the shorter duration of impact for areas treated in 2020, where improvements did not persist beyond two years.
Additional change in average download speeds after longer time periods, by voucher scheme (Mbps)
| Treatment year | Voucher type | Number of OAs | 1 Year median effect | 2 Year median effect | 3 Year median effect |
|---|---|---|---|---|---|
| 2018 | GBVS | 1,615 | 9.0*** | 12.2*** | 13.7*** |
| RGC | 2 | n.a. | n.a. | n.a. | |
| 2019 | GBVS | 3,188 | 3.9*** | 5.9*** | 9.8*** |
| RGC | 66 | 1.2 | 23.6*** | 30.8*** | |
| 2020 | GBVS | 1,698 | 0.5 | 1.9 | -2.5 |
| RGC | 389 | 4.1** | 26.6*** | 1.6 | |
| 2021 | GBVS | 0 | n.a. | n.a. | n.a. |
| RGC | 109 | 16.0*** | 17.3*** | n.a. |
| Source: Belmana |
| Note: Significance levels are 1% (***), 5% (**) and 10% (*). |
7.1 Cost-effectiveness of different voucher schemes
The results above do not account for differences in the value of voucher subsidies between GBVS and RGC areas. On average, RGC areas received more vouchers per output area, which could partly explain the larger increases in download speeds seen in those areas.
The table below addresses this by adjusting for the value of voucher investment. It does this by weighting the net additional change in download speeds by the total voucher subsidy per premise in each treated area. This is based on all premises within treated areas, including both those that were upgraded through voucher activity and those that were not. It is not possible to isolate only the premises that directly benefited from vouchers or voucher projects. As a result, the cost-effectiveness measure should be interpreted as the impact of voucher investment spread across the wider treated area. This approach therefore dilutes the estimated cost-effectiveness, particularly where only a subset of premises were upgraded.
Cost-effectiveness is calculated using the following formula:
(Net additional speed change (Mbps) x Voucher subsidy per premise) x 100
If the change in download speed was not statistically significant at the 5% level, we assume it had no additional effect (shown as n.a. in the table). This provides a fairer comparison of the two schemes by focusing on their cost-effectiveness, measured as speed improvement per £ of subsidy per premise. The more cost-effective scheme in each year and time period is shown in bold.
The analysis is limited to 2019 and 2020, when both schemes were active, to enable a like-for-like comparison. While RGC was active in 2018, only two OAs received a voucher meaning the sample size is too small for analysis. For each period analysed (one, two or three years after treatment), we include the value of vouchers issued up to that point. For example, in the two-year analysis, we include both initial and follow-up voucher investment made during those two years.
The findings are mixed. In 2019, although RGC vouchers led to much greater increases in download speeds over two and three years, they were also linked to much higher levels of investment. Once we adjust for this, the cost-effectiveness of RGC vouchers was only slightly higher than GBVS after two years, and actually lower after three years. This means we cannot draw conclusions about which was more the more cost-effective scheme in 2019.
In 2020, the results are clearer. Since GBVS vouchers had no statistically significant effect on download speeds at any point, we can conclude that RGC vouchers were more cost-effective, except over a three-year period, where neither scheme showed a significant effect.
Cost effectiveness analysis for RGC and GBVS vouchers
| Treatment year | Indicator | After one year | After two years | After three years | |||
|---|---|---|---|---|---|---|---|
| GBVS | RGC | GBVS | RGC | GBVS | RGC | ||
| 2019 | Net additional change (Mbps) | 3.9 | 0 | 5.9 | 23.6 | 9.8 | 30.8 |
| Value of voucher subsidy (£m) | 19.7 | 0.9 | 24.5 | 1.0 | 24.5 | 1.0 | |
| Voucher subsidy per premise (£) | 21 | 87 | 26 | 101 | 26 | 102 | |
| Net additional change per £ per 100 premises (Mbps) | 18.6 | n.a. | 22.6 | 23.3 | 37.6 | 30.1 | |
| 2020 | Net additional change (Mbps) | 0 | 4.1 | 0 | 26.6 | 0 | 0 |
| Value of voucher subsidy (£m) | 7.6 | 2.4 | 7.6 | 2.7 | 7.6 | 2.7 | |
| Voucher subsidy per premise | 16.7 | 84.5 | 16.7 | 94.6 | 16.7 | 94.6 | |
| Net additional change per £ per 100 premises (Mbps) | n.a. | 4.9 | n.a. | 28.1 | n.a. | n.a. | |
| Source: GC Insight |
The charts titled “change in average download speed after one year by number of vouchers per output area” help to understand the cost-effectiveness findings. In 2019, there was a positive relationship between the number of vouchers an area received and the increase in download speed. However, the relationship between numbers of vouchers and changes in speed was relatively flat for areas receiving up to 20 vouchers, particularly when compared to later years. For example, areas with 15 to 20 vouchers in 2019 saw download speeds increase by just 7.5 Mbps more than areas with only one voucher.
Because RGC areas typically received more vouchers per output area, this helps explain why they appeared less cost-effective in 2019; more investment led to only modest additional gains. In later treatment years, the marginal speed increase associated with additional vouchers was larger, meaning RGC areas were found to be more cost-effective.
8. Impacts by voucher type
Two types of vouchers were available at first, under the GBVS scheme. Standard vouchers were used by individual households or businesses to contribute towards the cost of connecting their own premises to a gigabit-capable network. Project vouchers were aggregated by suppliers to support the collective connection of multiple premises in the same area, enabling larger deployment projects that extended coverage more widely. Standard vouchers were discontinued during the lifetime of GBVS, meaning that all RGC vouchers were project vouchers.
The table below shows how the impact of vouchers on average download speeds after one year differs between project and standard vouchers. In the first treatment year (2018), the additional effect of vouchers was much greater in areas where standard vouchers were used (13.01 Mbps in the median model). In project areas, only one of the nine models found a statistically significant difference, and this found that the change in download speeds was lower than that in control areas. Though it should be noted that this was based on a small sample size of only 282 output areas.
However in 2019 and 2020, areas with project vouchers consistently outperformed standard voucher areas. In 2019, both types had a statistically significant effect, but the effect was much greater for project vouchers (8.41 Mbps) than standard vouchers (3.7 Mbps). In 2020, standard vouchers had no significant effect in any model, while project vouchers consistently showed a significant effect, averaging 6.5 Mbps. No standard vouchers were issued in 2021, but project vouchers again had a significant effect across all models, with an average increase of 21.2 Mbps.
Additional change in average download speeds after one year by voucher type
| Treatment year | Voucher type | Number of OAs | Median effect (Mbps) | Range of effect (Mbps) | Models significant |
|---|---|---|---|---|---|
| 2018 | Project | 282 | -1.31 | -5.36** to 4.75 | 1 out of 9 models |
| Standard | 909 | 13.01*** | 0.44 to 18.67 | 6 out of 9 models | |
| 2019 | Project | 687 | 8.4*** | 7.3*** to 9.0*** | 9 out of 9 models |
| Standard | 2,517 | 3.7** | 2.0 to 4.7*** | 7 out of 9 models | |
| 2020 | Project | 1,075 | 6.5*** | 4.3** to 7.4*** | 9 out of 9 models |
| Standard | 1,376 | -1.0 | -3.1 to -0.2 | 0 out of 9 models | |
| 2021 | Project | 1,665 | 21.2*** | 18.7*** to 24.9*** | 9 out of 9 models |
| Standard | 0 | n.a. | n.a. | n.a. |
| Source: Belmana |
| Note: Significance levels are 1% (***), 5% (**) and 10% (*). |
The table below shows that areas supported by project vouchers continued to have significantly higher average download speeds than control areas three years after initial treatment. The only exception to this was areas supported in 2018, where project areas experienced much lower changes in average download speeds over each time period compared to standard vouchers, but the results for project vouchers were not statistically significant.
The stronger effect of project vouchers in 2019 and 2020 may reflect the lasting impact of the vouchers, but the results are also influenced by continued investment in these areas. For example, areas first treated with project vouchers in 2019 received 6,600 vouchers that year, followed by an additional 2,700 in 2020 and 1,560 in 2021, likely contributing to ongoing improvements in speed. This pattern is very similar to that observed for RGC vouchers, which is due to the fact that there is significant overlap between RGC vouchers and project vouchers since all RGC vouchers were delivered through projects.
Areas supported by standard vouchers in 2019 also had significantly higher speeds than control areas after three years. However, the pattern over time is less consistent, with no significant effect observed at two years. For 2020, standard vouchers showed no significant impact on average download speeds at any time point.
Additional change in average download speeds after longer time periods, by voucher type
| Treatment year | Voucher type | Number of OAs | 1 Year median effect (Mbps) | 2 Year median effect (Mbps) | 3 Year median effect (Mbps) |
|---|---|---|---|---|---|
| 2018 | Project | 282 | -1.31 | 2.12 | 5.75 |
| Standard | 909 | 13.01*** | 18.57*** | 19.00*** | |
| 2019 | Project | 687 | 8.41*** | 20.20*** | 27.39*** |
| Standard | 2,517 | 3.70** | 2.85 | 6.38** | |
| 2020 | Project | 1,075 | 6.47*** | 26.58*** | 19.39*** |
| Standard | 1,376 | -1.00 | 5.63 | -4.73 | |
| 2021 | Project | 1,665 | 21.19*** | 42.93*** | n.a. |
| Standard | 0 | n.a. | n.a. | n.a. |
| Source: Belmana |
| Note: Significance levels are 1% (***), 5% (**) and 10% (*). |
8.1 Cost-effectiveness of different voucher types
The table below presents the cost-effectiveness analysis by voucher type. It shows that areas receiving project vouchers benefited from much higher levels of investment compared to those with standard vouchers. When this is taken into account, standard vouchers are found to be more cost-effective at increasing download speeds for areas treated in 2019, except over the two-year period, where they had no significant effect. In 2020, project vouchers delivered better value for money, as standard vouchers had no significant effect on download speeds. Again, this is very similar to the findings for the cost-effectiveness of voucher schemes because of the overlap between RGC and project vouchers.
Again, the relationship between the number of vouchers an area received and the change in average download speeds found in the charts titled “change in average download speed after one year by number of vouchers per output area” helps explain these findings.
Cost effectiveness analysis for project and standard vouchers – output area level
| Treatment year | Indicator | After one year | After two years | After three years | |||
|---|---|---|---|---|---|---|---|
| Project | Standard | Project | Standard | Project | Standard | ||
| 2019 | Net additional change (Mbps) | 8.4 | 3.7 | 20.2 | n.a. | 27.4 | 6.4 |
| Value of voucher subsidy (£m) | 11.8 | 10.1 | 16.6 | 12.1 | 20.4 | 12.1 | |
| Voucher subsidy per premise (£) | 75 | 13 | 105 | 16 | 130 | 16 | |
| Net additional change per £ per 100 premises (Mbps) | 11.2 | 27.5 | 19.2 | n.a. | 21.1 | 39.7 | |
| 2020 | Net additional change (Mbps) | 6.5 | n.a. | 26.6 | n.a. | 19.4 | n.a. |
| Value of voucher subsidy (£m) | 18.4 | 4.8 | 27.3 | 4.8 | 31.1 | 4.8 | |
| Voucher subsidy per premise | 86.1 | 12.6 | 127.5 | 12.6 | 145.5 | 12.6 | |
| Net additional change per £ per 100 premises (Mbps) | 7.5 | n.a. | 20.8 | n.a. | 13.3 | n.a. | |
| Source: GC Insight |
9. Impact of top-up vouchers
Top-up vouchers are an additional financial contribution provided by local authorities, like councils, to supplement the standard BDUK voucher value. They are intended to make it commercially viable for suppliers to connect premises that would otherwise be too costly to serve using national-level voucher funding alone. By increasing the total subsidy available, top-ups aim to extend the reach of gigabit-capable broadband to more challenging areas and enhance the impact of the overall voucher programme.
This section assesses the impact of top-up vouchers in two ways:
-
Download speed improvements – We compare the change in average download speeds in areas where top-up vouchers have been used with areas that have received standard vouchers only. This analysis controls for key variables, including the number of voucher-supported premises and the relative cost of build, as estimated by BDUK’s F score model. Download speeds are used as the outcome measure based on the findings earlier in this section, which concluded that speed is a more reliable and accurate indicator of voucher impact than coverage data in Connected Nations.
-
Premises passed – We analyse whether top-up vouchers are associated with a greater number of expected premises passed (EPP) in voucher-supported projects. This analysis uses a dataset provided by BDUK, based on estimates submitted by suppliers, and controls for both the number of vouchers used per project and the relative cost of deployment in different areas.
These two approaches both have limitations for evaluating the effectiveness of top-up vouchers. Changes in average download speed provide only a partial indication of top-up impacts, as top-ups were designed to enable connections to more remote and higher-cost premises, where achievable speeds may be lower. The analysis of EPP data therefore provides a more appropriate measure of whether top-ups helped extend coverage in harder-to-reach areas, particularly when focusing on higher-cost, non-viable locations. However, even when restricting the analysis to areas identified as higher cost using BDUK’s F-score model, top-up areas may still differ from non-top-up areas in ways that are difficult to fully control for. In addition, EPP figures are based on supplier estimates rather than confirmed delivery, meaning the results should be interpreted as indicative rather than definitive.
9.1 Change in average download speeds
The table below presents a comparison of key indicators for all output areas that used top-up vouchers versus those that did not, focusing on the 2020 and 2021 treatment years when top-up vouchers were most heavily used.
The table highlights several notable differences between the two groups:
-
Voucher intensity: Areas using top-ups received a higher number of vouchers per output area. In 2020, top-up areas received an average of 12.5 vouchers per OA, compared to 3.6 in no top-up areas. In 2021, the figures were 12.3 vs 9.7 respectively.
-
Voucher value: The average value of vouchers including top-ups was significantly higher in top-up areas. In 2020, vouchers in top-up areas received an average subsidy of £2,893, nearly £1,000 more than in no top-up areas at £1,900. his gap widened further in 2021, with voucher values of £3,437 in top-up areas compared to £1,641 in those without.
-
Subsidy per premises: Areas using top-ups also had much higher voucher subsidies per premises (based on the total number of premises in the output area). In 2020, this figure was £224 in top-up areas, versus just £35 in non top-up areas. In 2021, the difference remained substantial: £278 with top-ups vs £104 without.
-
Change in download speeds: In 2020, areas with top-up vouchers experienced a significantly greater increase in average download speeds; 30.3 Mbps, compared to 16.0 Mbps in areas without top-ups. This indicates that top-up vouchers contributed to improved broadband performance outcomes.
-
Cost effectiveness: However, when the speed gain is adjusted for the value of voucher support per premise, the cost effectiveness of vouchers appears lower in top-up areas. In 2020, top-up areas delivered 0.14 Mbps per £ per premise, while no top-up areas achieved 0.46 Mbps per £ per premise. In 2022, the trend was even more striking. Average download speed improvement was slightly higher in no top-up areas at 35.9 Mbps compared to 34.0 Mbps in top-up areas. When adjusted for cost, the efficiency of the investment was 0.12 Mbps per £ per premise in top-up areas, compared to 0.34 Mbps in no top-up areas.
These findings suggest that while top-up vouchers are associated with positive broadband performance outcomes in some years, they are linked to smaller improvements in average download speeds relative to the level of public investment. This does not necessarily imply that top-up vouchers are less effective overall. Rather, it reflects the fact that top-ups were designed to support more remote and higher-cost premises, where speed improvements may be more limited. As a result, assessments based on Mbps gained per £ invested should be interpreted with caution.
Comparison of change in download speeds in output areas that used top-up vouchers with those that did not
| 2021 | 2022 | |||
|---|---|---|---|---|
| No top-ups | With top-ups | No top-ups | With top-ups | |
| No. OAs | 3,193 | 77 | 1,504 | 413 |
| Average vouchers per OA | 3.6 | 12.5 | 9.7 | 12.3 |
| Average voucher value | 1,900 | 2,893 | 1,641 | 3,437 |
| Value of voucher subsidy per premise (£) | 35 | 224 | 104 | 278 |
| Average change in download speed per OA (Mbps) | 16.0 | 30.3 | 35.9 | 34.0 |
| Average change in download speed per £ of subsidy per premise (Mbps) | 0.46 | 0.14 | 0.34 | 0.12 |
| Source: GC Insight analysis of Connected Nations data |
Recognising that top-up vouchers were more likely to be used in remote and high cost locations, we repeated the analysis using a restricted sample of output areas where the average F score is 0.8217 or higher, based on BDUK’s F score model. These areas are considered to have particularly high build costs and are unlikely to be commercially viable without public subsidy.
The table below presents the results of this analysis. It shows that even when focusing only on these non-viable areas, the headline findings remain unchanged:
-
In 2020, areas using top-up vouchers recorded a lower average increase in download speeds of 15.6 Mbps compared to 18.0Mbps in no top-up areas, despite receiving an average of £207 more subsidy per premise.
-
Similarly, in 2021, the average change in download speeds was 4.4Mbps lower in top-up areas than no top up areas, despite receiving a higher level of subsidy.
These findings suggest that, when assessed solely in terms of average download speed, top-up vouchers did not deliver larger speed improvements than standard vouchers in the most hard-to-reach areas. However, this result should be interpreted with caution. The analysis is based on a small number of output areas, particularly in 2020, and does not involve a full matching exercise to control for all differences between top-up and non-top-up areas. In addition, download speed captures only one dimension of impact and do not fully reflect the primary purpose of top-ups, which was to enable delivery to more difficult and costly premises. As a result, these findings should be viewed as indicative rather than definitive when assessing the cost-effectiveness of top-up vouchers.
Comparison of change in download speeds in output areas that used top-up vouchers with those that did not – F20 output areas only
| 2020 | 2021 | |||
|---|---|---|---|---|
| No top-ups | With top-ups | No top-ups | With top-ups | |
| No. OAs | 587 | 24 | 248 | 126 |
| Average vouchers per OA | 4.7 | 13.8 | 11.4 | 9.8 |
| Average voucher value | 1,920 | 2,819 | 1,787 | 3,723 |
| Value of voucher subsidy per premise (£) | 63 | 270 | 151 | 263 |
| Average change in download speed per OA (Mbps) | 18.0 | 15.6 | 47.8 | 43.4 |
| Average change in download speed per £ of subsidy per premise (Mbps) | 0.28 | 0.06 | 0.32 | 0.17 |
| Source: GC Insight analysis of Connected Nations data |
9.2 Expected premises passed
The table below presents findings from the analysis of the EPP dataset, comparing projects that used top-up vouchers with those that did not. The figures represent supplier estimates of premises expected to be passed at the point of application, rather than confirmed delivery outcomes. In practice, not all expected premises were connected: BDUK analysis discussed later in this report shows that only 63% of expected premises were ‘ready for service’ once projects were completed, rising to 72% in uncommercial areas.
Of the 380 projects with EPP data, only 20 used top-up vouchers. Sample sizes for top-up projects are therefore small, and the results should be treated with caution.
The analysis shows clear differences between the two groups of projects. Projects with top-ups had a higher average voucher value of £1,983 compared with £1,642 for non-top-up projects. However, they were expected to deliver far fewer premises per voucher: 6.4 compared with 15.4 for no top-up projects. When the focus is narrowed to uncommercial areas, the gap is smaller but still significant - 6.1 premises per voucher for top-up projects compared with 9.1 for no top-up projects. As a result, the cost per F20 premise passed was substantially higher where top-ups were used.
Overall, these findings indicate that projects using top-up vouchers were associated with higher subsidy levels per voucher but fewer expected premises passed per voucher than projects without top-ups, including in uncommercial areas. However, this evidence should be interpreted with caution. The number of projects using top-ups is very small, the analysis is based on supplier estimates rather than confirmed delivery, and there may be other important differences between projects that used top-ups and those that did not which are not captured in the data. As a result, while the results raise questions about the relative cost-effectiveness of top-up vouchers, they should be viewed as indicative rather than definitive.
Expected premises passed on projects which used top-ups
| No top ups | With top ups | |
|---|---|---|
| Number of projects | 360 | 20 |
| Average voucher value (£) | 1,642 | 1,983 |
| Total premises passed per voucher | 15.4 | 6.4 |
| Uncommercial premises passed per voucher | 9.1 | 6.1 |
| Cost per uncommercial premise passed per voucher | 180.8 | 322.9 |
| Source: GC Insight analysis of BDUK data |