Broadband market impacts
Published 1 October 2026

© Crown copyright 2026
This publication is licensed under the terms of the Open Government Licence v3.0 except where otherwise stated. To view this licence, visit nationalarchives.gov.uk/doc/open-government-licence/version/3 or write to the Information Policy Team, The National Archives, Kew, London TW9 4DU, or email: psi@nationalarchives.gov.uk.
Where we have identified any third party copyright information you will need to obtain permission from the copyright holders concerned.
This publication is available at https://www.gov.uk/government/publications/final-evaluation-of-bduk-legacy-vouchers-schemes/broadband-market-impacts
1. Summary of key findings
This report addresses the research question: “Did vouchers stimulate the broadband market by increasing competition, for example by reducing barriers to entry and supporting the growth of smaller providers?” We use a contribution analysis approach structured around three core claims.
Claim 1: Vouchers contributed to supplier growth by enabling smaller providers to scale operations and increase revenue.
The evidence strongly supports this claim. Quantitative analysis of Companies House data shows clear correlations between voucher use and growth in turnover and fixed assets, particularly among smaller and newer suppliers such as Airband, Truespeed, Trooli, Wessex Internet and Box Broadband. For these firms, vouchers provided an essential platform for early expansion, in some cases described as “transformational”. Supplier interviews reinforced this, with most reporting that vouchers were critical in reaching unviable areas, scaling networks, and securing further private investment. The effects were weaker for larger and more established providers, where voucher funding was a relatively small part of their overall investment.
Claim 2: Vouchers influenced supplier investment decisions and shaped their long-term strategies.
The evidence also supports this claim. Interviews show that vouchers played a central role in strategic shifts, such as moving from wireless or copper-based networks to full fibre, and in encouraging suppliers to adopt more ambitious and accelerated rollout strategies. For several providers, vouchers gave the confidence to expand into rural and hard-to-reach areas that would otherwise have been commercially unviable. Others reported that participation in the schemes helped them attract new private investment, creating a virtuous circle of growth.
Claim 3: Vouchers increased competition in local broadband markets by supporting new entrants and expanding coverage.
The evidence provides a more nuanced picture for this claim. At the national level, vouchers clearly contributed to a more diverse and competitive market by enabling smaller “alt-nets” to enter, expand, and challenge incumbents. Vouchers also helped some of these providers to gain a strong foothold in local and regional markets, often becoming significant players within particular geographies. Case study evidence highlights examples such as Wessex Internet in Dorset, B4RN in Lancashire and Cumbria, and Trooli in Kent, where voucher-supported rollout helped suppliers establish scale and visibility.
However, the impact on competition at the local level was more limited. In many rural or high-cost areas, vouchers typically supported a single provider, reflecting the fact that these markets could not sustain multiple networks. Open Market Review (OMR) data from case study areas shows that voucher use was often associated with increased coverage. Areas that were classed as having no build or plans, classified as “white”, would see increased coverage or planned coverage by one supplier, meaning they could be reclassified as “grey”,. We saw very few cases of premises having build or plans from two or more suppliers, classified as “black”. Suppliers themselves often acknowledged that their business models sought local exclusivity in unviable areas, though the existence of vouchers also created incentives to competitively accelerate rollout in order to secure first-mover advantage. This means that although new entrants were supported and incentivised to expand their coverage, there was limited level of direct competition in broadband markets at the local level.
2. Purpose of report
This section explores the extent to which Building Digital UK(BDUK) vouchers contributed to stimulating the broadband market, using a contribution analysis approach.
The analysis is focused on three key contribution claims:
1. Vouchers contributed to supplier growth by enabling smaller providers to scale operations and increase revenue.
2. Vouchers influenced supplier investment decisions and shaped their long-term business models and strategies.
3. Vouchers increased competition in local broadband markets by supporting new entrants and expanding coverage.
3. Methodology and data limitations
To evaluate the claims and assess the contribution of vouchers to broadband market stimulation, we draw on a range of evidence sources, including:
-
BDUK monitoring data: focusing on the value of vouchers used by suppliers.
-
Companies House data: analysing business performance metrics (e.g. turnover, value of assets) for suppliers that participated in the scheme, tracking their growth over time.
-
Supplier interviews: carried out in 2021 during the initial phase of the evaluation, these interviews provide insights into how suppliers perceived the impact of vouchers on their businesses.
-
Thinkbroadband maps, showing the current gigabit capable coverage of suppliers.
-
OMR data showing whether an area has no gigabit capable network, one network or a choice of networks.
This strand of analysis was not part of the original evaluation design. The supplier interviews conducted in 2021 informed an internal BDUK document and were not included in the published interim reports. For the final evaluation, it was agreed to draw on this material, alongside other evidence, in order to add value by providing further insight into the wider market-stimulation effects of the voucher schemes. The original consent provided by interview participants allows this material to be used in published evaluation outputs.
3.1 Details of supplier interviews
In 2021 we conducted 13 semi-structured interviews with broadband suppliers that participated in BDUK’s original Gigabit Broadband Voucher Scheme(GBVS) and Rural Gigabit Connectivity(RGC) voucher schemes:
-
Airband
-
Alnwick Broadband
-
B4RN (Broadband for the Rural North)
-
Borderlink (now GoFibre)
-
Box Broadband
-
Broadway Partners
-
CityFibre
-
Gigaclear
-
Glide Broadband
-
Openreach
-
Trooli
-
Truespeed
-
Wessex Broadband
These interviews aimed to provide qualitative insights into how vouchers influenced supplier growth, competition, and investment strategies. The discussion topics included company background, the scale and nature of involvement in voucher schemes, motivations for participation, and the impacts on growth, strategy and investment. They also considered effects on market competition and gathered supplier reflections on the design and effectiveness of the schemes.
A limitation is that supplier interviews were conducted four years ago in 2021, during the initial phase of the evaluation. These interviews were not designed specifically for contribution analysis, meaning the interview guide did not ask suppliers to identify other factors that influenced their performance over time, making it challenging to isolate the impact of vouchers. In addition, the market context has shifted considerably since 2021: at that stage GBVS and RGC vouchers may have been a more prominent driver of supplier behaviour, whereas subsequent developments, such as increased market competition and consolidation through mergers, are likely to have played a greater role. Because the interviews did not capture these later trends, it is challenging to isolate the specific impact of vouchers from other influences that have emerged more recently.
The interviews were not recorded, so we do not have full transcripts. Instead, we have drawn on summary notes, which means verbatim quotes cannot be included in this report.
4. Impacts on supplier growth
This section tests the first hypothesis: Vouchers contributed to supplier growth by enabling smaller providers to scale operations and increase revenue.
To assess this, we analyse i) correlations between voucher use and business turnover using Companies House data for suppliers, ii) examine changes in fixed asset values as a proxy for network expansion, and ii) draw on qualitative insights from supplier interviews to understand how vouchers influenced business growth, investment, and strategic decisions.
The focus of the analysis is the suppliers listed in the table below. The suppliers included in this analysis were those interviewed during the initial phase of the evaluation. 6G internet, The Fourth Utility and G. Network Comms were not interviewed but were included because they were heavy users of the voucher schemes.
The table includes i) incorporation year, providing context on how long each company has been operating, ii) turnover data availability, indicating whether turnover data is available for the full study period (2016-2024) or only for specific years, and iii) fixed assets data availability, showing whether balance sheet data is available.
Many of the suppliers included in the evaluation do not report annual turnover for the full study period. This is because UK accounting regulations do not require companies to disclose turnover in their accounts. Medium-sized companies – broadly those with turnover above £10 million, significant balance sheets, or more than 50 employees – must publish this information, while smaller firms can file abbreviated accounts, which include balance sheet data but not turnover figures.
To address this gap, we have analysed changes in fixed assets as an alternative indicator of supplier growth. For broadband providers, a significant proportion of fixed assets are the fibre networks themselves. As a result, increases in fixed assets serve as a useful proxy for network expansion, particularly for smaller suppliers that do not report turnover.
Details of companies included in analysis and availability of Companies House data
| No. RGC/GBVS vouchers | Total value of vouchers (£000) | Incorporation date | Turnover data available | Assets data available | |
|---|---|---|---|---|---|
| The Fourth Utility | 3,025 | 8,977 | 2013 | None | 2018, 2020 |
| 6G internet | 516 | 681 | 2013 | None | 2016-23 |
| Airband | 670 | 1,080 | 2009 | 2017-23 | 2016-23 |
| Alnwick Broadband | 1,050 | 2,795 | 2018 | None | 2023 only* |
| B4RN | 2,865 | 5,963 | Not applicable (Community Benefit Society) | ||
| Box Broadband | 341 | 453 | 2016 | 2022-23 | 2017-23 |
| Borderlink (now GoFibre) | 135 | 223 | 2017 | None | 2018-23 |
| Broadway Partners | 283 | 634 | 2011 | None | 2016-21 |
| G. Network Comms | 687 | 659 | 2016 | 2019-24 | 2018-24 |
| Gigaclear | 225 | 336 | 2010 | 2017-2023 | 2016-23 |
| Glide Broadband | 1,220 | 3,286 | 1996 | 2016-24 | 2016-24 |
| Trooli | 1,100 | 1,546 | 2002 | 2020-23 | 2016-23 |
| Truespeed | 3,011 | 2,451 | 2016 | 2018-23 | 2016-23 |
| Wessex Broadband | 2,484 | 4,823 | 2007 | 2021-23 | 2017-23 |
| Source: Companies House and BDUK monitoring data |
| Note: Openreach was interviewed but is excluded from this analysis, as its scale means vouchers are unlikely to have had a measurable impact on annual turnover. The only other supplier excluded is the Fourth Utility, who operated on voucher schemes from 2018 – 2020 and went into liquidation in 2023. |
4.1 Change in annual turnover
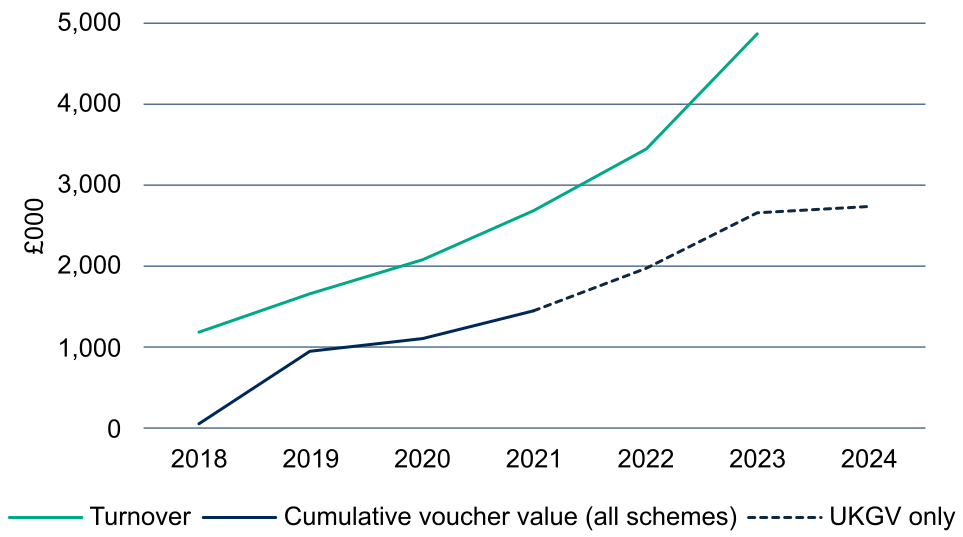
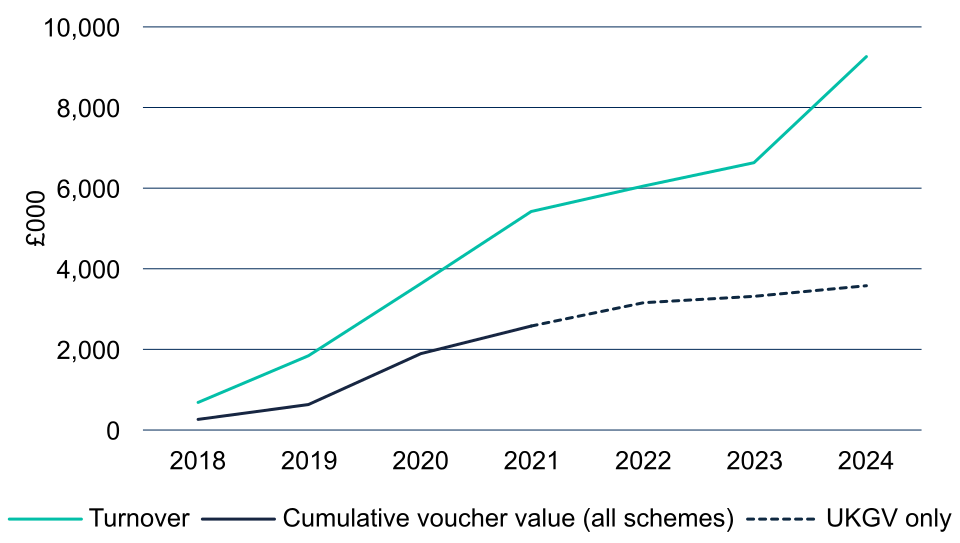
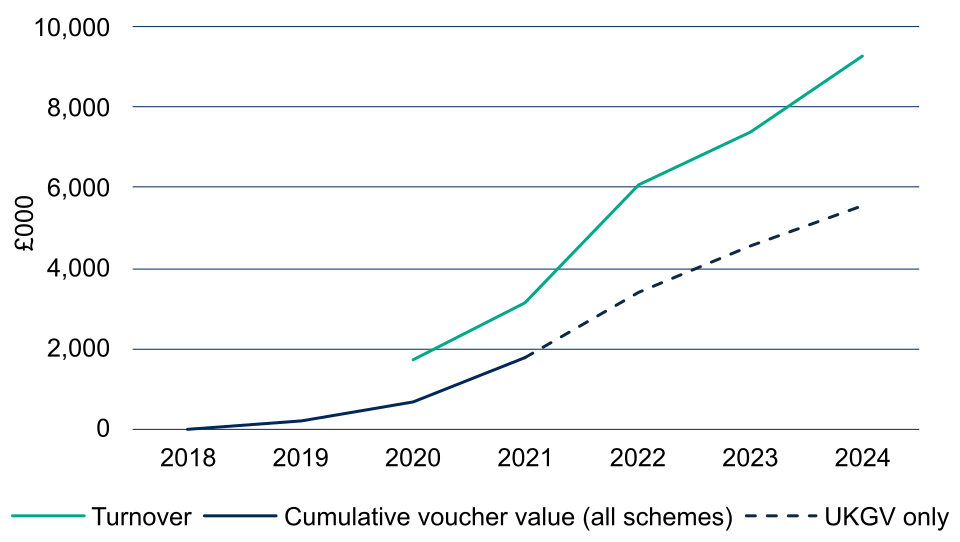
The charts below compare growth in annual turnover with the cumulative value of vouchers used by each supplier. The cumulative value is shown because the expansion of their network through voucher-supported connections should have a cumulative effect on revenue growth. The charts show vouchers from all three schemes (GBVS, RGC and the UK Gigabit Voucher(UKGV) scheme). While UKGV is formally out of scope for this evaluation, it is included to illustrate the continuing role of vouchers in many suppliers’ growth. UKGV activity only began at scale in 2021, so vouchers used between 2018 and 2020 were almost entirely from GBVS and RGC. From 2022 onwards, voucher use relates mainly to UKGV and is shown as a dotted line in the charts where suppliers received support through the UKGV scheme. These results should therefore be interpreted with this context in mind.
This analysis focuses only on suppliers for which at least four years of turnover data is available. It should be viewed as indicative rather than a statistically robust method, providing suggestive insights rather than definitive causal evidence.
The figures indicate that for several suppliers, there is a clear correlation between voucher use and revenue growth. This relationship is particularly strong among smaller suppliers that had very low turnover before engaging with the voucher schemes. Notable examples include Airband, Truespeed, and Trooli (see charts below).
For these suppliers, turnover has grown significantly in tandem with, or immediately following, their use of vouchers. While other factors such as public or private investment and broader market growth may also have contributed, the alignment between voucher funding and turnover growth suggests that vouchers have played an important role in enabling their expansion.
Annual turnover and voucher investment for Airband
Source: BDUK and Companies House
Annual turnover and voucher investment for Truespeed
Source: BDUK and Companies House
Annual turnover and voucher investment for Trooli (previously Call Flow Solutions)
Source: BDUK and Companies House
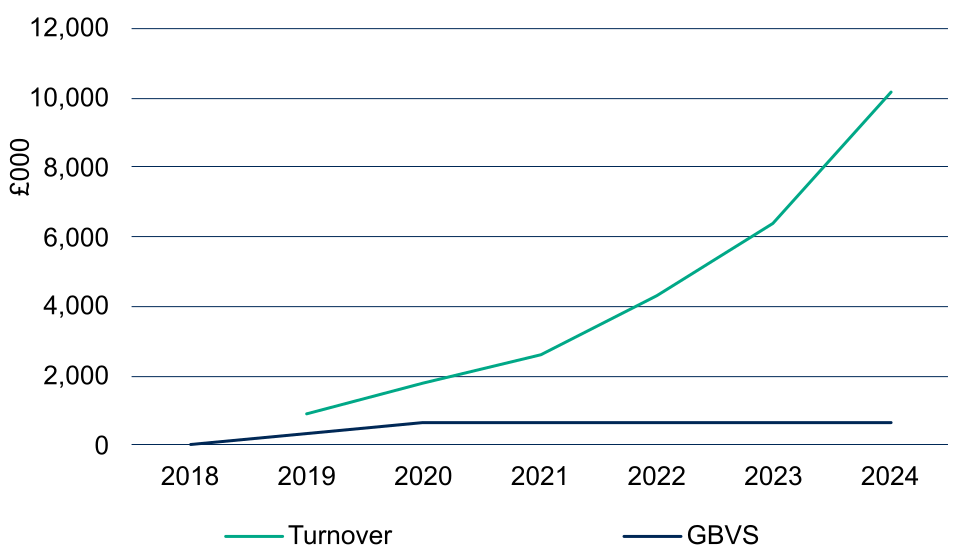
The chart for G Network Communications (established in late 2016) indicates that vouchers supported its early growth, though to a lesser extent than for Airband, Truespeed and Trooli. The company received £659,000 in GBVS vouchers between 2018 and 2020, a smaller sum than those competitors, but this coincided with a period of rapid revenue growth. Since 2020 it has expanded without further voucher support, suggesting that vouchers may not have been the main driver of growth, but the initial investment could have helped establish a platform for subsequent expansion.
Annual turnover and voucher investment for G Network Communications
Source: BDUK and Companies House
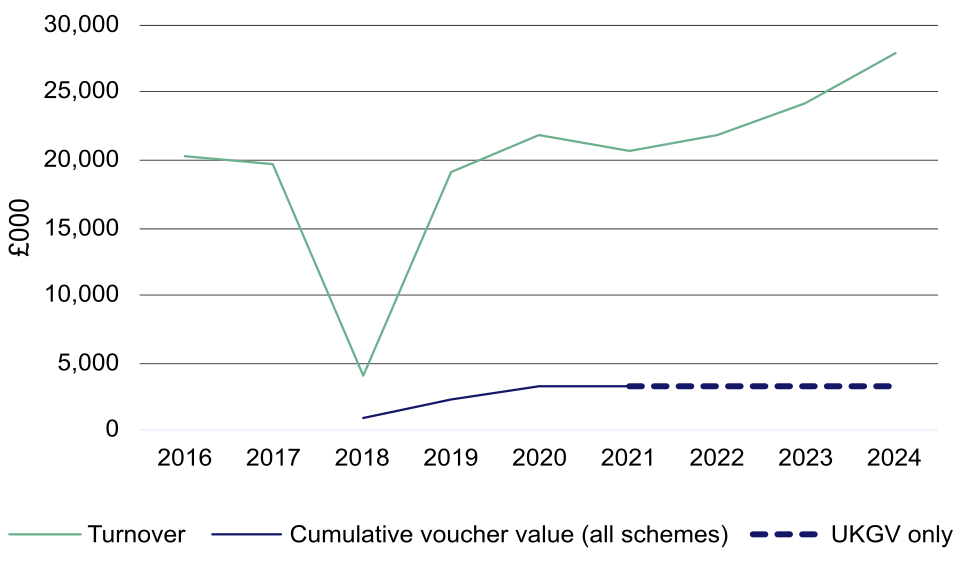
For suppliers that were already well-established before participating in the voucher schemes, the impact of vouchers on turnover is less clear. For example, Glide, shown in the chart below, continued to grow its revenues throughout the study period, but the £3.3m it received in vouchers was small relative to its annual turnover. This suggests that other factors were more influential in driving growth.
The chart also uses larger increments on the y-axis, £5 million, compared with smaller scales in earlier charts. The larger scale of the y axis can make Glide’s level of voucher use appear lower than that of other suppliers, even though its total support was similar to Airband and Truespeed.
Annual turnover and voucher investment for Glide
Source: BDUK and Companies House.
Note: The dip in reported turnover in 2018 reflects a change in the company’s accounting period, resulting in a shorter reporting period for that year rather than a fall in trading activity.
4.2 Change in the value of fixed assets
For suppliers where at least four years of turnover data is unavailable from Companies House, we have analysed changes in the value of fixed assets as an alternative indicator. This provides a useful proxy for the expansion of suppliers’ networks. We would expect to see a direct impact as voucher funding should be used to build new networks, therefore expanding their assets. We would also expect there to be additional growth in supplier’s assets which can be attributed to vouchers as suppliers then build to connect premises nearby to the voucher funded premises. As with turnover analysis, we compare changes in fixed assets with the cumulative value of vouchers used, as network growth should have a cumulative effect on asset values over time.
Among the suppliers analysed, Wessex Internet shows the clearest correlation between voucher investment and the growth of fixed assets. Between the company’s first use of vouchers in 2017 and 2020, the value of its assets grew steadily alongside the value of vouchers received, indicating that the support was instrumental in enabling its early network expansion.
After 2020, Wessex Internet’s assets grew even more rapidly, increasing by nearly £40 million between 2020 and 2023. This suggests vouchers played a key role in the company’s early expansion, helping to establish a larger network footprint that provided the platform for further growth, both through voucher schemes and independently of it.
Value of fixed assets and voucher investment for Wessex Internet
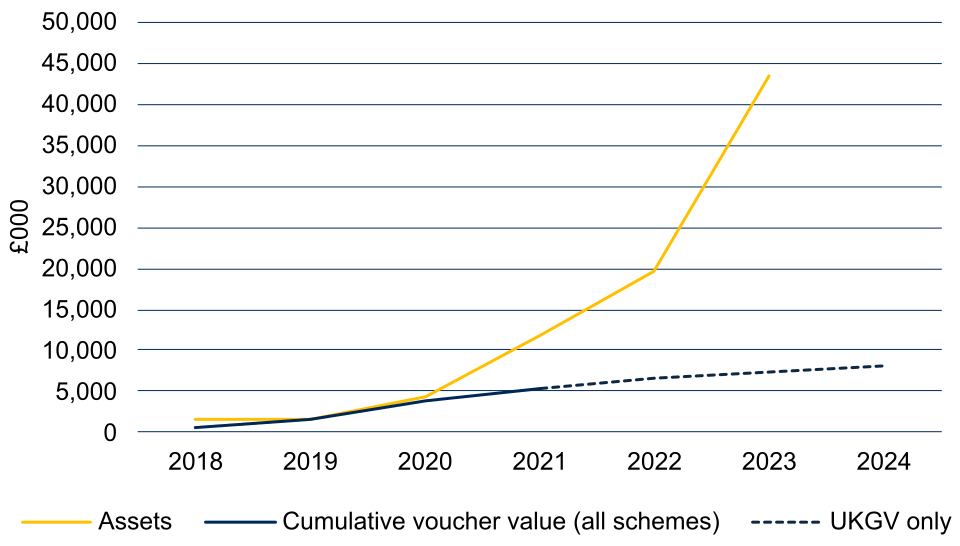
Source: BDUK and Companies House. Note: asset values for 2024 is not available as the company accounts have yet to be submitted to Companies House
A similar pattern is evident for Box Broadband, though the scale of voucher investment was smaller, £2 million by 2024 compared with over £8 million for Wessex Internet. Its asset growth between 2018 and 2021 coincided with the company’s use of vouchers, suggesting vouchers supported its early expansion, though the data suggests this was to a lesser extent than for Wessex Internet. After 2021 it is not possible to attribute asset growth to the use of vouchers given the wide difference in scale.
Value of fixed assets and voucher investment for Box Broadband
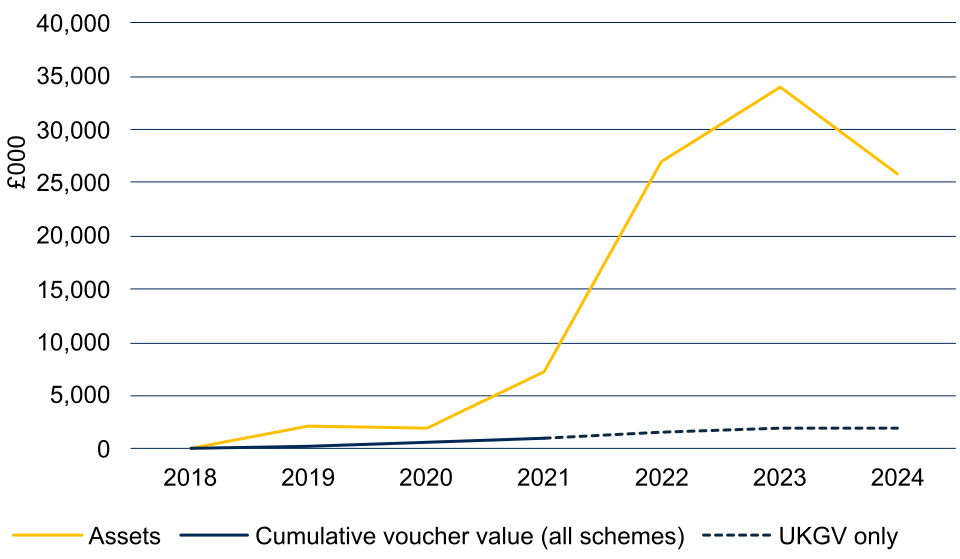
Source: BDUK and Companies House.
Borderlink (now GoFibre) received £223,000 in vouchers between 2020 and 2021, a much smaller amount than other suppliers in this analysis. Their assets also grew significantly in the study period, meaning the y axis has to go in increments of £10million rather than £5million used for the two last suppliers. As a result, the “Cumulative voucher value” line in the chart below is only just visible along the x axis. While the growth in the company’s assets occurred during the period of voucher use, the relatively modest level of support suggests vouchers were a very minor factor in its expansion.
Value of fixed assets and voucher investment for Borderlink/GoFibre
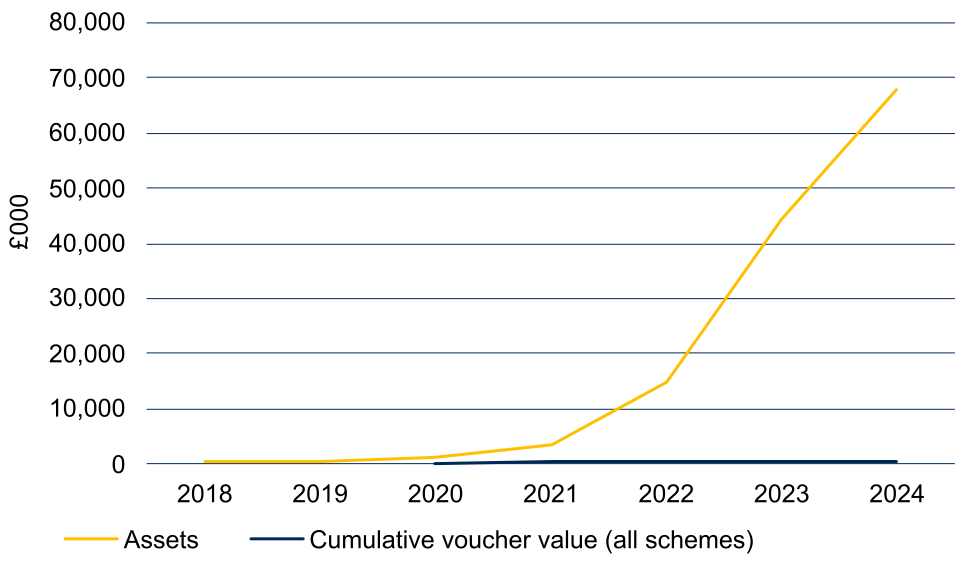
Source: BDUK and Companies House
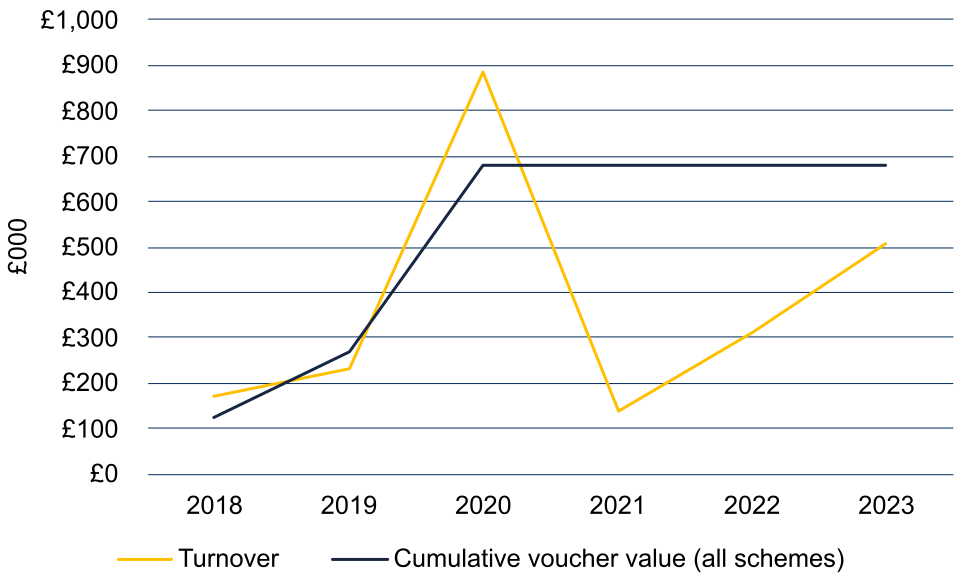
The final chart, showing asset growth for 6G Internet, presents a different pattern. While there is some correlation between voucher investment and asset growth (particularly between 2018 and 2020), the data is erratic and fluctuates significantly over time.
Unlike most other suppliers, the value of fixed assets does not show a steady upward trend but instead rises and falls unpredictably. Furthermore, in 2021, the cumulative value of vouchers exceeded the reported value of fixed assets by over £500,000, which is difficult to explain and suggests inconsistencies in reporting. This volatility raises questions about the reliability of asset data for this company or whether other financial factors may have influenced reported values.
Value of fixed assets and voucher investment for 6G Internet
Source: BDUK and Companies House
4.3 Supplier insights
The majority of suppliers interviewed reported that BDUK vouchers had a significant positive impact on their business growth, with some describing them as critical to their expansion. Of the 13 suppliers interviewed, nine stated that vouchers had directly contributed to their growth, enabling them to scale operations, increase revenue, and expand their fibre networks.
For those that did not attribute growth to vouchers, the reasons were generally structural. Some were large, well-established companies, where vouchers represented only a small element of their overall broadband investment programme. Others had not engaged with the voucher schemes at a large enough scale to see a transformative impact.
Four suppliers provided quantitative estimates of the extent to which vouchers supported their business, indicating that between 20% and 40% of their customer base at the time were voucher recipients. The vast majority said that vouchers had directly enabled network expansion, helping them reach customers that otherwise may not have been commercially viable.
Beyond direct revenue generation, vouchers also played a key role in securing additional investment:
-
Three suppliers stated that the availability of voucher funding had helped them attract additional private investment, allowing them to invest further in their network.
-
One of these highlighted that investors were particularly keen on voucher-supported projects, and actively encouraged them to maximise participation in the scheme.
For some smaller suppliers, vouchers had a transformational impact, reshaping the scale and trajectory of their businesses. One supplier described vouchers as having "shaped the company", explaining that before participating in the scheme, they employed just 20 people. This increased to 200 staff over a three year period representing a tenfold increase, which they attributed primarily to the voucher programme.
4.4 Conclusions
The evidence strongly supports the conclusion that BDUK vouchers made a significant contribution to the growth of many broadband suppliers, particularly among smaller and newer providers. This conclusion draws on a combination of quantitative data and supplier interviews
Quantitative analysis shows a clear link between voucher use and growth among smaller or early-stage suppliers, particularly those using vouchers to expand their networks for the first time. In contrast, for larger or more established firms, the role of vouchers appears more limited, with other factors, such as commercial strategy, acquisitions, or wider market trends, likely playing a greater role. The supplier interviews support this pattern, with many smaller providers reporting that vouchers were essential for reaching unviable areas, scaling operations, and attracting investment.
However, it is important to note a key limitation in the qualitative evidence: the supplier interviews were conducted in 2021 and did not explicitly ask suppliers to assess the relative importance of vouchers compared to other factors in explaining their growth. In addition, the analysis does not include a formal counterfactual, meaning it cannot isolate what would have happened in the absence of vouchers. As a result, the strength of attribution must be interpreted with caution. Other contextual factors, such as the overall growth in broadband demand, increased availability of private capital, regulatory changes, and national policy commitments to gigabit connectivity, likely also played a role in supporting supplier growth during this period.
5. Impacts on supplier investment decisions and business strategies
This section tests the hypothesis that vouchers influenced supplier investment decisions and shaped their long-term business models and strategies.
The supplier interviews provide strong evidence that BDUK voucher schemes influenced the strategic direction and investment decisions of many broadband providers. The key themes are summarised below.
5.1 Changes in technologies and business models
For several suppliers, vouchers were instrumental in driving a transition in technology or delivery model, resulting in significant long-term changes to their business approach:
Three suppliers reported that they had originally operated as wireless broadband providers but used BDUK vouchers and other public subsidies to establish a core fibre network infrastructure. In both cases, this led to a strategic shift, with one provider now planning to migrate all remaining wireless customers to fibre, and another stating that vouchers were the “sole reason” they pivoted to full fibre. Although all three continue to use wireless in extremely rural areas, their primary focus is now on fibre. One also noted that they were planning to expand into wholesale dark fibre and that vouchers had laid the foundations for this.
Another supplier stated that it had previously relied on copper-based services but used the voucher scheme as a means of transitioning to a full fibre delivery model. The interviewee described this shift as their main motivation for participating in the scheme.
Fibre offers significant advantages over these legacy technologies: unlike copper, which suffers from signal degradation over distance and has limited capacity, fibre supports much higher speeds and is more resilient. Compared to wireless, fibre is less susceptible to environmental interference and offers greater reliability and scalability. This suggest that vouchers have helped suppliers to modernise their networks and position themselves for long-term growth.
Another supplier reported that vouchers had influenced how they delivered their network build. One notable change was the shift from demand-led, pre-order models to speculative builds, where infrastructure was deployed ahead of confirmed customer interest. This allowed the supplier to accelerate their rollout and capture early-mover advantage in new areas.
5.2 More ambitious investment strategies
While many suppliers noted that their overall business models remained intact, the availability of vouchers led several to adopt more ambitious investment strategies than would otherwise have been feasible.
-
Two suppliers reported that the scheme created a strong incentive to move quickly in order to secure first-mover advantage in target areas, meaning they accelerated their rollout plans to build ahead of competitors.
-
Three suppliers highlighted that their engagement with the voucher scheme had helped them to attract private investment, giving them access to additional resources which led them to scale up their growth plans.
-
Finally, several suppliers said that vouchers had enabled them to target rural and hard-to-reach areas that would not have been commercially viable without subsidy. This allowed them to extend their geographic reach beyond their original footprint, bringing forward investment in areas that would otherwise have remained underserved. One reported that vouchers “give us the confidence to promote new build with rural communities. If it were to stop, we would probably have to stop building and focus on maintaining the network and explore a more commercial non voucher solution - but would be a much smaller scale of growth.”
5.3 Conclusions
The evidence strongly supports the conclusion that GBVS and RGC vouchers contributed meaningfully to suppliers’ investment decisions and long-term strategies. While the scale of impact varied, vouchers enabled many providers to make strategic shifts, whether in technology, delivery models, or geographical focus, and to pursue more ambitious growth plans than would have been feasible using private investment alone.
6. Impacts on competition
This section explores the hypothesis that BDUK vouchers increased competition in the broadband market by enabling new entrants to enter and expand their networks. The analysis draws on three main sources of evidence:
-
Supplier interviews, which provide insights into how vouchers affected market dynamics
-
ThinkBroadband coverage maps, showing current network footprints of voucher-funded suppliers alongside competing alt-nets and traditional providers
-
OMR data, which shows the number of premises classified as black, grey, or white in postcodes where vouchers were used as of January 2025, compared to those where they were not. These classifications are defined as:
-
Black – premises are served by or are in the build plans of two or more gigabit-capable networks, indicating current or future provider choice.
-
Grey – premises are served by or are in the build plans of one gigabit-capable network.
-
White – premises not served by or planned to be served by any gigabit-capable network.
-
The ThinkBroadband and OMR analysis focuses on five case study areas selected in agreement with BDUK: Lancashire, Dorset, Kent, Cambridgeshire and Northumberland. These were chosen based on the high volume of voucher use and to ensure coverage of different regions across England. Due to separate OMR collections led by devolved governments, the case studies had to be focused on England. While some of the suppliers interviewed had deployed vouchers in these areas like B4RN in Lancashire and Wessex Internet in Dorset, others had primarily operated in non–case study locations. There were also some case study areas where we were unable to interview the main voucher suppliers active locally such as Cambridge Fibre Networks in Cambridgeshire. Lastly, in some case study areas we interviewed the main supplier, but this was not focused specifically on the case study area like Openreach in Kent. As such, the findings from the supplier interviews should be interpreted as general insights into the role of vouchers in shaping competition, rather than evidence directly linked to the case study areas.
Other limitations of the analysis are as follows:
-
We do not have access to the underlying ThinkBroadband dataset, so our analysis of these maps relies on visual interpretation of screenshots from the website, which limits precision.
-
The OMR analysis compares postcodes where vouchers were used with those where they were not. This allows us to assess the impact of vouchers on local competition in the specific postcodes where vouchers were used. However, some non-voucher postcodes may still have benefited indirectly from vouchers, either through being close to postcodes where vouchers were used, particularly premises in voucher-funded project areas, or by enabling suppliers who used vouchers to expand and compete in other areas.
-
The OMR data is a snapshot as of January 2025 and includes the effects of UKGV vouchers which is outside the scope of this evaluation. We therefore excluded postcodes where only UKGV vouchers were used. However, many postcodes include a mix of UKGV and RGC/GBVS vouchers, which we could not fully separate, potentially affecting results.
6.1 Supplier perspectives
The interviews with broadband suppliers discussed their views on how voucher schemes affected market competition. These interviews reflected market conditions at the time they were conducted in 2021, and the competitive landscape may have evolved since.
Almost all suppliers agreed that BDUK vouchers played a significant role in increasing competition in the UK broadband market. The schemes were particularly valuable in enabling alt-nets to enter the market, expand their networks, and challenge established players such as Openreach and Virgin Media. As noted above, several suppliers credited the voucher schemes with accelerating their growth and helping them to secure additional investment. This contributed to a broader and more diverse supplier base across the UK.
However they reported the effects of vouchers on local-level competition were more nuanced and highly context-dependent. Suppliers reported that they were often the only active provider in the specific areas they served, particularly in rural or semi-rural communities. In these locations, low population density, high infrastructure build costs, and uncertain demand meant the commercial case for deploying a network was already challenging. As a result, they believed the market could not realistically sustain more than one network operator, and in some cases they reported there was a tacit understanding across the industry to avoid building in areas where another alt-net was already present. They stressed that in many of the areas they reached, the alternative to a single-provider model was no service at all, and therefore they believed access should be prioritised over market competition in these areas.
Several suppliers indicated that their business models were based on targeting areas with little or no existing broadband provision, rather than competing head-to-head with incumbents. In doing so, they sought to achieve localised exclusivity that would allow them to recover costs over time.
Several noted the voucher scheme created a strong sense of urgency, driving providers to accelerate their build plans in order to reach communities before competitors. One supplier remarked that “the mere fact of the scheme’s existence” prompted them to act quickly, fearing that if they did not move first, someone else would.
At the same time, some suppliers expressed concern about emerging overbuild, particularly from large operators such as Openreach or Virgin Media. It was noted that, in some areas, traditional suppliers had responded to alt-net expansion by deploying infrastructure in the same areas. While smaller suppliers were often confident that they could compete with traditional providers on quality and price, there were concerns that even losing a small proportion of their market share posed a significant financial risk for their future sustainability.
6.2 Lancashire
There are 1,897 vouchers included in the analysis for Lancashire. Of these, 1,096 were GBVS vouchers, 426 were RGC vouchers and the remaining 375 were UKGV vouchers used in postcodes where other vouchers were also used. The main voucher supplier was B4RN.
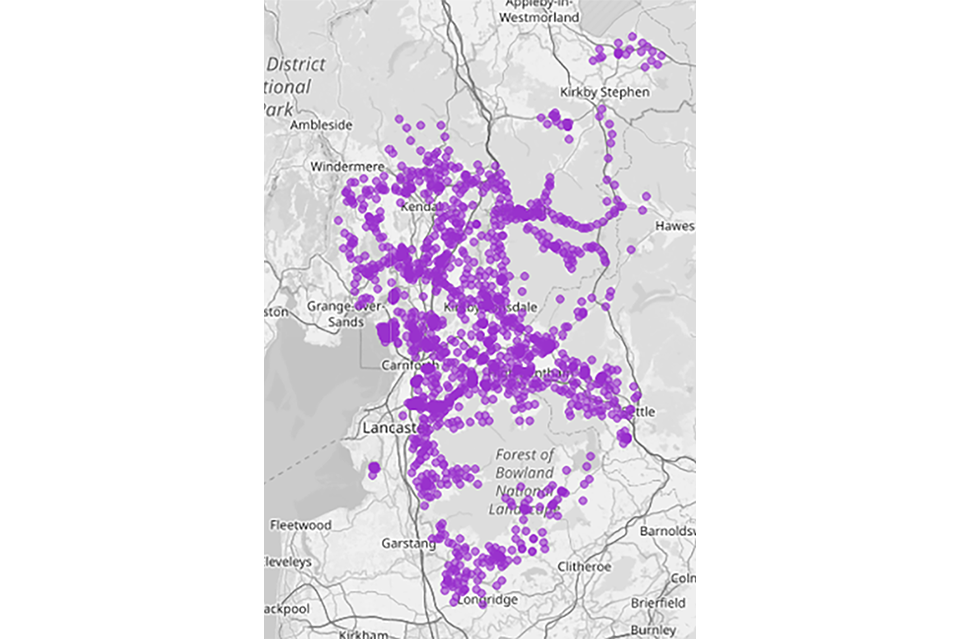
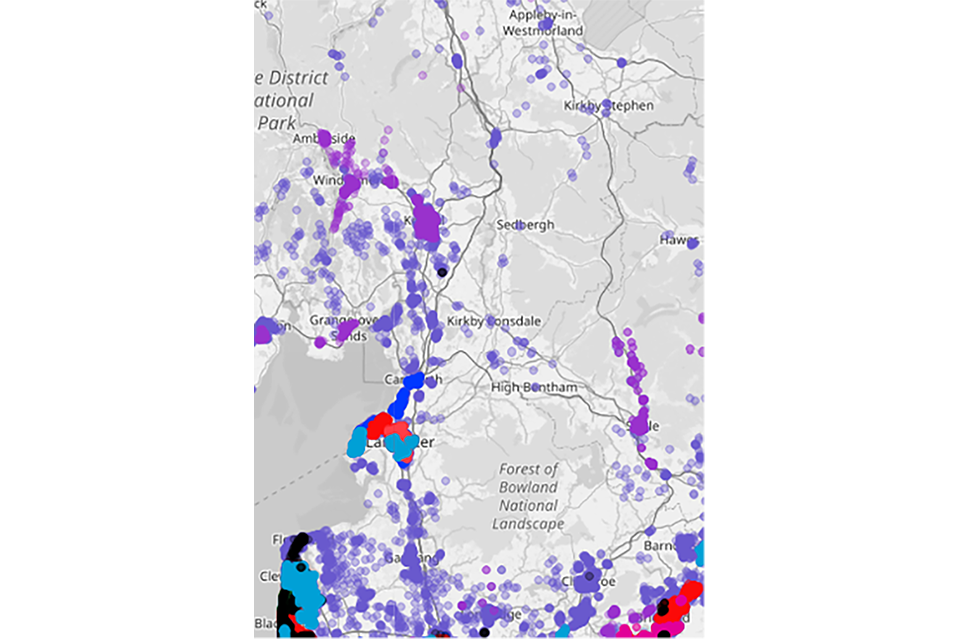
The maps below show the coverage of B4RN on the left and other providers on the right. In all of the maps for case study areas, Openreach coverage is shown in dark blue, Virgin Media is shown in red and light blue representing different gigabit capable technologies, CityFibre is shown in green and the coverage of other alt-nets is shown in various colours.
These maps show a large amount of overlap between B4RN and other networks, which suggests there is increased competition. However they also highlight large areas where the voucher supplier is the only network present, indicating a large number of areas where B4RN have a local monopoly. This trend of one supplier having extensive rural coverage in an area is something we see across many of the case studies when looking at ThinkBroadband maps.
Image: Coverage of B4RN (top) and coverage of other providers (bottom)
Source: Think Broadband
The table below presents the current broadband coverage in Lancashire according to OMR data, based on the number of premises classified as black ;those with access or planned access to two or more gigabit-capable networks, grey; access or planned access to one network, or white; where they have no access or planned access.
Percentage of premises in treated and untreated postcodes in Lancashire which are black, grey or white
| All areas in Lancashire | Uncommercial areas (F20) | |||||
|---|---|---|---|---|---|---|
| With vouchers | No vouchers | Total | With vouchers | No vouchers | Total | |
| Black | 52% | 51% | 51% | 13% | 16% | 16% |
| Grey | 36% | 41% | 41% | 64% | 49% | 50% |
| White | 11% | 9% | 9% | 23% | 35% | 35% |
| Total premises | 15,901 | 713,433 | 729,344 | 3,439 | 77,688 | 81,127 |
| Total vouchers | 1,899 | 945 | ||||
| Source: BDUK OMR data |
Overall, 51% of premises are black, 41% are grey, and 9% are white. In postcodes where vouchers were used, the proportion of black premises is similar to non-voucher areas; 52% with vouchers vs 51% without. This suggests that, at a local level, vouchers have not been associated with higher levels of competition, as measured by the presence of multiple networks.
It should also be noted that voucher areas have a lower share of grey premises and a higher share of white premises than non-voucher areas. This indicates that in many voucher postcodes, there are still significant numbers of premises without access or planned access to gigabit-capable broadband. Further analysis shows that this pattern is largely driven by postcodes where standard GBVS vouchers were used. These vouchers were often used for individual, standalone connections in commercial areas, and did not deliver wider network coverage for neighbouring premises.
A different pattern emerges when focusing specifically on uncommercial areas, postcodes where the average F score exceeds 0.82. The F score is a model generated by BDUK to estimate the cost of connecting a premise to gigabit-capable broadband and whether it is likely to be covered by the commercial rollout. Lower F scores indicate more commercially viable areas, and conversely a high score is less commercially viable. An F score of 0.82 or above is used as a cut-off point in BDUK to determine the least commercially viable premises in the UK. These accounted for roughly 50% of the vouchers connected in Lancashire. In these areas, the share of white premises is significantly lower in voucher postcodes than in non-voucher postcodes 23% vs 35%, and the share of grey premises is much higher. This suggests that vouchers were effective in extending broadband investment to hard-to-reach areas.
The share of black premises is lower in voucher areas, indicating that while vouchers improved gigabit coverage, they did not lead to increased competition in these high-cost locations. This aligns with supplier interviews, which highlighted that vouchers were often used to deliver connectivity in areas where the market could not support more than one provider. This is a trend which we see emerge across the case studies.
The following table compares the percentage of black premises across different F score bands. It should be noted that given the scope of RGC was to focus on rural and therefore less commercial areas, there is more voucher delivery in higher F score areas. This means the findings for lower F score areas should be interpreted with caution.
Percentage of premises in treated and untreated areas in Lancashire which are black by F score
| F score | With vouchers | No vouchers | Number of vouchers |
|---|---|---|---|
| 0-0.2 | 22% | 31% | 54 |
| 0.2-0.4 | 81% | 61% | 365 |
| 0.4-0.6 | 63% | 61% | 138 |
| 0.6-0.8 | 33% | 51% | 331 |
| 0.8-1 | 13% | 21% | 1009 |
| Total | 52% | 51% | 1897 |
| Source: BDUK OMR data |
The only band where voucher areas have a notably higher share of black premises is 0.2–0.4. Further analysis shows that 70% of vouchers in this band were used in Blackburn, delivered by 6G Internet through the GBVS scheme. ThinkBroadband maps confirm that 6G now has substantial coverage across the town, suggesting that vouchers may have supported their network expansion and enabled them to compete locally. However, Virgin Media, Openreach, and brsk also have extensive coverage in Blackburn, indicating a high level of overbuild.
In all other F score bands, either the differences are not statistically significant or non-voucher areas have a higher proportion of black premises. This suggests that in many parts of Lancashire, competition appears to be lower in voucher-supported areas than in comparable non-voucher locations.
6.3 Dorset
There are 1,448 vouchers included in the analysis for Dorset. Of these, 520 were GBVS vouchers, 692 were RGC vouchers and the remaining 236 were UKGVS vouchers used in postcodes where other vouchers were also used. The main voucher supplier was Wessex Internet, accounting for over 80% of vouchers.
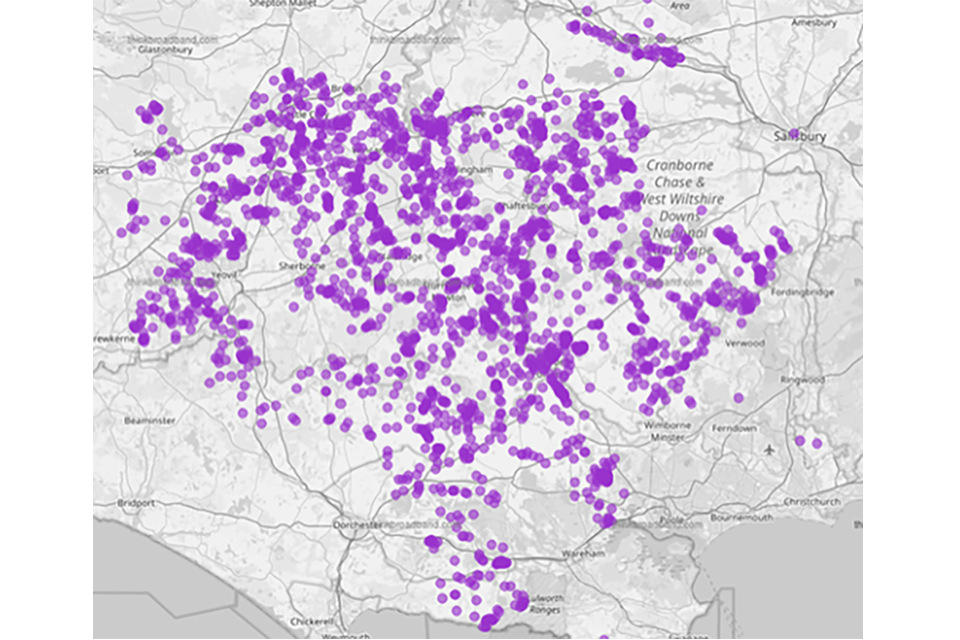
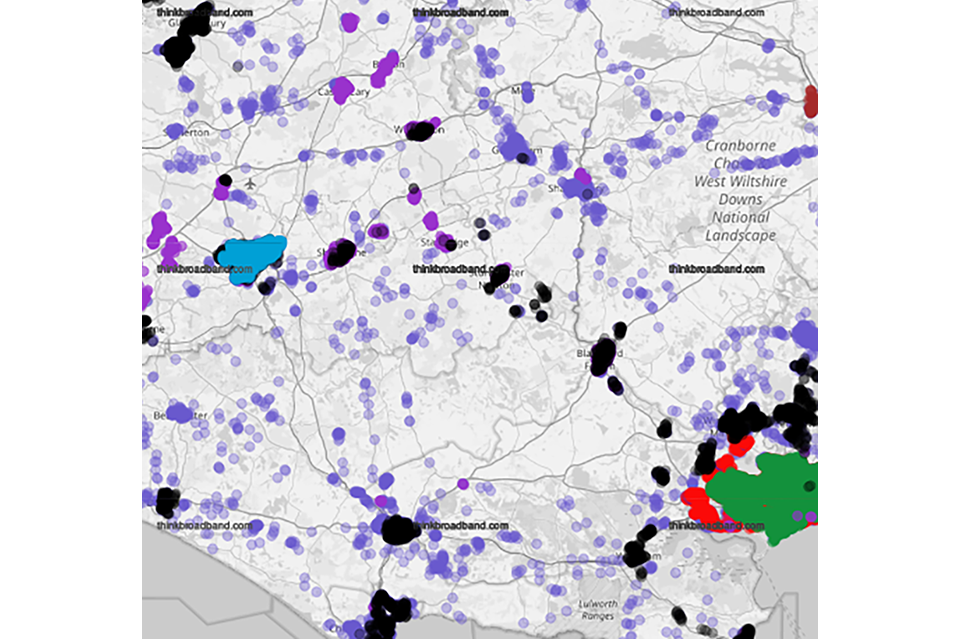
The maps below shows gigabit coverage of Dorset by Wessex Internet above and other suppliers below. Wessex Internet now has substantial coverage across Dorset and surrounding areas, primarily concentrated in rural locations. In contrast, they have no coverage in the main towns of Bournemouth, Poole, Dorchester, and Weymouth, and only limited coverage in smaller towns.
The bottom map highlights that competition from other networks is largely concentrated in these urban centres, suggesting a highly segmented market, with Wessex Internet focused on rural areas and other providers dominating towns and cities.
Image: Gigabit coverage of Wessex Internet (top) and other providers (bottom)
Source: Think Broadband
The table below shows that 96% of vouchers in Dorset were used in uncommercial areas, reflecting Wessex Internet’s strong focus on rural locations. This includes both GBVS and RGC vouchers.
Analysis of these areas shows that voucher-supported areas have a much higher share of grey premises at 71% compared to non-voucher areas at 50%, and a lower share of both black and white premises. This suggests that vouchers have been effective in extending gigabit-capable coverage to hard-to-reach areas but have not led to greater competition at a local level. Again, this is consistent with the maps above and the findings of supplier interviews.
Percentage of premises in treated and untreated postcodes in Dorset which are black, grey or white
| All areas in Dorset | Uncommercial areas (F20) | |||||
|---|---|---|---|---|---|---|
| With vouchers | No vouchers | Total | With vouchers | No vouchers | Total | |
| Black | 12% | 45% | 45% | 7% | 22% | 12% |
| Grey | 66% | 44% | 44% | 71% | 50% | 66% |
| White | 23% | 11% | 11% | 22% | 28% | 23% |
| Total premises | 4,781 | 347,929 | 352,710 | 3,891 | 64,305 | 4,781 |
| Total vouchers | 1,448 | 1,389 | 1,448 | |||
| Source: BDUK Open Market Review data |
| Note: a separate analysis by F score band has not been provided for Dorset because 96% of vouchers were in uncommercial areas (i.e. an F score above 0.82) |
6.4 Kent
The analysis for Kent includes 2,821 vouchers, comprising 565 GBVS vouchers, 904 RGC vouchers, and 1,352 UKGV vouchers that were issued in postcodes where other voucher types were also used. The presence of a large number of UKGV vouchers in mixed voucher postcodes makes it difficult to isolate the effects of the RGC and GBVS schemes.
Unlike other case study areas, there was no single dominant supplier in Kent. The largest users of vouchers were Trooli at 54% and Openreach at 35%, with the remainder distributed across a mix of smaller providers.
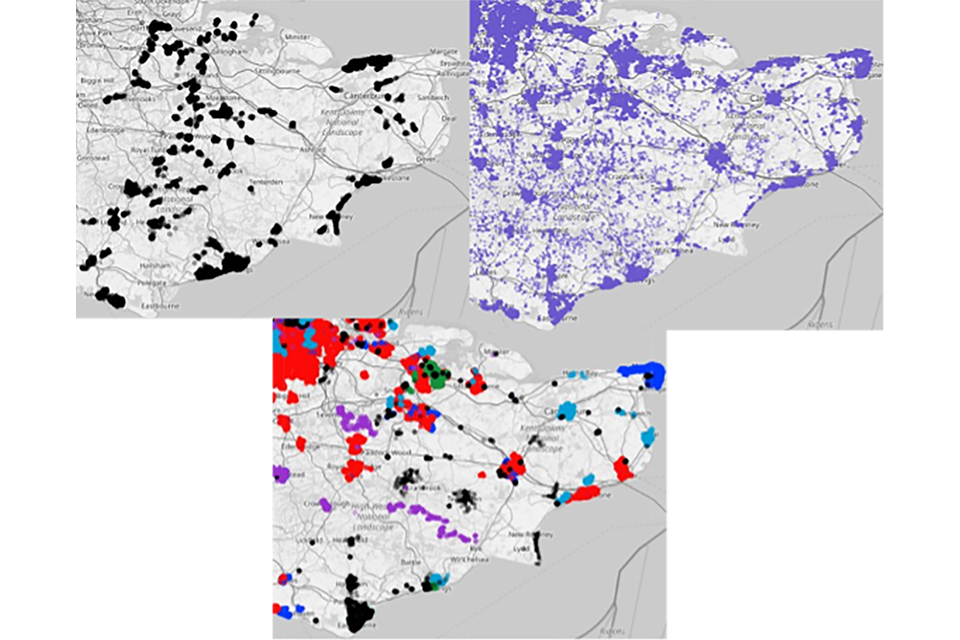
Interpreting ThinkBroadband maps for Kent is more complex than in other areas, due to its large geographic size and the extensive and overlapping coverage of multiple networks. The maps show both areas of direct overlap between Trooli and Openreach, particularly in parts of the coast and around south Tunbridge Wells, and areas where Trooli appears to provide coverage in towns such as Maidstone, Royal Tunbridge Wells and Canterbury where Openreach coverage is more limited or absent. This indicates that voucher-supported rollout has contributed both to increased competition in some locations and to additional coverage in others.
Image: Gigabit coverage of Trooli (top-left), Openreach (top-right) and other providers (bottom) in Kent
Source: Think Broadband
Despite the apparent overlap between voucher suppliers and other gigabit networks in Kent, the table below shows a pattern consistent with other case study areas. Voucher-supported areas have a 27% higher share of grey premises than non-voucher areas , and a lower share of both black and white premises. Again, this indicates that vouchers have been effective in extending gigabit-capable coverage but have not led to increased competition in the specific locations where they were used. This is the case for all areas and for uncommercial areas.
Percentage of premises in treated and untreated postcodes in Kent which are black, grey or white
| All areas in Kent | Uncommercial areas (F20) | |||||
|---|---|---|---|---|---|---|
| With vouchers | No vouchers | Total | With vouchers | No vouchers | Total | |
| Black | 22% | 44% | 44% | 9% | 14% | 14% |
| Grey | 67% | 40% | 41% | 66% | 40% | 41% |
| White | 11% | 16% | 15% | 25% | 45% | 45% |
| Total premises | 15,087 | 641,162 | 656,249 | 3,694 | 96,846 | 100,540 |
| Total vouchers | 2,822 | 872 | ||||
| Source: BDUK OMR data |
Analysis by F score band in Kent shows that voucher-supported areas consistently have a significantly lower share of black premises compared to non-voucher areas, regardless of commercial viability (though it should be noted that the sample size for the most commercial areas is very low). This suggests that voucher suppliers have often established local monopolies, even in low-cost, commercially viable areas where competition might otherwise have been expected.
Percentage of premises in treated and untreated areas in Kent which are black by F score
| F score | With vouchers | No vouchers | Number of vouchers |
|---|---|---|---|
| 0-0.2 | 5% | 36% | 24 |
| 0.2-0.4 | 11% | 56% | 147 |
| 0.4-0.6 | 38% | 55% | 414 |
| 0.6-0.8 | 25% | 48% | 1,164 |
| 0.8-1 | 12% | 18% | 1,072 |
| Total | 22% | 44% | 2,821 |
| Source: BDUK OMR data |
6.5 Cambridgeshire
The analysis for Cambridgeshire covers 404 vouchers, including 380 GBVS, 13 RGC, and 11 UKGV vouchers issued in postcodes where other voucher types were also used. 55% were delivered by Cambridge Fibre Networks, with the remainder spread across a wide range of suppliers. Most vouchers were issued as standard connections, rather than through coordinated projects.
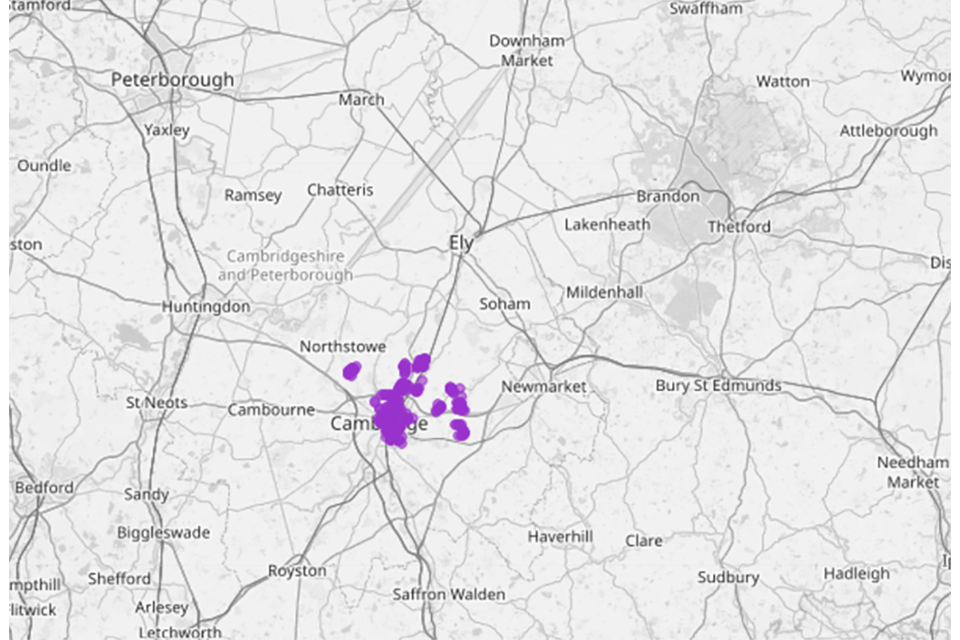
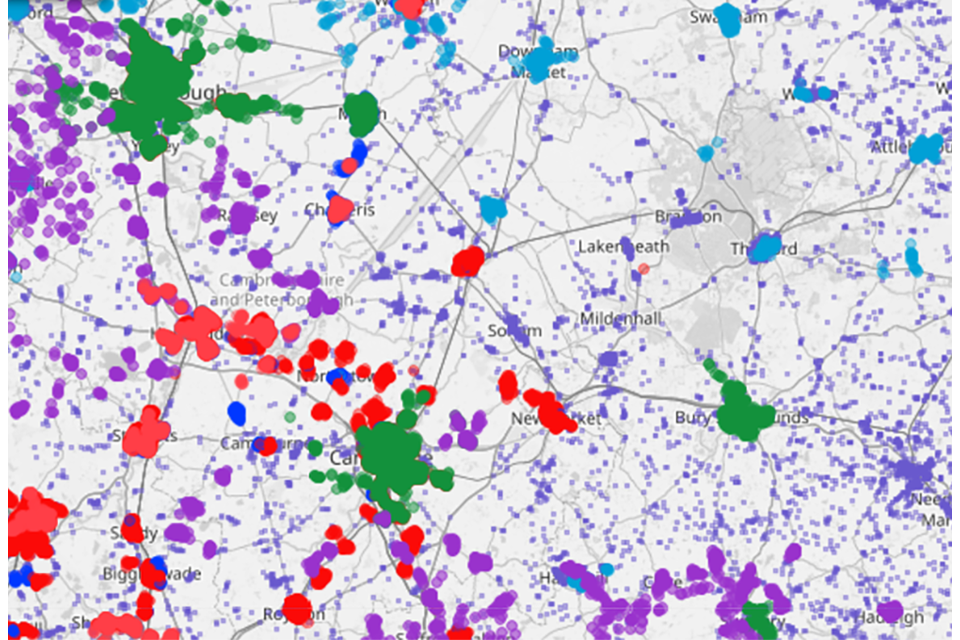
ThinkBroadband maps show that Cambridge Fibre Networks’ coverage is concentrated in the city of Cambridge and surrounding villages to the north and east. The lower map highlights the presence of multiple fibre networks in the city, including CityFibre, Virgin Media, Openreach, and Gigaclear.
Both CityFibre and Gigaclear operate using the Light Blue Fibre network, a ducting and fibre asset jointly owned by Cambridgeshire County Council and the University of Cambridge and made available commercially to broadband providers. This infrastructure was supported by BDUK funding through the Local Full Fibre Networks (LFFN) programme.
Image: Gigabit coverage of Cambridge Fibre Networks (top), and other providers (bottom) in Cambridgeshire
Source: Think Broadband
The table below shows that only 27% of vouchers in Cambridgeshire were used in uncommercial areas, the lowest share among all case study areas. It also indicates that voucher-supported areas have a higher proportion of white premises than non-voucher areas, particularly in uncommercial locations, where 42% of premises still lack access to gigabit-capable broadband.
While 63% of premises in voucher areas are classified as black, compared to 56% in non-voucher areas, this largely reflects the concentration of voucher use in the city of Cambridge, where multiple networks already operate. Although vouchers may have contributed to competition in the city, it is likely that other factors, such as the creation of Light Blue Fibre and the expansion of CityFibre and Gigaclear, played a more significant role.
It is also important to note that the intensity of voucher use in Cambridge was relatively low compared with other case study areas. Vouchers accounted for around 5% of total premises in Cambridge, compared with much higher proportions in Lancashire, Dorset and Kent. This reflects the predominance of GBVS vouchers in Cambridge, which were typically used on a more one-off basis, rather than being clustered within larger projects. By contrast, areas with a higher share of RGC vouchers often saw multiple vouchers concentrated within the same postcode, increasing both the likelihood of grey coverage and the potential for additional premises to be connected.
Percentage of premises in treated and untreated postcodes in Cambridgeshire which are black, grey or white
| All areas in Cambridgeshire | Uncommercial areas (F20) | |||||
|---|---|---|---|---|---|---|
| With vouchers | No vouchers | Total | With vouchers | No vouchers | Total | |
| Black | 63% | 56% | 56% | 20% | 30% | 30% |
| Grey | 24% | 37% | 36% | 37% | 49% | 49% |
| White | 12% | 8% | 8% | 42% | 21% | 22% |
| Total premises | 8,058 | 381,665 | 389,723 | 1,297 | 74,709 | 76,006 |
| Total vouchers | 406 | 110 | ||||
| Source: BDUK OMR data |
The low numbers of vouchers used in Cambridgeshire means we have not provided separate analysis by F score bands as the sample sizes for most bands are very low.
6.6 Conclusions
The evidence suggests that BDUK vouchers made a meaningful contribution to increasing competition at a national level, by enabling smaller alt-nets to enter the market, grow their networks, and challenge established suppliers. Many suppliers credited vouchers with helping them expand and attract investment, contributing to a more diverse and competitive broadband market overall.
However, the effects on local-level competition were more limited and context-specific. Suppliers frequently stated that in rural and less commercially viable areas, the market could not sustain more than one provider, and that they deliberately avoided building in areas already served by others. As a result, voucher-funded deployment often led to suppliers acting as the sole network provider in these locations.
The OMR analysis for case study areas provide further insight into how this played out on the ground. In areas like rural Lancashire and rural Dorset , voucher schemes did not create direct customer choice at the postcode level but they did help alt-nets like B4RN and Wessex Internet establish regional footholds, which in turn supported broader market diversity and the viability of smaller providers.
While vouchers may not have delivered competition in specific locations, they were clearly associated with a period of increased competition in the market more broadly, where suppliers moved quickly to capture new markets and expand coverage. In this sense, vouchers played a key role in stimulating market activity, accelerating investment in hard-to-reach areas, and contributing to a more competitive landscape across the UK.