Appendices
Published 1 October 2026

© Crown copyright 2026
This publication is licensed under the terms of the Open Government Licence v3.0 except where otherwise stated. To view this licence, visit nationalarchives.gov.uk/doc/open-government-licence/version/3 or write to the Information Policy Team, The National Archives, Kew, London TW9 4DU, or email: psi@nationalarchives.gov.uk.
Where we have identified any third party copyright information you will need to obtain permission from the copyright holders concerned.
This publication is available at https://www.gov.uk/government/publications/final-evaluation-of-bduk-legacy-vouchers-schemes/appendices
1. Appendix A: Analysis of change in coverage in Connected Nations
Phase 2 of the evaluation (2023) identified limitations in using Connected Nations data to assess changes in broadband coverage at the Output Area (OA) level. While Connected Nations provides the most comprehensive available dataset for broadband infrastructure and performance, coverage data at very small geographic scales can be sensitive to changes in supplier reporting over time.
The analysis found that only around half of the treated OAs displayed any increase in broadband coverage in the year following voucher-supported connections, while the remaining treated OAs exhibited either no change or, unexpectedly, a decline in reported coverage. There are some instances where we might expect a decrease in a given OA, for example damage to existing telecoms infrastructure or a supplier no longer providing service. However, the scale of decrease present in the data exceeds this as a possible explanation. This suggests a substantial degree of underreporting in the dataset, which could obscure the actual impacts of vouchers on broadband availability.
These inconsistencies meant that we were unable to draw definitive conclusions about the effects of vouchers on broadband coverage. Counterfactual analysis, which compared changes in coverage between treated and control areas, produced highly inconsistent results, likely driven by the data limitations rather than the true impact of vouchers. As a result, one of the first steps in the final evaluation was to explore whether these data issues persist and to assess whether Connected Nations remains a reliable source for conducting counterfactual analysis of the impact of vouchers on the availability of ultrafast broadband (UFBB) and gigabit-capable broadband.
This appendix presents our findings, focusing on two key questions:
-
What proportion of treated areas display any increase in coverage in the year or two years after receiving voucher-supported connections? This helps determine whether the reporting inconsistencies identified in the previous evaluation persist.
-
Is the increase in coverage commensurate with the number of vouchers used in these areas? If the Connected Nations dataset accurately reflects the impact of vouchers, we would expect a clear relationship between the level of support provided and changes in reported broadband coverage.
The findings of this analysis were used to inform whether Connected Nations coverage data can be used for robust counterfactual impact analysis or whether the analysis should focus solely on broadband performance (download speeds) where the data has been found to be a more reliable indicator.
What proportion of treated areas display any increase in coverage after receiving voucher-supported connections?
The table below shows that only around half of OAs that received a voucher showed any increase in the number of premises that could access UFBB or gigabit capable broadband in the year after their voucher connection. The proportion showing an increase has fluctuated, although the results for 2021 are much higher than earlier years which may indicate recent improvements in the coverage of Connected Nations data.
Proportion of treated OAs showing no change, increase, or decrease in UFBB and gigabit-capable broadband coverage one year after first voucher connection
| Year of first voucher | No change (±0) | Decreasing (≤-1) | Increasing (≥+1) | Number of OAs |
|---|---|---|---|---|
| UFBB | ||||
| 2018 | 12% | 23% | 65% | 1,487 |
| 2019 | 34% | 18% | 47% | 4,219 |
| 2020 | 33% | 16% | 51% | 2,724 |
| 2021 | 20% | 4% | 76% | 825 |
| All years | 29% | 17% | 54% | 9,255 |
| Gigabit capable | ||||
| 2018 | 33% | 11% | 56% | 1,487 |
| 2019 | 45% | 8% | 47% | 4,219 |
| 2020 | 36% | 9% | 55% | 2,724 |
| 2021 | 20% | 4% | 77% | 825 |
| All years | 38% | 9% | 53% | 9,255 |
| Source: Connected Nations, Ofcom |
The table below examines how the reported changes in broadband coverage differ when extending the analysis period from one year to two years after the initial voucher connection. The results show that a significantly higher proportion of treated OAs report an increase in coverage over two years compared to one year - 68% for UFBB and 74% for gigabit-capable broadband.
This trend may suggest that there is a delay in suppliers reporting the additional coverage enabled by vouchers, meaning it is not fully reflected in Connected Nations data within the first year but becomes more apparent after two years. However, an alternative explanation is that the general rollout of UFBB and gigabit-capable broadband has been expanding across most parts of the UK due to broader market trends and other BDUK interventions. As a result, we would naturally expect a higher proportion of OAs to show an increase in coverage over two years compared to just one.
Proportion of treated OAs showing no change, increase, or decrease in UFBB and gigabit-capable broadband coverage two years after first voucher connection.
| Year of first voucher | No change (±0) | Decreasing (≤-1) | Increasing (≥+1) | Number of OAs |
|---|---|---|---|---|
| UFBB | ||||
| 2018 | 9% | 21% | 71% | 1,487 |
| 2019 | 20% | 19% | 61% | 4,219 |
| 2020 | 17% | 10% | 72% | 2,724 |
| 2021 | 14% | 16% | 68% | 825 |
| All years | 17% | 16% | 68% | 9,255 |
| Gigabit capable | ||||
| 2018 | 19% | 7% | 74% | 1,487 |
| 2019 | 23% | 9% | 68% | 4,219 |
| 2020 | 13% | 5% | 81% | 2,724 |
| 2021 | 14% | 3% | 83% | 825 |
| All years | 19% | 7% | 74% | 9,255 |
| Source: Connected Nations, Ofcom |
The table below shows that, on average, each treated OA received 3.5 vouchers in its first year of support, with 29.1 premises gaining access to a gigabit-capable connection in the following year. However, the table also indicates that there is no clear correlation between the average number of vouchers issued in an area and the change in access to gigabit-capable broadband.
Change in number of premises with access to high speed broadband one year after first voucher connection
| Average change in number of premises with access to | Average vouchers per OA in first year | Number of treated OAs | ||
|---|---|---|---|---|
| Year of first voucher | UFBB | Gigabit capable | ||
| 2018 | 36.2 | 35.1 | 3.1 | 1,487 |
| 2019 | 14.1 | 29.9 | 2.6 | 4,219 |
| 2020 | 12.4 | 31.8 | 3.2 | 2,724 |
| 2021 | 14.7 | 23.9 | 9.4 | 825 |
| All years | 14.6 | 29.1 | 3.5 | 9,255 |
| Source: Connected Nations, Ofcom |
Change in Rural Gigabit Connectivity Voucher areas
It should be noted that the larger increases in coverage observed in earlier years in the table above may be due to the nature of the Gigabit Broadband Voucher Scheme(GBVS), which was less targeted towards rural areas and more likely to be used in commercial areas where suppliers were already expanding their networks. This could explain why some areas experienced significant increases in coverage despite receiving relatively few vouchers.
To account for this, this section focuses exclusively on vouchers issued through the Rural Gigabit Connectivity(RGC) scheme, which was specifically targeted at less commercial, rural areas. This allows for a clearer assessment of the relationship between vouchers and changes in broadband coverage in locations where market-driven expansion was less likely to have influenced the results.
The table below shows that around 55% of OAs treated through the RGC scheme show any increase in coverage in the year after support, indicating there is still significant underreporting of coverage enabled by vouchers.
Proportion of OAs treated through the RGC scheme showing no change, increase, or decrease in UFBB and gigabit-capable broadband coverage one year after first voucher connection
| Year of first voucher | No change (±0) | Decreasing (≤-1) | Increasing (≥+1) | Number of OAs |
|---|---|---|---|---|
| UFBB | ||||
| 2019 | 37% | 12% | 51% | 81 |
| 2020 | 33% | 6% | 61% | 481 |
| 2021 | 43% | 8% | 49% | 825 |
| All years | 37% | 8% | 55% | 1,389 |
| Gigabit capable | ||||
| 2019 | 38% | 12% | 51% | 81 |
| 2020 | 32% | 6% | 63% | 481 |
| 2021 | 42% | 8% | 49% | 825 |
| All years | 37% | 8% | 56% | 1,389 |
| Source: Connected Nations, Ofcom |
The table below looks in detail in coverage outcomes for OAs that received different volumes of vouchers through the RGC scheme. The results show no clear correlation between the number of vouchers issued in an area and the growth in the number of premises with access to gigabit-capable broadband. In fact, the data suggests a possible inverse relationship; areas receiving higher numbers of vouchers tend to show smaller increases in coverage. This is most pronounced in OAs that received more than 50 vouchers, where the average increase in premises with access was just 6 in the year following support.
The third column of the table presents the increase in the number of premises with access to gigabit-capable broadband per voucher. If Connected Nations data accurately reflected the coverage enabled by vouchers, this figure should always be at least 1 - since each voucher should correspond to at least one additional premise gaining access. However, the table shows this is not the case: in all OAs that received 16 or more vouchers (a total of 239 areas), the average increase in premises per voucher was less than 1 (values highlighted in red). This strongly suggests significant underreporting in Connected Nations, particularly in areas where multiple vouchers were issued.
Increase in premises with access to gigabit capable broadband in areas that received different volumes of vouchers (RGC only)
| Number of vouchers per OA | Average increase in premises with access to gigabit capable broadband | Increase in premises with gigabit capable broadband per voucher | No. OAs |
|---|---|---|---|
| 1 | 13 | 12.7 | 262 |
| 2-5 | 11 | 4.7 | 459 |
| 6-10 | 11 | 1.4 | 297 |
| 11-15 | 13 | 1.0 | 160 |
| 16-20 | 12 | 0.7 | 80 |
| 21-25 | 7 | 0.3 | 52 |
| 26-30 | 4 | 0.1 | 24 |
| 31-35 | 7 | 0.2 | 27 |
| 36-40 | 11 | 0.3 | 23 |
| 41-45 | 1 | 0.0 | 9 |
| 46-50 | 4 | 0.1 | 8 |
| 50+ | 6 | 0.0 | 16 |
| Source: Connected Nations, Ofcom |
1.1 Conclusion
The analysis presented above raises serious concerns about the reliability of Connected Nations as a dataset for monitoring changes in the number of premises with access to UFBB and gigabit-capable broadband.
-
In around half of OAs that have received a voucher, Connected Nations reports no increase or even a decrease in coverage after one year.
-
We find no correlation between the number of voucher-supported premises and the reported increase in broadband coverage. In many cases the number of premises recorded as gaining access is consistently lower than the number of premises receiving vouchers, particularly in areas with multiple vouchers.
These findings indicate that Connected Nations is not a reliable dataset for evaluating the impact of vouchers on broadband coverage. If used for counterfactual analysis, the data risks producing highly inconsistent and misleading results, as the true impact of vouchers may be systematically underreported. This could lead to:
-
Underestimation of additional coverage enabled by vouchers, as many voucher-supported premises do not appear in the dataset as gaining access.
-
Bias in comparisons between treated and control areas, as Connected Nations may misrepresent the scale of broadband improvements in these areas.
As such, this current phase of evaluation has had to use download speeds as a reasonable alternative to analyse the impact of vouchers on take-up, which is done in Report 1.
2. Appendix B: Technical Annex for Measuring Impacts on Local Area Broadband Performance
2.1 Purpose and Overview
This annex provides a detailed account of the data sources, analytical approach, and modelling methods used to estimate the effects of voucher support on broadband performance at the area level. It forms part of the counterfactual impact evaluation undertaken to assess whether areas receiving vouchers experienced greater improvements in broadband outcomes than comparable areas that did not receive support.
The evaluation adopts a quasi-experimental approach, using propensity score matching (PSM) to identify control areas with similar pre-treatment characteristics to those that received vouchers. Once matched, the broadband performance of treated and control areas is tracked over time using Ofcom’s Connected Nations data to estimate the net additional change in download and upload speeds attributable to the voucher schemes. The analysis is carried out for multiple treatment cohorts, corresponding to areas first receiving voucher connections in 2018/19, 2019/20 and 2020/21, with outcomes assessed over subsequent years.
The analytical process follows the sequence below:
1. Data integration – Combining Connected Nations, BDUK voucher, FScore, and socio-economic datasets at OA and postcode levels.
2. Defining treatment – Identifying areas with at least one connected voucher within each treatment year, distinguishing between GBVS and RGC schemes.
3. Constructing the counterfactual – Using PSM to identify non-supported areas that are statistically comparable to supported ones, drawing from different control pools.
4. Estimating treatment effects – Applying Difference-in-Difference(DiD) analysis to the matched samples to quantify the additional changes in broadband speed and availability associated with voucher support.
5. Assessing robustness – Testing alternative model specifications, data sources and geographic samples to ensure that results are consistent and reliable.
2.2 Datasets and integration
The counterfactual analysis draws upon multiple datasets to construct a consistent evidence base on broadband performance, voucher delivery, commercial viability, and area characteristics. These datasets were integrated at OA and postcode level, allowing for detailed comparison between supported and comparable unsupported areas. Each dataset and its role in the modelling are described below.
Connected Nations data (for measuring outcomes)
The primary outcome data used in the analysis were drawn from Ofcom’s Connected Nations reports, which provide annual statistics on the coverage and performance of fixed broadband and mobile networks across the UK. This data forms the foundation for assessing how broadband performance changed over time in areas that received voucher support compared with comparable areas that did not.
Data from each annual report between 2017 and 2024 were used, which can be accessed here . The Connected Nations datasets provide consistent, longitudinal information on both broadband coverage and performance, allowing year-on-year comparisons at detailed geographic levels. The analysis used only the final annual datasets for each year, as these represent Ofcom’s verified statistics and fill gaps in interim updates.
The variables compiled from the Connected Nations data include:
-
Coverage indicators: the percentage and number of premises meeting specified speed thresholds (2, 5, 10, 30 and 300 Mbit/s), and the proportion with access to superfast (≥30 Mbit/s), ultrafast (≥100 Mbit/s), full-fibre and gigabit-capable broadband. The dataset also records premises below the universal service obligation and those able to receive broadband via fixed wireless access.
-
Performance indicators: minimum, average and maximum upload and download speeds, data usage per connection, and the number of lines within defined speed categories. Performance data were collected in May 2018, 2019, 2021, 2022 and 2023, in June 2020, and in July 2024.
Both coverage and performance data are available at postcode and OA level. Earlier reports (up to 2022/23) used 2011 Census OA geographies, while later releases (from 2023/24 onwards) adopted 2021 Census boundaries. To maintain a consistent time series, the earlier data were re-estimated on the 2021 geography using ONS postcode look-ups and weighted mapping methods.
For the 2024 reporting year, Ofcom revised the format of its broadband performance statistics, focusing on maximum speeds achievable within broad speed bands rather than average speeds across all lines. As a result, the broadband performance analysis presented in this evaluation covers the period up to 2023.
Initial analysis of coverage data identified patterns that suggest inconsistencies in reported gigabit-capable coverage in some areas where vouchers had been used. These patterns may reflect variation in supplier reporting over time rather than genuine changes in network availability, particularly at very small geographical scales. Because this issue could bias estimates of programme effects on broadband coverage, the main analysis therefore focuses on broadband performance outcomes, which are less sensitive to reporting variation. The supporting analysis of under-reporting in gigabit coverage is presented in Appendix A.
Overall, the Connected Nations dataset provides a detailed and credible basis for tracking changes in broadband performance over time. These performance measures form the primary outcome variables in the counterfactual analysis used to estimate the additional improvements in broadband speeds associated with voucher support.
BDUK monitoring data (for defining treatment)
The analysis uses detailed administrative data supplied by BDUK on all broadband connections supported through the voucher schemes. This dataset provides information on when and where vouchers were used, the value of support provided, and the type of connection funded. They form the main evidence base for identifying which areas received public subsidy.
The dataset includes, for each voucher, information on:
-
the voucher scheme under which support was provided – GBVS, RGC, or the later UKGV;
-
the supplier delivering the connection;
-
the value of the voucher;
-
the geographic location of the connected premises;
-
the status of the voucher (connected or cancelled); and
-
whether the voucher was part of a supplier project, where several vouchers were combined to support a coordinated local build, or a standard voucher, issued to a single household or business.
An updated extract of the BDUK vouchers dataset was provided for this final evaluation. The updated data include additional years of activity and improvements in completeness and consistency. The dataset also includes some revisions to scheme coding. A small number of vouchers (350) that were initially recorded as funded under the RGC programme were subsequently reclassified as being funded through the UK Gigabit Voucher scheme. This mainly affected vouchers issued in 2020 and 2021.
The updated dataset also includes revisions to the dates on which vouchers were issued, resulting in significant changes to the number of vouchers recorded in each year compared with the 2022 dataset used for the 2023 report. For example, the earlier dataset indicated that 1,974 vouchers were issued in 2018, whereas the updated data show 4,874. Conversely, the 2022 dataset recorded 9,301 vouchers issued in 2021, while the updated version shows only 3,880. Overall, the revised data suggest that voucher activity took place earlier than previously reported, with a greater number of connections now appearing in the earlier years of the programme.
RGC and GBVS voucher issued year in original 2022 and new 2025 data
| Original 2022 data | |||||
|---|---|---|---|---|---|
| New 2025 data | 2018 | 2019 | 2020 | 2021 | Total |
| 2018 | 1,974 | 2,596 | 295 | 9 | 4,874 |
| 2019 | 0 | 9,271 | 6,581 | 927 | 16,779 |
| 2020 | 0 | 6 | 11,620 | 4,486 | 16,112 |
| 2021 | 0 | 0 | 1 | 3,879 | 3,880 |
| TOTAL | 1,974 | 11,873 | 18,497 | 9,301 | |
| Source: BDUK |
| Note: This table compares the year of voucher issue recorded in the original 2022 dataset (columns) with the revised year of issue in the updated 2025 dataset (rows). Each cell shows the number of vouchers that were previously recorded in one year but are now recorded in a different year. Values along the diagonal indicate vouchers where the recorded year is unchanged. Differences off the diagonal reflect revisions to issue dates in the updated data. |
A key limitation of the dataset is that it does not record the exact date of connection for each voucher. Following advice from BDUK, the analysis uses the voucher issued date as the best available estimate of This table was quite difficult to interpret - I was able to get at it through the text so really important to keep the text and possibly consider a caption to the table to explain how to read itwhen the connection would have been completed. This provides a consistent method for aligning voucher activity with the annual outcome data from Ofcom’s Connected Nations reports.
F score model (for assessing commercial viability and cost to connect)
To complement the vouchers data, BDUK provided outputs from its FScore Model, which estimates the relative cost and commercial viability of connecting individual premises to gigabit-capable broadband. This was used to help identify areas that would have been commercially viable for suppliers to reach without public subsidy and those that would not.
The FScore Model was developed by BDUK to assess the cost of deploying fibre-to-the-premise connections across the UK. It assigns each property an F score that is proportionate to the estimated cost of connection. Lower FScore values indicate premises that are relatively easy and inexpensive to connect, typically because they are close to existing network infrastructure, while higher scores represent premises that are more costly to reach, often due to remoteness, dispersed settlement patterns, or challenging geography.
BDUK uses an FScore threshold of 0.82 to distinguish between premises that are commercially viable and those which are not. Premises with scores below 0.82 are considered likely to be connected by the market without subsidy, whereas those above 0.82 are classed as non-commercial and therefore more likely to require public intervention. This distinction broadly aligns with the “F20” category described in the report, representing roughly the 20 per cent of UK premises least likely to be served commercially.
For this evaluation, the FScore data were aggregated to both the postcode and OA levels to produce average measures of connection cost and difficulty across small geographic areas. These aggregated indicators were used as explanatory variables in the propensity score matching models, ensuring that the control areas selected for comparison had similar commercial characteristics to the voucher-supported areas.
Linking the FScore data with the vouchers dataset also made it possible to examine whether public funding reached those high-cost, hard-to-connect locations where commercial roll-out would have been least likely. This provided important context for assessing whether the voucher schemes effectively targeted areas that the market alone would not have served.
Economic and demographic data (for matching treatment and control areas)
To ensure that the analysis accounts for differences between areas that could influence broadband outcomes, a range of economic, demographic, and geographic variables were compiled from official sources and linked to the Connected Nations, vouchers, and FScore datasets.
The principal data sources were the Office for National Statistics (ONS) and Nomis, supplemented by equivalent datasets for Scotland and Northern Ireland. These provide consistent, nationally recognised measures of local economic structure and population characteristics.
The variables cover four main domains:
-
Employment and business activity, capturing the scale of local labour markets and economic density using data from the ONS Business Register and Employment Survey;
-
Population density, derived from ONS mid-year estimates, reflecting the degree to which an area is urban or rural;
-
Rural–urban classification, based on the ONS 2011 Rural Urban Classification for Local Super Output Areas (LSOAs) used to identify rural locations; and
-
Deprivation, measured using the income and employment domains of the Index of Multiple Deprivation, 2020 (IMD) for England and Wales, with equivalent indices for Scotland (Scottish Index of Multiple Deprivation, 2020) and Northern Ireland (Northern Ireland Multiple Deprivation Measure, 2017).
For analysis at output-area or postcode level, the LSOA-based data were mapped down to these smaller geographies using standard ONS look-up tables.
2.3 Defining Treatment and Control Areas
Defining treated areas
To estimate the impact of the voucher schemes, the first step was to define which areas were considered treated; that is, those that received support through one or more connected vouchers during the evaluation period.
An area was defined as treated if it contained at least one voucher issued during the year to 30 September (with vouchers issued after 30th September included in next year’s cohort), following BDUK’s advice that the issued date provides the best available approximation of when a connection would have been completed. This approach aligns with the annual cycle of Ofcom’s Connected Nations reporting, ensuring that voucher activity is synchronised with the period covered by the outcome data.
Treatment was identified at both OA and postcode level. Each treated area was then grouped into a treatment cohort based on the year in which voucher connections first occurred. The analysis focuses on four cohorts:
-
2018 – areas with first vouchers issued between 1 October 2017 and 30 September 2018;
-
2019 – areas with first vouchers issued between 1 October 2018 and 30 September 2019;
-
2020 – areas with first vouchers issued between 1 October 2019 and 30 September 2020; and
-
2021 – areas with first vouchers issued between 1 October 2020 and 30 September 2021.
Where an area received vouchers in multiple years, only the first year of support was used to define treatment. This avoids double counting and ensures that the analysis captures the initial point at which an area gained access to improved broadband infrastructure through the voucher schemes.
From 2020 onwards, analysis is complicated by the overlap between the two schemes in scope (GBVS and RGC) and the UKGV scheme. Any areas that only received a voucher through the UKGV scheme were not included in the treatment group. However, in a number of cases, UKGV vouchers were used in the same OAs as GBVS and RGC vouchers in the same treatment year or in subsequent years, meaning they may influence the results. These areas are included in the treatment group as removing them would have significantly reduced the available sample size, particularly for RGC areas. It should be noted that the UKGV voucher scheme continued beyond 2021.
The table below shows the number of vouchers used in each OA during its first year of treatment, excluding any additional vouchers received in later years. It also presents the number of OAs treated for the first time each year and the average number of vouchers per area, reflecting the intensity of support.
Number of vouchers and treated OAs by first treatment year
| GBVS | RGC | UKGVS | Total vouchers | Treated OAs | Vouchers per OA | |
|---|---|---|---|---|---|---|
| 2018 | 4,804 | 55 | - | 4,859 | 1,617 | 3.0 |
| 2019 | 11,566 | 1,300 | 59 | 12,925 | 4,650 | 2.8 |
| 2020 | 4,521 | 4,635 | 1,037 | 10,193 | 3,120 | 3.3 |
| 2021 | - | 1,833 | 1,052 | 2,885 | 318 | 9.1 |
| Total | 20,891 | 7,823 | 2,148 | 30,862 |
| Source: BDUK |
Identifying control areas
To assess the additional impact of voucher support, the evaluation compared changes in broadband outcomes in areas that received vouchers with those in similar areas that did not. This required identifying a counterfactual group of unsupported areas that were as comparable as possible to the treated areas before the introduction of vouchers.
Because voucher participation was not random, directly comparing supported and unsupported areas could produce misleading results. Areas that received vouchers may have had different economic characteristics, population densities or broadband infrastructure even before support began. To address this, the analysis used PSM to identify unsupported areas that closely resembled the treated ones based on observable characteristics.
To construct the counterfactual, several combinations of selection models and sample pools were tested to check the robustness of results. The approach involved:
-
Estimating three different selection models, which used alternative combinations of matching variables to predict the likelihood that an area received voucher support; and
-
Applying these models to different control pools (groups of potentially comparable areas) to test how the choice of comparison sample affected results.
This produced nine separate model–sample combinations, allowing us to test whether estimated impacts were consistent across different assumptions about how voucher-supported areas were selected and which areas made the best comparators.
The control pools used for matching were defined as follows:
-
All areas: included all OAs across England, Scotland, Wales and Northern Ireland that had not received voucher support. This provided the largest pool for matching and maximised statistical power but included a wide range of area types.
-
All areas excluding high-employment OAs: excluded OAs located within the 1% of LSOAs with the highest employment levels. Treated areas often had higher business density, which made it difficult to find close matches in the full sample. Removing these extremes improved comparability.
-
Same-exchange areas: included only OAs served by the same broadband exchange as a treated OA. Areas sharing an exchange are likely to have similar underlying infrastructure and commercial viability. An OA was linked to a single exchange if at least 60% of its premises were served by that exchange. This improved comparability of network conditions but reduced the pool size.
Each sampling approach offered trade-offs between coverage and precision:
-
All areas provided the broadest control pool but included more heterogeneous areas;
-
Excluding high-employment areas improved comparability by removing outliers with very high business density; and
-
Same-exchange areas gave the most precise comparison in terms of network characteristics but substantially reduced the available sample.
To ensure that the control group contained only genuinely untreated areas, any OAs that had received vouchers in earlier years were removed from the pool of potential comparators. This meant that the number of available control areas declined slightly in later cohorts, as more of the country became eligible or supported. The table below summarises the number of OAs included in the treated and control samples across the four treatment years.
Number of OAs in treated sample by treatment year
| OAs treated for first time | ||||
|---|---|---|---|---|
| OAs receiving a voucher | All treated | Excl high employment | Same exchange | |
| 2018 | 1,642 | 1,642 | 1,264 | 1,542 |
| 2019 | 5,441 | 4,649 | 3,802 | 4,391 |
| 2020 | 5,174 | 3,364 | 2,956 | 3,113 |
| 2021 | 3,009 | 2,034 | 1,957 | 1,684 |
| Source: Belmana |
The use of multiple model–sample combinations allowed the evaluation to test the sensitivity of results to different assumptions about the factors influencing voucher take-up and the characteristics of the counterfactual areas. The detailed specification of each selection model and the results of the matching process are provided below.
2.4 Model specification
Selection modelling
To identify control areas a selection model was developed to estimate the probability that an area would be supported through the voucher schemes. This forms the basis for the PSM used to create the control group.
The model was estimated using a Probit regression, which predicts the likelihood of an event occurring; in this case, whether an OA received at least one voucher, based on observable characteristics before support was introduced.
The selection model drew on the datasets described earlier in the annex. It included variables that capture the main differences between areas that received vouchers and those that did not, focusing on characteristics that might affect either the demand for faster broadband or the cost of supplying it.
The key variables were:
-
Employment: total employment at LSOA level, included in logarithmic form to reflect business density. Areas with more businesses were more likely to apply for vouchers.
-
Digital employment: a binary indicator identifying whether an area had above-average employment in digital or technology-intensive industries. Areas with higher digital employment may have greater demand for high-speed connections.
-
Population density: measured as the number of people per square kilometre. Denser areas are typically cheaper to serve and are therefore more commercially viable.
-
Rurality: based on the ONS 2011 Rural–Urban Classification at LSOA level.
-
Deprivation: income-domain rank from the Index of Multiple Deprivation (IMD), controlling for socio-economic differences that could affect both demand and eligibility for support.
-
FScore: average cost-to-connect index from the BDUK FScore model, representing the relative cost of extending fibre to the area. Higher FScore values indicate less commercially viable areas.
-
Distance to exchange: the average distance (in kilometres) from the OA centroid to the broadband exchange serving most premises. Longer distances increase connection costs and therefore the likelihood of requiring public subsidy.
-
Pre-treatment broadband performance: indicators of average download and upload speeds before voucher support, or the annual change in download speeds prior to treatment. Including these variables helps control for existing differences in broadband quality and pre-trends.
-
Regional dummies: binary variables for English regions and devolved nations, capturing broader structural and policy differences between parts of the UK.
Three alternative model specifications were tested to examine how sensitive the results were to the inclusion of different pre-treatment broadband variables and employment measures:
-
Model I: included population density, high digital employment, rurality, income deprivation, FScore, distance to exchange, and the change in average download speed in the year before support, ensuring that previous trends in broadband improvement were accounted for.
-
Model II: included all variables from Model I but also added total employment (in logarithmic form) to capture local business density as an additional driver of voucher uptake.
-
Model III: included the same variables as Model I but replaced the change in broadband performance with the level of performance before support (for example, average upload speed), to test whether the model’s explanatory power depended on the choice of performance measure.
Each of these models was applied to the three sampling pools described above (all areas, all areas excluding high-employment OAs, and same-exchange OAs), producing nine distinct model–sample combinations in total (see diagram below). This ensured that results were not driven by a particular specification or dataset, and allowed the evaluation to test whether estimated impacts were consistent across different assumptions about how vouchers were distributed and which areas made the best comparators.
Illustration of how selection models were developed using different combinations of sample pools and model specifications
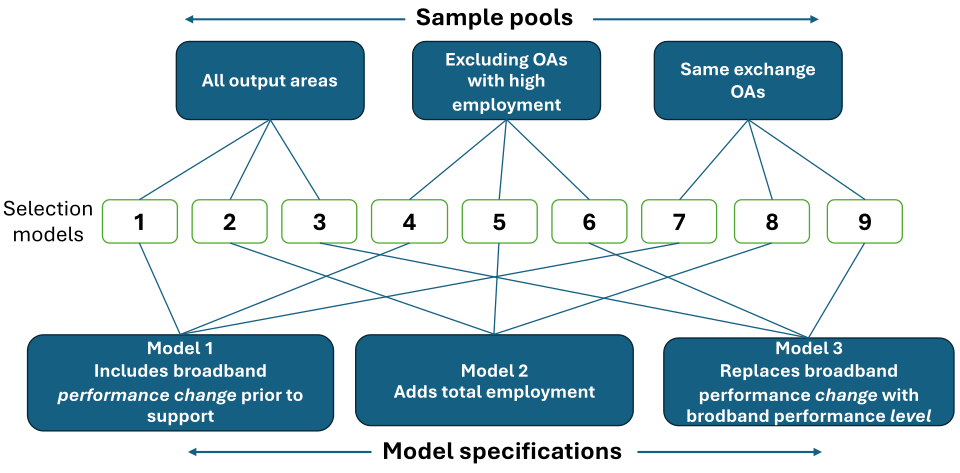
In every case, the model was estimated separately for each treatment cohort year (2018–2021), ensuring that the estimated selection probabilities reflected the conditions and scheme parameters relevant to each period. This means the control groups in 2021 were more rural in nature, reflecting the shift from GBVS to RGC.
Matching procedure
Following estimation of the selection models, each treated area was matched with one or more comparable untreated areas that had similar observable characteristics before voucher support. This was achieved through PSM using the estimated probabilities (propensity scores) from the Probit selection models described above.
Under this approach:
-
Each treated OA was assigned a propensity score, representing its estimated likelihood of receiving voucher support.
-
Treated areas were then matched to one or more untreated areas with similar propensity scores using a nearest-neighbour matching algorithm.
-
Matching was conducted without replacement, meaning that each control area was used only once to maintain balance across the sample.
Before matching, the overlap between treated and untreated areas was examined to confirm that there was sufficient common support; that is, that untreated areas existed with similar characteristics to those that received vouchers. This ensured that meaningful comparisons could be made.
The quality of matching was assessed through balance diagnostics, comparing the distributions of key variables between treated and matched control groups. After matching, the differences in pre-treatment characteristics between the two groups were substantially reduced, indicating that the procedure successfully identified comparable areas.
This process was repeated for each of the nine model–sample combinations described above, and for each of the four treatment cohorts (2018–2021). Matching results and diagnostic statistics for each cohort are presented in the annex tables.
The matched datasets were then used in DiD analysis (see below) to estimate the additional changes in broadband performance attributable to voucher support.
To check the robustness of the results, the analysis compared findings across the different model specifications and control pools. Consistent results across these variations provided confidence that the estimated impacts are not sensitive to specific modelling choices or sample definitions.
Summary of estimated selection models
The tables below present the results of the selection models used to construct matched control areas for the impact analysis. These models estimate the probability that an OA is selected as a control, based on a range of characteristics measured before vouchers were issued. They are used to test whether treated and control areas are comparable on observable factors, rather than to draw substantive conclusions about individual variables.
Each table reports the results for different model specifications. Variables are included or excluded across models to test the robustness of the matching and to identify specifications that achieve the best balance between treated and control areas.
The “observations” row shows the total number of OAs included in the sample used to estimate each model. This includes both treated areas and the wider pool of potential control areas from which matches are selected.
Each cell in the table reports three elements:
-
Coefficient (e.g. 0.0): This shows the estimated relationship between the variable and the likelihood of an area being selected as a control. Values close to zero indicate that the variable has little influence once other factors are controlled for.
-
t-statistic (in brackets, e.g. (4.2)): This indicates how strongly the data support the estimated relationship. Larger absolute values mean stronger statistical evidence that the effect is different from zero.
-
Statistical significance (stars): Stars indicate the level of statistical significance: *** significant at the 1% level, ** significant at the 5% level, * significant at the 10% level
The adjusted R² shows how much of the variation in treatment status is explained by the variables included in the model. In these tables, adjusted R² values are relatively low. This is expected and appropriate for selection models of this kind.
The purpose of these models is not to maximise explanatory power, but to ensure treated and control areas are comparable on key observable characteristics. In applied economic evaluations, low adjusted R² values are common in propensity and selection models and do not indicate poor model quality. The robustness of the analysis is assessed through balance and pre-trend tests rather than the R² statistic.
Across all specifications and cohorts, coefficients generally had the expected signs and were statistically significant.
Key patterns include:
-
Employment and business density: Areas with higher employment were more likely to receive vouchers, reflecting the programme’s initial focus on business premises.
-
Digital sector presence: Areas with a greater share of employment in digital or technology-intensive sectors were more likely to be treated, indicating higher demand for faster connections.
-
Rurality: Rural areas had a significantly higher probability of receiving support, with the effect strengthening in later years as the RGC programme became dominant.
-
Connection costs and distance: Higher FScore values and greater distance to the exchange both increased the likelihood of treatment, showing that the schemes effectively targeted higher-cost, less commercially viable areas.
-
Deprivation: Less deprived areas were slightly more likely to receive vouchers, likely due to rural areas being less likely to be deprived than urban areas.
-
Pre-treatment broadband quality: Areas with lower initial speeds or slower improvement before the programme were more likely to be treated.
Results were consistent across the three sample pools and model variants, though excluding the top 1% of high-employment areas slightly improved comparability. The main change over time was a growing emphasis on rural and higher-cost areas as policy priorities shifted from the more business-focused GBVS to the more rural, residential RGC scheme.
Overall, the models show that voucher support was influenced by logical and policy-consistent factors -rurality, commercial viability, and local demand, providing confidence that the propensity scores and matched control areas are robust.
Selection models for control areas in 2019 - Part 1
| All OAs pool | |||
|---|---|---|---|
| Treated in | I | II | III |
| SFBB coverage | n.a. | n.a. | 0.0 (4.2)*** |
| Average data usage (Gigabits) | n.a. | n.a. | 0.0 (-2.3)** |
| Average upload speed (Mbit/s) | n.a. | n.a. | 0.0 (6.1)*** |
| Download speed, year before (Mbit/s) | 0.0 (7.5)*** | 0.0 (10)*** | n.a. |
| Distance to exchange | 0.0 (6.4)*** | 0.0 (-1.6) | 0.0 (2.0)** |
| Index of Multiple Deprivation (LSOA) | -0.2 (-5.7)*** | -0.1 (-3.4)*** | -0.2 (-4.1)*** |
| Employment (ln) (LSOA) | n.a. | 0.3 (55.2)*** | 0.3 (56.2)*** |
| ICT (LSOA) | 0.1 (5.7)*** | 0.1 (7.1)*** | 0.1 (6.0)*** |
| Rurality | 0.2 (6.6)*** | 0.0 (-0.4) | 0.0 (1.2) |
| FScore | 0.2 (4.6)*** | 0.0 (1.0) | 0.1 (2.2)** |
| Population density (ln, LSOA) | n.a. | n.a. | -0.1 (-11.5)*** |
| Constant | -4.56 (-15.58***) | -2.90 (-12.32***) | -1.75 (-4.65***) |
| Adjusted R-square | 0.13 | 0.15 | 0.13 |
| Observations | 215526 | 215376 | 214726 |
Selection models for control areas in 2019 - Part 2
| Excl high Employment OAs | |||
|---|---|---|---|
| Treated in | I | II | III |
| SFBB coverage | n.a. | n.a. | 0.0 (3.6)*** |
| Average data usage (Gigabits) | n.a. | n.a. | 0.0 (-2.3)** |
| Average upload speed (Mbit/s) | n.a. | n.a. | 0.0 (6.1)*** |
| Download speed, year before (Mbit/s) | 0.0 (8.4)*** | 0.0 (10.2)*** | n.a. |
| Distance to exchange | 0.1 (6.9)*** | 0.0 (-0.9) | 0.0 (2.4)** |
| Index of Multiple Deprivation (LSOA) | -0.2 (-5.9)*** | -0.1 (-3.4)*** | -0.2 (-4.2)*** |
| Employment (ln) (LSOA) | n.a. | 0.3 (48.8)*** | 0.3 (48.6)*** |
| ICT (LSOA) | 0.1 (5.3)*** | 0.1 (6.6)*** | 0.1 (5.7)*** |
| Rurality | 0.2 (6.4)*** | 0.0 (-0.1) | 0.0 (0.8) |
| FScore | 0.2 (4.7)*** | 0.0 (1.1) | 0.1 (2.2)** |
| Population density (ln, LSOA) | n.a. | n.a. | -0.1 (-12.1)*** |
| Constant | -2.84 (-10.10***) | -2.07 (-8.03***) | -0.89 (-2.20**) |
| Adjusted R-square | 0.11 | 0.14 | 0.12 |
| Observations | 213514 | 213366 | 212720 |
Selection models for control areas in 2019 - Part 3
| Same exchange OAs | |||
|---|---|---|---|
| Treated in | I | II | III |
| SFBB coverage | n.a. | n.a. | 0.0 (4.2)*** |
| Average data usage (Gigabits) | n.a. | n.a. | 0.0 (-1.9)* |
| Average upload speed (Mbit/s) | n.a. | n.a. | 0.0 (5.9)*** |
| Download speed, year before (Mbit/s) | 0.0 (6.4)*** | 0.0 (8.1)*** | n.a. |
| Distance to exchange | 0.0 (5.7)*** | 0.0 (-1.6) | 0.0 (0.8) |
| Index of Multiple Deprivation (LSOA) | -0.2 (-5.7)*** | -0.2 (-4.2)*** | -0.2 (-4.2)*** |
| Employment (ln) (LSOA) | n.a. | 0.3 (51.8)*** | 0.3 (52.5)*** |
| ICT (LSOA) | 0.1 (5.1)*** | 0.1 (6.5)*** | 0.1 (5.4)*** |
| Rurality | 0.3 (9.0)*** | 0.0 (1.6) | 0.1 (2.9)*** |
| FScore | 0.2 (4.8)*** | 0.1 (1.7)* | 0.1 (2.1)** |
| Population density (ln, LSOA) | n.a. | n.a. | -0.1 (-12.6)*** |
| Constant | -4.12 (-15.71***) | -2.90 (-12.08***) | -1.63 (-4.20***) |
| Adjusted R-square | 0.12 | 0.15 | 0.13 |
| Observations | 172136 | 171951 | 171413 |
| Source: Belmana |
| Note: Significance levels are 1% (***), 5% (**) and 10% (*). |
Selection models for control areas in 2020 - Part 1
| All OAs pool | |||
|---|---|---|---|
| Treated in | I | II | III |
| SFBB coverage | n.a. | n.a. | 0.0 (1.0) |
| Average data usage (Gigabits) | n.a. | n.a. | 0.0 (-2.7)*** |
| Average upload speed (Mbit/s) | n.a. | n.a. | 0.0 (-1.2) |
| Download speed, year before (Mbit/s) | 0.0 (-6.3)*** | 0.0 (-6.0)*** | n.a. |
| Distance to exchange | 0.0 (6.0)*** | 0.0 (-0.7) | 0.0 (0.5) |
| Index of Multiple Deprivation (LSOA) | -0.3 (-7.0)*** | -0.1 (-3.0)*** | -0.2 (-4.3)*** |
| Employment (ln) (LSOA) | n.a. | 0.2 (37)*** | 0.2 (35.7)*** |
| ICT (LSOA) | 0.0 (1.7)* | 0.1 (2.2)** | 0.0 (2.1)** |
| Rurality | 0.4 (15.0)*** | 0.3 (10)*** | 0.2 (7.6)*** |
| FScore | 0.2 (3.4)*** | -0.1 (-1.1) | 0.0 (-0.2) |
| Population density (ln, LSOA) | n.a. | n.a. | -0.1 (-17)*** |
| Constant | -4.2 (-67)*** | -3.0 (-40)*** | -3.2 (-39)*** |
| Adjusted R-square | 0.10 | 0.13 | 0.11 |
| Observations | 211639 | 211489 | 210839 |
Selection models for control areas in 2020 - Part 2
| Excl high Employment OAs | |||
|---|---|---|---|
| Treated in | I | II | III |
| SFBB coverage | n.a. | n.a. | 0.0 (0.9) |
| Average data usage (Gigabits) | n.a. | n.a. | 0.0 (-2.7)*** |
| Average upload speed (Mbit/s) | n.a. | n.a. | 0.0 (-1.2) |
| Download speed, year before (Mbit/s) | 0.0 (-6.1)*** | 0.0 (-5.9)*** | n.a. |
| Distance to exchange | 0.0 (6.1)*** | 0.0 (-0.6) | 0.0 (0.5) |
| Index of Multiple Deprivation (LSOA) | -0.3 (-7.2)*** | -0.2 (-3.3)*** | -0.2 (-4.5)*** |
| Employment (ln) (LSOA) | n.a. | 0.3 (34.6)*** | 0.2 (33.1)*** |
| ICT (LSOA) | 0.0 (1.5) | 0.0 (2.1)** | 0.0 (2.0)** |
| Rurality | 0.4 (15.0)*** | 0.3 (10.6)*** | 0.2 (7.5)*** |
| FScore | 0.2 (3.5)*** | -0.1 (-1.0) | 0.0 (-0.2) |
| Population density (ln, LSOA) | n.a. | n.a. | -0.1 (-18)*** |
| Constant | -4.2 (-65)*** | -3.1 (-40)*** | -3.3 (-38)*** |
| Adjusted R-square | 0.10 | 0.12 | 0.11 |
| Observations | 209936 | 209788 | 209142 |
Selection models for control areas in 2020 - Part 3
| Same exchange OAs | |||
|---|---|---|---|
| Treated in | I | II | III |
| SFBB coverage | n.a. | n.a. | 0.0 (4.2)*** |
| Average data usage (Gigabits) | n.a. | n.a. | 0.0 (-1.9)* |
| Average upload speed (Mbit/s) | n.a. | n.a. | 0.0 (5.9)*** |
| Download speed, year before (Mbit/s) | 0.0 (-6.9)*** | 0.0 (-6.4)*** | n.a. |
| Distance to exchange | 0.0 (5.7)*** | 0.0 (-1.6) | 0.0 (0.8) |
| Index of Multiple Deprivation (LSOA) | -0.2 (-5.7)*** | -0.2 (-4.2)*** | -0.2 (-4.2)*** |
| Employment (ln) (LSOA) | n.a. | 0.3 (51.8)*** | 0.3 (52.5)*** |
| ICT (LSOA) | 0.1 (5.1)*** | 0.1 (6.5)*** | 0.1 (5.4)*** |
| Rurality | 0.3 (9.0)*** | 0.0 (1.6) | 0.1 (2.9)*** |
| FScore | 0.2 (4.8)*** | 0.1 (1.7)* | 0.1 (2.1)** |
| Population density (ln, LSOA) | n.a. | n.a. | -0.1 (-13)*** |
| Constant | -4.5 (-72)*** | -3.0 (-39)*** | -3.7 (-43)*** |
| Adjusted R-square | 0.12 | 0.15 | 0.13 |
| Observations | 172136 | 171951 | 171413 |
| Source: Belmana |
| Note: Significance levels are 1% (***), 5% (**) and 10% (*). |
Selection models for control areas in 2021 - Part 1
| All OAs pool | |||
|---|---|---|---|
| Treated in | I | II | III |
| SFBB coverage | n.a. | n.a. | 0.0 (-0.7) |
| Average data usage (Gigabits) | n.a. | n.a. | 0.0 (0.4) |
| Average upload speed (Mbit/s) | n.a. | n.a. | 0.0 (-3.1)*** |
| Download speed, year before (Mbit/s) | 0.0 (-1.5) | 0.0 (-3.8)*** | n.a. |
| Distance to exchange | 0.1 (6.4)*** | 0.0 (-0.7) | 0.0 (-3.8)*** |
| Index of Multiple Deprivation (LSOA) | -0.3 (-6)*** | -0.1 (-1.9)* | 0.2 (2.7)*** |
| Employment (ln) (LSOA) | n.a. | 0.0 (4.3)*** | 0.0 (-2.0)** |
| ICT (LSOA) | -0.1 (-5)*** | -0.1 (-4)*** | -0.1 (-4)*** |
| Rurality | 0.8 (26.7)*** | 0.7 (22.3)*** | 0.4 (11.8)*** |
| FScore | 0.2 (2.8)*** | -0.2 (-3)*** | -0.4 (-6)*** |
| Population density (ln, LSOA) | n.a. | n.a. | -0.3 (-37)*** |
| Constant | -3.1 (-46)*** | -1.5 (-17)*** | -0.5 (-5)*** |
| Adjusted R-square | 0.15 | 0.19 | 0.22 |
| Observations | 208788 | 208638 | 207988 |
Selection models for control areas in 2021 - Part 2
| Excl high Employment OAs | |||
|---|---|---|---|
| Treated in | I | II | III |
| SFBB coverage | n.a. | n.a. | 0.0 (-0.6) |
| Average data usage (Gigabits) | n.a. | n.a. | 0.0 (0.4) |
| Average upload speed (Mbit/s) | n.a. | n.a. | 0.0 (-3.1)*** |
| Download speed, year before (Mbit/s) | 0.0 (-1.5) | 0.0 (-3.7)*** | n.a. |
| Distance to exchange | 0.1 (6.4)*** | 0.0 (-0.8) | 0.0 (-3.8)*** |
| Index of Multiple Deprivation (LSOA) | -0.3 (-6)*** | -0.1 (-2.0)** | 0.1 (2.6)** |
| Employment (ln) (LSOA) | n.a. | 0.0 (5.1)*** | 0.0 (-1.3) |
| ICT (LSOA) | -0.1 (-5)*** | -0.1 (-4)*** | -0.1 (-4)*** |
| Rurality | 0.8 (26.6)*** | 0.7 (22.2)*** | 0.4 (11.7)*** |
| FScore | 0.2 (2.8)*** | -0.2 (-3)*** | -0.4 (-6)*** |
| Population density (ln, LSOA) | n.a. | n.a. | -0.3 (-37)*** |
| Constant | -3.2 (-46)*** | -1.6 (-17)*** | -0.5 (-5)*** |
| Adjusted R-square | 0.15 | 0.19 | 0.22 |
| Observations | 207180 | 207032 | 206386 |
Selection models for control areas in 2021 - Part 3
| Same exchange OAs | |||
|---|---|---|---|
| Treated in | I | II | III |
| SFBB coverage | n.a. | n.a. | 0.0 (-0.4) |
| Average data usage (Gigabits) | n.a. | n.a. | 0.0 (0.7) |
| Average upload speed (Mbit/s) | n.a. | n.a. | 0.0 (-2.3)** |
| Download speed, year before (Mbit/s) | 0.0 (-4.8)*** | 0.0 (-6.5)*** | n.a. |
| Distance to exchange | 0.1 (7.3)*** | 0.0 (0.7) | 0.0 (-3.1)*** |
| Index of Multiple Deprivation (LSOA) | -0.4 (-7)*** | -0.2 (-3)*** | 0.1 (1.7)* |
| Employment (ln) (LSOA) | n.a. | 0.0 (3.3)*** | 0.0 (-3.6)*** |
| ICT (LSOA) | -0.2 (-6)*** | -0.2 (-5)*** | -0.2 (-5)*** |
| Rurality | 0.9 (26.9)*** | 0.8 (22.2)*** | 0.4 (11.2)*** |
| FScore | 0.3 (5.3)*** | 0.0 (0.2) | -0.2 (-3)*** |
| Population density (ln, LSOA) | n.a. | n.a. | -0.3 (-36)*** |
| Constant | -3.1 (-41)*** | -1.4 (-13)*** | 0.0 (-0.3) |
| Adjusted R-square | 0.17 | 0.21 | 0.25 |
| Observations | 165829 | 165644 | 165106 |
| Source: Belmana |
| Note: Significance levels are 1% (***), 5% (**) and 10% (*). |
2.5 Difference-in-differences outcomes analysis
Once the treated and matched control areas had been identified, the evaluation used a DiD approach to estimate the additional change in broadband performance associated with voucher support.
The DiD method compares how outcomes changed over time in areas that received vouchers with how they changed in otherwise similar areas that did not. By focusing on changes rather than absolute levels, this approach controls for unobserved characteristics that remain constant over time, such as geography, baseline infrastructure, or demographics, and isolates the additional improvement linked to the voucher schemes.
The analysis was conducted separately for each of the four treatment cohorts (2018–2021), using the matched datasets produced through the PSM. For each cohort, broadband performance (as measured by mean download speed) was compared in the year before voucher support and in subsequent years, depending on data availability. The Connected Nations data provided annual measures from 2017 to 2023, allowing outcomes to be tracked for up to three years after treatment.
The DiD analysis was applied to each of the nine model–sample combinations described earlier (three selection models × three control pools). Comparing results across these specifications provided a test of robustness - consistent findings across multiple approaches indicate that the estimated effects are not sensitive to particular modelling choices or dataset definitions.
For each treatment year, the estimated results show how much faster broadband performance improved in treated areas than in their matched comparators. This provides an estimate of the average additional improvement in broadband speeds attributable to voucher support.
It is important to note that the estimated effects represent the average impact on areas that received voucher support, not just on the individual premises that used vouchers. In many treated areas, only a subset of premises were directly connected through vouchers, so the results capture both direct and indirect effects, such as improvements to local broadband networks that benefited nearby properties.
Detailed results for each treatment year and model specification, including estimated effect sizes and significance levels, are provided in the tables below.
DiD analysis for change in average download speeds in OAs receiving vouchers between October 2018 and September 2019 - Part 1
| All OAs | |||
|---|---|---|---|
| I | II | III | |
| Change after one year | |||
| Treated | 12.97 | 12.97 | 12.97 |
| Control | 11.35 | 11.11 | 11.00 |
| Difference | 1.62*** | 1.86*** | 1.97*** |
| Change after two years | |||
| Treated | 30.18 | 30.18 | 30.18 |
| Control | 25.26 | 25.36 | 24.40 |
| Difference | 4.92*** | 4.82*** | 5.79*** |
| Change after three years | |||
| Treated | 56.78 | 56.78 | 56.78 |
| Control | 48.75 | 49.22 | 48.15 |
| Difference | 8.03*** | 7.56*** | 8.63*** |
| All Observations | |||
| Untreated | 211593 | 211469 | 210838 |
| Treated | 3887 | 3887 | 3887 |
DiD analysis for change in average download speeds in OAs receiving vouchers between October 2018 and September 2019 - Part 2
| Excl high Employment OAs | |||
|---|---|---|---|
| I | II | III | |
| Change after one year | |||
| Treated | 13.21 | 13.21 | 13.21 |
| Control | 11.03 | 10.98 | 10.86 |
| Difference | 2.17*** | 2.22*** | 2.35*** |
| Change after two years | |||
| Treated | 29.43 | 29.43 | 29.43 |
| Control | 24.21 | 24.85 | 23.58 |
| Difference | 5.22*** | 4.59*** | 5.85*** |
| Change after three years | |||
| Treated | 56.99 | 56.99 | 56.99 |
| Control | 47.83 | 49.36 | 46.12 |
| Difference | 9.17*** | 7.64*** | 10.88*** |
| All Observations | |||
| Untreated | 209886 | 209763 | 209135 |
| Treated | 3584 | 3584 | 3584 |
DiD analysis for change in average download speeds in OAs receiving vouchers between October 2018 and September 2019 - Part 3
| Same exchange OAs | |||
|---|---|---|---|
| I | II | III | |
| Change after one year | |||
| Treated | 12.74 | 12.74 | 12.74 |
| Control | 11.43 | 11.65 | 11.54 |
| Difference | 1.31** | 1.09** | 1.19** |
| Change after two years | |||
| Treated | 29.44 | 29.44 | 29.44 |
| Control | 24.81 | 25.70 | 25.63 |
| Difference | 4.62*** | 3.74*** | 3.80*** |
| Change after three years | |||
| Treated | 55.22 | 55.22 | 55.22 |
| Control | 48.90 | 49.76 | 49.05 |
| Difference | 6.32*** | 5.46*** | 6.17*** |
| All Observations | |||
| Untreated | 168438 | 168273 | 167743 |
| Treated | 3669 | 3669 | 3669 |
DiD analysis for change in average download speeds in OAs receiving vouchers between October 2019 and September 2020 - Part 1
| All OAs | |||
|---|---|---|---|
| I | II | III | |
| Change after one year | |||
| Treated | 14.98 | 14.98 | 14.98 |
| Control | 12.77 | 13.47 | 12.85 |
| Difference | 2.21*** | 1.52** | 2.13*** |
| Change after two years | |||
| Treated | 46.19 | 46.19 | 46.19 |
| Control | 35.49 | 36.69 | 33.89 |
| Difference | 10.70*** | 9.50*** | 12.30*** |
| Change after three years | |||
| Treated | 78.22 | 78.22 | 78.22 |
| Control | 70.62 | 72.51 | 71.31 |
| Difference | 7.60*** | 5.71*** | 6.91*** |
| All Observations | |||
| Untreated | 208769 | 208627 | 207985 |
| Treated | 2851 | 2851 | 2851 |
DiD analysis for change in average download speeds in OAs receiving vouchers between October 2019 and September 2020 - Part 2
| Excl high Employment OAs | |||
|---|---|---|---|
| I | II | III | |
| Change after one year | |||
| Treated | 14.79 | 14.79 | 14.79 |
| Control | 12.20 | 13.20 | 12.51 |
| Difference | 2.59*** | 1.59** | 2.27*** |
| Change after two years | |||
| Treated | 46.52 | 46.52 | 46.52 |
| Control | 34.10 | 35.54 | 34.35 |
| Difference | 12.43*** | 10.99*** | 12.17*** |
| Change after three years | |||
| Treated | 78.41 | 78.41 | 78.41 |
| Control | 68.32 | 72.04 | 68.86 |
| Difference | 10.08*** | 6.37*** | 9.54*** |
| All Observations | |||
| Untreated | 207167 | 207026 | 206387 |
| Treated | 2752 | 2752 | 2752 |
DiD analysis for change in average download speeds in OAs receiving vouchers between October 2019 and September 2020 - Part 3
| Same exchange OAs | |||
|---|---|---|---|
| I | II | III | |
| Change after one year | |||
| Treated | 14.60 | 14.60 | 14.60 |
| Control | 12.98 | 13.61 | 12.42 |
| Difference | 1.62** | 1.00 | 2.18*** |
| Change after two years | |||
| Treated | 42.94 | 42.94 | 42.94 |
| Control | 36.12 | 37.65 | 35.06 |
| Difference | 6.82*** | 5.29*** | 7.88*** |
| Change after three years | |||
| Treated | 76.10 | 76.10 | 76.10 |
| Control | 73.53 | 73.74 | 70.74 |
| Difference | 2.57 | 2.36 | 5.36*** |
| All Observations | |||
| Untreated | 168438 | 168273 | 167743 |
| Treated | 3669 | 3669 | 3669 |
DiD analysis for change in average download speeds in OAs receiving vouchers between October 2020 and September 2021 - Part 1
| All OAs | |||
|---|---|---|---|
| I | II | III | |
| Change after one year | |||
| Treated | 36.02 | 36.02 | 36.02 |
| Control | 19.63 | 19.62 | 17.87 |
| Difference | 16.39*** | 16.40*** | 18.15*** |
| Change after two years | |||
| Treated | 79.85 | 79.85 | 79.85 |
| Control | 52.77 | 49.34 | 45.94 |
| Difference | 27.07*** | 30.51*** | 33.91*** |
| Change after three years | |||
| Treated | n.a. | n.a. | n.a. |
| Control | n.a. | n.a. | n.a. |
| Difference | n.a. | n.a. | n.a. |
| All Observations | |||
| Untreated | 206901 | 206752 | 206108 |
| Treated | 1853 | 1853 | 1853 |
DiD analysis for change in average download speeds in OAs receiving vouchers between October 2020 and September 2021 - Part 2
| Excl high Employment OAs | |||
|---|---|---|---|
| I | II | III | |
| Change after one year | |||
| Treated | 35.96 | 35.96 | 35.96 |
| Control | 19.12 | 18.35 | 17.49 |
| Difference | 16.84*** | 17.61*** | 18.48*** |
| Change after two years | |||
| Treated | 79.77 | 79.77 | 79.77 |
| Control | 50.24 | 48.79 | 43.83 |
| Difference | 29.53*** | 30.98*** | 35.94*** |
| Change after three years | |||
| Treated | n.a. | n.a. | n.a. |
| Control | n.a. | n.a. | n.a. |
| Difference | n.a. | n.a. | n.a. |
| All Observations | |||
| Untreated | 205296 | 205149 | 204508 |
| Treated | 1851 | 1851 | 1851 |
DiD analysis for change in average download speeds in OAs receiving vouchers between October 2020 and September 2021 - Part 3
| Same exchange OAs | |||
|---|---|---|---|
| I | II | III | |
| Change after one year | |||
| Treated | 37.58 | 37.58 | 37.58 |
| Control | 19.71 | 19.67 | 18.51 |
| Difference | 17.87*** | 17.91*** | 19.07*** |
| Change after two years | |||
| Treated | 82.51 | 82.51 | 82.51 |
| Control | 51.74 | 50.71 | 47.28 |
| Difference | 30.77*** | 31.81*** | 35.23*** |
| Change after three years | |||
| Treated | n.a. | n.a. | n.a. |
| Control | n.a. | n.a. | n.a. |
| Difference | n.a. | n.a. | n.a. |
| All Observations | |||
| Untreated | 164285 | 164101 | 163565 |
| Treated | 1529 | 1529 | 1529 |
2.6 Postcode level analysis
The same overall methodological framework, combining PSM with DiD, was also applied at postcode level to capture more localised effects of voucher support.
The matching approach at postcode level differed slightly from the OA analysis due to data limitations. Full socio-economic data are not available at postcode level, meaning that the range of control variables used in the OA-level matching could not be replicated. Instead, we identified voucher-connected postcodes within the treated OAs and matched them to non-voucher postcodes within the corresponding control areas.
The matching focused on ensuring that treated and control postcodes were comparable in terms of commercial viability for fibre deployment. This was achieved by matching postcodes with similar estimated connection costs, based on the BDUK FScore model, which reflects the relative cost of connecting individual premises to gigabit-capable broadband. This approach should also ensure that matched postcodes are likely to be in locations with broadly similar socio-economic characteristics, since commercial viability is correlated with population density and settlement type.
After matching, the DiD analysis was applied in the same way as for the OA-level models, comparing changes in broadband performance before and after voucher support between the matched treated and control postcodes.
Although the postcode-level analysis relied on a more limited set of matching variables, the results were consistent with those from the OA-level analysis. This provides additional confidence that the estimated improvements in broadband performance are robust and not driven by the choice of geographic level or control variables.
The tables showing the results of DiD analysis for postcodes are provided below.
DiD analysis for change in average download speeds in postcodes receiving vouchers between October 2018 and September 2019 - Part 1
| Treated postcodes and in matched OAs | |||
|---|---|---|---|
| I | II | III | |
| Change after one year (Megabits per second(Mbps)) | |||
| Treated | 26.25 | 26.25 | 26.25 |
| Control | 9.38 | 10.72 | 10.43 |
| Difference | 16.87*** | 15.53*** | 15.82*** |
| Change after two years (Mbps) | |||
| Treated | 54.96 | 54.96 | 54.96 |
| Control | 21.94 | 24.79 | 24.54 |
| Difference | 33.02*** | 13.76*** | 13.95*** |
| Change after three years (Mbps) | |||
| Treated | 96.57 | 96.57 | 96.57 |
| Control | 43.85 | 46.15 | 47.08 |
| Difference | 52.73*** | 17.43*** | 16.99*** |
| All Observations | |||
| Untreated | 18,859 | 18,589 | 18,754 |
| Treated | 2,845 | 2,845 | 2,845 |
DiD analysis for change in average download speeds in postcodes receiving vouchers between October 2018 and September 2019 - Part 2
| Excl high Employment OAs | |||
|---|---|---|---|
| I | II | III | |
| Change after one year (Mbps) | |||
| Treated | 26.25 | 26.25 | 26.25 |
| Control | 10.35 | 11.68 | 10.57 |
| Difference | 15.91*** | 14.58*** | 15.68*** |
| Change after two years (Mbps) | |||
| Treated | 54.96 | 54.96 | 54.96 |
| Control | 23.21 | 26.07 | 23.79 |
| Difference | 14.71*** | 13.07*** | 14.35*** |
| Change after three years (Mbps) | |||
| Treated | 96.57 | 96.57 | 96.57 |
| Control | 46.19 | 48.65 | 44.68 |
| Difference | 17.46*** | 16.41*** | 18.04*** |
| All Observations | |||
| Untreated | 17,224 | 16,923 | 17,546 |
| Treated | 2,845 | 2,845 | 2,845 |
DiD analysis for change in average download speeds in postcodes receiving vouchers between October 2018 and September 2019 - Part 3
| Same exchange OAs | |||
|---|---|---|---|
| I | II | III | |
| Change after one year (Mbps) | |||
| Treated | 26.25 | 26.25 | 26.24 |
| Control | 10.11 | 10.98 | 11.38 |
| Difference | 16.14*** | 15.27*** | 14.86*** |
| Change after two years (Mbps) | |||
| Treated | 54.96 | 54.96 | 54.97 |
| Control | 23.63 | 24.67 | 26.16 |
| Difference | 14.47*** | 13.50*** | 13.02*** |
| Change after three years (Mbps) | |||
| Treated | 96.57 | 96.57 | 96.59 |
| Control | 44.81 | 47.59 | 49.79 |
| Difference | 18.11*** | 16.72*** | 15.94*** |
| All Observations | |||
| Untreated | 17,505 | 17,286 | 17,964 |
| Treated | 2,845 | 2,845 | 2,845 |
DiD analysis for change in average download speeds in postcodes receiving vouchers between October 2019 and September 2020 - Part 1
| Treated postcodes and in matched OAs | |||
|---|---|---|---|
| I | II | III | |
| Change after one year (Mbps) | |||
| Treated | 25.71 | 25.71 | 25.71 |
| Control | 13.30 | 14.17 | 12.83 |
| Difference | 12.41*** | 11.54*** | 12.88*** |
| Change after two years (Mbps) | |||
| Treated | 95.46 | 95.46 | 95.46 |
| Control | 35.33 | 36.60 | 33.94 |
| Difference | 60.14*** | 58.87*** | 61.52*** |
| Change after three years (Mbps) | |||
| Treated | 129.51 | 129.51 | 129.51 |
| Control | 66.19 | 68.58 | 64.85 |
| Difference | 63.32*** | 60.93*** | 64.66*** |
| All Observations | |||
| Untreated | 13,380 | 13,250 | 13,423 |
| Treated | 2,782 | 2,782 | 2,782 |
DiD analysis for change in average download speeds in postcodes receiving vouchers between October 2019 and September 2020 - Part 2
| Excl high Employment OAs | |||
|---|---|---|---|
| I | II | III | |
| Change after one year (Mbps) | |||
| Treated | 25.48 | 25.69 | 25.71 |
| Control | 13.01 | 13.10 | 12.47 |
| Difference | 12.47*** | 12.59*** | 13.24*** |
| Change after two years (Mbps) | |||
| Treated | 95.19 | 95.47 | 95.46 |
| Control | 34.64 | 35.82 | 33.47 |
| Difference | 60.55*** | 59.65*** | 61.99*** |
| Change after three years (Mbps) | |||
| Treated | 129.23 | 129.52 | 129.51 |
| Control | 68.23 | 68.15 | 70.12 |
| Difference | 61.00*** | 61.37*** | 59.39*** |
| All Observations | |||
| Untreated | 12,984 | 12,854 | 13,139 |
| Treated | 2,782 | 2,782 | 2,782 |
DiD analysis for change in average download speeds in postcodes receiving vouchers between October 2019 and September 2020 - Part 3
| Same exchange OAs | |||
|---|---|---|---|
| I | II | III | |
| Change after one year (Mbps) | |||
| Treated | 25.71 | 25.71 | 25.71 |
| Control | 14.61 | 12.23 | 12.59 |
| Difference | 11.09*** | 13.47*** | 13.12*** |
| Change after two years (Mbps) | |||
| Treated | 95.46 | 95.46 | 95.46 |
| Control | 37.57 | 34.52 | 34.02 |
| Difference | 57.89*** | 60.94*** | 61.44*** |
| Change after three years (Mbps) | |||
| Treated | 129.51 | 129.51 | 129.51 |
| Control | 75.78 | 73.29 | 66.04 |
| Difference | 53.73*** | 56.22*** | 63.47*** |
| All Observations | |||
| Untreated | 12,189 | 12,064 | 12,575 |
| Treated | 2,782 | 2,782 | 2,782 |
DiD analysis for change in average download speeds in postcodes receiving vouchers between October 2020 and September 2021 - Part 1
| Treated postcodes and in matched OAs | |||
|---|---|---|---|
| I | II | III | |
| Change after one year (Mbps) | |||
| Treated | 75.07 | 75.07 | 75.07 |
| Control | 17.99 | 16.72 | 16.19 |
| Difference | 57.08*** | 58.35*** | 58.87*** |
| Change after two years (Mbps) | |||
| Treated | 140.69 | 140.69 | 140.69 |
| Control | 43.44 | 41.49 | 40.55 |
| Difference | 97.26*** | 99.20*** | 100.14*** |
| All Observations | |||
| Untreated | 9,210 | 8,996 | 9,475 |
| Treated | 4,485 | 4,485 | 4,485 |
DiD analysis for change in average download speeds in postcodes receiving vouchers between October 2020 and September 2021 - Part 2
| Excl high Employment OAs | |||
|---|---|---|---|
| I | II | III | |
| Change after one year (Mbps) | |||
| Treated | 75.07 | 75.07 | 75.07 |
| Control | 16.68 | 16.36 | 15.21 |
| Difference | 58.39*** | 58.71*** | 59.86*** |
| Change after two years (Mbps) | |||
| Treated | 140.69 | 140.69 | 140.69 |
| Control | 42.50 | 43.52 | 37.73 |
| Difference | 98.19*** | 97.17*** | 102.96*** |
| All Observations | |||
| Untreated | 9,255 | 9,026 | 9,254 |
| Treated | 4,485 | 4,485 | 4,485 |
DiD analysis for change in average download speeds in postcodes receiving vouchers between October 2020 and September 2021 - Part 3
| Same exchange OAs | |||
|---|---|---|---|
| I | II | III | |
| Change after one year (Mbps) | |||
| Treated | 75.07 | 75.07 | 75.07 |
| Control | 18.40 | 16.89 | 15.39 |
| Difference | 56.67*** | 58.18*** | 59.68*** |
| Change after two years (Mbps) | |||
| Treated | 140.69 | 140.69 | 140.69 |
| Control | 44.64 | 49.42 | 46.68 |
| Difference | 96.05*** | 91.27*** | 94.01*** |
| All Observations | |||
| Untreated | 7,593 | 7,526 | 7,801 |
| Treated | 4,485 | 4,485 | 4,485 |
3. Appendix C: Technical Annex for Firm-level Analysis
3.1 Purpose and Overview
This annex describes the approach used to assess the impacts of voucher-supported broadband connections on businesses. This examined how faster, more reliable connections affected key indicators of business performance.
The same overall methodological framework was applied, combining PSM with DiD. This allowed the analysis to compare how business outcomes changed over time for firms that received voucher-supported connections with changes observed among similar firms that did not.
The analysis focused on three core outcome variables that provide a rounded assessment of business performance:
-
Turnover
-
Employment
-
Turnover per employee (by dividing turnover by employment)
3.2 Datasets used
The analysis of business-level impacts drew primarily on administrative data from the ONS Business Structure Database (BSD), supported by information from BDUK’s voucher database and a small number of other datasets used to provide contextual information and additional matching variables.
The BSD is a comprehensive annual dataset that records key information on all UK businesses registered for VAT and/or PAYE(Pay As You Earn). It provides consistent measures of employment, turnover, and firm characteristics such as age, industry, and legal status. Because it is drawn from the Inter-Departmental Business Register, the BSD covers virtually all active UK enterprises, including small and medium-sized firms that are most likely to have benefited from voucher-supported broadband.
For this evaluation, data were accessed through the ONS Secure Research Service. Annual BSD snapshots for the financial years up to 2023/24 were linked to construct a longitudinal dataset, enabling the analysis to track business performance over time. This provided at least three years of outcome data for each treatment cohort, and a longer post-treatment period for firms that received vouchers in earlier years.
In addition to the BSD, the analysis made use of the following datasets which have all been described in detail in Appendix 2:
-
BDUK’s voucher database, which contains administrative records for all connections supported through the GBVS and RGC schemes;
-
BDUK’s F20 model, which estimates the relative cost and commercial viability of connecting individual premises to gigabit-capable broadband;
-
The ONS Urban–Rural Classification, used to identify whether businesses are located in urban or rural areas; and
-
Local-level broadband indicators from Ofcom’s Connected Nations data, providing measures such as average download speed.
3.3 Identifying treated businesses
Businesses that received voucher support were identified by linking the BDUK voucher database to the ONS BSD using company identifiers and address information. This linkage allowed each voucher recipient to be matched to its corresponding business record within the BSD, ensuring that consistent data on turnover and employment could be tracked over time.
The treatment date for each business was based on the voucher issue date, which provides the best available estimate of when the connection would have been completed. Because the BSD is organised by financial year (April to March), each business was assigned to an annual treatment cohort corresponding to the financial year in which its voucher was issued.
In total, 16,508 voucher-supported businesses were successfully identified in the BSD (out of 25,349 business vouchers), distributed across three treatment cohorts:
-
7,542 businesses issued vouchers in 2018/19;
-
7,197 businesses in 2019/20; and
-
1,769 businesses in 2020/21.
3.4 Developing a counterfactual
Selection models
The matching process used a rich set of variables describing each business and its operating environment. Three different models were developed using different variables.
All models have the following variables:
-
Local units: the number of sites for the business
-
Employment categories: micro (fewer than ten employees), small (10 to 49), medium (50 to 249), large (250 and above)
-
Turnover categories: micro (≤ £632,000), small (≤ £10.2 million), medium (≤ £36 million), large (> £36 million)
-
F score
-
Age
-
Broad industry
-
Year of support
-
Tracked in Beauhurst: this indicates whether a business is recorded in the Beauhurst database, meaning it has been identified as a high-growth, innovative, or investment-seeking company based on factors such as equity investment, scale-up activity, or use of growth finance.
-
Furlough recipient
-
High technology knowledge intensive services
-
Innovate UK beneficiary
-
Patent owner
-
Scale-up
Model 1 includes the following additional variables:
-
Hirfindhal-Index (above ave in sector): indicates how concentrated a business’s sector is, with values above the sector average suggesting the firm operates in a less competitive market dominated by fewer suppliers
-
High tech industry
-
ICT industry
-
Median download speed (OA)
-
Whether the businesses is in London/SE England
-
New business
Model 2 additionally includes:
-
Lagged log employment change
-
Hirfindhal-Index (above ave)
-
Hirfindhal-Index logged*;
-
Hi technology manufacturing;
-
Whether the businesses is in London/SE England
-
Whether businesses in in a low paying sector (an industry where average wages are below the national median)
Model 3 additionally includes:
-
Lagged log employment change
-
High tech industry
-
ICT industry
-
Median download speed (OA)
-
Low paying sector
The selection models were then applied to three separate pools of unsupported businesses to construct control groups:
-
Wider business population: all businesses in England and Wales not supported through the voucher schemes, providing the largest pool for matching.
-
Businesses in the same exchange areas as supported firms: allowing comparisons within a shared broadband infrastructure and local operating environment.
-
Businesses that later received a UKGV Voucher: this pool was newly added for this evaluation. Because these firms subsequently benefited from the successor scheme, their pre-upgrade performance provides a useful benchmark for earlier recipients and helps account for unobserved factors influencing application and take-up.
In total, nine models were estimated, combining different sets of matching variables with the three business sample pools.
All combinations of models and sample pools were tested to assess which provided the closest match to supported businesses, focusing in particular on balance across observed characteristics and similarity in pre-support trends. On this basis, Model 1 combined with the sample pool of future UKGV beneficiaries was selected as the preferred specification, as it provided the strongest alignment with treated businesses prior to receiving support. Results are also compared with the median estimate across all model specifications to test the robustness of the findings.
Matching procedure
Matching was achieved through PSM using the estimated probabilities (propensity scores) from the Probit selection models described above.
Under this approach:
-
Each treated business was assigned a propensity score, representing its estimated likelihood of receiving voucher support.
-
Treated businesses were then matched to an untreated businesses with similar propensity scores using a nearest-neighbour matching algorithm.
-
Matching was conducted with replacement for models based on the future voucher recipient and cancelled voucher applicant pools. This was necessary because the number of businesses in these pools was smaller than the number of treated businesses, meaning that some control businesses had to be used as matches for more than one treated business.
3.5 Robustness checks
A series of robustness checks were undertaken to test whether the matching procedure produced a credible counterfactual and whether the assumptions underpinning the DiD analysis were satisfied.
1. Similarity between treated and matched control businesses
The first test examined whether the matched control businesses closely resembled those that received vouchers. This was done by comparing the distributions of key business characteristics across the treated group and the matched control groups. As shown in the chart below, after matching, businesses in the preferred control group (red bars) and the median control group across all models (gold bars) were much more similar to the treated businesses (dark blue bars) than to the wider business population (blue-green bars). This demonstrates that the matching substantially reduced differences between supported and comparison firms, creating a more credible counterfactual.
Characteristics of voucher beneficiaries and comparators
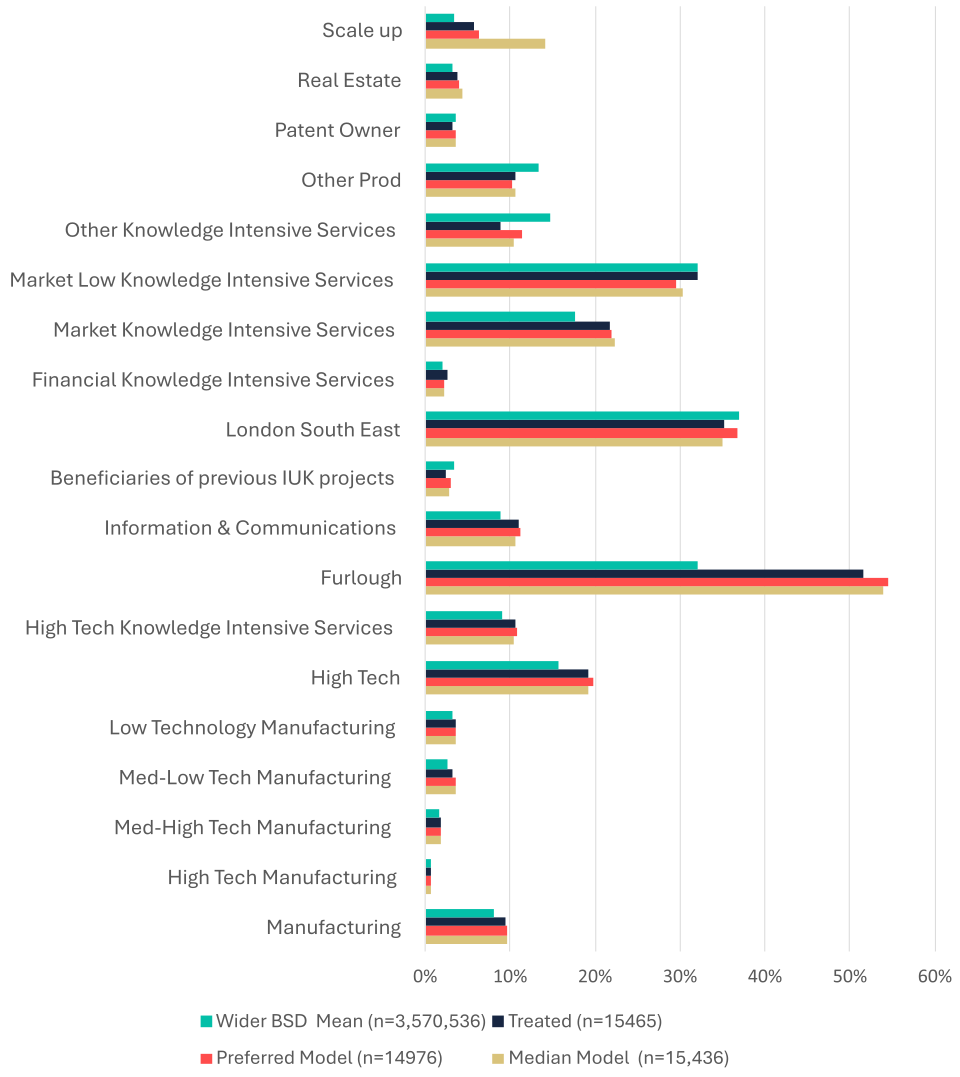
2. Coverage of the matched sample
The second test assessed whether the range of supported businesses was adequately represented in the matched sample. In some cases, matching models can fail to find suitable comparators for firms with particularly unusual characteristics. To test this, we compared the distributions of propensity scores for treated and control businesses and identified any outliers without matches. This occurred only in one of the models using the cancelled-voucher applicant pool, where a small number of treated firms had no close comparator. In all other cases, the matched samples provided full coverage of the treated businesses.
3. Pre-treatment trends in outcomes
A crucial test for any DiD analysis is whether treated and control groups followed similar trajectories before the intervention. If the two groups were already on diverging paths before support was introduced, any post-treatment differences could reflect pre-existing trends rather than programme impacts.
Pre-treatment trends were analysed for employment and turnover across all control groups. The table below highlights the year-on-year percentage growth for treated businesses, the preferred control group, and the median across all 11 models, as well as the DiD in growth rates. This shows that it is challenging to find a control group that mirrors supported firms on both outcomes, but the preferred control group, based on future UKGV voucher recipients and the preferred set of matching variables, provided the closest match. Supported businesses recorded slightly higher employment growth than the preferred control group in the years before receiving a voucher, but these differences were small and not statistically significant at the 5% level in any of the three years prior to support. Statistical significance at the 10% level is generally acceptable for establishing comparability in evaluation research.
Change in employment and turnover before businesses received a voucher
| Employment | Treated | Preferred Control Group | Median Control Group of 11 | ||
|---|---|---|---|---|---|
| Growth | DiD | Growth | DiD | ||
| Yr before support | 8.3% | 7.1% | 1.2%* | 0.2% | 8.1%*** |
| 2 yrs before | 7.6% | 6.1% | 1.5%* | 1.0% | 6.8%*** |
| 3 yrs before | 6.3% | 4.5% | 1.8% | 3.8% | 2.5%* |
| Real Turnover | Treated | Preferred Control Group | Median Control Group of 11 | ||
|---|---|---|---|---|---|
| Growth | DiD | Growth | DiD | ||
| Yr before support | 7.1% | 7.8% | -0.7% | 8.2% | -1.1%* |
| 2 yrs before | 6.3% | 4.6% | 1.8% | 4.4% | 1.9% |
| 3 yrs before | 4.6% | 5.3% | -0.7% | 4.8% | -0.2% |
| Source: Belmana |
| Note: Significance levels are 1% (***), 5% (**) and 10% (*). |
3.6 Difference-in-differences results
The DiD analysis was used to estimate the additional change in business outcomes associated with voucher support, after accounting for wider economic trends. The approach compared how outcomes changed over time for businesses that received vouchers with how they changed for otherwise similar firms in the matched control groups. Separate analyses were undertaken for turnover, employment, and turnover per employee (used as a measure of productivity). The tables showing the results for all models are shown below.
Across all model and sample pool combinations, the DiD analysis generated a wide range of estimates, reflecting the sensitivity of results to the choice of comparator group. For turnover, there was strong alignment between models using the wider business population, future voucher beneficiaries, and businesses located in the same exchange areas. All of these models found statistically significant positive effects, suggesting that businesses which received voucher-supported connections experienced faster turnover growth than comparable unsupported firms.
The models using cancelled standard voucher applicants, however, produced less consistent findings. In some years there were no statistically significant effects, while in others the estimated impacts were negative. These results should be interpreted with caution, as this pool contained relatively few businesses, which made it more difficult to identify suitable matches. Furthermore, the reasons for voucher cancellation are not known. It is plausible that many of these firms withdrew because they found alternative means of upgrading their broadband; options unlikely to have been available to all businesses, particularly those in rural areas.
For employment, results were more variable. The models using the wider business population and those using future voucher beneficiaries produced broadly consistent results, with statistically significant positive effects in most years. The effects were larger for models that used future voucher beneficiaries as the control group. By contrast, models based on businesses from the same exchange areas found no statistically significant effects, and those using cancelled voucher applicants again produced mixed and occasionally negative results.
Taken together, these findings indicate that the estimated impacts of vouchers on turnover are clearer and more robust than those on employment. Most models point to a positive relationship between voucher support and business performance, but the variation across control groups highlights the importance of comparator choice and suggests that the employment effects are more uncertain than those observed for turnover.
Business level impacts on employment by across all supported businesses - Part 1
| All BSD | |||
|---|---|---|---|
| I | II | III | |
| Change in logged employment after support, year 1 | |||
| Treated | 7.4% | 7.4% | 7.4% |
| Control | 6.3% | 5.1% | 5.0% |
| Difference | 1.2%** | 2.3%* | 2.5%** |
| Change in logged employment after support, year 2 | |||
| Treated | 11.4% | 11.4% | 11.4% |
| Control | 9.1% | 7.7% | 7.8% |
| Difference | 2.3%*** | 3.8%** | 3.6%** |
| Change in logged employment after support, year 3 | |||
| Treated | 12.2% | 12.2% | 12.2% |
| Control | 9.6% | 8.5% | 9.5% |
| Difference | 2.6%*** | 3.7% | 2.7% |
| All observations | |||
| Treated | 15,465 | 15,031 | 14,277 |
| Untreated | 631,184 | 584,969 | 569,682 |
| Note: To aid comparability, the models have been centred for the treatment values to Model I, All BSD. There was some variation across models in the growth of the treated as some observations could not be matched in different models and this allows the DiD estimate to be accurate. Significance levels are 1% (***), 5% (**) and 10% (*); T-statistics in parenthesis using robust standard errors; estimates have been estimated using log growth and DiD estimates are from growth in percentage terms. |
Business level impacts on employment by across all supported businesses - Part 2
| Later Supported | |||
|---|---|---|---|
| I | II | III | |
| Change in logged employment after support, year 1 | |||
| Treated | 7.4% | 7.4% | 7.4% |
| Control | 2.4% | 1.6% | 3.0% |
| Difference | 5.0%*** | 5.8%*** | 4.4%*** |
| Change in logged employment after support, year 2 | |||
| Treated | 11.4% | 11.4% | 11.4% |
| Control | 2.1% | 3.5% | 3.4% |
| Difference | 9.3%*** | 7.9%*** | 8.0%*** |
| Change in logged employment after support, year 3 | |||
| Treated | 12.2% | 12.2% | 12.2% |
| Control | 4.8% | 5.3% | 5.5% |
| Difference | 7.4%*** | 6.9%*** | 6.7%*** |
| All observations | |||
| Treated | 15,044 | 15,028 | 14,277 |
| Untreated | 6,833 | 6,601 | 6,515 |
| Note: To aid comparability, the models have been centred for the treatment values to Model I, All BSD. There was some variation across models in the growth of the treated as some observations could not be matched in different models and this allows the DiD estimate to be accurate. Significance levels are 1% (***), 5% (**) and 10% (*); T-statistics in parenthesis using robust standard errors; estimates have been estimated using log growth and DiD estimates are from growth in percentage terms. |
Business level impacts on employment by across all supported businesses - Part 3
| Same exchange as supported | |||
|---|---|---|---|
| I | II | III | |
| Change in logged employment after support, year 1 | |||
| Treated | 7.4% | 7.4% | 7.4% |
| Control | 6.9% | 6.7% | 5.7% |
| Difference | 0.5% | 0.7% | 1.7% |
| Change in logged employment after support, year 2 | |||
| Treated | 11.4% | 11.4% | 11.4% |
| Control | 11.0% | 9.5% | 9.6% |
| Difference | 0.4% | 1.9% | 1.8% |
| Change in logged employment after support, year 3 | |||
| Treated | 12.2% | 12.2% | 12.2% |
| Control | 12.4% | 10.9% | 10.4% |
| Difference | -0.2% | 1.3% | 1.7% |
| All observations | |||
| Treated | 15,465 | 15,031 | 14,277 |
| Untreated | 133,349 | 125,790 | 122,018 |
| Note: To aid comparability, the models have been centred for the treatment values to Model I, All BSD. There was some variation across models in the growth of the treated as some observations could not be matched in different models and this allows the DiD estimate to be accurate. Significance levels are 1% (***), 5% (**) and 10% (*); T-statistics in parenthesis using robust standard errors; estimates have been estimated using log growth and DiD estimates are from growth in percentage terms. |
Business level impacts on real turnover by across all supported businesses - Part 1
| All BSD | |||
|---|---|---|---|
| I | II | III | |
| Change in logged real turnover after support, year 1 | |||
| Treated | 6.2% | 6.2% | 6.2% |
| Control | -2.0% | 0.0% | -0.9% |
| Difference | 8.3%*** | 6.3%*** | 7.2%*** |
| Change in logged real turnover after support, year 2 | |||
| Treated | 9.3% | 9.3% | 9.3% |
| Control | -6.7% | -3.4% | -4.0% |
| Difference | 15.9%*** | 12.7%*** | 13.2%*** |
| Change in logged real turnover after support, year 3 | |||
| Treated | 4.1% | 4.1% | 4.1% |
| Control | -12.1% | -10.6% | -9.9% |
| Difference | 16.3%*** | 14.8%*** | 14.0%*** |
| All observations | |||
| Treated | 15,465 | 15,031 | 14,277 |
| Untreated | 631,184 | 584,969 | 569,682 |
| Note: To aid comparability, the models have been centred for the treatment values to Model I, All BSD. There was some variation across models in the growth of the treated as some observations could not be matched in different models and this allows the DiD estimate to be accurate. Significance levels are 1% (***), 5% (**) and 10% (*); T-statistics in parenthesis using robust standard errors; estimates have been estimated using log growth and DiD estimates are from growth in percentage terms. |
Business level impacts on real turnover by across all supported businesses - Part 2
| Later Supported | |||
|---|---|---|---|
| I | II | III | |
| Change in logged real turnover after support, year 1 | |||
| Treated | 6.2% | 6.2% | 6.2% |
| Control | 0.5% | -1.2% | -1.3% |
| Difference | 5.7%*** | 7.4%*** | 7.5%*** |
| Change in logged real turnover after support, year 2 | |||
| Treated | 9.3% | 9.3% | 9.3% |
| Control | -4.1% | -6.3% | -4.2% |
| Difference | 13.3%*** | 15.6%*** | 13.4%*** |
| Change in logged real turnover after support, year 3 | |||
| Treated | 4.1% | 4.1% | 4.1% |
| Control | -12.7% | -12.3% | -12.9% |
| Difference | 16.8%*** | 16.5%*** | 17.0%*** |
| All observations | |||
| Treated | 15,044 | 15,028 | 14,277 |
| Untreated | 6,833 | 6,601 | 6,515 |
| Note: To aid comparability, the models have been centred for the treatment values to Model I, All BSD. There was some variation across models in the growth of the treated as some observations could not be matched in different models and this allows the DiD estimate to be accurate. Significance levels are 1% (***), 5% (**) and 10% (*); T-statistics in parenthesis using robust standard errors; estimates have been estimated using log growth and DiD estimates are from growth in percentage terms. |
Business level impacts on real turnover by across all supported businesses - Part 3
| Same exchange as supported | |||
|---|---|---|---|
| I | II | III | |
| Change in logged real turnover after support, year 1 | |||
| Treated | 6.2% | 6.2% | 6.2% |
| Control | 0.3% | 2.3% | 0.8% |
| Difference | 5.9%*** | 3.9%*** | 5.4%*** |
| Change in logged real turnover after support, year 2 | |||
| Treated | 9.3% | 9.3% | 9.3% |
| Control | -1.1% | 1.0% | 0.2% |
| Difference | 10.3%*** | 8.3%*** | 9.1%*** |
| Change in logged real turnover after support, year 3 | |||
| Treated | 4.1% | 4.1% | 4.1% |
| Control | -5.9% | -4.2% | -7.1% |
| Difference | 10.1%*** | 8.4%*** | 11.2%*** |
| All observations | |||
| Treated | 15,465 | 15,031 | 14,277 |
| Untreated | 133,349 | 125,790 | 122,018 |
| Note: To aid comparability, the models have been centred for the treatment values to Model I, All BSD. There was some variation across models in the growth of the treated as some observations could not be matched in different models and this allows the DiD estimate to be accurate. Significance levels are 1% (***), 5% (**) and 10% (*); T-statistics in parenthesis using robust standard errors; estimates have been estimated using log growth and DiD estimates are from growth in percentage terms. |
Business level impacts on real turnover per employee across all supported businesses - Part 1
| All BSD | |||
|---|---|---|---|
| I | II | III | |
| Change in real turnover per employee after support, year 1 | |||
| Treated | -1.1% | -1.1% | -1.1% |
| Control | -7.8% | -5.0% | -5.6% |
| Difference | 6.7%*** | 3.8%*** | 4.5%*** |
| Change in real turnover per employee after support, year 2 | |||
| Treated | -2.0% | -2.0% | -2.0% |
| Control | -14.4% | -10.3% | -11.0% |
| Difference | 12.5%*** | 8.3%*** | 9.0%*** |
| Change in real turnover per employee after support, year 3 | |||
| Treated | -7.1% | -7.1% | -7.1% |
| Control | -19.8% | -17.6% | -17.7% |
| Difference | 12.7%*** | 10.5%*** | 10.6%*** |
| All observations | |||
| Treated | 15,465 | 15,031 | 14,277 |
| Untreated | 631,184 | 584,969 | 569,682 |
| Note: To aid comparability, the models have been centred for the treatment values to Model I, All BSD. There was some variation across models in the growth of the treated as some observations could not be matched in different models and this allows the DiD estimate to be accurate. Significance levels are 1% (***), 5% (**) and 10% (*); T-statistics in parenthesis using robust standard errors; estimates have been estimated using log growth and DiD estimates are from growth in percentage terms. |
Business level impacts on real turnover per employee across all supported businesses - Part 2
| Later Supported | |||
|---|---|---|---|
| I | II | III | |
| Change in real turnover per employee after support, year 1 | |||
| Treated | -1.1% | -1.1% | -1.1% |
| Control | -1.9% | -2.7% | -4.1% |
| Difference | 0.7%* | 1.6%*** | 3.0%*** |
| Change in real turnover per employee after support, year 2 | |||
| Treated | -2.0% | -2.0% | -2.0% |
| Control | -6.1% | -9.5% | -7.3% |
| Difference | 4.1%*** | 7.5%*** | 5.3%*** |
| Change in real turnover per employee after support, year 3 | |||
| Treated | -7.1% | -7.1% | -7.1% |
| Control | -16.7% | -16.7% | -17.4% |
| Difference | 9.6%*** | 9.6%*** | 10.3%*** |
| All observations | |||
| Treated | 15,044 | 15,028 | 14,277 |
| Untreated | 6,833 | 6,601 | 6,515 |
| Note: To aid comparability, the models have been centred for the treatment values to Model I, All BSD. There was some variation across models in the growth of the treated as some observations could not be matched in different models and this allows the DiD estimate to be accurate. Significance levels are 1% (***), 5% (**) and 10% (*); T-statistics in parenthesis using robust standard errors; estimates have been estimated using log growth and DiD estimates are from growth in percentage terms. |
Business level impacts on real turnover per employee across all supported businesses - Part 3
| Same exchange as supported | |||
|---|---|---|---|
| I | II | III | |
| Change in real turnover per employee after support, year 1 | |||
| Treated | -1.1% | -1.1% | -1.1% |
| Control | -6.1% | -4.1% | -4.6% |
| Difference | 5.0%*** | 3.0%*** | 3.5%*** |
| Change in real turnover per employee after support, year 2 | |||
| Treated | -2.0% | -2.0% | -2.0% |
| Control | -10.9% | -7.8% | -8.6% |
| Difference | 8.9%*** | 5.8%*** | 6.7%*** |
| Change in real turnover per employee after support, year 3 | |||
| Treated | -7.1% | -7.1% | -7.1% |
| Control | -16.3% | -13.7% | -15.9% |
| Difference | 9.1%*** | 6.5%*** | 8.8%*** |
| All observations | |||
| Treated | 15,465 | 15,031 | 14,277 |
| Untreated | 133,349 | 125,790 | 122,018 |
| Note: To aid comparability, the models have been centred for the treatment values to Model I, All BSD. There was some variation across models in the growth of the treated as some observations could not be matched in different models and this allows the DiD estimate to be accurate. Significance levels are 1% (***), 5% (**) and 10% (*); T-statistics in parenthesis using robust standard errors; estimates have been estimated using log growth and DiD estimates are from growth in percentage terms. |
4. Appendix D: Technical Annex for Area Level Economic Analysis
4.1 Overview
This strand of the analysis examines economic outcomes at the local area level, rather than for individual firms. It looks at how the combined performance of all businesses changed in OAs where at least one business received a voucher. The approach is consistent with other econometric analysis used in the evaluation and combines statistical matching with DiD methods to assess whether voucher support was associated with changes in local employment and turnover.
The analysis draws primarily on the BSD at local unit level. Local units are individual business locations such as shops, offices, depots or plants, and the dataset records annual employment at each location. This allows jobs to be assigned to specific places, including within multi-site businesses. The BSD is accessed through the ONS Secure Research Service.
Using the BSD, we constructed a panel dataset covering 222,062 OAs, with annual information on employment and estimated real turnover. The dataset also enables us to track business births and relocations within each OA over time.
This area-level dataset was linked to voucher data by identifying the OAs in which voucher-supported businesses were located. In total, 8,648 OAs were classified as treated, meaning they contained at least one business that received a voucher. The year of treatment was defined as the year in which the first voucher-supported connection took place in each area.
For each treated OA, a comparison area was selected using PSM. This involves estimating the likelihood that an area would receive voucher support based on observed characteristics, and then matching each treated area to the untreated area with the most similar likelihood of treatment. Because the results can depend on how the selection model is specified, multiple model specifications were tested. A preferred model was chosen based on the quality of matching, similarity in pre-treatment trends, and balance between treated and comparison areas.
4.2 Datasets used
Business Structure Database (BSD)
The analysis uses the BSD, which provides annual administrative data on UK businesses. The BSD distinguishes between enterprises (the business as a whole) and local units, which are individual business locations such as shops, offices, factories, warehouses or depots. An enterprise may operate from one or multiple local units in different locations.
The BSD was accessed at local unit level to support analysis at a detailed geographic scale. Local unit data record employment and location over time, allowing jobs to be assigned to specific OAs and enabling analysis of how employment changes spatially. Turnover is available only at enterprise level in the BSD. To support area-based analysis, enterprise-level turnover was apportioned to local units using employment-based ratios. While this allows turnover to be estimated at OA level, it introduces some measurement uncertainty, particularly where enterprises operate both headquarters and operational sites.
Annual BSD snapshots were linked over time to create a panel dataset covering up to financial year 2023/24, the most recent year available. This panel supports analysis of changes in employment, estimated turnover, new business creation and business relocations within OAs. In total, the dataset covers 222,062 OAs across the UK.
Voucher data
Information on voucher take-up was linked to the BSD by matching businesses that received BDUK business vouchers to the BSD using Companies House Registration Numbers. This allowed the locations of voucher-supported businesses to be identified and assigned to OAs. Using this approach, 8,648 OAs were identified as having received at least one business voucher.
Supporting datasets
Several additional datasets were linked to the OA panel to support analysis and matching:
-
BDUK F-score model, used as a proxy for the relative cost and commercial viability of broadband deployment;
-
Connected Nations data, providing information on average download speeds, number of connections and gigabit availability;
-
Demographic data, including population density and income deprivation deciles.
Together, these datasets provide a consistent evidence base for analysing how economic outcomes changed in areas where business vouchers were used, compared with similar areas that did not receive support.
4.3 Selection models
A wide range of variables was considered when constructing the selection models used for matching. These variables describe business size and structure (employment, turnover, number of local units), past growth and dynamism (new and relocated local units, previous employment and turnover growth), local conditions (population density, broadband download speeds, and estimated build costs from the F20 model), and broader economic context. Together, these variables capture both the characteristics of businesses and the environments in which they operate.
Rather than relying on a single specification, we tested several alternative combinations of variables. This reflects the fact that there is no single “correct” selection model. Including too many variables can make it harder to find good matches, while including too few risks omitting important differences between supported and unsupported areas. The aim was therefore to identify parsimonious models that capture the main drivers of voucher take-up while still producing well-balanced and comparable control groups.
The selection models are estimated using a probit model, which is a standard statistical approach for modelling the probability that an area receives voucher support based on its observed characteristics. The estimated probabilities (propensity scores) are then used to match treated areas to similar untreated areas.
The table below sets out the variables included in each model specification. Comparing results across these different specifications allows us to test the robustness of the findings and assess whether results are sensitive to the choice of variables used in the matching process.
| Variables | Model 1 | Model 2 | Model 3 | Model 4 | Model 5 |
|---|---|---|---|---|---|
| Log employment | X | X | X | X | X |
| Log real turnover | X | X | X | X | X |
| Log number of local units | X | X | X | X | X |
| Number of new local units | X | X | X | ||
| Number of relocated local units | X | X | X | ||
| Log population density | X | ||||
| Median download speed (Mbps) | X | X | X | X | X |
| F score | X | X | X | X | X |
| Previous employment growth | X | X | |||
| Previous real turnover growth | X | ||||
| Previous number of local units growth | X |
| Source: Belmana |
We tested different selection model specifications using a range of sample pools for untreated OAs. This included restricting matches to geographically proximate areas e.g. to untreated OAs within the same Middle Super Output Area as the treated area or the same local authority. These restrictions were intended to control for unobserved local factors such as economic conditions, infrastructure, and planning environments. In practice, however, applying these geographic restrictions substantially reduced the pool of potential comparison areas, making it difficult to identify suitably matched controls. As a result, the main analysis uses an unrestricted pool of untreated OAs, which provided more reliable matches.
4.4 Model selection and robustness checks
We compared different selection model specifications based on how well they matched treated OAs to suitable comparison areas. A good match is one where the comparison group closely resembles the treated group both in observable characteristics (such as employment, turnover and broadband conditions) and in pre-treatment growth trends. Matching on past trends is particularly important, as it helps ensure that any differences observed after treatment are more likely to reflect the effects of vouchers rather than pre-existing differences.
To test the robustness of the results, we selected both a preferred model and an alternative model. This allows us to assess whether the estimated impacts are sensitive to the choice of matching specification.
The table below compares the average values of key variables for treated OAs and for the comparison groups generated by each model specification. Overall, the results show that propensity score matching was effective in identifying comparison areas that are broadly similar to treated OAs across most dimensions.
However, performance varies by model. Some specifications achieve closer alignment on certain variables than others, reflecting differences in which variables are included in the selection model and how much weight they receive in determining the propensity score.
Model 1 is selected as the preferred specification because it provides a close match across most variables, including employment, turnover, broadband conditions and population density. Crucially, it also achieves good alignment with treated OAs on pre-treatment trends, particularly employment and the number of local units.
Model 2 is retained as an alternative specification. While it matches well on many observable characteristics, it performs less well in terms of aligning past growth trends, with higher pre-treatment employment and turnover growth in the comparison group than in treated OAs. This makes it a useful sensitivity check but less suitable as the main model for estimating impacts.
Summary statistics for treated and comparison groups for different model specifications
| Variables | Treated | Model 1 (Preferred) | Model 2 (Alternative) | Model 3 | Model 4 | Model 5 |
|---|---|---|---|---|---|---|
| Log employment | 5.78 | 5.44 | 5.83 | 5.43 | 5.45 | 5.46 |
| Log real turnover | 10.31 | 9.92 | 10.37 | 9.90 | 9.93 | 9.93 |
| Log number of local units | 3.84 | 3.59 | 3.88 | 3.59 | 3.61 | 3.60 |
| Number of new local units | 9.36 | 4.78 | 7.05 | 5.73 | 5.47 | 5.01 |
| Number of relocated local units | 6.97 | 3.44 | 5.26 | 4.20 | 3.85 | 3.00 |
| Log population density | 7.11 | 6.98 | 6.99 | 6.99 | 6.97 | 6.96 |
| Median download speed (Mbps) | 33.79 | 33.46 | 33.53 | 33.32 | 33.54 | 33.41 |
| F score | 0.55 | 0.56 | 0.55 | 0.56 | 0.56 | 0.56 |
| Previous employment growth | 3.2% | 3.1% | 7.5% | 3.5% | 2.8% | 2.8% |
| Previous real turnover growth | 5.4% | 7.2% | 10.8% | 6.5% | 6.6% | 6.3% |
| Previous number of local units growth | 3.1% | 3.1% | 6.3% | 2.8% | 3.1% | 2.2% |
5. Appendix E: Method for Estimating Earnings Premium Impacts
To move from the analysis of wage premiums to a quantified estimate of the overall earnings benefits, we followed a series of steps. The aim was to calculate the additional income earned by workers as a result of the new jobs created in voucher-supported businesses.
We began by establishing the baseline employment in businesses that received a voucher. Analysis of BSD data shows that these businesses employed an average of 22 people each in 2018. Using this figure alongside BDUK data of how many businesses received a voucher in each year from 2017/18 to 2020/21, we estimated total baseline employment in each year.
Next, we applied the findings of the DiD analysis, which identified the additional effect of vouchers on employment growth. This allowed us to estimate the number of jobs created that could be directly attributed to vouchers for each cohort of businesses, and how these effects persisted over time. The result is an annual profile of jobs attributable to vouchers between 2018 and 2023.
We then adjusted for the fact that not all new jobs will be filled by people moving from other employment. Our analysis of the Annual Survey of Hours and Earnings (ASHE) showed that the wage premium arises specifically for job-to-job movers, rather than for those entering from unemployment or inactivity. We therefore assumed that 70% of new jobs were filled by people moving from other jobs. This is consistent with ONS evidence on UK labour market flows, which shows that the majority of job starts, typically around two-thirds to three-quarters, are the result of people moving directly from another job.
The next step was to calculate the size of the wage premium. Average wages for workers in unsupported businesses in 2018 were £26,620 (in 2024 prices). Our analysis of ASHE data showed that job movers entering supported businesses received an average pay rise 6.8 percentage points higher than the average job mover in the economy (15.3% minus 8.5%). Applying this uplift to the baseline wage gives a wage premium of around £1,785 per job per year (in 2024 prices).
We applied this annual premium to the net additional jobs created in each cohort of voucher-supported businesses, taking into account that each cohort generates benefits for up to three years after support. This provided an annual series of additional earnings attributable to vouchers.
Finally, to ensure all benefits are expressed on a consistent basis, we rolled these past benefits forward to 2024 prices using HM Treasury’s Green Book discount rate of 3.5%. This provides a present value (PV) estimate of the additional earnings attributable to vouchers over the period 2018–23.
Using this method we estimate that the earnings benefits from additional job creation attributable to vouchers are in the region of £176m (see table below).
The same approach was applied separately to GBVS and RGC voucher beneficiaries to provide individual scheme level estimates.
Estimates of earnings premium benefits attributable to vouchers
| Businesses accessing a voucher | Estimated number of total jobs | New jobs attributable to vouchers | New jobs taken by movers from other jobs | Total wage premium for job-to-job moves (£000) | Discounted wage premiums (£000) | |
|---|---|---|---|---|---|---|
| 2017/18 | 346 | 7,612 | 441 | 309 | 552 | 678 |
| 2018/19 | 10,643 | 234,146 | 14,182 | 9,927 | 17,720 | 21,783 |
| 2019/20 | 12,284 | 270,248 | 34,697 | 24,288 | 43,354 | 53,293 |
| 2020/21 | 2,075 | 45,650 | 40,153 | 28,107 | 50,172 | 61,674 |
| 2021/22 | 22,253 | 15,577 | 27,806 | 34,180 | ||
| 2022/23 | 3,150 | 2,205 | 3,936 | 4,838 | ||
| Total | 176,446 |
| Source: GC Insight |