Impacts on Local Area Broadband Performance: Postcode Analysis
Published 1 October 2026

© Crown copyright 2026
This publication is licensed under the terms of the Open Government Licence v3.0 except where otherwise stated. To view this licence, visit nationalarchives.gov.uk/doc/open-government-licence/version/3 or write to the Information Policy Team, The National Archives, Kew, London TW9 4DU, or email: psi@nationalarchives.gov.uk.
Where we have identified any third party copyright information you will need to obtain permission from the copyright holders concerned.
This publication is available at https://www.gov.uk/government/publications/final-evaluation-of-bduk-legacy-vouchers-schemes/impacts-on-local-area-broadband-performance-postcode-analysis
1. Summary of key findings
This report assesses the impact of vouchers on broadband performance at postcode level, measured by changes in average download speeds. It replicates the counterfactual analysis used in the previous chapter, applying the same methodology but using postcodes rather than output areas as the unit of analysis.
The findings show that postcodes receiving vouchers experienced substantially larger increases in average download speeds than comparable control postcodes, demonstrating clear additional impacts. The scale of impact varies by treatment year. For postcodes first supported in 2018 and 2021, around 80% of the one-year increase in download speeds can be attributed to vouchers. Impacts in 2019 and 2020 were smaller but remained statistically significant (around 60% and 49% respectively). Effects are consistently larger at postcode level than at output area level, reflecting the smaller number of premises within postcodes and therefore less dilution of voucher impacts.
The analysis also shows that voucher impacts are persistent. For postcodes supported in 2018, 2019 and 2020, average download speeds remained around 50% higher than control areas three years after connection, indicating that improvements were sustained over time.
Postcode-level analysis provides clearer evidence that Rural Gigabit Connectivity (RGC) vouchers were more effective than Gigabit Broadband Voucher Scheme vouchers at increasing download speeds. Across all treatment years where both schemes were in operation, RGC-supported postcodes experienced much larger impacts than those supported through GBVS. These stronger effects persist even after accounting for higher levels of subsidy in RGC areas, indicating that RGC vouchers were also more cost-effective.
2. Purpose of report
This report assesses the impact of vouchers on broadband performance at postcode level, measured through changes in average download speeds. Theprevious chapter in this evaluation reports on the effect of vouchers on the performance of broadband by output area, instead of by postcode.
The rationale for undertaking analysis at postcode level as well is that postcodes are smaller geographic units and contain fewer premises than output areas. As a result, observed changes in broadband performance are less affected by premises that did not receive voucher-supported connections, reducing noise in the data and allowing the effects of vouchers to be identified more clearly. Output areas are generally more consistent than postcodes however, so both have merits.
The methodology used is closely aligned with the output area analysis, with one key difference reflecting data availability. As full socio-economic data are not available at postcode level, the matching approach differs slightly. Voucher-connected postcodes within treated output areas are matched to non-voucher postcodes within the corresponding control output areas. Matching focuses on postcodes with similar estimated connection costs, ensuring comparability in terms of commercial viability for fibre deployment and broadly similar socio-economic characteristics.
3. Limitations of postcode-level data
It should be noted that Connected Nations does not provide data on average download speeds for all treated postcodes. Some postcodes are missing all together, while others only provide the data for certain years. We understand download speed is only estimated for a postcode if the sample size is large enough.
The table below shows that the proportion of treated postcodes with available download speed data has increased over time, from around 45% in 2018 and 2019 to 67% in 2021. This is in part due to Connected Nations data becoming more representative, especially given the large increase between 2018 and 2019 in number of treated postcodes where data is available.. As a result, the earlier analysis of output areas may show a clearer relationship between voucher numbers and speed changes because the underlying data is more robust.
Availability of data on average download speeds by treatment year
| Treatment year | Treated postcodes | Number of treated postcodes where download data is available | % of treated postcodes where data is available |
|---|---|---|---|
| 2018 | 2,293 | 1,057 | 46% |
| 2019 | 7,819 | 3,550 | 45% |
| 2020 | 7,490 | 3,751 | 50% |
| 2021 | 5,862 | 3,925 | 67% |
| Source: Building Digital UK and Connected Nations |
3.1 Headline results
The table below uses the same indicators introduced earlier in the report, but applied to postcodes. Gross change shows the overall increase in average speeds in treated postcodes; median additional change is the extra improvement compared with matched control areas; and additional change range gives the lowest and highest estimates across the different models.
This shows that voucher-supported connections led to substantial and statistically robust improvements in average download speeds within the first year of treatment. All models found vouchers had a statistically significant effect for all treatment years, with the strongest effects occurring in 2018 and 2021 (the same as for Output Area level analysis).
-
In 2018, treated postcodes saw an average speed increase of 29.6 Megabits per second(Mbps), shown in the column “Gross change (Mbps). Of this 29.6 Mbps speed change, 23.8 Mbps was the additional effect of vouchers in comparison to the median model, under the column median additional change. This means 81% of the change in average download speeds was due to vouchers, shown in the column median additionality. 81% Median additionality in 2018 was the highest of any treatment year.
-
In 2019, the average speed increase of 26.3 Mbps, of which 15.7 Mbps was the additional effect of vouchers.
-
In 2020, average speeds increased by 25.7 Mbps, of which 12.6 Mbps was the additional effect.
-
In 2021, average speeds increased by 75.1 Mbps increase, of which 58.4 Mbps (78%) was additional.
These results confirm that the voucher schemes delivered clear and immediate improvements in broadband performance at the postcode level. As expected, the effects appear larger at this finer geographic scale, since they are less diluted by properties not supported by vouchers, unlike in output area-level analysis. For example, an increase in download speed for one premise enabled by a voucher will have a greater effect in a postcode containing ten premises than an output area containing 80 premises.
Additional change in average download speeds after one year in voucher supported postcodes (Mbps)
| Treatment year | Gross change (Mbps) | Median additionalchange | Additionalchange range | Models significant | Median additionality |
|---|---|---|---|---|---|
| 2018 | 29.6 | 23.8*** | 13.0*** to 31.2*** | 9 out of 9 | 81% |
| 2019 | 26.3 | 15.7*** | 14.6*** to 16.9*** | 9 out of 9 | 60% |
| 2020 | 25.7 | 12.6*** | 11.1*** to 13.47*** | 9 out of 9 | 49% |
| 2021 | 75.1 | 58.4*** | 56.7*** to 59.9*** | 9 out of 9 | 78% |
| Source: Belmana |
| Note: Significance levels are 1% (***), 5% (**) and 10% (*). |
The table below shows that vouchers continued to have a statistically significant effect on average download speeds two years after treatment, with all models confirming this. The additional effect of vouchers in terms of Mbps was larger than after one year for all treatment years. For example, the additional effect of vouchers in 2021 increased from 58.4 Mbps after one year to 97.3 Mbps after two years. However, these figures also reflect wider improvements in speeds across all premises. When focusing on the median additionality, the results show this was lower than after one year, with the exception of 2020, where median additionality increased from 49% to 63%.
Additional change in average download speeds after two years in voucher supported postcodes (Mbps)
| Treatment year | Gross change (Mbps) | Median additional change | Additional change range | Models significant | Median additionality |
|---|---|---|---|---|---|
| 2018 | 49.3 | 30.1*** | 21.3*** to 41.0*** | 9 out of 9 | 61% |
| 2019 | 55.0 | 30.4*** | 28.8*** to 33.0*** | 9 out of 9 | 55% |
| 2020 | 95.5 | 60.5*** | 57.9*** to 62.0*** | 9 out of 9 | 63% |
| 2021 | 140.7 | 97.3*** | 91.3*** to 103.0*** | 9 out of 9 | 69% |
| Source: Belmana |
| Note: Significance levels are 1% (***), 5% (**) and 10% (*). |
The analysis also found statistically significant effects on average download speeds three years after treatment, with all models confirming this. For areas treated in 2018, 2019 and 2020, the median additional change increases were 34 Mbps, 50.4 Mbps and 61 Mbps respectively. Median additionality was 53% for 2018, 52% for 2019 and 47% for 2020. This is slightly lower than the two-year estimates but still indicates a strong and sustained impact from vouchers.
Additional change in average download speeds after three years in voucher supported postcodes (Mbps)
| Treatment year | Gross change (Mbps) | Median additional change | Additional change range | Models significant | Median additionality |
|---|---|---|---|---|---|
| 2018 | 64.6 | 34.0*** | 24.2*** to 43.3*** | 9 out of 9 | 53% |
| 2019 | 96.6 | 50.4*** | 46.8*** to 52.7*** | 9 out of 9 | 52% |
| 2020 | 129.5 | 61.0*** | 53.7*** to 64.6*** | 9 out of 9 | 47% |
| Source: Belmana |
| Note: Significance levels are 1% (***), 5% (**) and 10% (*). |
4. Differences by scheme
The table below compares the two voucher schemes by looking at changes in average download speeds one year after connection at postcode level. The postcode-level results are much more consistent than those from output area analysis which is again likely due to the smaller geographic size of postcodes compared to Output Areas. Similarly to the Output Area level analysis, RGC postcodes showed substantially larger additional effects than GBVS postcodes. In 2019, the median additional effect in RGC areas was 71.1 Mbps, compared with 14.7 Mbps in areas supported by GBVS vouchers. In 2020, none of the nine models found a statistically significant effect for GBVS areas, but all nine found significant improvements in RGC areas, with a median effect of 39.6 Mbps. In 2021, GBVS vouchers were no longer in use, but all nine models again showed significant effects for RGC areas, with a median gain of 22.6 Mbps.
Additional change in average download speeds in postcodes after one year, by voucher scheme (Mbps)
| Treatment year | Scheme | Number of postcodes | Median effect (Mbps) | Range of effect (Mbps) | Models significant |
|---|---|---|---|---|---|
| 2019 | GBVS | 2,686 | 14.66*** | 11.96*** to 16.33*** | 9 out of 9 models |
| RGC | 179 | 71.14*** | 68.22*** to 76.69*** | 9 out of 9 models | |
| 2020 | GBVS | 1,641 | 0.46 | -0.23 to 2.23 | 0 out of 9 models |
| RGC | 788 | 39.60*** | 38.67*** to 46.75*** | 9 out of 9 model | |
| 2021 | GBVS | 0 | n.a | n.a | n.a |
| RGC | 560 | 22.60*** | 19.00*** to 24.98*** | 9 out of 9 models |
| Source: Belmana |
| Note: Significance levels are 1% (***), 5% (**) and 10% (*). |
The table below presents results over a three-year period and shows that RGC areas consistently achieved larger additional increases in average download speeds than GBVS areas. For areas treated in 2019, the three-year median effect was 241.2 Mbps in RGC areas compared with 37.4 Mbps in GBVS areas. For those treated in 2020, the corresponding effects were 62.2 Mbps for RGC and 14.7 Mbps for GBVS.
Additional change in average download speeds in postcodes after three years year, by voucher scheme (Mbps)
| Treatment year | Voucher type | No. postcodes | 1 Year median effect | 2 Year median effect | 3 Year median effect |
|---|---|---|---|---|---|
| 2019 | GBVS | 2,686 | 14.7*** | 23.6*** | 37.4*** |
| RGC | 179 | 71.1*** | 190.1*** | 241.2*** | |
| 2020 | GBVS | 1,641 | 0.5 | 4.2 | 14.7*** |
| RGC | 788 | 39.6*** | 90.4*** | 62.2*** | |
| 2021 | GBVS | 0 | n.a | n.a | n.a |
| RGC | 560 | 22.6*** | 12.3 | n.a |
| Source: Belmana |
| Note: Significance levels are 1% (***), 5% (**) and 10% (*). |
The table below compares the cost-effectiveness of the two schemes using postcode-level analysis. Unlike the earlier assessment in the table titled “Cost effectiveness analysis for project and standard vouchers – output area level” which measured speed change per pound per premise, this approach uses speed change per £1,000 of voucher subsidy because premise counts are missing for many treated postcodes in Connected Nations.
The results show that RGC areas received higher subsidies than GBVS areas but still delivered greater improvements in speed. In 2019, the average subsidy in RGC areas was £7,443 per postcode—more than double the £3,645 average in GBVS areas. Yet over three years, the average speed change per £1,000 invested was 32.4 Mbps in RGC areas compared with only 10.3 Mbps in GBVS areas.
RGC was also more cost effective in 2020. GBVS areas showed no significant speed improvements, while in RGC areas the three-year average was 11.7 Mbps per £1,000 invested.
The results suggest that, when analysis is done at a more granular level than output areas, RGC vouchers are consistently found to have delivered better value for money than GBVS vouchers.
Cost effectiveness analysis by scheme – postcode level
| Treatment year | Indicator | After one year | After two years | After three years | |||
|---|---|---|---|---|---|---|---|
| GBVS | RGC | GBVS | RGC | GBVS | RGC | ||
| 2019 | Net additional change (Mbps) | 14.7 | 71.1 | 23.6 | 190.1 | 37.4 | 241.2 |
| Average cumulative value of vouchers per postcode (£) | 3,645 | 7,406 | 3,770 | 7,525 | 3,770 | 7,800 | |
| Average speed change per £1,000 invested | 4.0 | 6.3 | 25.3 | 9.9 | 30.9 | ||
| 2020 | Net additional change (Mbps) | n.a. | 39.6 | n.a. | 90.4 | n.a. | 62.2 |
| Average cumulative value of vouchers per postcode (£) | 2,841 | 5,337 | 2,978 | 5,401 | 2,978 | 5,456 | |
| Average speed change per £1,000 invested | n.a. | 7.4 | n.a. | 16.7 | n.a. | 11.4 | |
| Source: Belmana |
5. Differences by voucher type
Postcode-level analysis of voucher types shows similar patterns to those observed at output area level. In 2019 and 2020, postcodes supported by project vouchers experienced much larger additional effects after one year than those supported by standard vouchers. The median additional effect in 2019 was 30.3 Mbps for project areas compared with 5.09 Mbps for standard areas, while in 2020 project areas recorded a median effect of 20.3 Mbps and standard areas showed no significant difference from the control group.
The results for 2018 differ sharply from this pattern. Standard voucher areas recorded a median additional effect of 36.8 Mbps, but project voucher areas showed no significant differences in any model.
Overall, the findings suggest project vouchers have been more effective than standard vouchers at increasing average download speeds. The one exception to this is in 2018, which could be explained by errors or small sample sizes in Connected Nations data, or project vouchers becoming more effective over time.
Additional change in average download speeds in postcodes after one year, by voucher type (Mbps)
| Treatment year | Voucher type | Median effect (Mbps) | Range of effect (Mbps) | Models significant |
|---|---|---|---|---|
| 2018 | Project | -3.22 | -7.69 to 11.61 | 0 out of 9 models |
| Standard | 36.83*** | 22.46*** to 48.52*** | 9 out of 9 models | |
| 2019 | Project | 30.27*** | 25.94*** to 34.06*** | 9 out of 9 models |
| Standard | 5.09*** | 4.03*** to 6.09*** | 9 out of 9 models | |
| 2020 | Project | 20.28*** | 18.26*** to 21.25*** | 9 out of 9 models |
| Standard | -3.36 | -4.20* to -2.36 | 0 out of 9 models | |
| 2021 | Project | 47.90*** | 46.18*** to 52.11*** | 9 out of 9 models |
| Standard | n.a | n.a | n.a |
| Source: Belmana |
| Note: Significance levels are 1% (***), 5% (**) and 10% (*). The ‘models significant’ column only includes models where the difference is significant at the 5% or 1% level which is the standard threshold used in evaluation |
Looking over a longer time period, the table below shows that postcodes that received project vouchers in 2018 did experience an additional effect , but this was delayed. By the second year, the change in average download speeds was 15.5 Mbps higher than control areas in the median model, increasing to 27.5 Mbps by the third year. However the additional effect of vouchers for project voucher areas was still lower than standard voucher areas, which saw a 36 Mbps additional effect by the third year.
For 2019 and 2020, the additional effects of vouchers were much higher in project areas than standard voucher areas. For 2019, the additional effect over a three year period was 97.7 Mbps in project areas compared to only 16 Mbps in standard areas. In 2020, the three year additional effect was 101 Mbps in project areas, while the average speed change in standard voucher areas was not significantly different to control group areas.
Overall, this suggests that project vouchers have been more effective at increasing average download speeds than standard vouchers, particularly from 2019 when they became more focused on rural areas.
Additional change in average download speeds in postcodes after three years, by voucher type (Mbps)
| Treatment year | Voucher type | Number of postcodes | 1 Year median effect (Mbps) | 2 Year median effect (Mbps) | 3 Year median effect (Mbps) |
|---|---|---|---|---|---|
| 2018 | Project | 279 | -3.22 | 15.50** | 27.52*** |
| Standard | 544 | 36.83*** | 39.98*** | 35.98*** | |
| 2019 | Project | 1,024 | 30.27*** | 73.15*** | 97.67*** |
| Standard | 1,834 | 5.09*** | 4.32* | 16.00*** | |
| 2020 | Project | 1,824 | 20.28*** | 97.06*** | 101.34*** |
| Standard | 966 | -3.36 | 3.88 | -7.37 | |
| 2021 | Project | 4,485 | 47.90*** | 92.29*** | n.a |
| Standard | n.a. | n.a | n.a | n.a |
| Source: Belmana |
| Note: Significance levels are 1% (***), 5% (**) and 10% (*). |
The cost-effectiveness analysis in the table below shows that standard vouchers delivered better value in 2018, when project vouchers had no measurable impact on download speeds. In all subsequent years, however, project vouchers were more cost effective despite the higher level of investment. For example, in 2019 the average speed change per £1,000 invested was 15.9 Mbps in project areas compared with just 6 Mbps in standard voucher areas. This indicates that project vouchers provided greater value for money overall, but only from 2019 onwards, which may reflect the increased focus on rural areas in later years.
Cost effectiveness analysis for voucher types – postcode level
| Average voucher value | Average speed change per £1000 invested (Mbps) | ||||
|---|---|---|---|---|---|
| £ | 1 year | 2 years | 3 years | ||
| 2018 | Project | 7,463 | 0.0 | 2.1 | 3.7 |
| Standard | 2,924 | 12.6 | 13.7 | 12.3 | |
| 2019 | Project | 6,128 | 4.9 | 11.9 | 15.9 |
| Standard | 2,689 | 1.9 | 1.6 | 6.0 | |
| 2020 | Project | 4,847 | 4.2 | 20.0 | 20.9 |
| Standard | 2,578 | 0.0 | 0.0 | 0.0 | |
| Source: Belmana |
6. Relationship between value of voucher investment and change in speeds
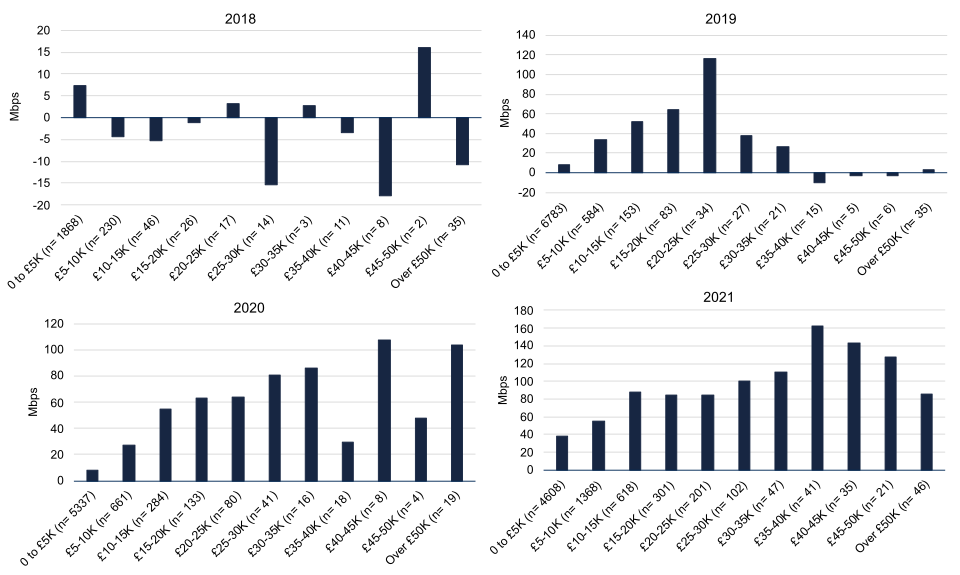
As with the output area analysis, the charts below show that within postcode areas the relationship between the total value of vouchers used in output areas and subsequent speed increases is clearer and stronger for the later treatment years
The 2018 results show no relationship between the value of voucher investment and speed changes. In several years, the data suggests that postcode areas actually experienced a decline in average download speeds. This is also the case for postcode areas that received more than £35,000 in voucher investment in 2019. Although sample sizes are very small for postcodes with high investment values, these findings reinforce the view that speed data from Connected Nations is less reliable in earlier treatment years.
Since both the postcode- and output area-level analyses are based on the same underlying speed data from Connected Nations, this limitation also affects the interpretation of 2018 and 2019 results in the output area analysis presented earlier in the report.
It should be noted that postcodes vary in size, making the voucher-band categories less consistent than at Output Area level which risks potentially distorting the results.
Change in average download speed after one year by value of vouchers per postcode
Source: GC Insight analysis of Connected Nations