Extractive industries in the UK
Published 20 December 2019

© Crown copyright 2019
This publication is licensed under the terms of the Open Government Licence v3.0 except where otherwise stated. To view this licence, visit nationalarchives.gov.uk/doc/open-government-licence/version/3 or write to the Information Policy Team, The National Archives, Kew, London TW9 4DU, or email: psi@nationalarchives.gov.uk.
Where we have identified any third party copyright information you will need to obtain permission from the copyright holders concerned.
This publication is available at https://www.gov.uk/government/publications/extractive-industries-transparency-initiative-payments-report-2018/extractive-industries-in-the-uk
The extractive industries comprise mining and quarrying, including oil and gas production. The sector has made a sizeable contribution to the UK economy for many years and remains an important sector, both directly and by supporting substantial added value in downstream industries and related supply chains. By far the largest economic contribution comes from oil and gas production.
In 2018, total UK extractive industry gross value added (GVA) is now estimated to have been £18 billion, with oil and gas production and associated support service activities accounting for 90% of the sector’s GVA[footnote 1]. The oil and gas industry was directly responsible for 40,000 jobs in 2018, with many more supported in the industry’s wider supply chain. It is estimated that in total 260,000 jobs across the UK were supported by the offshore oil and gas industry in 2018.
Construction minerals, principally crushed rock and sand and gravel aggregates, represent the largest materials flow in the UK. The market for these minerals depends upon the level of UK construction activity and longer-term construction-related demand.
Ahead of collection and publication of information on extractive-related payments to the UK government in 2018, the UK EITI Multi-Stakeholder Group (MSG) decided to exclude payments made by coal mining companies to the Coal Authority from this year’s reconciliation. These payments are no longer material relative to overall government revenues and the MSG believes that their exclusion will not affect the comprehensiveness of UK EITI reporting. The continuing economic contribution of the coal sector is, though, still included in the background information set out below.
Figure 1. Extractive industry gross value added (GVA)
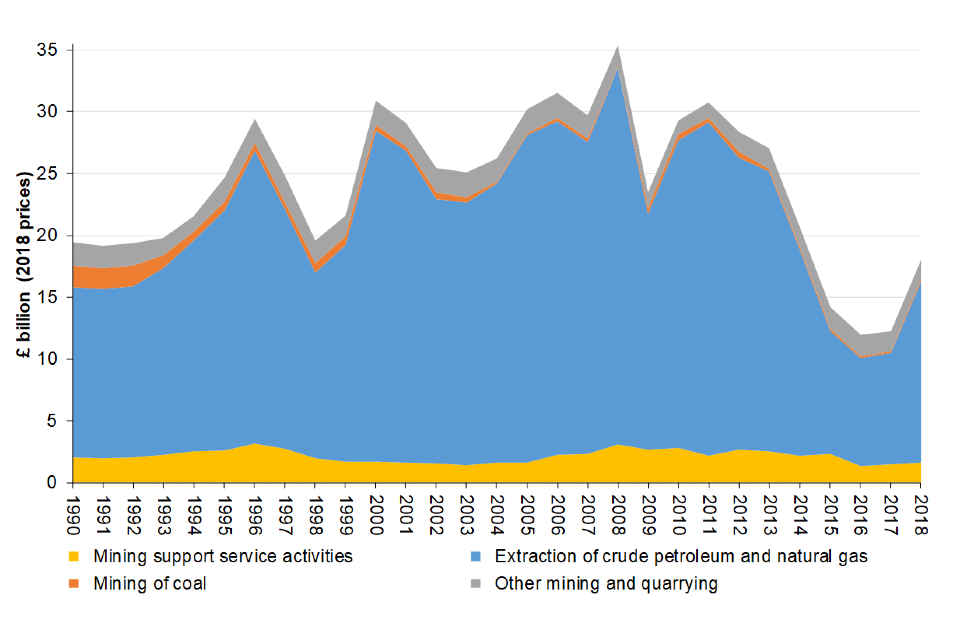
Extractive Industry Gross Value Added 1990 to 2018
Source: ONS, UK GDP(O) low level aggregates, 30 September 2019.
In some of the summary information below, coal is grouped with oil and gas (for example where data are available for fossil fuels but not for other parts of the sector). However, for most of this chapter, oil and gas are treated separately from mining and quarrying, including coal. In addition, it should be noted that the phrase “mining and quarrying” as used in UK national statistics embraces the whole UK extractive sector including oil and gas production as well as coal production. Mining support services are also included in this sector. Some of the data reported below include those activities while other data exclude them.
Value of the sector
Table 1 shows GVA for the main components of the mining and quarrying sector as reported in UK national statistics. As noted above, this sector includes fossil fuel production, other mining and quarrying and mining support service activities, but excludes the value of products manufactured with extracted minerals. The table gives for each subsector its percentage share of total UK GVA for the most recent year. It also shows the whole sector’s GVA as a percentage of national gross domestic product (GDP) for each year[footnote 2].
Table 1. Gross Value Added (GVA) (£ million)
| Year | Extraction of crude petroleum and natural gas | Mining of coal | Other mining and quarrying | Mining support service activities | Total mining and quarrying including oil and gas | Total UK GVA | Total UK GDP | Extractives share of total GDP |
|---|---|---|---|---|---|---|---|---|
| Calculations | (A) | (B) | (C) | (D) | (E) = sum of (A) to (D) | (F) | (G) | (E) / (G) |
| 2014 | 15,743 | 189 | 1,514 | 2,046 | 19,492 | 1,660,188 | 1,844,295 | 1.06% |
| 2015 | 9,339 | 167 | 1,679 | 2,227 | 13,412 | 1,709,325 | 1,895,839 | 0.71% |
| 2016 | 8,403 | 138 | 1,680 | 1,289 | 11,510 | 1,778,134 | 1,969,524 | 0.58% |
| 2017 | 8,809 | 176 | 1,572 | 1,470 | 12,027 | 1,846,694 | 2,049,629 | 0.59% |
| 2018 | 14,703 | 164 | 1,539 | 1,611 | 18,017 | 1,923,440 | 2,117,724 | 0.85% |
| %* | 0.76% | 0.01% | 0.08% | 0.08% | 0.94% | 100% |
*The percentages in this row are shares of total UK GVA for all industries in 2018.
Source: ONS, UK GDP(O) low level aggregates, 30 September 2019, ONS, UK Economic Accounts: main aggregates, 29 September 2019
The following tables give a finer breakdown of the sector in the latest recent year for which data are available to give a sense of the scale of activity in each subsector. Although the GVA data in the first table and the one above are sourced from official Office of National Statistics (ONS) data, they are not identical. Note that in value terms support service activities are almost entirely related to extraction of petroleum and natural gas.
Table 2. Mining and Quarrying (including Oil and Gas) – number of enterprises, GVA and employment costs in 2017
| SIC 07 Code | Description | Number of enterprises | Approximate gross value added at basic prices (aGVA) | Total employment costs |
|---|---|---|---|---|
| Number | £ million | £ million | ||
| 06 | Extraction of crude petroleum and natural gas | 159 | 15,423 | 2,027 |
| 09.1 | Support activities for petroleum and natural gas extraction | 215 | * | 1,657 |
| 08.11 | Quarrying of ornamental and building stone, limestone, gypsum, chalk and slate | 222 | 1,040 | 429 |
| 08.12 | Operation of gravel and sand pits; mining of clays and kaolin | 161 | 797 | 370 |
| 08.92 | Extraction of peat | 16 | 24 | 10 |
| 08.93 | Extraction of salt | 8 | 117 | 29 |
| 09.9 | Support activities for other mining and quarrying | 169 | * | 20 |
| B | Mining and quarrying | 1,261 | 20,103 | 4,729 |
Source: Annual Business Survey, 7 November 2019
Note: SIC = Standard Industrial Classification (in which, in the 2007 edition which is still used to classify UK industries, mining and quarrying including oil and gas make up Section B which comprises Divisions 05–09).
Table 3. Number of businesses in the private sector and their associated employment and turnover, by number of employees and industry division, UK, start 2019
| All business | Businesses number | Employment thousands | Turnover £ million |
|---|---|---|---|
| 05 Mining of coal and lignite | 15 | * | * |
| 06 Extraction of crude petroleum and natural gas | 785 | 13 | 20,868 |
| 07 Mining of metal ores | 5 | * | * |
| 08 Other mining and quarrying | 1,950 | 22 | 6,106 |
| 09 Mining support service activities | 5,775 | 26 | 6,435 |
| B Mining and quarrying including oil and gas | 8,530 | 61 | 33,409 |
| All employers | Businesses number | Employment thousands | Turnover £ million |
|---|---|---|---|
| 05 Mining of coal and lignite | 15 | * | * |
| 06 Extraction of crude petroleum and natural gas | 90 | 12 | 20,835 |
| 07 Mining of metal ores | 0 | * | * |
| 081 Quarrying of stone, sand and clay | 315 | 18 | 5,598 |
| 089 Mining and quarrying n.e.c. | 180 | 2 | 421 |
| 08 Other mining and quarrying | 500 | 20 | 6,019 |
| 091 Support activities for petroleum and natural gas extraction | 155 | 19 | 5,834 |
| 099 Support activities for other mining and quarrying | 70 | 1 | 102 |
| 09 Mining support service activities | 225 | 20 | 5,936 |
| B Mining and quarrying including oil and gas | 830 | 52 | 32,790 |
Notes:
1. n.e.c. = not elsewhere classified; industrial classification follows UK SIC 2007
2. A * symbol replaces data that are deemed to be disclosive.
Source: Business Population Estimates for the UK and Regions 2018, BEIS, 10 October 2019, Tables 6 & 7
Government revenues
UK government accounts cover a financial year running from April to March rather than a calendar year, so most of the data on government revenues are of necessity on a financial year basis. Where possible, calendar year data have (also) been provided. Oil and gas companies have a distinct tax regime, allowing identification of their extractive-related tax payments (and repayments), whereas mining and quarrying companies pay mainstream corporation tax. This means the data for extractive-related tax receipts from mining and quarrying companies cannot be separated out. Details on tax revenues can therefore be found in the separate upstream oil and gas in the UK chapter.
Section 106 payments are made (in England, plus equivalent payments made elsewhere in the UK) to local authorities relating to the granting of planning permission for mining operations to cover, for example, local road and infrastructure improvements. These are the only mandated social expenditure by extractive companies.
There are no non-monetary arrangements between extractive companies and the government in the UK.
Forecasts of UK government oil and gas revenues are published by the independent Office for Budget Responsibility (OBR). The OBR also publishes details of its underlying forecasts of oil and gas production, prices and expenditure broken down between exploration and appraisal, development capital expenditure, operating costs and decommissioning costs.
Table 4 includes environmental taxes paid by the UK extractive industries. These are not extractive-related so are not included in the reconciliation of payments and receipts.
Table 4: Environmental taxes paid by the mining and quarrying sector (including oil and gas)
| Revenue £ million | 2012 | 2013 | 2014 | 2015 | 2016 | 2017 | 2018 |
|---|---|---|---|---|---|---|---|
| Government revenue from energy taxes | 314 | 321 | 321 | 262 | 177 | nya | nya |
| Government revenue from transport taxes | 106 | 115 | 116 | 106 | 114 | nya | nya |
| Government revenue from pollution and resource taxes | 266 | 284 | 344 | 356 | 407 | nya | nya |
| Total government revenue from environmental taxes | 685 | 720 | 782 | 724 | 698 | nya | nya |
| of which Aggregates Levy | 264 | 282 | 342 | 354 | 405 | 375 | 381 |
The Aggregates Levy was introduced in 2002 and is a tax on sand, gravel or rock that has been dug from the ground, dredged from the sea or imported into the UK. It is generally payable by the quarrying industry but can also apply when aggregate is removed in the course of infrastructure projects. More information available in the Aggregates Levy Bulletin and Aggregate Levy archive.
nya = not yet available
Source: Environmental taxes in the United Kingdom (ONS, 5 June 2019)
Exports
The UK both imports and exports all types of mining and quarrying production but is generally a net importer of each type. Information on trade flows is given in the relevant sectoral sections.
Gross extractives exports in 2018 as reported by ONS amounted to 4% of total UK gross exports by value.
Employment
Table 5 gives estimates of the total UK workforce jobs directly supported by the UK mining and quarrying sector including its major sub-sectors. It also shows the industries are typically capital- rather than labour-intensive and correspondingly represent a significantly smaller share of workforce jobs than of GVA.
Table 5. Workforce jobs estimates (thousands)
| Year | Extraction of crude petroleum and natural gas | Mining of coal | Mining of metal ores and other mining and quarrying | Mining support service activities* | Total mining & quarrying including oil & gas | All UK industries |
|---|---|---|---|---|---|---|
| 2014 | 17 | 4 | 17 | 29 | 68 | 33,223 |
| 2015 | 18 | 2 | 21 | 30 | 71 | 33,763 |
| 2016 | 17 | 1 | 21 | 24 | 63 | 34,339 |
| 2017 | 14 | 1 | 19 | 25 | 59 | 34,682 |
| 2018 | 12 | 1 | 19 | 28 | 60 | 34,914 |
| 2018 | 0.03% | 0.00% | 0.06% | 0.08% | 0.17% | 100% |
*Almost all of this is in support of oil and gas production
Sources: ONS, BEIS DUKES 2019
Table 6 shows estimates of extractive industry employment in Great Britain (the UK excluding Northern Ireland) at a finer level of disaggregation than is available for the workforce jobs estimates for the UK.
Table 7 shows the gender split of employment in recent years for the mining and quarrying sector as a whole. Although the proportion of women in the workforce has declined slightly since 2014 the longer-term trend is more positive; the female share in 1996 was only 7%, less than half the share in 2019. All extractive employment shown in this and subsequent tables is in the private sector.
Table 6. Extractive industry employment in Great Britain and United Kingdom (in thousands)
| SIC 2007 | Subject | 2014 | 2015 | 2016 | 2017 | 2018 |
|---|---|---|---|---|---|---|
| GB 05101 | Deep coal mines | 1.6 | 0.9 | * | - | 0.1 |
| GB 05102 | Open cast coal working | 1.3 | 1.1 | * | 1.2 | 1.2 |
| GB 05 | Mining of coal (1) | 2.9 | 2.0 | 1.1 | 1.3 | 1.3 |
| GB 06 | Extraction of crude petroleum and natural gas (2) | 16.6 | 15.7 | 15.2 | 12.2 | 12.8 |
| GB 07 | Mining of metal ores | - | - | - | - | - |
| GB 08110 | Quarrying of ornamental and building stone; limestone; gypsum; chalk and slate | 6.7 | 7.4 | 8.6 | 7.7 | 8.2 |
| GB 08120 | Operation of gravel and sand pits; mining of clays and kaolin | 7.1 | 7.7 | 6.9 | 7.0 | 7.3 |
| GB 081 | Quarrying of stone; sand and clay | 13.8 | 15.1 | 15.5 | 14.7 | 15.6 |
| GB 08910 | Mining of chemical and fertilizer minerals | * | 1.3 | * | * | * |
| GB 08920 | Extraction and agglomeration of peat | * | 0.2 | * | * | * |
| GB 08930 | Extraction of salt | 0.4 | 0.4 | 0.3 | 0.3 | * |
| GB 08990 | Other mining and quarrying n.e.c. | 1.1 | 1.3 | 1.2 | 0.9 | 1.0 |
| GB 089 | Mining and quarrying n.e.c. | 2.7 | 3.2 | 2.4 | 2.0 | 1.9 |
| GB 08 | Other mining and quarrying (other than mining of metal ores) | 16.4 | 18.3 | 17.9 | 16.7 | 17.5 |
| GB 091 | Support activities for petroleum and natural gas extraction (3) | 25.1 | 22.4 | 18.8 | 18.4 | 18.1 |
| GB 099 | Support activities for other mining and quarrying | 0.3 | 0.4 | 0.4 | 0.3 | 0.5 |
| GB 09 | Mining support service activities | 25.4 | 22.9 | 19.2 | 18.7 | 18.6 |
| GB sum of 05-09 | Total extractive industries | 61.3 | 58.9 | 53.4 | 48.9 | 50.2 |
| GB (1) + (2) | Fossil fuel extraction | 19.5 | 17.7 | 16.3 | 13.5 | 14.1 |
| GB (2) + (3) | Oil and gas extraction and support services | 41.7 | 38.1 | 34.0 | 30.6 | 30.9 |
| UK 05 & 06 | Mining of coal and lignite; Extraction of crude petrol / gas | 21 | 20 | 18 | 15 | 13 |
| UK 07 & 08 | Mining of metal ores; Other mining and quarrying | 17 | 21 | 21 | 19 | 19 |
| UK 09 | Mining support service activities | 29 | 30 | 24 | 25 | 28 |
| UK sum of 05-09 | Total extractive industries | 68 | 71 | 63 | 59 | 60 |
Notes: (1) Data for 2014 and 2015 come from the provisional rather than revised results. (2) n.e.c. = not elsewhere classified
- Employment is defined as employees plus working proprietors.
- Figures are rounded to the nearest thousand and to one decimal place. For example, 2.4 is equal to 2,400 and represents a figures in the range 2,350-2,449. Figures may not add up due to rounding.
- Cells containing an asterisk (*) represent disclosive data that cannot be published.
- Cells containing a hyphen (-) represent a zero or less than 50.
Source: ONS, Business Register and Employment Survey (Table 2a)
Table 7: Male / female split of total workforce jobs (thousands) - Mining and quarrying (M&Q) sector and All industries
| Year | M&Q Male | M&Q Female | M&Q Total | M&Q Female share | All industries Male | All industries Female | All industries Total | All industries Female share | M&Q share of all industries |
|---|---|---|---|---|---|---|---|---|---|
| 2014 | 56 | 11 | 68 | 17% | 17,618 | 15,843 | 33,461 | 47% | 0.20% |
| 2015 | 59 | 11 | 70 | 16% | 17,929 | 16,056 | 33,986 | 47% | 0.21% |
| 2016 | 53 | 10 | 62 | 16% | 18,135 | 16,418 | 34,553 | 48% | 0.18% |
| 2017 | 49 | 9 | 59 | 16% | 18,316 | 16,568 | 34,884 | 47% | 0.17% |
| 2018 | 51 | 9 | 60 | 15% | 18,421 | 16,670 | 35,091 | 48% | 0.17% |
| 2019 | 49 | 9 | 58 | 15% | 18,643 | 16,945 | 35,588 | 48% | 0.16% |
Source: Unadjusted data downloaded from Nomis on 18 October 2019
Regional location of extractive industries
Extractive industry employment levels have fallen markedly from their historic peak decades ago, mainly due to the decline of the coal industry, but extractive-related activities still contribute significantly to local employment in a number of regions.
The broad geographic spread of employment in the UK extractive sector (including oil and gas and mining support service activities) is illustrated in Table 8. The concentration of employment in Scotland reflects the dominance of the Aberdeen area in terms of oil and gas-related activity. While the importance of the sector for the Scottish economy is well known, the relatively high share of activity in the East Midlands is also noteworthy.
Table 8: Regional distribution of number of employees in 2018
| Location | Extraction of crude petroleum and natural gas | Support activities for petroleum and natural gas extraction | Extraction of petroleum and natural gas | Mining of hard coal from deep coal mines (underground mining) | Mining of hard coal from open cast coal working (surface mining) | Mining of hard coal | Quarrying of ornamental and building stone, limestone, gypsum, chalk and slate | Operation of gravel and sand pits; mining of clays and kaolin | Mining of chemical and fertiliser minerals |
|---|---|---|---|---|---|---|---|---|---|
| London | 1,825 | 400 | 2,225 | 0 | 0 | 0 | 20 | 175 | 0 |
| South East | 175 | 100 | 275 | 0 | 0 | 0 | 175 | 1,000 | 0 |
| East | 710 | 175 | 885 | 0 | 0 | 0 | 300 | 600 | 0 |
| South West | 150 | 100 | 250 | 0 | 0 | 0 | 1,250 | 1,500 | 0 |
| East Midlands | 100 | 150 | 250 | 0 | 0 | 0 | 3,000 | 600 | 20 |
| West Midlands | 0 | 5 | 5 | 0 | 0 | 0 | 175 | 500 | 10 |
| Yorkshire and The Humber | 210 | 250 | 460 | 0 | 0 | 0 | 600 | 700 | 0 |
| North East | 315 | 50 | 365 | 0 | 300 | 300 | 125 | 175 | 500 |
| North West | 150 | 300 | 450 | 10 | 20 | 30 | 600 | 600 | 10 |
| England | 3,400 | 1,500 | 4,900 | 10 | 350 | 360 | 6,000 | 6,000 | 600 |
| Wales | 50 | 100 | 150 | 50 | 600 | 650 | 500 | 500 | 0 |
| Scotland | 9,050 | 16,000 | 25,050 | 0 | 300 | 300 | 1,250 | 1,000 | 0 |
| Great Britain (GB) | 12,500 | 18,000 | 30,500 | 75 | 1,250 | 1,325 | 8,000 | 7,000 | 600 |
| Sector share of GB Total | 0.04% | 0.06% | 0.10% | 0.00% | 0.00% | 0.00% | 0.03% | 0.02% | 0.00% |
| Location | Extraction of peat | Extraction of salt | Other mining and quarrying n.e.c. | Support activities for other mining and quarrying | Other mining and quarrying | Mining and quarrying including oil and gas | Region total all industries | Sector share of region total |
|---|---|---|---|---|---|---|---|---|
| London | 0 | 0 | 200 | 125 | 520 | 2,745 | 5,160,250 | 0.05% |
| South East | 0 | 0 | 15 | 5 | 1,195 | 1,470 | 4,151,000 | 0.04% |
| East | 0 | 10 | 35 | 5 | 950 | 1,835 | 2,779,000 | 0.07% |
| South West | 15 | 0 | 125 | 75 | 2,965 | 3,215 | 2,468,000 | 0.13% |
| East Midlands | 30 | 0 | 75 | 25 | 3,750 | 4,000 | 2,070,000 | 0.19% |
| West Midlands | 0 | 0 | 40 | 10 | 735 | 740 | 2,561,000 | 0.03% |
| Yorkshire and The Humber | 0 | 0 | 150 | 35 | 1,485 | 1,945 | 2,398,000 | 0.08% |
| North East | 0 | 0 | 50 | 100 | 1,250 | 1,615 | 1,053,500 | 0.15% |
| North West | 0 | 350 | 100 | 75 | 1,765 | 2,215 | 3,328,000 | 0.07% |
| England | 40 | 400 | 800 | 450 | 14,650 | 19,550 | 25,976,000 | 0.08% |
| Wales | 0 | 0 | 25 | 10 | 1,685 | 1,835 | 1,272,000 | 0.14% |
| Scotland | 20 | 10 | 125 | 45 | 2,750 | 27,800 | 2,509,000 | 1.11% |
| Great Britain (GB) | 50 | 400 | 900 | 500 | 18,775 | 49,275 | 29,758,000 | 0.17% |
| Sector share of GB Total | 0.00% | 0.00% | 0.00% | 0.00% | 0.06% | 0.17% | 100.00% |
The level of rounding applied varies by estimate. Please see this article for further information on how rounding of Business Register and Employment Survey estimates is applied. ONS Crown Copyright Reserved (from Nomis on 16 October 2019)
Almost all UK oil and gas production comes from fields located offshore. The Oil and Gas Authority (OGA) publishes maps showing the location of oil and gas fields in GB and on the UK Continental Shelf (UKCS). These maps also show which areas are under licence offshore and onshore in Great Britain. The Northern Ireland Department for the Economy (DfE) publishes a map showing which areas are under licence in Northern Ireland, but there is as yet no production there.
The majority of coal production comes from sites in Scotland, England and South Wales, as mapped by the Coal Authority. The mining and quarrying of non-hydrocarbon minerals are widely distributed across the UK. There are no significant hard-rock aggregate deposits in the South and East of England, so these materials are transported for use in these regions from further afield in the Midlands and South West in particular.
UK fossil fuel production and UK energy demand
UK production of fossil fuels has been, and continues to be, significant in terms of meeting UK energy demand. This is particularly true of oil and gas but, nowadays, much less so for coal. While the share of total demand represented by fossil fuels has been declining, they still account for around 4 fifths of total primary energy demand and are currently forecast by BEIS to account for nearly 70% of total primary energy demand even in 2035.
Figures 2 and 3 show the evolution of UK energy demand and production since 2000. The recent decline in coal use and growth in renewables are shown clearly.
Figure 2: UK energy demand
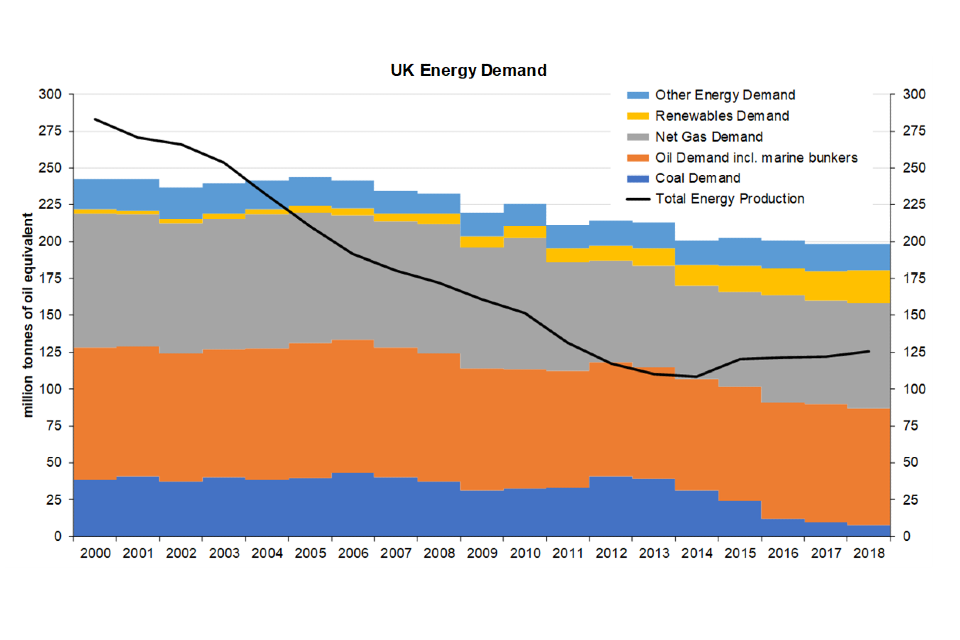
UK energy demand 2000 to 2018
Figure 3: UK energy production
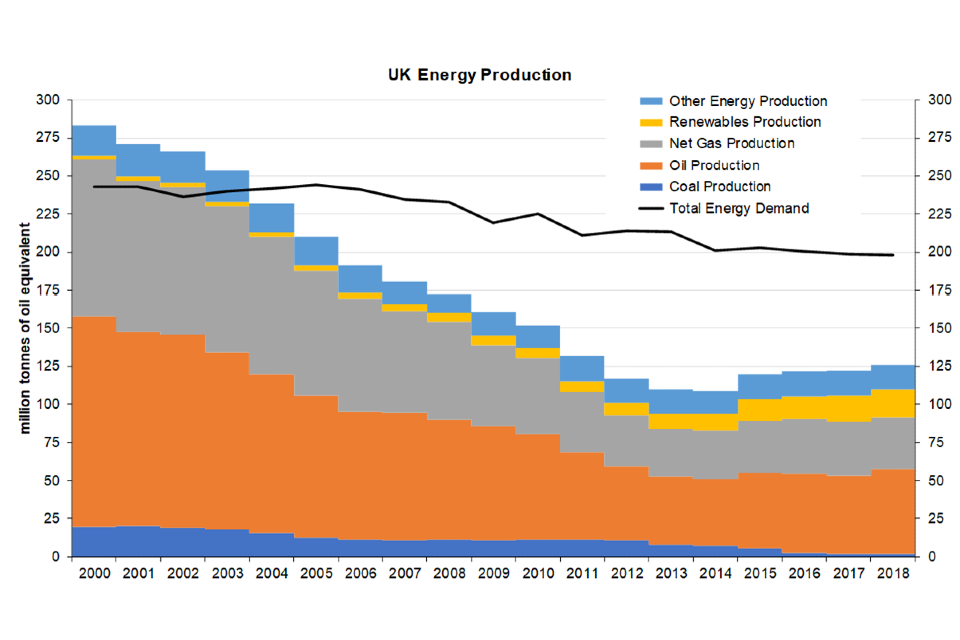
UK energy production 2000 to 2018
Source: UK Energy in Brief 2019 dataset (BEIS, August 2019), Aggregated Energy Balances showing proportion of Renewables (BEIS, September 2019) and DUKES 2019 (BEIS, July 2019).
Glossary of abbreviations
| Term | Definition |
|---|---|
| BEIS | Department for Business, Energy & Industrial Strategy |
| billion | one thousand million or 10 to the power of 9 |
| DfE | Department for the Economy |
| DUKES | Digest of United Kingdom Energy Statistics |
| EITI | Extractive Industries Transparency Initiative |
| GB | Great Britain |
| GDP | gross domestic product |
| GVA | gross value added |
| MSG | Multi-Stakeholder Group |
| OBR | Office for Budget Responsibility |
| OGA | Oil and Gas Authority |
| ONS | Office for National Statistics |
| SIC | Standard Industrial Classification |
| UK | United Kingdom |
| UKCS | UK Continental Shelf |
-
GVA is a measure of economic output – capturing the value of goods and services produced by a sector – and is often used to indicate a sector’s contribution to the economy. It should be noted that the sectoral GVA data published here are very different from (and often much lower than) those previously published by the ONS. The revised estimates of GVA reflect methodological changes introduced for Blue Book 2019 (October 2019). ↩
-
Generally in this page, unlike in the ONS table and some other official sources, a terminological distinction is made between “oil and gas” and “[other] mining and quarrying”, the latter comprising the extraction of coal and of all non-hydrocarbon minerals. We have included mining support service activities in the total for the sector when calculating its contribution to GDP. ↩