Upstream oil and gas in the UK
Published 20 December 2019

© Crown copyright 2019
This publication is licensed under the terms of the Open Government Licence v3.0 except where otherwise stated. To view this licence, visit nationalarchives.gov.uk/doc/open-government-licence/version/3 or write to the Information Policy Team, The National Archives, Kew, London TW9 4DU, or email: psi@nationalarchives.gov.uk.
Where we have identified any third party copyright information you will need to obtain permission from the copyright holders concerned.
This publication is available at https://www.gov.uk/government/publications/extractive-industries-transparency-initiative-payments-report-2018/upstream-oil-and-gas-in-the-uk
Background and recent developments
The UK’s oil and gas sector is dominated by production from offshore areas, which account for virtually all of UK output[footnote 1]. Production of natural gas began in 1967 with the West Sole field in the Southern North Sea. Offshore oil production began with the Argyll field in the Central North Sea (CNS) in 1975. At the start of the industry in the 1960s and 1970s production was dominated by a small number of very large fields, such as Inde, Leman, Forties, Brent, Ninian and Piper. That era also saw the development of a number of key offshore pipelines.
UKCS production now comes from over 300 predominantly small fields and others that are much more technically complex to produce from, both of which tend to increase unit development and production costs. By the end of 2018, almost 45 billion barrels of oil equivalent (boe) had been recovered from the UK Continental Shelf (UKCS). The Oil and Gas Authority (OGA) estimates that a further 10 to 20 billion boe could still be recovered from the basin.
Since 2014, UKCS production has increased by 20%, driven by some major incremental projects in existing fields and more than 40 new field starts during this period. Having a steady stream of new field start-ups is crucial to ensuring that this remaining potential is achieved, although we recognise concerns expressed by many about climate change and the need to balance meeting domestic energy supplies and supporting jobs in the energy sector with decarbonisation and ensuring an economic return for future extraction. It is crucial that the UKCS maintains its competitive investment package to attract the investment required.
In September 2019, the industry published its Roadmap 2035: A blueprint to net zero, which outlines how it can continue to help meet the UK’s energy needs whilst making a positive contribution towards the UK’s 2050 net zero emissions ambition.
Key economic parameters
Oil and gas prices
Boom and bust cycles are the norm in the energy markets. Throughout the years, the nominal price of oil has fluctuated significantly, reaching as low as $3 per barrel in the 1970s and as high as $143 per barrel in July 2008. The oil price is affected by many factors, all of which are global in nature, and reach from supply and demand fundamentals to the strength of the US Dollar (all oil is traded in US Dollars) and to geopolitical stability. Global demand for oil and gas has been steadily rising since the 1970s and has nearly doubled since then[footnote 2]. Strong economic growth particularly in fast-growing developing economies like China and India has been a major contributor to increasing levels of demand.
The United States was, until 2010, the world’s largest net importer of crude oil, which was a significant contributor to the steady increase in prices until then. Since 2011, the growth of US tight oil (often referred to as “US shale”) has reduced the reliance of the United States on imports by over one third. Together with a slow-down in China’s rapid economic growth and more efficient energy use overall, this caused prices to fall rapidly towards the end of 2015 and throughout 2016. During 2016, dated Brent oil price was at its lowest nominal level since 2004 at an average $44 per barrel, with a trough of $31 per barrel in January 2016[footnote 3].
Figure 1: Brent Spot Price in US$ (nominal) - annual and monthly average crude oil prices
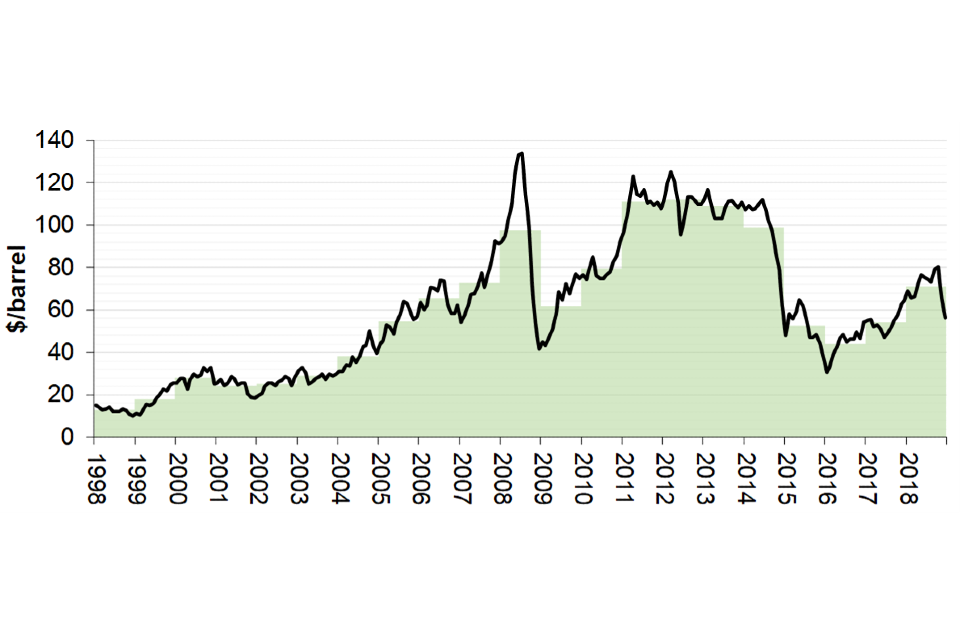
Brent Spot Price (nominal) - Annual and monthly average crude oil prices (US dollars)
Figure 2: Brent Spot Price in UK£ (nominal) - Annual and monthly average crude oil prices
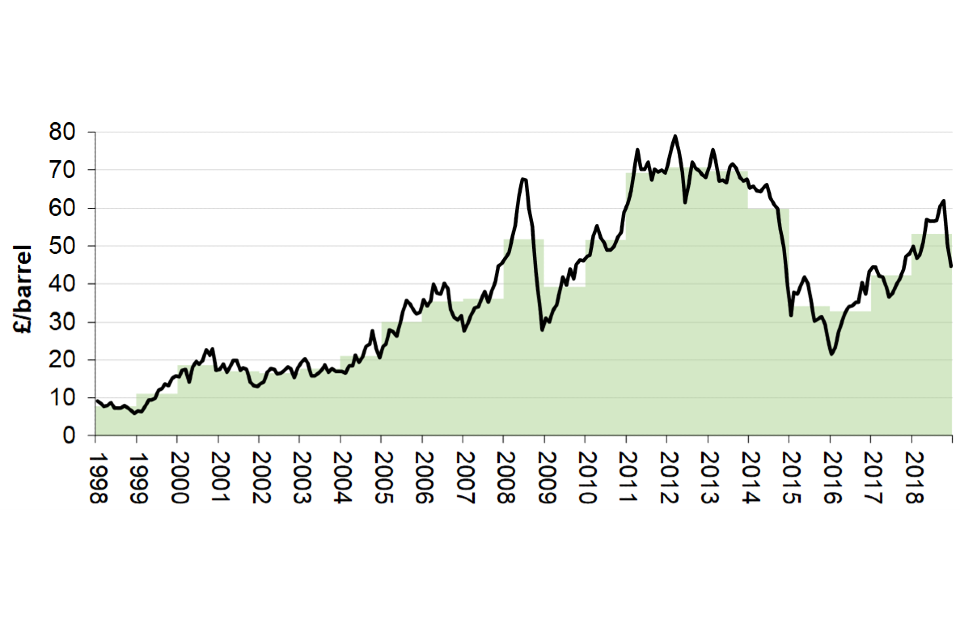
Brent Spot Price (nominal) - Annual and monthly average crude oil prices (UK pound sterling)
Sources: Monthly average dollar Brent oil price, World Bank Commodity Price Data (The Pink Sheet)
Monthly average £/$ exchange rate Bank of England series XUMAUSS.
The UK benefits from diverse and flexible sources of gas supply. The UK consistently has one of the largest and most liquid gas markets in Europe, with extensive import infrastructure and a diverse range of gas supply sources: pipelines from Norway, Belgium and the Netherlands, domestic production, and Liquefied Natural Gas (LNG) terminals to bring in gas from around the world.
Gas markets are largely regional in nature, due to infrastructure and transportation limitations. Gas is traded on the UK’s National Balancing Point (NBP) virtual trading hub, which is the second-most liquid trading hub in Europe, behind only the Netherlands’ TTF hub[footnote 4]. There is no price differentiation based on origin or source type of gas. Although there has been a trend away from long-term contracts, these still have a role in attracting both piped gas and LNG to the UK market.
Global gas price signals determine LNG trade flows and the UK is well placed to take advantage of a growing global market in LNG, with around a quarter of total EU LNG capacity and a utilisation rate of around 15% in 2017. Imports of LNG in 2018 increased by 6.4% on the previous year, accounting for 15% of the UK’s total imports in 2018. Global liquefaction capacity is expected to continue its growth, increasing by 13% between 2018 and 2020. The majority of the liquefaction capacity that is currently under construction is located in the US and Australia. US LNG has many of the characteristics – destination flexibility, hub-priced pricing and spot availability – that are transforming the wider gas market.
The development of a global and flexible LNG market is a positive sign for the improvement of natural gas security of supply.
Figure 3. Gas Spot Price (nominal): annual and monthly average natural gas prices
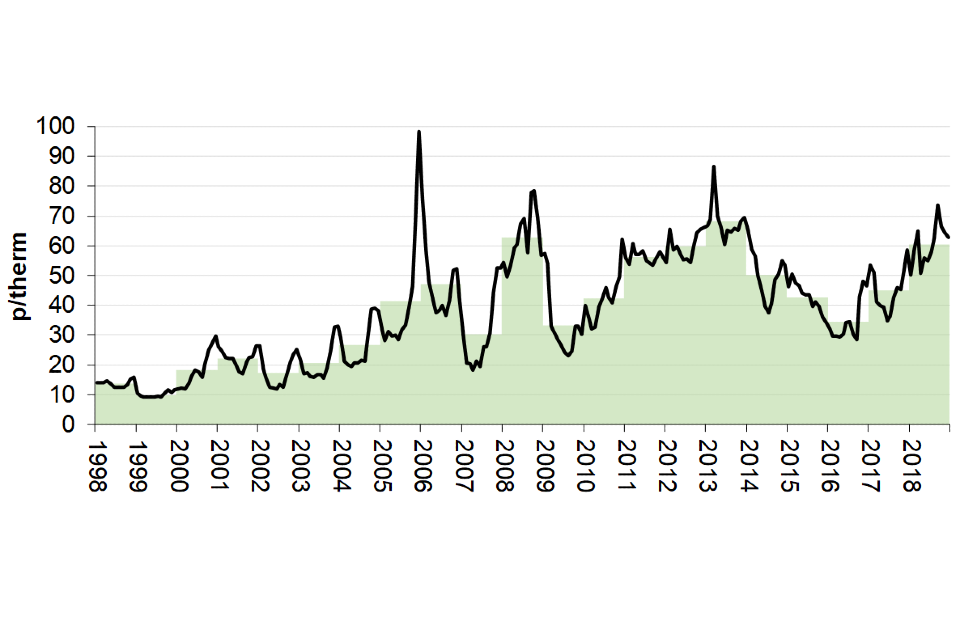
Gas Spot Price (nominal): annual and monthly average natural gas prices
Source: OGA from various sources.
Production and trade
Production on the UKCS is currently split roughly 60:40 between oil production and natural gas production (Figure 4).
Figure 4. UK oil and net gas production[footnote 5]
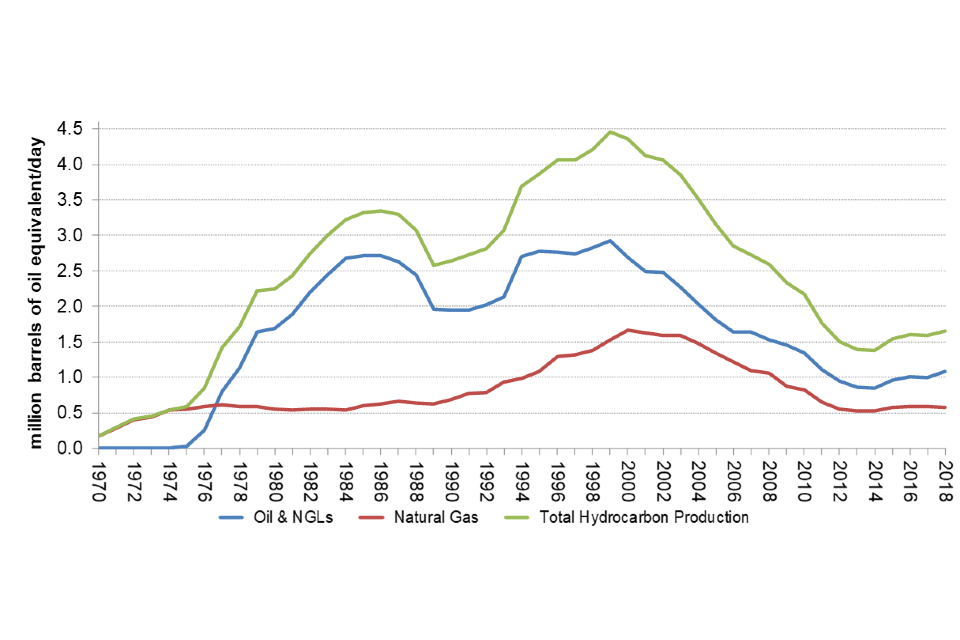
UK oil and net gas production 2000 to 2018
Source: OGA.
Combined oil and gas production volumes from the UKCS peaked in 1999 at 4.6 million boe/day and declined to 1.4 million boe/day by 2014 – a consequence of natural reservoir decline in existing fields combined with fewer/smaller developments. Between 2014 and 2018, however, this trend was reversed and production on the UKCS increased by 20% to 1.7 million boe/day.
These tables show BEIS data on the volume and value of UK oil and gas trade and production in recent years.
Table 1. Volume and value of gross UK exports and imports, net exports and UK production of oil and gas
1a. Volume of gross UK export (million tonnes of oil equivalent)
| Year | Oil | Natural gas | Oil and gas |
|---|---|---|---|
| 2014 | 33.8 | 11.0 | 44.8 |
| 2015 | 36.9 | 13.7 | 50.6 |
| 2016 | 38.2 | 10.1 | 48.2 |
| 2017 | 42.0 | 10.8 | 52.8 |
| 2018 | 48.8 | 7.2 | 56.0 |
1b. Value of gross UK exports (£ million)
| Year | Oil | Natural gas | Oil and gas |
|---|---|---|---|
| 2014 | 14,625 | 2,000 | 16,625 |
| 2015 | 9,915 | 2,310 | 12,225 |
| 2016 | 9,200 | 1,355 | 10,555 |
| 2017 | 12,815 | 1,830 | 14,645 |
| 2018 | 18,605 | 1,815 | 20,420 |
1c. Volume of gross UK imports (million tonnes of oil equivalent)
| Year | Oil | Natural gas | Oil and gas |
|---|---|---|---|
| 2014 | 58.7 | 42.0 | 100.7 |
| 2015 | 55.4 | 43.1 | 98.5 |
| 2016 | 53.5 | 45.5 | 99.0 |
| 2017 | 58.3 | 44.6 | 102.8 |
| 2018 | 57.4 | 44.5 | 101.9 |
1d. Value of gross UK imports (£ million)
| Year | Oil | Natural gas | Oil and gas |
|---|---|---|---|
| 2014 | 24,335 | 7,635 | 31,970 |
| 2015 | 12,645 | 6,990 | 19,635 |
| 2016 | 11,200 | 6,085 | 17,285 |
| 2017 | 16,095 | 7,520 | 23,615 |
| 2018 | 20,580 | 10,825 | 31,405 |
1e. Volume of net UK exports (million tonnes of oil equivalent)
| Year | Oil | Natural gas | Oil and gas |
|---|---|---|---|
| 2014 | -24.9 | -31.0 | -55.9 |
| 2015 | -18.5 | -29.4 | -48.0 |
| 2016 | -15.3 | -35.5 | -50.7 |
| 2017 | -16.3 | -33.8 | -50.1 |
| 2018 | -8.6 | -37.3 | -45.9 |
1f. Value of net UK exports (£ million)
| Year | Oil | Natural gas | Oil and gas |
|---|---|---|---|
| 2014 | -9,710 | -5,635 | -15,345 |
| 2015 | -2,730 | -4,680 | -7,410 |
| 2016 | -2,000 | -4,730 | -6,730 |
| 2017 | -3,280 | -5,690 | -8,970 |
| 2018 | -1,975 | -9,010 | -10, 985 |
1g. Volume of UK production (million tonnes of oil equivalent)
| Year | Oil | Natural gas | Oil and gas |
|---|---|---|---|
| 2014 | 43.7 | 31.9 | 75.6 |
| 2015 | 49.5 | 34.5 | 84.0 |
| 2016 | 52.0 | 35.6 | 87.5 |
| 2017 | 51.1 | 35.8 | 86.9 |
| 2018 | 55.7 | 34.3 | 90.0 |
1h. Value of UK production (£ million)
| Year | Oil | Natural gas | Oil and gas |
|---|---|---|---|
| 2014 | 18,135 | 6,315 | 24,450 |
| 2015 | 12,985 | 7,035 | 20,020 |
| 2016 | 12,385 | 5,315 | 17,700 |
| 2017 | 15,590 | 6,300 | 21,890 |
| 2018 | 21,285 | 6,900 | 28,185 |
Source: Digest of UK Energy Statistics 2019 (BEIS, July 2019)
Domestic production of oil and gas continues to supply around 60% of UK hydrocarbon consumption. Net exports (imports) since 1998 are illustrated in Figure 5.
Figure 5. Volume and value of net UK oil and gas exports (imports)
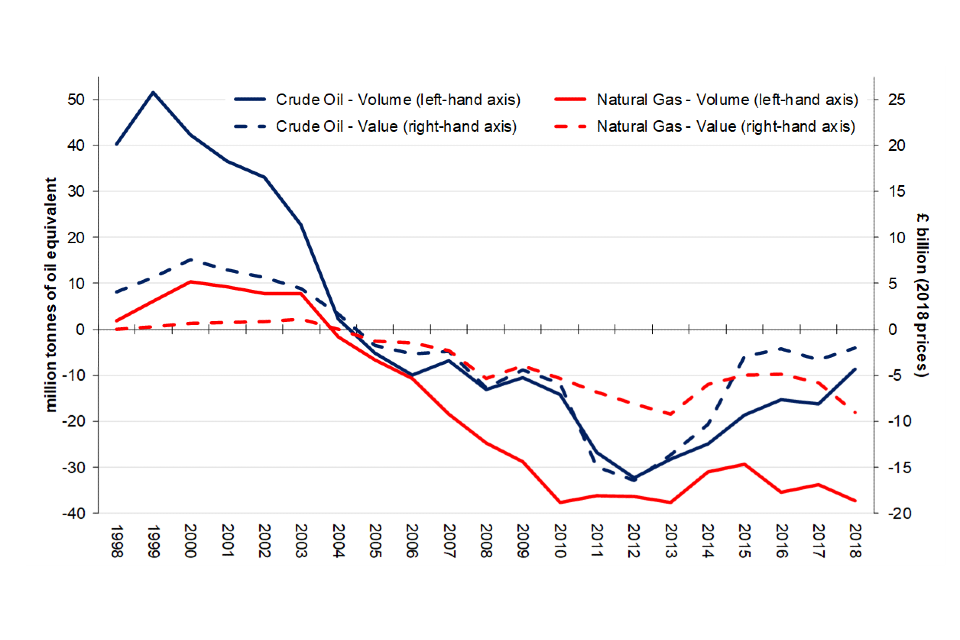
Volume and value of net UK oil and gas exports (imports) 1998 to 2018
Source: BEIS. Digest of UK Energy Statistics 2019
Figures 6 and 7 show, respectively, the destinations of UK oil production and the sources of UK oil supply. Most UK oil production is exported and most UK refinery supply comes from imports.
Figure 6: Destinations of UK oil production (crude oil plus NGLs), 2018
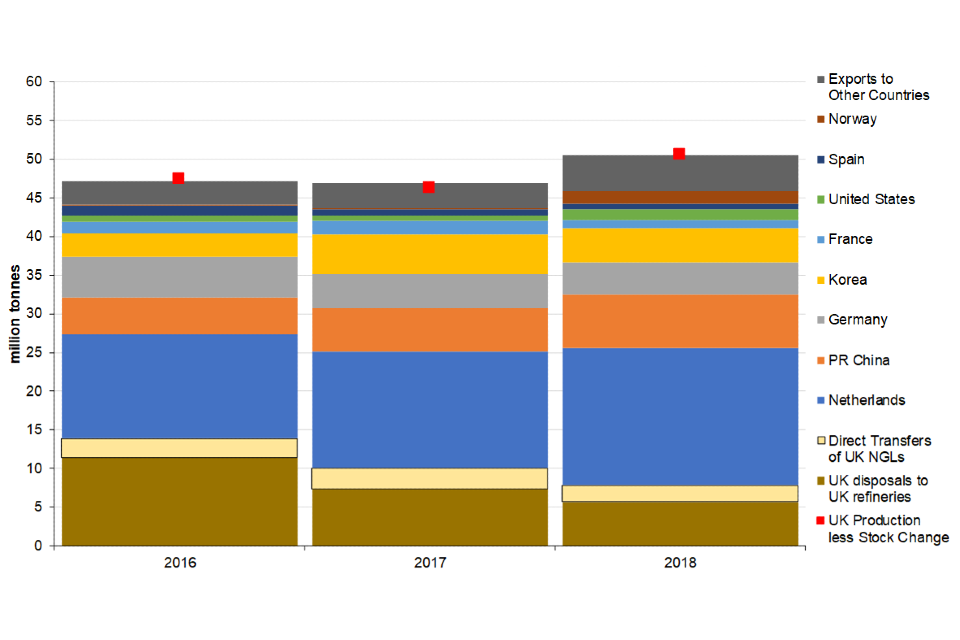
Destinations of UK crude oil production 2016 to 2018
Figure 7: UK refineries’ sources of oil (crude oil plus NGLs), 2018
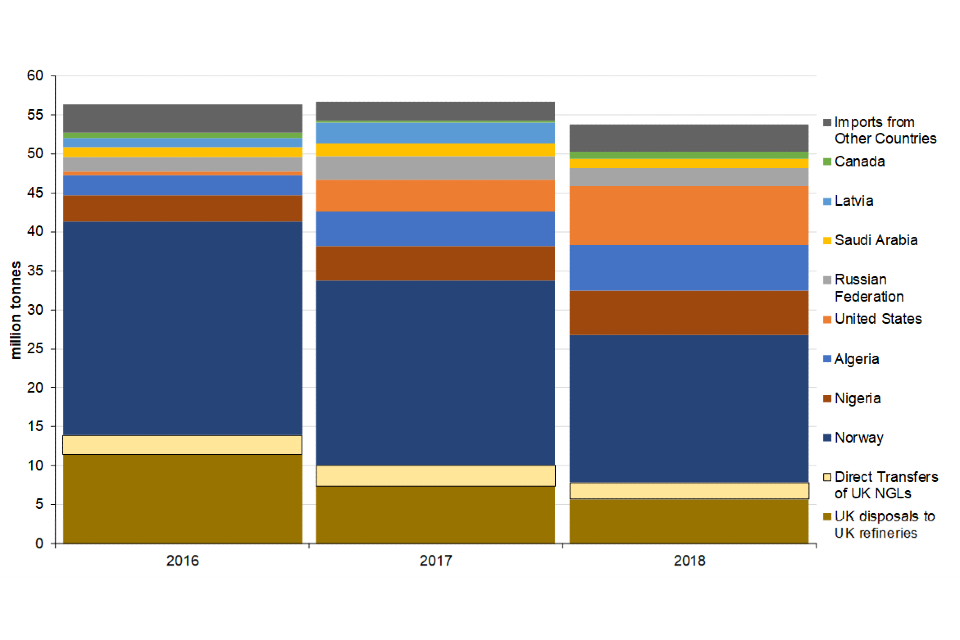
Sources of UK crude oil supply 2016 to 2018
Sources: BEIS DUKES 2019, BEIS, July 2019, and Energy Trends, November 2019
Figures 6 and 7 show the sources of UK natural gas supply. The same data are included in both charts, the difference being the first shows annual data while the second shows monthly data, revealing the strong seasonal changes in levels of demand and sources of supply. Even on an annual basis the sources of supply can change quickly and significantly.
Figure 8. Sources of annual UK gas supply
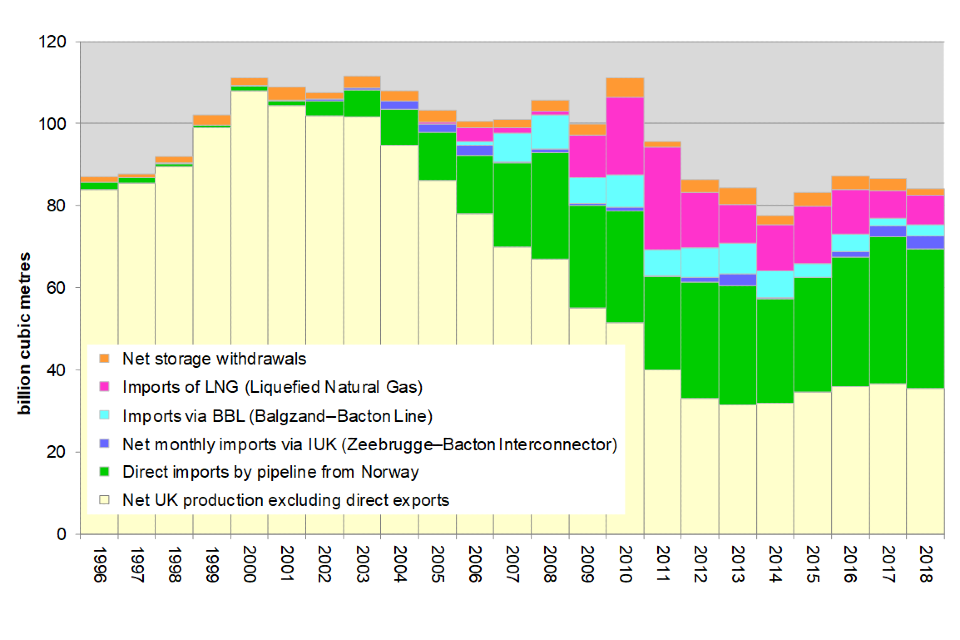
Sources of annual UK gas supply 1996 to 2018
Source: Energy Trends Tables 4.2 and 4.3, September 2019.
Figure 9. Sources of monthly UK gas supply
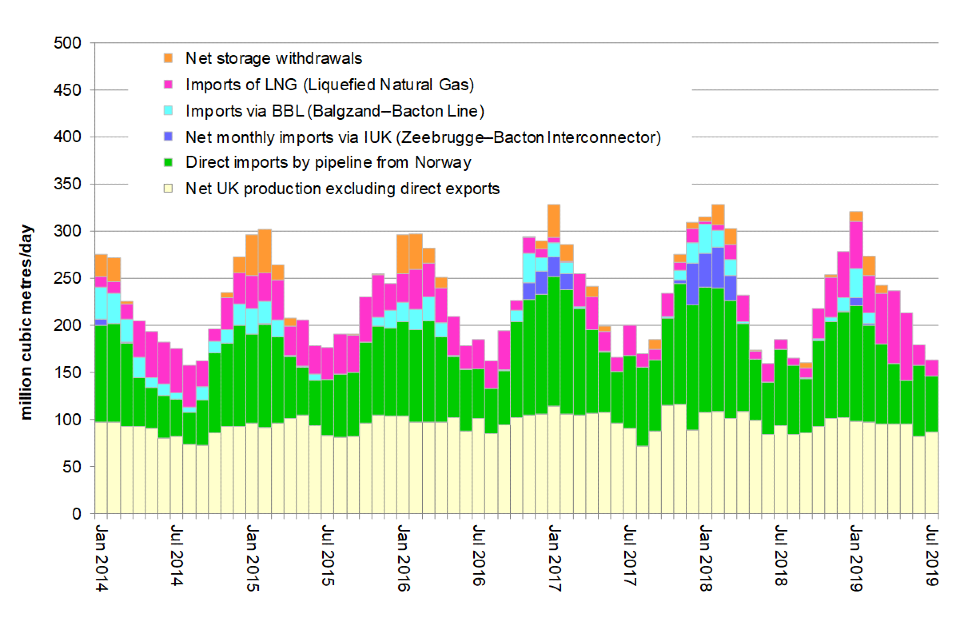
Sources of monthly UK gas supply 2014 to 2019
Source: Energy Trends Tables 4.2 and 4.3, September 2019.
Figure 10 illustrates the long-term decline and more recent growth in UK oil production since 2000.
Figure 10. UK crude oil production by start-up year of field
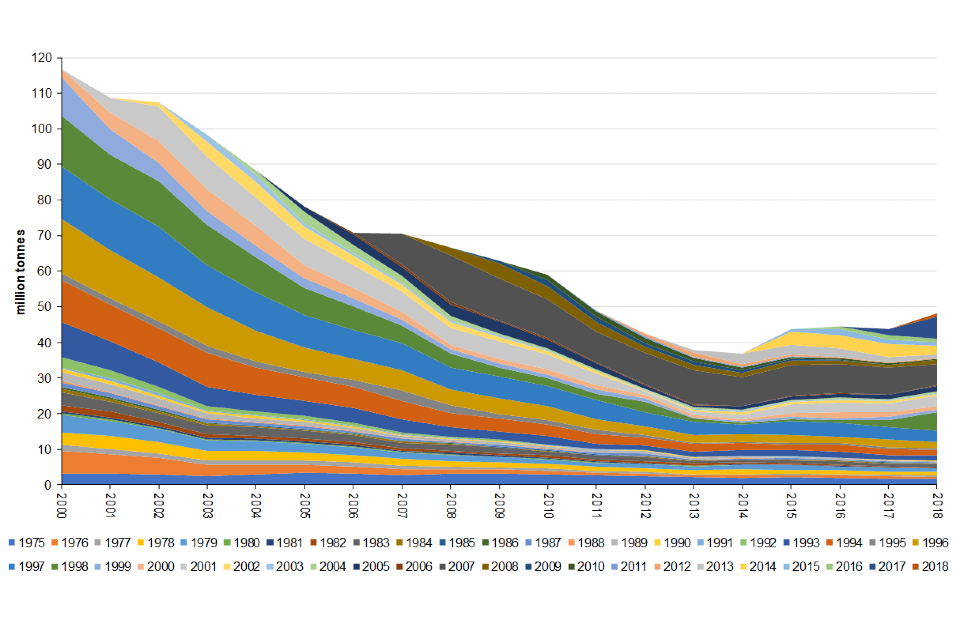
UK crude oil production by start-up year of field 2000 to 2018
Source: OGA Petroleum Production Reporting System.
The UK is still a significant oil and gas producer, being responsible for 1.1% of global output of oil and gas in 2018, when the UK was the 21st largest producer of oil and gas (19th largest of oil, 18th largest of gas)[footnote 6].
Cost environment
Total upstream expenditure peaked in 2014 at £29.3 billion in 2018 prices and fell to £14.3 billion in 2018. The impact of the fall in oil and gas prices put industry under immense pressure to reduce expenditure, both through readjusting budgets and rationalising expenditure.
Figure 11. Upstream oil and gas expenditure, 2000–2018
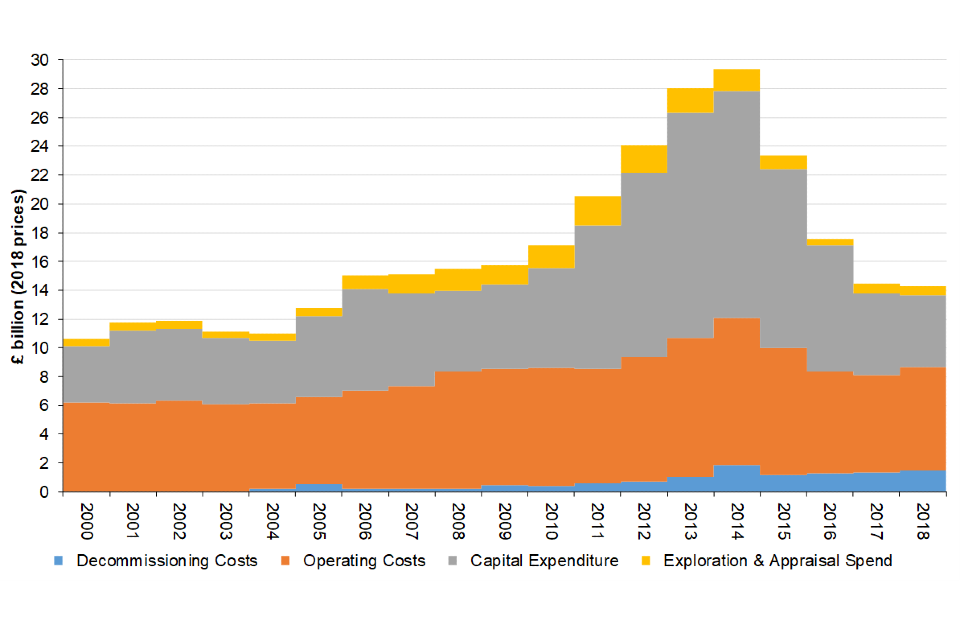
Upstream oil and gas expenditure, 2000 to 2018
Source: OGA. UK Continental Shelf income and expenditure.
Government revenues
Table 2 includes estimates of the amounts of ring fence corporation tax (RFCT) plus supplementary charge (SC) paid annually in respect of UK upstream oil and gas production activities, that is, the exploration and productions stage (described for simplicity as “offshore” CT), and of petroleum revenue tax (PRT). UK government accounts are compiled on a financial year basis and the figures reported are consistent with annual totals reported in them on a cash basis.
In addition to the cash receipts series published by HMRC that is tabulated below, tax receipts are also reported by the ONS on an accruals basis. The accruals basis shows when the tax liability arises, that is, it matches the taxes arising to taxable income as it is earned. There is usually a timing difference between when the tax liability arises and when it is paid. Tax is usually paid after the liability arises so the tax cash payments in one time period may not match the tax liability for the same period. For example, a tax liability of £120 million may arise in one tax year (£120 million recorded on an accruals basis); this may be paid in 3 equal instalments, 2 in the same tax year (£80 million recorded that year on a cash basis) with one final instalment the next tax year (£40 million recorded in the next tax year on a cash basis). Over a longer timeframe, the same amounts are captured by these 2 different mechanisms of recording payments, but in the short term there will be a mismatch in amounts. This results in different series being published for corporation tax receipts/repayments. Table 2 below therefore also includes receipts on an accruals basis.
Table 2. UK government revenues from upstream oil and gas
Cash in £ million by calendar year
| Year | Total Corporation Tax | Of which offshore | Petroleum Revenue Tax | Total upstream oil and gas | Total HMRC receipts | Upstream oil and gas share of total (%) |
|---|---|---|---|---|---|---|
| 2014 | 39,824 | 2,503 | 569 | 3,072 | 505,436 | 0.6% |
| 2015 | 43,323 | 937 | -553 | 384 | 527,302 | 0.1% |
| 2016 | 45,189 | 355 | -769 | -414 | 553,314 | -0.1% |
| 2017 | 51,694 | 1,293 | -635 | 658 | 589,322 | 0.1% |
| 2018 | 53,737 | 1,861 | -817 | 1,044 | 611,431 | 0.2% |
Cash in £ million by financial year (April to March)
| Year | Total Corporation Tax | Of which offshore | Petroleum Revenue Tax | Total upstream oil and gas | Total HMRC receipts | Upstream oil and gas share of total (%) |
|---|---|---|---|---|---|---|
| 2014-15 | 41,132 | 2,026 | 77 | 2,102 | 514,098 | 0.4% |
| 2015-16 | 42,897 | 560 | -562 | -2 | 532,794 | 0.0% |
| 2016-17 | 47,857 | 295 | -654 | -359 | 567,716 | -0.1% |
| 2017-18 | 52,086 | 1,757 | -569 | 1,188 | 591,648 | 0.2% |
| 2018-19 | 53,213 | 1,912 | -744 | 1,168 | 619,367 | 0.2% |
Accruals in £ million by calendar year (ONS)
| Year | Total Corporation Tax | Of which offshore | Petroleum Revenue Tax | Total upstream oil and gas | Total public sector taxes and NICS | Upstream oil and gas share of total (%) |
|---|---|---|---|---|---|---|
| 2014 | 43,414 | 2,072 | 568 | 2,640 | 598,912 | 0.4% |
| 2015 | 43,603 | 536 | -552 | -16 | 621,159 | 0.0% |
| 2016 | 51,661 | 340 | -768 | -428 | 657,332 | -0.1% |
| 2017 | 54,624 | 1,760 | -634 | 1,126 | 690,593 | 0.2% |
| 2018 | 56,547 | 1,912 | -817 | 1,095 | 715,521 | 0.2% |
Accruals in £ million by financial year (April to March)
| Year | Total Corporation Tax | Of which offshore | Petroleum Revenue Tax | Total upstream oil and gas | Total public sector taxes and NICS | Upstream oil and gas share of total (%) |
|---|---|---|---|---|---|---|
| 2014-15 | 44,090 | 1,544 | 77 | 1,621 | 606,359 | 0.3% |
| 2015-16 | 44,510 | 410 | -562 | -152 | 628,892 | 0.0% |
| 2016-17 | 53,281 | 622 | -653 | -31 | 670,741 | 0.0% |
| 2017-18 | 54,742 | 1,793 | -568 | 1,225 | 692,850 | 0.2% |
| 2018-19 | 57,592 | 1,867 | -744 | 1,123 | 728,873 | 0.2% |
Source: HM Revenue & Customs (HMRC), Tax Receipts and National Insurance Contributions for the UK, and ONS, Public sector current receipts: Appendix D.
In addition to taxation, the extractive sector in the UK pays relatively small amounts to government by way of licence fees and other levies. These payments are summarised later in this report.
The level of government revenues from taxes on production of oil and gas is dependent on rates of taxation and adjusted profitability which is driven by a combination of production volumes, commodity prices and cost levels. Historical data by financial year since 1976/77 on upstream oil and gas taxes, including petroleum licence fees, are shown in constant price terms in Figure 12.
Figure 12. Government revenues from UK oil and gas production
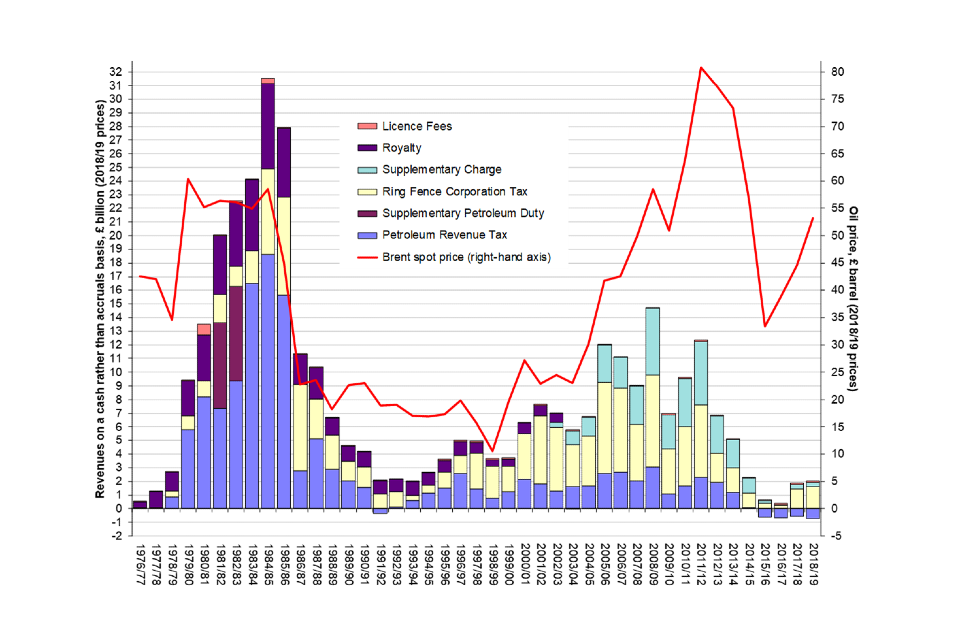
Government revenues from UK oil and gas production, 1976-1977 to 2018-2019
Source: Oil and Gas Authority (OGA), Government revenues from UK oil and gas production
The overall totals reflect both the combination of RFCT/SC and PRT and of net payments and receipts by individual companies. The overall net repayments reflect the low level of oil (and gas) prices and companies’ varying exposure across their portfolios to the four main phases of upstream activity (exploration, development, production and decommissioning). A few companies paid significant amounts, many paid nothing and some received significant repayments of tax paid in previous years. In future years, with the permanent zero-rating of PRT from the start of 2016, net PRT receipts will be negative, with the carry-back of largely decommissioning-related losses resulting in significant repayments of PRT paid in previous years. The overall totals reflect both the combination of RFCT/SC and PRT and the combination of net payments or receipts by individual companies.
Differences between reconciled EITI amounts and HMRC statistics
There can be differences between the cash totals reported above for RFCT/SC and PRT, based on published HMRC statistics, and the post-reconciliation totals reported in annual reconciliation reports.
These totals and the differences are given in the table showing “Differences between reconciled upstream oil and gas tax payments in EITI Reports and cash payments currently reported in HMRC statistics” on the OGA website. The main reason for the difference between the total of RFCT/SC reconciled for EITI and the total published in HMRC statistics are that HMRC statistics are, at least for recent years, provisional (prior to disaggregation and allocation between payments inside and outside the ring fence).
When oil and gas companies make corporation tax payments they are not obliged to inform HMRC whether such payments relate to RFCT/SC or mainstream CT. Since 2014, to assist HMRC in relation to EITI reporting, many companies do report the split of payments as they are made to HMRC. Once the tax payment deadline has passed and all tax instalments have been received, HMRC’s statistics team undertakes work to disaggregate these payments made for a group of companies and to re-allocate them into ring fence and non-ring fence payments. HMRC statistics are thus provisional and subject to change, often up to 18 months after the tax year has ended.
For PRT, the discrepancy is primarily the result of timing differences between payments and repayments being made and the date that they are recorded on HMRC’s systems.
Because corporation tax is levied on company level profits and companies can be engaged in both extractive and non-extractive activities, it is not possible to identify how much CT is paid by other extractive industries (that is those engaged in mining and quarrying). Estimates of the CT paid by the mining and quarrying sector are published annually by HM Revenue & Customs (HMRC) and include oil and gas and mining support service activities. They are on a liability basis for financial years rather than a cash basis for calendar years.
Reserves and forecasts
Full details of the assumptions underpinning forthcoming years in the Budget cycle relating to projected production, commodity prices and revenue forecasts are provided by the independent Office for Budget Responsibility.
Figure 13. Recoverable UK oil and gas reserves discovered and produced
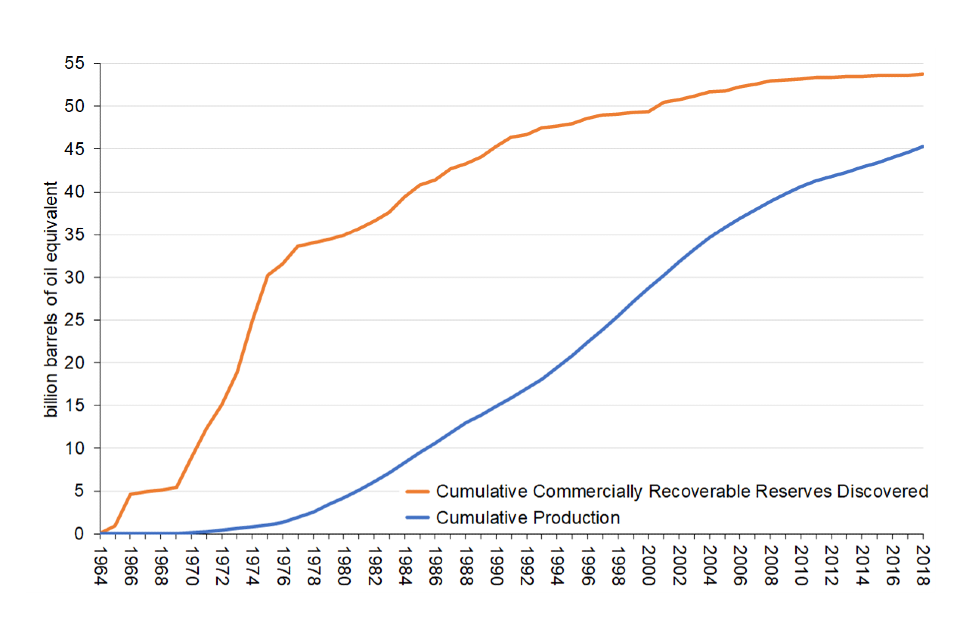
Recoverable UK oil and gas reserves discovered and produced 1964 to 2018
Source: Data from Wood Mackenzie, Upstream data tool
The path of future production is uncertain and, consequently, forecasts of future production rates vary. Currently the OGA’s central projection is for flat production in 2019 followed by both oil and gas declining at a rate of 5% a year after 2020 (Figure 14).
Figure 14. OGA projections of future UK oil and gas production
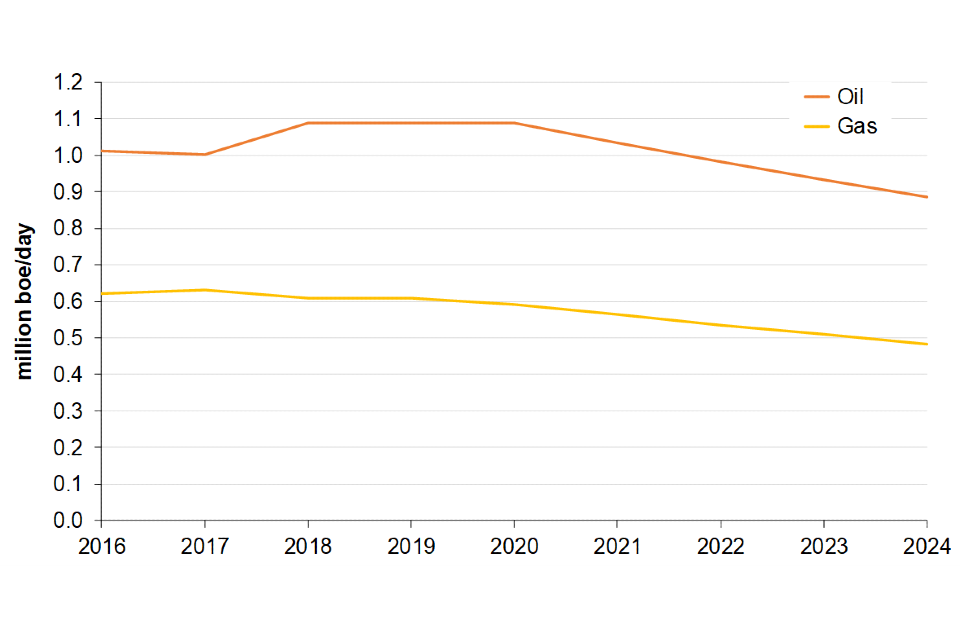
OGA projections of future UK oil and gas production 2016 to 2024
Source: OGA, Projections of UK Oil and Gas Production and Expenditure, October 2019
Employment
In addition to direct employment in oil and gas companies there is a significant number of jobs in companies providing support activities. Official estimates for both are tabulated below:
Table 3. Direct employment (Great Britain not United Kingdom)
| Thousands | 2014 | 2015 | 2016 | 2017 | 2018 |
|---|---|---|---|---|---|
| Oil and gas extraction | 16.6 | 15.7 | 15.2 | 12.2 | 12.8 |
| Support activities for petroleum and natural gas extraction | 25.1 | 22.4 | 18.8 | 18.4 | 18.1 |
| Oil and gas extraction and support services | 41.7 | 38.1 | 34.0 | 30.6 | 30.9 |
Source: ONS. Business Register and Employment Survey (Table 2a)
Additional information on employment in the UK oil and gas industry, including the UK supply chain, is published by OGUK. This information includes estimates of the indirect and induced jobs that depend on the UK’s upstream oil and gas sector. Note that the direct employment estimates reported can differ from the ONS estimates.
Table 4. Total employment supported by the UK upstream oil and gas industry
Estimates of employment supported by the offshore oil and gas industry
| Type | 2014 | 2015 | 2016 | 2017 | 2018 | 2019e |
|---|---|---|---|---|---|---|
| Direct | 41,300 | 37,300 | 35,600 | 31,400 | 30,400 | 30,600 |
| Indirect | 206,100 | 169,500 | 155,100 | 124,300 | 116,100 | 121,000 |
| Induced | 216,500 | 180,200 | 136,200 | 118,100 | 113,400 | 117,500 |
| Total employment | 463,900 | 387,000 | 326,900 | 273,800 | 259,900 | 269,100 |
| Direct plus indirect | 247,400 | 206,800 | 190,700 | 155,700 | 146,500 | 151,600 |
| Indirect % of direct plus indirect | 83% | 82% | 81% | 80% | 79% | 80% |
where:
- direct - those employed by companies operating in the extraction of oil and gas and associated
- indirect - employment as a result of supply chain effects caused by oil and gas sector activity
- induced - employment supported by the expenditure of income from the oil and gas sector
Source: Figure 1 in Workforce Report 2019, OGUK, August 2019.
Shale gas
Research by the BGS indicates that there are potentially large volumes of shale gas beneath the UK. Further exploration is required before the full extent of these resources is known and the amount of gas that is technically and commercially recoverable can be estimated.
UK licence and fiscal terms do not generally differentiate between conventional and unconventional hydrocarbon activities. For example, the Onshore Allowance (an allowance against the SC which ensures that otherwise economic developments are not uncommercial) is applicable to both new conventional oil and gas as well as to shale gas developments. As PEDLs do not grant automatic rights to operations such as drilling or hydraulic fracturing, any company looking to develop shale will also need to obtain all necessary permissions, like planning and environmental permits.
To date, a range of measures specific to hydraulic fracturing and the shale industry have been put in place to ensure that exploration is safe and environmentally sound. The Infrastructure Act 2015 specifies 13 conditions that need to be met before a hydraulic fracturing consent will be issued, including public notification and a scheme to provide financial or other benefit for the local area. The government has also put in place regulations which ensure that high-volume hydraulic fracturing cannot take place within 1,200 metres beneath the surface of National Parks, the Broads, Areas of Outstanding Natural Beauty, World Heritage Sites and areas that are most vulnerable to groundwater pollution.
Following its analysis of hydraulic fracturing operations in 2018, the Oil and Gas Authority (OGA) has found that it is not currently possible to accurately predict the probability or magnitude of earthquakes linked to fracking operations. On this basis, and following the significant disturbance that has been caused to local people following seismic events in August 2019, caused by further operations at Preston New Road, Lancashire, on 2 November 2019 the BEIS Secretary of State announced a moratorium on fracking with immediate effect. On 4 November, ministers issued a Written Ministerial Statement that sets out the government’s position – namely that government will no longer be supporting further hydraulic fracturing activities in England at this time. The statement sets out that there will be a presumption against ministers issuing further Hydraulic Fracturing Consents, which would only be altered if compelling new evidence comes to light.
Legal framework and licensing
The Petroleum Act 1998 vests rights to oil and gas (petroleum) resources in England and on the UK Continental Shelf (UKCS) in the Crown. The Act gives the OGA powers to grant licences that confer exclusive rights to “search and bore for and get” petroleum. Each of these licences confers such rights over a limited area and for a limited period. There are separate licensing regimes for offshore (seaward) and onshore (landward) areas, with distinct licences in each[footnote 7].
Licences are generally awarded in periodic “rounds” subject to a requirement that the holder will make annual payments (known as “licence rental fees”). These payments are calculated on the basis of the area under licence and incorporate an escalating scale of pre-determined rates per square kilometre. This is to encourage licensee companies to relinquish acreage not undergoing productive activity, thus making it available for relicensing to other potential interested applicants. The vast majority of licence rental fees come from offshore licensing. Receipts of petroleum licences under the Petroleum Act 1998 are collected by the OGA for payment to the Consolidated Fund.
Licensing in Scotland and Wales is now devolved. The Petroleum (Production) Act (Northern Ireland) 1964 vests the property in oil and gas in Northern Ireland, with certain exceptions, in the Department for the Economy (DfE). Northern Ireland’s offshore waters are subject to the same licensing regime as the rest of the continental shelf.
The OGA publishes oil and gas licences and licence reports. The OGA also publishes offshore and onshore maps which are available for nil cost; these interactive maps allow users to find the co-ordinates of each licence and download at nil cost, individual licences. The Northern Ireland DfE issues separate onshore licences independently of the OGA and publishes current licences and a map showing licence areas.
Award and transfer of licences in Great Britain and on the UKCS
The OGA works to maximise economic recovery of the nation’s petroleum resources. The government has essential pre-requisites for licence applicants, such as requiring the would-be licensee to have a fixed place of business within the UK.
Licences are awarded during regular competitive onshore and offshore licensing rounds once the OGA has been satisfied that the licensee has met the necessary technical and financial requirements[footnote 8]. This method of licensing aims to optimise recovery of the UK’s remaining petroleum resources. Out-of-round licence applications are possible but only in exceptional circumstances. Further Information on licensing activity is available on the OGA website. Licensing rounds are announced in the Official Journal of the European Union and assessed against a publicly announced set of criteria[footnote 9].
Each licence takes the form of a deed, which binds the licensee (either a single company or several working together and bound under joint and several liability) to obey the licence conditions regardless of whether or not they are using the licence at any given moment. The OGA (and DECC previously) regulates the transfer of licence interests in order to enforce its policy objectives. A company that is party to a licence may wish to sell its interest or a part of it, to another company. It requires the OGA’s permission to do so[footnote 10].
Licence applications and interests attract fees and charges payable by the applicant or licensee. Each licence carries an annual charge, commonly called a rental. Rentals serve the double purpose of incentivising licensees to work their whole licensed areas and to surrender acreage they do not intend to exploit. Rentals are due every year on the licence anniversary and are charged at a variable rate on each square kilometre that the licence covers at that date. The rates are set out in the licence document at award. Payments are made to the OGA only by licence administrators (typically operators, who recoup the payments from the licensees in proportion to their interests in each licence) so the reconciled amounts reported in Table 4 in the 2018 UK EITI Reconciliation and State of Industry Report do not reflect the extent to which payments to the OGA are spread between licensees.
Onshore licensing was devolved to the Scottish Government on 9 February 2018 and to the Welsh Government on 1 October 2018. Scottish licence information for onshore licences, onshore fields and onshore wells is published on the Marine Scotland website. In Wales licences are not yet published online, however information at petroleum licences can be requested, free of charge, by post or email. All licences and appropriate associated documents will be published online during 2020.
Licence conditions and types of licences
Each licence contains detailed terms and conditions, but not all regulation is contained in the licence. The Petroleum Act 1998 requires these conditions - called model clauses - to be published first in secondary legislation except in particular cases[footnote 11]. In recent years, the model clauses have also been set out in full in the licence document.
Production licences are valid for a sequence of periods, or terms. These terms mirror the typical life cycle of a field: exploration, appraisal and production, and provide that each licence will expire automatically at the end of each term, unless the licensee has sufficiently progressed to warrant a move into the next term. The duration of each term depends on the type of the licence.
The OGA publishes additional information about the different types of licences, their normal duration and different phases of the licensing lifecycle.
While landward licences confer the right to search for, bore and extract petroleum on areas under licence, they do not exempt the licensee from other legal or regulatory requirements, including a need to obtain access rights from landowners or planning permission from relevant local authorities, or to conform to health and safety regulations.
In Northern Ireland, there is only one type of petroleum licence, this has broadly similar terms and conditions to onshore Petroleum Exploration and Development Licences (PEDLs) in Great Britain but also some differences.
The oil and gas tax regime
Introduction
As the UK’s oil and gas industry has developed over the last 40 years, successive governments have developed a tax regime designed to ensure that the nation receives a fair share of the profits from the exploitation of its oil and gas resources. At the same time, the regime aims to support maximising the economic recovery of the UK’s remaining hydrocarbon resources.
The fiscal regime which currently applies to oil and gas extractive activities comprised 3 separate taxes: Petroleum Revenue Tax (PRT), Ring Fence Corporation Tax (RFCT) and the Supplementary Charge (SC).
The tax regimes
Petroleum Revenue Tax (PRT)
PRT is a tax on oil and gas production from the UK and UKCS. It is a field-based tax, which means that the profits from individual oil fields are calculated and subjected to tax separately. Companies do not aggregate their profits from different fields and cannot normally set off losses from one field against profits from another. PRT was introduced by the Oil Taxation Act 1975 and was dis-applied in Finance Act 1993 for all fields given development consent on or after 16 March 1993. This means that fields that were given development consent after this date are not subject to PRT. The Chancellor announced at Budget 2016, that from 1 January 2016 the PRT rate would be permanently reduced to zero. However, it is important to note that PRT has not been abolished. Companies will still have to record and declare their profits and may be able to claim tax refunds for previously paid PRT where they make net losses after this date.
Despite the fact that PRT has been zero rated, it is possible that some companies may still make payments of PRT, for example where a payment is made to settle a previous year’s liability, or there is an adjustment to the amount of tax due from previous years.
Advance PRT Payments
Advance Petroleum Revenue Tax (APRT) was a temporary tax payable for periods from 1 January 1983 to 31 December 1986. The change was in effect a means of accelerating PRT payments.
Although APRT is no longer chargeable, repayments may arise due to the carry back of losses to periods in which APRT paid was set against a PRT liability. For practical purposes APRT repayments are included within the PRT figures in EITI reconciliation reports.
Ring Fence Corporation Tax (RFCT)
RFCT is a tax charged on the profits a company earns from carrying out oil and gas extraction activities in the UK and UKCS. This can include exploration, development and production activities. The profits chargeable to RFCT are calculated in the same way as for mainstream CT, but with some different rules relating to certain allowances, interest and transfer pricing. RFCT is charged at the company level, unlike PRT which was charged at the field level. This means that where a company has several different oil fields, it aggregates the profits from all those fields, and where any of the fields makes a loss, that loss can be set against profits from another field. The total profit across all fields in which a company operates is then charged to RFCT.
The ring fence separates the upstream UK oil and gas related activities of a company from any other activities of the company. It was introduced in the Oil Taxation Act 1975, and it means that if a company also carries on other activities which are not related to oil and gas extraction (this could include downstream oil and gas activity such as oil refining, or other completely separate activities), it will pay mainstream corporation tax (CT) on the profits of those other activities. Profits in the ring fence are taxed at 30%. This is significantly higher than the main rate of CT. If a company makes a loss on non-ring fence activities, it cannot set that loss against its ring fence profits (ring fence losses can be set against non-ring fence profits).
If a company makes a small profit (less than £300,000) on its ring fence activities, it pays tax at the small profits rate of 19% on those profits. If its profits are between £300,000 and £1,500,000 it can claim Marginal Relief, to remove the cliff-edge between 19% and 30% as soon as its profits are above £300,000.
Supplementary Charge (SC)
SC is an additional tax on a company’s adjusted ring fence profits. It was introduced in 2002. Like RFCT it is charged at the company level. The starting point for calculating the SC is the company’s profits subject to RFCT. These profits are then adjusted to remove any finance costs, which are not allowed as a deduction for SC purposes. The company may, however, be able to reduce its profits subject to the SC by virtue of certain allowances: the Investment Allowance and Cluster Area Allowance, and the Onshore Allowance, which are outlined below. The company’s adjusted ring fence profits are then charged to SC at a rate of 10%.
Summary of rates
- PRT – 0%
- RFCT – 30%
- SC – 10%
Interaction
PRT is an allowable deduction in calculating profits subject to RFCT and SC. Equally, any refund of PRT is a taxable receipt for RFCT and SC purposes. RFCT and SC are charged on the same profit base, so neither is allowable as a deduction in calculating the profits chargeable to the other.
This means that the overall marginal tax rate in 2018 was 40%. Table 4 provides an example of this.
Table 5. Illustrative tax calculation
| Tax | PRT or non-PRT liable field |
|---|---|
| Profit | £1,000 |
| PRT at 0% | £0 |
| Profits after PRT | £1,000 |
| RFCT at 30% | £300 |
| SC at 10% | £100 |
| Total tax (PRT+RFCT+SC) | (£400) |
| Profit after tax | £600 |
| Tax as a % of pre-tax profit | 40% |
There have been numerous changes to the tax rates for PRT, RFCT and SC. PRT peaked at 75%, was reduced to 50% by Finance Act 1993, and as noted above, was permanently zero-rated at Budget 2016. Mainstream CT rates have been reduced substantially since 2008, but the RFCT rate has remained at 30%, creating a differential between the two. SC has varied between 10% and 32% since its introduction.
Previously, there was also a royalty levied at 12.5% of the value of petroleum which was generally measured as “well head value”. This was abolished for new fields in phases starting in 1983 with abolition in its entirety with effect from the end of 2002 as it distorted investment incentives. In addition, a Supplementary Petroleum Duty (SPD) was in place in 1981 and 1982.
Allowances
There are various allowances that apply to reduce the amount of PRT, RFCT or SC that a company has to pay.
PRT allowances
A number of allowances used to be available under the PRT regime to prevent an excessive PRT burden falling on smaller, more economically marginal fields. Oil Allowance was the only one that was still relevant to years immediately prior to 2016. Oil Allowance ensures that many small fields are effectively free from PRT. The available amounts are converted each chargeable period into a “cash equivalent” which then reduces the liability to PRT.
RFCT allowances
Capital allowances
Capital allowances are a feature of business taxation in the UK and apply to the mainstream CT regime (as well as to income tax). For CT purposes, the general rule is that capital expenditure is not allowed as a deduction for tax purposes. This means that profits chargeable to CT cannot be reduced by depreciation or similar expenses. The capital allowance regime exists to provide some relief for capital expenditure incurred.
There are specific rules and rates of allowances available for companies carrying on a ring fence trade. These allowances mean that in practice, virtually all capital expenditure incurred by oil and gas companies for the purposes of their ring fence trades will qualify.
There are 3 types of allowance which are commonly relevant for companies carrying on a ring fence trade. Research and Development Allowance (RDA), Mineral Extraction Allowance (MEA) and Plant and Machinery Allowances (PMA). RDA and MEA are primarily relevant to companies incurring capital expenditure on exploring for, appraising and gaining access to oil and gas during the pre-production phase. PMAs are available on capital expenditure on items of plant or machinery used in the ring fence trade. Mostly these are 100% First Year Allowances (FYAs), which allow the full amount of the expenditure to be written off for tax purposes in the accounting period in which the expenditure is incurred[footnote 12].
Ring Fence Expenditure Supplement (RFES)
RFES is designed to assist companies that do not yet have sufficient RFCT profits against which to set their exploration, appraisal and development costs. The RFES currently increases the value of unused expenditure carried forward from one accounting period to the next by a compound 10% a year for a maximum of 10 years (6 years prior to 2014). The company can elect which periods it wants to claim RFES for. They do not have to be consecutive years.
SC allowances
Cluster Area Allowance
Legislation in the Finance Act 2015 introduced a new Cluster Area Allowance, which aims to support large development projects in areas of high pressure and high temperature, encouraging exploration and appraisal in the surrounding area (or “cluster”). The allowance is generated by incurring capital expenditure, and certain types of operating and leasing expenditure within the cluster area. The value of the allowance is 62.5% of the qualifying expenditure incurred. Any allowance generated is carried forward year on year until it is activated. Allowance is activated by production income from the cluster area. Once the allowance has been activated it is set against profits subject to the SC, so that any such profits are only subject to RFCT at 30%. Cluster areas are determined as such by the OGA, and the only area determined to date is the Culzean Cluster Area in the Central North Sea.
Onshore Allowance
The Onshore Allowance was introduced in Finance Act 2014 to provide support for the early development of onshore oil and gas projects which were economic but not commercially viable at the prevailing tax rates. The onshore allowance covers both conventional and unconventional hydrocarbons and replaces all existing field allowances for onshore projects. The allowance works in a similar way to Cluster Area Allowance: it is generated by capital expenditure, in an amount equal to 75% of that capital expenditure. Once the allowance is activated by production income in relation to an onshore site, the allowance is used to reduce the adjusted ring fence profits which are subject to SC.
Investment Allowance
The existing system of offshore field allowances was replaced by a single Investment Allowance in Finance Act 2015. Similarly to the Cluster Area and Onshore Allowances, the Investment Allowance is generated by capital expenditure, and certain types of operating and leasing expenditure incurred in relation to a qualifying oil field. The amount of allowance generated is equal to 62.5% of qualifying expenditure. Investment Allowance is activated by production income from the field, unlike Cluster Area Allowances, which can be activated by income from any field in a designated cluster. Once activated, it is used to reduce the adjusted ring fence profits chargeable to the SC.
Losses
When a business makes a loss, it may be able to get relief for that loss through the tax system. Loss relief is not unique to the oil and gas regime: it is a feature of income tax, mainstream CT and other regimes too. Broadly, loss relief works by allowing a loss made in one period to be set off, in certain circumstances, against profits in the same or other periods.
PRT
PRT is a field-based tax, so loss relief is normally available only against profits from the same field. A loss can be carried back and set against profits of the field in previous periods, most recent period first, or carried forward to set against future profits, earliest period first. The loss is set against the profit before Oil Allowance. Only once, following cessation of production, all carry back and carry forward options are exhausted for that participator and there are no further profits against which the loss can be set, can the loss then be relieved against profits of earlier participators in the field. If there are still any unrelieved losses, they can be relieved against profits from another field.
Where a field has made an assessable profit, and paid tax in one period, and then has subsequently made a loss and the participator has chosen to carry the loss back, it could generate a repayment of tax.
RFCT
Where a company makes a loss for RFCT purposes, it can also choose how to treat that loss. The default position is that the loss is carried forward to set against future profits of the ring fence trade. However, the loss can also be set off against other (non-ring fence) profits arising in the year, or it can be carried back to set against the profits earned in previous years. Alternatively, where a company is part of a corporate group, it can surrender the loss to another company making a profit in the same period.
Under the normal rules, losses can be carried back only against profits arising in the previous year. However, these time limits are extended where the trade has ceased, in which case the loss may be carried back up to three years. For ring fence trades, this time limit may be extended further where the loss is incurred as a result of decommissioning expenditure. In such situations, the loss may be carried back to any period ending on or after 17 April 2002, regardless of whether trade has ceased.
SC
SC is calculated on the same basis as RFCT, but with adjustment for finance costs resulting in ‘adjusted ring fence profits’. However, there is no loss relief for SC per se. Rather, if a company makes a RFCT loss, and elects to carry it forward or backward, it will reduce the RFCT profits, and therefore the adjusted ring fence profit subject to SC of the subsequent or previous period will also be reduced, potentially to nil, generating a repayment of SC where SC has already been paid.
Variations in tax payments and repayments
The amount of tax paid by a company can vary year on year for a number of reasons. Perhaps most obviously, changes in tax rates will affect the amount of tax paid. In recent years, the rates of PRT and SC have both dropped, reducing the amount payable under these taxes. The level of profits (or losses) made by a company will also vary year on year. Factors such as capital expenditure incurred both on decommissioning and on exploration and investment can reduce profits, and variations in the oil price will have a substantial impact on trading receipts. Equally, as explained above, while a company may make a profit in a year, if it has a loss to set against that profit, the amount of tax payable may fall, or indeed lead to a repayment of tax.
Companies are charged PRT for chargeable periods of 6 months, running from 1 January to 30 June, and 1 July to 31 December. Companies’ profits are charged to RFCT and SC for accounting periods (APs). APs normally last for one year, although they can sometimes be shorter. Different companies have different APs, although commonly calendar or financial years are used.
PRT payments
PRT instalments are due based on the previous chargeable period. From 2016, as the PRT rate was reduced to nil, PRT payments were only made to true up previous year’s liabilities or instalments made prior to the announcement of PRT being zero-rated at the 2016 Budget.
RFCT/ SC payments
The rules for payment of RFCT and SC differ from the payment rules for mainstream CT. Payments of RFCT and SC be made in three equal instalments: 6 months and 13 days from the start of the AP, 3 months from the first instalment due date , and 14 days from the end of the AP. These payments are in addition to non-ring fence CT payments which will remain payable under the quarterly instalment payments (QIPS) regime.
Decommissioning
Decommissioning is an inherent cost of doing business in the UKCS. As a result, tax relief is given for decommissioning costs but not until they are incurred and the decommissioning is carried out. For accounting purposes a company is required to make an annual provision. However, this cannot be deducted for tax purposes as the cash has yet to be spent, and the decommissioning has not actually happened.
If decommissioning expenditure produces an overall loss for a year then, as explained above, the loss may be carried back against previous ring fence profits of that company, as far as 2002 for RFCT and SC, and almost indefinitely against field profits for PRT. Losses generated by decommissioning costs and carried back to be offset against previous profits are relieved at the RFCT and SC rates to which those earlier periods were subject to. However, SC relief is subject to a further restriction[footnote 13]. In most cases, the maximum rate of tax relief for PRT fields is 75%, but again is dependent on the prevailing tax rate in the period the losses are carried back to. The amount of relief available is limited to the taxable profits of the relevant field/company and in economic terms, represents a repayment of tax that has been overpaid through the profitable life of the company or field.
An estimate of the likely cost to the Exchequer, based on current estimates of decommissioning costs, is £16.8 billion[footnote 14].
Decommissioning Relief Deeds (DRDs)
In 2013, following extensive discussions with industry, the government introduced legislation giving it the statutory authority to sign contracts (DRDs) with companies operating in the UKCS. The aim of the DRD is to provide certainty over the availability of decommissioning tax relief for the purposes of putting up security against the risk of default.
The DRD works by guaranteeing the tax relief due on decommissioning expenditure, based on the relief available at Finance Act 2013 (FA13). It allows a company to claim a payment from the Exchequer if, as a result of changes to the tax system, the relief available to the company on its decommissioning expenditure is less than that which would have been due under the rules as at FA13 (however, this does not apply if the relief is less due to changes in tax rates.) The DRD will also pay out to a company that picks up the decommissioning liabilities of another company that has defaulted under its Petroleum Act 1988 obligations – for example if the company becomes insolvent – to ensure that the company incurring the default expenditure is able to get relief. This provides industry with certainty over the availability of decommissioning tax relief in future years and has unlocked additional investment capital in the UKCS by allowing companies to provide security for their decommissioning liabilities on a post-tax basis.
Each year the Treasury reports to Parliament the number of Deeds it has entered into that year, the total number of DRDs in force, the number and amounts of any payments made under the Deeds and an estimate of the maximum amount liable to be paid.
Looking ahead
The UK government is committed to having an oil and gas tax regime that is internationally competitive in order to encourage investment in the UK, while at the same time ensuring a fair return for the nation.
Finance Act 2019 introduced Transferable Tax History (TTH), which is designed to incentivise new investment and activity in the UKCS as it matures. TTH allows companies selling UKCS oil and gas fields to transfer some of their tax payment history to the buyers of those fields. The buyers are then able to set the costs of decommissioning the fields at the end of their lives against the TTH.
This levels the playing field between buyers and sellers of oil and gas fields, providing new investors in the UK Continental Shelf with certainty on the tax relief available for the decommissioning costs.
The OGA Levy
The OGA is a government-owned not-for-profit company largely funded by fees for specific activities and by a per-licence levy, known as the OGA Levy, on offshore licence holders apportioned between in-production (89%) and pre-production (11%) licence holders. The OGA Levy was introduced with effect from 1 October 2015. The OGA reports on Levy income in its annual accounts.
Payments to The Crown Estate (TCE) and Crown Estate Scotland (CES)
Oil and gas companies make payments to TCE and CES for pipeline rights.
Glossary of abbreviations
| Term | Definition |
| AP | Accounting Period |
| APRT | Advance Petroleum Revenue Tax |
| BEIS | Department for Business, Energy and Industrial Strategy |
| BGS | British Geological Survey |
| boe | Barrel(s) of oil equivalent |
| Brent | as applied to trading, the standard quality of oil in Europe and elsewhere comprising a blend of four North Sea crudes from the Brent, Ekofisk, Forties and Oseberg fields |
| CES | Crown Estate Scotland |
| CNS | Central North Sea |
| CT | Corporation Tax |
| DECC | Department of Energy & Climate Change (now part of BEIS) |
| DfE | Department for the Economy |
| DRD | Decommissioning Relief Deed |
| DUKES | Digest of UK Energy Statistics |
| EITI | Extractive Industries Transparency Initiative |
| EU | European Union |
| FA | Finance Act |
| FYAs | First Year Allowances |
| HMRC | HM Revenue and Customs |
| LNG | Liquefied Natural Gas |
| MEA | Mineral Extraction Allowance |
| NBP | National Balancing Point |
| NGLs | Natural Gas Liquids |
| OBR | Office for Budget Responsibility |
| OGA | Oil and Gas Authority |
| ONS | Office of National Statistics |
| PEDL | Petroleum Exploration and Development Licence |
| PMA | Plant and Machinery Allowances |
| PRT | Petroleum Revenue Tax |
| QIP | Quarterly Instalment Payment |
| RDA | Research and Development Allowance |
| RFCT | Ring Fence Corporation Tax |
| RFES | Ring Fence Expenditure Supplement |
| SC | Supplementary Charge |
| SPD | Supplementary Petroleum Duty |
| TCE | The Crown Estate |
| TTF | Tile Transfer Facility |
| TTH | Transferable Tax History |
| UK | United Kingdom |
| UKCS | UK Continental Shelf |
| US | United States |
-
Wytch Farm in Dorset, England, is the only substantial onshore field and is partly covered by a “seaward” licence; the drilling sites are onshore, but some of the wells extend under Poole Harbour. Wytch Farm is here treated as offshore. ↩
-
The International Energy Agency publishes annual booklets of its most useful statistics, including Key World Energy Statistics 2019. These show a steady increase of oil and gas consumption since the 1970s, see pp. 39-40. ↩
-
A more detailed analysis of the supply imbalance and cyclical adjustments currently being experienced by the oil and gas industry, see BP’s latest Statistical Review of World Energy. ↩
-
TTF, the Dutch Tile Transfer Facility, is the most liquid. See also the trading of NBP contracts on ICE ↩
-
Net natural gas production equals gross production less producers’ own use, that is the gas used in the course of production of oil and gas and therefore not available for sale to end users. The OGA publishes data relating to production of UK oil and gas, including production data for individual fields, production and expenditure projections and tables and charts on UKCS income and expenditure. ↩
-
This sub-section draws on the material on Licensing and consents on the OGA’s website to which reference may be made for further details. ↩
-
See for example the announcement of the 14th landward licensing round including the assessment criteria. ↩
-
For further details see the OGA Licence Assignments and details of current licences. ↩
-
Petroleum Licensing (Exploration and Production) (Landward Areas) Regulations 2014 ↩
-
Oil and gas: further information on these capital allowances: HMRC - Oil taxation manual: Capital allowances and Oil taxation manual: Corporation tax ring fence: first-year allowances for a ring fence trade ↩
-
For more information on the SC restriction please see the HMRC Oil taxation manual: the supplementary charge ↩
-
See Statistics of government revenues from UK oil and gas production July 2019, p.18 at Statistics of government revenues from UK oil and gas production ↩