Science Note - Emerging findings from studies of indicators of SARS-CoV-2 transmission risk at the Events Research Programme: environment, crowd densities and attendee behaviour
Published 26 November 2021
Applies to England

© Crown copyright 2021
This publication is licensed under the terms of the Open Government Licence v3.0 except where otherwise stated. To view this licence, visit nationalarchives.gov.uk/doc/open-government-licence/version/3 or write to the Information Policy Team, The National Archives, Kew, London TW9 4DU, or email: psi@nationalarchives.gov.uk.
Where we have identified any third party copyright information you will need to obtain permission from the copyright holders concerned.
This publication is available at https://www.gov.uk/government/publications/events-research-programme-phase-ii-and-iii-findings/science-note-emerging-findings-from-studies-of-indicators-of-sars-cov-2-transmission-risk-at-the-events-research-programme-environment-crowd-densi
Background
1. The Environmental and Behavioural Studies investigated factors associated with risk of transmission of COVID-19 at events using high resolution monitoring distributed throughout each venue and following a typical attendee journey.[footnote 1] Data included CO2 measurements, occupancy levels, crowd density estimates and observed adherence to mitigations (e.g. wearing face coverings) across a wide range of events.
2. The Scientific Advisory Group for Emergencies-Environmental Modelling Group (SAGE-EMG) and the Independent Scientific Pandemic Insights Group on Behaviours (SPI-B) have recommended enhanced ventilation and CO2 monitoring during the pandemic and made a series of recommendations for target CO2 values.[footnote 2][footnote 3] Although not a direct quantitative indicator of risk, CO2 is in exhaled breath and is an effective proxy for occupancy relative to the levels of ventilation, which links to risk of long-range aerosol transmission in indoor spaces.[footnote 4] Crowd densities give an indication of the distances that can be maintained between crowd members and how these vary over time and space.
Findings
3. Environmental and Behavioural risk factors associated with COVID-19 transmission at events are complex and contextual. Key measures of average and maximum CO2 levels and peak crowd densities varied significantly between different events and during them. Variation among spaces within a venue, reflecting distributed occupancy levels and localised ventilation strategies, can be as significant as between events, especially in hybrid indoor-outdoor venues. The nature, organisation, size and duration of an event are also key factors.
4. Good quality ventilation, for given occupancy levels, was observed in nearly all of the spaces monitored. For mitigation against COVID-19, indoor spaces recording CO2 values that regularly exceed 1500 ppm indicate poor ventilation and are considered a priority for improvement. CO2 values consistently lower than 800ppm in an occupied space indicate that the space is well-ventilated, thus spaces where aerosol generating activities occur (such as singing, aerobic activity or dancing) are encouraged to adopt a ventilation strategy capable of maintaining CO2 values at or below 800ppm (Table 1). At the 55 events monitored in 10 venues, the maximum recorded CO2 values were below 1500 ppm in 161 of the 179 spaces monitored. Where CO2 levels were higher than 1500 ppm, this usually did not persist for longer than 1-2 hours. The average CO2 levels during an entire event were below 800 ppm in 170 out of 179 monitored spaces (Figure 1).
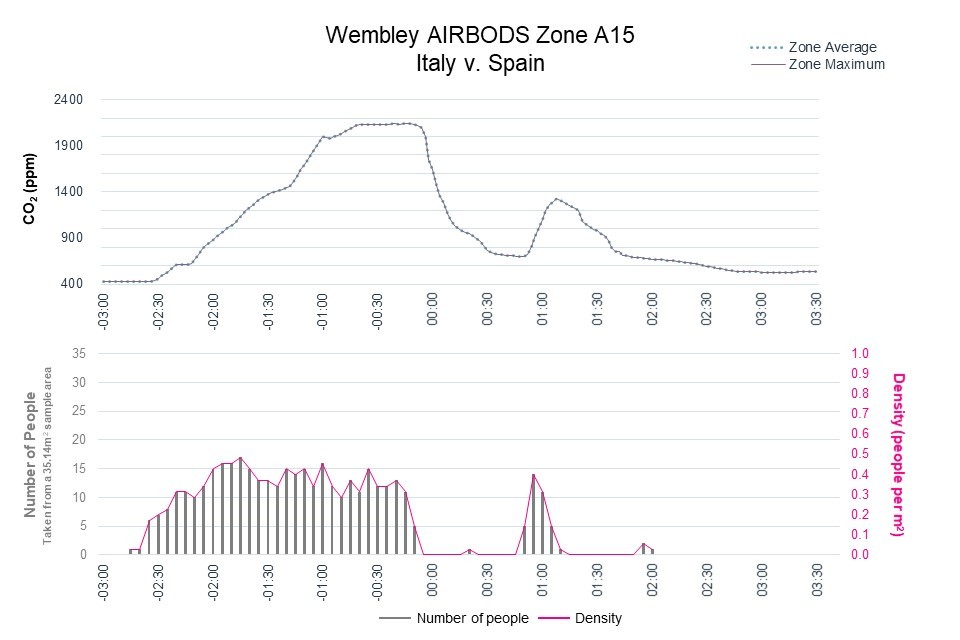
5. Poor air quality is indicative of a higher airborne transmission risk and was associated with crowded spaces. Unstructured settings (e.g. where attendees were standing and could move about a space) were more likely to be associated with pockets of high crowding. Improvements to air quality, either by improving ventilation or reducing crowding, can be made to mitigate the risk of airborne transmission. It was found that high crowding can be maintained without significant negative impact on air quality, in settings such as open-sided marquees or sheltered outdoor seating which have very high levels of natural ventilation. Improvements can be made in indoor settings; opening windows, doors or adding fans strategically can increase air quality (Figure 2). However, reducing overcrowding was found to be more immediately impactful on air quality.
6. Increasing the number of attendees within a given space reduces physical distancing and increases the risk of close contact with others. Peak crowd densities (a proxy for physical distancing) varied within each venue (Figure 3). In addition, peak crowd densities varied between different event types (Figure 4). Although managing event attendee numbers may allow for physical distancing (given the overall occupancy levels) it does not ensure it. The actual attendee distribution will likely be uneven and related to the function of a particular space at the event. In some instances, this will generate local clusters of people in close proximity, somewhat independent of the overall audience size. This increases the risk of surface and droplet transmission within these local clusters. It is important to understand this variation in crowd density (by location type and event type) to assess the impact of physical distancing guidance.
7. Adherence to physical distancing and wearing of face coverings were both higher when required rather than discretionary. Average crowd densities (across Phase II-III events) rose from 0.4 person/m2 where physical distancing was required to 0.8 person/m2 where it was not. ERP events occurred over several months, during which time societal practices regarding physical distancing evolved in line with general guidance and experience. On average, 35% of the observed attendee population (across Phase I-III events) wore face coverings. It should be noted that the requirement to wear face coverings varied at events across the programme in line with guidance at the time. This average increased to 49% when face coverings were required and decreased to 18% when they were not. Methods used to encourage or enforce mask wearing varied between and within events. The wearing of face coverings, where required, generally declined over Phases I-III (Figure 5). As with physical distancing, the levels of face covering adherence may have been influenced by general guidance regarding face covering (beyond the event itself), staff attempts to encourage mask coverings and attendee motivation to wear coverings.
8. Individual risk whilst attending an event is dependent on social interactions, on the interaction with the environment and on the individual journey through an event. It is not yet possible to directly quantify the passive risk of inhaling aerosol particles that carry the virus from ambient air. To indicate how comparative individual risk for attendees may vary throughout venues, the accumulated personal exposure to exhaled breath during an entire event was measured for 26 simulated attendee journeys undertaken by three researchers at events at three venues with handheld CO2 monitors. The cumulative exposure to exhaled breath measured by researchers attending the same event at different locations varied by up to 45% depending on their choice of seat and bar. However, researchers did not linger in higher risk spaces and it is estimated that the exposure of some attendees would have been higher. Risk is increased with prolonged and repeated exposure to poor air quality, insufficient ventilation, reduced distancing between individuals or limited compliance with face covering. This may particularly impact staff at events and additional mitigations should be considered for staff.
Recommendations
9. Venues and event organisers should consider their ventilation strategy, occupancy, operations, space utilisation, and people movement outcomes within an overall risk assessment tailored to each venue. While ventilation can reduce the risk of long-range airborne transmission, it does not eliminate the risks posed by other modes of transmission amongst close contacts (i.e. surface and droplet transmission). Appropriate mitigations are best adopted as part of a hierarchy of controls such as an enhanced ventilation strategy, requiring the wearing of face coverings and reducing crowding. High resolution fixed monitoring of air quality and people movement can be used to determine ventilation effectiveness and identify areas of higher risk to prioritise their improvement. For complex or large venues or high-occupancy events, specific mitigations are best developed in consultation with ventilation and crowd movement experts.
10. Additional consideration of the ventilation requirements in UK building regulations may be needed with a view to improve post-occupancy indoor air quality and build resilience to future infectious diseases. Analysis of the data from ERP continues and further modelling and investigation of key risk factors will be carried out.
Annex
The methods and research questions were described in detail inpublished protocols for Phases I, II and III of the ERP.
The Environmental Study monitored ten sports, music and cultural venues for the duration of 55 events. In total, over the three phases of the Events Research Programme, 179 individual spaces were monitored using 370 CO2 monitors, which logged data every two minutes and transmitted it to a central database. 17 events were attended by researchers in person, to measure airflows, biological contamination and crowd social behaviour (phase I); and airflows and personal exposure to CO2 (Phases II-III).
The Behavioural Study data collection took place over 21 events, involving the installation of over 750 temporary cameras and the capture of over 9,300 hours of video footage, generating over 275,000 data points, along with numerous other inputs (e.g. planning documents, ticket scans, concession sales data, cleaning manifests). Detailed analysis of the underlying data will be presented in an article to be submitted later in 2021.
Table 1: Indoor Air Quality Index based on CO2 levels: bands from A to G
| Air Quality Bands | Range of CO2 concentrations, |
| Absolute Values (ppm) | |
| A - Marginally above outdoor levels | 400 - 600 |
| B - Target for enhanced aerosol generation (singing, aerobic activity) | 600 - 800 |
| C - High air quality design standards for offices | 800 - 1000 |
| D - Medium air quality | 1000 - 1200 |
| E - Design standards for schools pre-Covid | 1200 - 1500 |
| F - Priority for improvement (Sage EMG) | 1500 -2000 |
| G - low ventilation/dense occupancy. Must be improved | >2000 |
Figure 1. The number of spaces across the ten monitored venues aggregated by air quality bands: Average and Maximum CO2 values. Data includes all venues and events from ERP Phases I, II and III
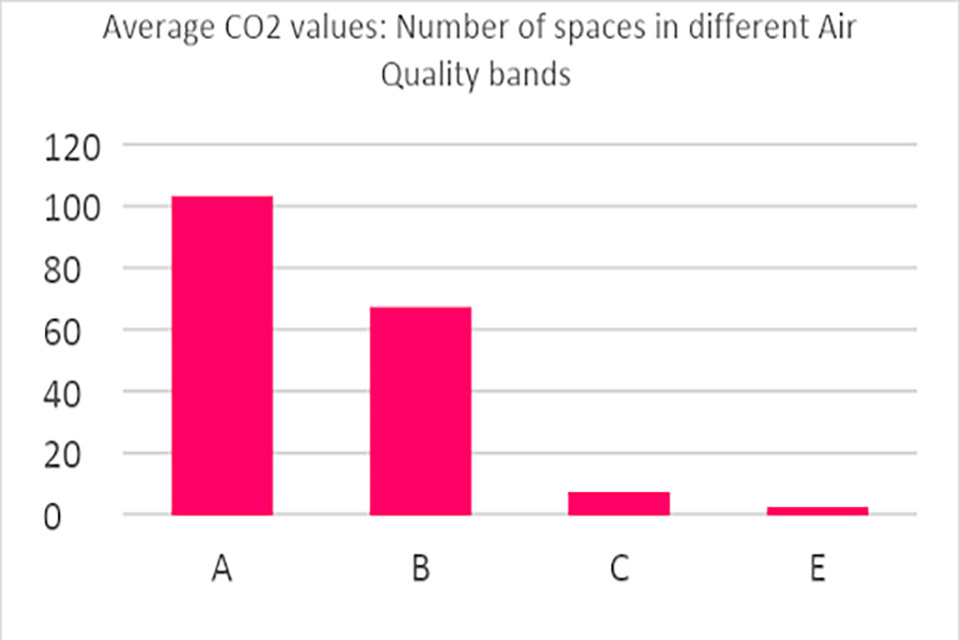
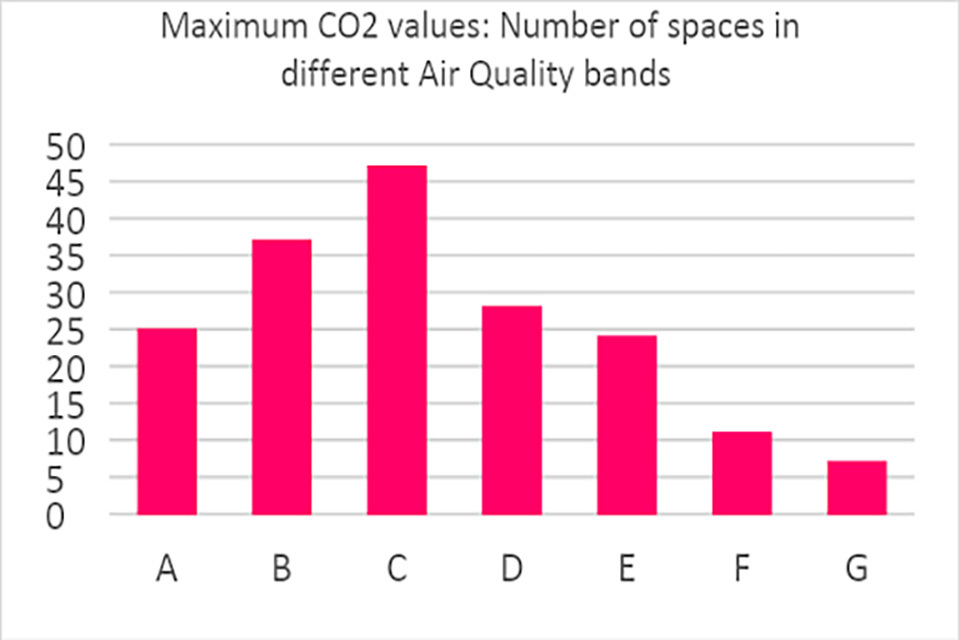
Figure 2. Impact of crowd densities on air quality, and impact of enhanced ventilation deployed rapidly following feedback to Wembley stadium. The figure shows the Average numbers of spectators, crowd densities, Average and Maximum monitored values of CO2 in an indoor concessions/bar area at Wembley stadium on level 5 during the (a) Italy vs Spain Semi-Final and (b) England vs Denmark Semi-Final
(a)
(b)
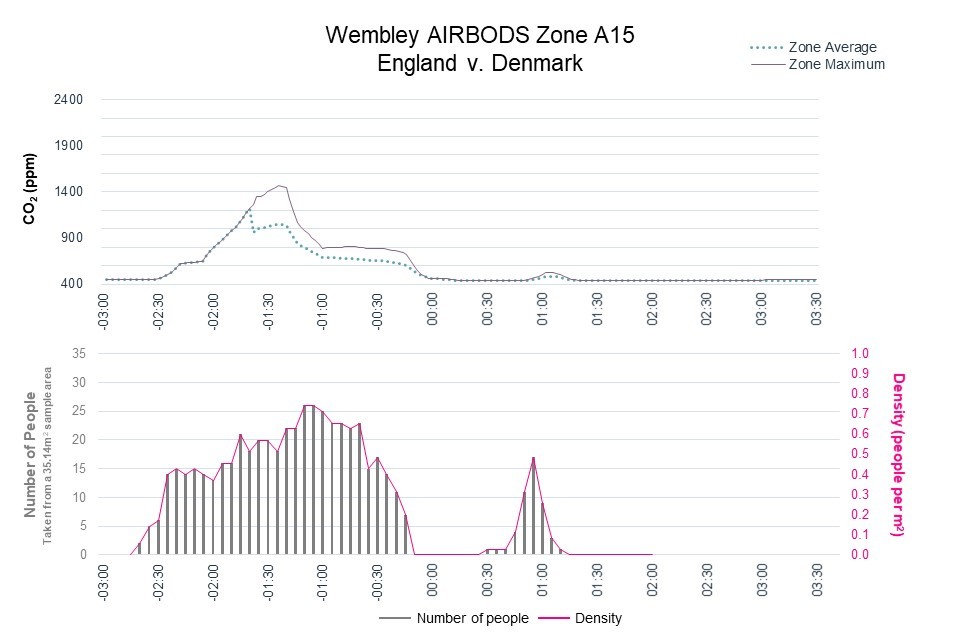
Figure 3. Peak crowd densities observed across Phase I-III events by location type (p/m2 = person per metre squared)

Figure 4. Peak crowd densities observed across Phase I-III events by event types (p/m2 = person per metre squared)
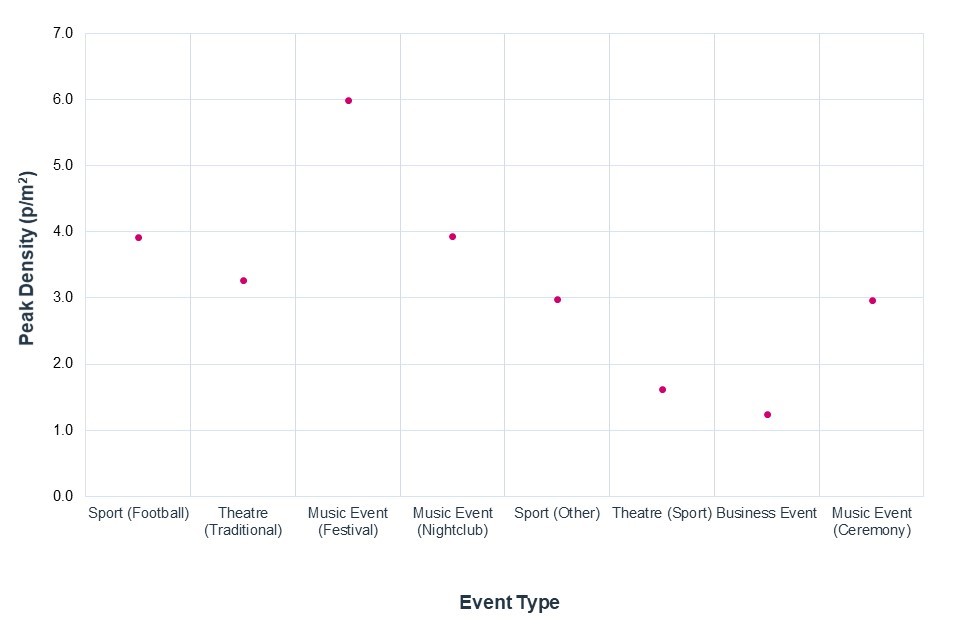
Figure 5. Percentage of the observed population wearing face covering, by phase and requirement

-
The protocols associated with these studies were agreed by the Science Board and initial findings were published in the Phase I report. ↩
-
Application of CO2 monitoring as an approach to managing ventilation to mitigate SARS-CoV-2 transmission, 27 May 2021 - GOV.UK (](https://www.gov.uk/government/publications/emg-and-spi-b-application-of-co2-monitoring-as-an-approach-to-managing-ventilation-to-mitigate-sars-cov-2-transmission-27-may-2021)www.gov.uk); ↩
-
EMG: Role of ventilation in controlling SARS-CoV-2 transmission, 30 September 2020 https://www.gov.uk/government/publications/emg-role-of-ventilation-in-controlling-sars-cov-2-transmission-30- september-2020 ↩
-
EMG and SPI-B: Application of CO2 monitoring as an approach to managing ventilation to mitigate SARS-CoV-2 transmission, 27 May 2021 - GOV.UK (www.gov.uk) ↩