Events Research Programme: Phase I findings
Updated 1 July 2021

© Crown copyright 2021
This publication is licensed under the terms of the Open Government Licence v3.0 except where otherwise stated. To view this licence, visit nationalarchives.gov.uk/doc/open-government-licence/version/3 or write to the Information Policy Team, The National Archives, Kew, London TW9 4DU, or email: psi@nationalarchives.gov.uk.
Where we have identified any third party copyright information you will need to obtain permission from the copyright holders concerned.
This publication is available at https://www.gov.uk/government/publications/events-research-programme-phase-i-findings/events-research-programme-phase-i-findings

Chief Advisers’ foreword
In February, the Prime Minister asked us to lead a review of how events with larger crowd sizes could return without social distancing, while limiting the transmission of COVID-19 as much as practical. The Prime Minister assigned us this role so that we could build an evidence base with which to get the public back into the places they have missed so much, from football grounds, to theatres, to live music venues. This report presents the findings from Phase I of the Events Research Programme (ERP) to inform how events can be reopened with reduced risk. The report does not make conclusive public health recommendations on the reopening of events at this stage.
Over the past year, the COVID-19 pandemic has forced many changes upon our daily lives, including restrictions on a wide range of events due to the public health risks that gatherings pose when infection rates are high or increasing substantially. In normal times, these events are important for our wellbeing, our sense of community and togetherness, and they have been sorely missed. We also understand how important events are to this country’s economy and global reach.
The first phase of the ERP consisted of nine pilots, some running across multiple days in April and May. These pilots have tested events in various settings including indoor and outdoor venues. Through these pilots, we have demonstrated how we can use mitigation measures, potentially as alternatives to social distancing, to reduce and manage the risks identified at events. The invaluable data we have collected from this work has informed decisions on the re-opening of events in Step 4 of the Roadmap.
The warm public reception to the ERP has demonstrated the central role such events play in our lives. The ERP has allowed over 20,000 spectators to walk through Wembley’s turnstiles for the FA Cup Final and over 13,000 people to attend dance and music events over a Bank Holiday weekend in Liverpool – the return of such events, with comprehensive pre-event testing, at a scale not seen anywhere since the beginning of the pandemic. Over the course of 17 days in Sheffield, we brought full capacity audiences back into an event for the first time to watch the World Snooker Championship. At the BRITs we saw the return of an international music awards ceremony, with an audience, including key workers, participating in an evening celebrating the best of British talent. The joy of the over 58,000 people who attended the pilots and the positive response to these events, showed just how much the country has missed such occasions.
In considering the findings in this report, it is important to note that our studies were undertaken while the prevalence of the virus was low and that future public health measures need to adapt to the prevailing levels and patterns of the virus.[footnote 1] Prevalence is likely to rise as we continue to remove restrictions and we may see variants (such as the Delta variant, B.1.617.2) emerge that are more transmissible and possibly less responsive to vaccines than those encountered during our studies. The emergence of new variants means we must remain vigilant in the global fight against this virus. We therefore strongly support the existing position that the policies influencing the reopening of events should be guided first and foremost by protecting the health of the public.
We would like to thank the many people who made the world-leading ERP possible – the participants in our audiences and their responses to our research requests; the event organisers, promoters, ticketing and venue staff working tirelessly with local authority events and public health teams on the ground; the officials across national and local government coordinating the programme; and the scientists collecting and analysing significant quantities of data. This includes teams from the University of Liverpool, Loughborough University, University College London, the University of Edinburgh and Movement Strategies who undertook the research core to the ERP. It is thanks to all their immense hard work and co-operation that the findings from this programme will help facilitate the return of what so many of us enjoy: attending exciting and top quality events throughout the country when it is safe to do so.
Nicholas Hytner and David Ross
Chief Advisers for the Events Research Programme
1. Executive summary
1.1 Context of pandemic and impact of mitigations on events settings
The Roadmap, published in February 2021, committed the government to explore how large-scale events could return safely with reduced or no social distancing from Step 4 onwards, accounting for the variable levels of risk at different events (as identified by the Scientific Advisory Group for Emergencies (SAGE)).[footnote 2] As part of that, the Events Research Programme (ERP) was tasked with overseeing this work conducting pilot events across different settings and sectors to inform approaches to reduce transmission risks. This was with the intention of being able to inform the safer lifting of restrictions on events in Step 4 of the Roadmap.
1.2 Objectives of the ERP
The ERP is a world-leading study that is pioneering the return of events in a structured, scientifically and ethically robust manner to enable events to return at a scale not previously trialled. The objectives of the ERP were to build evidence on the risks associated with events-related transmission routes of the COVID-19 virus; the public health characteristics of events and surrounding activities; and, the extent to which risk-mitigation measures can be implemented.
1.3 Pilot selection Phase I
Between 17 April and 15 May, Phase I of the ERP conducted nine pilots, some running across multiple days, in a variety of indoor and outdoor settings, with variations of seated, standing, structured and unstructured audience styles, and a range of participant numbers. The pilot selection was based on event settings that would provide substantial data and transferable learning that could be generalised across many settings. The ERP continues to run pilots as part of Phase II and III of the research programme.
1.4 Programme design and science framework
The programme design drew upon a science framework for studying events that was developed by the Scientific Advisory Group for Emergencies (SAGE) sub-group, the Environmental Modelling Group (SAGE-EMG). Researchers collected large amounts of data before, during, and after these events, including: testing and wider public health data; detailed monitoring of ventilation; video capture and analysis of crowd behaviour; interviews, and surveys. This report (dated 21 June 2021) focuses on findings to date from the nine pilots (see Table 1 in Phase I of the programme. The protocols associated with these studies were agreed upon by our science board and published in line with open science best practice. Whilst the data already provides a rich picture of these events, it is important to note that there are some limitations.
The programme is overseen by an independently-chaired Science Board, led by Dame Theresa Marteau, and with representation from government department Chief Scientific Advisers and with other leading government and independent experts (see Annex A).
Specific provisions of the Health Protection (Coronavirus, Restrictions) (Steps) (England) Regulations 2021 were disapplied for each of the pilot events in order to allow them to take place during a period of restrictions.
1.5 Limitations and interpretation
The ERP has focused on the measures necessary to ensure the safe return of large events and closed settings, which the Roadmap envisages as part of Step 4. As set out in the ERP’s Terms of Reference, it will not be responsible for advising on the timing of this reopening. This will be decided by Ministers as part of the overall approach to the steps in the Roadmap. Decisions on those mitigations should also consider the financial and social impact on businesses, organisations and individuals as well as public health considerations.
The ability of the ERP’s studies to generate any direct evidence based on transmission data was identified by the Science Board in a statement at the outset of the programme. This reflected: (a) the initial events being insufficient in scale, scope and design, and (b) the low prevalence of the virus. Nonetheless it was judged that the ERP would still generate evidence on transmission risk factors to help inform policy on how events might be reopened in a way that mitigates risks of COVID-19 virus transmission, as well as important evidence to inform Phase II.
Risk factors of transmission that were studied include environmental factors, such as CO2 levels and crowd density as a proxy for airborne transmission, bacterial amounts on surfaces and in the air at venues, behavioural considerations such as compliance with face coverings and social distancing. The programme also looks at the implementation of outbreak prevention and control strategies including pre-event testing.
Findings from the ERP should also be interpreted in relation to the wider context as set out in the Roadmap’s four tests for easing restrictions, which include risks presented by variants of concern (such as the recent emergence of the Delta variant / B.1.617.2), and rising infection rates. In addition, it is worth noting that as well as potential exposures to the virus within a venue, end-to-end transmission risks include travel to and from venues and any visits individuals make to nearby premises (e.g. to bars and restaurants in the vicinity of a venue). Many of these venues were closed when ERP Phase I events were run.
The evidence that was collected has, however, contributed to our understanding of transmission risk and the management of risk factors. To build further evidence around transmission, it will be important to: study additional events with significantly more attendees, representative of the normal event-going population; improve the return of pre and post-event PCR tests; and a decision to link test data more systematically to event attendance (an approach trialled in Liverpool pilots in Phase I). Additional testing capacity (as part of Phase II) and changes to the data infrastructure will be needed to provide this evidence.
We are continuing to build on findings from Phase I by running Phases II and III of the ERP, from the end of May. These additional pilot events will provide the opportunity to generate further evidence around the implementation and operational considerations of the findings from this Phase I report. Phase II and III also aim to address these limitations and provide further data that can be collated cumulatively across different events to provide additional statistical power to the evidence already generated from Phase I.
1.6 Key scientific observations
Observation 1: The variation of transmission risk factors within a venue matters as well as the differences in risk between types of venue. Outdoor spaces are generally lower risk than indoor spaces. However, all venues are different and may have indoor spaces such as toilets, food/drink concessions and corridors which can pose higher risks.
COVID-19 risks have previously adopted a broad event wide approach given the lack of detailed evidence. The richness of the data collected by the ERP environmental studies were able to provide evidence that every event and setting has areas where the risk of transmission is lower or higher. The profile of these higher risk areas includes areas where the density of people in a space increases for longer periods of time such as during the 15 minutes at half-time in a football match, and where ventilation is poorer. These higher risk areas include entry and exit points, concourses and restaurant areas within a venue. These areas may require additional measures relative to spectator areas, including limiting the number of individuals who congregate for longer duration, staggered entry and exit, or alternative ventilation in these zones.
Observation 2: Large unstructured gatherings indoors where there is significant mixing of people in close proximity typically pose a higher risk.
The risk of COVID-19 transmission is strongly associated with proximity and duration of contact in indoor environments, particularly those that are poorly ventilated. The detailed measurements taken during events allowed some of the first comparisons between events and other settings where people mix. Although CO2 levels increased with higher numbers of attendees, across most events and spaces within them they were within acceptable levels, comparable to the bounds of the ventilation design guidance for a school or an office.[footnote 3] The most notable exception was the nightclub pilot, where there were sustained higher CO2 levels by the stage consistent with higher crowd density observations. While acceptable levels do not preclude the transmission of COVID-19, these findings indicate that unstructured and energetic activity with a high crowd density may lead to higher airborne transmission risks. These risks may be open to previously identified and assessed mitigation measures.
Observation 3: The ERP pilots demonstrated how risk mitigation measures could be put in place to reduce and manage the risks identified for events, building on previous SAGE-EMG’s conclusions.
The combination of movement data and CO2 measures used by the ERP provided a new way to identify areas of risk that could be reduced through the application of different mitigation measures. Mitigation options include: communications, crowd and audience management strategies, face coverings, ventilation, testing, restrictions on food and drink, and social distancing/capacity caps. The use of certification as a mitigation measure will be assessed in Phase II and Phase III.
Observation 4: Compliance with requirements to wear a face covering and socially distance was mostly high, with lower compliance observed in higher risk areas, exacerbating overall transmission risk without sufficient mitigations in place.
The behavioural work undertaken as part of our studies provided a much richer insight into event attendees motivations than we previously had. Participants were in general motivated to follow safety precautions. Reduced face covering compliance was associated with higher attendance levels, circulation zones and exiting. It was notable that in hospitality areas and when congregating in groups the majority of people did not wear face coverings (when required to do so), 98% and 88% respectively. Reduced social distancing compliance was linked with higher attendances and less effective crowd management strategies.
Observation 5: Pre-event lateral flow testing, questionnaire-based screening and consent to link event booking and test result data, as conditions of admittance to events, were accepted by audiences for most types of events and helped public health teams to respond to any potential outbreaks.
Timely access to linked testing and ticketing data was effective in enabling rapid contact tracing around Liverpool events. Areas for further risk-mitigation that were identified included: moving the time of testing closer to events; and automatically cancelling tickets when positive test results appear.
Observation 6: It is challenging to generate robust, generalisable evidence of the transmission risk associated with particular events. Phase I pilots were necessarily limited in scale, and took place during a period of low prevalence of the virus. Further, they were insufficient in scale, scope and study designs to generate any direct evidence based on transmission data. Therefore, evidence on case numbers should be treated with caution.
A total of 28 positive cases have been identified to date potentially related to the pilots undertaken, of which 11 were identified as potentially infectious at an event and a further 17 were identified as potentially infected at or around the time of an event.[footnote 4] Contact tracing was used to identify contacts of those who tested positive. However, these figures should be interpreted with extreme caution given the very low return rate of pre- and post-event PCR tests (only 15% returned both tests), the low prevalence at the time of the studies and the lack of a comparator group for the studies. However, that cases were identified indicates that even with entry conditional on a negative LFT result in the 36 hours before the event, some people who are potentially infectious will still be admitted, indicating a need for robust outbreak control procedures to be in place. Events without pre-event testing were not piloted as part of Phase I.
2. Impact on the economy and society
The creation of the ERP was motivated by the major impact that COVID-19 has had on sectors that stage and put on events, which we briefly cover in this section prior to reporting on the results of the programme. This is based on secondary analysis of existing data sources and a nationally representative survey undertaken alongside the pilots.
2.1 Pre-pandemic activity
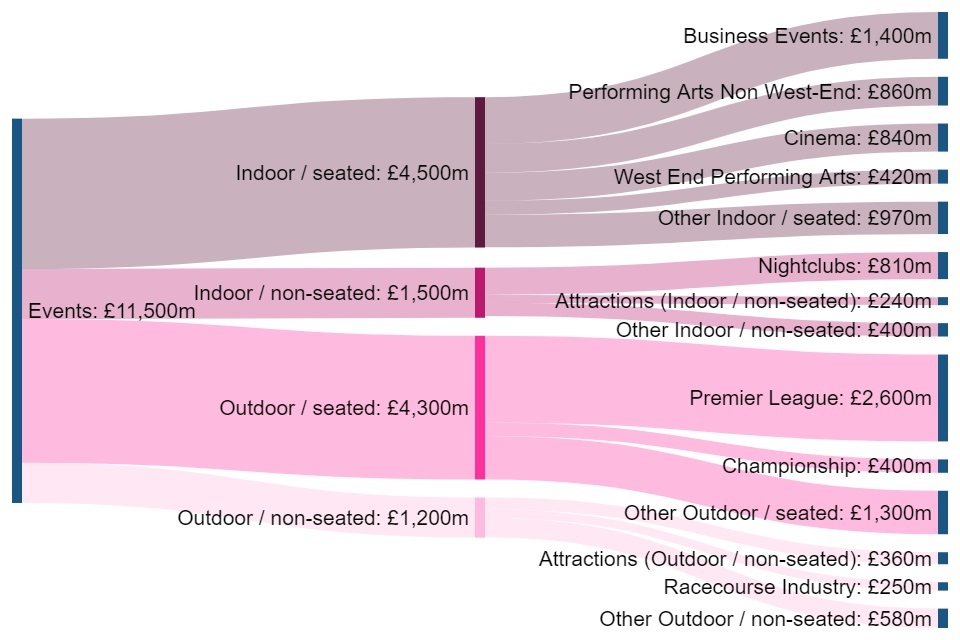
Events activity in England, pre-COVID-19 (2019), accounted for £11.5bn in direct Gross Value Added (GVA) to the English economy and a further £6.6bn in indirect GVA through the supply chain and related consumer markets; giving a total of £18bn, 1.1% of total England GVA.[footnote 5] In 2019, events activity in England employed 416,000 people, with its workforce (excluding volunteers) being, on average, younger than other sectors. 39% of this GVA is contributed by indoor seated settings, 38% by outdoor seated settings, 13% by indoor unseated settings, and 10% by outdoor unseated settings.[footnote 6]
Figure 1: Direct GVA from events by setting and sector[footnote 7] in 2019
This GVA was supported by high levels of pre-pandemic levels of participation and attendance. For example:
- In 2019/20 there were 47.6 million visits to Department for Digital, Culture, Media and Sport -sponsored museums and galleries (DCMS-sponsored Museums and Galleries Annual Performance Indicators 2019/20)
- 76% of adults engaged with the arts between April 2019 and March 2020 (Taking Part Survey)
- There were 176.1 million cinema admissions in the UK in 2019 (IHS Markit)
- 73% of adults visited a heritage site between April 2019 and March 2020 (Taking Part Survey)
- 25% of adults attended at least 2 sport events between May 2019 and May 2020 (Active Lives Survey)
These attendance levels saw significant falls during the pandemic, even during periods of reopening under restrictions. The total number of visits to Department for Digital Culture Media and Sport-sponsored museums and galleries decreased by 89% in the last quarter of 2020 compared to the same period of the previous year (DCMS Monthly Museums Visitors Figures). When cinemas reopened in summer 2020 they experienced attendance well below their pre-pandemic level. In January 2020 there were 16.5 million cinema admissions, but this fell to 2.6 million cinema admissions in September 2020 (UK Cinema Admissions). Although for some activities there was a shift towards digital consumption this was only a fraction of pre-pandemic attendance and generated significantly less revenue. In July 2020 7% of adults watched a live arts event online (Taking Part Survey - COVID-19 Module).
2.2 Impact on events activity
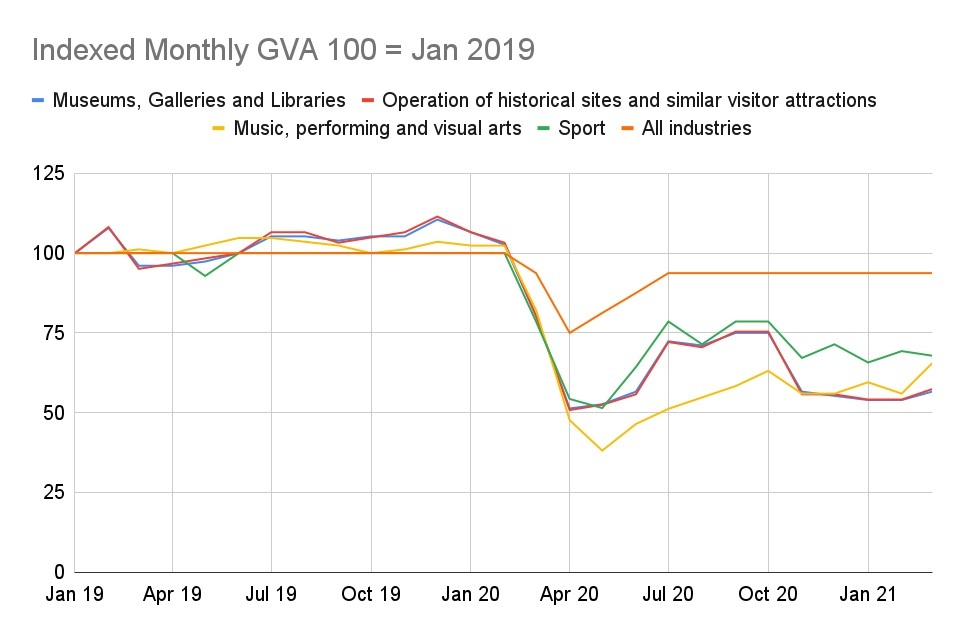
Due to the nature of COVID-19 restrictions, sectors reliant on events have been disproportionately impacted by the pandemic and restrictions in place on reopening. GVA in events-related sectors experienced a substantial decrease when the pandemic hit and lockdowns were implemented at the start of Q2 2020. GVA dropped by 50-60% for these sectors, while the whole economy GVA dropped by 25% and other sectors in the Digital and Telecoms sectors were virtually unaffected. The summer of 2020 saw a moderate uptick while restrictions were eased, but GVA for firms in the ‘Arts, entertainment, recreation and other services’ (AER) sector was still well below pre-pandemic levels, at around 60% of January 2019 levels.
Figure 2: Indexed monthly GVA from selected events sectors, Jan 2019 - Mar 2021, DCMS Monthly GVA
Many firms have been unable to operate on a stable financial footing, and have relied heavily on government support. The proportion of businesses currently trading within the AER sector has been below that of the overall economy at all times during the pandemic. At the lowest point in June 2020 less than a quarter of AER organisations were trading and this currently stands at 71% as of 16 May 2021 (ONS Business Impacts of Coronavirus Survey). During 2021, more than 70% of firms have seen their turnover decrease and 60% of firms have seen their profits decrease (ONS Business Impacts of Coronavirus Survey). As a result, 10-20% of firms report that they are at a moderate or severe risk of insolvency (ONS Business Impacts of Coronavirus Survey).
Figure 3: Proportion of organisations currently trading Jun 2020 and May 2021, ONS Business Impacts of Coronavirus Survey


Although social distancing has been effective at reducing the risk of transmission, it has been financially challenging for events, leading to reductions in capacity (anywhere between 20% and 70% depending on the venue) which is financially unsustainable within current business models.
Looking forward, COVID-19 mitigations at events could significantly increase or decrease the likelihood of an individual attending an event. Evidence from ONS’ Opinions and Lifestyle Survey (survey of 3,810 adults in Great Britain, 28 April to 3 May 2021) suggests the following mitigations will have an effect on attendance:
- COVID-19 pre-event testing: 15% more likely to attend an event
- Social Distancing (1m+): 2% less likely to attend an event
- Face coverings required (2hrs): 28% less likely to attend an event
- No food/drink allowed at the event: 43% less likely to attend
- 2-hour delay to enter and exit: 62% less likely to attend an event
Whilst these findings indicate significant variations in the effect of different mitigations on demand, it should be noted that individuals’ appetites to attend events is uncertain and can change based on many factors. For example, in the ERP pilots, the testing was free, therefore attendees’ willingness to test before an event may be different depending on whether they are charged for tests. Individuals’ appetite to attend events may also be influenced by how safe events are perceived to be, for example attendance may be lower if events become associated with high transmission rates.
Different demographic groups respond differently to different mitigations and demand may change accordingly. For example, results from the Opinion Lifestyle Survey, designed to be representative of the GB population, showed that:
- vaccinated people say they are more likely to attend events with pre-event testing than non-vaccinated people
- people belonging to an ethnic minority or those aged 16-29 are 8% more likely to attend an event if it has social distancing mitigations in place
- the availability of food and drink is more important to those in the 16-29 and 30-49 age groups when considering their likelihood of attending an event
- men are also less likely than women to attend an event where face coverings are required for more than two hours
3. Research approach
3.1 Objectives of Events Research Programme (Phase I)
The objectives of Phase I of the programme were to build evidence on the risks associated with how coronavirus is transmitted, the interaction with characteristics of events and surrounding activities, and the extent to which mitigation measures can effectively address these risks.
3.2 Scientific approach
The science framework, led by the SAGE EMG, informed the development of the ERP. [footnote 8] Findings of other government reviews announced in the Roadmap have also been taken into account. These ERP interim findings have also been shared to inform the government’s wider review of social distancing, and the ongoing COVID-status certification review.
The pilot selection and design was based on event settings that would provide substantial evidence and learning on the potential effectiveness of ventilation systems; the organisation of events and venue design; the effectiveness of public health measures to contain potential outbreaks, and an indication of coronavirus transmission routes in specific settings. We adopted a settings approach where we considered the size of an event, the physical layout (seated, free-moving, mixed), indoor/outdoor and level of crowd activity. We then selected settings with maximum cross over to sectors and chose venues that demonstrated these settings. To achieve this, we conducted complementary studies across the nine pilots, working with leading research teams from the University of Liverpool, University of Edinburgh, University College London and Loughborough University, as well as Movement Strategies Ltd, a company that specialises in people movement and crowd dynamics. These studies explored environmental factors such as ventilation and crowd movement, behavioural responses of participants, and evidence of transmission through testing of attendees.
Table 1: Events Research Programme Phase I pilot events
| Pilot events* | No. of participants | Setting being tested | Mitigations in place** |
|---|---|---|---|
|
World Snooker Championship Venue: Crucible Theatre, Sheffield 17 April - 3 May |
10,147 | Indoor seated | Social Distancing in seats for first five days, then reduced social distancing, then no social distancing for the final; No food and drink available; Face coverings mandated at all times; LFT at Asymptomatic Testing Site (ATS) |
|
Emirates FA Cup Semi-Final Venue: Wembley Stadium, London 18 April |
2,728 | Outdoor seated | Social distancing rules applied within the venue and attendees seated one seat (0.9m+) apart regardless of if in the same household; Alcohol, food and limited hospitality available indoors; Face coverings mandated at all times; LFT at ATS |
|
Carabao Cup Final Venue: Wembley Stadium, London 25 April |
7,737 | Outdoor seated | Social distancing rules applied within the venue and attendees seated one seat apart (0.9m+) regardless of if in the same household; Alcohol, food and limited hospitality available indoors; Face coverings mandated at all times; LFT at ATS |
|
Emirates FA Cup Final Venue: Wembley Stadium, London 15 May |
18,720 | Outdoor seated | Social distancing rules apply within the venue and attendees seated one seat apart (0.9m+) regardless of if in the same household; Alcohol and food on the concourse; Indoor hospitality; Face coverings mandated at all times; Limited Home LFT testing |
|
The Good Business Festival Presents ‘Change Business for Good’ Venue: ACC Exhibition Centre, Liverpool 28 April |
149 | Indoor mixed open/seated | No social distancing; Alcohol and food available indoors; No face coverings; LFT at ATS |
|
Circus Presents ‘The First Dance’) Venue: Circus Nightclub (warehouse club), Liverpool 30 April - 1 May |
3,138 (Night 1); 3,870 (Night 2) | Indoor open | No social distancing; Alcohol and food available indoors; No face coverings; LFT at ATS |
|
Sefton Park Pilot (Outdoor music event) Venue: Tented Stage in Sefton Park, Liverpool 2 May |
6,101 | Outdoor unstructured | No social distancing; Alcohol and food available outdoors; No face coverings; LFT at ATS |
|
BRIT Awards Venue: The O2, London 11 May |
3,532 | Indoor seated(mixed styles) | No social distancing; Alcohol and food available indoors; No face coverings inside the main arena, required elsewhere; LFT at ATS |
|
Reunion 5k Venue: Kempton Park, Surrey 15 May |
1,981 | Outdoor open | No social distancing; No face coverings; Home LFT testing allowed |
3.3 Research protocols
Table 2: Studies conducted during Phase I and the associated objectives
| Environment studies | Our environment studies examined the risk of airborne and surface transmission based on environmental data indicative of transmission risk. CO2 as a proxy for exhaled breath and poor ventilation, temperature and humidity were measured at high resolution. Crowd density was measured as a proxy for the proximity of others to aerosol and droplets, measurements were made through analysis of video footage and on-site observations. Microbiology samples were taken from surfaces and air of the three football matches and the BRIT award ceremony and analysed for bacterial cells and, for the first two football matches, SARS-CoV-2 RNA. Social grouping analysis measured people’s congregation behaviour and their face covering wearing compliance. In total 320 CO2 monitors were deployed, due to the size of the venue: 86 at the Wembley stadium, 75 at the O2 venue, 75 at the indoor Crucible Theatre, 51 at the ACC Exhibition Centre – and 33 at the Circus Nightclub. Researchers monitored the environment to understand air movement and ventilation performance during events. |
|---|---|
| Behavioural studies | Our behavioural studies examined how people reacted and responded to the events, including identifying risk factors for non-adherence and motivators for adherence. We analysed spectator experiences across indoor and outdoor events, comparing observational data with self-reported data of spectator adherence to COVID-19 guidance to identify predictors of non-adherence. The data gathered will be used to inform communication intervention strategies at later phases to increase spectator adherence. 2,502 attendees were surveyed across five of the Phase I pilot events, including the three outdoor football matches, the World Snooker Championship and the Sefton Park Pilot outdoor music event. 37 participants were interviewed, all of whom had participated in the online survey. Across the nine Phase I pilot events, on-site observations were made over 30 days, 315 temporary cameras were installed and over 3,000 hours of video footage was captured. In total, over 125,000 individual data points were extracted from the footage and used within the analysis. The observational data collected has supported the work of the wider research group. Where appropriate, the outcomes related to movement and behaviour patterns have been shared and cross-referenced with those generated by the environment studies to inform their analysis, including crowd density measures, occupancy levels, patterns in social distancing and face covering compliance. |
| Outbreak prevention and control studies | Our outbreak control studies focused on the feasibility and utility of testing for COVID-19 using lateral flow devices to mitigate the risk of transmission, alongside reporting of symptoms, amongst those attending indoor and outdoor mass events in comparison to that in the wider community. We considered the end-to-end outbreak control systems including, testing, contact-tracing, and control measure receptiveness of participants, events’ staff and, where possible, the populations audiences were drawn from. Public reactions to the events as well as behavioural reflections from participants were captured. The effectiveness of digital systems, such as linking data between organisations, for testing and contact tracing was assessed in order to recommend how the system might be streamlined. Across the nine Phase I pilot events a total of 26,000 PCR tests were analysed, including 12,000 pre-event PCR tests and 14,000 post-event PCR tests. This compares to 58,000 attendees across all the events. Both ERP and wider public health service COVID-19 tests were considered where participants identifying information was sufficient to link them to public health records, with their consent. |
4. Findings
4.1 Overview
Current research shows that there are three main routes to transmission: close-range respiratory droplets and aerosols; longer-range respiratory aerosols; and direct contact with surfaces contaminated with COVID-19.[footnote 9] Multiple studies have shown that both the number of interactions and duration of exposure are significant risk factors for COVID-19 transmission.
Figure 4: Routes of transmission
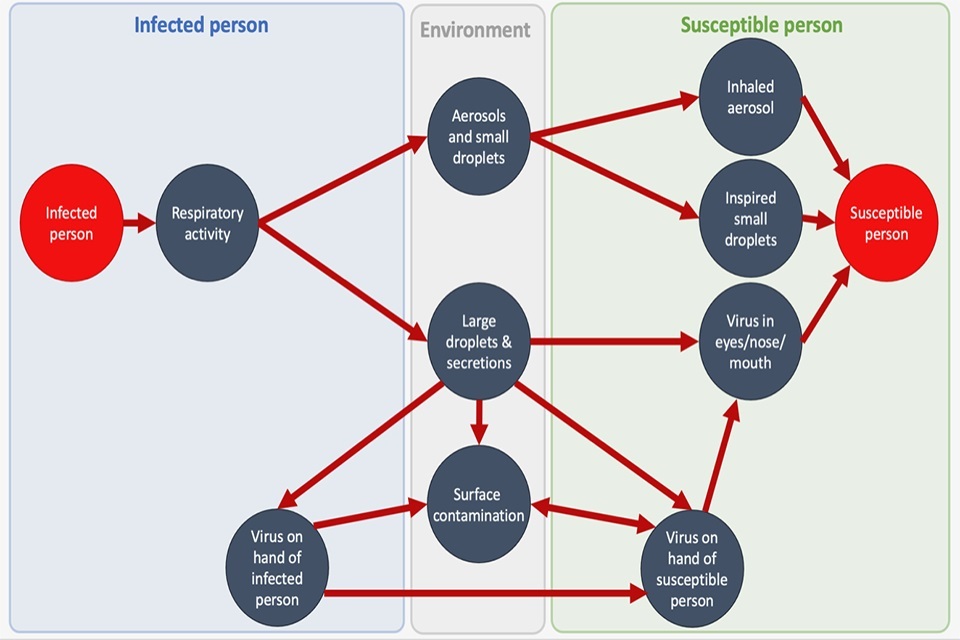
As with many activities in society, events bring groups of people together to breathe the same air and therefore present a risk of transmission due to the numbers, proximity and mixing of people. Some events, outside of the ERP, have resulted in significant spreading with a number of case studies reported in the literature.[footnote 10]
The risk of transmission at any event will depend on several biological, behavioural and environmental factors including the prevalence of disease at the time, venue design, extent and effectiveness of venue ventilation (including whether events are held indoors or outdoors), numbers and characteristics of attendees, type, nature and purpose of contact, and length of time spent close to others. For example, there are different risks involved if someone is shouting in a loud environment face-to-face, versus whispering to someone sitting near you, but facing away at a seated event. At a large sporting spectator event, close contact with strangers tends to be incidental or accidental, whereas in other settings close contact is often deliberate and purposeful.
The highest risks of transmission occur when multiple factors are combined. For example, an indoor event with a large number of people mixing in close proximity for a prolonged period of time is likely to present a higher risk than fewer people outside for a shorter period. Transmission can also occur at pre- and post-event activities, such as at restaurants and bars, or on public transport (although the ERP did not investigate this directly).[footnote 11]
Whilst weddings were not assessed in the ERP, SAGE-EMG Transmission Group advice on weddings-related transmission notes a variety of risk factors including domestic and international travel, a high degree of social mixing, intergenerational mixing, long event duration, consumption of alcohol (which impacts behaviour) and shared food. Wedding events are a diverse mixture of outdoor, indoor, seated and unseated settings so transmission risk will vary. Wedding venues could be well placed to provide details for contact tracing.
4.2 Environmental studies
The environmental studies undertaken at the pilot events highlighted that the risk factors associated with COVID-19 transmission at events are complex and depend on many different factors which vary by the nature, organisation, size and duration of an event. The environmental studies looked at key measures such as CO2 levels, crowd density and microbiological swabs to explore environmental risks. CO2 measurements were taken as a proxy for exhaled breath and air quality, which can be used as indicators of airborne transmission risk. However, it is highly likely that transmission can occur at lower CO2 levels where people are in close contact for prolonged periods of time with poorer ventilation, such as happens in home settings, hence the studies also looked at crowd density. How long people were exposed to accumulating CO2 and/or high density of people is important when assessing the risk of transmission.
All events have areas of higher risk which are specific to the venue. Crowd movement studies during the pilots demonstrated that entrances and exits, as well as transient spaces such as toilets, corridors, and bars formed points where people could gather at higher densities with restricted flow, leading to higher risks. These higher risk areas are specific to the venue: at the large outdoor Wembley stadium the highest crowd densities were observed in the toilet queues (2.41 people/m2), whereas at the awards show it was in arrival and departure areas (2.96 people/m2).
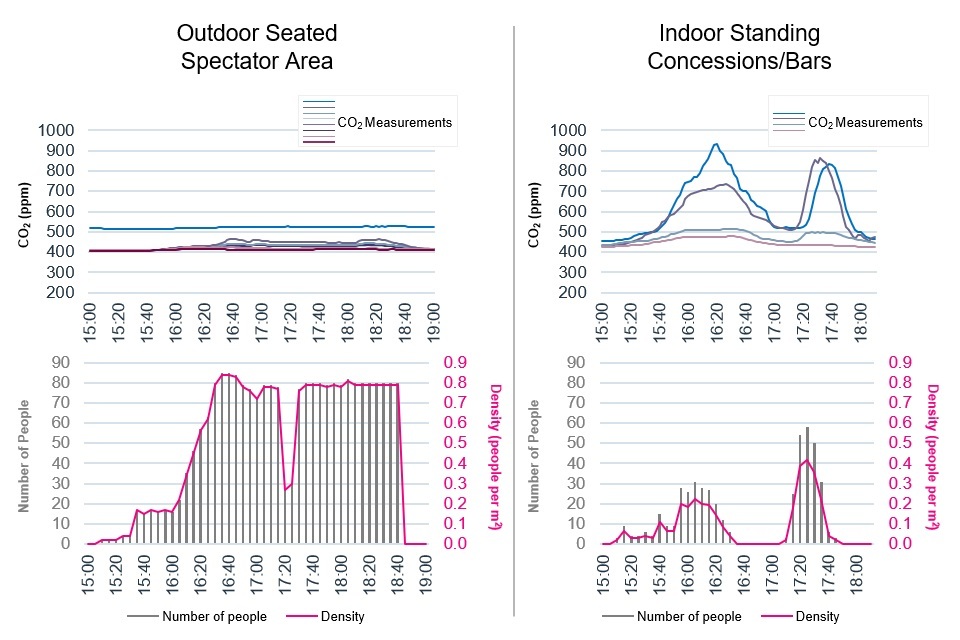
Though outdoor areas present lower risk than indoor, the level of transmission risk factors within settings varied significantly. At outdoor events, where main activity areas present a lower risk, there are still numerous indoor spaces which are likely to be areas of higher risk, either where people congregate at higher densities, potentially for several hours, and/or where ventilation is poorer. For example, at the Carabao Cup Final at the Wembley Stadium, recorded CO2 levels in the seated outdoor bowl were low with minimal variation, despite a high density of people. At the indoor concession stands and bars for the same event there were spikes in CO2 before the match and at half time, despite a far lower density of people than the outdoor seated bowl (see Fig 5). At the same outdoor venue microbiology analysis found that the enclosed spaces with higher occupancy levels, such as the private boxes and restaurants, were the most microbiologically contaminated, although no traces of SARS-CoV-2 were found in any microbiological samples analysed.
Figure 5: Case study: Carabao Cup Final at Wembley. Time series of CO2 and crowd density readings for outdoor seated spectator arena and indoor concession stands.
Nearly all CO2 levels recorded at the pilot events were within the bounds of reasonable ventilation benchmarks[footnote 12] with outdoor spaces clearly better for ventilation than indoors. Exceptions were in front of the stage at the Circus nightclub and momentarily in two ancillary areas at other venues. The area in front of the stage at the nightclub had a sustained CO2 reading of over 2000ppm (parts per million)[footnote 13] on the first night and just under 2000ppm on the second. With attendees spending long periods of time in that area and doing aerobic activity, such a reading is a cause for concern and does not meet CIBSE COVID guidance.[footnote 14] It is important to note that there was only one nightclub pilot in Phase I, in an atypical warehouse setting where ventilation improvements could be made, so only limited inferences about the sector can be reliably made.
There were two isolated instances of brief higher CO2 readings[footnote 15] at peak occupancy times in other venues, but they were rare and in places where people only tend to spend a short period of time: a toilet and a queue for a bar. Exposure to aerosols accumulates over time and given the high readings were brief instances in places where people tend to pass through, they were not seen as problematic. However, maintaining good air quality could be more of a challenge with audience sizes that are closer to venue capacities.
Initial findings suggest that, except for the nightclub, a person attending an event experiences a lower level of cumulative exposure (CO2 levels above outdoor readings multiplied by exposure time) than attending a well-ventilated multi-person office for 6 hours.[footnote 16] This is partly due to the shorter durations of events compared to the working day, and partly due to most event spaces being well ventilated at the audience sizes tested. The average exposures in Figure 6 are indicative of the full range of observed areas at pilot events but may not capture the situation when venues are closer to full capacity; for this the maximum values are an indication of the “worst case” scenario.
Figure 6: Preliminary indicative analysis of cumulative exposure (CO2 levels above outdoor readings multiplied by exposure time), relative to the exposure experienced from a 6 hour period in a well ventilated office (e.g. maximum exposure in the Crucible approximately 1.5 times the exposure resulting from 6 hours in a well ventilated multi-person office. A measure of 1 would indicate the same cumulative exposure risk).
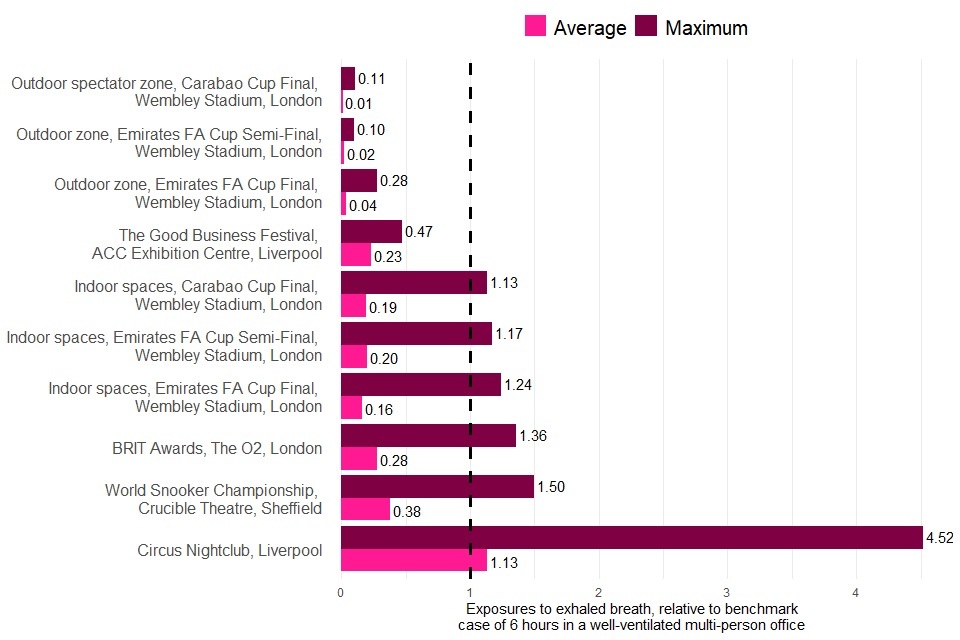
The overall cumulative exposure risk of an event depends on how much time people spend in the higher risk areas; for example, if a spectator at an outdoor football match spends the majority of their time at an indoor restaurant within the stadium they will have been at higher risk. Further analysis of overall exposure to above ambient levels of CO2 over the course of an event is planned.
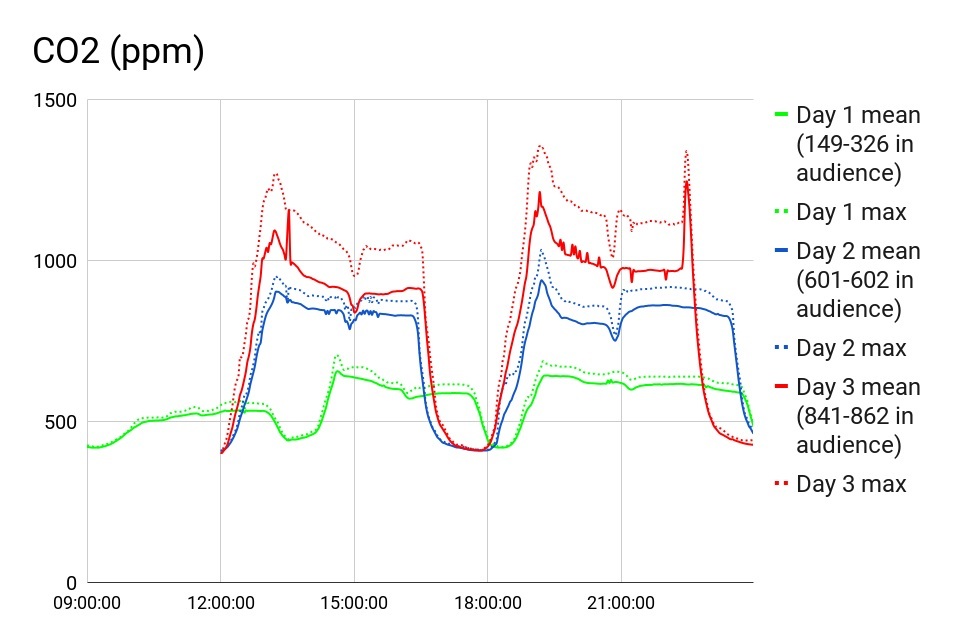
Increasing audience sizes leads to higher risk of transmission. Findings showed that increasing numbers of audience members leads to higher CO2 levels, crowd density and increased bacterial cell counts. Even with higher crowd densities CO2 levels remained within CIBSE COVID-19 guidelines in seated spectator areas at both the Crucible Theatre and the O2. CO2 readings at the Crucible Theatre increased in the auditorium as more people attended, although they remained within the recommended industry standards. Similarly at the O2 where social distancing was not in place, CO2 levels in the auditorium stayed well within industry standards.
However, removing social distancing requirements and increasing capacity within venues, attendees are sometimes unable to maintain social distancing in areas outside of the auditorium. This increases the risk of close contact with others in areas that may pose a higher risk of transmission for other reasons, such as poorer ventilation.
Microbiology analysis at Wembley confirms the finding that increasing the audience size increases transmission risk, but only surfaces where spectators regularly touch. Bacterial cell counts in biological samples taken at the three football matches showed increased bacterial presence on surfaces and in the air as audience numbers were increased.[footnote 17]
Figure 7: CO2 readings at the Crucible on three different days where audience numbers were increased day to day. On day 1 there were three events, with an audience of: 15%, 30%, 30% capacity. On day 2 there were two events at 60% capacity. On day 3 there were two events at 85% capacity. Peaks in CO2 readings are due to peaks in shouting and cheering in the audience.
Large unstructured gatherings indoors where there is significant close-mixing of people typically pose a higher risk and may be open to previously identified and assessed mitigation measures. The risk of COVID-19 transmission is strongly associated with proximity and duration of contact in indoor, poorly ventilated environments. Clearly the CO2 levels recorded at the nightclub suggest these risks need to be addressed in areas where people will naturally crowd together and mingle for prolonged periods of time - for example, in front of a stage or on a dancefloor) However, not all unstructured settings will have the same level of risk: the nightclub event and outdoor music event had far higher crowd densities (4 people/m2 and 6 people/m2) and for longer periods of time, than the networking session held at the business event (1 person/m2) because of the nature of the activity. Social distancing was not in place at any of these events.
4.3 Behavioural studies
The behavioural studies involved the collection of observational data on the movement and behaviour of attendees at events. Attendees were also surveyed and interviewed to examine attendee experience, perceptions of the COVID-19 guidance, self-reported adherence and barriers to adherence. Generally, behaviour of individuals and groups at events will vary by the activity they are undertaking and the space they are in, taking cues from the guidance they receive, the behaviour of others around them and what is normally expected in the setting. Behaviour will vary within events as much as they do between events.
Attendees were motivated to follow COVID-19 guidance to enable the return of events, keep other attendees safe and support the ERP. The self reported adherence correlates with observational data captured at the event, with overall high social distancing and face covering compliance across events where this was applicable.
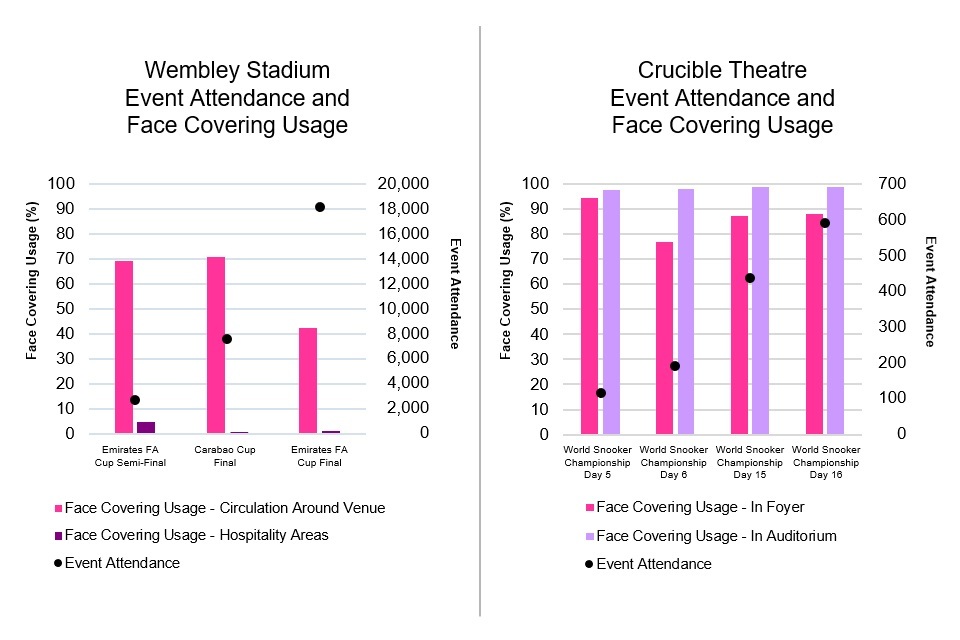
Correct face covering usage was found to be high across events where required (an average of 96.2%[footnote 18] of people in sampled areas were observed wearing face coverings correctly while seated during the event), particularly in indoor environments (98.3%) in comparison to events conducted outdoors or with a substantial open air element (92.1%). Attendees suggested that the reduction in compliance was due to a lack of clarity, particularly where the risk was perceived by the attendee to be lower in an open air environment. Generally, as occupancy levels increase, the observed compliance was found to decline. Reduced correct face covering usage was observed when leaving (59.7%)[footnote 19] and when circulating around the venue (74.3%), with a significant reduction in hospitality areas where food and drink were consumed (2% of people were wearing a face covering). The congregation of people was monitored at sample areas at selected events,[footnote 20] where it was observed that most people (88.4%) did not wear face coverings while grouped together. The average duration was found to be 13.2 minutes, with 80% of congregations lasting less than 20 minutes.
Figure 8: Observed use of correctly worn face coverings at different areas in events with varying attendance levels.
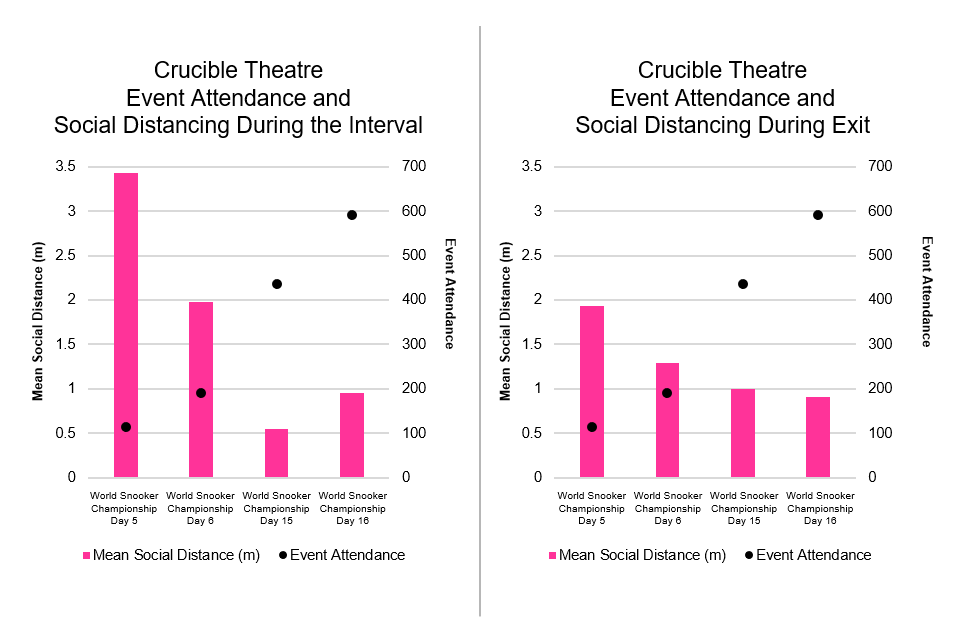
Increasing the number of attendees within a given space impacts the ability to maintain social distancing and increases the risk of close contact with others. However, in general, adherence to social distancing guidance, where required, was high across events. Key areas of concern were observed in queues, during exit and in hospitality areas. Self reported data from attendee interviews and survey responses suggests that incidents of non-adherence observed were primarily associated with an inability to adhere to social distancing guidelines, for example due to the layout of crowd barriers forming queue, and due to a lack of clarity around how to behave, during exit and highlighted in hospitality areas where live announcements of safety guidance were also difficult to hear. Higher density will put increased pressure on “pinch points”, for example toilets, which exacerbates existing risks posed by these spaces.
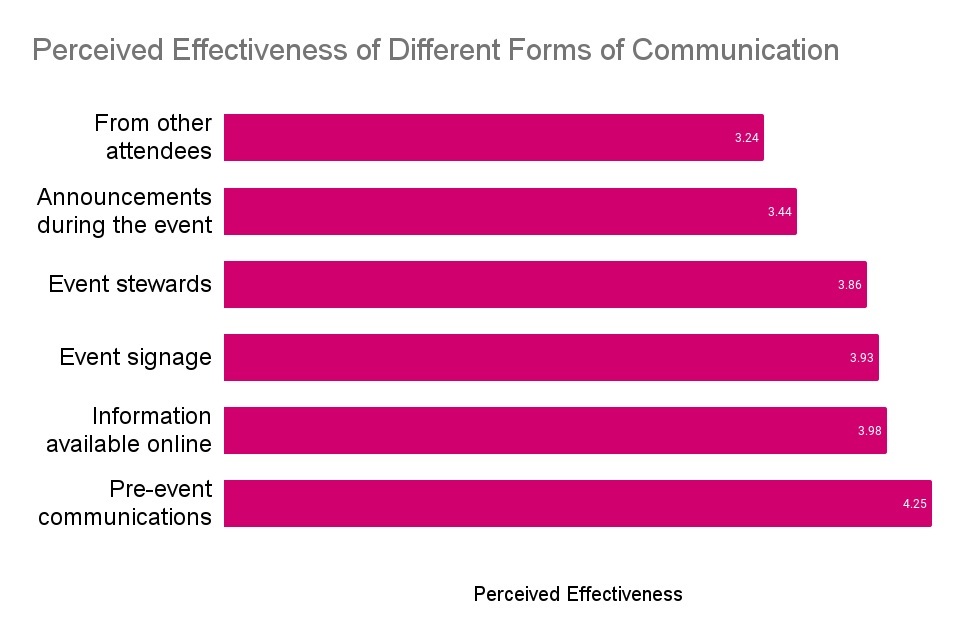
Provision of clear guidance at all stages of the event was found to be key to facilitate adherence to safety measures, with pre-event communications perceived as the most effective for attendees in understanding how to follow COVID-19 safety measures. Information provided in advance of the event allowed participants to plan safer behaviour, fulfil requirements for entry, for example around testing, and emphasised the importance of complying with measures. Stewards were highlighted as particularly helpful at some events in helping attendees understand how to follow the guidance, with the exception of Emirates FA Cup Final where advice from stewards was felt by spectators to disrupt the enjoyment of the event. Effective communication sources will vary depending on the nature of the event, with attendees looking to those they feel are part of their group for information on behaviour.
Figure 10: Perceived effectiveness of different forms of communication about COVID-19 guidance in attendee understanding of safety measures and how to comply, from 1 = very ineffective to 5 = very effective, across the three football matches, snooker competition and the Sefton Park Pilot outdoor music event.[footnote 21]
4.4 Outbreak prevention and control studies
Public health teams and event organisers planned outbreak prevention and control measures for each event, including requiring a negative Lateral Flow Test (LFT) result within 36 hours of the event to gain entry to the venue. The initial target of LFT within 24 hours (ideally as close to the event time as possible) was found to be logistically impractical when using asymptomatic testing sites (ATS). Other risk-mitigation measures included pre-event communications advising not to attend if experiencing symptoms and to minimise unnecessary contacts in the week before/after the event. Participants gave consent to share their data in order to link test results with ticket bookings, and, for events in Liverpool, completed a pre-qualifying questionnaire including questions about vaccination status. Many events invited audiences from a restricted population catchment area for fuller evaluation of COVID-19 epidemiology and contact-tracing. The health protection teams in Liverpool had an enhanced data infrastructure which allowed test results linked to ticket information before events started, which enabled prompt outreach to test-positive individuals and their contacts not to attend, and helped contact tracing teams to prepare to investigate any potential outbreak.
PCR testing on the day and five days later, and public health teams surveillance of other positive tests, enabled subsequent cases associated with pilot events to be identified. Participants were also asked to take voluntary PCR tests via home test kits that were usually posted out to their home address or collected from an ATS or from the event venue. The instruction was to take one test on the day of the event and one 5 days later, with the results of these tests used for research purposes and outbreak control and as a condition for entry. In reality, tests were taken across a spectrum of days therefore we used positive tests from days -1 to 3 to indicate being infectious at the event (termed “index case”), and positive tests from days 4 to 7 to indicate a possibility of having caught coronavirus at the event (termed “putative secondary case”). Further PCR tests were also considered - from people tested after the event because they had symptoms and went for a test, or from people who were contacts of cases and tested on the advice of the tracing service. It is hard to know if positive post-event tests are as a result of transmission at events or other activity carried out by the individual over a similar period. Viral genetic analysis is being completed to see if those cases are linked to the events or not. In the meantime, the cycle threshold values of the PCR positive results have been used to work out whether someone might be an index or putative secondary case.
Return rates for PCR tests were low at pilot events significantly limiting the ability to estimate rates of infection after attending events. Test return rates were higher for the events where tests were posted to attendees and when an incentive, such as the chance to win free tickets, was offered. The proportion of participants returning PCR tests, shown in the table below, varied between 8% and 74% for the ‘pre-event’ (days -1 to 3) test and between 13% and 66% for the ‘post-event’ (days 4-7) test. The music festival offered an incentive of the chance to win future festival tickets and saw a three-fold higher return rate of both PCR tests when compared with the Circus Presents ‘The First Dance’ (nightclub) event held on the same weekend with an approximately comparable audience in Liverpool.[footnote 22] Extremely low PCR test returns were seen in the early days of the World Snooker Championship, when participants had to order tests online. For later events, such as the Emirates FA Cup Final, the BRIT awards show and the Reunion 5k organised run, PCR tests were automatically posted to attendees (rather than needing to order them), leading to higher return rates. The organised run had a particularly high return rate at 61% for both tests. This low and varied level rate of PCR test return significantly limits the direct evidence of transmission from the events, and further reduces the possibility of comparing data pooling across events to give an indication of transmission risks between events. It does, however, provide important behavioural insights, showing that attendees are not sufficiently motivated to get tested after attending an event.
Table 3: Testing rates and test results for Phase I pilots. Index cases are those detected in pre-event PCR tests and therefore infection is assumed to have taken place before the event. Secondary cases associated with events are inferred, or ‘putative’ to date as it is difficult to ascertain exactly where transmission occurred, at the event or in other activities being carried by that individual. Table entries marked with a * were collected through Liverpool’s enhanced public health data systems.
| Event | Event Outbreak Control Measures | PCR Test Return Rates | Cases Associated with Events | |||||
|---|---|---|---|---|---|---|---|---|
| Tickets Included in analysis** (+ scanned* | LFT-ticket linked (before event*) | Pre-event +ve LFT | PCR days -1-3 ‘pre-event’ | PCR days 4-7 ‘post-event’ | Both tests done: ‘pre’ and ‘post’ | Index cases | Putative secondary cases | |
|
The Good Business Festival Venue: ACC Exhibition Centre |
149* | 97%* | 0 | 65 (44%) | 68 (46%) | 51 (32%) | 0 | 0 |
| Circus Presents ‘The First Dance’ (Circus Nightclub), Night 1 | 3140* | 97%* | 1 | 353 (11%) | 830 (26%) | 227 (7%) | 2 | 3 |
| Circus Presents ‘The First Dance’ (Circus Nightclub), Night 2 | 3872* | 98%* | 0 | 312 (8%) | 1185 (31%) | 237 (6%) | 1 | 4 |
| Sefton Park Pilot Venue: Sefton Park, Tented stage |
6101* | 98%* | 4 | 1587 (26%) | 2739 (45%) | 1245 (20%) | 1 | 1 |
| Snooker Competition Venue: Crucible Theatre |
7,483 | 76% | 2 | 1237 (17%) | 1006 (13%) | 603 (8%) | 1 | 5 |
| Emirates FA Cup Semi-Final Venue: Wembley stadium |
2,564* | 86% | 1 | 451 (18%) | 467 (18%) | 171 (7%) | 0 | 0 |
| Carabao Cup Final Venue: Wembley stadium |
6,526 | 87% | 0 | 555 (9%) | 1489 (23%) | 198 (3%) | 0 | 2 |
| BRIT Awards Venue: The O2 |
3,312* | 91% | 0 | 1684 (51%) | 1268 (38%) | 1,125 (34%) | 0 | 0 |
| Emirates FA Cup Final Venue: Wembley stadium |
16,197 | 88% | 2 | 4446 (27%) | 4111 (25%) | 2701 (17%) | 6 | 0 |
| Reunion 5k Venue: Kempton Park |
1,975* | 96% | 0 | 1,454 (74%) | 1,308 (66%) | 1,206 (61%) | 0 | 2 |
| Total | 51,319 | 10 | 12,144 (24%) | 14,471 (28%) | 7,764 (15%) | 11 | 17 | |
| 28 |
Exploratory modelling of transmission risks at nightclubs that was undertaken to complement the pilot studies suggests that primary transmissions in nightclubs are reduced by 53% through testing on the day (between 37% and 71% depending on scenario), by a further 13% through the use of face coverings (10%-29%), and by a further 41% through social distancing (11%-41%). The modelling does not fully account for aerosol and fomite (surface) transmission; is limited by the lack of direct evidence on transmissions in nightclubs; and does not cover onwards transmissions, hotspots, or cross-community infections. The modelling was carried out internally by government and peer-reviewed through the Royal Society Rapid Assistance in Modelling the Pandemic (RAMP) and external UK academics.
Direct evidence of the risk of coronavirus transmission at specific types of events can not be drawn from Phase I of the pilots given the low prevalence of COVID-19 at the time of the pilot events; low levels of pre- and post-event PCR return and the limited scale, scope and design of pilots. Ahead of publishing this report, the Science Board has made a statement that it was not possible to gather direct evidence of transmission and these numbers should not be interpreted as such. The cases recorded are likely an underestimate of the true number given (a) some attendees managed to enter events without proof of LFT negative results, and (b) post-event PCR return rates were lower than expected. In addition, the studies did not include comparison groups, thus making it difficult to attribute infection to attending events.
Mindful of the caveats, no substantial outbreaks were identified by public health teams and their surveillance systems around any of the events. Across all events, of the 15% who returned both PCR tests, there were 28 PCR-positive cases recorded, with 11 considered potentially infected before an event and 17 at or after an event. It should be noted that some individuals were potentially infected before an event despite admittance being conditional on a negative LFT result before the event. Contact-tracing found evidence of symptomatic individuals attending events despite instructions for participants with symptoms not to attend, and one case of an individual seeking multiple LFTs after a positive test to acquire a negative result. 10 of the 28 cases were associated with the Circus Presents ‘The First Dance’ (nightclub) , where PCR return was 6-7% for both tests. Outbreak prevention controls around the Circus nightclub worked well and the event was preemptively flagged by the public health teams as having increased transmission risks.
Pilots also highlighted significant issues in matching event bookings/tickets, test results and wider public health data, except again in Liverpool, where an enhanced combined intelligence system is already in place. This test to ticket matching requirement underpins the testing and tracing infrastructure. Without it, it is impossible to reliably associate attendees’ test results to events and therefore to reliably operate outbreak prevention and control for events. Given some individuals infected before the event were admitted despite admittance being conditional on a negative LFT result, robust contact tracing capacity is necessary.
Higher levels of audience participation in testing and thorough data linkage with public health surveillance systems are needed to better understand the transmission risks around events. The Outbreak Prevention and Control studies in Phase II pilots will look to gather more end-to-end outbreak prevention and control data from larger numbers of people in larger crowd sizes attending higher risk events. Incentives, improved communications and more convenient distribution of test kits will be used to increase PCR returns at Phase II events where these are required. We will implement, where practical, the enhanced risk-mitigation measures in collaboration with public health teams and event organisers, with possible options including: moving the event admittance LFT as close to the event time as possible; automatically voiding tickets when a positive test result is transmitted; improving communication over not attending if you are experiencing symptoms which indicate you are unwell in any way; encouraging uptake of regular testing where there is crossover between those attending (multiple) events; and using AI-supported reading of LFT results uploaded from home testing. The environmental and behavioural studies will continue to expand the evidence on transmission risk factors, particularly under the context of higher audience numbers.
We will also be exploring further in Phase II and Phase III the behavioural impacts of unsupervised home testing on compliance and correct recording. Given that supervised testing is more resource-intensive to operate than home testing, and less accessible to most event-goers, it is likely to be important to the successful delivery of the next two Events Research Programme phases. For example, home testing will be used throughout Phase II to continue to build in existing evidence on gaming via anonymous surveys, as well as the potential impact of risk mitigators such as Artificial Intelligence and spot testing, in order to develop our understanding of the reliability of home testing.
Phase III pilots will involve a significant increase in trialling the use of the NHS App and Lateral Flow Testing, to be used as proof of COVID status. Trials of the NHS App will be run to assess whether it can also be used to display a user’s natural immunity status.
4.5 Operational Learnings
Running the pilots has highlighted that testing, data and contact tracing infrastructure is not currently designed to provide dedicated testing to significant numbers of events. Current asymptomatic testing sites (ATS) and contact tracing capacity has been designed to support local authorities to provide testing for groups who are most likely to be disproportionately impacted by COVID-19 and who may be less able to access testing. Apart from in Liverpool, which is a national pilot site for community testing, the pilots required bespoke changes to testing capacity, for example, at the Emirates FA Cup Final and the Reunion 5k organised run. Current testing distribution networks are therefore not designed to provide testing for significant numbers of events. Pilots also highlighted significant issues in matching event bookings/tickets, test results and wider public health data, except again in Liverpool where an enhanced combined intelligence system is already in place. In future if prevalence rises, directors of public health may develop data sharing agreements with their major venues to facilitate the collection and sharing of data.
The requirement to get a test, and particularly a supervised test, can introduce friction for those planning to attend events which can reduce the likelihood that they attend, particularly for events driven by impromptu decisions such as cinemas, nightclubs and day-trip attractions. For example, a ticketing website for an event that was cancelled saw users spend an average of three minutes and 15 seconds reading the terms of entry specifying supervised testing requirements, but only 1.7% of users then bought a ticket, when previously, without testing requirements, their conversion rate was 18%. There were also higher than usual ‘no-shows’ at Wembley Stadium, which may indicate that people received their tickets and then didn’t want to follow through with the home or supervised testing requirements. Tests for pilot events were free; if consumers had to pay for tests, it would be likely to have a knock on impact on demand and participation, and could exclude or disproportionately impact some demographic groups.
Whilst the majority of the public support the use of testing for risk mitigation, there is a vocal minority who express strong opposition to COVID-status certification. Survey results and public attitudes at pilot events show that the public is overall accepting of testing for event attendance purposes. However, misconceptions surrounding the scope of the programme, specifically around vaccination status (the pilots in the first phase focused solely on testing), generated some significant “vaccine passport” opposition expressed online to some early pilot event organisers. This led to the cancellation of one event.
The use of separate zones as a mitigation to reduce numbers of potential contacts could allow for higher/ full capacity and therefore increase turnover for event organisers. However, this may not be achievable for many forms of venue, such as older, listed buildings or those that may require expensive upgrades to infrastructure.
Staggering entries and exits for larger events could result in significant delays which could both reduce the attendees’ enjoyment of events and increase the amount of time people spend at events. For example football fans are accustomed to leaving early if the result is already decided. Events and venue organisers have noted that this mitigation could result in extra costs, for example in terms of increased staffing. Other key operational considerations are compliance with staggered exits and prioritisation, for example managing the needs of families and people with disabilities.
5 Next steps and further research
The UK is, and will continue to be, world-renowned for its cultural and events sectors which form part of the UK’s ‘soft power’. Phase I of the Events Research Programme (ERP) is one of many UK government initiatives to facilitate the return of a thriving industry which continues to support the UK’s global influence.
The world-leading study has pioneered the development of scientific understanding related to risk-mitigation at events. It has provided important evidence on the variety of settings and differences within venues such as ventilation systems, the organisation of events, venue design, and attendee behaviour. This has provided an understanding of how different settings and mitigations impact specific risk factors. It has also provided significant evidence of the operational, logistical and commercial implications for events of differing types and the heterogeneity found in events settings.
5.1 Key considerations for Phase II and Phase III
The UK government continues to prioritise scientific evidence as the key tool to enable our return to normality and we will therefore continue to progress research to inform events policy. As we look forward to an anticipated move to Step 4 of the Roadmap and a return to greater normality, the government will incorporate and continue to build on findings from Phase I of this internationally acclaimed initiative by running Phase II and III of the programme. These will provide the opportunity to generate further evidence particularly on transmission, using larger events running closer to full capacity and testing different settings. Phase II and III will both inform further improvements to guidance for events organisers at and beyond Step 4 of the roadmap, building on recommendations from Phase I. Phase III pilots will provide evidence about using COVID-status certification in real-world environments via use of the NHS App, developing learnings on operationality and the impact on public health.
5.2 Organised events guidance
Based on findings from Phase I of the ERP, we will update existing guidance, including organised events guidance which is designed to help event organisers and local authorities in England ensure that events are able to go ahead as safely as possible. The guidance will be applicable to any organised event or gathering of any size, both indoors and outdoors. We recommend event organisers consider the risk management advice included in the Organised Events Guidance alongside relevant sector specific COVID-19 guidance. The risk management advice in the guidance will set out a range of options for proportionately managing potential risks in relation to the transmission of COVID-19, but will not remove or replace duties and obligations under the Health and Safety at Work etc Act 1974. Instead, it will provide information to assist event organisers and local authorities in England in ensuring that events are able to go ahead as safely as possible in their area.
Annex A: Science Board membership
The ERP governance structure has an independently-chaired Science Board, which brings together clinical and scientific experts. The Science Board provides scientific assurance across the programme and ensures events are following ethical and scientific principles and that they generate evidence of sufficient quality to inform decisions. Membership of the Science Board is outlined below, and selected to provide coverage of key, relevant areas. Research investigators also observed meetings alongside representatives from government departments, including BEIS, Cabinet Office and DHSC.
Membership:
| Name, job title | Role |
|---|---|
| Prof Dame Theresa Marteau | Chair |
| Prof Tom Rodden, DCMS CSA | Member |
| Prof Paul Monks, BEIS CSA | Member |
| Prof James Calder | Member (Testing) |
| Dr Jenifer Smith | Member (Public Health) |
| Dr Shaun Fitzgerald | Member (Ventilation, with coverage of other environmental measurements) |
| Prof John Edmunds | Member (Modelling) |
| Prof Michael Parker | Member (Ethics) |
| Jennet Woolford | Member (Analysis) |
| Dr Matthew Boulter | Member (Public Health, Testing) |
Annex B: Summary of Phase I pilot events
| Events | Date | Estimated no. of participants | Event Partner(s) | Setting being tested | Rationale/ Research Questions | Summary |
|---|---|---|---|---|---|---|
| World Snooker Championship Location: Sheffield |
17 April-3 May | 10,147 across 17 days(confirmed) | World Snooker, The Crucible Theatre, Trivandi, Sheffield City Council, Sheffield Hallam University testing site | Indoor seated(theatre style) | To examine transmission including aerosol risks and variables e.g. reduced social distancing in medium-sized indoor venues. | Working in partnership with World Snooker, Sheffield Theatres and Trivandi, this event consisted of 17 days of indoor snooker. Attendees were required to provide proof of a negative LFT result within 36 hours of the session they aimed to attend. Attendees wore face coverings at all times unless exempt. As the events progressed the social distancing mitigations were reduced iteratively with the final round running at 100% capacity, with c.900 attendees. Over the course of the tournament 10,147 attended the event. |
| FA Cup Semi-Final Location: London |
18 April | 2,800 (confirmed) | Football Association, Trivandi, Brent London Borough Council | Outdoor seated | To examine transmission including setting a baseline for future Wembley events. 90% of participants from Brent, fully socially distanced (1m+). | The FA Cup Semi-final at Wembley was delivered in partnership with the Football Association, Brent Council and Trivandi. Attendees were required to provide proof of a negative LFT result within 24 hours hours. The Semi-final was contested between Leicester City FC and Southampton FC, but the majority of the audience was taken from the local borough (Brent) in line with covid regulations on travel. Supporters were socially distanced within the stadium and wore masks throughout the match. This event was designed to give insight into future matches due to be hosted at Wembley. In total 2,800 fans attended. |
| Carabao Cup Final Location: London |
25 April | 7,800 (confirmed) | English Football League, Football Association, Trivandi, Brent London Borough Council | Outdoor seated | To examine transmission including contact risks in large outdoor venues, with reduced social distancing (0.9m). | The Carabao Cup Final was delivered in partnership with the English Football League, the Football Association and Trivandi. Attendees from both clubs were allowed to attend on the basis that they complete an LFT within 24 hours of attending. The match was contested by Manchester City and Tottenham Hotspur. Each club was allocated 2,000 tickets for supporters to replicate a club supporter environment. Supporters from Manchester City were bussed or transported by dedicated trains to London by the club to reduce the pressure on the transport network. Within the stadium the attendees were socially distanced (0.9m, a seat width) and wore face coverings throughout. In total, 7,800 supporters attended. |
| ACC Business Event Location: Liverpool |
28 April | 240 (confirmed) | Liverpool City Council, Trivandi, ACC Liverpool Graphnet, Ticket Quarter, CIPHA | Indoor mixed open/seated | To examine transmission, aerosol and contact risks in medium-sized indoor venues. | This event was delivered in partnership with Liverpool City Council, Trivandi, ACC Liverpool, Graphnet, Ticket Quarter, and CIPHA. A test to ticket solution was designed and utilised which automatically validated or invalidated tickets based on the results of LFT tests taken at registered Asymptomatic Testing Sites in the Liverpool City region. Attendees were required to complete an LFT within 36 hours of attending. Once inside the event no mitigations were in place. The event was used as a test of the process for larger events. Within the event attendees mingled, watched keynote speakers and the afternoon culminated in drinks and a comedy set. In total, 240 people attended. |
| Circus Nightclub Location: Liverpool |
30 April-1 May | 3,400 (Friday) and 3,700 (Saturday) | Liverpool City Council, Trivandi, ACC Liverpool, Graphnet, Ticket Quarter, CIPHA, Events UK | Indoor open | To examine transmission, aerosol and contact risks in a club setting. A BEIS priority. | This event was delivered in partnership with Liverpool City Council, Trivandi, ACC Liverpool, Graphnet, Ticket Quarter, CIPHA and Events UK and consisted of two days of nightclub events. The international line-up of DJs performed to crowds of 3,400 and 3,700 respectively. A test to ticket system was utilised which was used to invalidate the tickets of attendees with a positive or voided LFT result. 96% of prospective attendees were matched with negative test results and therefore were able to proceed to the event. In total, 7,100 people attended. |
| Sefton Park Pilot Location: Liverpool |
2 May | 5,900 (confirmed) | Liverpool City Council, Trivandi, ACC Liverpool, Graphnet, Ticket Quarter, CIPHA, Live Nation | Outdoor unstructured | To examine risks and mitigations for unstructured outdoor music events with younger demographic. | A day festival in Sefton Park was delivered in partnership with Liverpool City Council, Trivandi, ACC Liverpool, Graphnet, Ticket Quarter, CIPHA and Live Nation. The team deployed a test to ticket system which was used to invalidate the tickets of attendees with a positive or voided LFT result. Around 96% of prospective attendees were successfully matched with negative LFT results (within 36 hours). The event was held outside with no social distancing or face coverings required. In total, 5,900 people attended. |
| BRIT Awards Location: London |
11 May | 3,532 | The BRITS Awards/BPI, The AEG/02 Arena, Royal Borough of Greenwich, Trivandi | Indoor seated(mixed styles) | To examine transmission, aerosol and contact risks in large indoor venues. | The BRIT Awards show was delivered in partnership with the BRITS, BPI, AEG/O2, Royal Borough of Greenwich and Trivandi. It took place at the O2 arena to a live audience. The audience were made up of key workers from the London area who entered a ballot for tickets. To gain entry, all attendees had to take a LFT at an Asymptomatic Test Site (ATS) within 36hrs of the event starting and show a negative test result along with their ticket and ID at the checkpoints. For this event, automated PCR tests were delivered for pre and post event testing - a key part of the transmission study. Whilst moving around the venue, masks were worn and social distancing applied, but within the Arena Bowl (both seats and suites) social distancing and mask wearing were not required.. The event ran at 35% capacity and a total of 3,532 people attended. |
| Reunion 5k Location: Kempton Park, Surrey |
15 May | 1,875 participants & 106 spectators | London Marathon Events Limited (LME), Surrey County Council, Trivandi | Outdoor open | To examine transmission including contact risks in mass participation running events. | Two mass participation runs with spectators at Kempton Park Racecourse were delivered in partnership with LME, Surrey County Council and Trivandi. The decision to condense races was taken in the week due to low sales and to even out numbers across races. All participants and spectators accessing the site had to undertake a LFT test, either at home or at an Asymptomatic Test Site, and present a negative test result to gain entry. Five people were turned away without a test result having declined onsite testing mitigation. Automated PCR tests were delivered for pre and post event testing. The first race one was fully socially distanced, but as spectators were outside mask wearing was not mandatory . The second race was not socially distanced. The event did run under capacity and didn't achieve its initial participant target numbers. Drop off rates were about average for an event like this and the poor weather on the day may have deterred spectators. In total, 1,875 runners took part, watched by 106 spectators. |
| FA Cup Final Location: Wembley |
15 May | 22,000 capacity 18,720 (confirmed) |
Football Association, Trivandi, Brent London Borough Council | Outdoor seated | To examine transmission including contact risks in large outdoor venues. | The FA Cup Final was delivered in partnership with the Football Association, Brent Council and Trivandi. Each club was allocated 6,250 tickets. Ticket holders from both clubs and the Brent area were allowed to attend on the basis that they completed an LFT test within 36 hours of the event and tested negative. 3,600 Leicester City ticket holders were bussed by dedicated coaches, with the remaining Leicester and Chelsea fans travelling by train or car. Masks were required to be worn by attendees at all times. Ticket holders were socially distanced, with 0.9m between each seat. In total, 18,720 supporters attended. |
-
Confirmed cases in England during this period were (on a 7-day average) between 1.6k-1.9k cases per day (a 7-day incidence of ~20 per 100k) ↩
-
Scientific Pandemic Influenza Group on Modelling (SPI-M) and the Independent Scientific Pandemic Influenza Group on Behaviours (SPI-B)produced reports on large events as part of an early commission from DCMS (August 2020) ↩
-
As recommended by the Chartered Institution for Building Services Engineers (CIBSE) and based on advice from the Scientific Advisory Group for Emergencies (SAGE). ↩
-
While we know when these 17 positive cases were recorded at or around the time of the event we are unable at this point to say that these were contracted due to attendance at an ERP event ↩
-
There is no official ‘events’ sector. We have defined events generally as all sectors where you would be required to purchase a ticket to gain entry which would be for a specific activity such as watching a match. Weddings are therefore not included here although evidence from the ERP will help inform how best to safely run weddings after June 2021. ↩
-
We have mapped the settings (indoor / outdoor, seated / unseated) to specific sectors (see Figure 1) to estimate this. These estimates are based on aGVA (approximate GVA), rather than GVA (which is used for the total economy), and estimate activity only related to events as defined in earlier footnote, and as such are not consistent with DCMS’s regularly reported economic estimates or many other estimates. ↩
-
For the purposes of mapping, sectors have generally been assigned to the setting where the majority of their activity occurs - eg: cinemas to all indoor/seated. There are a few sectors - such as attractions - which fall significantly across several settings. ↩
-
DCMS asked a SAGE-EMG led working group involving participants from various SAGE subgroups to produce a scientific framework as the basis for the ERP that was signed off by SAGE. ↩
-
Transmission of SARS-CoV-2 and Mitigating Measures - update, 4 June 2020 ↩
-
Outbreaks covering a range of settings have been reported in academic articles such as Wellcome Open Research and databases of outbreaks collated by projects including SARS-CoV-2 Superspreading Events from Around the World. It is worth noting that this literature may be biased in this regard, as it tends to report only on significant outbreaks and there are no corresponding reports for the many events that pass without incident. ↩
-
SAGE 52 (August 2020) ↩
-
As set by the Chartered Institution for Building Services Engineers (CIBSE) and based on advice from the Scientific Advisory Group for Emergencies (SAGE). ↩
-
CO2 is measured in parts per million (ppm). CIBSE guidelines suggest that levels over 2000 “must be improved”, 1500-2000pp would be a “priority for improvement” and 800-1000ppm would indicate “good air quality”. ↩
-
The CIBSE COVID guidance suggests that areas used for aerobic activity venues should aim for CO2 concentrations to be below 800ppm and recommends additional transmission risk mitigations such as reduced exposure (occupancy) times, face coverings for audiences and restricting the size of groups and duration of activities. ↩
-
Above the 1500ppm CIBSE design guidance ↩
-
CO2 levels of 1000 ppm were used as indicative of a well ventilated office ↩
-
At the first match, with 2,800 attendees, there were 0.12 colony forming units (CFU) per m2 on samples taken from handles or rails, whereas at the second and third football match measurements were 1.86 CFU/m2 and 2.16 CFU/m2, with attendances of 7,800 and 20,000 respectively. ↩
-
At the time of writing, figures on face covering compliance in Wembley stadium’s seating bowl for the Emirates FA Cup Final were unavailable. Averages shown throughout this section are averages of individual samples, unweighted. ↩
-
All events where face coverings were required when leaving, with the exception of Emirates FA Cup Semi-Final where face coverings on exit were undetectable from footage. ↩
-
The three football matches and the BRIT awards ceremony ↩
-
Survey data was collected from a total of 2,502 attendees across Emirates FA semi-cup final (277 participants, 10.2% response rate from 2,contributed by indoor seated settings, 38% by outdoor seated settings, 13% by indoor unseated settings, and 10% by outdoor unseated settings.#728 attendees), Carabao Cup Final (511 participants, 6.6% response rate from 7,737 attendees) and Emirates FA Cup Final (1,329 participants, 7.1% response rate from 18,720 attendees), the Snooker Competition (53 participants, 0.5% response rate from 10,147 attendees), and the outdoor Sefton Park Pilot music event (332 participants, 5.4% response rate from 6,101 attendees). ↩
-
Liverpool’s enhanced public health data systems allow for public health teams to access data on tickets scanned on entry to events and LFT tests to be linked to tickets pre-event. ↩