DCMS-sponsored museums and galleries annual performance indicators 2019/20
Published 28 January 2021
Applies to England

© Crown copyright 2021
This publication is licensed under the terms of the Open Government Licence v3.0 except where otherwise stated. To view this licence, visit nationalarchives.gov.uk/doc/open-government-licence/version/3 or write to the Information Policy Team, The National Archives, Kew, London TW9 4DU, or email: psi@nationalarchives.gov.uk.
Where we have identified any third party copyright information you will need to obtain permission from the copyright holders concerned.
This publication is available at https://www.gov.uk/government/statistics/dcms-sponsored-museums-and-galleries-annual-performance-indicators-201920/dcms-sponsored-museums-and-galleries-annual-performance-indicators-201920
Released: 28 January 2021
Geographic coverage: England
This release presents the annual performance indicator data collected by DCMS-sponsored museums and galleries for the financial year 2019/20 at the national level for England. Data for individual museums and galleries are available in the accompanying tables.
The performance indicators are:
Access
- Number of visits to the museum/gallery
- Number of unique website visitors
Audience profile
- Number of visits by children under 16
- Number of overseas visits
Learning and outreach
- Number of facilitated and self-directed visits to the museum/gallery by visitors under 18 in formal education
- Number of instances of visitors under 18 participating in on-site organised activities
Visitor satisfaction
- Percentage of visitors who would recommend a visit
Regional engagement
- Number of UK loan venues
Self-generated income
- Self-generated income - admissions
- Self-generated income - trading income
- Self-generated income - Charitable giving (fundraising/contributed income)
Data collection methods vary between institutions and performance indicators. DCMS does not provide a prescribed way to collect the data, and provides the flexibility to the museum and gallery to adopt a cost efficient data collection technique. Additional information explaining how the data is collected is available in the Performance Indicator Guidance.
Headline findings
In 2019/20, there were 47.6 million visits to DCMS-sponsored museums and galleries, an increase of 41.7% from 33.6 million visits in 2002/03 when records began (Figure 1), but a decrease of 4.4% from 2018/19 (the year with the highest number of visitors recorded for the current portfolio of museums).
Museums and galleries were closed during lockdown from 17 March 2019. Visitor numbers in March 2020 were 63.4% lower than in March 2019. Total visitors for the year excluding March 2020 (April 2019 to February 2020) were 46.0 million, an increase of 1.0% on the same period in the previous year.
Based on these data it appears that lockdown measures changed the trend of total museum visitor numbers from increasing to decreasing between 2018/19 and 2019/20.
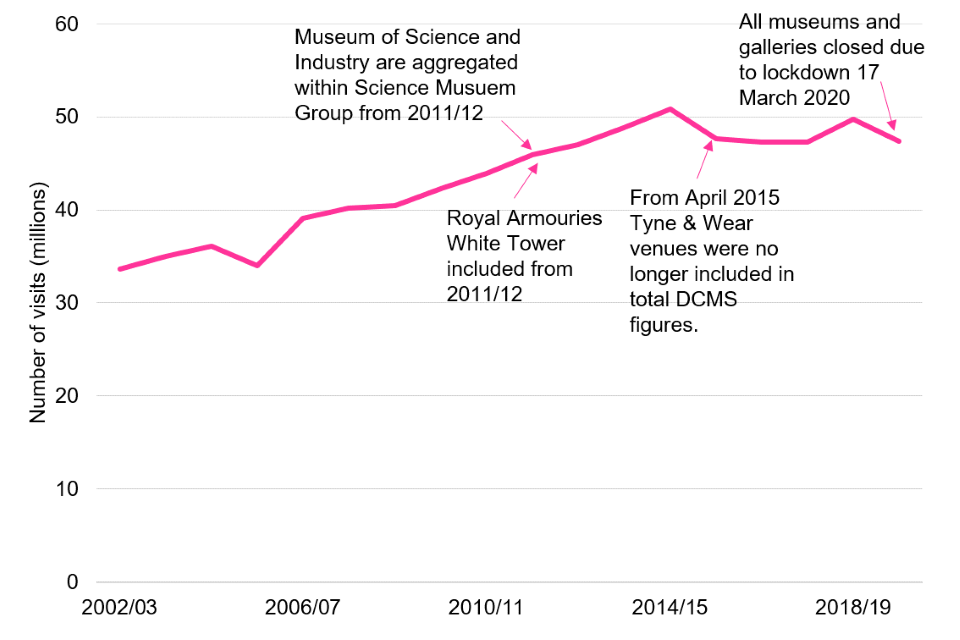
Figure 1: Total number of visits to DCMS-sponsored museums and galleries, 2002/03 to 2019/20
Total visits to sponsored museums and galleries have levelled out from a high point of over 50 million in 2014/15. The group of sponsored museums has changed over this period, in particular with the Museums of Science and Industry aggregated within the Science Museum Group from 2011/12, Royal Armouries White Tower included from 2011/12, and Tyne & Wear venues no longer included from April 2015.
Of the total visits, 16.6% were made by children under the age of 16. 50.8% were made by overseas visitors.
The total self-generated income for DCMS-sponsored museums and galleries was £315 million, an increase of 9.0% from £289 million in 2018/19. These data have not been adjusted for inflation.
Chapter 1: Access to DCMS-sponsored museums and galleries
Visitors
In 2019/20, there were 47.6 million visits to DCMS-sponsored museums and galleries. This is the third highest figure since the start of records in 2002/03, adjusted to the currently sponsored group of institutions.
There was a 4.4% decrease in the total number of visits from 2018/19 to 2019/20. However, as total visits for the year excluding March 2020 (April 2019 to February 2020) increased by 1.0% compared to the same period in the previous year, we expect that the overall fall is predominantly due to closure of the museums and galleries from the 17th March as part of national lockdown measures.
When calculating percentage changes the Museum of the Home has been excluded, as during refurbishment the only visitors are to ticketed events, and visitor numbers will be inconsistent with prior years.
When calculating proportions of total visits for visitor sub-groups, for example the proportion of total visits that were child visitors, visitors to the National Coal Mining Museum England and visitors to the Museum of the Home have been excluded. These museums only collect total visitor numbers and cannot produce disaggregations by visitor characteristics.
Website visits
In 2019/20, there were a total of 127.7 million unique website visits to DCMS-sponsored museums websites, reflecting an average year on year increase of around 5% since 2014/15 and an increase of 3.6% from the previous year (123.2 million).
Due to changes in the software used to measure website visits by many of the museums at several points over time, these figures may not be directly comparable between the years.
DCMS also publishes the Taking Part survey, which includes questions on visits to museums and galleries (not limited to DCMS-sponsored institutions).
Chapter 2: Audience profile
Child visitors
There were 7.9 million child visits to all DCMS-sponsored museums and galleries in 2019/20, accounting for 16.6% of total visits, broadly the same proportion as in 2018/19. This was a 6.7% decrease in the absolute number of child visits from 8.5 million child visits in 2018/19. We expect about half of this decrease to be due to the national lockdown measures introduced on the 17th March 2020.
Overseas visitors
There were an estimated 24.2 million overseas visits to DCMS-sponsored museums in 2019/20, accounting for 51.1% of all visits. Despite the closure of the museums due to national lockdown measures from the 17th March, this was a 1.9% increase in the absolute number of visits from 23.8 million visits in 2018/19, and a record figure since 2002/03, when records began.
There is substantial variation between museums in the proportion of total visits accounted for by visitors from overseas; for example,overseas visitors accounted for only around 10% of total visitors to the Horniman museum, and 20% of visitors to National Museums Liverpool, but over 58% of the visitors to the Royal Museums Greenwich, the National Gallery, and the British Museum. For full results see table 4 in the associated spreadsheet.
Chapter 3: Learning and outreach
Educational visits by under 18 year olds
In 2019/20, there were 2.3 million instances where visitors under the age of 18 participated in onsite organised activities at the DCMS-sponsored museums and galleries. This was a fall of 14.1% from 2018/19, continuing a 2 year trend from and returning to levels observed before 2017/18.
There were just over 2.0 million facilitated and self-directed visits by visitors under 18 and in formal education in 2019/20, a decrease of 1.7% from 2018/19. We expect that this decrease is due to the closure of the museums due to national lockdown, and that the number of these visits would have otherwise risen between 2018/19 and 2019/20.
These educational indicators are separate from the child visits indicator mentioned above and are collected via a separate system to that of the child visits.
Chapter 4: Visitor satisfaction
In 2019/20, an average of 95.5% of all visitors to the DCMS-sponsored museums and galleries would recommend a visit to a friend or family. This is similar to 2018/19, and is unlikely to have been affected by the national lockdown as it is a percentage of total museum visitors.
The proportion of visitors who would recommend a visit is defined as those who answered ‘How likely are you to recommend a visit to your friends or family’ with ‘definitely will’ or ‘probably will’.
Chapter 5: Regional Engagement
Visits to museum and gallery sites outside London
There were a total of 6.9 million visits to DCMS-sponsored museums and galleries outside of London in 2019/20, a decrease of 17% from 8.3 million in 2018/19. In contrast, visits to museum and gallery sites in London decreased by 2.0% from 41.3 million in 2018/19 to 40.5 million in 2019/20 (for number of visits by individual museum, see Table 1).
A list of the national museums located outside London can be found in the strategic review of DCMS-sponsored museums, page 23.
UK loan venues
The number of venues in the UK that the DCMS-sponsored museums and galleries loaned their items to, decreased by 4.9% from 1,348 in 2018/19 to 1,281 in 2019/20.
A loan venue is defined as any approved borrowing institution, organisation, exhibition facility, or individual researcher who has been loaned an item from one of the DCMS-sponsored museums and galleries. Loaning items from permanent collections is not practical for every museum or gallery.
For more detail on museum partnership activities see the museum partnership report.
Chapter 6: Self-generated Income
Self-generated income
The total self-generated income for DCMS-sponsored museums is made up of fundraising, admissions income and trading net profit. DCMS publishes a separate report on total income of DCMS-funded cultural organisations, the next edition of which (covering the 2019/20 financial year) will be published this year. A breakdown of total income by type is given in Figure 2.
Figure 2: Total self-generated income by source for DCMS sponsored museums and galleries in 2019/2020
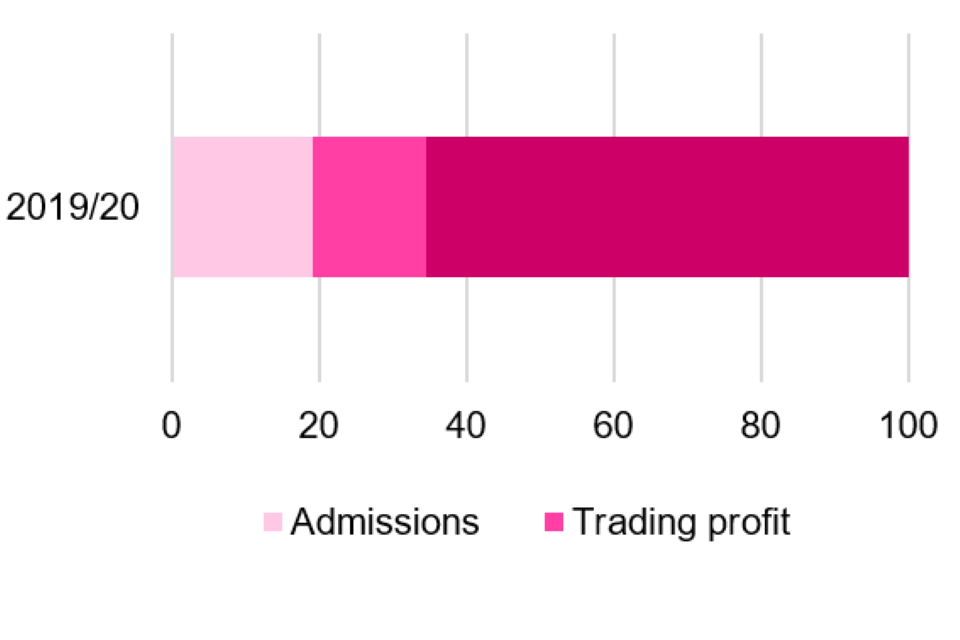
In 2019/20, the total self-generated income for DCMS-sponsored museums and galleries amounted to £315 million, an increase of 9.0% on 2018/19. This consisted of:
- £206.8 million (65.6%) from fundraising/contributed income, an increase of 14.8% from 2018/19 (£180.0 million)
- £60.9 million (19.3%) through admissions, a decrease of 0.6% on the 2018/19 figure of £61.0 million, which was a record year
- £47.7 million (15.1%) trading net profit, a fall of 1.3% on the 2018/19 figure of £48.4 million
Background note
Sponsored Museums: Performance Indicators is an Official Statistic and has been produced to the standards set out in the Code of Practice for Official Statistics. Additional information is available here.
The data are collected by the museums through sample surveys, with the exception of the information on educational visits and total visits, which are based on actual counts.
Sponsored Museums Performance Indicator publications previously included data on:
- Adult visits by NS-SEC group, ethnicity and whether visitors considered themselves to have a long term illness, disability or infirmity
- The number of instances of children participating in outreach activities outside the gallery
- The number of instances of adults aged 16 and over participating in organised activities at the museum/gallery
- The number of instances of adults aged 16 and over participating in outreach activities outside the museum/gallery
Following consultation with the sponsored Museums and Galleries, the data outlined above were no longer collected from 2012/13 onwards to reduce the burden of data collection on the Museums and Galleries. If you have a continued user need for these data, or additional comments on this statistical release, please contact evidence@dcms.gov.uk or the DCMS- sponsored museums directly.
The responsible statistician for this release is Rachel Moyce. For enquiries on this release, please contact evidence@dcms.gov.uk
For general enquiries contact:
Department for Digital, Culture, Media and Sport
100 Parliament Street
London
SW1A 2BQ
Telephone: 020 7211 6000
The next Sponsored Museums and Galleries Annual Performance Indicators release is scheduled for Autumn 2021.
DCMS statistics can be followed on Twitter via @DCMSInsight.