Evaluation of the Help to Buy scheme: evaluation findings report
Updated 16 September 2026
Applies to England

© Crown copyright 2026
This publication is licensed under the terms of the Open Government Licence v3.0 except where otherwise stated. To view this licence, visit nationalarchives.gov.uk/doc/open-government-licence/version/3 or write to the Information Policy Team, The National Archives, Kew, London TW9 4DU, or email: psi@nationalarchives.gov.uk.
Where we have identified any third party copyright information you will need to obtain permission from the copyright holders concerned.
This publication is available at https://www.gov.uk/government/publications/evaluation-of-the-help-to-buy-scheme/evaluation-of-the-help-to-buy-scheme-evaluation-findings-report
Authors: Verian with Alma Economics and the Centre for Regional Economic and Social Research at Sheffield Hallam University.
Acknowledgements
We are particularly grateful to the members of the independent Advisory Group and those who provided specialist methodological advice for their invaluable guidance, expertise and constructive challenge throughout the evaluation.
Thanks also go to the Help to Buy customers who participated in surveys and interviews and generously shared their experiences and to the mortgage lenders and housing developers who participated in interviews and provided valuable insights into the delivery and operation of the scheme.
We would like to acknowledge Homes England for facilitating access to scheme and administrative data and for their support throughout the evaluation.
Finally, we recognise the contribution of colleagues across the Ministry of Housing, Communities and Local Government, whose expertise, commitment and support were invaluable to the successful delivery of this work.
Glossary
Arrears – To be in ‘arrears’, an individual is behind on paying money that was owed at an earlier date. In the context of the Help to Buy scheme, this means that an individual is behind on their equity loan interest payments.
Credit score – A credit score is a 3-digit number which represents an individual’s credit risk, for example how likely an individual is to pay their bills on time.
Customer – In this report, a customer refers to individuals who purchased a property through the Help to Buy scheme.
Debt – To be in ‘debt’, an individual owes a sum of money to another party.
Developer – In this report, a developer refers to house builders who built properties to be sold through the Help to Buy scheme.
Equity loan – In the context of Help to Buy, an equity loan refers to a loan where the repayment value is determined by any change in value of the property. For example, if an individual purchased a property for £100,000 using a 20% equity loan (borrowing £20,000), and the value of the property increased to £120,000, the individual would owe £24,000 at repayment to reflect the value increase.
Help to Buy Terms – The terms of the Help to Buy scheme include the need for a customer to pay interest on their equity loan (after the 5-year interest free period), pay a management fee and repay the equity loan in full (relevant to the new valuation price of the property). More information on the terms of the scheme is here: Help to Buy: Equity Loan.
Homes England (HE) – A non-departmental public body that funds new affordable housing in England.
Interest – Interest refers to the cost of borrowing money. For example, by borrowing money from a bank for a mortgage, an individual would owe ‘interest’ to reflect the money borrowed.
Interest free period – In the context of the Help to Buy scheme, the interest free period relates to the 5 years after purchasing a property where the customer was not charged interest on their equity loan.
Lender – In this report, a lender refers to building societies, banks and mortgage brokers who are both participants and non-participants of the Help to Buy scheme.
Loan administrator – For the Help to Buy scheme, the equity loan administrator means the organisation which handles the administration for customers making payments. Loan administrators can make changes to the equity loan agreement and customers are able to ask them questions about the scheme.
Loan to value (LTV) – LTV refers to how much individuals are borrowing compared with how much the property is worth. It is shown as a percentage. For example, if a property is worth £200,000 and the mortgage is £150,000, the loan‑to‑value is 75%.
Mortgage – An agreement with a bank or building society who lends an individual money to purchase a property. This will be paid back over time by the individual, with the individual paying interest on the re-payments.
Mortgage broker – A person or company that arranges a mortgage between an individual purchasing a property and the lender.
New build – A new build property is one that is brand new and has had no previous occupants.
New build premium – A new build premium refers to a higher price paid for a new build property compared to the price of a similar existing property.
Redemption – In the Help to Buy scheme, redemption refers to a customer paying back the money owed on the equity loan.
Re-mortgaging – The process of replacing a current mortgage agreement with a new one on the same property.
Second-hand property – An existing property which has had previous tenants, as opposed to a new build property.
Shared Ownership – This is a government-backed home buying scheme which uses a ‘part-buy, part-rent’ element. Customers purchase a share of the property from a housing association or landlord and pay rent on the remaining share. This scheme is still active as of 2026.
1. Executive summary
1.1 Scope and purpose
The Ministry of Housing, Communities, and Local Government (MHCLG) commissioned Verian, Sheffield Hallam University and Alma Economics to deliver this evaluation of the Help to Buy scheme in England over the period 2013 to 2023. Between October 2024 and December 2025, the project team conducted primary qualitative and quantitative research with customers, developers and lenders, as well as analysis of secondary datasets. The evaluation was supported by an independent advisory group, whose role was to scrutinise the research instruments and analytical approaches and to review the emerging analysis findings and evaluation outputs. The analysis and findings presented in this report are the responsibility of Verian, Sheffield Hallam University and Alma Economics. They relate to the impact of the scheme on home ownership, housing supply and house prices; its value for money; and customer experience of using the scheme. The final section of this report draws conclusions on the impact of the Help to Buy scheme from findings across the evaluation.
1.2 Background
The Help to Buy scheme was launched in 2013, aiming to tackle affordability as an obstacle to home ownership and to increase housing supply (HM Treasury, 2013).
The scheme had 2 iterations, with different entry conditions and operating in different economic and social contexts. The first iteration of the scheme (Help to Buy 1) was open to all types of buyers who were purchasing a new build property with a purchase value under a national-level price cap (£600,000). Help to Buy 1 was active from 2013 to 2021. The second iteration of the scheme (Help to Buy 2) restricted access to first-time buyers (FTBs) and applied regional-level price caps to the properties that could be bought through the scheme. Help to Buy 2 was active from 2021 to scheme end in 2023.
The core scheme design was the same for both iterations. The scheme provided an equity loan to enable recipients to purchase a property. The loan was worth up to 20% of the property value (increased to 40% in London from February 2016). This made homes more affordable for customers and reduced the risk for banks and building societies of lending a mortgage to these customers in the short term. As demand for buying homes grew, developers were expected to build more houses and faster, increasing housing supply overall.
In the 10-year period that the Help to Buy scheme was operating, there were a wide range of contextual factors that influenced how the scheme affected lenders, developers and customers. These include:
- the Help to Buy scheme launched in a post 2008 financial crisis context of low home building and buying
- interest rates remained low throughout the 2010s and during Help to Buy 1, but rose during Help to Buy 2 following the 2022 ‘Growth Plan’ (‘mini budget’)
- EU exit referendum (2016) leading to uncertainty in the housing market
- additional Stamp Duty Land Tax was increased for second homes in 2016
- Stamp Duty Land Tax holidays for FTBs in 2017, 2020, 2021 and 2022
- reduction of buy-to-let mortgage relief in 2017
- the Housing White Paper (2017) triggered policy changes to boost housing supply and speed up construction through planning reforms
- the Grenfell tower fire (2017) triggered policy changes around the safety regulations of high-rise flats
- the COVID-19 pandemic (2020 to 2022) affected home building and buying
1.3 Evaluation approach
The evaluation involved multiple strands of research. The primary research included a survey of 5,869 Help to Buy scheme customers plus 21 qualitative interviews with developers, 12 with lenders and 40 with Help to Buy scheme customers. Verian conducted secondary analysis of customer outcomes from the Homes England Customer Database, the English Housing Survey and data from Land Registry and UK Finance. Verian also estimated the impact of the scheme on home ownership, housing supply and house prices using a quasi-experimental counterfactual-based design, while Sheffield Hallam University measured the scheme’s impact on developer profits and market share, and Alma Economics conducted the value for money evaluation.
1.4 Evaluation findings
This report outlines findings against 6 themes: home ownership, housing supply, developer performance, house prices, value for money and customer experience.
The 2 main objectives of the Help to Buy scheme were to increase access to home ownership and to boost housing supply. The evaluation found evidence that suggests the introduction of the Help to Buy scheme had a positive effect on both of these outcomes. The scheme was introduced at a point where FTB mortgage sales and new homes were still at a low point following the financial crisis. The evidence from the evaluation suggests that the Help to Buy scheme contributed to increased confidence among developers, leading in turn to a fairly widespread recovery in the number of new developments being completed over the first years of the scheme.
Increased access to finance through the scheme also led to an increase in the number of FTB mortgage sales in England, supported by the increase in supply. However, the effect on home ownership varied between different types of area. In particular, there was little effect on home ownership in areas that were already relatively less affordable before the Help to Buy scheme started. These were also the areas where prices increased the most. This suggests that the Help to Buy scheme may have driven up prices in these relatively more expensive areas, so that buying a home remained out of reach for many potential FTBs.
The evaluation found little evidence that the change to Help to Buy 2 (in 2021) or the end of the English scheme (in 2023) had a substantial effect on new housing supply. This could indicate that the scheme was less needed at these points in time. Developer confidence had already improved since the financial crisis. Additionally, the mortgage market had changed by this point with more high loan to value (LTV) loans available for FTBs outside of the Help to Buy scheme. However, the evaluation did find some evidence for a negative impact of the closure of the Help to Buy scheme on FTB mortgage sales in England. This suggests the scheme was still playing a role in supporting some people into home ownership at this time, especially with higher interest rates creating additional affordability pressures for many potential FTBs.
1.4.1 Home ownership
The evaluation found that the introduction of the Help to Buy scheme led to an increase in the number of FTB mortgage sales, but not in all areas of England. Approximately half of Help to Buy customers said they could have bought a home without the scheme, indicating some deadweight for the scheme.
Comparing areas close to the England/Wales border (where housing markets are likely to be reasonably similar), the number of FTB mortgage sales increased faster on the English side of the border than on the Welsh side. Under the assumption that the trends would have been similar on both sides of the border without the scheme, around 15 to 30% of FTB mortgage sales on the English side can be attributed to Help to Buy over the course of Help to Buy 1 and Help to Buy 2. As explained in detail in the report, the evaluation uses a number of techniques to explore the impact of Help to Buy, one of which is to exploit the differences in schemes between England and Wales, and the earlier introduction of a scheme in England, to try to isolate the effects of the scheme in otherwise similar housing markets on either side of the border.
However, these trends do not generalise across to the rest of England. The evidence suggests that the Help to Buy scheme had little effect on FTB mortgage sales in more expensive areas, where home deposits typically paid by FTBs were already high before the scheme. These areas also saw the largest increases in prices following the introduction of the Help to Buy scheme. As such, the evidence of this evaluation suggests that the Help to Buy scheme led to an increase in prices in areas that were already relatively expensive, meaning properties in those areas remained too expensive for many FTBs despite the scheme. Whilst housing supply increased across different types of area, higher prices in already expensive markets meant that increased supply did not necessarily translate into improved access for FTBs. There is little evidence that the change to Help to Buy 2 had a further effect on home ownership. This could indicate that the scheme was less needed to support FTBs by the time Help to Buy 2 started in 2021. In particular, high LTV mortgages were more commonly available by 2021, meaning FTBs had more options for housing finance beyond the equity loan offered through Help to Buy.
However, the closure of the Help to Buy scheme in England appears to have had a negative effect on home ownership, leading to a reduction in the number of FTB mortgage sales of approximately 10-15% compared to what would have happened with the scheme. This analysis is based on comparing trends at the England/Wales border and across England and Wales as a whole. In both cases, the number of FTB mortgage sales was falling after 2021 (likely in part because of higher interest rates creating additional affordability pressures for monthly repayments) but fell slightly more in England than in Wales. This suggests the scheme continued to have some effect on home ownership, even if the scale of this effect was smaller than when the Help to Buy scheme was first introduced in 2013.
The evidence for an effect on home ownership is supported by the customer survey, which found that 46% of Help to Buy customers in England said they could not have bought without the scheme. However, there was likely some deadweight within the scheme, with the remaining 54% of customers saying they could have bought a home without Help to Buy. Many customers described using the scheme to buy a larger property than they otherwise could have afforded, which was corroborated by qualitative evidence from lenders and developers.
1.4.2 Housing supply
The evaluation found that the Help to Buy scheme had an overall positive impact on housing supply across England. The econometric analysis suggests that around 15% of new builds in England built over the course of Help to Buy 1 and Help to Buy 2 (2013 to 2023) were the result of the scheme.
This analysis found evidence for a strong effect on housing supply in areas close to the England/Wales border; the number of new dwellings increased much faster on the English side of the border than the Welsh side following the start of the Help to Buy scheme in England. The scale of this effect indicates there was some spillover from the scheme. In other words, this evidence suggests that Help to Buy led to an increase in housing supply beyond the homes bought through the scheme.
The evidence for such spillover is supported by the views of developers, who reported building more homes due to increased confidence, in turn increasing their build pace and number of sites. Further quantitative analysis also indicates that the increase in housing supply in these areas close to the England/Wales border is predominantly from more housing developments being completed, rather than the size of housing developments becoming larger.
When analysing national trends, there is some evidence for more widespread effects on housing supply beyond the England/Wales border. The number of new dwellings increased much faster in England as a whole than in Wales following the start of the Help to Buy scheme in England. Additionally, unlike the findings on home ownership the impact evaluation did not find evidence that the increase in housing supply was substantially different in areas that were already more or less affordable prior to the scheme, rather, the evidence suggests that supply increased across both types of area, although this did not translate into increased FTB home ownership in less affordable areas.
The introduction of Help to Buy 2 in 2021 and the end of the Help to Buy scheme in 2023 do not appear to have had a substantial impact on new housing supply. In addition, in London, new housing supply increased between 2013 and 2016, potentially reflecting a Help to Buy contribution to post-financial-crisis recovery, but the 2016 increase in the maximum loan value does not appear to have led to a further increase in housing supply. Taken together, these findings suggest that Help to Buy’s supply effect was strongest as part of the post-financial-crisis market recovery, when developer confidence and high loan-to-value lending were more constrained. The scheme appears to have been less needed in the later years, once developer confidence had improved and high loan-to-value mortgages had become more widely available.
1.4.3 Help to Buy developer performance
The Help to Buy scheme had a positive impact on developers’ financial performance. Positive impacts were identified relating to developer revenues, profit before tax and profit margins. A sample of small/medium developers shows statistically significant positive impacts across all the financial measures for the period 2016 to 2023.
The analysis found a similar pattern of impacts on larger developers’ revenues, profit before tax and profit margin. However, as all large developers participated in the Help to Buy scheme, estimating impacts was made more difficult. To resolve this, the analysis applied patterns observed in the matched pairs of small/medium developers to the larger developer sample.
The results on whether scheme participation affected developers’ market share are inconclusive. This is partly due to challenges securing adequate data on developers’ overall housing completions.
1.4.4 House prices
The evaluation found that the introduction of the Help to Buy scheme is likely to have contributed to slightly higher property prices, especially in areas where local deposits were already high. The econometric analysis indicates that, during Help to Buy 1, the average price of a home on the English side of the England/Wales border was in total around 2% higher than it would have been if following the same trajectory as the Welsh side of the border. However, on average, the increase in prices was larger in areas which were already less affordable before the Help to Buy scheme was introduced. This suggests that access to additional housing finance in these more expensive areas may have contributed to higher prices.
The econometric analysis also explored the effects of later changes to the scheme, such as the increase in the maximum loan value in London in 2016. This analysis did not find strong evidence for a large effect on prices in London from this change. This is in contrast to a previous study which estimated that the increase in the maximum loan value in London led to an 8% increase in new build prices in London (Carozzi and others, 2024). Given these results are sensitive to different statistical modelling assumptions, the scale of this effect is inconclusive, although this evaluation concludes that a modest increase in prices is the most plausible result.
The evaluation additionally considered evidence relating to the ‘new build premium’, which is the additional price paid for a new build compared to an equivalent second-hand home. This suggests that during the period of the scheme there was a new build premium of 5% for non-Help to Buy new builds, and 6% for Help to Buy new builds (i.e. an additional ‘Help to Buy price premium’ of around 1%). In other words, a buyer paid on average 5% more for a new build home than for a similar second-hand home, and an additional 1% more for a Help to Buy home than for a similar new build that was not bought through the scheme.
1.4.5 Value for money
The Help to Buy scheme represents very high value for money. The Help to Buy scheme is estimated to have generated a net present social value of £25.1 billion in 2024/25 prices over the lifetime of the scheme (April 2013 to March 2023), including projected income from equity loan redemptions up to 2039/40. This value is driven by the social benefit of the impact of Help to Buy in supporting an increase in housing supply.
This analysis represents a lower bound estimate of societal value. It is likely that Help to Buy may also have had a positive impact on construction jobs supported, improvements to life satisfaction and wellbeing for residents living in new Help to Buy properties and environmental benefits from efficiency of new homes. But these additional potential impacts were not monetised in the analysis.
However, this analysis does not reflect any effects of the scheme on house prices. In line with guidance from the HM Treasury Green Book, impacts on house prices represent transfers between buyers and sellers rather than benefits (or disbenefits), and so do not influence the overall net present social value.
1.4.6 Customer experience
The evaluation found customers’ experiences of using the Help to Buy scheme generally to be positive. Customers were highly satisfied with their property (86%) and experience of using the scheme (71%). The scheme benefitted all types of customers and households, particularly those who bought alone, with children, the elderly or those buying in London.
Largely the scheme was simple and easy to enter, with the scheme terms easy to understand for most. However, there was some dissatisfaction with the redemption process and confusion surrounding the equity loan repayment aspect of the scheme. The negative views about the redemption process were driven by customers needing to manage multiple stakeholders, short valuation periods and poor communication from the loan administrator.
1.4.7 Conclusions
Overall, the Help to Buy scheme supported expanded home ownership, particularly in already affordable areas. For some people, it helped them onto the housing ladder sooner or enabled them to buy when they might not otherwise have been able to afford to do so. For others, it supported people to skip a rung on the housing ladder and buy a larger or more expensive home. On this basis, the Help to Buy scheme delivered its core aim of supporting home ownership.
Help to Buy scheme customers were largely happy, particularly with their new build property. While many customers found the scheme easy to enter, use and understand, understanding of key equity loan terms was weaker.
The econometric analysis indicates that the Help to Buy scheme also increased new housing supply by around 15% across England, initially driven by and subsequently reinforcing increased market confidence among both buyers and developers, especially during Help to Buy 1. On this measure, the Help to Buy scheme also succeeded in meeting its original aims, especially to help get the market moving again following the financial crisis of 2008-09, though outcomes were less responsive to later changes in the scheme.
The Help to Buy scheme is likely to have contributed to slightly higher property prices, across all homes, not just new builds, with larger effects in areas that were already relatively expensive. Higher house prices represent a negative impact for future FTBs, who would need to pay more to get onto the housing ladder.
One of the aims of this evaluation was to identify lessons from the Help to Buy scheme. While the evaluation provides lots of insight, it is important to note that the socio-economic environment is very different today compared to when the Help to Buy scheme first launched. In 2013 the Help to Buy scheme stimulated demand for homes in a depressed market, boosting developer confidence and increasing housing supply. Today, inflation is higher, interest rates are higher and there are more 95% mortgages available. The overarching insight from the econometric analysis is that there was significant variation in the impact of Help to Buy, both geographically and over time. In designing any future such scheme, being explicit about who and which areas are intended to benefit from a scheme will help design similar schemes in the best way, especially if a future scheme aims to support particular groups or particular areas rather than just operating at the macro, national level.
2. Introduction
2.1 Background to this report
Verian, with partners Alma Economics and the Centre for Regional Economic and Social Research (CRESR) at Sheffield Hallam University, were commissioned in 2024 by the Ministry of Housing, Communities and Local Government (MHCLG) to carry out an evaluation of the Help to Buy scheme.
This report outlines the evaluation findings, covering the scheme’s impact on home ownership, housing supply, house prices and mortgage financing, value for money, customer experience, and lessons learned from the scheme.
2.2 Policy context
Following the recession of 2008 to 2009, the Help to Buy scheme was launched in 2013 to increase access to home ownership and boost housing supply in England. The scheme offered eligible buyers an equity loan of up to 20% of the value of a new build home. This proportion was increased to 40% in London from 2016, though remained at 20% elsewhere. This was in part due to the lack of high LTV mortgages available at the time. The equity loan was interest free for the first 5 years, with interest starting from 1.75% of the original loan amount, rising annually with a link to inflation. The equity loan had to be repaid when the home was sold.
The Help to Buy scheme ran for 10-years and had 2 iterations:
- The Help to Buy 1 scheme ran from 2013 to 2021 and was available to first-time buyers (FTBs) and existing homeowners for primary homes up to £600,000
- The Help to Buy 2 scheme ran from 2021 to 2023, was restricted to FTBs and with regional price caps set at 1.5 times the average FTB price in each region, up to £600,000 in London. It also required developers to provide warranties and comply with the Consumer Code for Home Builders
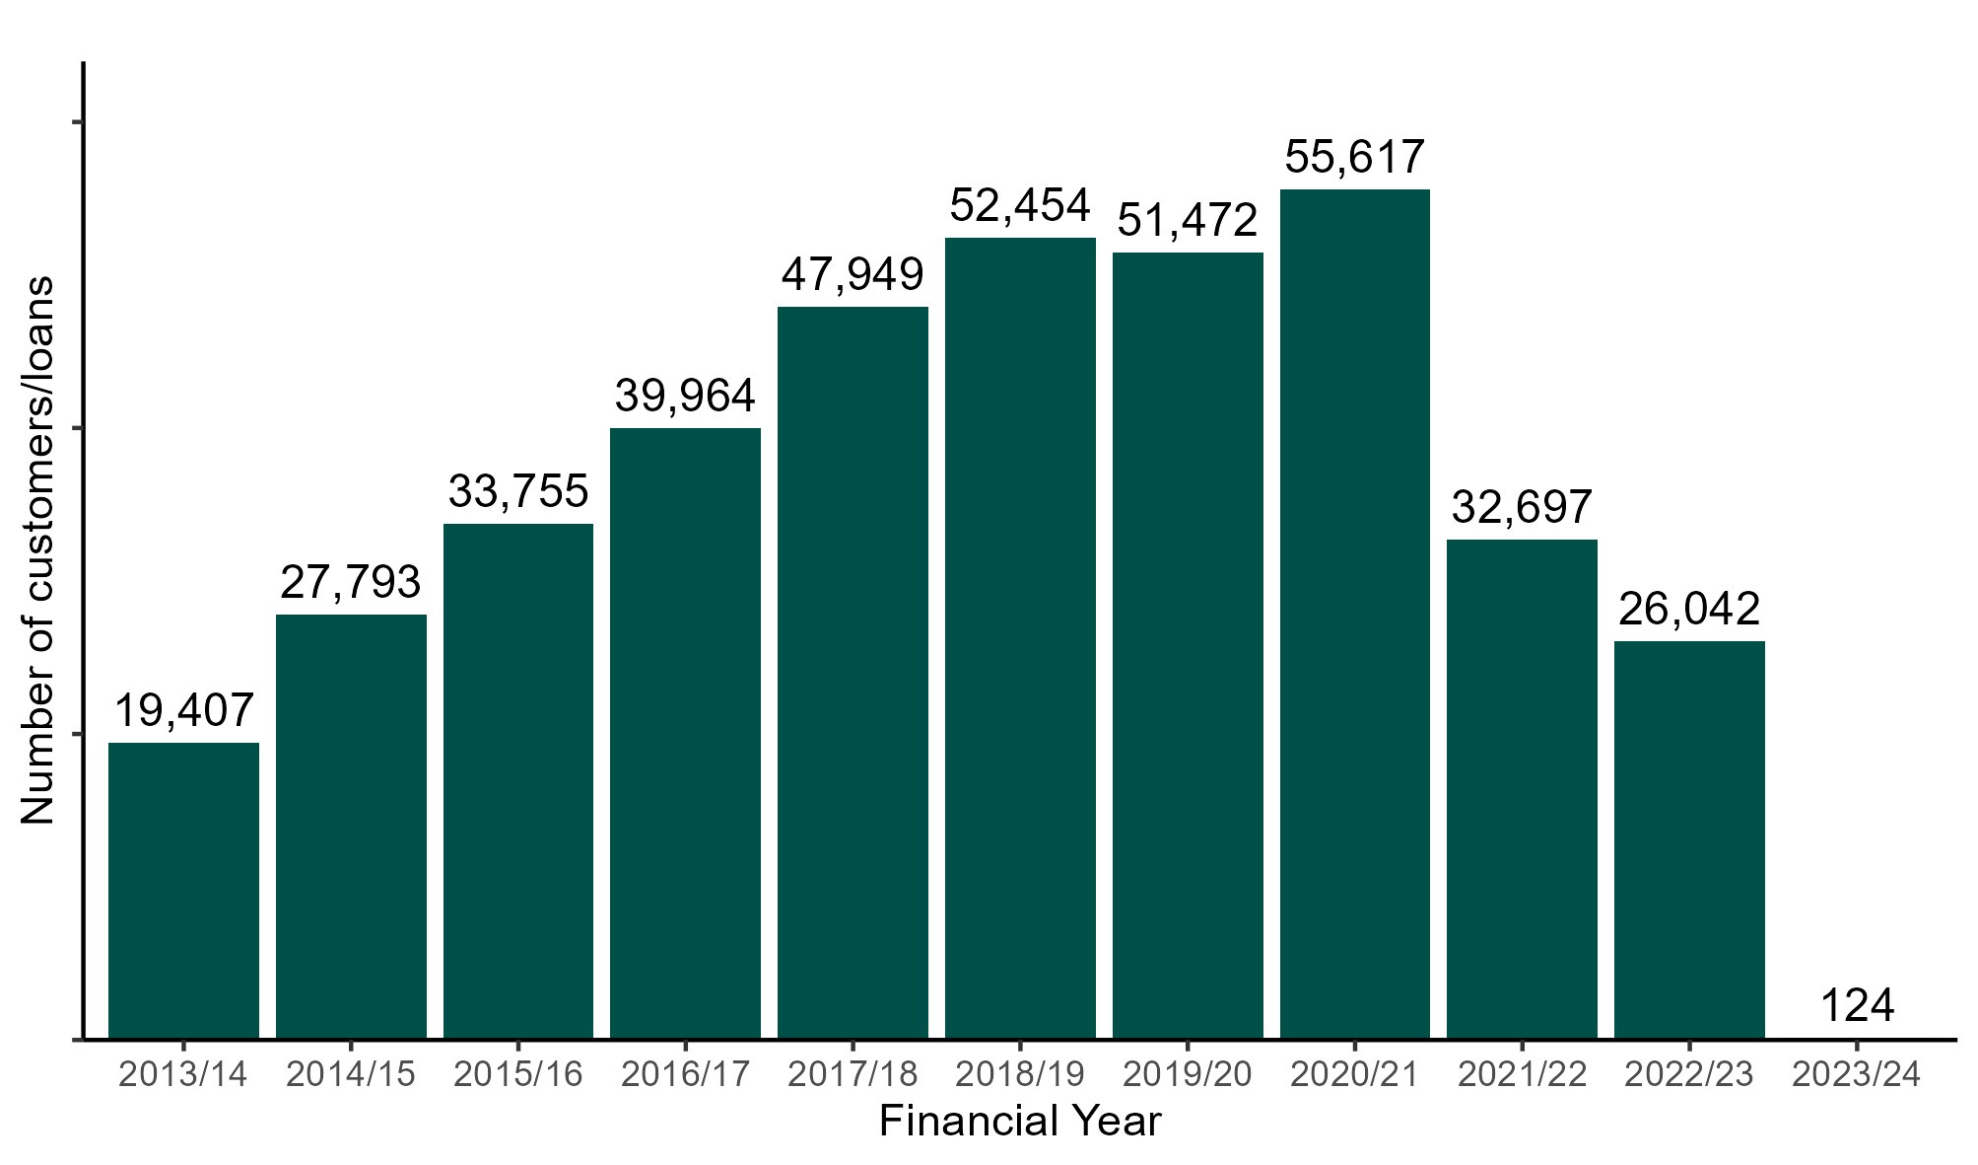
Altogether, over 387,000 properties were purchased through the scheme, of which 328,000 were by FTBs. Figure 2.1 shows the number of Help to Buy scheme loans issued each year, starting at almost 14,000 in 2013, rising to a peak of over 52,000 in both 2018 and 2019, then decreasing until the scheme closed in 2023. The total value of the equity loans was £24.7 billion.
Figure 2.1: Help to Buy loan numbers, live and redeemed by year
Source: Homes England Help to Buy customer database
Alternative text
Bar chart showing the number of customers or loans by financial year from 2013/14 to 2023/24. The number rises steadily from 19,407 in 2013/14 to 27,793 in 2014/15, 33,755 in 2015/16, and 39,964 in 2016/17. It continues increasing to 47,949 in 2017/18 and 52,454 in 2018/19, with a slight dip to 51,472 in 2019/20 before reaching a peak of 55,617 in 2020/21. After this peak, the number falls sharply to 32,697 in 2021/22 and continues declining to 26,042 in 2022/23, dropping to a very low value of 124 in 2023/24.
2.3 Aims of the scheme
As outlined, the Help to Buy scheme had 2 main objectives: to increase access to home ownership, and to increase housing supply (HM Treasury, 2013).
To increase access to home ownership, the scheme was designed to tackle issues relating to affordability such as the size of deposits needed to purchase a property as well as the size of the mortgage and therefore the affordability of mortgage interest payments. The 20% equity loan allowed the prospective buyer’s deposit to be reduced to 5%, alongside the buyer only needing to initially take out (and service) a 75% loan-to-value mortgage (or less in London).
The second aim, to increase housing supply, was founded on the policy logic that overcoming the affordability issues of buying a home increases the number of people who can buy one. As the scheme is only available on new build housing, this would support demand for such housing, in turn boosting the confidence of developers to build sites more quickly and open more sites, therefore increasing the overall supply of housing.
The theory of change which sets out the policy logic and expected outcomes of the Help to Buy scheme is shown in Appendix 1. This was developed as part of the evaluation rather than at the time of the policy design.
2.4 Help to Buy in context
Wider home buying policies also ran alongside the Help to Buy equity loan scheme. These included the Help to Buy mortgage guarantee scheme, where the government offered lenders the option to purchase a guarantee on mortgage loans where the borrower had a deposit of between 5% and 20%. The First Homes scheme allows FTBs and key workers to buy a property discounted to at least 30% compared to the market price. Shared ownership offers people the option to buy a share of their home (between 10% and 75%) and pay rent on the remaining share. The Right to Buy or Right to Acquire schemes enable individuals to buy their council or housing association property with a discount. Finally, the Help to Buy ISA and Lifetime ISA offer individuals a 25% government top-up on savings.
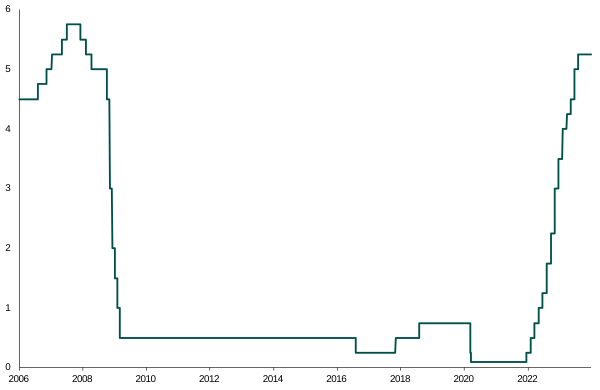
In the 10-year period that the Help to Buy scheme operated, several events and policy interventions influenced how the scheme was received by lenders, developers and customers. It was launched after the financial crisis of 2008-09, a period marked by limited house building and home ownership (as shown further below). Help to Buy 1 ran in an extended period of low interest rates (as shown in Figure 2.2), making monthly mortgage payments more affordable. The Funding for Lending scheme from the Bank of England and HM Treasury in 2012 to 2013 offered funding to banks and building societies to encourage lending to households and companies. The National Planning Policy Framework was introduced in 2012 and updated during the Help to Buy scheme’s duration, setting out the government’s planning policies for England. There have also been several Stamp Duty Land Tax holidays for FTBs over the Help to Buy period.
Figure 2.2: Bank of England base rate 2006-2023
Alternative text
Line chart showing the Bank of England official bank rate from 2006 to 2023. The rate starts around 4.5% in 2006, rises to a peak of about 5.75% in 2007, then drops sharply during 2008 to 2009 to around 0.5%. It remains at this low level for several years, dips further to about 0.25% in 2016, and stays below 1% through 2020, briefly falling close to 0.1%. From 2022 onward, the rate increases rapidly, reaching just above 5% by 2023.
Source: Bank of England, Official Bank Rate history
The EU exit referendum in 2016 led to potential uncertainty in the housing market, including concerns about labour shortages with EU migrants returning to their home countries and rising material costs (for example, House of Commons Communities and Local Government Committee, 2017; RICS, 2024). The 2017 Housing White Paper triggered policy changes to boost housing supply and speed up construction through planning reforms. However, later that same year, the Grenfell Tower fire triggered policy changes around the safety regulations particularly of high-rise flats, which continues to have an impact on the sale of flats more widely.
More recently, the COVID-19 pandemic affected home building and buying, again placing a strain on wider public and private finances. Unlike the low interest rates of Help to Buy 1, the Bank of England base rate rose during Help to Buy 2 after the Growth Plan 2022 (otherwise known as the ‘mini budget’), affecting mortgage costs. Wages also grew more slowly than Consumer Price Index in the 2021-23 period, further affecting housing affordability (Allcoat, 2021; Bank of England, 2022; ONS, 2023).
It is therefore important to look at the bigger picture for FTBs, housebuilding and prices. The following 3 charts show this over a longer time period.
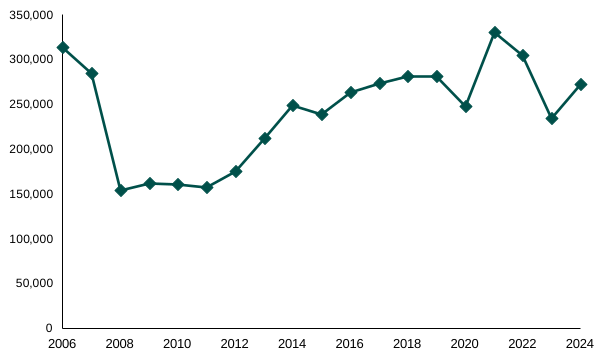
Numbers of FTB mortgage sales are a measure of the property sales made to new homeowners published by the Office of National Statistics. Figure 2.3 shows the trend of first-time buyer mortgages in England in each year from 2006 to 2024, before, during and after the Help to Buy scheme. This shows the steep drop following the financial crisis in 2008 to 2009, a key rationale for the Help to Buy scheme. The number of FTB mortgages was already starting to rise before the introduction of the Help to Buy scheme, with a steep rise in the early years of Help to Buy. The impact of COVID-19 is noticeable in the drop in 2020.
Figure 2.3: Annual number of first-time buyer mortgages, England
Source: ONS, First-time buyer mortgage sales, by local authority, UK (ONS, 2024a)
Alternative text
Line chart showing the annual number of first-time buyer mortgages in England from 2006 to 2024. The vertical axis ranges from 0 to 350,000.
The number starts high at around 315,000 in 2006, then declines to about 280,000 in 2007 before dropping sharply to roughly 150,000 in 2008. It stabilises at around 155,000–165,000 between 2009 and 2011. From 2012 onward, the number rises steadily, reaching about 210,000 in 2013 and around 250,000 in 2014.
The upward trend continues through the late 2010s, increasing to approximately 270,000–280,000 between 2016 and 2019. There is a dip to around 245,000 in 2020, followed by a sharp peak at roughly 330,000 in 2021. After this, the number falls to about 300,000 in 2022 and declines further to around 235,000 in 2023, before partially recovering to approximately 270,000 in 2024.
Overall, the chart shows a sharp decline during the financial crisis, steady recovery through the 2010s, a spike in 2021, and a subsequent decline with partial recovery.
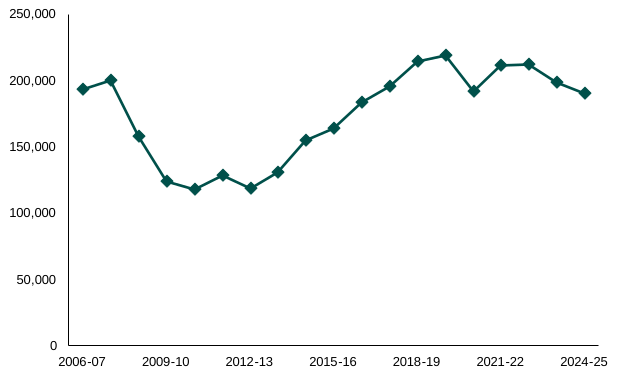
Figure 2.4 focuses on housebuilding. It shows the total number of new self-contained residential units built each year in England between 2006 to 2007 and 2024 to 2025, taking into account any units lost to other uses or cancelled. This is reported as ‘new build completions in England (net additions)’. The trend in new build completions is similar to that of FTB mortgages, though slightly less marked. It again shows the drop in new build completions due to the financial crisis of 2008 to 2009, then a steady rise during Help to Buy 1, to a peak in 2019 to 2020, before Covid. In the latest few years, new build completions have been decreasing.
Figure 2.4: New build completions in England (net additions)
Source: MHCLG, Table 120: components of housing supply; net additional dwellings, England (MHCLG, 2026)
Alternative text
Line chart showing new build completions in England measured as net additions from 2006 to 2007 to 2024 to 2025. Completions start at around 190,000 in 2006 to 2007, rise slightly to about 200,000, then fall sharply to a low of roughly 120,000 around 2010 to 2011. After this trough, completions gradually increase, reaching around 165,000 by the mid-2010s and peaking at approximately 215,000 to 220,000 in 2018 to 2019 and 2019 to 2020. There is a dip to about 190,000 in 2020 to 2021, followed by a recovery to just over 210,000 in 2021 to 2022 and 2022 to 2023. Completions then decline again to around 200,000 and end at approximately 190,000 in 2024 to 2025.
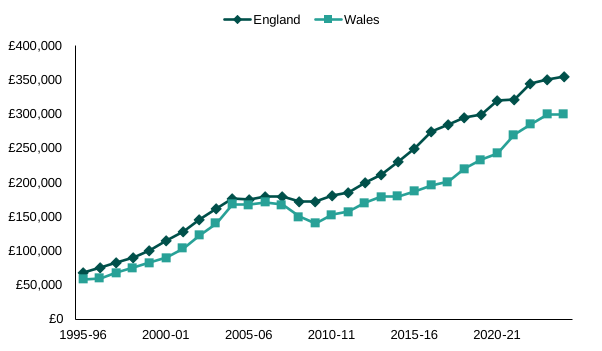
Figure 2.5 shows the trend in average (median) house prices paid for new build properties in England and Wales between 1995 to 1996 and 2024 to 2025. Using this longer time span shows the steady rise in prices in both nations up to 2004 to 2005, then levelling off for a few years. From 2009 to 2010, prices again rose in both nations for the remainder of the period.
Figure 2.5: Median price paid (new dwellings), England and Wales
Source: ONS, Median house prices for administrative geographies (newly built dwellings) (ONS, 2024b)
Alternative text
Line chart showing the median price paid for new dwellings in England and Wales from 1995 to 1996 to the early 2020s. Two lines compare England and Wales. Both begin at around £60,000 to £70,000 in the mid-1990s and rise steadily to a peak of roughly £170,000 to £175,000 in the mid-2000s. Prices then dip slightly around 2008 to 2010, with Wales falling more noticeably to about £140,000 while England remains closer to £170,000. From the early 2010s onward, prices increase again, with England rising more sharply. By the early 2020s, England reaches approximately £350,000 while Wales reaches around £300,000, maintaining a consistent gap with England higher throughout most of the period.
2.5 Evaluation context
The Help to Buy scheme has already undergone 2 independent evaluations. The first, in 2015 (DCLG, 2016), sought to assess the ‘additionality’ of the policy and to provide evidence of the experiences of both customers and providers. ‘Additionality’ here is defined as the extent to which the scheme had drawn in more buyers – demand additionality – and the extent to which developers had expanded output – supply additionality. Two years later in 2017 (Whitehead, C. and others, 2018), following an expansion of the scheme’s take-up and presence within the industry, a further independent evaluation was commissioned to understand the extent to which the scheme was supporting the housing market and how this might have changed over time. These evaluations concluded that the scheme had indeed supported home ownership and boosted supply. For example, based on self-reported evidence from customers, the 2017 evaluation estimated that 37% of buyers who were assisted by the Help to Buy scheme could not have bought their home without it and the study found that the scheme contributed to 14.5% of new build supply built up to March 2017. Customers reported high satisfaction with the scheme, as well as high financial confidence at the last measurement (Whitehead and others, 2018).
However, throughout the policy’s lifetime it has experienced much media interest and stakeholder commentary. In 2019 the Public Accounts Committee held a hearing on the Help to Buy scheme to assess progress. Following this, the Public Accounts Committee published a report outlining a series of recommendations for MHCLG, including to “undertake a further evaluation of the scheme, to understand its value and necessity from 2017” (House of Commons Committee of Public Accounts, 2019). This was followed by a report on the scheme by the National Audit Office (2019). MHCLG committed to the Public Accounts Committee and National Audit Office to undertake this new evaluation.
Alongside the work carried out by DCLG in 2015 and MHCLG in 2017, there was some evidence of house price rises in greater London (Hilber and Mense, 2022), increased profits for larger developers (Mangalit and others, 2024) and reduced capital available for other housing schemes (National Audit Office, 2019) attributed to the scheme which warranted further investigation. Projections made by Homes England in 2019 suggested the scheme would make a positive return financially by 2048 (House of Commons Committee of Public Accounts, 2019). There was therefore a need to measure the value for money from the scheme in this evaluation.
Since these previous studies, there have also been recent publications about the Help to Buy scheme. For example, the Institute for Fiscal Studies (Boileau and others, 2026) has challenged the affordability gains from the Help to Buy scheme. Their modelling suggested affordability gains would likely be concentrated among higher-income individuals, with those living in London and the South East seeing larger increases in maximum affordable price but smaller increases in the share of local properties they could afford. Meanwhile, industry groups and others (for example, TYI, 2025; Enfield Council and Pocket Living, 2026; Home Builders Federation, 2025) continue to lobby for a return to a Help to Buy scheme to stimulate housebuilding.
Delivering this new evaluation has enabled MHCLG to fulfil its NAO commitment and will help identify whether any similar policies could effectively support similar objectives in future. MHCLG also wanted the evaluation to improve understanding of Help to Buy scheme customers and their situations – how they were managing to afford interest and their plans for redeeming. Intelligence on this is important for effectively supporting some 250,000 current customers and delivering an appropriate financial return on the scheme.
The aims and objectives of the Help to Buy scheme evaluation are outlined in the section below.
2.6 Evaluation aims
The overall aims of the evaluation were:
- to identify whether the scheme achieved its key objectives of supporting people into home ownership and boosting housing supply
- to understand the scheme’s impact on developers, house prices and mortgage financing
- to understand customers’ experiences of the scheme including how current commitments are being managed and their future expectations
- to assess the value for money of the scheme
- to identify lessons that can be learned from the Help to Buy scheme and what these may mean for future housing schemes
Importantly, these aims applied to both iterations of the scheme (Help to Buy 1: April 2013 to March 2021 and Help to Buy 2: April 2021 to March 2023), building on the previous evaluations commissioned by MHCLG, the last in 2017.
3. Evaluation methods
3.1 Summary of approach
An initial scoping phase to provide context and prepare for a full evaluation was conducted, including an evidence review of key policy and academic documentation, scoping interviews with stakeholders and the development of a theory of change. This last element sets out the policy logic and expected outcomes of the Help to Buy scheme and is found in Appendix 1, which also includes the detailed evaluation questions.
Once the evaluation methodology was confirmed, the study included multiple strands of research to answer the evaluation’s aims and objectives, to identify impact on home ownership, housing supply and house prices as well as better understand customers’ experiences of the scheme. The primary research included a survey of 5,869 Help to Buy scheme customers plus 21 qualitative interviews with developers, 12 with lenders and 40 with Help to Buy scheme customers. Verian conducted secondary analysis of customer outcomes from the Homes England Customer Database, the English Housing Survey and data from Land Registry and UK Finance. Verian also estimated the impact of the scheme on home ownership, housing supply and house prices using a quasi-experimental counterfactual-based design (explained further in 3.3), while CRESR measured the scheme’s impact on developer profits and market share and Alma Economics conducted the value for money evaluation.
Figure 3.1 below summarises the evaluation approach, and the corresponding technical report provides more detail on the methodologies applied. This is intended to be read alongside the evaluation findings.
Figure 3.1. Summary of evaluation approach

Alternative text
A horizontal sequence of 4 large, coloured arrow shapes shows stages of an evaluation process. From left to right, the arrows read: “Initial scoping phase,” “Primary data collection: qualitative interviews with lenders, developers and customers, and a customer survey,” “Secondary data analysis: analysis of customer outcomes and of scheme impact on homeownership, housing supply, house prices and developer performance,” and “Value for Money analysis.”
3.2 Evaluation governance
The evaluation partners are grateful to the core evaluation team at MHCLG, whom the partners worked with extensively throughout this project. Alongside this core team, a formal independent Advisory Group has provided strategic direction and advice on the evaluation. Chaired by MHCLG, this included 9 members, representing a wide range of organisations, including Homes England, industry bodies, academics and a thinktank. The Advisory Group reviewed and critically challenged the overall evaluation design, interim findings and final findings from this evaluation.
The evaluation findings in this report have also been reviewed internally among the evaluation partnership, involving Verian, CRESR and Alma Economics.
3.3 Interpreting the impact evaluation findings
To measure the impact of the scheme on home ownership, supply and house prices, the evaluation partners used 3 quasi-experimental approaches. These are explained briefly below and further in the technical report.
Difference-in-discontinuities: differences at scheme borders
This approach builds on previous work from Carozzi, Hilber & Yu (2024). The study compares trends in areas close to a geographic border where the scheme differs:
- the England/Wales border for the introduction of the Help to Buy 1 scheme in England from April 2013
- the London border for the increase in the maximum loan value in London from February 2016
- English regional borders for the introduction of the Help to Buy 2 scheme in England from April 2021
- the England/Wales border for the end of the Help to Buy 2 scheme in England from April 2023
The difference-in-discontinuities analysis provides the most robust method of estimating local impacts as the areas very close to a border are likely to be generally similar to one another. These areas are likely to have similar housing markets and local conditions, and are likely to be similarly affected by factors outside of the Help to Buy scheme.
Therefore, the evaluation can state with greater confidence that differences in outcome trends are caused by differences in the scheme on either side of the border, rather than by other factors.
The analysis compares the change in outcomes either side of the border. For example, the home ownership analysis investigates the extent to which home ownership increased faster on the English side of the border than on the Welsh side of the border following the introduction of the Help to Buy scheme in England in April 2013. The statistical model accounts for pre-existing differences between local areas. It also accounts for underlying trends or shocks that are not related to the Help to Buy scheme and equally affect areas on both sides of the border. For the analysis of impacts on house prices, the analysis also accounts for differences in property characteristics (such as size and property type).
Following Carozzi, Hilber and Yu (2024), the analysis additionally includes a term for the distance to the border. This distance term allows a separate effect for distance at each financial year, and is intended to account for potential spatial differences in effects that may vary over time. The full set of variables used in the models can be found in the accompanying technical report.
The key assumption of this analysis is a form of parallel trends: without the Help to Buy scheme, it is assumed that trends either side of the border would have moved in parallel. Under this assumption, if the trends diverge after the introduction of the scheme (or after later changes to the scheme), this difference can be attributed to the effects of the Help to Buy scheme. To test the robustness of this assumption, the analysis compared the trends before the start of the Help to Buy scheme. If the trends on either side of the border were similar before the Help to Buy scheme started, it is more confidently assumed that they would have continued to be similar after this point without it.
The main analyses are restricted to wards[footnote 1] (for home ownership and housing supply) and postcodes (for prices) within 10 km of the border, with the exception of the London border for which a smaller threshold of 5km is used. These distance thresholds are consistent with those used by Carozzi, Hilber & Yu (2024). The smaller distance for the London border reflects the fact that this area is much more built up than other areas. Further analyses were conducted using different distance thresholds to see how sensitive results are to this choice.
While the Help to Buy scheme was introduced in England in April 2013, a similar scheme was introduced in Wales in January 2014. At its inception, the English scheme supported the purchase of homes up to £600,000, whereas the Welsh scheme was capped at prices of £300,000. There was therefore still a large difference in access to housing finance on either side of the England/Wales border. As such, the analysis at the England/Wales border can still provide insight into the effects of increased access to housing finance through a scheme like Help to Buy, even after the Welsh scheme started.
The findings from the difference-in-discontinuities analyses confirm whether the scheme had impacts in certain areas. The difference-in-discontinuities evidence is prioritised where available as it provides the most credible counterfactuals (and therefore, causal estimates) for these areas, since it is reasonable to think that the housing markets immediately either side of the border are similar to one another. However, those findings may not reflect the impacts, if any, in other different parts of the country further away from these borders.
Difference-in-differences: national and regional trends
The difference-in-differences analysis is conceptually similar to the difference-in-discontinuities analysis described above but is not limited to areas close to a geographic border.
This analysis again compares the change in outcomes in different areas. For example, it compares the change in home ownership for wards in England against the change for wards in Wales. The same property and area characteristics were used as for the difference-in-discontinuities analysis described above.
The advantage of the difference-in-differences is that it provides some evidence about outcomes across the whole of England. However, interpreting these results as the effects of the scheme relies on strong assumptions about the comparability between areas. In particular, the analysis relies on a similar assumption of parallel trends, for example, that without the Help to Buy scheme the trend in home ownership in England would have been similar to the trend in Wales. As with the difference-in-discontinuities analysis described above, the analysis investigates the trends before the introduction of the Help to Buy scheme in England to assess the plausibility of this assumption.
However, even where the parallel trends assumption appears to hold historically, there is still a greater risk that a difference in trends is not caused by the Help to Buy scheme but is instead explained by other factors. This is because the difference-in-differences analysis is comparing trends across a wider variety of local housing markets and conditions.
The analysis therefore primarily uses the difference-in-differences analyses to support or qualify the findings from the difference-in-discontinuities analysis, considering the extent to which results close to geographic borders are likely to generalise to other areas.
Difference-in-generosities: variation of the Help to Buy scheme locally
The difference-in-generosities analysis examines how outcomes vary depending on how large the Help to Buy scheme support was relative to local first-time buyer (FTB) deposits. This approach can be considered an extension of the difference-in-differences and difference-in-discontinuities methods described above. However, instead of comparing trends in outcomes such as home ownership in areas with or without the English Help to Buy scheme, this analysis investigates the relationship between outcomes and the local ‘generosity’ of the scheme. The analysis covers the whole of England and Wales and is used to understand how the effects of the scheme varied in different types of area.
The analysis constructed a measure of ‘generosity’ for each ward at each time point as the ratio between (1) the maximum absolute amount that could be borrowed through the scheme at different points in time and (2) the value of the median local FTB deposit. This measure can be interpreted as how many pounds a typical FTB could access through the Help to Buy scheme for each pound of their deposit.
‘High generosity’ areas were where the maximum amount that could be borrowed through the Help to Buy scheme (at each iteration) offered much more than typical local FTB deposits. For example, in areas in Stoke-on-Trent or towns and rural areas around Durham, the largest possible Help to Buy equity loan was around 10 times bigger than the local typical FTB deposit. This report refers to these sorts of high generosity areas as ‘more affordable’ areas to buy a property.
‘Low generosity’ areas were where the amount that could be borrowed through the Help to Buy scheme was low compared to typical FTB deposits. For example, in central Oxford or rural areas close to Chester, the maximum that could be borrowed through the Help to Buy scheme was less than or about the same size as the local typical FTB deposit. This report refers to these sorts of low generosity areas as ‘less affordable’ areas to buy a property.
The analysis used the local median FTB deposit for 2012/13 (the year before the start of the Help to Buy scheme in England), adjusted for inflation in subsequent years. By anchoring the deposit to the year before the Help to Buy scheme started, the study avoids a situation where the measure of generosity is itself influenced by any impact the Help to Buy scheme had on house prices. Otherwise, if the Help to Buy scheme led to an increase in house prices, it would be expected that this also had an effect on FTB deposits, which could then distort the generosity measure.
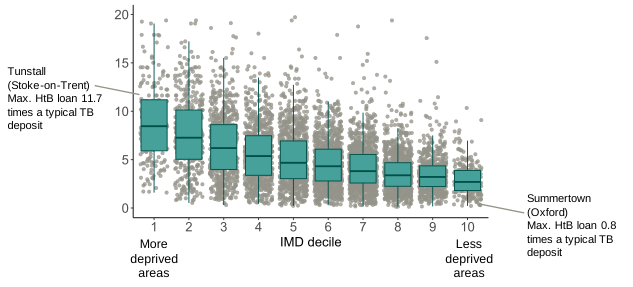
Each region included a mixture of higher and lower generosity areas. This generosity measure captures information about local housing markets to enable exploration of how the Help to Buy scheme may have had different effects in different types of places. For example, early in the Help to Buy 1 scheme, the scheme tended to be more generous in more deprived areas as the same price cap and loan value was available nationally, but FTB deposits were typically lower in these areas. Figure 3.2 illustrates the relationship between deprivation and the generosity score near the start of the Help to Buy scheme. Each point represents a single ward. The points on the left represent the 10% most deprived wards in England. The points on the right represent the 10% least deprived wards in England. The generosity of the Help to Buy scheme tended to be higher in more deprived areas at this point in the scheme.
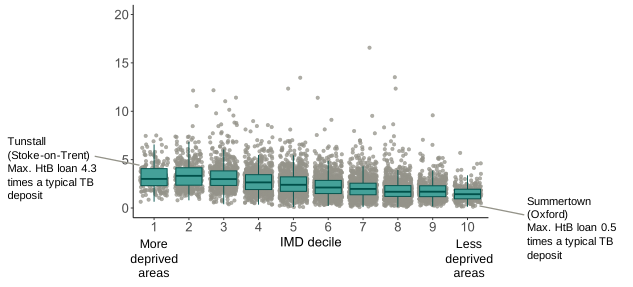
The local generosity of the Help to Buy scheme changed over the course of the scheme. The increase in the maximum loan value in London 2016 increased the relative generosity in London. On the other hand, the introduction of regional price caps meant the relative generosity of the scheme was reduced in most areas. For example, Figure 3.3 shows how the local generosity of the scheme was much more similar in more deprived and less deprived areas after the introduction of regional price caps with Help to Buy 2. This is because the price caps substantially reduced the amount that could be borrowed through the Help to Buy scheme in many areas.
The difference-in-generosities analysis then compares trends in areas where the Help to Buy scheme was more or less generous. For example, if an outcome tended to increase more in areas with high generosity, that would indicate that the effects of the Help to Buy scheme were mediated by the local housing market and the size of support available; greater generosity of the Help to Buy scheme was associated with a greater effect. On the other hand, if there is little relationship between this generosity measure and the trend for an outcome, this would suggest that the effectiveness of the Help to Buy scheme was not heavily mediated by the local housing market. This would imply that the effects of the scheme were similar in different types of local housing market.
In this way, the difference-in-generosities analysis is not assessing the overall impact of the Help to Buy scheme. Instead, it is exploring the local dynamics to better understand how the Help to Buy scheme may have had different types of effects in different types of local area.
For further information about this model, see the accompanying technical report.
Figure 3.2: Generosity of the Help to Buy 1 scheme in April 2015 by Indices of Multiple Deprivation
Source: UK Finance Regulated Mortgage Survey
Alternative text
Box-and-whisker plot with overlaid individual data points showing the relationship between IMD decile and generosity of the Help to Buy 1 scheme. The x-axis displays IMD deciles from 1 (more deprived) to 10 (less deprived). The y-axis ranges from 0 to 20. Grey dots represent individual observations, with turquoise box plots showing the distribution within each decile.
Median values decline steadily from around 8–9 in decile 1 to around 3 in decile 10, indicating that the outcome is generally higher in more deprived areas and lower in less deprived areas. The spread of values also narrows slightly across higher deciles, although substantial variation is present within all groups. A fitted trend line slopes downward from left to right, highlighting the negative relationship between deprivation and the outcome.
Figure 3.3: Generosity of the Help to Buy 2 scheme in April 2021 by Indices of Multiple Deprivation
Source: UK Finance Regulated Mortgage Survey
Alternative text
Box-and-whisker plot with overlaid individual data points showing the relationship between IMD decile and generosity of the help to buy 2 scheme. The x-axis displays IMD deciles from 1 (more deprived) to 10 (less deprived), and the y-axis ranges from 0 to 20.
Grey dots represent individual observations, while turquoise box plots show the distribution of values within each decile. Median values decrease gradually from approximately 3 to 4 in the most deprived deciles to around 1 to 2 in the least deprived deciles, indicating a modest negative relationship between deprivation and generosity.
The distribution is positively skewed across all deciles, with a number of higher-value outliers extending above 10 and, in some cases, above 15. Variability narrows slightly in less deprived deciles, although considerable overlap remains between groups. A fitted trend line slopes downward from left to right, highlighting the overall decline in the outcome as deprivation decreases.
How to interpret analysis of impact on developer performance
To assess the impact of the scheme on developers’ financial performance and market share, a variety of data on those that participated in the Help to Buy scheme was collected. This included information on their financial performance, housing completions, the markets in which they operate and their company structure. The same information was collected for developers that did not participate. Using an approach called propensity score matching, each Help to Buy scheme developer was matched to a developer that did not participate in the scheme. This process ensured that the matched pairs of developers were as similar as possible, except in relation to scheme participation. Through this approach the analysis accounts for differences between developers that might otherwise have affected their financial performance and changes in market share.
As all large developers participated in the Help to Buy scheme, there were no equivalent developers to pair with these organisations. Having tested different approaches, the study used rates of change among small/medium sized non-Help to Buy scheme developers as the basis to create counterfactual cases for large developers. In essence, these cases provide an estimate of what larger developers’ financial performance would have looked like had they not participated in the Help to Buy scheme.
To quantify the impact of the scheme on developers the average differences between the matched pairs for pre- and post-Help to Buy scheme periods are reported.
Confidence intervals and statistical significance
Where appropriate, the analysis shows the results from the impact analyses with 95% confidence intervals and p-values. These reflect the statistical uncertainty in the analysis.
Confidence intervals indicate a likely range for a result. The true value is likely to be within the confidence interval, as long as the assumptions of the analysis hold reasonably well.
Similarly, a p-value close to zero indicates that it would be surprising for the analysis to find evidence for an effect of this size if really there were no effect at all. For example, the difference-in-discontinuities analysis compares trends between areas on the English and Welsh sides of the border. A p-value close to zero would indicate that it would be unlikely to see such a large difference between the trends if the Help to Buy scheme had no effect, as long as the assumptions of the analysis hold. Where the p-value is lower than 0.05, the report refers to that result as ‘statistically significant at the 95% level’ in this report.
3.4 Limitations
As with all evaluations, the design of the full Help to Buy scheme evaluation has some limitations. The analysis has mitigated these where possible and the key limitations are reported here to inform readers’ interpretation of the evaluation results.
Missing data in secondary data sources
Some limitations relate to incomplete or partial data about groups of interest in the data sources available for use in the evaluation. For example:
- the UK Finance Regulated Mortgage Survey data Verian used for the difference-in-discontinuities and difference-in-generosities impact analysis of home ownership is incomplete, which may affect the results
- the developer performance analysis drew on Companies House data in its sampling and matching process, meaning its results may not be applicable to smaller developers or those businesses which do not file accounts with Companies House
- based on the data available, the affordability analysis could not account for the full range of factors that shape mortgage access and housing choices, such as credit history, other debts, household expenditure, lender stress testing, product availability or the specific homes available to households at the time.
Assumptions around counterfactuals
To generate findings about what would happen without the scheme, some analysis in the evaluation is based on constructed scenarios following certain assumptions about what customers would have done in the scheme’s absence, such as:
- parallel trends: the key assumption of the difference-in-difference approach is that the change observed in comparison areas is the same as the change that would have been observed in the Help to Buy areas without Help to Buy (or without subsequent changes to the scheme)
- no spillover effect: changes in the scheme in England do not affect outcomes in Wales
- no anticipation effect: outcomes are neither brought forward nor delayed in response to changes in the scheme; for example, a first-time buyer may rush to complete their purchase before a given date where the scheme would change.
The assumptions below also affect the findings of the evaluation:
- the financial counterfactual findings are sensitive to assumptions about counterfactual purchase or tenure pathways, mortgage rate proxies, house price growth, rent levels, savings returns and simplified definitions of wealth, and should therefore be interpreted as illustrative rather than definitive
Stakeholder availability, bias and recall
The in-depth interviews undertaken with lenders, developers and customers all had limitations relating to recruitment, recall and bias, such as:
- recruitment of small developers: recruitment of developers and lenders primarily took place through membership bodies, which tend to have more engagement with larger organisations. likely limiting representation of smaller developers who may also have less resources (e.g. staff and time) to participate
- developers that did not take part in the scheme were not interviewed despite attempts to identify and approach them, limiting evidence on their perspectives
- developers and lenders interviewed were often engaged in housing policy and may have had an interest in influencing findings through sharing their views
- participants sometimes found it difficult to recall details of their experience, particularly where purchases occurred several years earlier, introducing potential recall bias
- recruiting customers for interviews through the survey introduced a risk of selection bias, since these were customers who were more engaged and willing to share their experience
Survey limitations
The survey of Help to Buy scheme customers had similar limitations relating to non-response and measurement error:
- selection and non-response bias may arise because customers were sampled using a disproportionate design and not all those approached responded, although a 2-step weighting process was applied to mitigate this
- measurement error may arise as respondents were asked to report counterfactual behaviour or reflect on impacts after the event, creating a risk in self-reported responses
4. Home ownership
This chapter reports findings about the impact of the Help to Buy scheme on home ownership. It covers findings about:
- how far the Help to Buy scheme supported people into home ownership
- the impact of Help to Buy scheme closure on home ownership
- how far the Help to Buy scheme was used by those who really needed it to access home ownership
4.1 Summary of key findings
The impact analysis suggests that the introduction of the Help to Buy scheme contributed to an increase in home ownership. This impact was apparent in areas that were already more affordable for customers, but not in areas that were relatively less affordable.
As set out in chapter 3, a key part of the impact analysis focussed specifically on areas close to the England/Wales border, as these areas are likely to have similar local housing markets and so be most directly comparable to one another. This analysis suggests that the introduction of the Help to Buy scheme led to a sizeable increase in home ownership in areas of England close to the Welsh border; the number of first-time buyer (FTB) mortgage sales increased considerably faster in wards on the English side of the border than on the Welsh side. The analysis suggests that around 15-30% of FTB mortgage sales in these areas were attributable to Help to Buy over the course of Help to Buy 1 and Help to Buy 2.
However, wider national trends indicate that this impact at the England/Wales border was not necessarily experienced in other areas of England. The increase in the number of FTB mortgage sales across England as a whole was similar to the increase in Wales and Scotland, where the available equity loan schemes were smaller. Additionally, the number of FTB mortgage sales increased most in more affordable neighbourhoods (where the amount that could be borrowed through the Help to Buy scheme was large relative to local FTB deposits) and increased very little in less affordable areas.
These findings suggest that the Help to Buy scheme was successful in supporting people into home ownership in some areas in England, but was not as effective at removing affordability barriers for FTBs in areas that were already relatively expensive.
Following the introduction of regional price caps with Help to Buy 2, the number of loans issued through the Help to Buy scheme reduced. However, there is not strong evidence that the overall number of FTB mortgage sales was affected. For example, the trends in the number of FTB mortgage sales were generally similar either side of geographic borders where one side of the border had access to a higher price cap than the other side. High LTV mortgages were more readily available by the time of Help to Buy 2, and so one possibility is that the Help to Buy scheme was less needed for supporting people into home ownership at this point. Additionally, the market conditions during the Help to Buy 2 period were markedly different to the conditions when Help to Buy 1 was first introduced. In particular, increasing interest rates during the Help to Buy 2 period may have meant that monthly affordability of mortgage payments was the main constraint for many potential FTBs, rendering the effect of the reduced price caps irrelevant. This is supported by analysis of Homes England data, which suggests that 22% of Help to Buy 1 scheme customers and 38% of Help to Buy 2 scheme customers could not have bought an average local FTB home without the scheme as they would not have met affordability requirements for securing a mortgage.
As well as supporting some people into home ownership, the Help to Buy scheme affected the types of homes people bought. Analysis of data from the customer survey found that almost half (46%) of Help to Buy customers said they would not have been able to buy a home without the Help to Buy scheme. For the other 54% of customers, the Help to Buy scheme was used to buy the home they wanted, even if they said they could have afforded a different suitable home without the Help to Buy scheme. Lenders and developers said they thought that it was common for people to use the Help to Buy scheme to buy a bigger or higher quality property than they could have afforded without the scheme.
Taking these findings together, the evidence from this evaluation suggests that the effects of the Help to Buy scheme on home ownership varied between places and over time. The introduction of the Help to Buy scheme had a positive impact on the number of FTB mortgage sales in some areas, although not in areas that were already less affordable. Around half of Help to Buy scheme customers said they would not have been able to buy a home without the scheme, and data from Homes England suggests that a significant minority could not have accessed a mortgage at all for an average FTB home in their area without the scheme. However, these results also demonstrate that many customers could have bought a home without the scheme, and instead used the Help to Buy scheme to buy a bigger or higher quality property.
The number of FTB mortgage sales does not appear to have been substantially affected by the introduction of regional price caps with Help to Buy 2, indicating that the scheme may have been having less of an effect on home ownership at this time. This likely reflects changes in the economic context such as higher interest rates and the greater availability of high LTV mortgages. However, the fact that the number of FTB mortgage sales fell faster in England than in Wales following the end of the Help to Buy scheme in England suggests that the scheme was still playing a role in supporting some FTBs into home ownership in some areas of England.
The study’s qualitative research with banks, building societies and brokers suggests that the introduction of the Help to Buy 1 scheme resulted in higher demand for new build mortgage lending and gave those lenders who needed it (building societies in particular) the confidence to lend to Help to Buy customers at a higher loan to value (LTV). Lenders were more mixed about how far the scheme affected lending volumes, with banks and building societies considering that favourable interest rates, industry regulation and company policy had a greater influence. Lenders reported that the scheme had a limited impact on the terms and conditions, and types of mortgages they offered, either during or after the scheme.
4.2 Data sources
For the analysis of impacts on home ownership, the study used 2 main datasets. First, the ONS publish data on the number of FTB mortgage sales in each Local Authority based on data recorded by the Financial Conduct Authority. This data provides a reasonably comprehensive record of the trends in FTB mortgage sales. The analysis used this data to compare trends across Local Authorities in England, Wales and Scotland. Second, it uses ward-level data on the number of FTB mortgage sales from the UK Finance Regulated Mortgage Survey (RMS). Although this data is less complete than the data published by the ONS, it allows analysis of the changes at a lower level of geography.
In addition, for the section on how homeowners used the Help to Buy scheme, the customer survey data collected through this evaluation was used. The developers, lenders and customers who took part in qualitative interviews also had views about how the scheme affected home ownership, and these are referenced throughout this section to help interpret the quantitative analyses.
4.3 The introduction of Help to Buy in England from April 2013
This section of the report explores the effects on home ownership of the introduction of the Help to Buy scheme in England. The report first focuses on areas close to the England/Wales border as housing markets are likely to be similar either side of the border. It then considers the evidence from wider national trends across England, Wales and Scotland. Finally, it looks at the relationship between changes in home ownership and the local ‘generosity’ of the Help to Buy scheme, that is, the scale of the equity loan in relation to typical local FTB deposits.
4.3.1 Difference-in-discontinuities: evidence from the England/Wales border
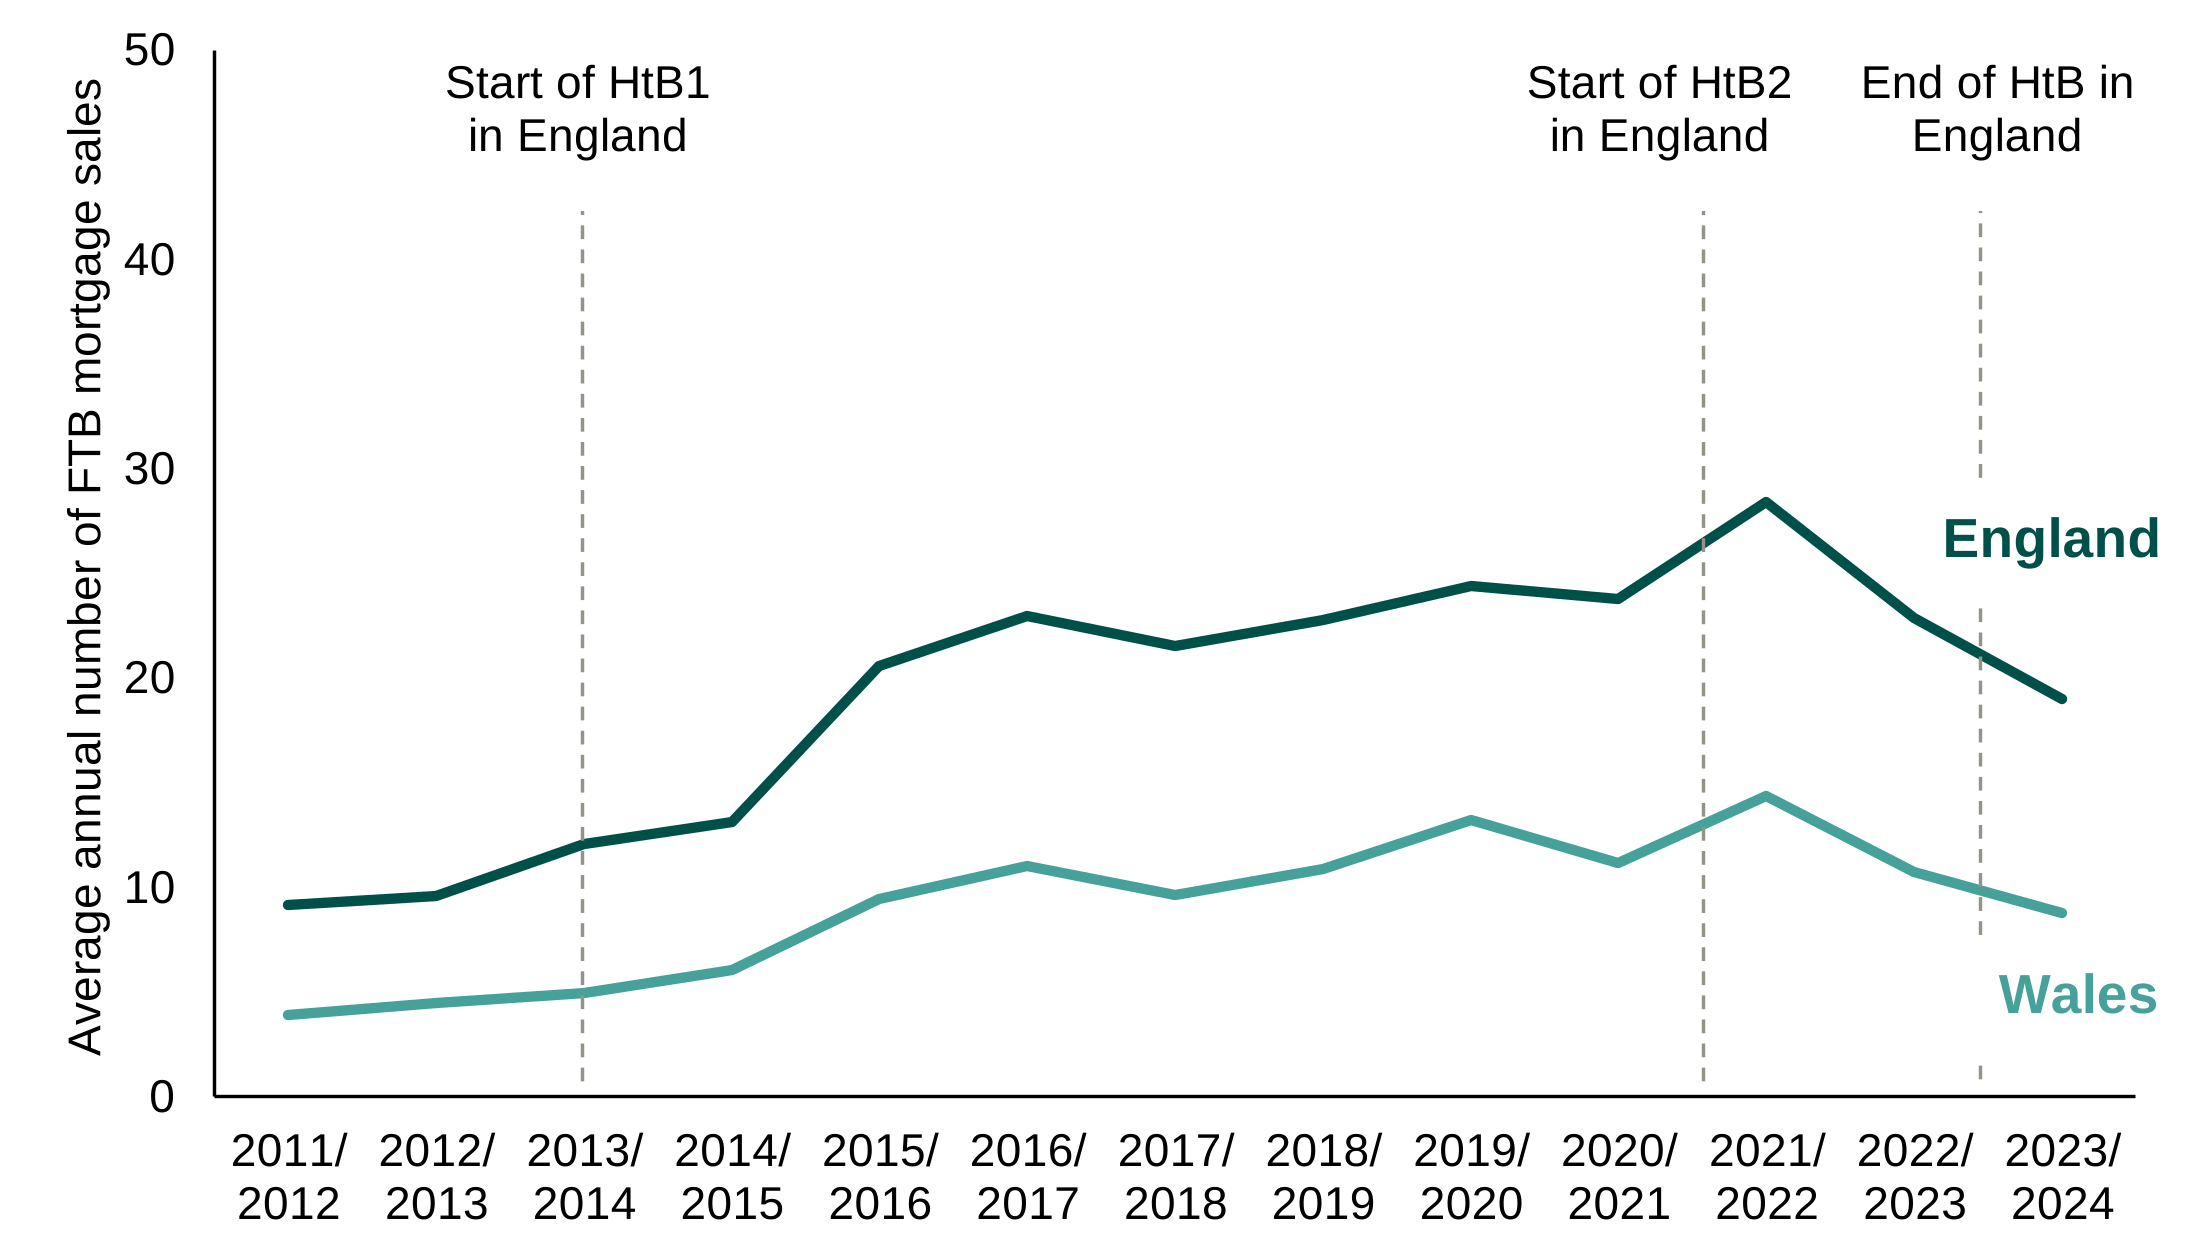
This analysis compares trends in the number of FTB mortgage sales in areas close to the England/Wales border. Figure 4.1 shows the average number of FTB mortgage sales recorded in the UK Finance Regulated Mortgage Survey (RMS) each year for wards within 10km of the border.[footnote 2] There was a small increase in the number of FTB mortgage sales on the English side of the border after the start of the Help to Buy scheme in April 2013, followed by a larger increase on both sides of the border in 2015/16.[footnote 3]
Figure 4.1: Average number of first-time buyer mortgage sales in wards within 10 km of the England/Wales border, April 2011 to March 2024
Source: UK Finance Regulated Mortgage Survey
Alternative text
Line chart showing indexed trends for England and Wales from 2011-12 to 2023–24, with markers indicating the start of Help to Buy 1 around 2013 to 2014, the start of Help to Buy 2 around 2020 to 2021, and the end of Help to Buy around 2022 to 2023. Two lines represent England and Wales, with England consistently higher.
Both series begin at around 500 to 700 in 2011 to 2012 and rise steadily to peaks in the mid- to late 2010s, reaching roughly 1,600 to 1,700 for England and 1,300 to 1,400 for Wales. There is some fluctuation around 2017 to 2019, followed by another increase. England peaks at just above 2,000 around 2021 to 22, while Wales peaks at around 1,800 shortly after. After the end of Help to Buy, both series decline, ending at approximately 1,400 for England and 1,100 for Wales in 2023 to 2024.
The difference-in-discontinuities approach compares these trends accounting for differences between wards and the distance from the border to estimate the impact of the introduction of the Help to Buy scheme in England. Table 4.1 shows the results of this analysis; in these areas, it is estimated the introduction of the scheme led to around an average of 6 additional FTB mortgage sales a year in these wards on the English side of the border. In other words, the average number of FTB mortgage sales recorded on the English side of the border in the RMS was higher by a total of 6 sales a year than if these areas had continued to follow a similar trend to the wards on the Welsh side of the border.
On average, these wards in England had 20 FTB mortgage sales a year recorded in RMS between April 2013 and March 2021. As such, these findings suggest that more than a quarter of FTB mortgage sales recorded in the RMS in these English wards over the course of Help to Buy 1 were attributable to Help to Buy.
Table 4.1: Estimated impact of the introduction of Help to Buy on the annual number of first-time buyer mortgage sales in English wards within 10 km of the England/Wales border, April 2013 to March 2021
| English wards within 10km of the England/Wales border | |
|---|---|
| Average annual number of FTB mortgage sales (April 2013 to March 2021) | 20.2 |
| Counterfactual: Average annual number of FTB mortgage sales if the trend had been the same as in wards on the Welsh side of the border | 14.5 |
| Estimated impact of Help to Buy 1 | +5.7 FTB mortgage sales a year per ward |
| 95% confidence intervals | +3.3 to +8.1 |
| p-value | <0.001* |
*statistically significant at the 95% level
Figure 4.2 shows these estimated impacts broken down by financial year. This graph compares the change in the number of FTB mortgage sales either side of the border since 2012/13, the year before the Help to Buy scheme started in England. Values above zero indicate that the number of FTB mortgage sales increased faster on the English side of the border than on the Welsh side.[footnote 2] Evidence for a small effect can be seen from the first year of the Help to Buy scheme (2013/14), with larger effects from 2015/16 onwards.
This initial effect on home ownership happened before there was a noticeable effect on housing supply in these areas. As described in chapter 5, the analysis estimates that the introduction of Help to Buy also led to an increase in housing supply in these same wards close to the England/Wales border, and that the effect on housing supply can be seen from the second year of the Help to Buy scheme (2014/15). However, Figure 4.2 indicates the effect on home ownership was more immediate, with a higher number of FTB mortgage sales observed from the first year of the Help to Buy scheme. The slightly longer timeframe for effects on housing supply is likely to reflect the time taken for new homes to be completed. It also aligns with the intuitive economic theory that, other things equal, an increase in demand should support additional supply.
This initial effect is therefore likely to be driven primarily by giving prospective FTBs greater access to finance as it occurs before there is evidence of an effect on supply. The further increase in home ownership in 2015/16 in Figure 4.2 could be responding to the increase in housing supply in these wards. The values above zero after the Help to Buy scheme started, especially from 2015/16, show that FTB mortgages increased faster in English wards than in Welsh wards in that year. However, as discussed further below, this change in 2015/16 could be exaggerated by changes in how the FTB mortgage sales data were recorded.
Figure 4.2: Estimated annual impact of Help to Buy on number of first-time buyer mortgage sales per English ward, April 2013 to March 2021 (England/Wales border)
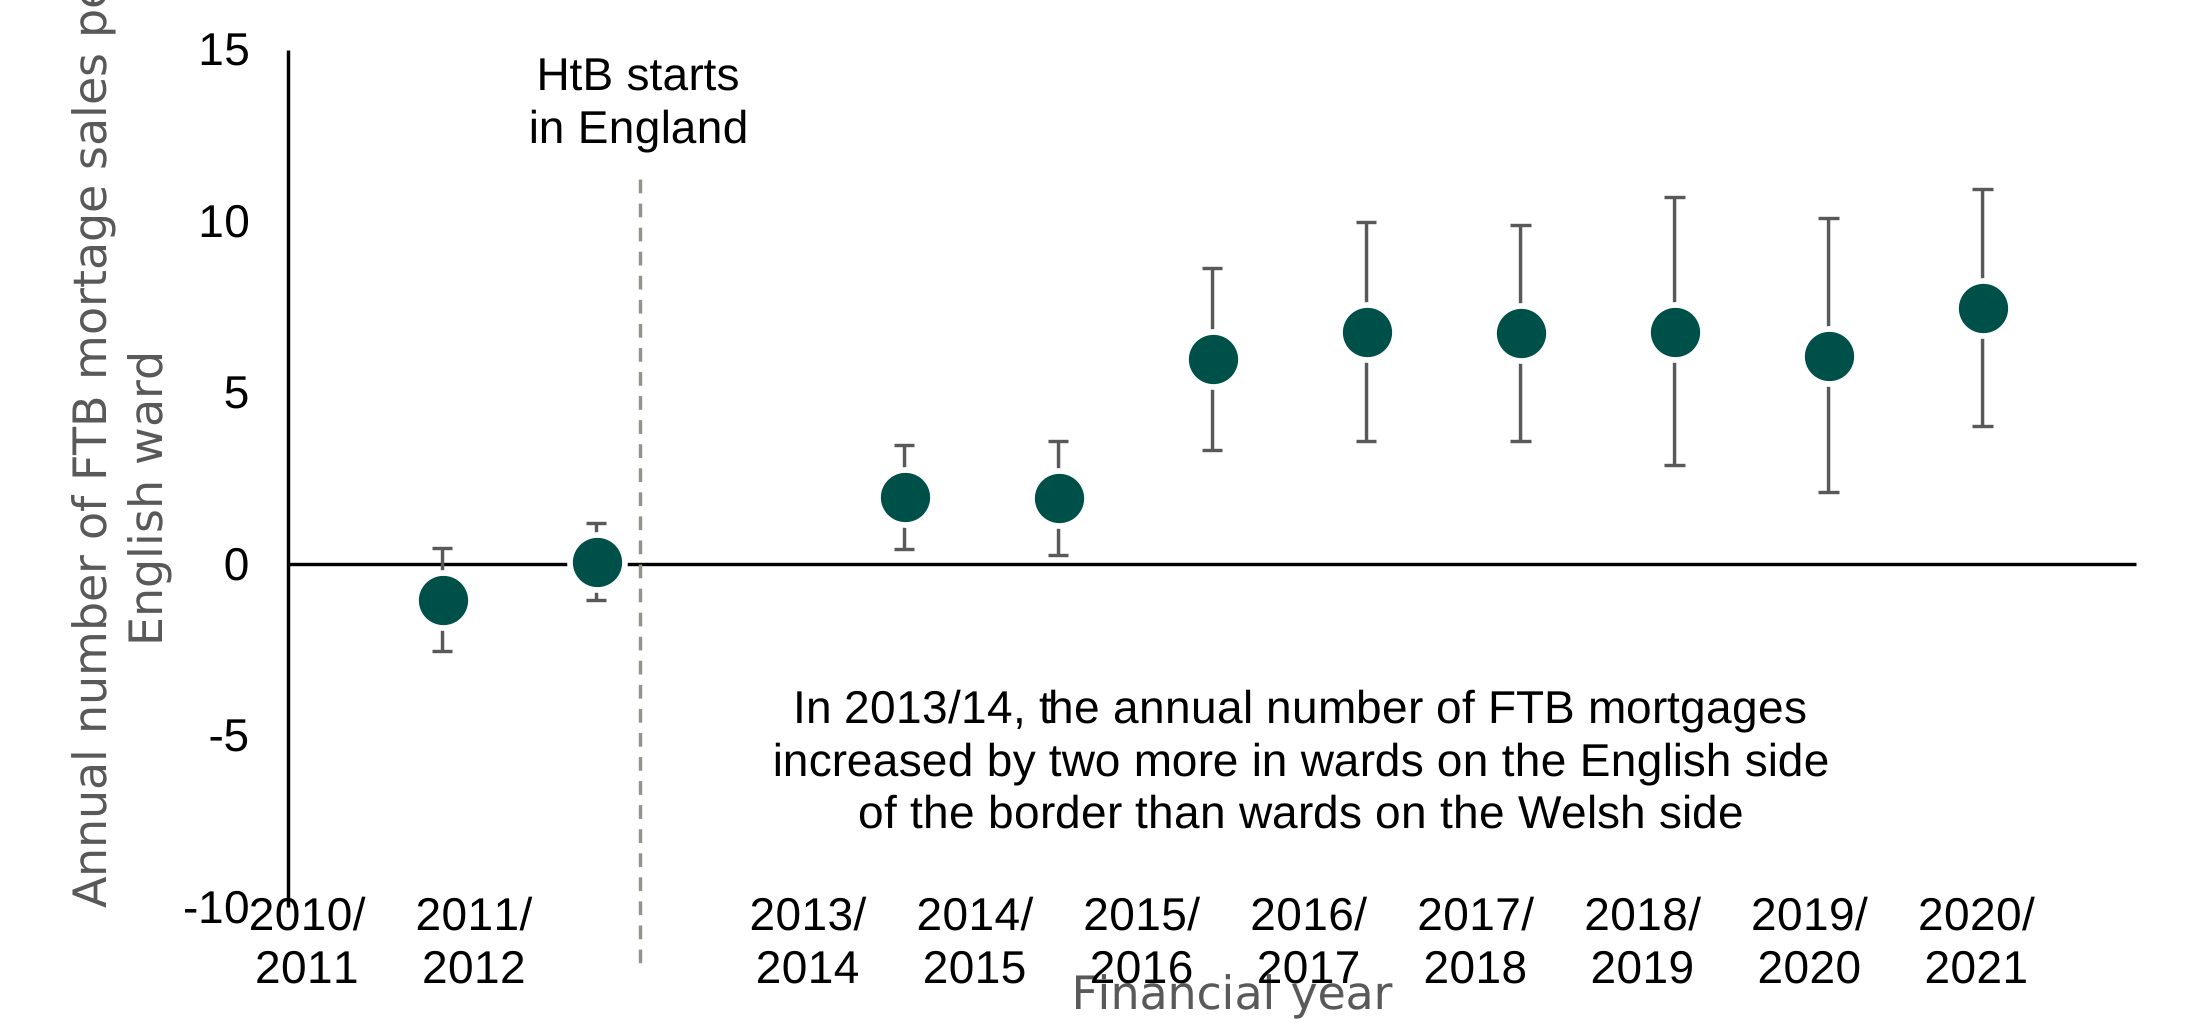
Source: UK Finance Regulated Mortgage Survey
Alternative text
Dot chart titled Estimated annual impact of Help to Buy on number of first-time buyer mortgage sales per English ward, April 2013 to March 2021 (England/Wales border). The chart shows annual estimates with error bars from 2010–11 to 2020–21 and a vertical marker indicating the start of Help to Buy in 2013 to 2014. Values are slightly negative at around -1 in 2010–11, rise to around 0 in 2011 to 2012, and increase to about 2 in 2013 to 2014 and 2014 to 2015. From 2015 to2016 onwards, estimates are consistently positive, generally ranging between about 6 and 8, reaching their highest level around 2020 to 2021. Error bars indicate uncertainty around each estimate and widen slightly in later years.
The analysis relies on the assumption that without the Help to Buy scheme the trends either side of the border would have been similar. If this ‘parallel trends’ assumption does not hold, the analysis would not isolate the effects of the introduction of the Help to Buy scheme.
Before the start of the Help to Buy scheme, the trends were similar on both sides of the border. This can be seen in Figure 4.2, where the values for 2010/11 and 2011/12 are reasonably close to zero, indicating little difference in the trends at this point. The fact that the trends were similar before the Help to Buy scheme was introduced gives some confidence in the parallel trends assumption; if the trends were similar before the start of the Help to Buy scheme, it is more reasonable to think that they would have continued to be similar without Help to Buy.
Nonetheless, the study conducted additional analyses that explore 2 specific risks to the parallel trends assumption.
First, the analysis considered the risk of displacement across the border. Some prospective first-time buyers may have chosen to buy a home on the English side of the border because of the more generous support available through the Help to Buy scheme but, without the scheme, would have bought on the Welsh side of the border. This would reduce the number recorded on the Welsh side of the border so that this trend would no longer fairly represent what would have happened in English wards without the Help to Buy scheme.
If such displacement were substantially influencing the results, it would be intuitive to see a larger estimated impact for the areas closest to the border. This is because it is reasonable for such displacement to occur most commonly over small distances. Figure 4.3 shows the estimated impacts using different distance thresholds. For example, the point on the left represents the result when restricted to wards within 5km of the border, and the point on the right represents the result when the analysis is based on wards within 20km of the border. The results are similar across these different thresholds. This suggests that displacement across the border is unlikely to be a major factor in the results. It also shows that the conclusions are not sensitive to the choice of how close to the border the analysis is restricted.
Figure 4.3: Estimated impact of the introduction of Help to Buy on the annual number of first-time buyer mortgage sales per English ward, April 2013 to March 2021
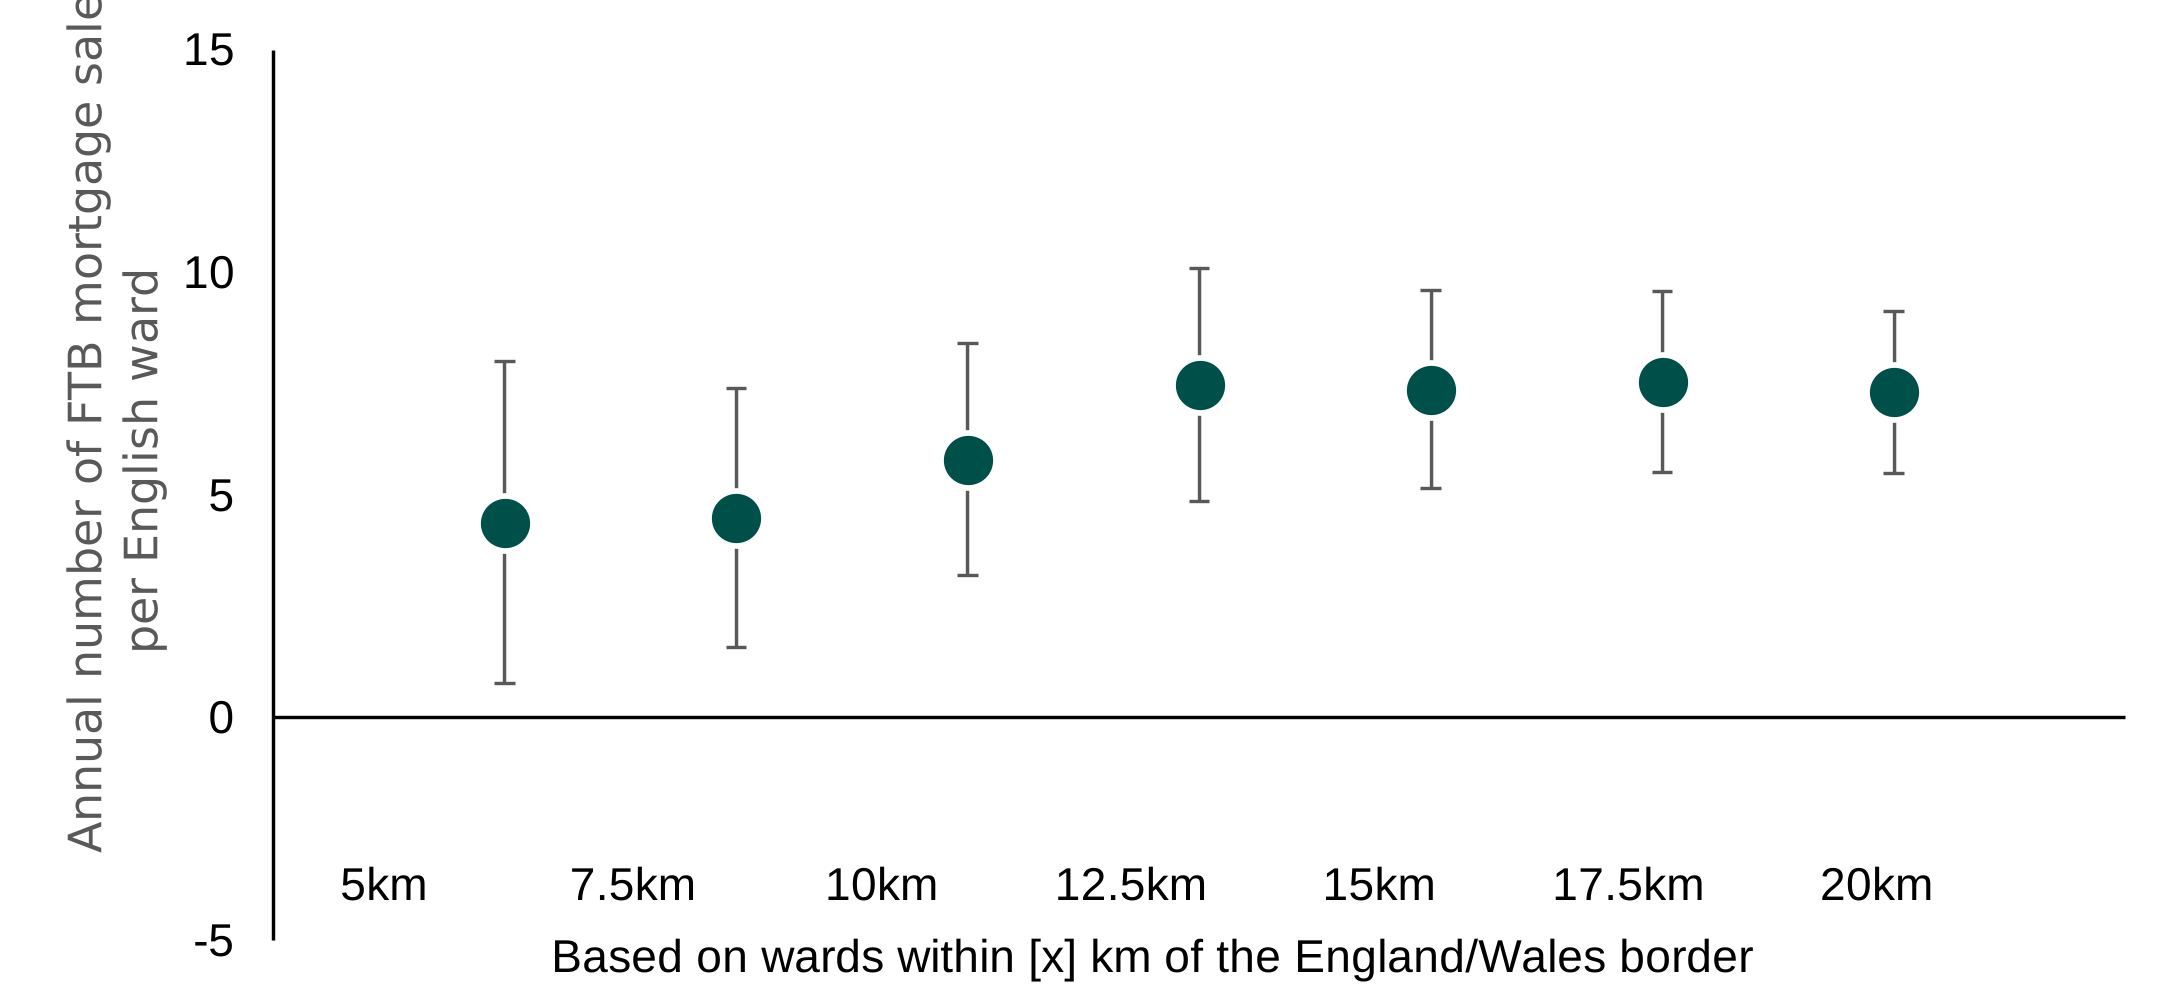
Source: UK Finance Regulated Mortgage Survey
Alternative text
Dot chart titled Estimated impact of the introduction of Help to Buy on the annual number of first-time buyer mortgage sales per English ward, April 2013 to March 2021. The chart shows estimated effects for areas within increasing distances of the England–Wales border, from 5 km to 20 km, with vertical error bars indicating uncertainty.
All estimates are positive and increase with distance from the border. The effect is around 4 to 5 additional mortgages per ward at 5 km and 7.5 km, rising to about 6 at 10 km. It increases further to approximately 7 to 8 at distances between 12.5 km and 20 km. Error bars widen slightly at greater distances, indicating greater variation, but remain above zero across all distances.
Second, the analysis considered the risk of changes in the underlying data. The RMS is not a comprehensive record of FTB mortgage sales as not all lenders provide data. If the coverage of the underlying data changed in different ways either side of the border, this could affect the results.
There is some evidence that the increase in the number of FTB mortgage sales recorded in the RMS in 2015/16 is partly explained by an increase in the coverage of the RMS at the same time.[footnote 3] However, even if the analysis conservatively assumes that all of the additional increase in 2015/16 is explained by changes in how data are recorded, the analysis would still suggest the Help to Buy scheme had a positive impact on home ownership. For example, Table 4.2 shows the results of 2 alternative analyses:
- adjusting for the estimated coverage of the RMS in England and Wales[footnote 4]
- excluding data from 2015/16 onwards
In both cases, there is evidence for a positive impact on home ownership in these areas, although somewhat smaller than the findings from the main analysis described above. For both analyses, these estimates are equivalent to just under 1 in 5 FTB mortgage sales recorded in the RMS being attributable to the Help to Buy scheme.[footnote 6]
Table 4.2: Estimated impact of the introduction of Help to Buy on the annual number of first-time buyer mortgage sales in English wards within 10km of the England/Wales border
| Adjusted for estimated coverage of RMS | Excluding data from 2015/16 onwards | |
|---|---|---|
| Average annual number of FTB mortgage sales | 20.2 | 12.6 |
| Average annual number of FTB mortgage sales if the trend had been the same as in wards on the Welsh side of the border | 16.3 | 10.4 |
| Estimated impact of Help to Buy 1 | +3.8 FTB mortgage sales a year per ward | +2.2 FTB mortgage sales a year per ward |
| 95% confidence intervals | +2.3 to +5.3 | +1.0 to +3.3 |
| p-value | <0.001* | 0.004* |
*statistically significant at the 95% level
The first analysis assumed that the relative increase in home ownership in England from 2015/16 reflected the impacts of the Help to Buy scheme. These additional analyses assume that all of that increase is explained by changes in how data were recorded. The evaluation partners consider that the real effects of the Help to Buy scheme are likely to lie between these 2 points, that is, approximately equivalent to 15-30% of FTB mortgage sales recorded in the RMS for these areas close to the England/Wales border being attributable to the Help to Buy scheme.
An effect of this scale implies the Help to Buy scheme supported home ownership in these areas close to the England/Wales border even for first-time buyers who did not use the scheme. The lower end of the estimate (15% of FTB mortgage sales in the RMS in these areas) equates to almost 1,800 additional FTBs in these wards. This is almost as large as the number of Help to Buy loans issued in the same areas (around 2,150). The upper end of the estimate would imply the number of additional FTBs in these wards during Help to Buy 1 was in fact larger than the number of Help to Buy loans issued.
It is possible for the Help to Buy scheme to have wider effects on home ownership beyond customers of the scheme. This could happen through effects on housing supply (see chapter 5) making more homes available for FTBs. Additionally, the presence of the Help to Buy scheme may have given lenders greater confidence to offer more high LTV mortgages.
4.3.2 Difference-in-differences: national trends
The analysis presented in the previous sub-section suggests that the introduction of the Help to Buy scheme led to an increase in home ownership in areas close to the England/Wales border. However, these effects do not necessarily generalise to other areas in England. This section presents the analysis of the national trends, to inform the evaluation partners’ judgement of how far the positive impact in areas of England close to the Welsh border can be generalised nationally. It uses a difference-in-differences approach that compares wider trends, here at a national level, following the introduction of the Help to Buy scheme in England.
Figure 4.4 shows the trends in the number of FTB mortgage sales across England, Wales and Scotland using Local Authority (LA) level data from the ONS. The number of FTB mortgage sales increased across all 3 nations from 2011. By 2021, the number of FTB mortgage sales was around twice as high in each nation as the period immediately before the Help to Buy scheme started. However, as this increase started before the introduction of Help to Buy and was observed across all 3 nations, it must be at least partly caused by other factors than the Help to Buy scheme in England. Specifically, this increasing trend is likely to represent the recovery of the market following the large fall in FTB mortgage sales following the financial crisis in 2008.
Figure 4.4: Nationwide trends in average number of first-time buyer mortgages, 2010 to 2024
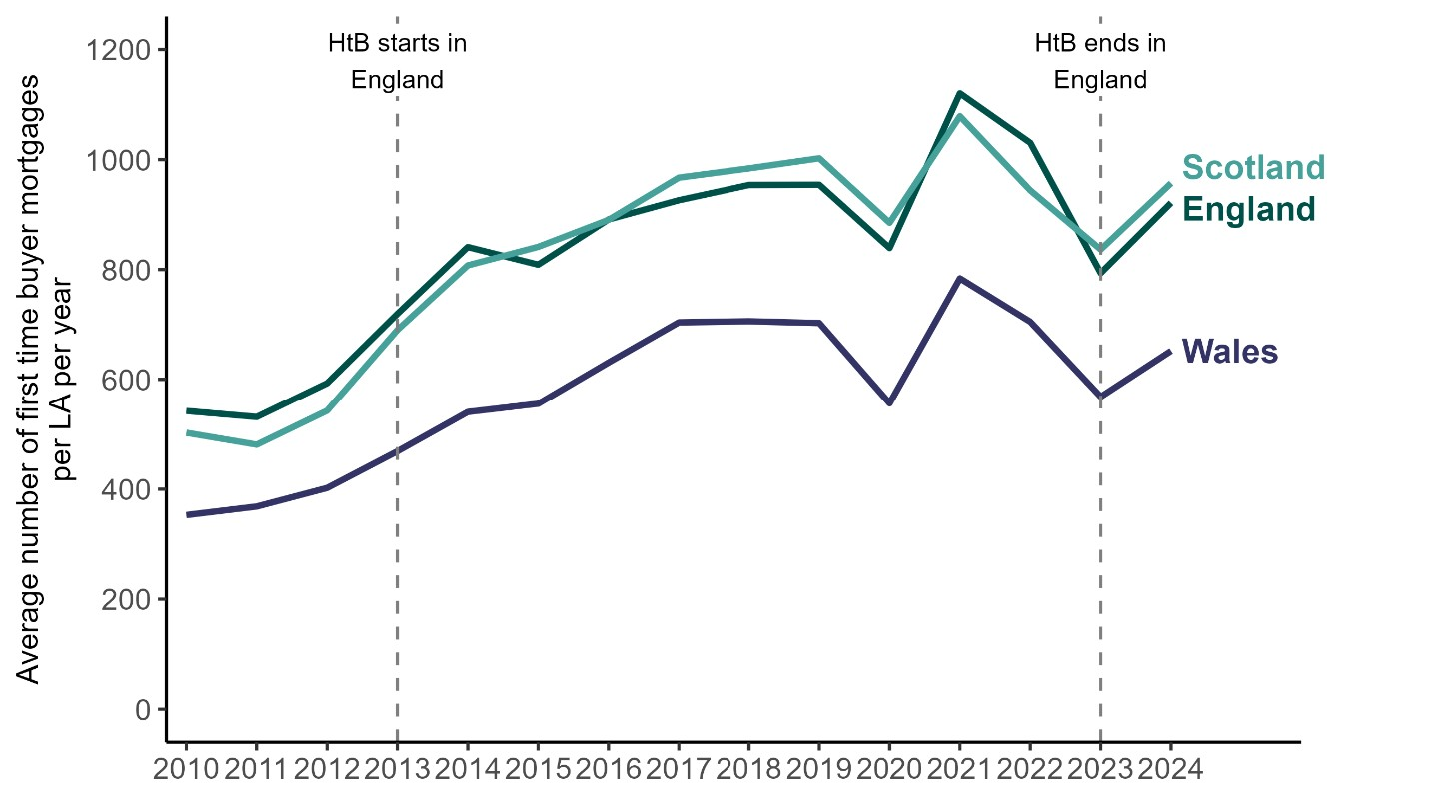
Source: ONS First-time buyer mortgage sales by LA
Alternative text
A line chart shows the average number of first‑time buyer mortgages per local authority from 2010 to 2024 for England, Scotland, and Wales. England and Scotland follow similar upward trends, rising from around 500 to 550 in 2010 to peaks near 1,100 in 2021 before dipping and partially recovering by 2024. Wales remains consistently lower, increasing from about 350 in 2010 to around 750 in 2021, then falling and rising again. Vertical dotted lines mark when Help to Buy starts (2013) and ends (2022) in England.
Table 4.3 shows how the change observed in England compares to the change observed in Wales and Scotland combined over the course of Help to Buy 1. Figure 4.5 breaks this down by year, in comparison to 2012. This data is published in calendar years and so this analysis covers the period from January 2010 to December 2020, before Help to Buy 2 was introduced in April 2021.
Before 2012, the values in Figure 4.5 are close to zero, indicating the trends were similar across the nations before the introduction of the Help to Buy scheme. While there is a little more variation after the start of Help to Buy (from 2013), the trends were still reasonably similar across nations.
This evidence therefore shows that home ownership did not increase faster in England following the introduction of the Help to Buy scheme than in Scotland and Wales. As some level of support was available in all 3 nations, it is possible that the Help to Buy scheme made some contribution to the wider recovery in FTB mortgage sales following the financial crisis in 2008. However, the evidence does not suggest that the Help to Buy scheme in England had an effect at a national scale over and above the effects of the more limited schemes in Wales and Scotland.
Table 4.3: Difference in trends of annual first-time buyer mortgage sales between LAs in England and LAs in Scotland and Wales combined, 2013 to 2020
| LAs in England | |
|---|---|
| Average annual number of FTB mortgage sales (2013 to 2020) | 866.8 |
| Average annual number of FTB mortgage sales if the trend had been the same as in Scotland/Wales | 872.9 |
| Estimated difference in trends following the introduction of Help to Buy 1 | -6.1 |
| 95% confidence interval | -101.2 to +89.1 |
| p-value | 0.901 |
Figure 4.5: Difference in trends of annual first-time buyer mortgage sales between LAs in England and LAs in Scotland and Wales combined, 2010 to 2020
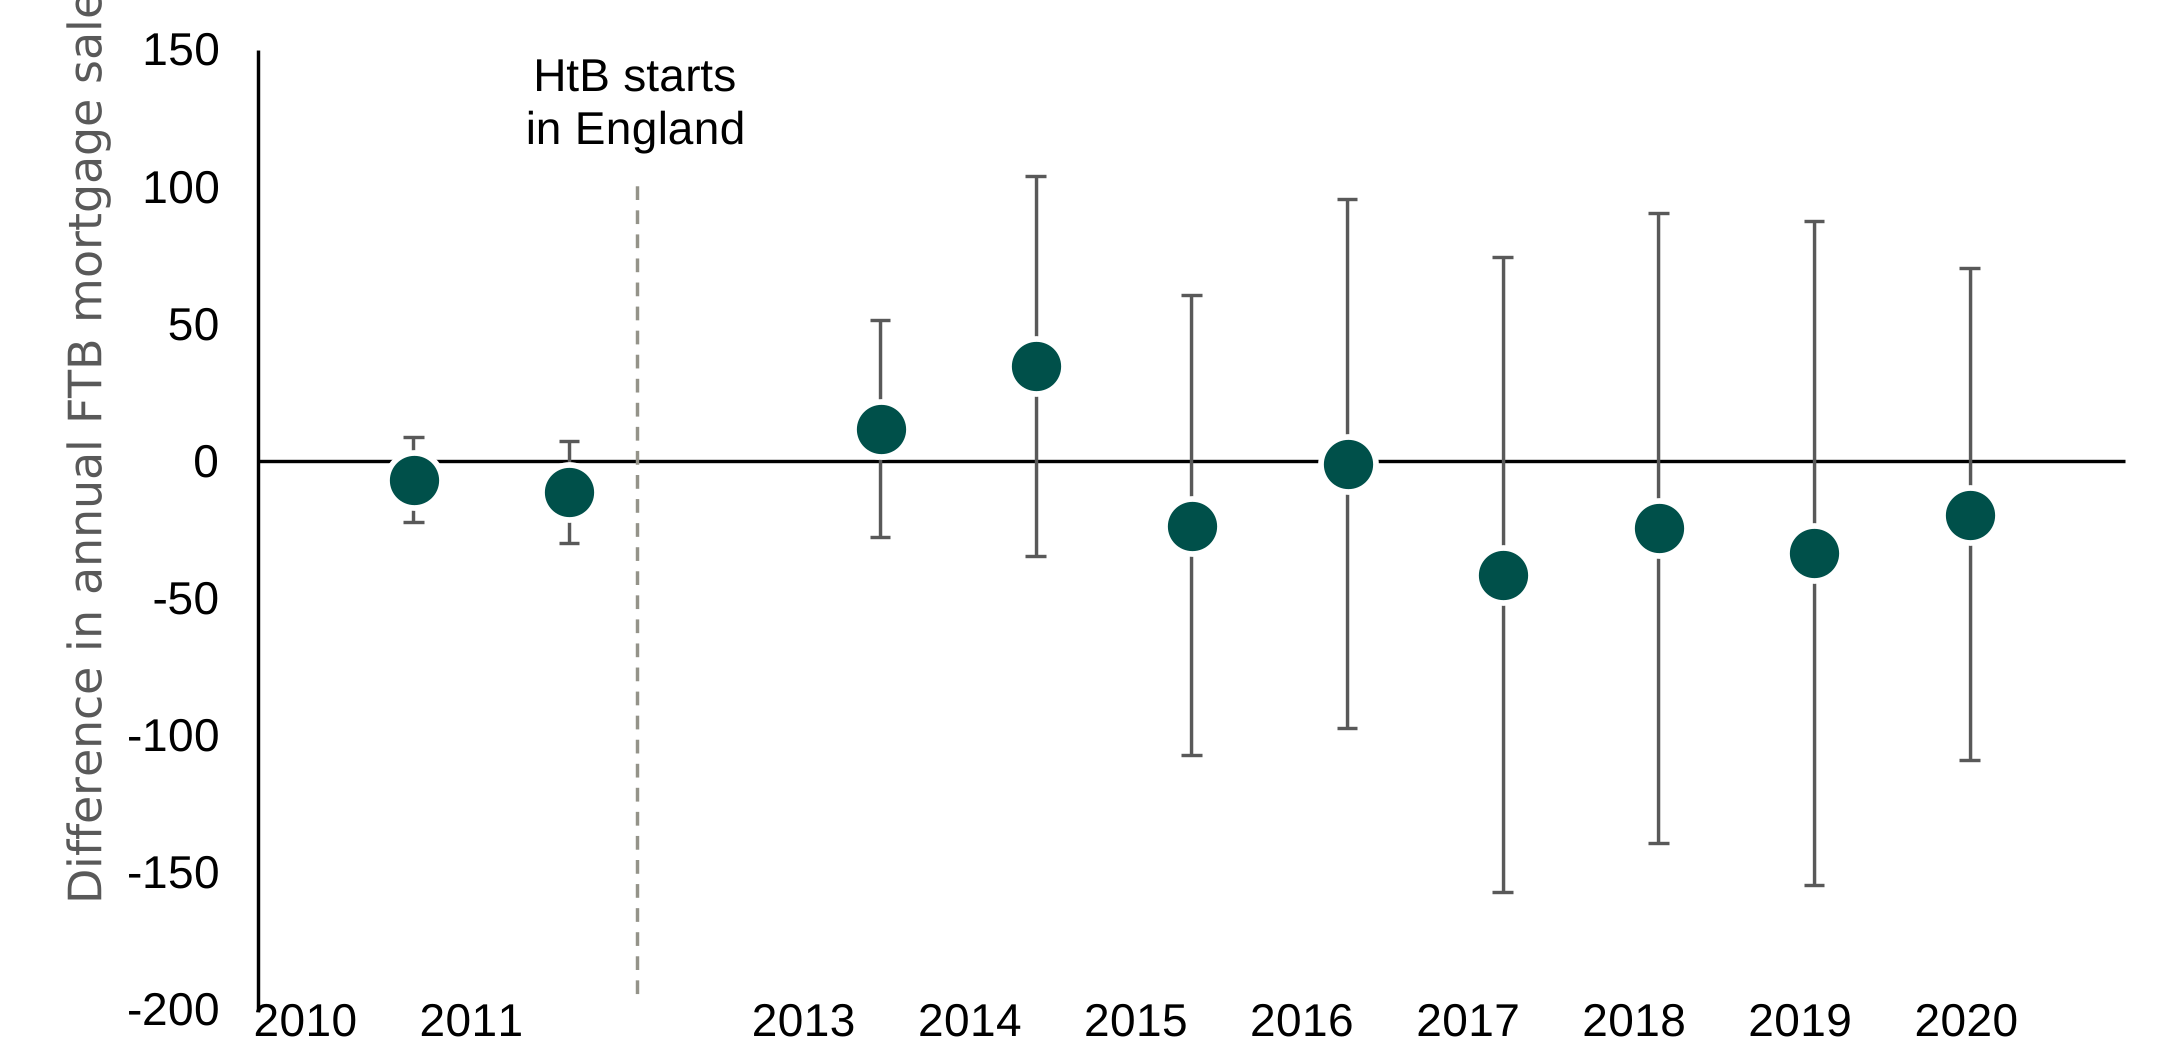
Source: ONS First-time buyer mortgage sales by LA
Alternative text
Dot chart with error bars showing annual estimated impacts from 2010 to 2020, with a vertical dashed line marking when Help to Buy starts in England around 2013. The estimates are centred around zero, with a horizontal line indicating no effect.
Before the policy starts, values in 2010 and 2011 are slightly negative, close to zero. After 2013, estimates fluctuate, with a small positive effect of around 10 to 15 in 2013 and a larger positive value of about 35 in 2014. From 2015 onwards, estimates vary widely, alternating between slightly negative and near zero, with most central values between about -40 and 0.
Error bars are large throughout the post-2013 period, often spanning well above and below zero, indicating substantial uncertainty in the estimates.
4.3.3 Difference-in-generosities: Local housing market conditions
The analysis of geographic borders suggests that the introduction of Help to Buy scheme led to an increase in home ownership in England close to the border with Wales. However, the analysis of national trends suggests these effects do not generalise to other areas in England. The analysis of local generosity is intended to investigate how the impacts varied across different types of area.
This analysis suggests that the impact on home ownership varied by local market, with FTB mortgage numbers increasing faster in the more affordable (higher generosity) areas. In contrast, there was very little increase in FTB mortgage numbers in the least affordable areas.
Figure 4.6 shows the trends in the number of FTB mortgage sales for wards based on the local ‘generosity’ of the Help to Buy scheme. There was little change in the least affordable areas (where the amount that could be borrowed at the start of the scheme was less than a typical FTB deposit). The number of FTB mortgage sales increased on average in other areas, and more so in areas where the loan that could be accessed through Help to Buy was large relative to local FTB deposits.
Figure 4.6: Average number of first-time buyer mortgages in England by local generosity of the Help to Buy scheme, 2013 to 2023
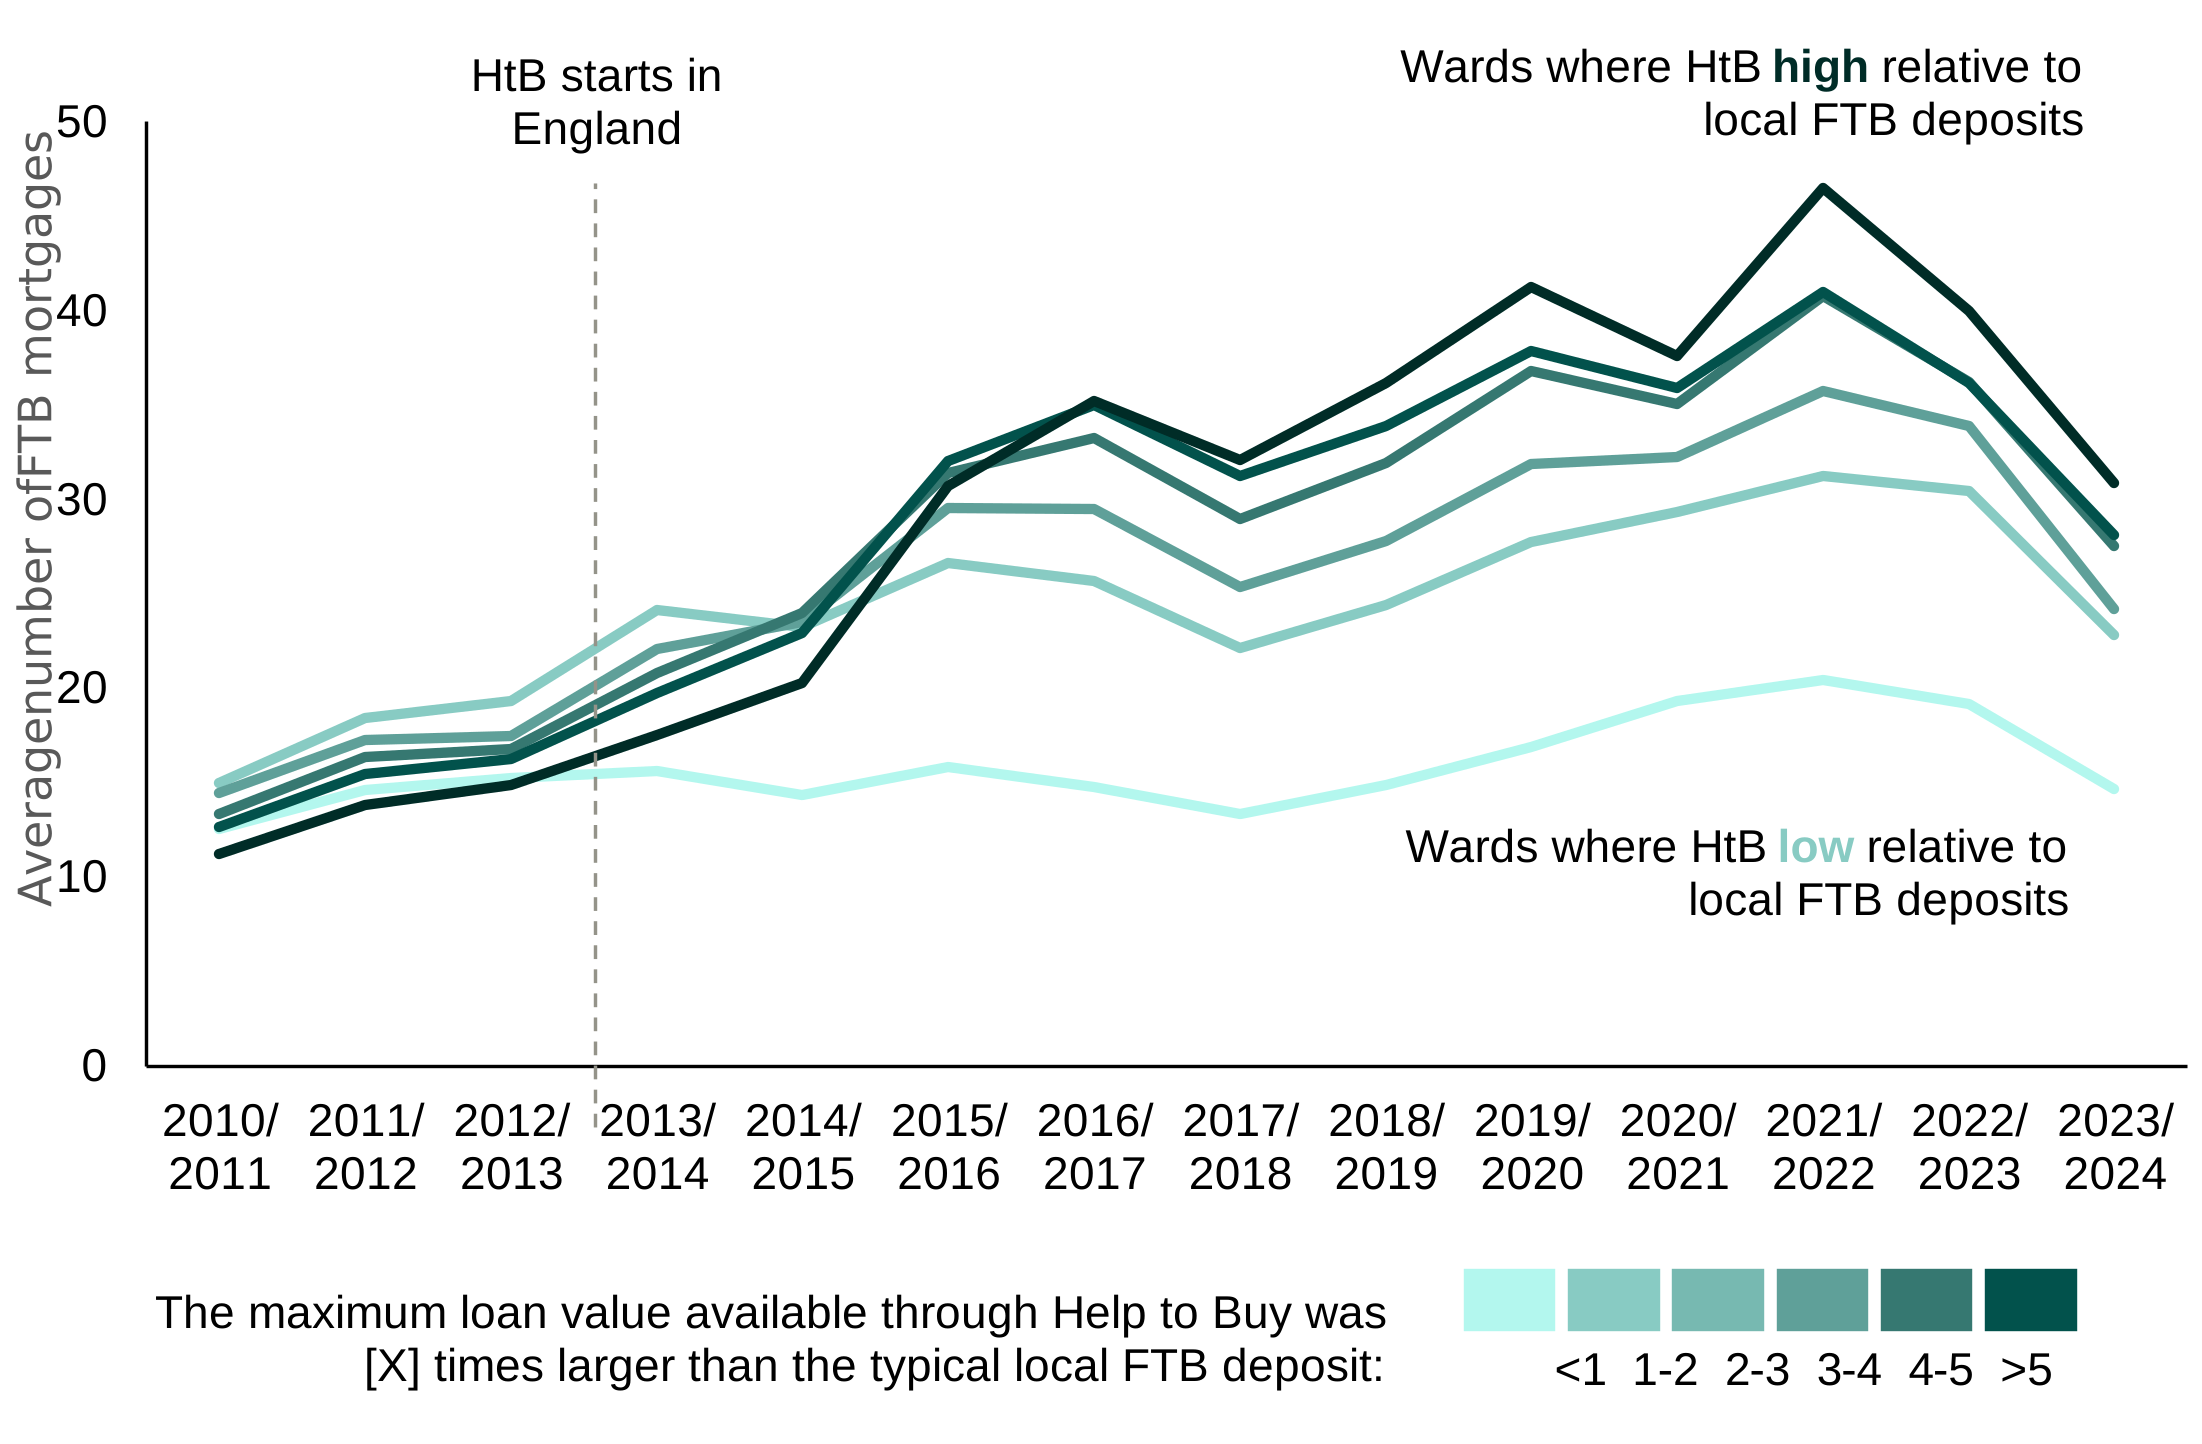
Source: UK Finance Regulated Mortgage Survey
Alternative text
A line chart shows average monthly first‑time buyer mortgages from 2010/11 to 2023/24 across ward groups defined by how large the Help to Buy (HtB) loan was relative to typical local deposits. All groups rise gradually until 2013, then increase more sharply after HtB begins in England. Wards where HtB support was high relative to deposits show the strongest growth, peaking around 4 to 4.5 mortgages per month in 2021/22 before declining. Wards with low relative HtB support remain much lower throughout, peaking just above 1.5. A colour legend categorizes ward groups from more than 1 to less than 5 times the typical local first‑time buyer deposit.
The analysis of price impacts (see chapter 7) also suggests that prices increased more in less affordable areas. Together, these findings indicate that areas with historically high deposits remained unaffordable for many buyers.
4.4 The increase in the maximum loan value in London from February 2016
In 2016, the maximum loan available for buyers in London was increased from 20% to 40% of the property value. Following this change, the number of Help to Buy customers in London increased (Figure 4.7).
Figure 4.7: Annual number of Help to Buy customers in London and other regions, April 2013 to March 2023
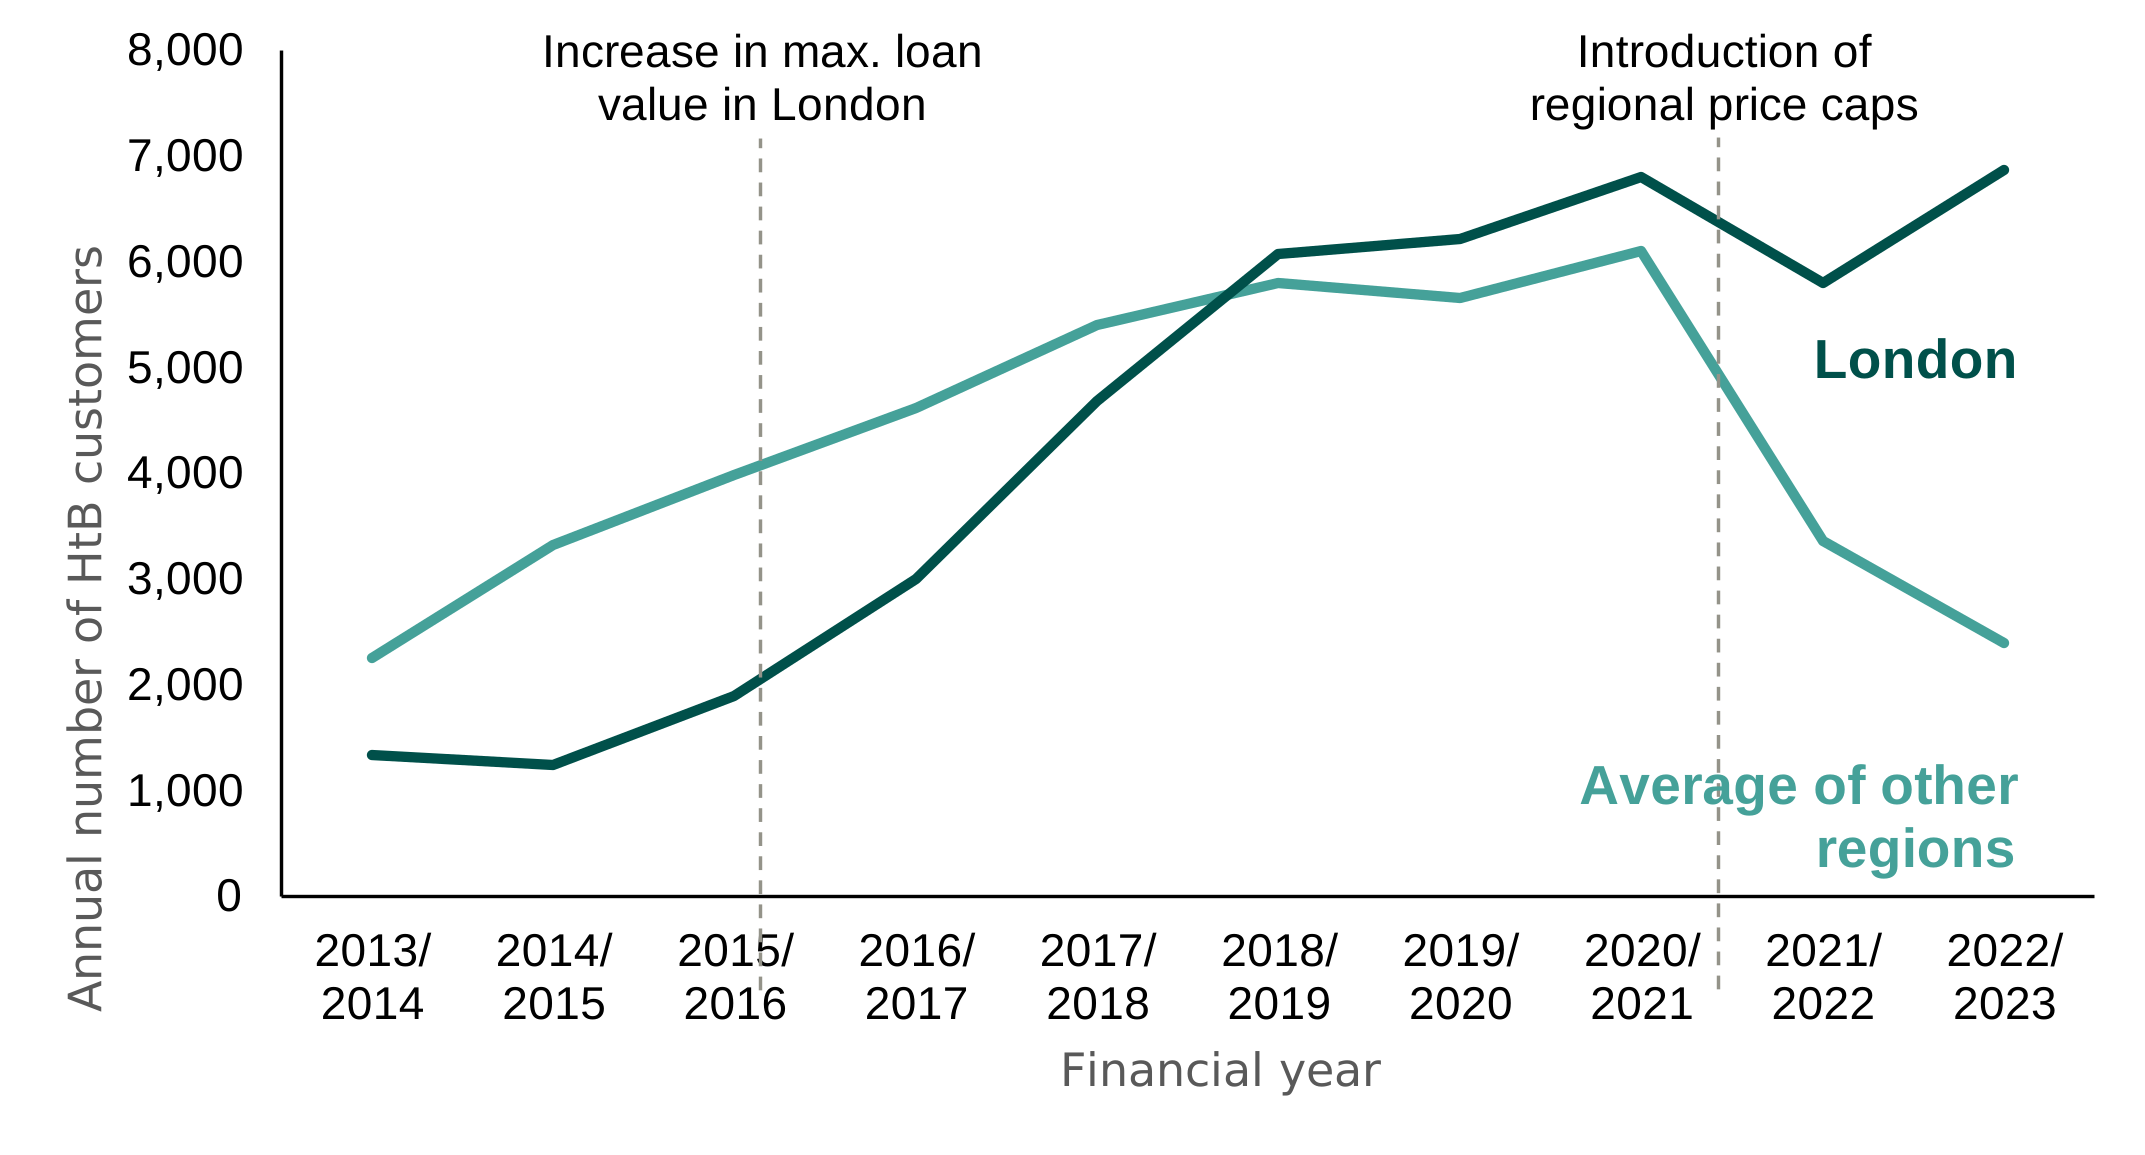
Source: Homes England Help to Buy customer database
Alternative text
Line chart comparing London and the average of other regions from 2013/14 to 2022/23, with values on the vertical axis ranging from 0 to 8,000. Two vertical markers indicate policy changes: an increase in maximum loan value in London around 2015/16 and the introduction of regional price caps around 2021/22.
The London series starts at about 1,300 in 2013/14, dips slightly, then rises sharply to around 6,000 by 2018/19. It continues upward to a peak of roughly 6,800 in 2020/21, falls to about 5,800 in 2021/22 after the introduction of regional price caps, and then partially recovers to near 6,800 in 2022/23.
The average for other regions begins higher, at about 2,200 in 2013/14, and increases steadily to around 5,800 by 2018/19. It remains relatively stable until 2020/21, then drops sharply after 2021/22 to around 3,300 and further to about 2,400 in 2022/23. London overtakes other regions around 2018/19 and remains higher thereafter.
In this section, the report investigates the effects of this change to the scheme on home ownership in London. The analysis first compares FTB mortgage sales near the London border on the basis that these areas are likely to have similar local housing markets. It then considers the trends in FTB mortgage sales across London, the South East and East of England as a whole.
4.4.1 Difference-in-discontinuities: evidence from the London border
Figure 4.8 shows the trends in the number of FTB mortgage sales in wards within 5km of the London border.[footnote 8] The trends are similar inside and outside of London.
Figure 4.8: Average number of first-time buyer mortgage sales in wards within 5km of the London border, April 2013 to March 2021
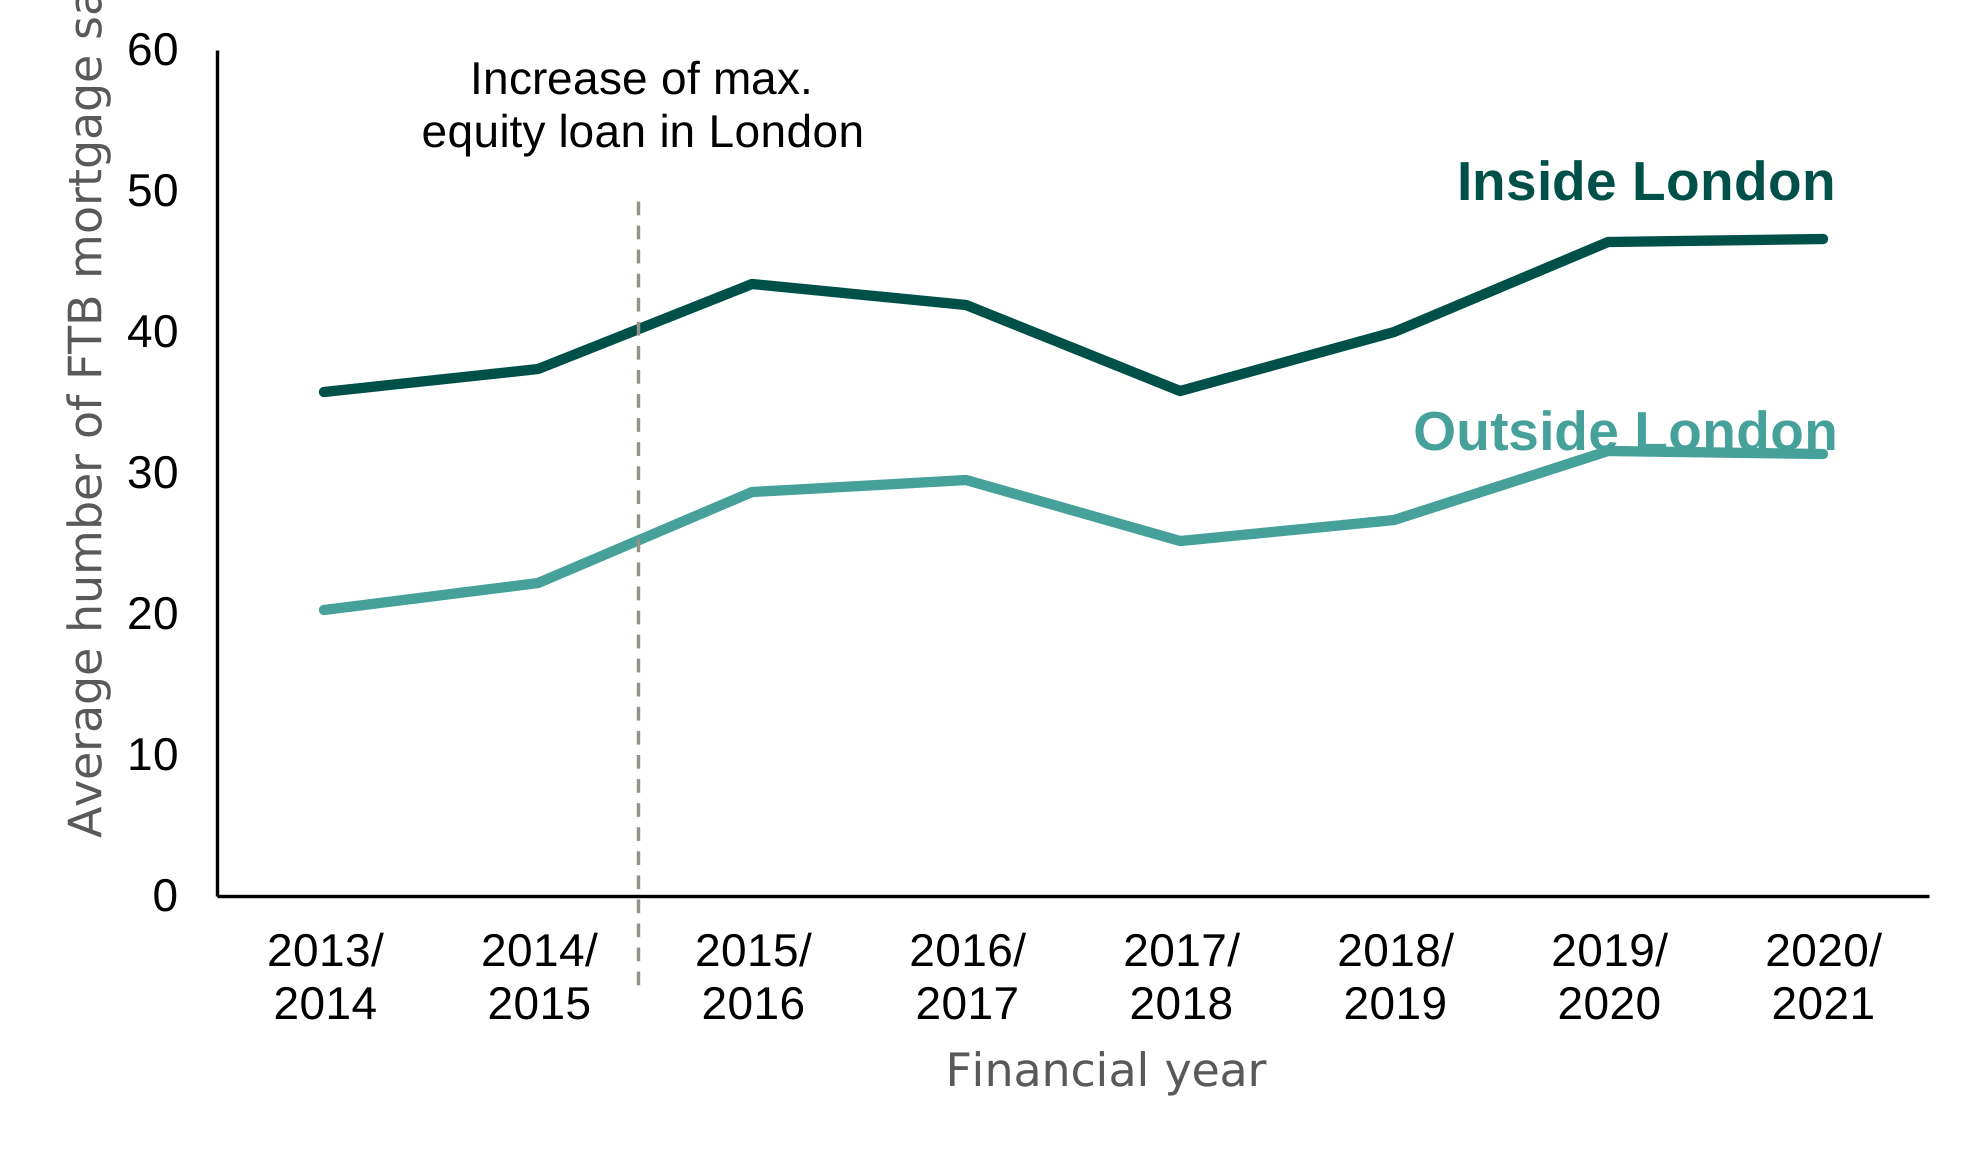
Source: UK Finance Regulated Mortgage Survey
Alternative text
Line chart comparing Inside London and Outside London from 2013/14 to 2020/21, with values ranging from 0 to 12,000. A vertical dashed line marks the increase in maximum equity loan in London around 2015/16.
Inside London starts at around 7,500 in 2013/14, rises to approximately 9,000 by 2015/16, then dips to about 7,500 in 2017/18 before increasing again. It reaches a high of around 9,700 to 9,800 in 2019/20 and remains at a similar level in 2020/21.
Outside London begins lower at about 3,400 in 2013/14, increases steadily to around 4,800 to 4,900 by 2016/17, then falls slightly to about 4,200 in 2017/18. It rises again to around 5,300 in 2019/20 and stays broadly stable in 2020/21.
Throughout the period, values inside London are consistently higher than outside London, with both series showing a dip around 2017/18 followed by recovery.
Table 4.4 shows the results of the quantitative impact analysis estimating the impact of the increase in the maximum loan value in London. This analysis indicates that there were on average 2 fewer FTB mortgage sales a year in the wards inside London than if these had followed the same trajectory as the wards outside of London. This difference is not statistically significant at the 95% level. It is equivalent to the number of FTB mortgage sales in London between February 2016 and March 2021 being about 5% lower than if these areas had followed the same trend as wards outside of London.
Table 4.4: Estimated impact of the increase in the maximum loan value in London on the annual number of first-time buyer mortgage sales, February 2016 to March 2021
| London wards within 5km of the border | |
|---|---|
| Wards within 5km of the London border | -2.2 |
| Average number of FTB mortgage sales a year (February 2016-March 2021) | 41.9 |
| Average number of FTB mortgage sales if the trend had been the same as wards outside the London border | 44.2 |
| Estimated impact of the increase in the maximum loan value in London | -2.2 FTB mortgage sales a year per ward |
| 95% confidence interval | -5.0 to +0.5 |
| p-value | 0.115 |
Figure 4.9 shows the results for different distance thresholds. These give broadly similar results, whether the analysis is based on wards very close to the border or including wards further away (up to 15km from the border). While not conclusive, these results point towards a small negative effect of the change to the maximum loan value on home ownership in London.
Figure 4.9: Estimated effect of the increase in maximum loan value on the annual number of first-time buyer mortgages (London border, February 2016 to March 2021)
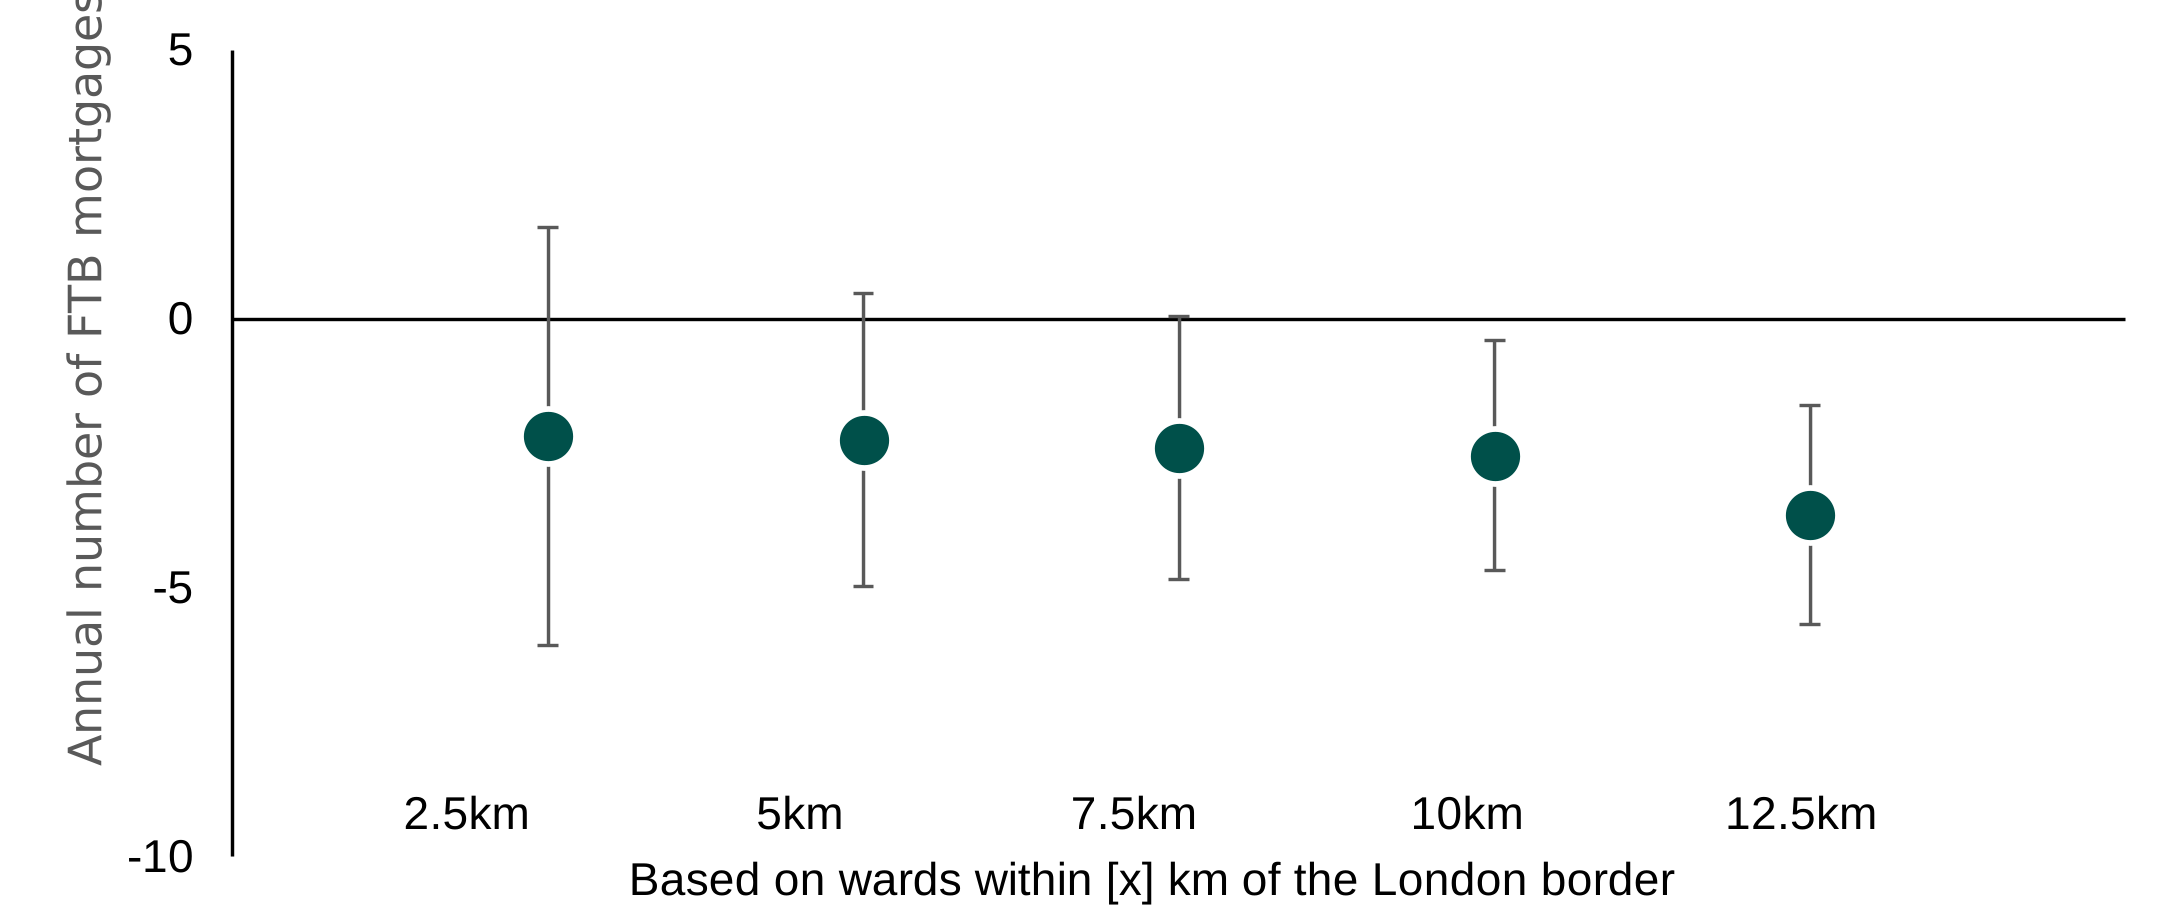
Source: UK Finance Regulated Mortgage Survey
Alternative text
Dot chart with error bars showing estimated effects for areas within increasing distances from the London border, ranging from 2.5 km to 12.5 km. All central estimates are negative and lie below the zero line, indicating a reduction in the measured outcome. The estimated effect is around -2.5 at 2.5 km, remains similar at about -2.5 at 5 km, and is slightly more negative at around -3 at 7.5 km and 10 km. The largest negative estimate appears at 12.5 km, at approximately -4.
Error bars for all points extend above and below the central estimates, with some ranges crossing or approaching zero at shorter distances, but most remaining below zero overall.
4.4.2 Difference-in-differences: Trends across London, the South East and East of England
Figure 4.10 shows the trends in the number of FTB mortgage sales across London, the South East and the East of England. The trend is fairly flat from 2015 to 2019 in London while increasing slightly in the South East and East of England.
Table 4.5 shows that the number of FTB mortgage sales in London was significantly lower following the increase in the maximum loan value than if it had continued to follow the same trajectory as the South East and the East of England. This is equivalent to approximately 7,000 fewer FTB mortgage sales a year across London as a whole, or 19% of FTB mortgage sales in London between January 2016 and December 2020.
Figure 4.10: Number of first-time buyer mortgage sales in London, the South East, and the East of England, 2010 to 2020
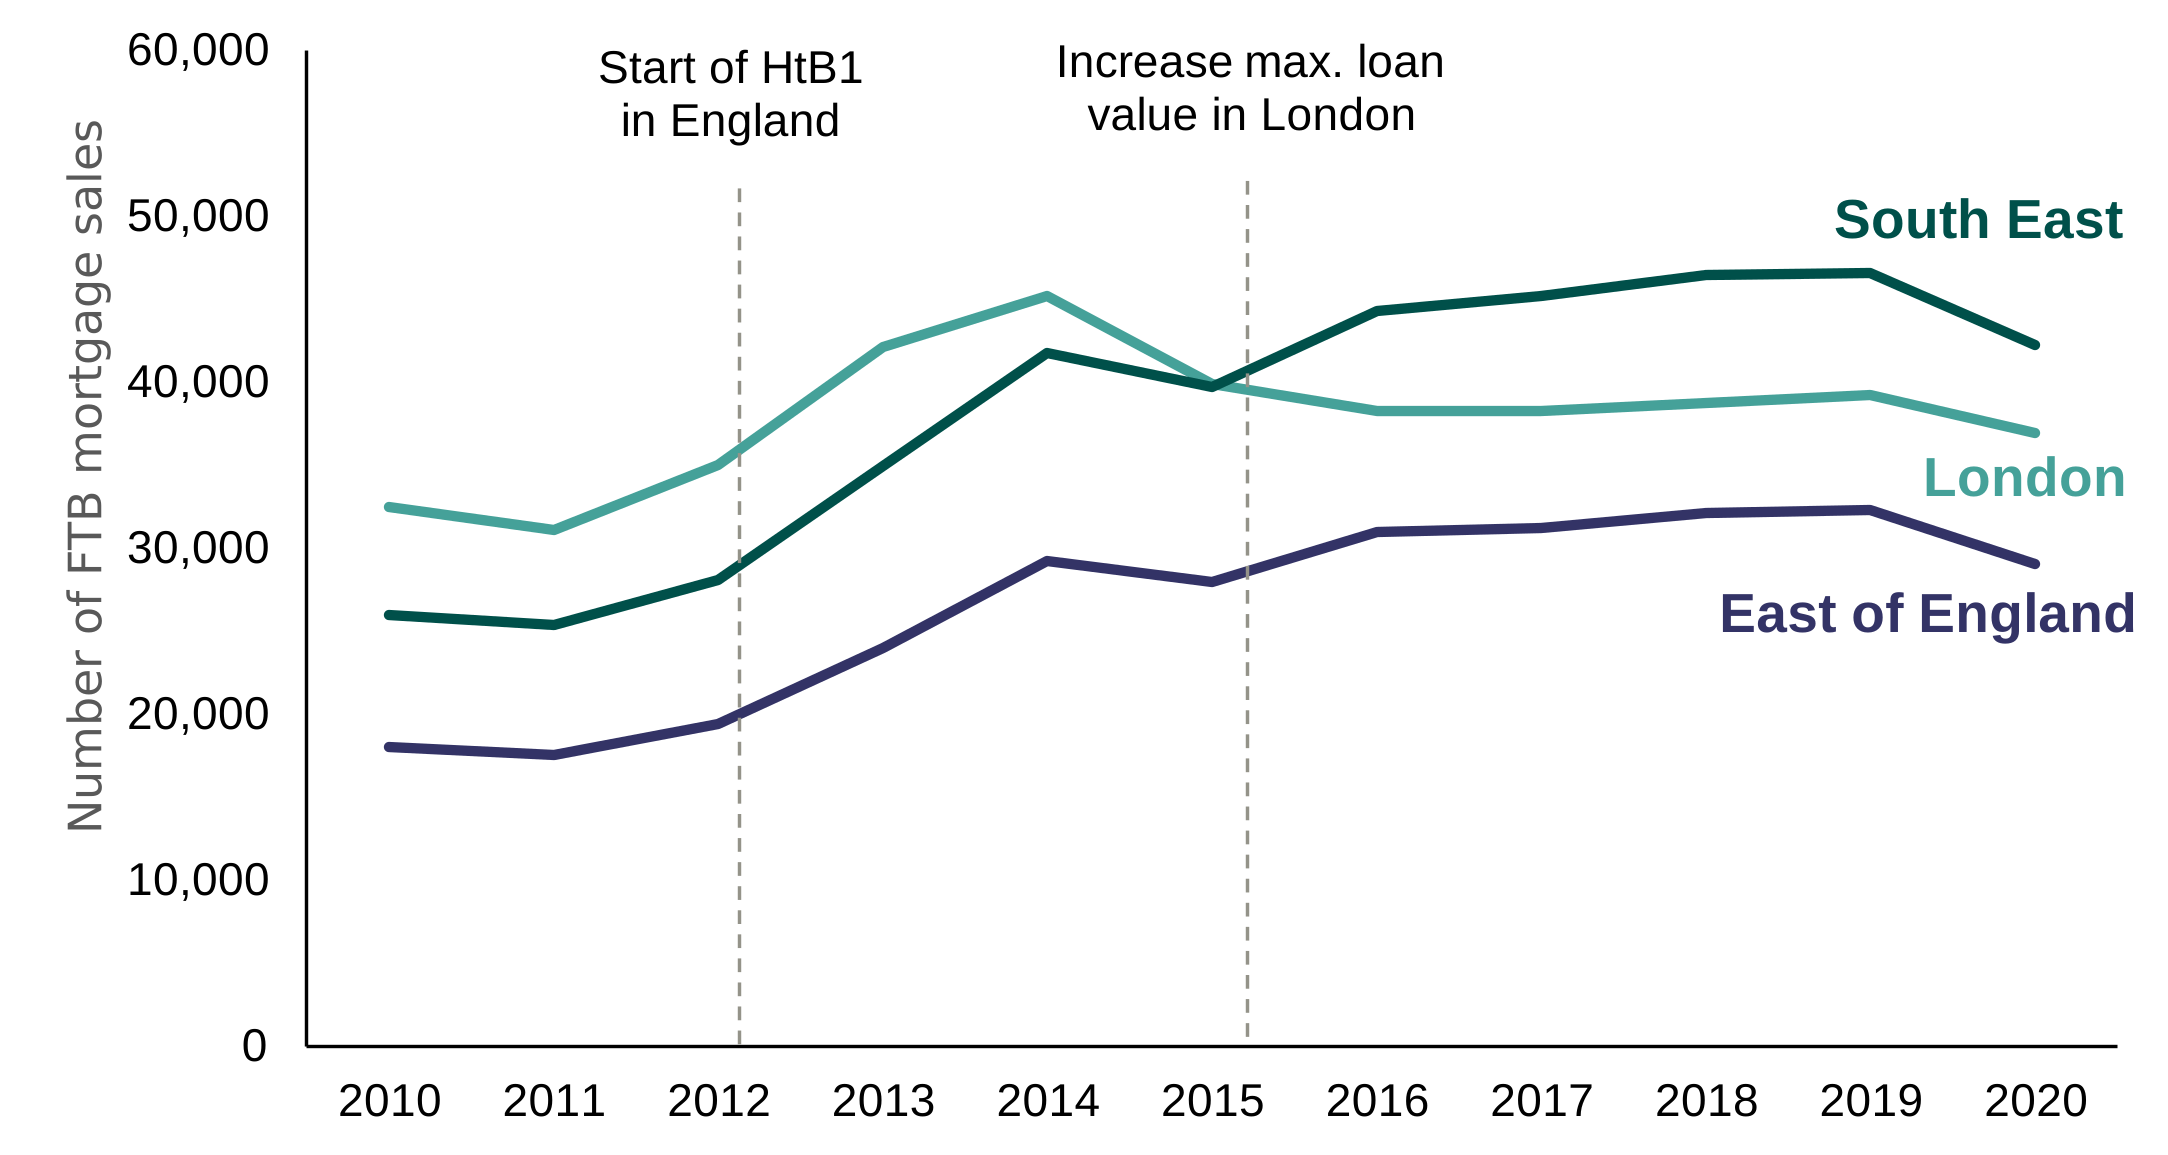
Source: UK Finance Regulated Mortgage Survey
Alternative text
Line chart comparing the number of first-time buyer mortgage sales in the South East, London, and the East of England from 2010 to 2020. The vertical axis ranges from 0 to 60,000. Two vertical dashed lines mark policy changes: the start of Help to Buy 1 in England around 2013 and an increase in maximum loan value in London around 2015.
London begins at around 32,000 in 2010, dips slightly in 2011, then rises to a peak of about 45,000 in 2014 before falling to around 40,000 in 2015 and remaining broadly stable near 38,000 to 39,000 through 2019, ending lower at about 37,000 in 2020. The South East starts at approximately 26,000 in 2010, declines slightly, then increases sharply after 2013 to around 42,000 in 2014. It continues rising to about 45,000 in 2016 and stabilises at around 46,000 to 47,000 through 2018 to 2019, before dropping to roughly 42,000 in 2020. The South East overtakes London from 2015 onwards. The East of England remains consistently lower, starting at around 18,000 in 2010, rising steadily to about 29,000 in 2014, dipping slightly in 2015, and then increasing gradually to around 32,000 by 2019 before falling back to about 28,000 in 2020.
Table 4.5: Difference in trends of first-time buyer mortgage sales between LAs in London and LAs in the South East and East of England combined, 2016 to 2020
| LAs in London | |
|---|---|
| Average number of FTB mortgage sales per LA (2016-2020) | 1,161 |
| Average number of FTB mortgage sales if the trend in London had been the same as in the South East/East of England | 1,379 |
| Estimated difference in trends following the increase in the maximum loan value in London | -218 FTB mortgage sales per LA |
| 95% confidence interval | -261 to -176 |
| p-value | <0.001* |
*statistically significant at the 95% level
Taken together with the results from the London border, this suggests that the increase in the maximum loan value in London likely had a small negative effect on home ownership in London. As discussed in chapter 7, there was a large increase in house prices in London before 2016, and there is some mixed evidence that the increase in the maximum equity loan value in London also contributed to higher prices in London. As such, homes in London may have been increasingly unaffordable for many prospective first-time buyers. Further, as discussed in chapter 5, the increase in the maximum loan value in London does not appear to have led to an increase in housing supply in London, limiting the opportunities for increasing home ownership in the capital.
In addition to these factors, the change to the maximum equity loan value in London happened at a point that the housing market in London and the South East was starting to slow down. For example, as shown in Figure 4.11, the overall number of residential property sales in London was around 25% lower in 2016/2017 than in 2015/2016. At the same time, the number of residential property sales declined by 16% in the South East and 14% in the East of England.
Figure 4.11: Total number of residential property sales, April 2010 to March 2021
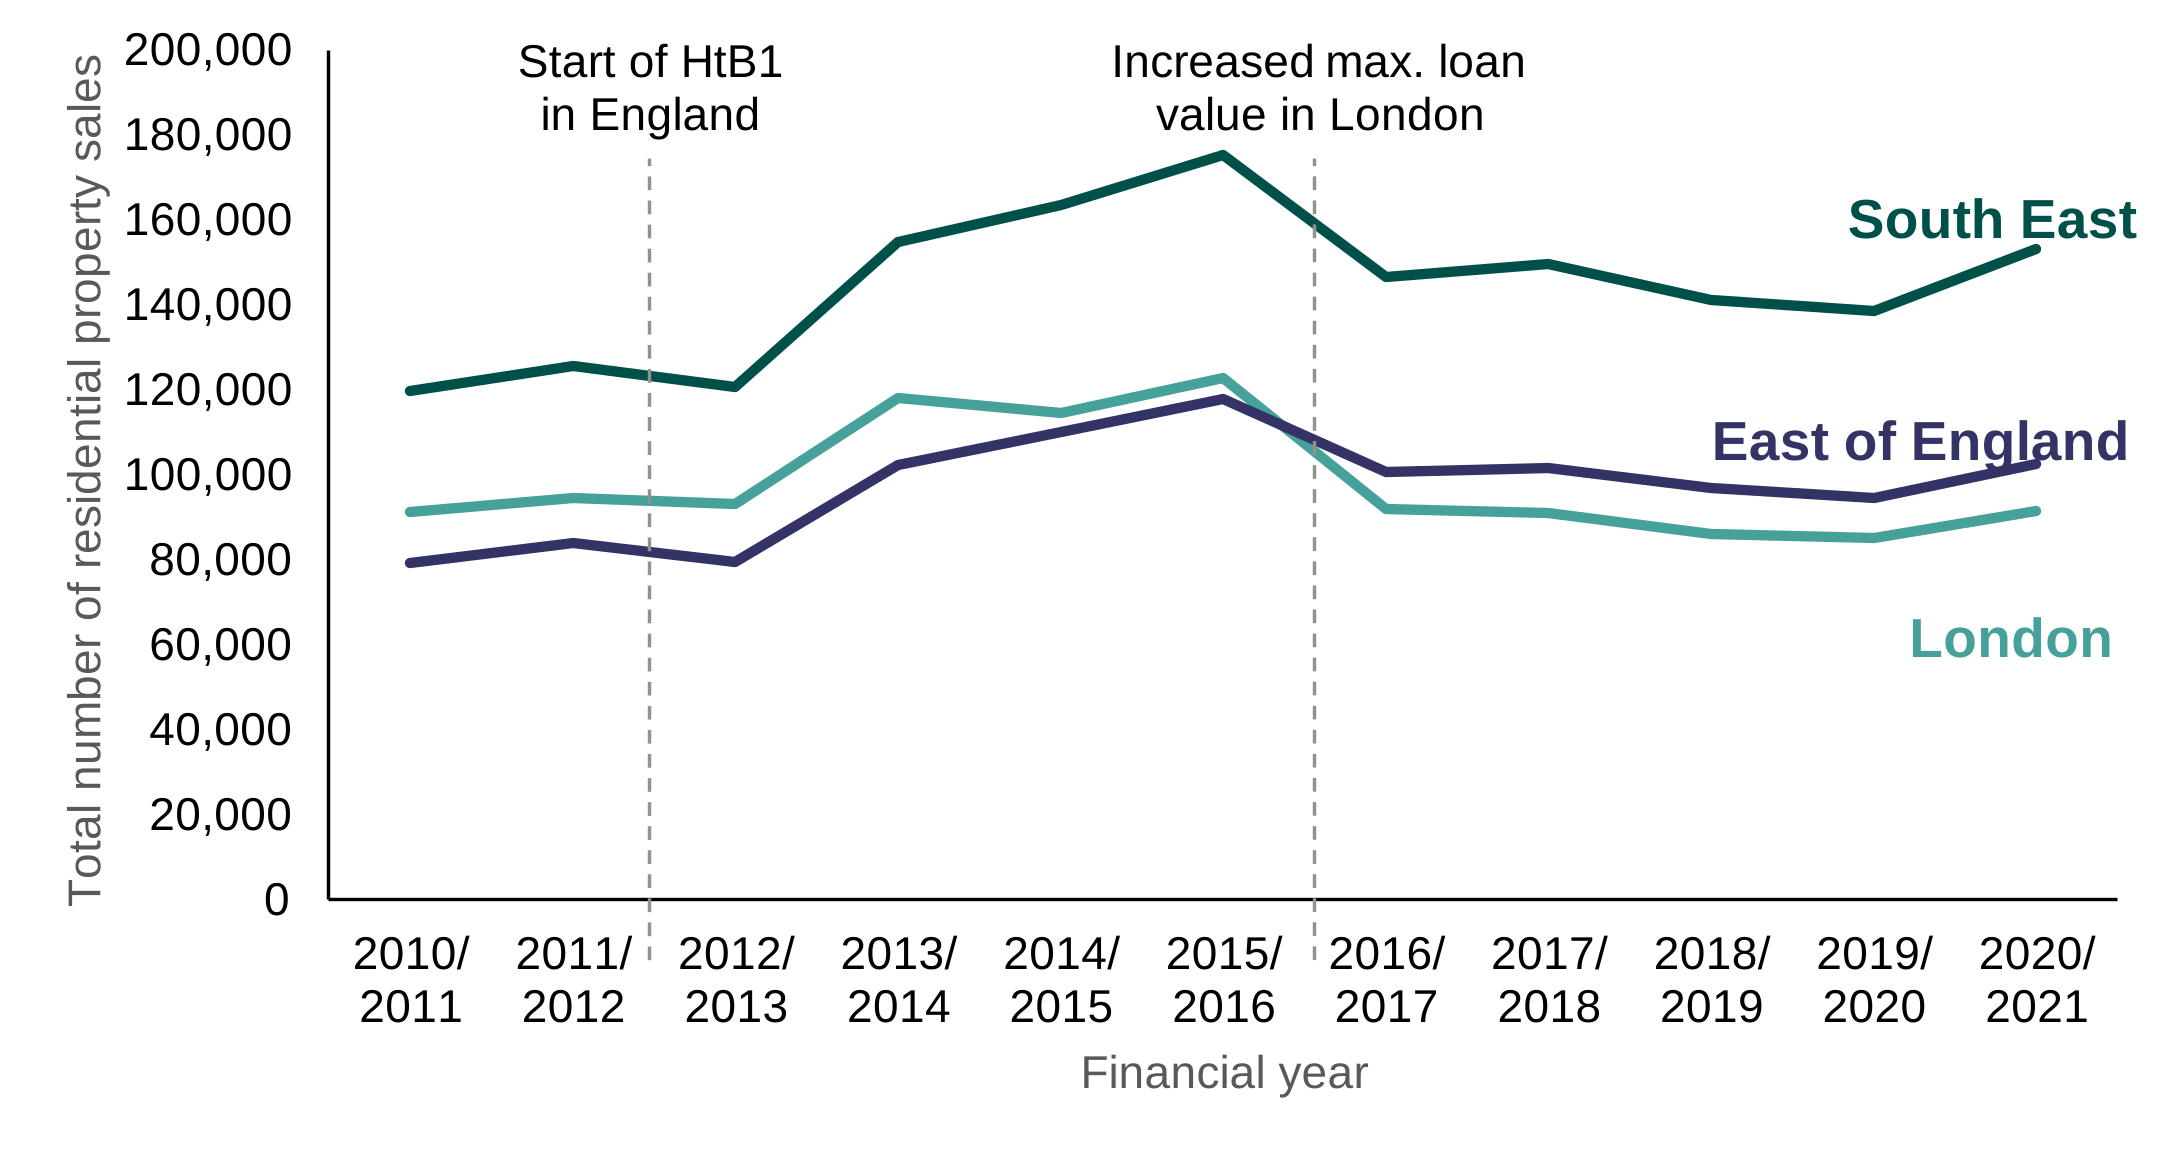
Source: ONS Number of residential property sales for administrative geographies
Alternative text
Line chart showing the number of residential property sales in London, South East and East of England from 2010/11 to 2020/21. All the areas follow a similar trend with a peak in in 2015/16 and downward from then on, picking up slightly in 2020/21. London starts and ends around 90,000 . East of England starts around 80,000 and ends around 100,000. The South East starts around 120,000 and ends around 150,000
There are numerous factors that likely influenced this slowdown including: additional Stamp Duty for second homes (introduced in April 2016), the reduction of buy to let mortgage interest relief (from 2017) and uncertainty about the housing market following the Brexit referendum in 2016. The Grenfell Tower fire in 2017 (and regulatory changes that followed) is also likely to have affected the pace of the housing market at this time. On the demand side, prospective FTBs are likely to have been less willing to buy flats in high rise blocks. Additionally, some current owners were unable to sell their home because of remediation costs or regulatory requirements, effectively reducing the available supply for prospective FTBs.
While the quasi-experimental impact analysis focused on the London border is intended to compare housing markets facing similar conditions, it is still possible that the factors leading to a slowdown in the housing market had a stronger effect on the London side of the border than just outside London. For example, flats make up a higher proportion of homes in London, even in areas very close to the border. As such, the housing market in London may have been more affected by some of these factors outside of the Help to Buy scheme itself.
4.5 The introduction of Help to Buy 2
Help to Buy 2 started in April 2021, introducing regional price caps in England. These price caps meant that fewer properties would be eligible for the Help to Buy scheme in all English regions outside of London. Following this change, the number of Help to Buy customers fell in all regions except for London (see Figure 4.7, above). In this section, the study considers the effects of this change to the Help to Buy scheme on home ownership in England.
4.5.1 Difference-in-discontinuities: evidence from regional borders
For some borders, the difference in price caps was large. For example, the price cap was £600,000 in London but £407,400 in the East of England. At other borders, the difference in price caps was very small. For example, the price cap was £228,100 for Yorkshire and the Humber and £224,400 for the North West. Therefore, by comparing the trends in the number of FTB mortgage sales across English regional borders the analysis could assess the impact of varying price caps on home ownership.
Figure 4.12 and Figure 4.13 show the estimated effects for wards within 5km and 10km of each of these borders respectively. Although there are some differences – for example, the number of FTB mortgage sales increased slightly more in London than in the South East and East of England combined following the introduction of the regional price caps – the differences are fairly small. This suggests that the differences in price caps did not have a substantial adverse effect on home ownership, even though the number of Help to Buy loans did decrease.
In this way, home ownership appears to have been less responsive to the Help to Buy scheme by the time Help to Buy 2 was introduced in 2021 than when Help to Buy 1 was introduced in 2013. This may in part reflect changes in market conditions. For example, by Help to Buy 2, rising interest rates may have meant that monthly affordability of mortgage payments was a bigger constraint for many potential FTBs than the reduced Help to Buy price caps. Additionally, the introduction of Help to Buy 1 may have played a role in stimulating the market following the financial crisis. By 2021, high LTV mortgages were more readily available than when Help to Buy 1 was introduced in 2013. As a result, the Help to Buy scheme may have been less needed by FTBs by this time.
Figure 4.12: Estimated impact of the introduction of regional price caps on the annual number of first-time buyer mortgage sales for wards within 5km of each border, April 2021 to March 2023
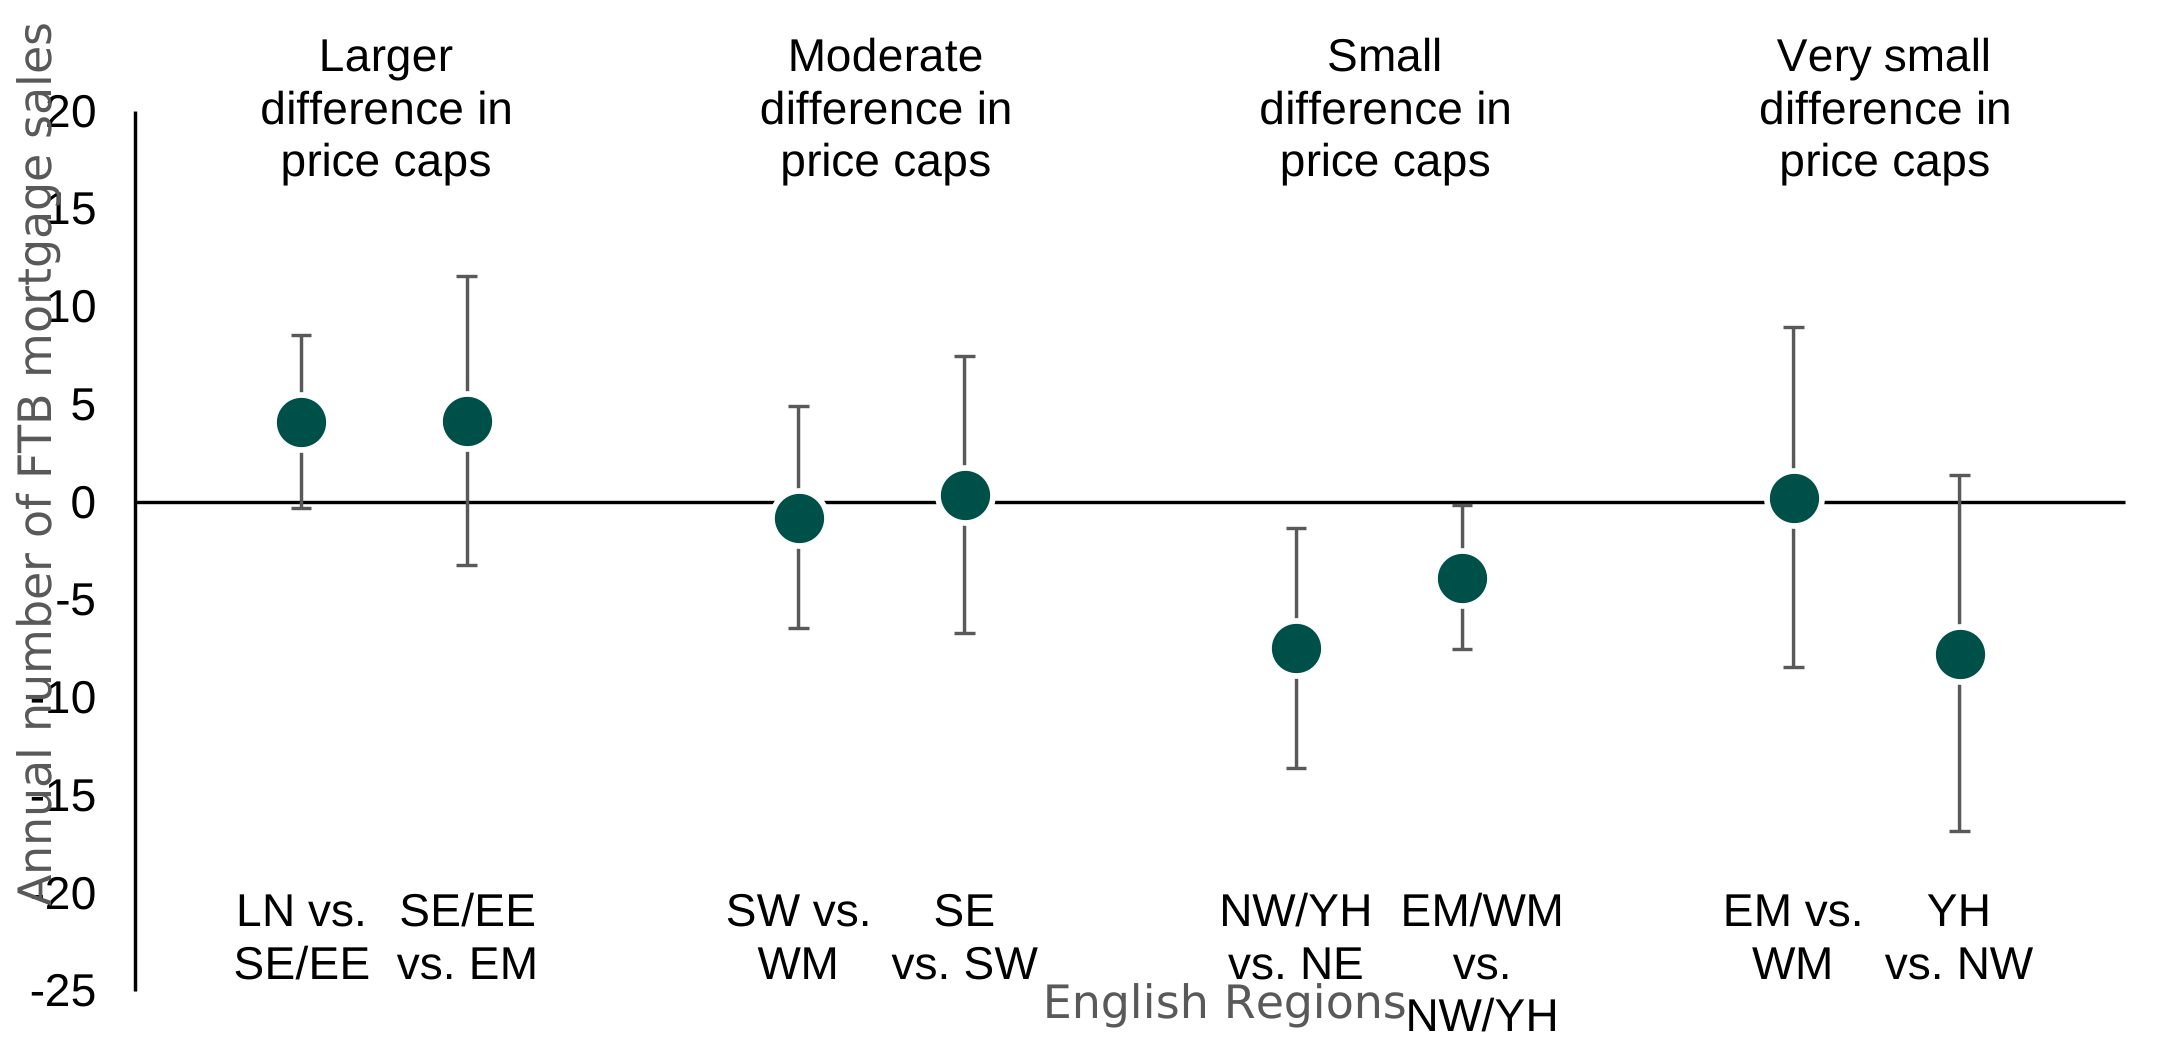
LN = London; SW = South West; SE = South East; EE = East of England; WM = West Midlands; EM = East Midlands; YH = Yorkshire and The Humber; NW = North West; NE = North East
The SE vs EE comparison is not included in this figure because of small sample sizes in available data.
Source: UK Finance Regulated Mortgage Survey
Alternative text
Dot chart with error bars comparing estimated effects across areas grouped by differences in price caps, including larger, moderate, small, and very small differences. Each group shows 2 comparisons between regions, plotted against a vertical scale from about -25 to 20, with a horizontal line at zero indicating no effect.
For areas with larger differences in price caps, both estimates are positive at around 4 to 5, with error bars extending above and below zero. For moderate differences, estimates are close to zero, with one slightly negative and one slightly positive, and error bars spanning both sides of zero.
For small differences, both estimates are negative, at approximately -7 and -4, with error bars mostly below zero. For very small differences, one estimate is close to zero while the other is more negative at around -8, with wide error bars indicating substantial uncertainty.
Overall, the chart suggests that larger differences in price caps are associated with more positive estimated effects, while smaller differences are associated with negative or negligible effects, although uncertainty is high in many cases.
Figure 4.13: Estimated impact of the introduction of regional price caps on the annual number of first-time buyer mortgage sales for wards within 10 km of each border, April 2021 to March 2023
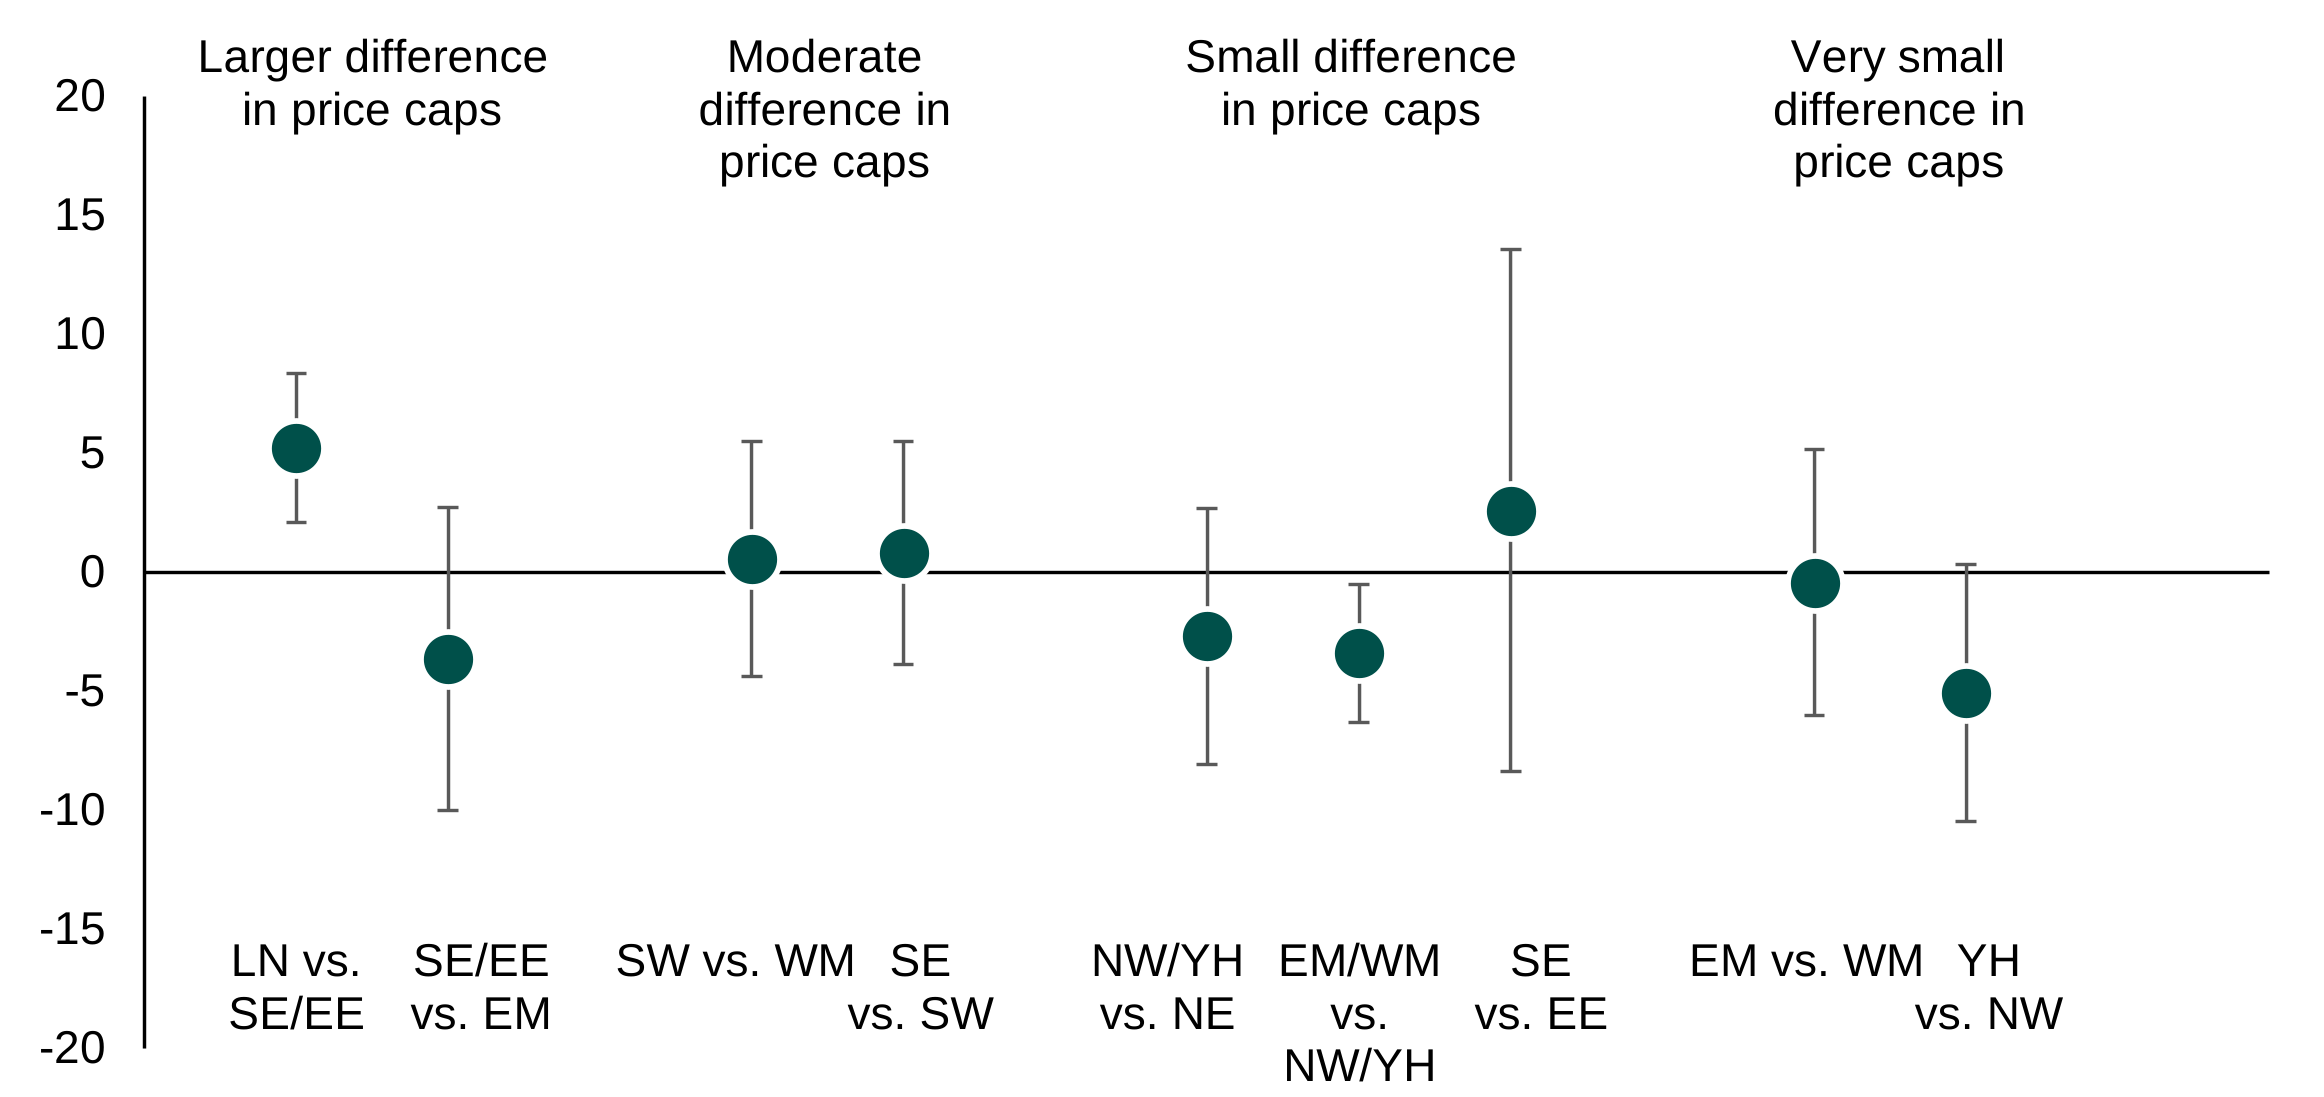
LN = London; SW = South West; SE = South East; EE = East of England; WM = West Midlands; EM = East Midlands; YH = Yorkshire and The Humber; NW = North West; NE = North East
Source: UK Finance Regulated Mortgage Survey
Alternative text
Dot chart with error bars showing estimated effects across regional comparisons grouped by size of difference in price caps: larger, moderate, small, and very small differences. Values range from about -20 to 20, with a horizontal line at zero indicating no effect.
For larger differences in price caps, one comparison shows a positive estimate of around 5, while the other is negative at about -4, with wide error bars for both. For moderate differences, both estimates are close to zero, slightly positive at around 0 to 1, with error bars spanning negative and positive values.
For small differences, estimates are mixed, with 2 negative values at roughly -3 and one positive estimate near 3, all with wide error bars indicating substantial uncertainty. For very small differences, both estimates are negative or near zero, at approximately 0 and -5, again with wide error bars.
Overall, estimates vary in sign and magnitude across groups, and most error bars cross or approach zero, suggesting high uncertainty and no clear, consistent effect across comparisons.
4.5.2 Lender and developer perspectives
These findings chime with lenders’ and developers’ perception of customers’ demand for homes and mortgages, and what drove this, throughout the scheme. They described experiencing lower demand during the Help to Buy 2 scheme generally than during the Help to Buy 1 scheme, which the Homes England Help to Buy scheme data confirms. However, this was also after COVID-19 and running into an era of higher interest rates following the Growth Plan 2022 (‘mini budget’).
Developers suggested that the regional price caps played a role in customer demand and home ownership. Following the introduction of the Help to Buy 2 scheme, Verian’s own analysis of Land Registry Price Paid data found there were areas where most new build homes were priced above the local price cap. In addition, some developers believed that the price caps were set at levels that limited their options for building homes they could market and sell in some areas within regions. For example, one developer described Peterborough and Essex as different sorts of housing market, but both having the East of England price cap of £407,400. Developers reported that the regional price caps ruled out those who needed larger homes from using the scheme, in turn reducing the level of demand they saw for new homes.
“Help to Buy 2 just didn’t have the same impact for us. It felt like Help to Buy had fallen away full stop.” - Medium small developer, built between 50 and 999 properties through the Help to Buy scheme
4.6 The end of Help to Buy in England
The Help to Buy scheme in England was closed in March 2023. However, the equivalent scheme in Wales continued to operate. By comparing trends beyond this timeframe the study can assess the extent to which the end of the Help to Buy scheme in England affected home ownership. The analysis first focuses on areas close to the England/Wales border and then extends to England and Wales as a whole.
4.6.1 Difference-in-discontinuities: evidence from the England/Wales border
As previously shown in Figure 4.1, the number of FTB mortgage sales recorded in the RMS for areas within 10 km of the England/Wales border was falling after the closure of the scheme in England on both sides of the border. However, as shown in Table 4.6 below, the number of FTB mortgage sales fell slightly faster on the English side of the border than the Welsh side following the end of the Help to Buy scheme in England. There were around 4 fewer FTB mortgage sales in these English wards than if they had followed the same trend as the Welsh wards. This is equivalent to the number of FTB mortgage sales being about 15% lower in these English wards than if the trend had been the same as the Welsh wards.
This could indicate that the closure of the scheme in England led to a reduction in home ownership. However, as shown in Figure 4.14, the finding is sensitive to the distance threshold used. If the analysis is restricted to wards within 5 km or 7.5 km of the border, the estimated effect is smaller and is not statistically significant at the 95% level.
Table 4.6: Estimated impact of the end of Help to Buy on the annual number of first-time buyer mortgage sales, April 2023 to December 2024
| English wards within 10km of the England/Wales border | |
|---|---|
| Average number of FTB mortgage sales a year (April 2023-December 2024) | 18.6 |
| Average number of FTB mortgage sales if the trend had been the same as on the Welsh side of the border | 22.0 |
| Estimated average annual impact of the end of the Help to Buy scheme in England | -3.5 FTB mortgage sales per ward |
| 95% confidence interval | -6.2 to -0.7 |
| p-value | 0.013* |
*statistically significant at the 95% level
Figure 4.14: Estimated impact of the end of Help to Buy on the annual number of first-time buyer mortgage sales per English ward, April 2023 to December 2024
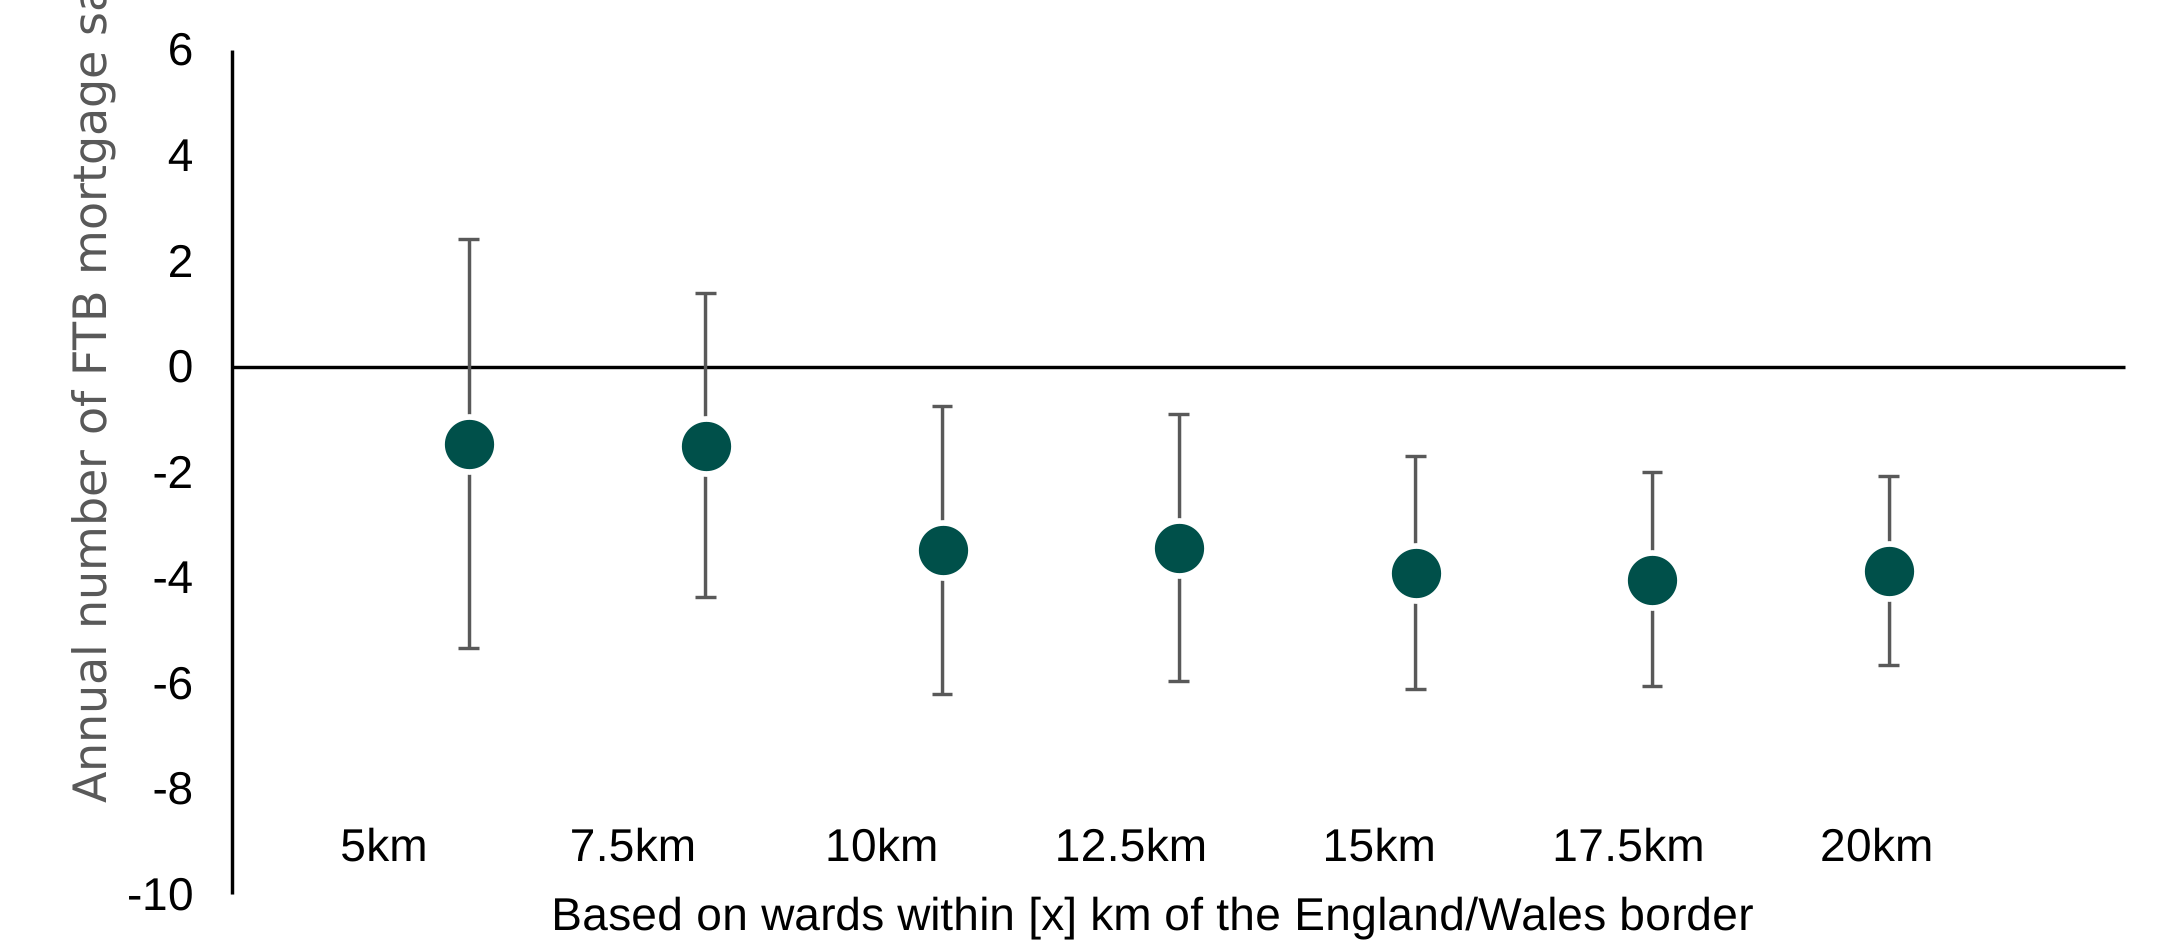
Source: UK Finance Regulated Mortgage Survey
Alternative text
Dot chart with error bars showing estimated effects for areas at increasing distances from the England–Wales border, from 5 km to 20 km. The vertical axis ranges approximately from -10 to 6, with a horizontal line at zero indicating no effect.
All central estimates are negative, indicating a reduction across all distances. The estimate is around -1 at 5 km, slightly more negative at about -1.5 at 7.5 km, and drops further to around -4 at 10 km and 12.5 km. From 15 km to 20 km, estimates remain consistently negative at roughly -4 to -4.5.
Error bars are wide at shorter distances, particularly at 5 km, where they extend above zero, but narrow slightly at greater distances. Most error bars at longer distances lie below or close to zero, suggesting more consistently negative effects further from the border.
4.6.2 Difference-in-differences: national trends
Looking at national trends, the number of FTB mortgage sales fell faster on average in England than in Wales following the end of the scheme in England. As shown in Table 4.7, English LAs had around 80 fewer FTB mortgage sales recorded than if they had followed the same trend as Welsh LAs. This difference is equivalent to the number of FTB mortgage sales in England being about 10% lower than if they had followed the same trajectory as Wales.
Table 4.7: Difference in trends of first-time buyer mortgage sales between LAs in England and LAs in Wales, 2023 to 2024
| LAs in England | |
|---|---|
| Average number of FTB mortgage sales (2023-2024) | 857.6 |
| Average number of FTB mortgage sales if the trend in England had been the same as in Wales | 941.3 |
| Estimated difference in trends following the end of Help to Buy 2 in England | -83.8 FTB mortgage sales per LA |
| 95% confidence interval | -127.5 to -40.0 |
| p-value | <0.001* |
*statistically significant at the 95% level
These quantitative estimates align with developers’ views, that demand for new build properties had reduced since the Help to Buy scheme ended. The developers whose business was more reliant on the scheme talked about experiencing a sudden drop in inquiries and sales. Smaller developers, which tended to build and sell fewer properties through the scheme, experienced less of a drop in demand. Developers also noted that other factors may have contributed to a drop in demand for new homes in 2023: COVID-19, inflationary pressure on building costs, rising interest rates and the onset of a natural dip in the housebuilding market cycle.
“It [Help to Buy] was removed at the worst possible time, as interest rates spiked and lenders sort of stopped lending.” - National developer, built over 10,000 properties through the Help to Buy scheme
In combination with the findings at the England/Wales border, it is likely that the end of the Help to Buy scheme led to a reduction in the number of FTBs in England although the evidence is not fully conclusive. This implies that the scheme was continuing to contribute to home ownership during Help to Buy 2. However, the scale of this effect was likely smaller than the effect on home ownership of the introduction of the Help to Buy scheme in 2013.
The difference in the scale of these effects at the beginning and end of the Help to Buy scheme is likely to reflect the different housing markets and housing contexts at these 2 points in time. When the Help to Buy scheme was introduced in 2013, the number of FTB mortgage sales was at a low point following the financial crisis in 2008 and only just starting to recover. At this time, interest rates were low and mortgages requiring only 5% deposits were rare. In this context, the evidence suggests the introduction of the Help to Buy scheme led to a sizeable increase in home ownership in certain areas, such as those close to the England/Wales border. However, these effects varied between areas, with little evidence of an effect on home ownership in areas that were already less affordable.
In contrast, by the end of the Help to Buy scheme, interest rates were higher, mortgages requiring only 5% deposits were more common and the wider economic context was different. While there is some evidence of a negative effect of the closure of the scheme on home ownership in England, it is less strong than the evidence for a positive effect at the start of the scheme and the size of the effect is likely to be smaller.
4.7 How homeowners used the scheme
This section draws on evidence from secondary analysis of the Homes England customer database, alongside the customer survey and qualitative interviews with customers, lenders and developers. It discusses how far the Help to Buy scheme was used by those who needed it to access home ownership and how far it was used by customers who could have bought a property without the Help to Buy scheme.
4.7.1 Additional homeowners
Verian used the Homes England Customer database to estimate whether customers could have purchased an average FTB home in their local authority without the scheme. This calculation was based on a simple rule of thumb that people may be able to borrow up to 4.5 times their yearly household income. In practice, of course, some households may have needed a larger-than-FTB-average home due to family size.
These mortgage affordability calculations found that most customers on both iterations of the scheme could have bought a local average FTB home without the scheme. Nearly 4 in 5 (78%) Help to Buy 1 scheme customers were able to afford a local average FTB home without the scheme and 3 in 5 (62%) Help to Buy 2 scheme customers nationally were able to afford a local average FTB home without the scheme. This implies 22% of Help to Buy 1 scheme customers and 38% of Help to Buy 2 scheme customers could not have afforded to buy a local average FTB home without the scheme – and could be described as “additional” homeowners, because of the scheme.
The evaluation has also drawn on self-reported evidence from the customer survey to understand the proportion of customers who could not have bought without the Help to Buy scheme and can be described as ‘additional’ homeowners. This approach replicates the 2017 evaluation (Whitehead and others, 2018).
Additional customers include those who responded to the survey and disagreed on all counts that they could have bought the property they wanted, the same property, a similar property or a smaller property or entered the property market without the Help to Buy scheme loan. Figure 4.15 shows how customers were classified as “additional” or “non-additional” based on their survey responses.
Figure 4.15: Additionality calculation
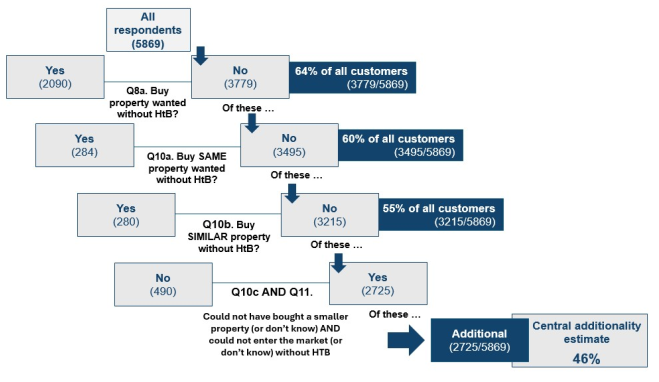
Source: Customer survey data. Base: All respondents (5869)
Alternative text
Additionality calculation: Image works through how additionality was calculated using unweighted data.
All respondents (n = 5869)
Those who disagree or strongly disagree that they would have been able to buy a property they wanted without assistance (Q8a: n = 3779 (64% of all respondents))
Among these, those who probably or definitely could not have bought the same property without the assistance of HtB (Q10a: n = 3495 (60% of all respondents))
Among these, those who probably or definitely could not have bought a similar property that was NOT new build without HtB (Q10b: n = 3215 (55% of all respondents))
Among these, those who probably or definitely could not have bought a smaller property or one in need of more work (Q10c) AND agreed HtB helped them enter the property market (or held a neutral opinion on this subject) (Q11) (n=2725, 46% of all respondents).
Overall, 46% of customers were additional by this measure. The remaining 54% of customers were not additional, suggesting they could have bought without the Help to Buy scheme. It is possible that the Help to Buy scheme may have channelled more of this demand into new build properties than otherwise. If so, this may have boosted supply of homes, by giving developers an incentive to develop and increase supply.
The additionality calculations drawing on customer survey data show that there were higher proportions of additional customers among the Help to Buy 2 scheme customers (50% compared to 46% in Help to Buy 1) and FTBs (48% compared to 36% of previous property owners).
These self-reported measures of additionality differ to the mortgage affordability calculation results substantially. For Help to Buy 1 customers, the difference in additionality estimates is 24 percentage points (46% self-reported vs 22% based on mortgage affordability calculations). Among Help to Buy 2 customers, the difference in additionality estimates is 12 percentage points (50% self-reported vs 38% based on mortgage affordability calculations).
The mortgage affordability calculation represents an approximate lower bound on the proportion of customers who needed the Help to Buy scheme to afford to buy a home. This is because the average local FTB home would not have been suitable for some households (for example, families with children needing a bigger home) and because the calculation does not account for other financial commitments the household might have. On the other hand, the survey used self-reported findings but was not taken at the point they were buying a property, so customers may not always have been able to accurately judge whether they could have bought without the Help to Buy scheme. The true figure may well lie between these 2 points.
4.7.2 “Skipping a rung” on the property ladder
During the Help to Buy 1 scheme, the scheme’s open eligibility criteria meant that both FTBs and existing homeowners used the scheme. Homes England data shows a large majority of Help to Buy 1 scheme customers were FTBs (82%) but alongside those who needed the scheme to access home ownership at all, there were some previous homeowners who used the scheme to purchase a home.
Lenders and developers thought that both FTBs and previous owners used the Help to Buy scheme to buy larger properties than buyers at the same life stages would have previously. They described this as “skipping a rung” on the property ladder. Aligned with this, survey findings suggest that customers used the Help to Buy scheme to buy a bigger or higher quality property than they could afford alone: 2 thirds (66%) agreed that they could have purchased a smaller property or one in need of work without the scheme. Customers’ ability to buy a smaller property without the scheme is only one of the criteria for being a “non additional” customer, as described above.
“It doesn’t help people to buy a house that wouldn’t have been able to buy one already. What it helps them to do is buy a house that is more expensive.” - Building society, non-big six lender
4.7.3 Groups and regions with higher levels of additional home ownership
3 in 10 (31%) of Help to Buy 1 scheme customers and just over 1 in 5 (23%) Help to Buy 2 scheme customers could have afforded to buy a local average FTB home in London compared to 78% and 62% respectively nationwide. This aligns with the wider picture regionally. As demonstrated in Table 4.8, the majority of customers were self-reported as additional in London, the South West and South East (58%, 52%, 50% respectively).
Table 4.8: Profile of additional Help to Buy Equity scheme customers by region
| Region | % of customers in region that are additional |
|---|---|
| England (all regions) | 46% |
| Regions excluding London | 45% |
| North East | 35% |
| North West | 37% |
| Yorkshire & the Humber | 41% |
| East Midlands | 42% |
| West Midlands | 41% |
| East of England | 47% |
| London | 58% |
| South East | 50% |
| South West | 52% |
Source: Additionality calculation based on Q8a, Q8b, Q10a, Q10b and Q11. ‘Prefer not to say’ answers excluded. Unweighted base: All respondents included in calculation (5820)
This is also in line with the qualitative interview evidence from developers, lenders and customers. For some FTBs and customers in London who were interviewed, the equity loan allowed them to get on the property ladder and made the property affordable for them. In addition, lone buyers described in interviews how they could not afford to buy at all without the Help to Buy scheme, having only one income to draw on and limited savings or options of other sources for a deposit. Developers and lenders also said that divorced and lone buyers valued the scheme as it helped them to buy on one income.
“Most people don’t have the ability to save that up themselves and live… the Help to Buy scheme being open to everybody made it much easier for people to buy their own home.” - National developer, built 5,000 to 9,999 properties through Help to Buy scheme
4.8 Impact on mortgage financing
The success of the scheme was dependent on banks and building societies having enough confidence to lend mortgages to scheme buyers and offering mortgage types, terms and conditions that buyers needed.
Banks, building societies and lenders who were interviewed for the evaluation described witnessing an increase in demand for new build lending with the introduction of the Help to Buy scheme. As a result, some lenders in the sample, building societies in particular, gained confidence and offered Help to Buy scheme customers a higher loan to value (LTV) than before, now that the equity loan was available as a safety net. While 95% LTV mortgages were rare in practice before 2013, other banks, building societies and brokers reported that they were already confident lending at 95% LTV before the scheme but thought the scheme was still helpful in spreading risk across their portfolios. For example, one lender said the scheme meant effectively lending to Help to Buy scheme buyers at 75% LTV, meaning they could offer 95% LTV to other customers at less risk to their business.
“It initially underpinned the going back into high LTV lending market, but the reality is we are and have consistently been happy with the economics of lending at 95% … we are happy taking that risk ourselves.” - Bank, big six lender
Lenders agreed that mortgage lending had increased in the Help to Buy scheme period but had mixed views on whether this was down to the scheme. Some lenders – and brokers especially – felt that the Help to Buy scheme contributed to lending at higher volumes. Other banks and building societies may have lent more through Help to Buy but felt that other factors such as favourable interest rates, industry regulation and company policy and ethos had a greater influence on lending volumes in the long term.
Lenders thought the Help to Buy scheme had limited impact on their terms and types of mortgages. While 2 of the lender sample discussed having products and pricing ranges tailored to the Help to Buy scheme’s customer, the other banks and building societies would direct Help to Buy scheme customers to products available to all borrowers. Lenders’ accounts of their experience did not include description of withdrawing types of products or changing terms and conditions because of the Help to Buy scheme ending.
Those lenders that were more heavily involved in the Help to Buy scheme felt an impact from its closure, but others could not disentangle the effects of the scheme end from significant economic events of 2021 to 2023 such as COVID-19 and the Growth Plan 2022 (‘mini budget’). One broker said the scheme ending coincided with economic changes that were unfavourable for mortgage lending.
“We all knew it was coming, but it came at the wrong time. When interest rates had flatlined for 10 years and then went up on the chart, is the same year we lost Help to Buy as well.” - Mortgage broker
4.9 Conclusion
The evidence from the quantitative impact evaluation suggests that the effects of the scheme on home ownership varied between different types of area and over time.
With the introduction of the Help to Buy scheme in England in 2013, the evaluation finds evidence of an effect on the number of FTB mortgage sales in areas close to the England/Wales border, but this does not appear to fully generalise to England as a whole. More specifically, the analysis finds that the number of FTB mortgage sales increased most in the areas which were already most affordable before the Help to Buy scheme, and did not increase on average in the areas that were least affordable. This suggests that the Help to Buy scheme did not resolve affordability barriers in the most expensive places. In chapter 7, it will be discussed how the scheme may have contributed to increasing prices in these areas so that buying a home remained out of reach for many prospective FTBs.
The evidence about the nature of home ownership shows that the Help to Buy 1 scheme was used by all sorts of buyers, which was in line with the intention for the scheme at the time. When the Help to Buy 2 scheme’s criteria introduced a focus on FTBs, the scheme began to support a slightly greater proportion of customers who would not have bought without the scheme. However, even then a substantial proportion of Help to Buy 2 scheme customers would have been able to buy without the scheme.
5. Housing supply
This chapter reports findings about the impact of the Help to Buy scheme on housing supply. It covers findings on:
- how far the scheme supported new housing supply
- the impact of the scheme closure on housing supply
5.1 Summary of key findings
The impact analysis suggests that the introduction of the Help to Buy scheme supported increases in new housing supply in England. Specifically, the econometric analysis estimates that around 15% of all new builds in England built over the course of Help to Buy 1 and Help to Buy 2 (2013 to 2023) were attributable to the Help to Buy scheme.
This conclusion is based on 4 key strands of evidence. First, as with home ownership (see chapter 4), the analysis finds evidence for a strong effect on housing supply in areas close to the England/Wales border. The number of new dwellings recorded in the Energy Performance Certificates database increased faster on the English side of the border than the Welsh side. These are the areas with the most comparable local housing conditions, providing the strongest evidence about local effects of the Help to Buy scheme in England. This analysis suggests that around 27% of new dwellings recorded in these wards over the course of Help to Buy 1 could be due to the support made available through the Help to Buy scheme. This analysis is described in section 5.3.1.
Second, it finds that new housing supply increased much faster across England as a whole than in Wales over the course of the Help to Buy scheme. The difference in trends is a similar scale to what the analysis finds at the England/Wales border, equivalent to 29% of new dwellings recorded in England during Help to Buy 1. Although this analysis requires stronger assumptions about the comparability of areas, it gives some indication of wider effects across other areas in England. This conclusion is supported by the analysis of local housing markets. On average, the increases in new housing supply in England were similar in more affordable and less affordable areas. These analyses are described in section 5.3.2 and section 5.3.4.
Third, it does not find evidence for a substantial change in new housing supply following the introduction of Help to Buy 2 in April 2021. This suggests that the gains in housing supply following Help to Buy 1 were largely maintained over the course of Help to Buy 2, and the introduction of regional price caps with Help to Buy 2 did not lead to a noticeable reduction in new dwellings. This analysis is described in section 5.5.
Fourth, it conducted additional analyses to explore how these results vary with different assumptions. In one analysis, the study used an alternative statistical model that effectively assumes less spillover in new housing supply. In another analysis, it considered a scenario where the effect on housing supply at the England/Wales border only applies in other similar areas in England, with the effect being smaller in areas that may face greater constraints on new homes. Both of these additional analyses come to similar results, with an effect on supply equivalent to around 15% of new dwellings recorded in England over the course of Help to Buy 1 and Help to Buy 2. These analyses are described in section 5.7.
Taking this evidence together, the study concludes that the Help to Buy scheme likely had a positive impact on home ownership in England, equivalent to around 15% of new dwellings recorded in England between April 2013 and March 2023. This could be through a larger effect at the England/Wales border but which is smaller in other areas, or through a smaller effect at the England/Wales border but which is more widespread across England.
The timing of these effects suggest the Help to Buy scheme had a positive impact on housing supply from the second year of the scheme (2014/15). However, housing supply does not appear to have been very responsive to later changes in the scheme, such as the introduction of regional price caps with Help to Buy 2. This could be because the introduction of the Help to Buy scheme helped the market start to recover following the financial crisis, leading to an increase in housing supply at this point. The evidence suggests that once new housing supply had recovered to similar levels as seen before the financial crisis, the Help to Buy scheme then had less of an ongoing effect on housing supply.
5.2 Data sources
To measure the impact of the Help to Buy scheme on housing supply, the study has used the Energy Performance Certificates (EPC) database for England and Wales, which are needed when selling (or letting) a home. Specifically, it counted the number of certificates with a transaction type of ‘new dwelling’ in each ward in England and Wales from April 2010 to June 2025. New dwellings recorded in the EPC database follow similar trends as the Net Additional Dwellings statistics, published by MHCLG to monitor trends in housing supply in England. Using the EPC database for this analysis allowed the study to include data in Wales and conduct analysis in smaller geographical areas.
The developers and lenders who took part in qualitative interviews also had views about how the scheme affected housing supply, and these are referenced throughout this section to help interpret the quantitative analyses.
5.3 The introduction of Help to Buy in England from April 2013
In this section, the study first investigates the impacts of the Help to Buy scheme on housing supply in areas close to the England/Wales border. These areas are likely to be reasonably comparable, as the local housing market conditions are likely to be similar either side of the border. The report presents the findings for the initial analysis (as per the pre-specified analysis plan), which uses a very similar method to Carozzi and others (2024). It also shows how the results vary under an alternative model that makes different assumptions.
It then considers how far this evidence can be generalised nationwide across England, and it discusses evidence for how far the effect on housing supply was seen in local housing markets depending on their local affordability.
Finally, it combines the results from different analyses to provide an overall assessment of the impact of the Help to Buy scheme on housing supply during both the Help to Buy 1 and Help to Buy 2 scheme.
5.3.1 Difference-in-discontinuities: evidence from the England/Wales border
This analysis compares trends in the number of new dwellings recorded in the EPC database for areas close to the England/Wales border (Figure 5.1). There was a substantial increase in the number recorded on the English side of the border in 2014/15, shortly after the start of the Help to Buy scheme in England. At the same time, there was relatively little change in wards on the Welsh side of the border.
Figure 5.1: Average number of new dwelling transactions in wards within 10km of the England/Wales border, April 2010 to March 2024
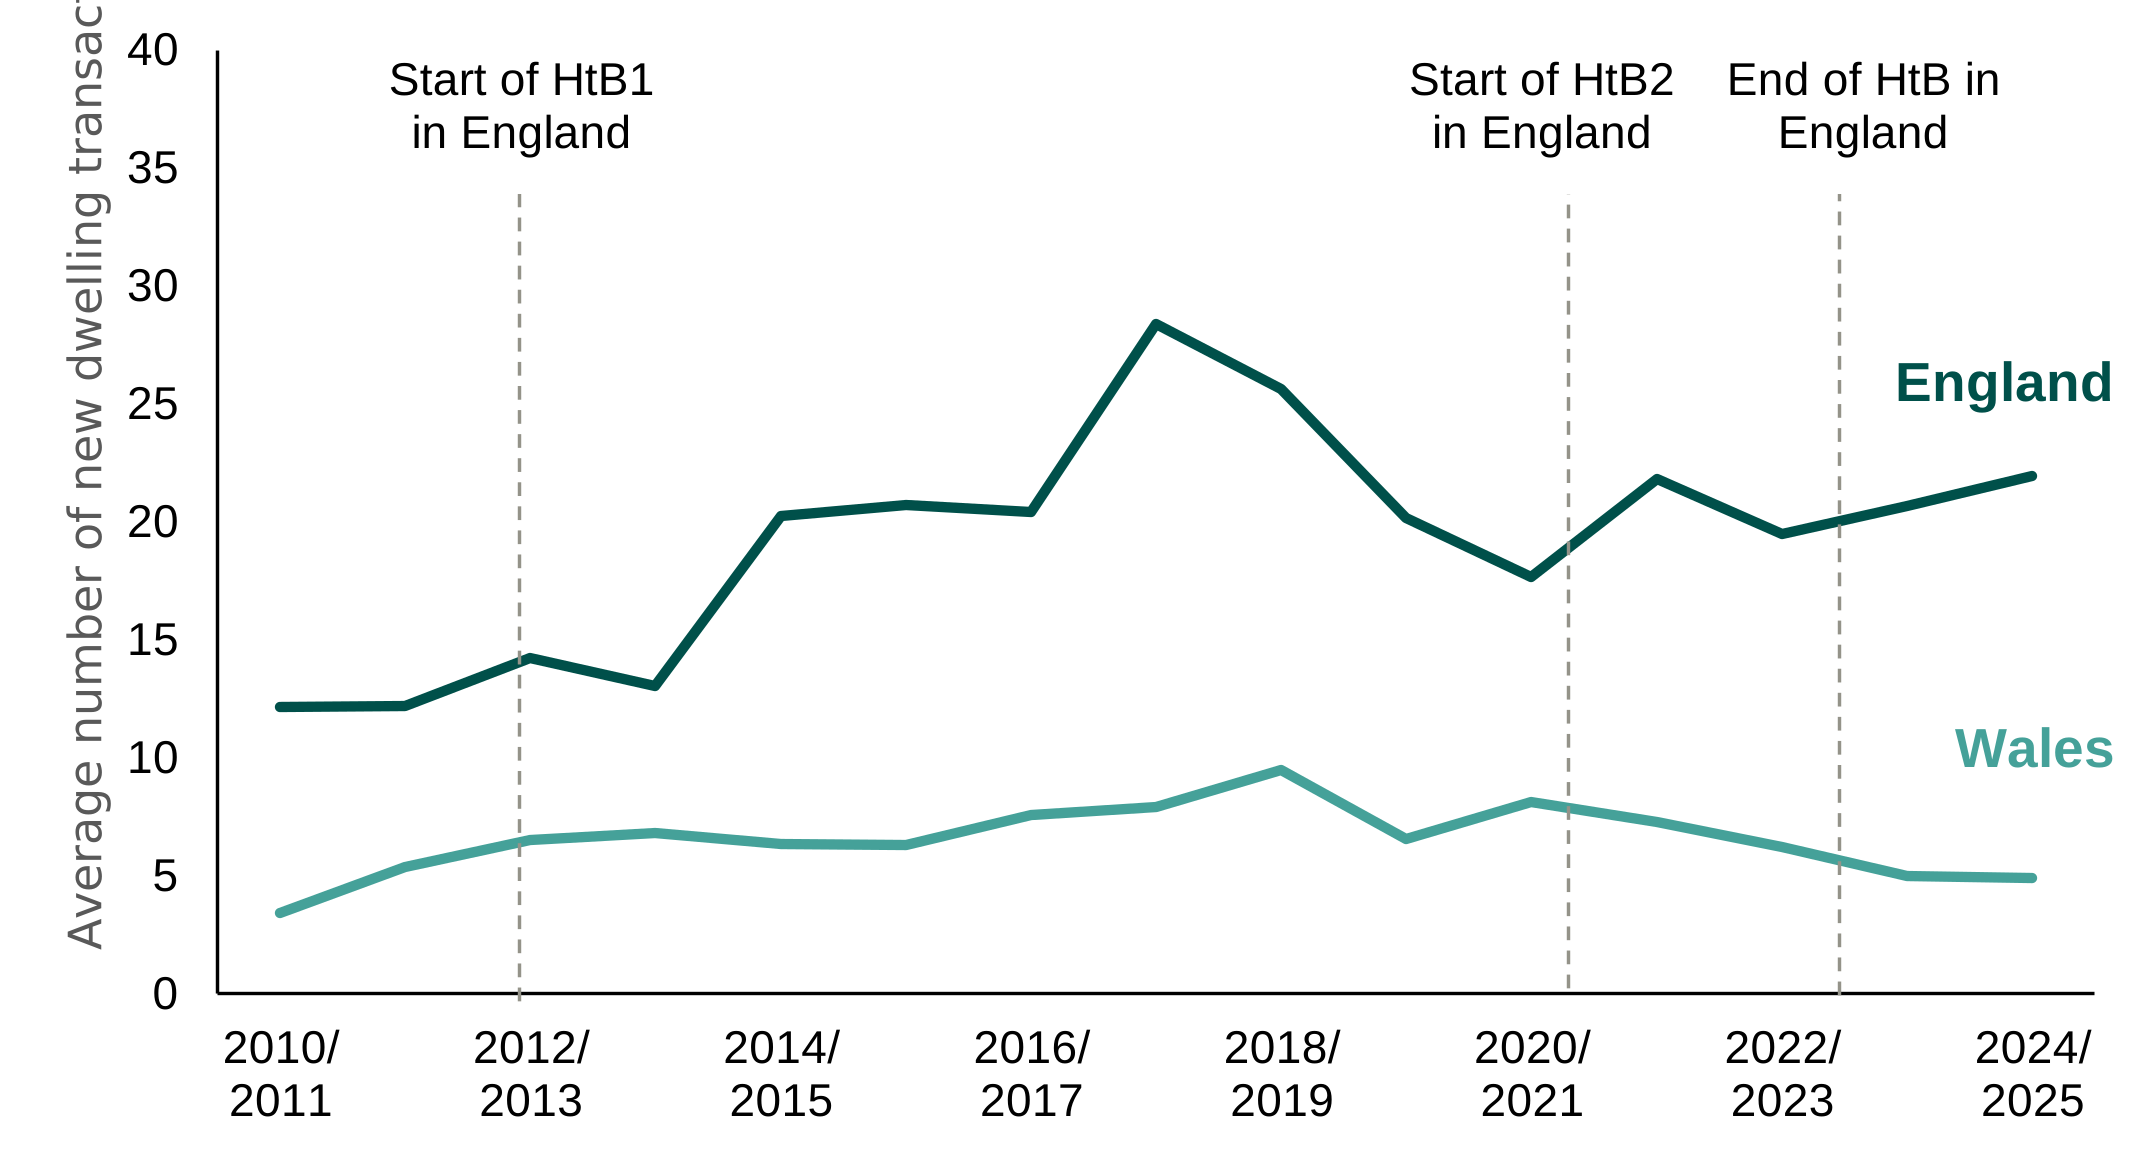
Source: Energy Performance Certificates database
Alternative text
Line chart showing the average number of new dwelling transactions in wards within 10 km of the England–Wales border from April 2010 to March 2024. The series begins in 2010 at a relatively low level, rises steadily through the early 2010s, and reaches a peak in the mid-to-late 2010s. There is some fluctuation around the late 2010s, followed by a noticeable dip around 2020 to 2021. After this, transactions recover briefly before declining again toward 2023 to 2024. Overall, the chart shows an upward trend from 2010 to the peak, followed by increased volatility and a recent decline.
Table 5.1 shows the results for the originally planned ‘difference-in-discontinuities’ analysis, described in chapter 3. This analysis suggests that the Help to Buy scheme led to an additional 5.6 new homes a year per ward on average in these wards on the English side of the border. In other words, the average number of new dwellings recorded for these wards was 5.6 higher than if these areas had continued to follow a similar trend to the wards on the Welsh side of the border.
Table 5.1: Estimated impact of the introduction of the Help to Buy scheme on the annual number of new dwellings recorded in English wards within 10km of the England/Wales border, April 2013 to March 2021
| English wards within 10km of the England/Wales border | |
|---|---|
| Average number of new dwellings a year (April 2013-March 2021) | 20.8 |
| Average number of new dwellings if the trend had been the same as wards on the Welsh side of the border | 15.1 |
| Estimated average impact of Help to Buy 1 | +5.6 new dwellings a year per ward |
| 95% confidence interval | +1.5 to +9.8 |
| p-value | 0.008* |
*statistically significant at the 95% level
There were, on average, around 21 new dwellings a year recorded in each of these English wards between April 2013 and March 2021. An impact of 5.6 additional new homes is therefore equivalent to more than a quarter (27%) of new dwellings recorded over the course of Help to Buy 1 being attributable to the support provided by the Help to Buy scheme.
This implies that the Help to Buy scheme supported approximately 3,400 additional homes in these wards in England between April 2013 and March 2021. That is higher than the number of Help to Buy scheme sales in these wards over the same timeframe (around 2,150 sales). This could indicate that the Help to Buy scheme had a wider effect, leading to more new homes being built beyond those bought through the scheme itself.
Such spillovers are possible if the Help to Buy scheme led to increased confidence among developers, as they reported in qualitative interviews. Developers described how high customer demand for the scheme increased their and other housebuilders’ confidence that there would be demand for future properties. Developers said that as their confidence increased, they increased their building activity, leading to more developments being completed or developments being larger. These developments would have included many homes that were not ultimately purchased through Help to Buy.
The study does not have data about the size of the development sites that Help to Buy scheme properties were part of. However, analysing records from the EPC database, the evaluation finds that for each home purchased through the Help to Buy scheme, there were on average 19 new dwellings recorded in the same postcode within the previous year, most of which were not bought through the scheme. This indicates that homes bought through the Help to Buy scheme were typically part of larger developments including many homes not bought through the Help to Buy scheme, demonstrating the potential for the scheme to have wider spillover effects on housing supply.
Figure 5.2 shows the estimated impacts from the difference-in-discontinuities analysis broken down by financial year. This graph compares the change in the number of new dwellings recorded either side of the border since 2012/13 (the year before the Help to Buy scheme started in England). Values above zero indicate that the number of new dwellings recorded increased faster on the English side of the border than on the Welsh side. Before the introduction of the Help to Buy scheme (to the left of the dotted line), the values are close to zero. This is what the evaluation partners expected to see before the Help to Buy scheme started and it indicates that the trends were similar either side of the border at this point.
As shown in Figure 5.2, there is evidence of an impact from the second year of the Help to Buy scheme (2014/15). The fact that it took a year for the effects of the Help to Buy scheme to become apparent likely reflects the time needed for developments to be completed. Even if the introduction of the Help to Buy scheme had an immediate effect on developers’ decisions, it would take time for new supply to become available. Consistent with an increase in supply from the second year, data from Homes England (in chapter 5) also shows more Help to Buy scheme loans in 2014/15 than in 2013/14.
While the effect appears to be much smaller in 2020/21, this is because of a large drop in the number of new dwellings recorded in England in one quarter of 2020. It is likely that this reflects short term disruption due to COVID-19 restrictions at the time, rather than a reduction in the effectiveness of the Help to Buy scheme.
Figure 5.2: Estimated impact of Help to Buy on annual number of new dwellings recorded per English ward, April 2013 to March 2021 (England/Wales border)
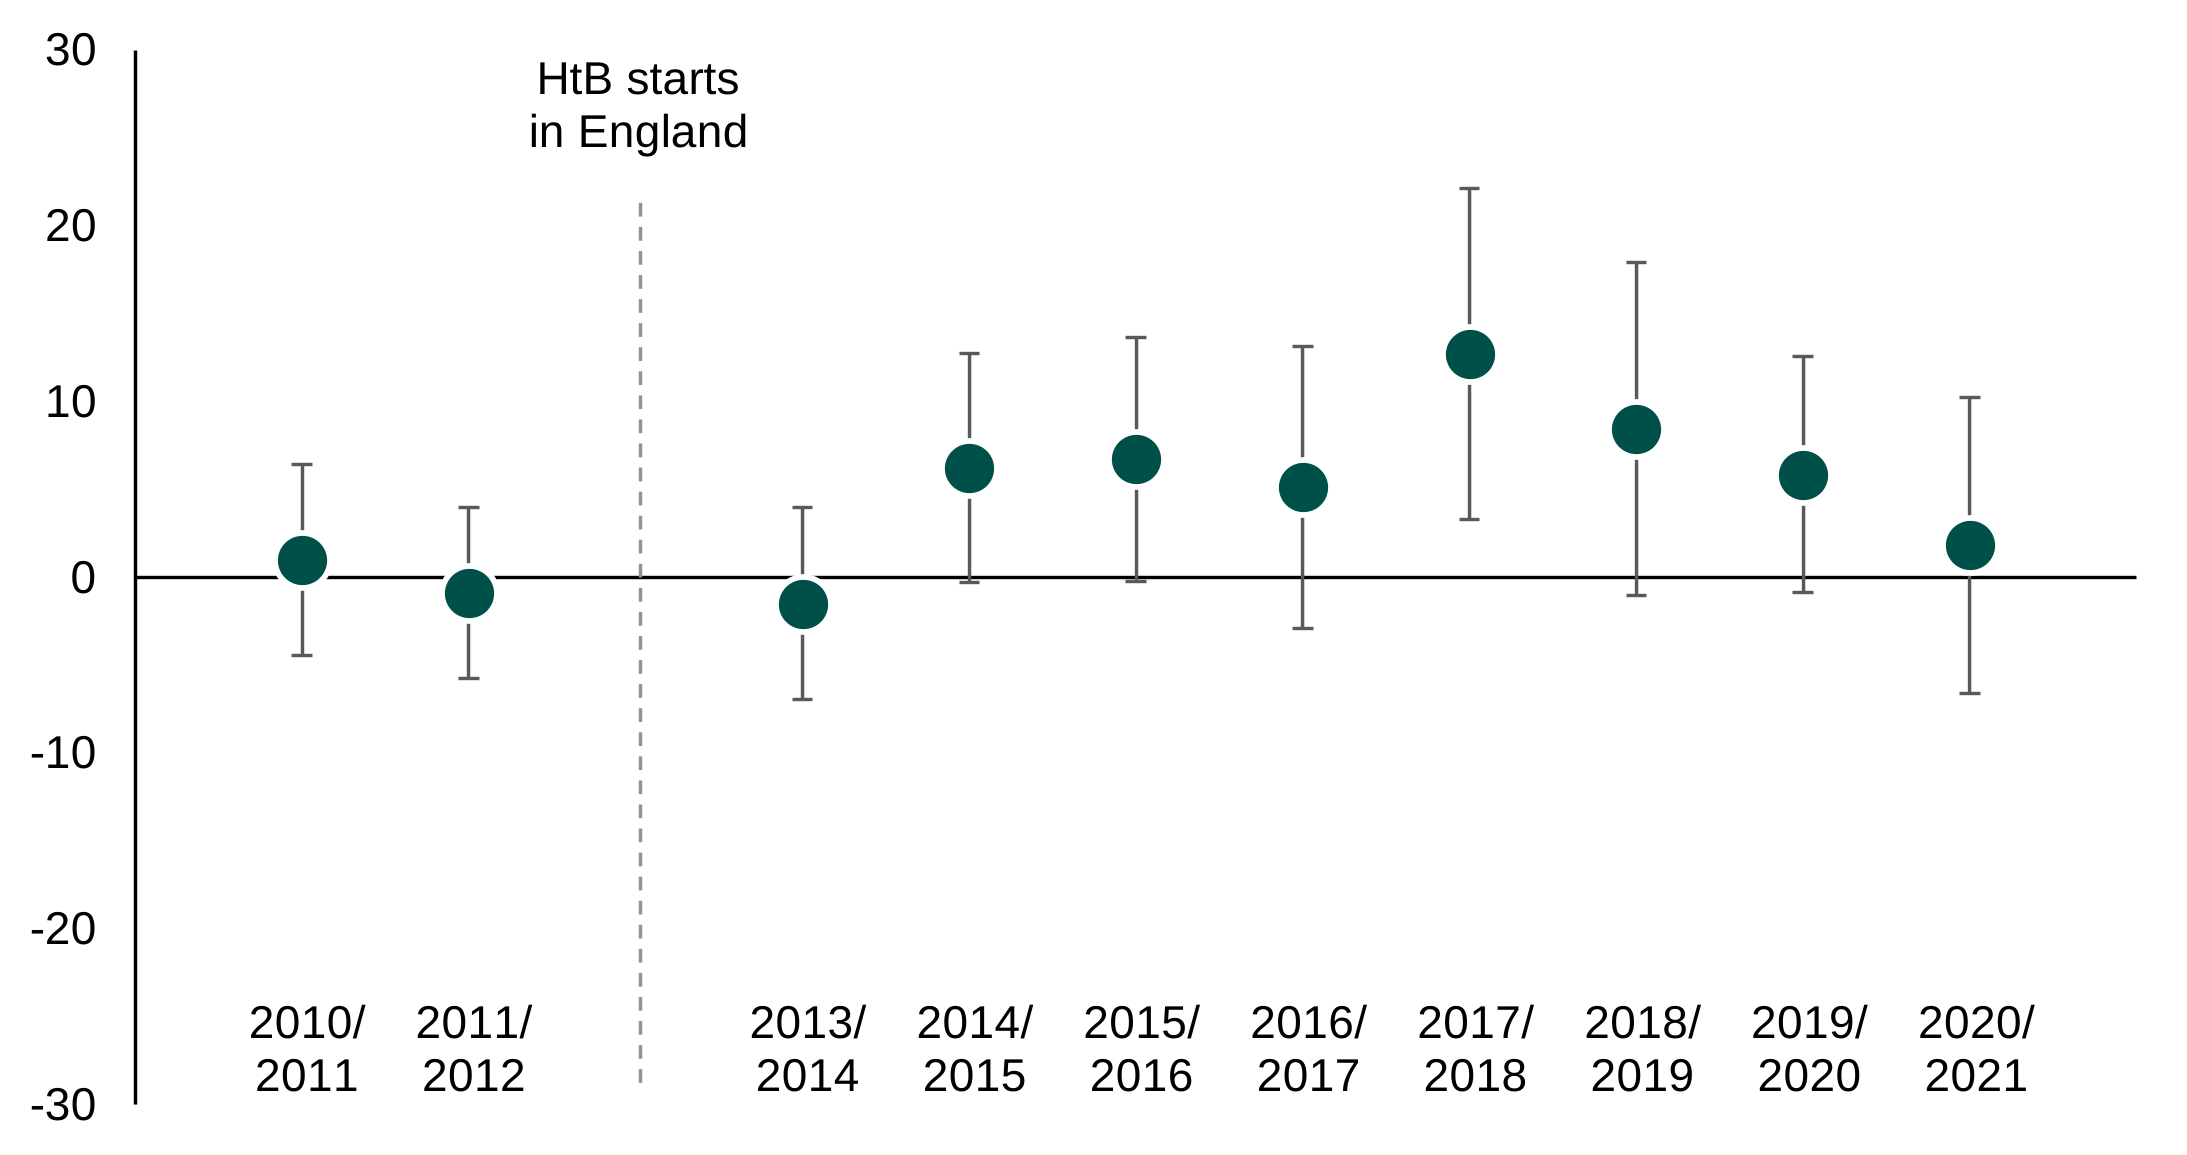
Source: Energy Performance Certificates database
Alternative text
Dot chart titled Estimated impact of Help to Buy on annual number of new dwellings recorded per English ward, April 2013 to March 2021
(England/Wales border).
The chart shows yearly estimates from 2010/11 to 2020/21 with a vertical dashed line marking the start of Help to Buy in England around 2013/14 and a horizontal line at zero indicating no effect.
Before the policy, estimates are close to zero, with a small positive value around 1 in 2010/11 and a slightly negative value near -1 in 2011/12. At the start of the policy in 2013/14, the estimate is slightly negative at around -2.
From 2014/15 onwards, estimates turn positive and increase, reaching about 6 to 7 in 2014/15 and 2015/16, then around 5 in 2016/17. The effect peaks at approximately 13 in 2017/18 before easing to about 8 in 2018/19 and around 6 in 2019/20. By 2020/21, the estimate falls to around 2.
Error bars are present for each year and are fairly wide throughout, often spanning values above and below zero in earlier years but remaining mostly above zero during the mid-to-late period, indicating greater uncertainty but generally positive estimated effects after the policy introduction.
The results are somewhat sensitive to the choice of which areas are included in the analysis. Figure 5.3 shows how the results vary when restricted to wards within 5 km of and up to 20 km of the border. The estimated effects tend to be larger when the distance threshold is greater.
It is not surprising that estimated effects vary to some extent for different distance thresholds. As the distances increase, the analysis is likely to include less comparable areas, meaning those estimates should be interpreted more cautiously as evidence of the scheme’s causal effect. All the estimates are positive and, from 7.5 km to 15 km, are of a reasonably similar scale. From this analysis, it is concluded that the Help to Buy scheme likely led to an increase in housing supply in these wards in England, most plausibly in the range of 4 to 7 additional dwellings per ward a year.
Figure 5.3: Estimated impact of the introduction of Help to Buy on the annual number of new dwellings per English ward, April 2013 to March 2021
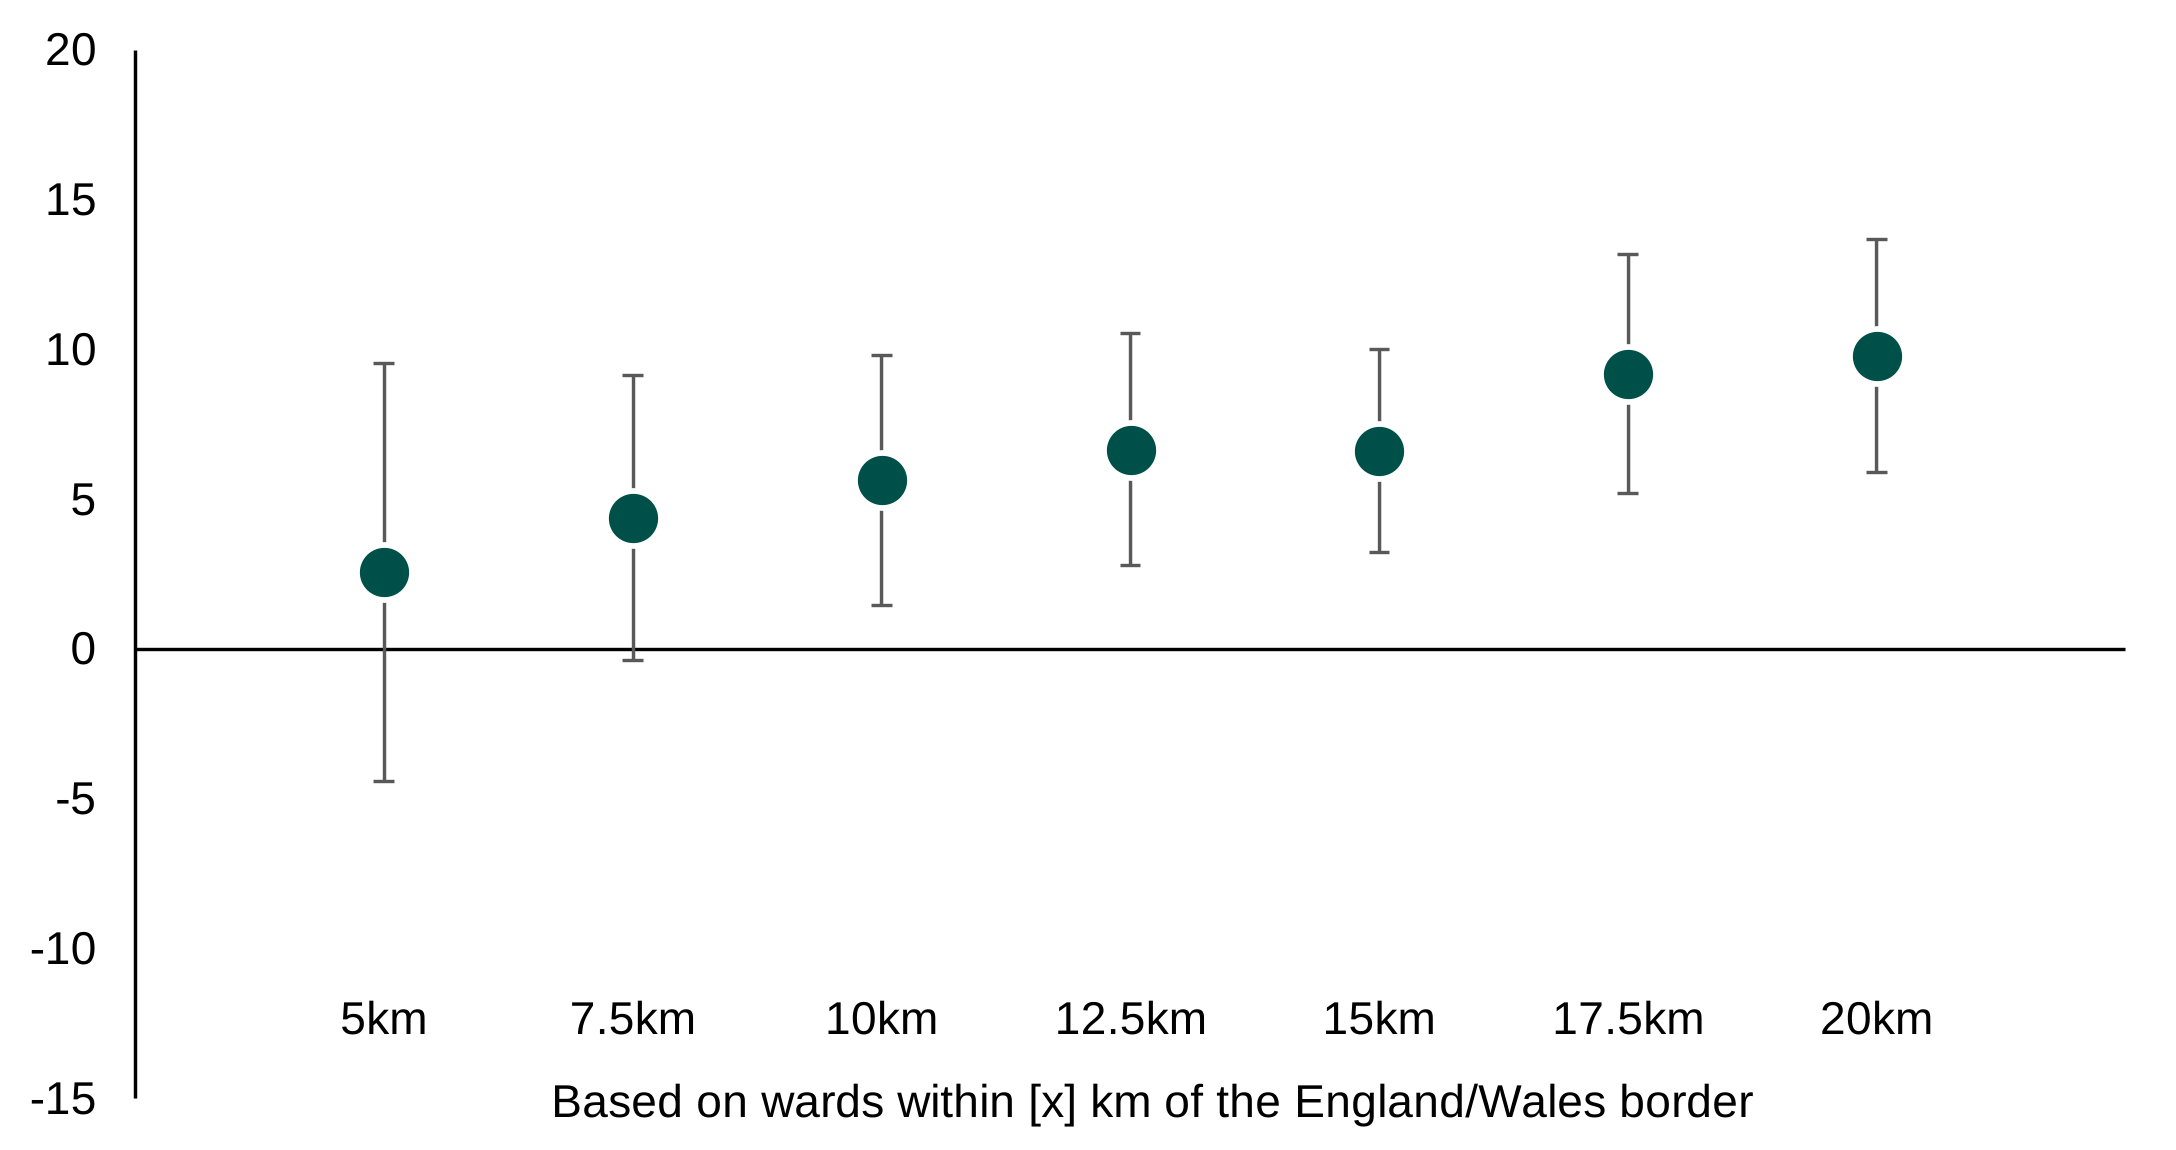
Source: Energy Performance Certificates database
Alternative text
Dot with the estimated impact of HtB on the annual number of new dwellings recorded per English ward, from April 2013 to March 2021
(England/Wales border).
The chart shows estimates for different samples, based on the distance from the England/Wales border. The impact is not statistically significant when the sample is restricted to wards within 5 or 7.5 km of the border, but becomes significant from 10 km onwards. As the distance band expands, the estimated effect increases, reaching around 10 additional dwellings per ward per year within 20 km of the border.
The study conducted an additional sensitivity analysis to further explore the possibility of spillover effects. In particular, at any given time period, most wards do not have any new dwellings recorded. Where new dwellings are recorded, the number is often quite low. The number of new dwellings recorded cannot be below zero, which can lead to models over-estimating the level of change.
The study therefore fits an alternative statistical model that is designed for this kind of data.[footnote 9] This model effectively splits the process of additional housing supply into 2 parts:
- Whether a ward has any new dwellings recorded
- How many dwellings are recorded in wards that have at least one
These 2 parts correspond approximately to (1) the number of development sites, and (2) the size of developments. An increase in the number of sites would be expected to increase the number of wards recording new dwellings. On the other hand, an increase in site size could, increase the number of dwellings recorded, even if the number of wards with any dwellings did not increase.[footnote 10] Figure 5.4 illustrates this model. On the English side of the border, the proportion of wards with at least one new dwelling recorded in a given quarter increased substantially, from 24% in the 3 years before the start of the Help to Buy scheme (April 2010 to March 2013) to 38% over the course of Help to Buy 1 (April 2013 to March 2021). At the same time, there was very little change for wards on the Welsh side of the border (12% and 15% respectively).
This analysis suggests that the effect on housing supply is primarily from more developments (more wards having any new dwellings recorded) rather than the developments becoming larger (as shown in the right-hand chart of Figure 5.4). This supports a hypothesis that the Help to Buy scheme had a spillover effect by creating an environment in which more developments were completed, including homes that were not purchased through the Help to Buy scheme.
Figure 5.4: Change in number and size of developments, April 2013 to March 2021 vs. April 2010 to March 2013
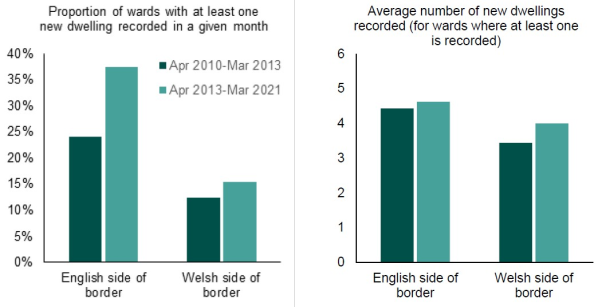
Alternative text
Bar chart titled Proportion of wards with at least one new dwelling recorded in a given month, comparing the English side of the border and the Welsh side of the border across 2 time periods: April 2010 to March 2013 and April 2013 to March 2021.
On the English side of the border, the proportion increases from about 24% in the earlier period to around 37% in the later period. On the Welsh side of the border, the proportion rises from approximately 12% to about 15%.
In both locations, the later period shows higher proportions than the earlier period, with a larger increase observed on the English side of the border compared to the Welsh side.
Bar chart titled Average number of new dwellings recorded (for wards where at least one is recorded), comparing the English side of the border and the Welsh side of the border across 2 periods: April 2010 to March 2013 and April 2013 to March 2021.
On the English side of the border, the average increases slightly from around 4.4 dwellings in the earlier period to about 4.6 in the later period. On the Welsh side of the border, the average rises from approximately 3.4 to around 4.0.
Both sides show an increase over time, with the English side consistently higher than the Welsh side, although the gap narrows slightly in the later period.
Source: Energy Performance Certificates database
Combining the 2 parts of this analysis, this model estimates that the Help to Buy scheme led to an additional 2,100 dwellings in these wards in England by March 2021. This is equivalent to around 17% of all new dwellings recorded in these wards being attributable to the support delivered by the Help to Buy scheme.
These estimates are smaller than the estimates from the original analysis described above (around 3,400 new dwellings, equivalent to 28% of all new dwellings in these areas). This is related to the fact that the number of new dwellings recorded was slightly lower for wards on the Welsh side of the border than the English side, even before the Help to Buy scheme started. As a result, the numerical floor (the fact that the number of new dwellings in the data cannot be less than zero) leads the model to be more conservative about how the trend in England compares to the trend in Wales.
Nonetheless, this analysis still finds evidence of a sizeable positive effect on housing supply in these English wards close to the England/Wales border. In section 5.7 the report presents how these 2 estimates of the effects of the introduction of the Help to Buy scheme can be combined with results from the other analyses to provide an overall assessment of the Help to Buy scheme’s impact on housing supply over the whole course of the scheme.
5.3.2 Difference-in-differences: national trends
The analysis above suggests that the introduction of the Help to Buy scheme led to an increase in housing supply in areas close to the England/Wales border. The analysis of wider national trends is intended to explore whether there is any evidence that similar effects may have occurred in other areas.
Figure 5.5 shows the trends in the number of new dwellings recorded across England and Wales, again using EPC data. By this measure, new housing supply increased steeply in almost all regions in England following the start of the Help to Buy scheme, while remaining relatively flat in Wales; North East England also remained relatively flat, much closer to the trend in Wales. The increases were especially large in London and the South East, although the trends were also different in these regions before the start of the Help to Buy scheme.
As discussed in section 2.1, new housing supply was at a relatively low point in 2009 to 2013 following the financial crisis. Therefore, much of this increase in housing supply represents a recovery of the market back to pre-financial crisis levels.
Figure 5.5: Nationwide trends in number of new dwellings, 2010 to 2024
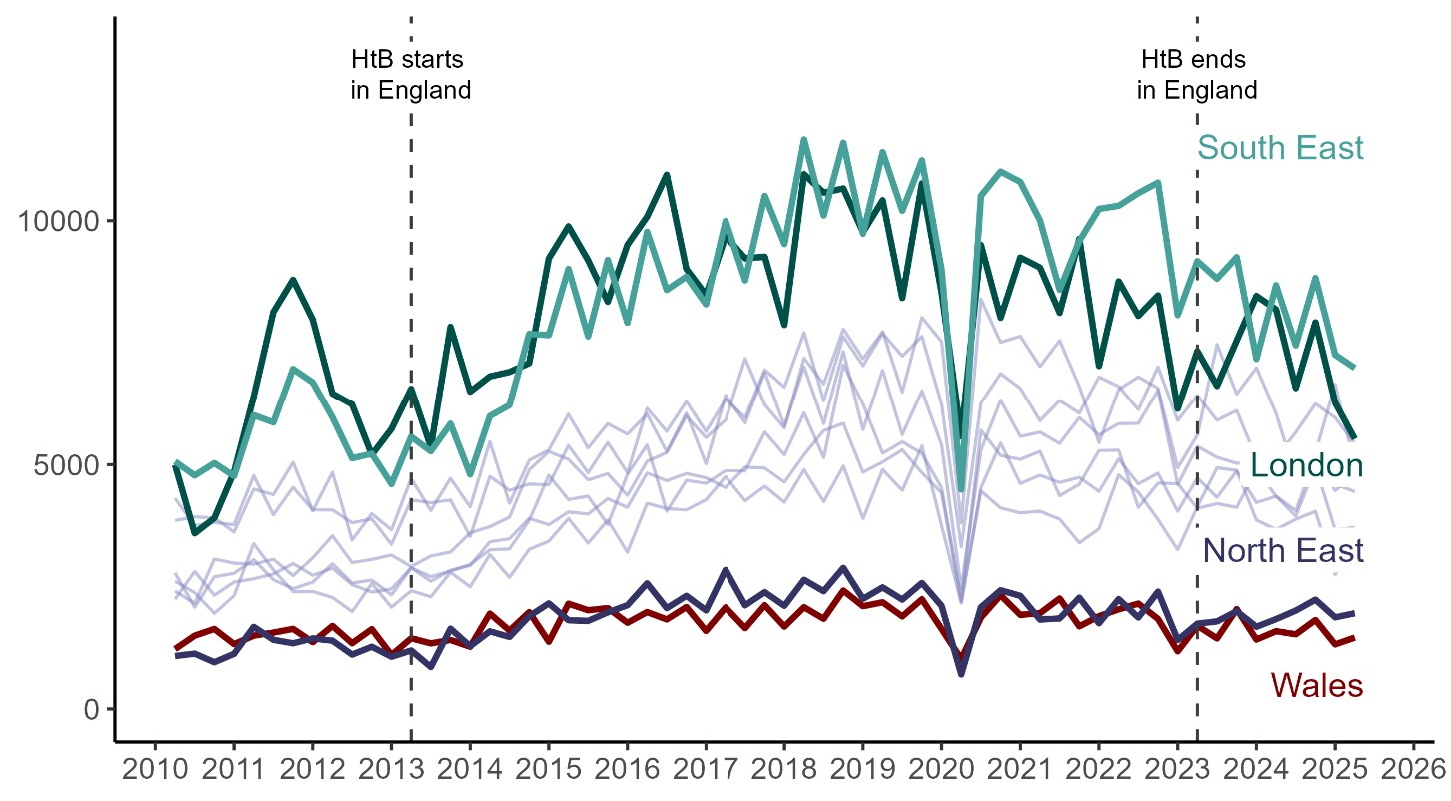
Source: Energy Performance Certificates database
Alternative text
Line chart showing the number of new dwellings over time across multiple regions from 2010 to around 2025. The vertical axis ranges from 0 to over 10,000. Two vertical dashed lines mark policy milestones: the start of Help to Buy in England around 2013 and the end of the scheme around 2023.
The South East has the highest values throughout, rising from around 4,500 to 5,000 in 2010 to peaks above 10,000 in the late 2010s, with fluctuations and a sharp dip around 2020, followed by recovery and then a decline after 2023. London follows a similar but lower pattern, increasing from about 4,000 to 5,000 to peaks near 9,000 to 10,000 before declining after the scheme ends.
The North East remains much lower, starting near 1,000 to 1,500, rising gradually to around 2,000 to 2,500, with a noticeable drop around 2020 and modest recovery afterward. Wales shows the lowest values overall, fluctuating between about 1,000 and 2,000 with a similar dip around 2020.
Multiple faint grey lines represent other regions, generally following similar upward trends before 2020, a sharp dip around 2020, and mixed recovery afterward. Overall, most regions show growth following the start of Help to Buy, a disruption around 2020, and a decline or levelling off after the scheme ends.
Table 5.2 shows how the change observed in England as a whole compares to the change observed in Wales as a whole. This evidence shows that housing supply increased faster on average across England following the introduction of the Help to Buy scheme than in Wales. On average, there were 8.5 more new dwellings recorded a year in wards in England than if these areas had followed the same trend as in Wales.
The scale of this difference is very similar to the scale of the estimated impact at the England/Wales border. As there were 29 new dwellings recorded on average a year for wards in England, a difference of 8.5 additional dwellings implies that around 29% of recorded dwellings may have been associated with the Help to Buy scheme, under the assumption that England would otherwise have followed the same trend as Wales.
Interpreting these differences in trends as being caused by the Help to Buy scheme would require strong assumptions about the comparability of different areas. For example, as previously shown in Figure 5.5, the trends in London and the South East were already different to Wales before the Help to Buy scheme was introduced. This suggests the assumption that without the Help to Buy scheme the trends would have been similar across the whole England and Wales may not hold.
The study therefore repeated the analysis excluding wards in London and the South East (Table 5.2). It finds a similar average difference between England and Wales after excluding these regions. This demonstrates that the difference applies across England and was not driven by the trends in London or the South East.
Table 5.2: Difference in trends of annual new dwellings recorded between local authorities (LAs) in England and LAs in Wales, April 2013 to March 2021
| Wards in England | Wards in England (excluding London and the South East) | |
|---|---|---|
| Average number of new dwellings a year (April 2013-March 2021) | 28.9 | 26.2 |
| Average number of new dwellings if the trend had been the same as wards in Wales | 20.5 | 18.5 |
| Estimated difference in trends following the introduction of the Help to Buy scheme in England | +8.4 new dwellings a year per ward | +7.8 new dwellings a year per ward |
| 95% confidence interval | +7.0 to +9.9 | +6.3 to +9.2 |
| p-value | <0.001* | <0.001* |
*statistically significant at the 95% level
Additionally, Figure 5.6 breaks down the difference in trends by quarter. Each point represents the change in England since the first quarter of 2013 (January to March 2013, immediately before the start of the Help to Buy scheme) in comparison to the change in Wales over the same time period. Although there are some small differences before the start of the Help to Buy scheme in England in April 2013, the trends clearly diverge midway through the second year of the Help to Buy scheme (from early 2015), with a faster increase in new housing supply in English wards than in Welsh wards. The differences in the trends after the beginning of the Help to Buy scheme are far larger than any differences observed before it started. The timing of this divergence is also consistent with the findings from the England/Wales border, with the difference in housing supply emerging from the second year of the Help to Buy scheme.
Figure 5.6: Difference in trends in the quarterly number of new dwellings recorded for wards in England vs. wards in Wales, April 2010 to March 2021
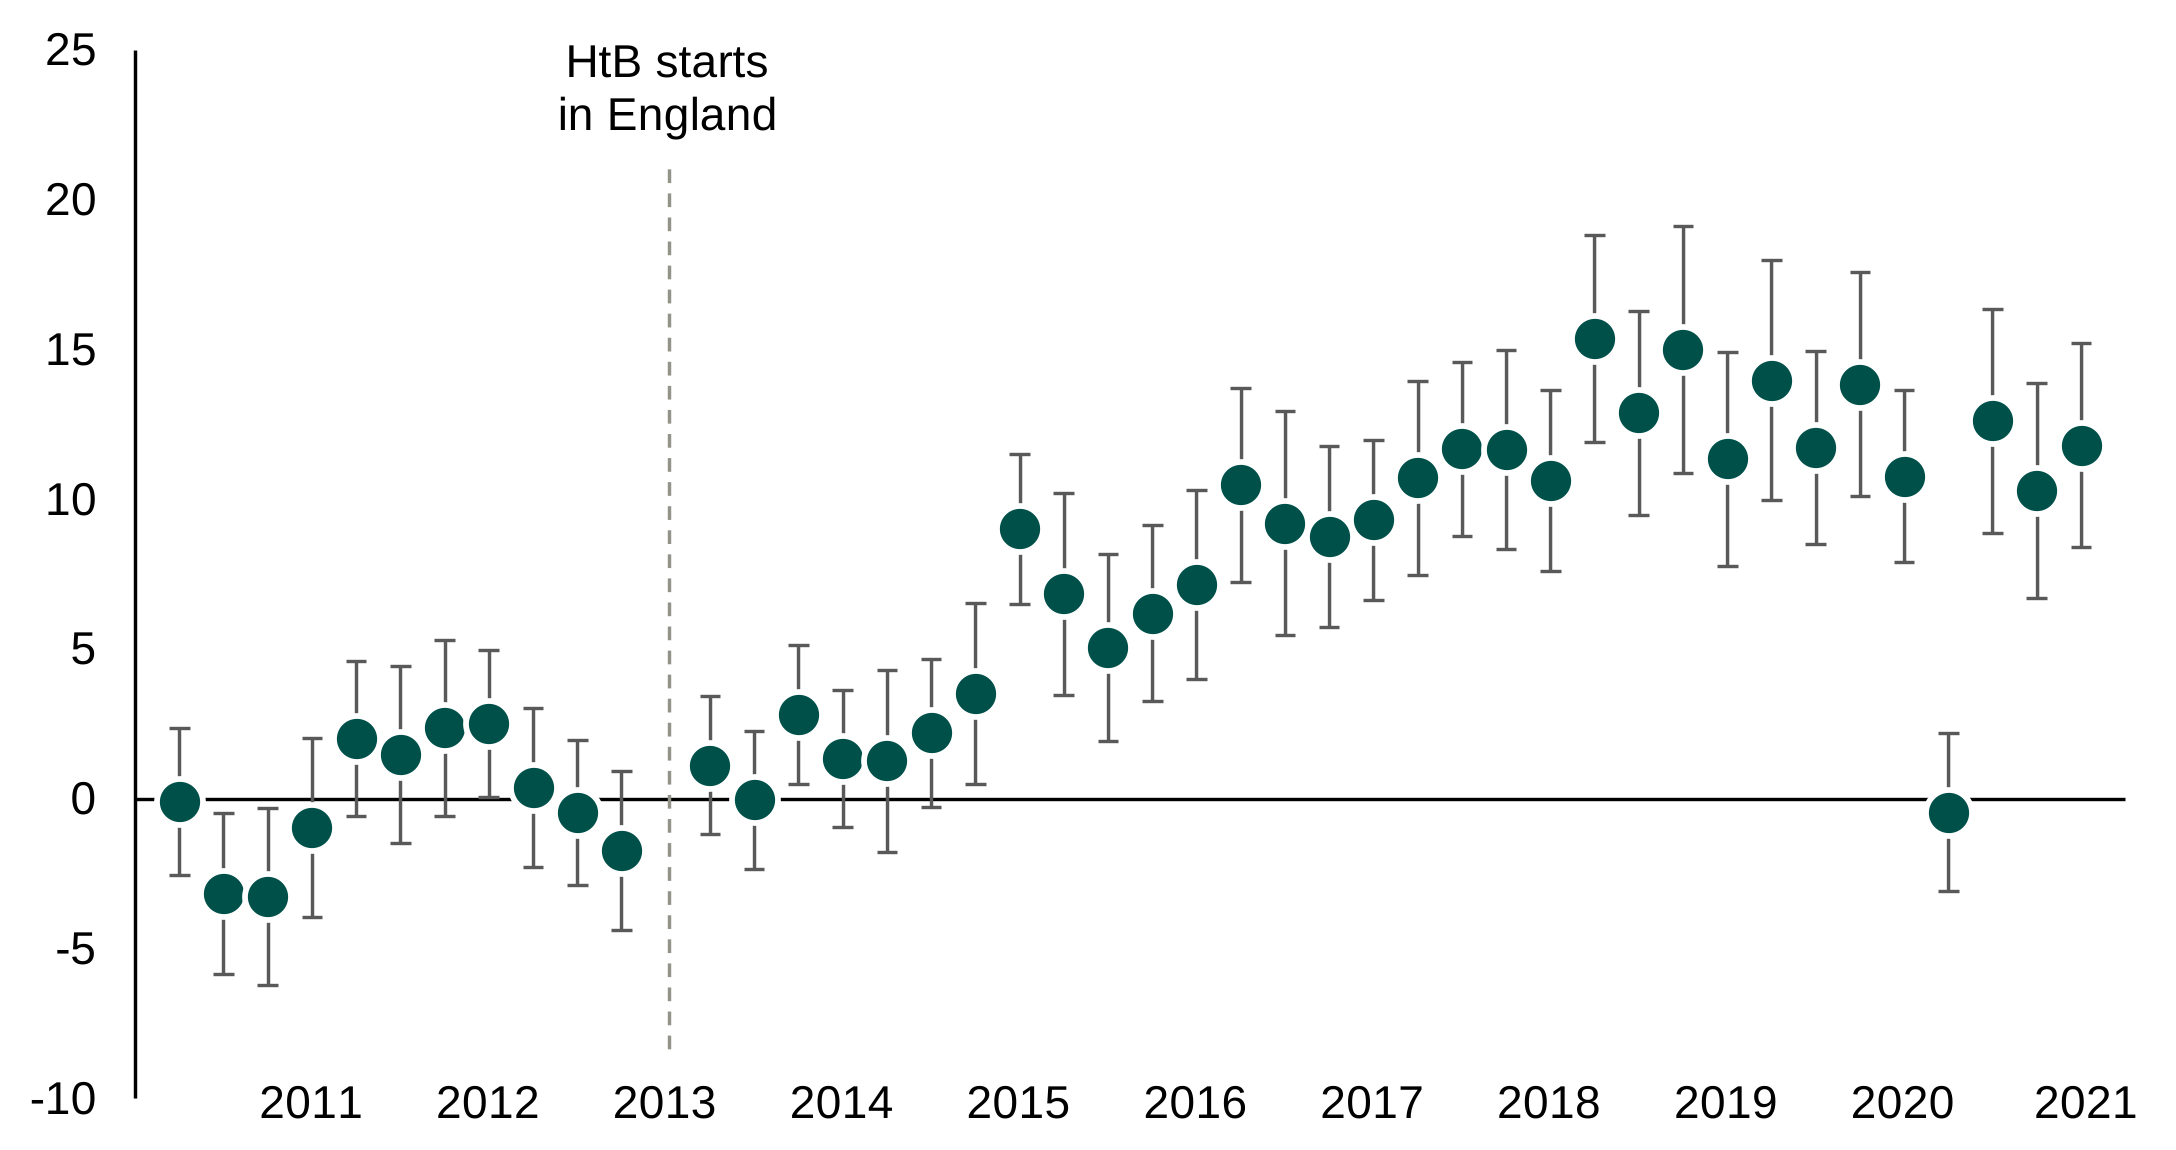
Source: Energy Performance Certificates database
Alternative text
Dot chart with error bars showing estimated annual impacts from 2010 to 2021, with a vertical dashed line marking the start of Help to Buy in England around 2013 and a horizontal line at zero indicating no effect. The vertical axis ranges from about -10 to 25.
Before the policy, estimates fluctuate around zero, with several negative values between about -4 and -1 in 2010 to 2011, followed by small positive values of around 1 to 3 in 2012. Around the start of the policy in 2013, estimates are close to zero, with slight positive and negative values.
From 2014 onwards, estimates become consistently positive and increase over time. Values rise from around 2 to 4 in 2014 to approximately 6 to 10 by 2015 to 2016, then continue upward to around 10 to 12 in 2017.
The peak occurs around 2018 to 2019, with values reaching roughly 12 to 16. After 2019, estimates remain positive but begin to moderate slightly, generally ranging between about 10 and 14 through 2020 and 2021, with one notable point near zero around 2020.
Error bars are present for all points and are relatively wide, especially in later years, but most estimates after 2014 lie above zero, indicating sustained positive effects following the introduction of Help to Buy.
These findings point towards reasonably widespread effects on housing supply in England. The study cannot entirely rule out other factors affecting the trends in England over the same timeframe. However, the fact that it shows increases in new housing supply at the same time and approximately similar scales across the English regions suggests that the Help to Buy scheme was likely to be contributing to the increase in housing supply in these regions.
This is different to the effects on home ownership, where the analysis found that there was very little increase in home ownership in areas which were already relatively expensive. This demonstrates that increases in housing supply do not necessarily translate into increases in home ownership in all local housing markets. In particular, increased supply in less affordable places does not appear to have led to increased home ownership in those places, perhaps because the homes remained unaffordable for many potential FTBs. As discussed in chapter 7, these less affordable areas also tended to see the largest increases in prices.
5.3.3 Qualitative evidence from developers
The findings about the scale and timing of effects on supply are consistent with the experiences reported by developers in qualitative interviews. As described earlier in this chapter, developers reported the increased demand due to the scheme led them to feel confident that they would sell future new build properties. Accordingly, national and larger developers described increasing the volumes they built, estimating that they built 10% to 40% more properties in the Help to Buy scheme period than before or after it.
National and larger developers described being able to increase their build pace, talking about directing their cash flow into buying more land, opening more sites and building more properties on them, building out quicker and overall building more properties. Some described intense competition for land and land banking in the Help to Buy scheme period.
“If our business is going to grow, we have to keep replacing our land bank and therefore we need to replace our land bank at a faster rate.” - National developer, built over 10,000 homes through Help to Buy scheme
5.3.4 Difference-in-generosities: Local housing market conditions
The analysis of geographic borders suggests that the introduction of the Help to Buy scheme led to an increase in housing supply in England close to the border with Wales. The analysis of national trends indicates that these effects could be more widespread as faster increases in new housing supply were seen in English regions than in Wales. The qualitative evidence from developers supports both of these quantitative analyses, suggesting that developer confidence had a positive effect on building activity. The analysis of local ‘‘generosity’ explores how housing supply changed in different types of local housing market over the course of the Help to Buy scheme.
There is no evidence for a strong relationship between increases in housing supply and the local ‘generosity’ of the Help to Buy scheme. There is a weak negative relationship: new housing supply increased slightly more in wards that were relatively more expensive. But that is largely driven by the growth in new housing supply in London between 2013 and 2016. This relationship almost entirely disappears if London is excluded from the analysis.
These findings suggest that new housing supply was not strongly dependent on the scale of the Help to Buy scheme in relation to local market conditions. The change in housing supply was broadly similar in areas where the Help to Buy scheme was more generous or less generous. This is consistent with the hypothesis that the increase in housing supply was widespread, with many different types of area benefitting.
Developers view was that customers wanted to purchase different sorts of properties depending on the affordability of an area, and they tailored their supply to meet this demand. In London, where property was less affordable, some developers reported that national developers built many flats for FTBs using the Help to Buy scheme. However, in areas where property was more affordable, developers typically described shifting their focus away from building 2-bedroom houses during the Help to Buy 1 scheme, as customers became more interested in borrowing the maximum amount and buying as large a property as they could afford. Instead, they described building more 3-bedroom houses. One developer explained that this was likely to be the case in areas where salaries were lower, and where the Help to Buy 1 scheme was an unprecedented opportunity for families to upsize their property.
“I do think in those in areas where salaries are lower like Norfolk there was a real push for people using Help to Buy to buy four-bedroom houses, which they needed for their family.” - National developer, built between 5,000 and 9,999 properties through the Help to Buy scheme
5.4 The increase in the maximum loan value in London from February 2016
In this section, the study investigates the effects of the increase in the maximum loan value on housing supply in London. This went up from 20% of the property value to 40% in London from February 2016.
5.4.1 Difference-in-discontinuities: evidence from the London border
Figure 5.7 shows the trends in the number of new dwellings recorded for wards within 5km of the London border.[footnote 11] After the change to the maximum loan value, the trend slowed down on the London side of the border while continuing to increase slightly outside of London.
Figure 5.7: Average number of new dwellings recorded in wards within 5 km of the London border, April 2013 to March 2021
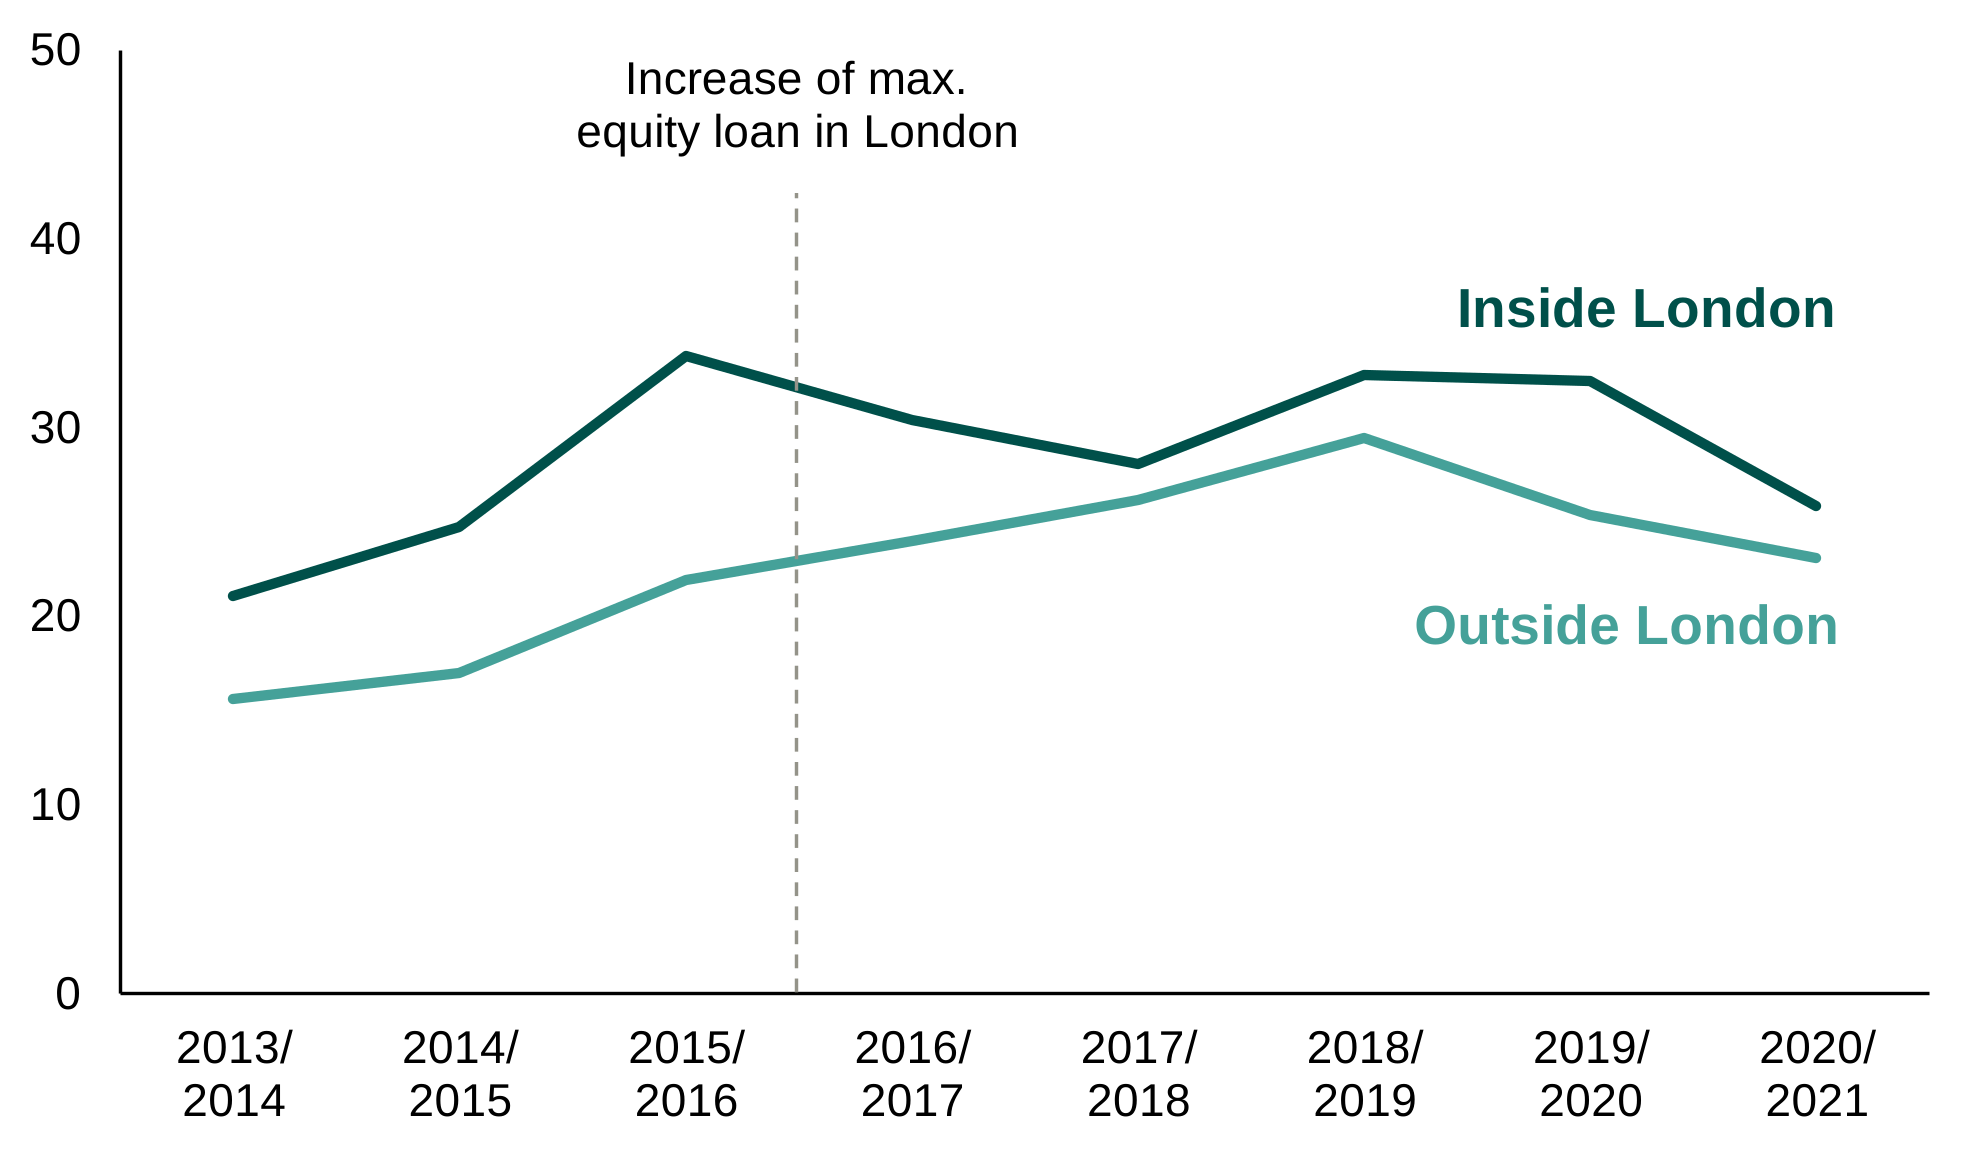
Source: Energy Performance Certificates database
Alternative text
Line chart titled Average number of new dwellings recorded in wards within 5km of the London border, April 2013 to March 2021. The chart compares Inside London and Outside London, with values ranging from 0 to 50, and includes a vertical dashed line around 2015/16 marking an increase in the maximum equity loan in London.
Inside London starts at about 21 in 2013/14 and rises to a peak of around 33 to 34 in 2015/16. It then declines to roughly 28 in 2017/18, increases again to around 32 to 33 in 2018/19 and 2019/20, and falls to approximately 25 in 2020/21.
Outside London begins at about 15 in 2013/14 and increases steadily to around 22 in 2015/16. It continues rising to a peak near 29 in 2018/19 before declining to about 25 in 2019/20 and 23 in 2020/21.
Throughout the period, the average number of new dwellings is consistently higher inside London than outside London, with both series showing growth up to the late 2010s followed by a decline toward the end of the period.
Table 5.3 shows the results of the quantitative impact analysis estimating the impact of the increase in the maximum loan value in London. This analysis suggests that the increase in the maximum loan value did not lead to an increase in housing supply in these areas, and may even have had a negative effect. From February 2016 to March 2021, there were on average 4 fewer new dwellings recorded in these London wards than if the trend had been the same as the wards outside the London border (although this is not statistically significant at the 95% level). Figure 5.8 shows the results for different distance thresholds, different distances from the London border. These give broadly similar results.
Table 5.3: Estimated impact of the increase in the maximum loan value in London on the annual number of new dwellings recorded per ward, February 2016 to March 2021
| Wards in London within 5km of the border | |
|---|---|
| Average number of new dwellings a year (February 2016-March 2021) | 30.2 |
| Average number of new dwellings if the trend had been the same inside London as wards outside the London border | 34.3 |
| Estimated average impact of the increase in the maximum loan value in London | -4.1 new dwellings a year per ward |
| 95% confidence interval | -11.3 to +3.1 |
| p-value | 0.267 |
This analysis focuses on the change to the maximum loan value in London in 2016 as this is the point where there is a difference in the Help to Buy scheme either side of the border. However, these results do not necessarily mean that the Help to Buy scheme as a whole had little (or negative) effect on housing supply in London before this point. For example, as shown previously in Figure 5.7, the trend in new housing supply in London increased considerably between 2013 and 2016. It is plausible that the introduction of the Help to Buy scheme did have an effect on housing supply in London, and that much of this effect had already happened before the increase in the maximum loan value in 2016.
The increase in new housing supply in London from 2013 to 2016 represents a recovery to the levels seen before the financial crisis. It is possible that the introduction of the Help to Buy scheme contributed to this recovery but, when the maximum Help to Buy loan value was increased in London in 2016, the potential for further new housing supply in London was already constrained. With high demand for housing in London at this time, this change to the scheme does not appear to have led to a further increase in housing supply in London.
Figure 5.8: Estimated effect of increase in maximum loan value on the annual number of new dwellings (London border, February 2016 to March 2021)
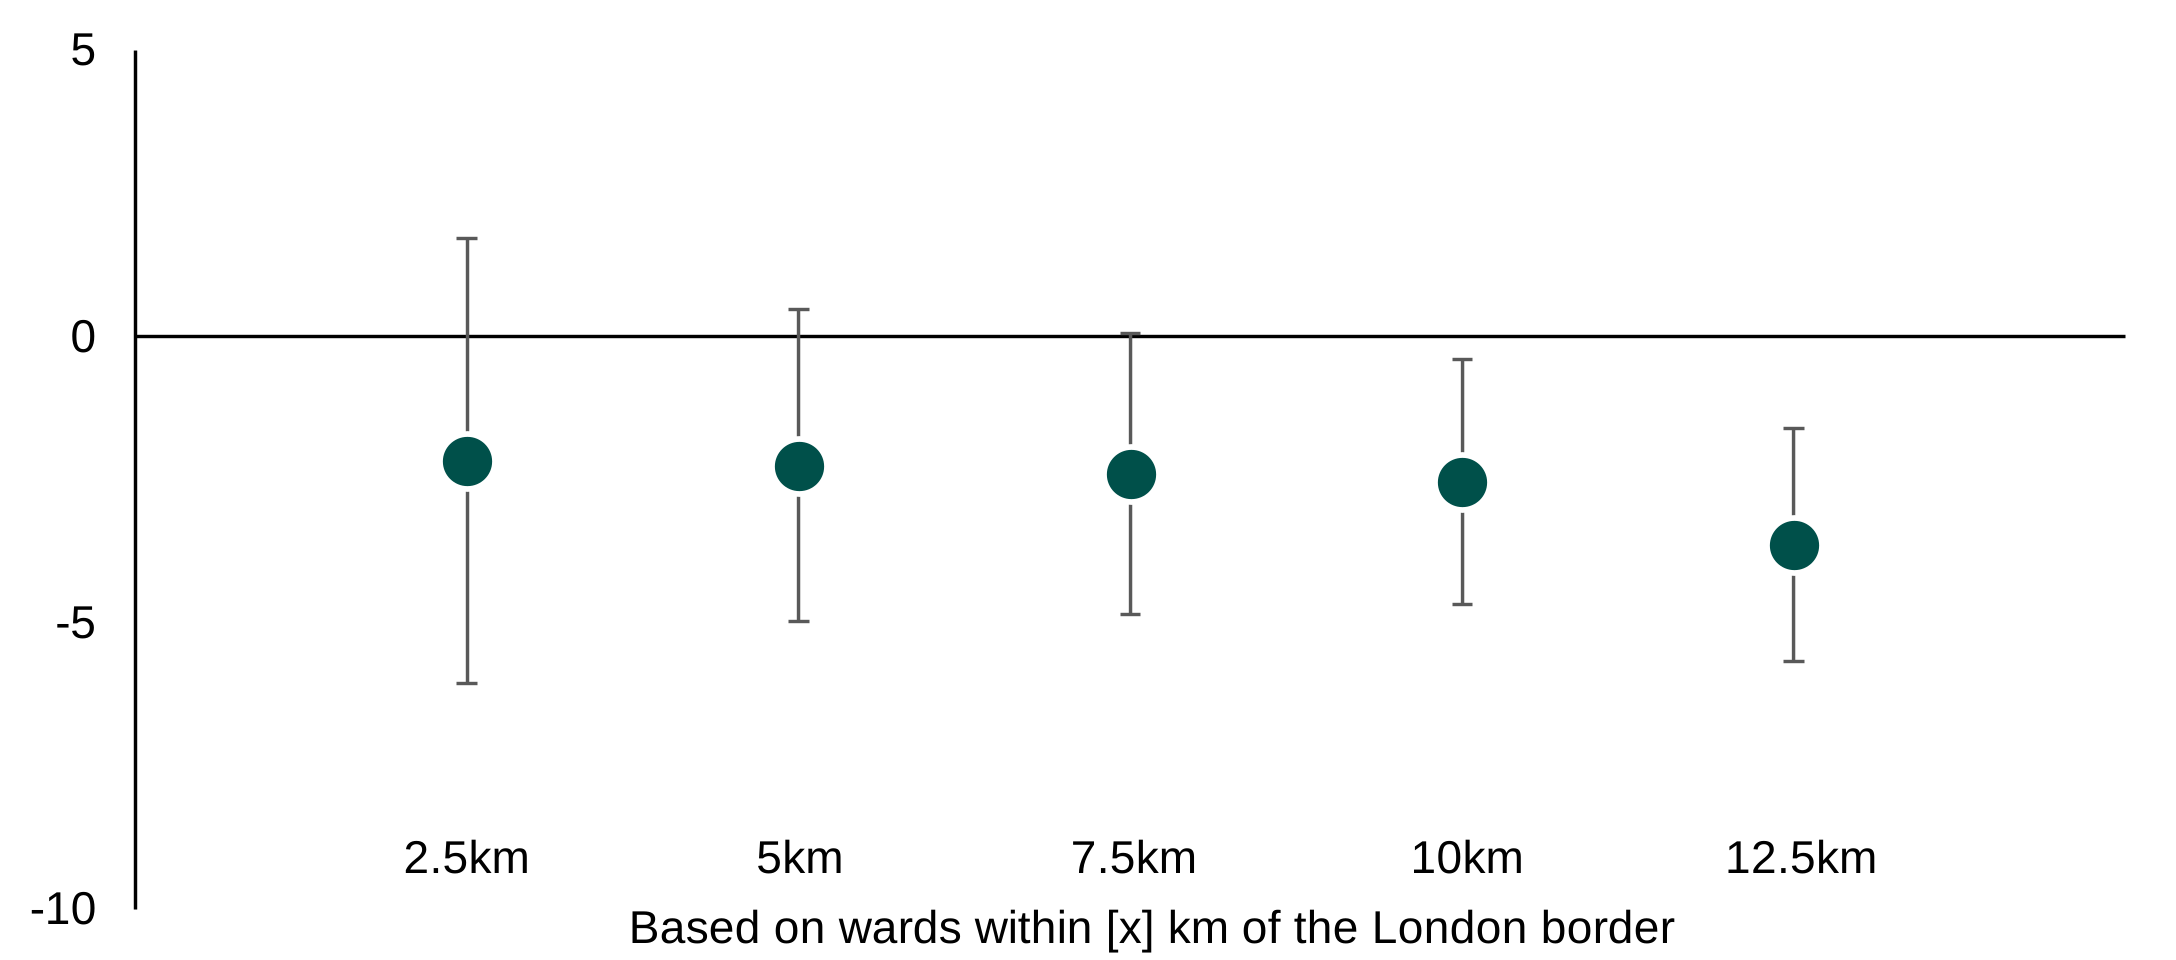
Source: Energy Performance Certificates database
Alternative text
Dot chart titled Estimated effect of increase in maximum loan value on the annual number of new dwellings (London border, February 2016 to March 2021). The chart shows estimated effects for areas at increasing distances from the London border, from 2.5 km to 12.5 km, with a horizontal line at zero indicating no effect.
All central estimates are negative. The effect is around -2.5 at 2.5 km and 5 km, becomes slightly more negative at about -3 at 7.5 km and 10 km, and reaches approximately -4 at 12.5 km.
Error bars are wide across all distances. At shorter distances, particularly 2.5 km and 5 km, they extend above and below zero, indicating substantial uncertainty. At greater distances, error bars remain wide but lie more consistently below zero, suggesting more clearly negative effects further from the London border.
5.4.2 Difference-in-differences: Trends across London, the South East and East of England
The findings from the London border are reinforced when the focus is placed on wider trends in the number of new dwellings recorded across London and the 2 regions closest to London Figure 5.9. The trends are reasonably similar across each region, gradually increasing up until 2018/2019. Table 5.4 shows that the number of new dwellings recorded in London was similar as if it had continued to follow the same trajectory as the South East and the East of England. Again, this supports the conclusion that the increase in the maximum loan value did not lead to a large increase in housing supply in London.
Figure 5.9: Number of new dwellings recorded in London, the South East, and the East of England, April 2010 to March 2021
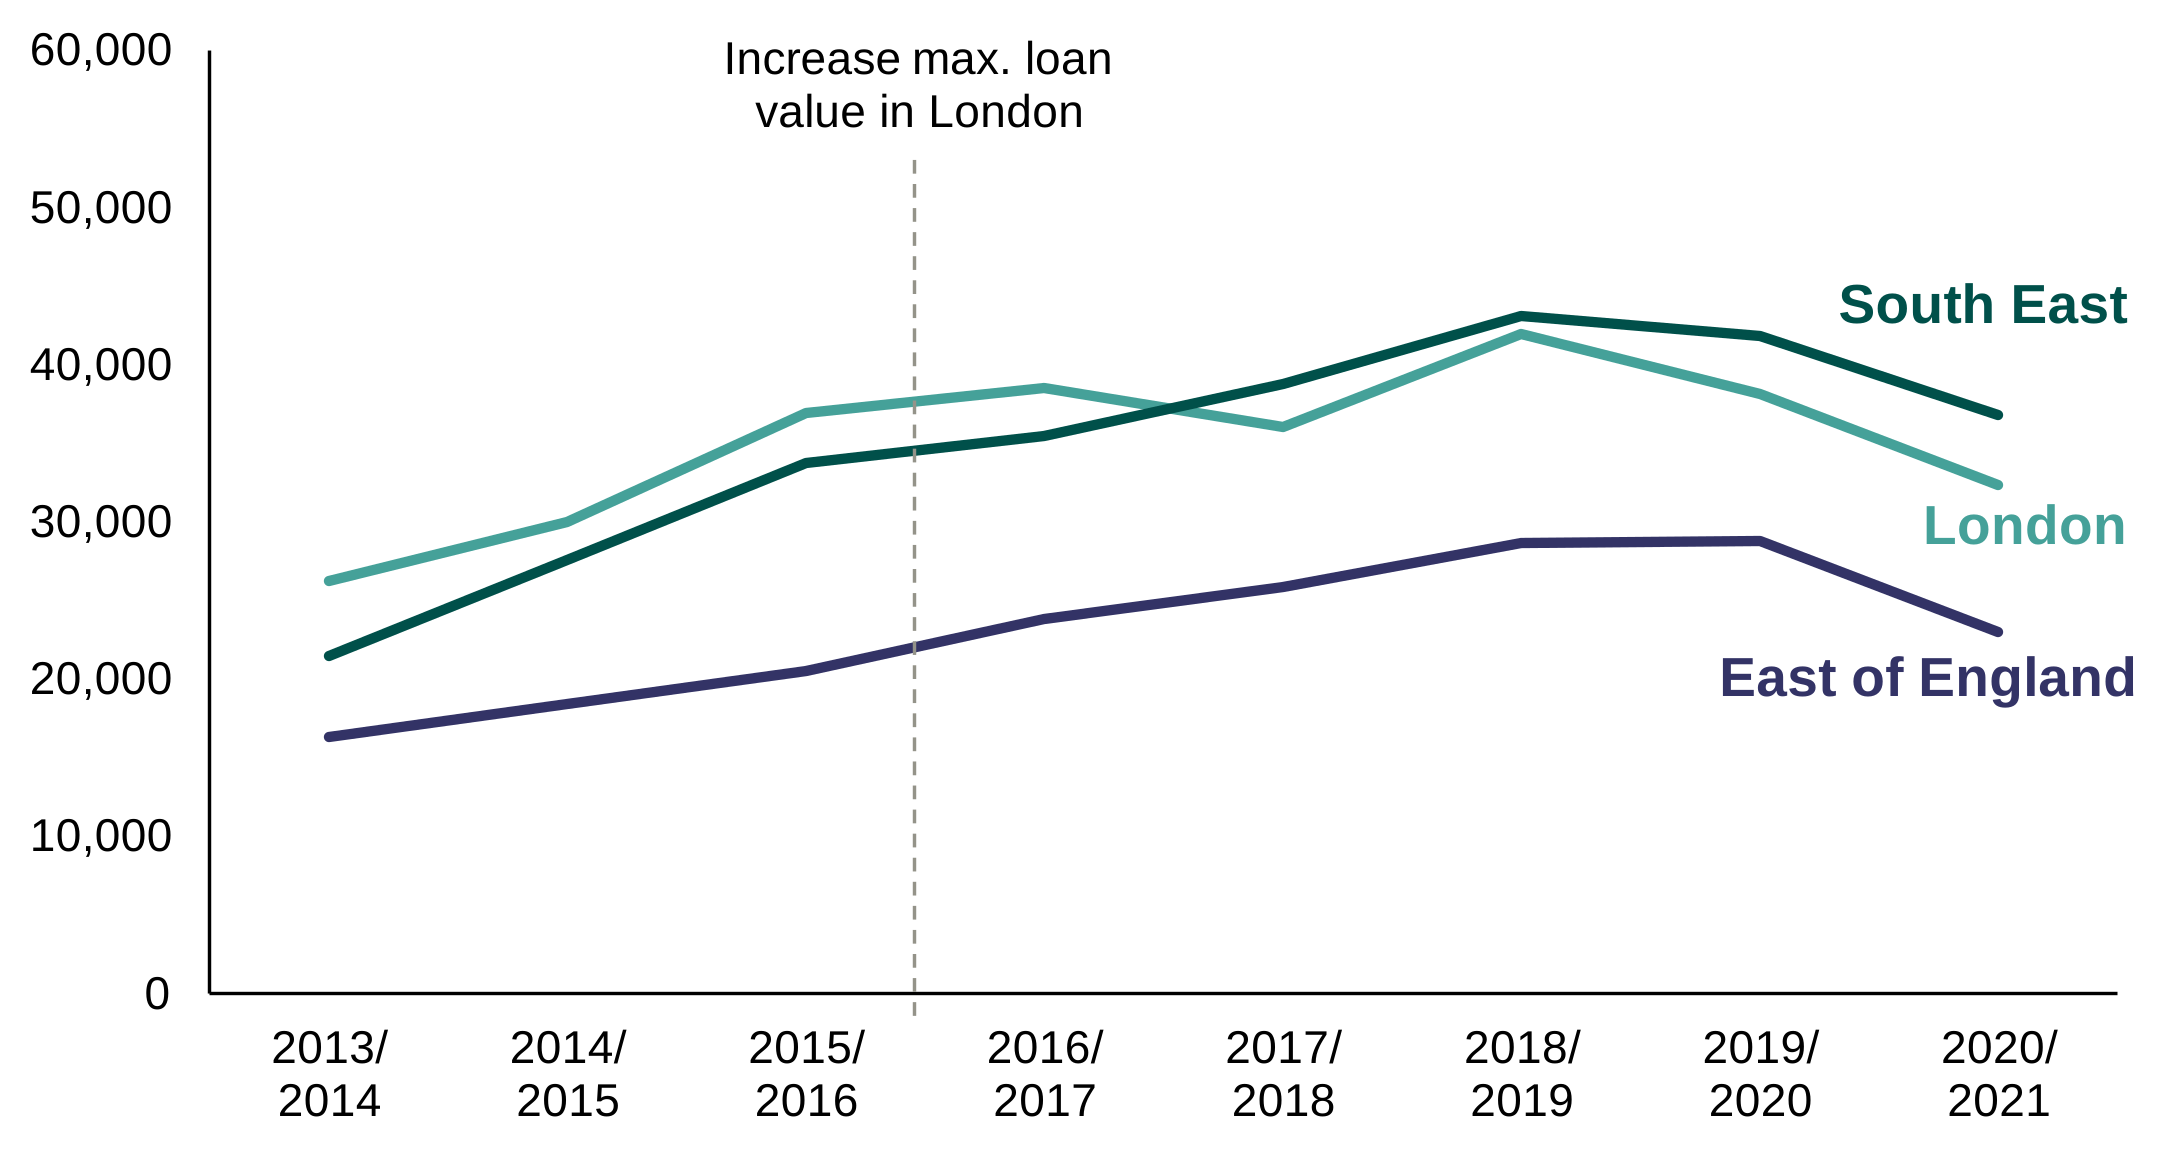
Source: Energy Performance Certificates database
Alternative text
Line chart titled Number of new dwellings recorded in London, the South East, and the East of England, April 2010 to March 2021. The vertical axis ranges from 0 to 60,000. A vertical dashed line around 2015/16 marks an increase in the maximum loan value in London.
The South East has the highest number of new dwellings for most of the period, rising from about 21,000 in 2013/14 to a peak of around 43,000 in 2018/19, before falling to approximately 37,000 in 2020/21.
London starts higher than the South East at around 26,000 in 2013/14 and increases to about 38,000 in 2016/17, then fluctuates and declines to roughly 32,000 by 2020/21.
The East of England remains lower throughout, increasing steadily from about 16,000 in 2013/14 to around 29,000 in 2019/20, before dropping to approximately 23,000 in 2020/21.
Overall, all 3 regions show growth through the mid-to-late 2010s followed by declines toward the end of the period, with the South East overtaking London after the policy change.
Table 5.4: Difference in trends of new dwellings between wards in London and wards in the South East and East of England combined, February 2016 to March 2021
| Wards in London | |
|---|---|
| Average number of new dwellings a year (February 2016-March 2021) | 53.2 |
| Average number of new dwellings if the trend had been the in London as in the South East/East of England | 53.6 |
| Estimated difference in trends following the increase in the maximum loan value in London | -0.4 new dwellings a year per ward |
| 95% confidence interval | -7.1 to +6.4 |
| p-value | 0.909 |
5.5 The introduction of Help to Buy 2
In this section, the study considers the effects of the introduction of Help to Buy 2 on new housing supply. This introduced regional price caps in England, which meant that fewer properties would be eligible for the Help to Buy scheme in all English regions outside of London. It also allowed the analysis to compare differences in supply between regions with varying prices caps.
5.5.1 Evidence from regional borders and national trends
As with the analysis of home ownership, the study compared the trends in the number of new dwellings recorded across English regional borders with the introduction of the Help to Buy 2 scheme in April 2021.
Figure 5.10 and Figure 5.11 show the estimated effects for wards within 5km and 10km of each of these borders respectively. There is no strong evidence to conclude that local differences in regional price caps led to a change in the number of new dwellings recorded. In most cases, the values are reasonably close to zero, indicating that the trends in the number of new dwellings recorded were similar either side of the border.
Figure 5.10: Estimated impact of the introduction of regional price caps on the annual number of new dwellings recorded for wards within 5km of each border, April 2021 to March 2023
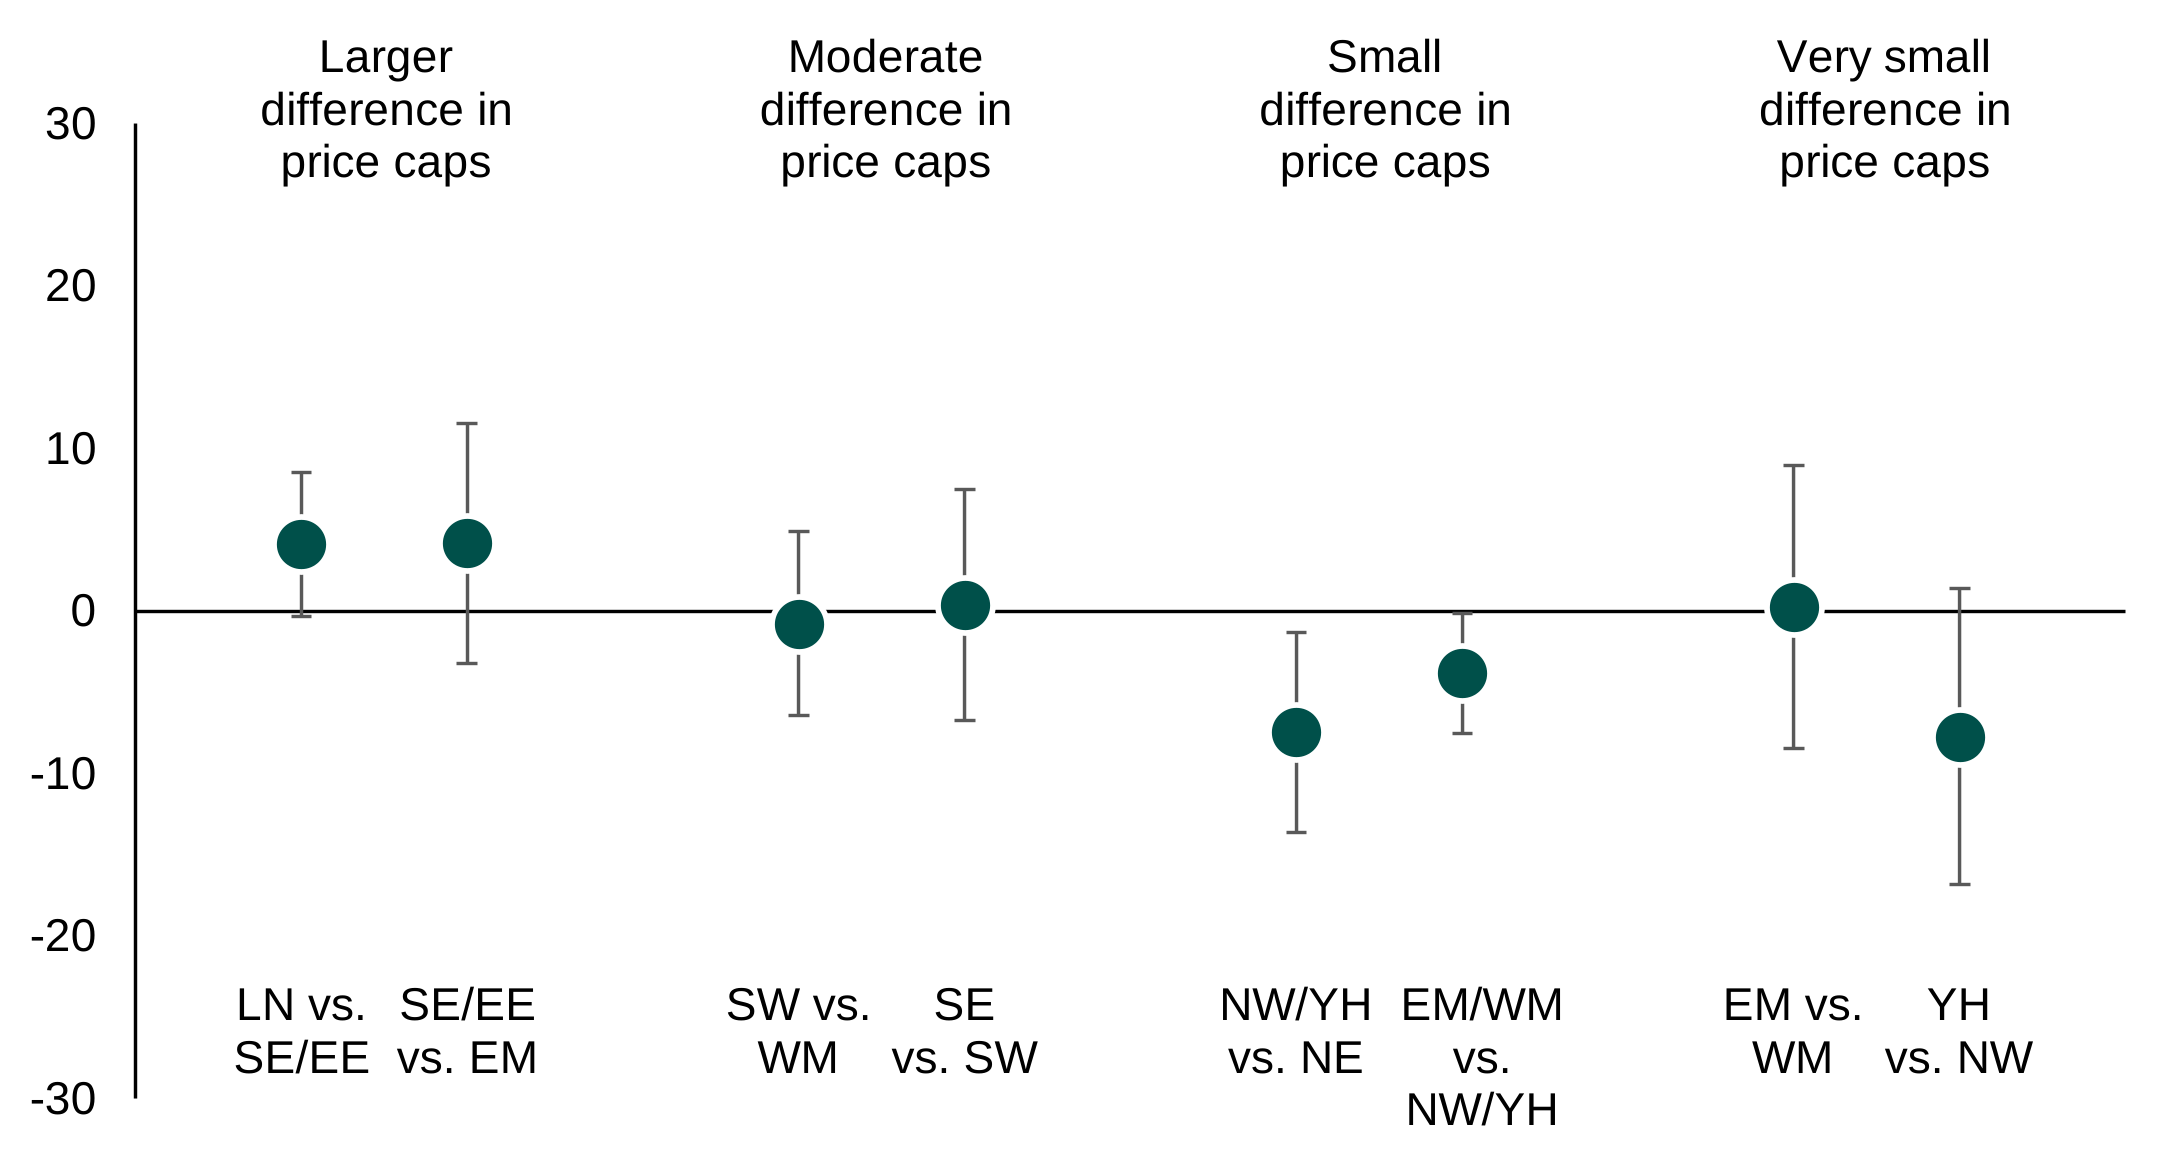
LN = London; SW = South West; SE = South East; EE = East of England; WM = West Midlands; EM = East Midlands; YH = Yorkshire and The Humber; NW = North West; NE = North East
Source: Energy Performance Certificates database
Alternative text
Dot chart titled Estimated impact of the introduction of regional price caps on the annual number of new dwellings recorded for wards within 5 km of each border, April 2021 to March 2023.
The chart groups estimates into 4 categories based on the size of differences in price caps: larger, moderate, small, and very small, with a vertical scale from about -30 to 30 and a horizontal line at zero indicating no effect. Each point includes an error bar showing uncertainty.
For larger differences in price caps, both estimates are positive at around 4 to 5, with error bars extending above and below zero. For moderate differences, estimates are close to zero, with one slightly negative (around -1) and one near zero, and error bars spanning both positive and negative values.
For small differences, both estimates are negative, at approximately -7 and -4, with error bars mostly below zero. For very small differences, one estimate is near zero while the other is more negative at around -8, with wide error bars indicating substantial uncertainty.
Overall, the chart shows more positive estimates where price cap differences are larger, and negative or negligible estimates where differences are smaller, although uncertainty is present across all groups.
Figure 5.11: Estimated impact of the introduction of regional price caps on the annual number of new dwellings for wards within 10km of each border, April 2021 to March 2023
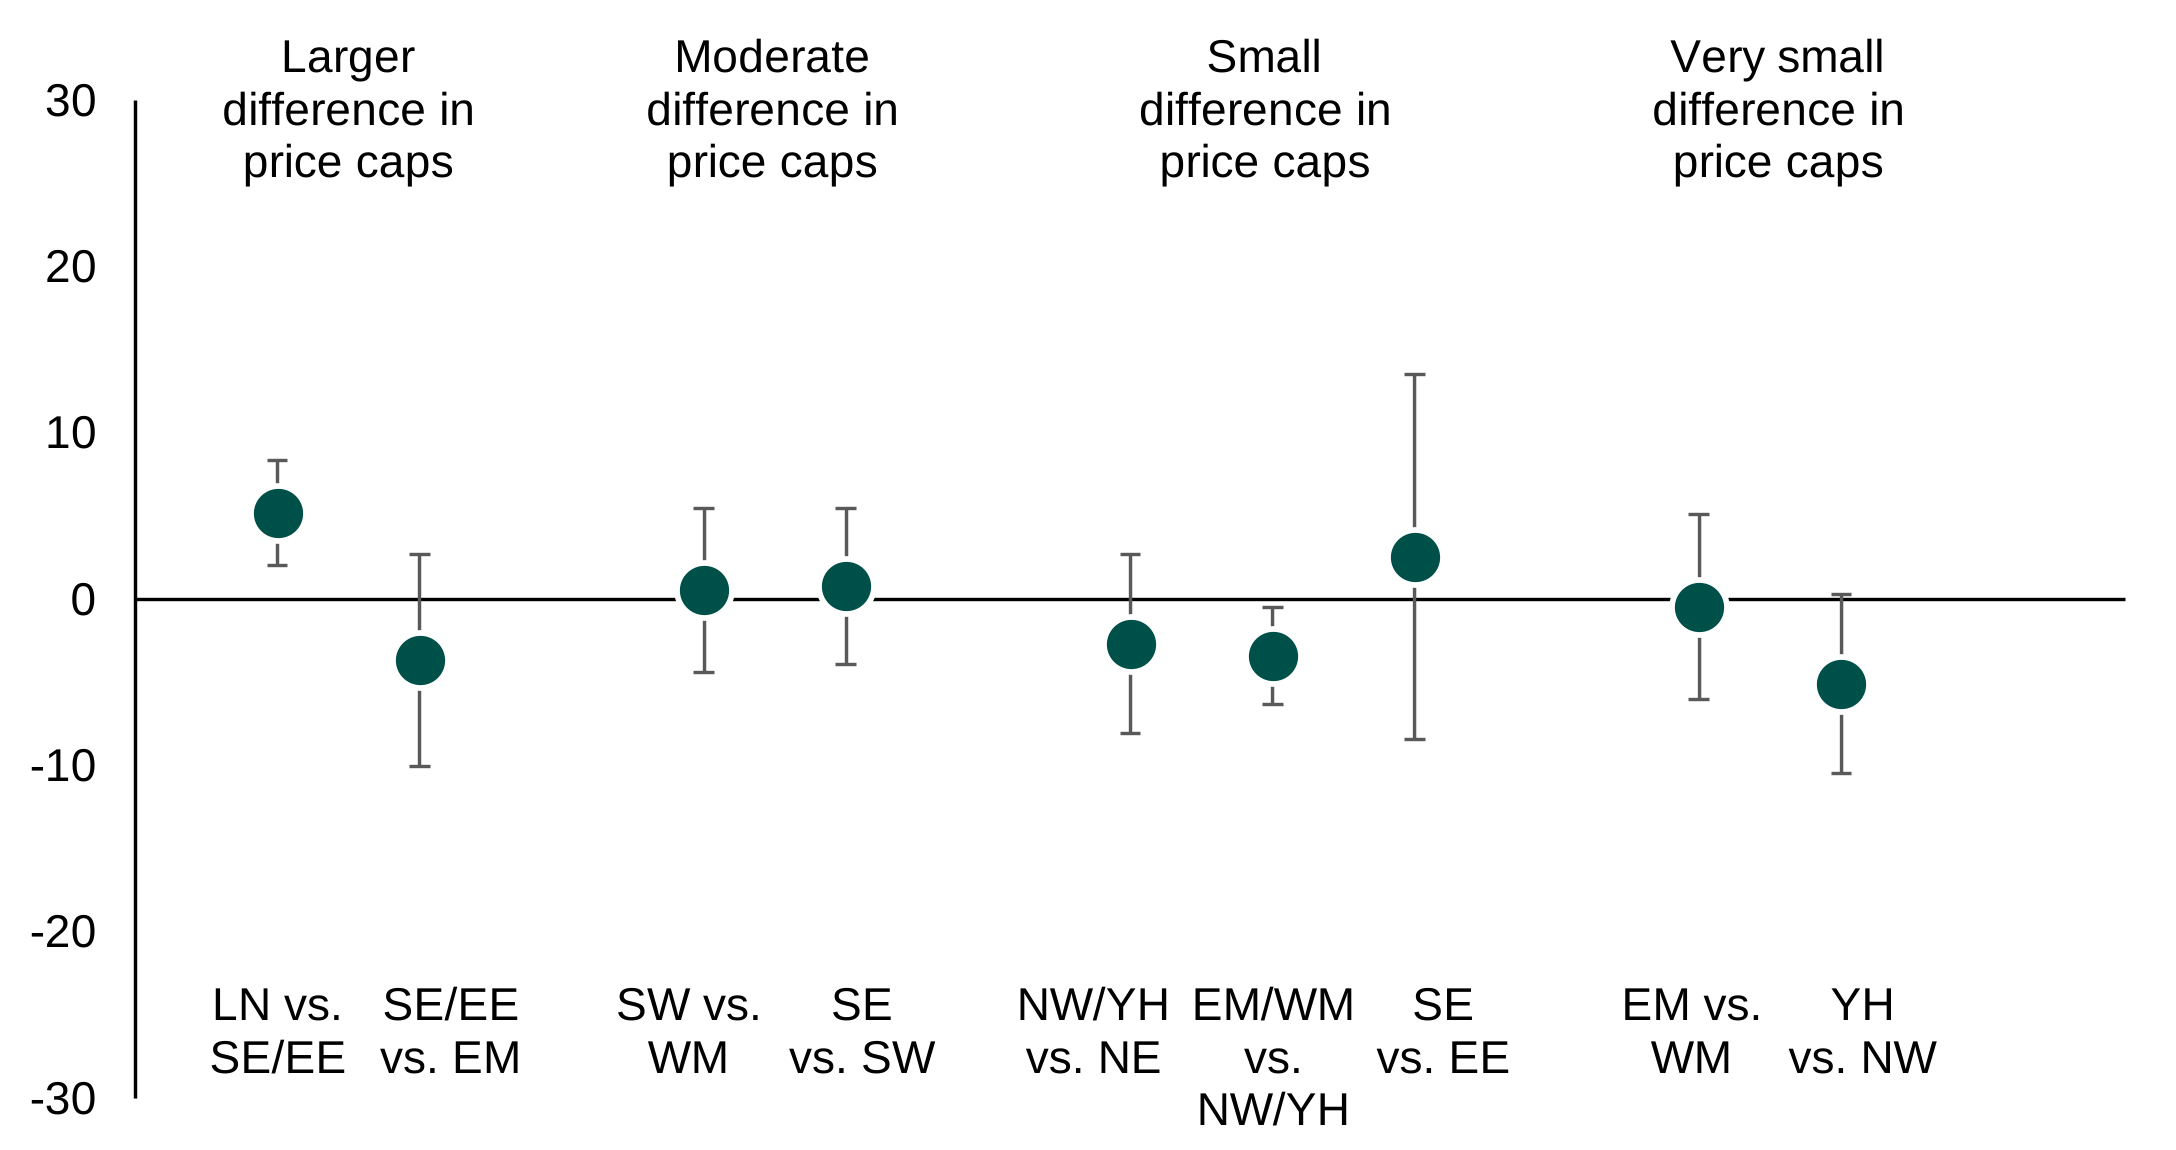
LN = London; SW = South West; SE = South East; EE = East of England; WM = West Midlands; EM = East Midlands; YH = Yorkshire and The Humber; NW = North West; NE = North East
Source: Energy Performance Certificates database
Alternative text
Dot chart showing estimated impacts grouped by size of differences in price caps: larger, moderate, small, and very small differences. The chart includes multiple regional comparisons within each group, with values plotted on a vertical scale from about -30 to 30 and a horizontal line at zero indicating no effect. Each estimate is shown with an error bar representing uncertainty.
For larger differences in price caps, one estimate is positive at around 5, while another is negative at about -4, with wide error bars for both. For moderate differences, both estimates are close to zero, slightly positive at around 0 to 1, with error bars spanning negative and positive values.
For small differences, most estimates are negative, at approximately -3 to -4, alongside one positive estimate near 3, with wide error bars indicating substantial uncertainty. For very small differences, estimates are close to zero or negative, with one near zero and another around -5, again with wide error bars.
Overall, the chart shows mixed results across groups, with no consistent pattern, and most error bars crossing or approaching zero, indicating a high level of uncertainty in the estimated effects.
These findings are corroborated by analysis of national trends. Figure 5.12 shows the change in the number of new dwellings recorded for Wales and for each region in England. This compares the annual number of new dwellings recorded during Help to Buy 2 (April 2021 to March 2023) against the annual number recorded across the previous 4 years (April 2017 to March 2021). New housing supply generally continued to increase, with the exception of London where there was little change in new housing supply at this time. As such, the introduction of regional price caps with Help to Buy 2 does not appear to have had a substantial adverse effect on new housing supply in England. Outside of London, the level of change in housing supply was similar across different English regions, indicating that the regional differences in price caps did not lead to widespread regional disparities in new housing supply.
In this way, housing supply appears to have been less responsive to the Help to Buy scheme by 2021 than when it was first introduced in 2013. As with home ownership (see section 4.5, the Help to Buy scheme was introduced in England at a point where new housing supply was at a low point following the financial crisis. Help to Buy 1 may have been an important factor in stimulating construction, leading to new housing supply recovering by 2018 to reach similar levels as prior to the financial crisis. However, after this point, the market may have recovered sufficiently to be less dependent on the support offered through the Help to Buy scheme. This could explain why the analysis found less of a response in housing supply to Help to Buy 2.
Figure 5.12: Change in average number of new dwellings recorded per ward, April 2021 to March 2023 vs. April 2017 to March 2021
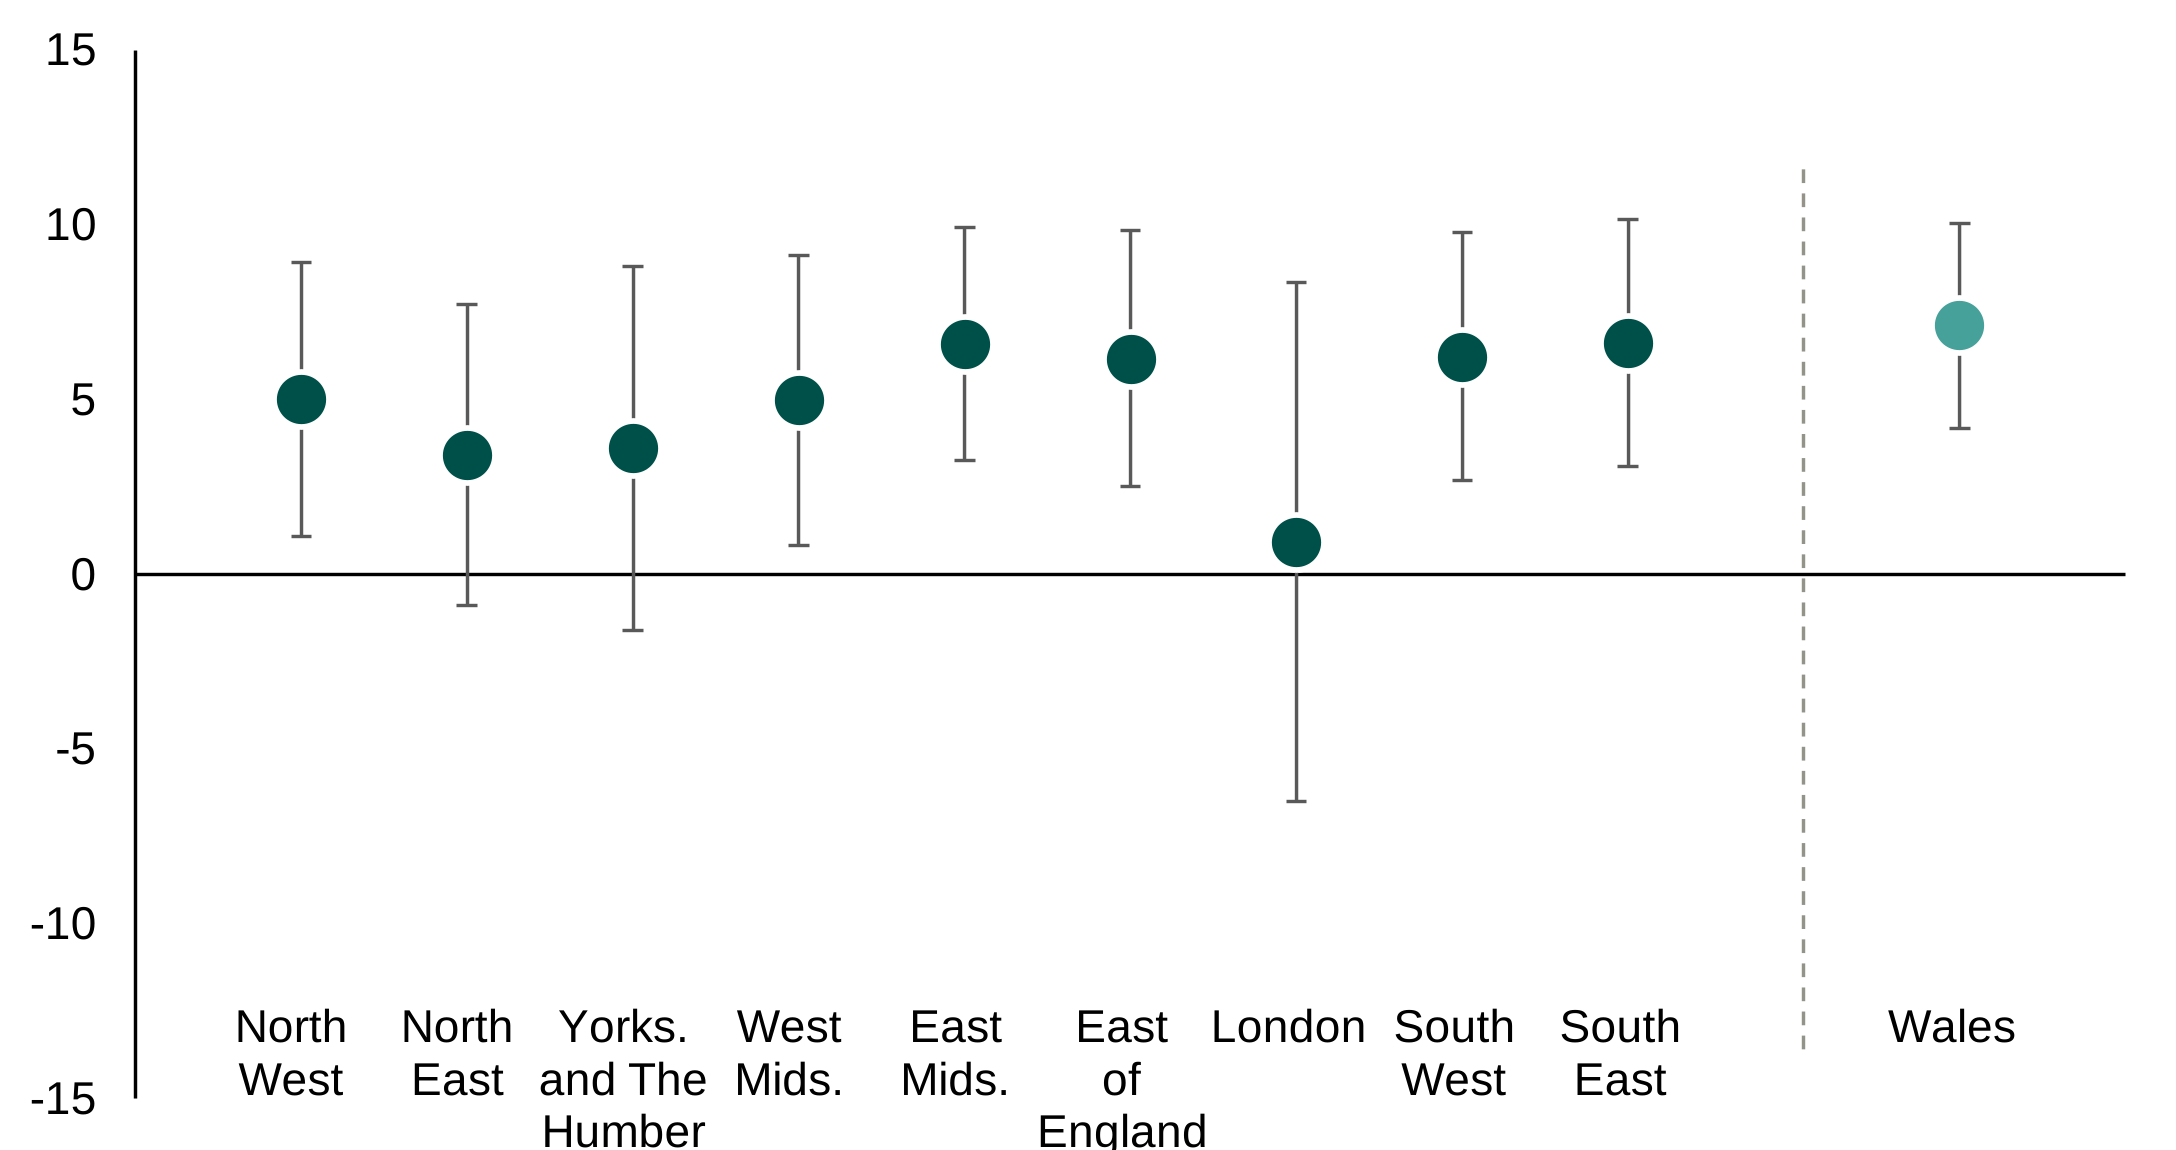
Source: Energy Performance Certificates database
Alternative text
Dot chart titled Change in average number of new dwellings recorded per ward, April 2021 to March 2023 vs. April 2017 to March 2021. The chart displays regional estimates with error bars on a vertical scale from about -15 to 15, with a horizontal line at zero indicating no change. A vertical dashed line separates England regions from Wales.
Most English regions show positive changes. The North West is around 5, North East about 3.5, and Yorkshire and the Humber around 3 to 4, all with error bars spanning slightly above and below these values. The West Midlands is around 5, East Midlands about 6 to 7, and East of England around 6, all clearly positive. London is close to 1 with a wide error bar extending below zero, indicating greater uncertainty. The South West and South East show increases of around 6 to 7.
Wales, shown separately, has a positive change of about 7, with an error bar indicating some uncertainty but remaining above zero.
Overall, most regions experienced increases in the average number of new dwellings per ward between the 2 periods, with London showing the smallest and most uncertain change.
5.6 The end of Help to Buy in England
There is no strong evidence of a negative effect on new housing supply following the end of the Help to Buy scheme in England in March 2023.
As previously shown in Figure 5.12, the number of new dwellings recorded remained relatively high in English wards close to the England/Wales border following the end of the Help to Buy scheme in England in March 2023. However, as shown in Table 5.5 below, the trends were reasonably similar on both the English and Welsh sides of the border.
Figure 5.13 shows how these findings vary depending on how much the analysis is restricted to areas close to the border. None of these analyses show a clear negative effect of the end of the Help to Buy scheme on new housing supply in these areas in England.
Table 5.5: Estimated impact of the end of the Help to Buy scheme on the annual number of new dwellings recorded in English wards within 10km of the England/Wales border, April 2023 to June 2025
| English wards within 10km of the England/Wales border | |
|---|---|
| Average number of new dwellings a year (April 2023-June 2025) | 21.0 |
| Average number of new dwellings if the trend had been the same as wards on the Welsh side of the border | 18.9 |
| Estimated average impact of Help to Buy 2 | +2.1 new dwellings a year per ward |
| 95% confidence interval | -4.5 to +8.7 |
| p-value | 0.535 |
Figure 5.13: Estimated impact of the end of the Help to Buy scheme on the annual number of new dwellings per English ward, April 2023 to June 2025
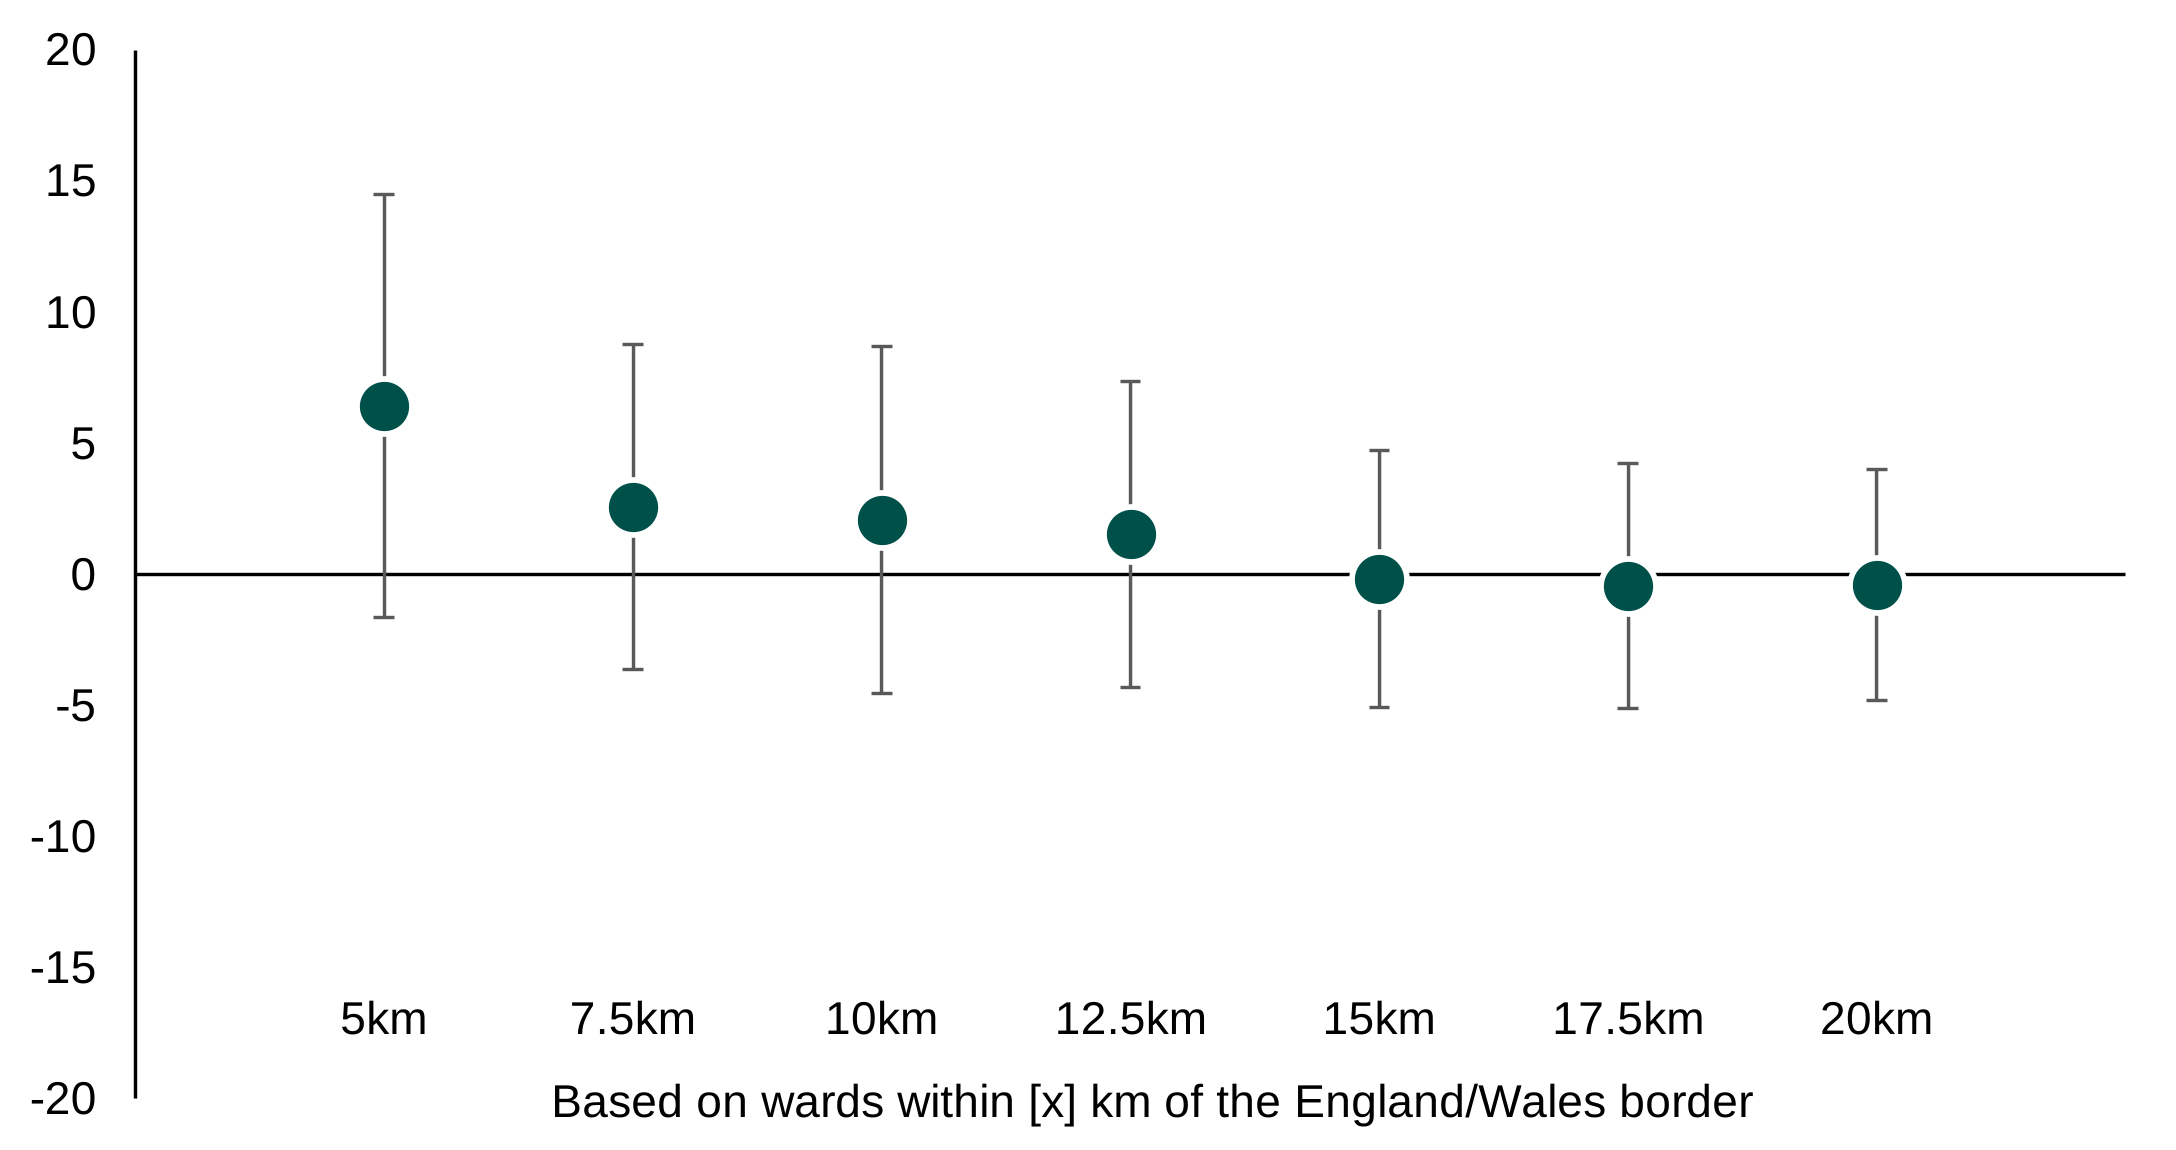
Source: Energy Performance Certificates database
Alternative text
Dot chart titled Estimated impact of the end of the Help to Buy scheme on the annual number of new dwellings per English ward, April 2023 to June 2025. The chart shows estimated effects for areas at increasing distances from the England–Wales border, from 5 km to 20 km, with a vertical scale from about -20 to 20 and a horizontal line at zero indicating no effect. Each point includes an error bar representing uncertainty.
The estimate is positive at shorter distances, around 6 to 7 at 5 km, decreasing to about 2 to 3 at 7.5 km and 10 km, and around 1 to 2 at 12.5 km. At greater distances, the estimates are close to zero or slightly negative, with values near zero at 15 km, 17.5 km, and 20 km.
Error bars are wide across all distances, often extending above and below zero, indicating substantial uncertainty. Overall, the chart suggests a positive effect closer to the border that diminishes and becomes negligible at greater distances.
When looking at national trends, the change in the number of new dwellings recorded was slightly lower across England than in Wales, although this is not statistically significant at the 95% level (Table 5.6). On average there were 1.8 fewer new dwellings a year recorded in English wards after the end of the Help to Buy scheme in England than if these areas had followed the same trend as in Wales. However, given the differences in housing markets in different parts of the country, this is not considered strong evidence of a negative effect of the closure of the Help to Buy scheme in England. It is very plausible that this difference in trends is explained by other factors outside of Help to Buy.
Table 5.6: Difference in trends of new dwellings in wards in England and wards in Wales, April 2023 to July 2025
| Wards in England | |
|---|---|
| Average number of new dwellings a year (April 2023-July 2025) | 27.1 |
| Average number of new dwellings if the trend had been the same as wards in Wales | 28.9 |
| Estimated average impact of the end of the Help to Buy scheme in England | -1.8 new dwellings a year per ward |
| 95% confidence interval | -3.6 to 0.0 |
| p-value | 0.052 |
This evidence contrasts with the evidence for impacts on housing supply following the introduction of the Help to Buy scheme. As shown in section 5.3, the start of the Help to Buy scheme was associated with a substantial increase in new housing supply, while the closure of the Help to Buy scheme does not appear to have had led to a corresponding decrease in supply.
One possibility is that the Help to Buy scheme was effective in helping the market to recover following the financial crisis. It may have played a role in stimulating further development from 2013, but this was no longer needed by 2023, when the housing market and wider economy were in a different situation.
In contrast, all developers consistently reported through qualitative interviews that demand was lower after the Help to Buy scheme closed, and that this affected their building. When the scheme closed, developers said the drop in demand meant slower sales and lower investment, slowing down development pace and fewer property completions.
“[After scheme closure], if you thought that you were going to finish developments in 3 years and now all of a sudden it might be 3.5 years, there’s quite a bit of commercial impact.” - National developer, built between 1,000 and 4,999 properties through Help to Buy scheme
However, developers reported mixed views about how far the scheme closure was responsible for changes in market demand after 2023. They pointed out that the closure of the scheme and the period immediately before it coincided with other events which affected the property market: COVID-19, corresponding inflation and increasing building costs and rising interest rates.
5.7 Investigating the scale of effects on supply
As described in section 5.3, the initial analysis suggested that the introduction of the Help to Buy scheme led to large increase in housing supply in areas close to the England/Wales border, equivalent to around 27% of new dwellings recorded in these areas over the course of Help to Buy 1. This is more than the number of Help to Buy sales in those areas, implying large spillover effects.
The study then presented the results for an alternative analysis that may better reflect the structure of the data (in particular, the fact that many wards had no or very few new dwellings recorded in a given time period). This alternative analysis also found evidence for a sizeable effect on housing supply, although somewhat smaller than the initial analysis: equivalent to around 17% of new dwellings in these areas.
These results apply to areas close to the England/Wales border and may not translate to other areas in England. Therefore, to consider the national effects of the Help to Buy scheme on housing supply, the analysis considers 4 scenarios making different assumptions about how results can be generalised from one context to another.
For the first scenario, it was assumed that the estimated effect near the England/Wales border also applied in other areas in England. The evidence supporting this scenario is that the number of new dwellings increased substantially in all regions in England, and increased faster in England than in Wales. The scale of this difference was similar to the scale of the effect around the England/Wales border. Before the Help to Buy scheme was introduced in England, the trends in England and Wales were much more similar. The study cannot rule out the possibility that the difference between England and Wales was driven by other factors outside of the Help to Buy scheme. However, the fact that similar trends were seen across all regions at the same time is indicative of more widespread effects on housing supply across England.
Similarly, the analysis of local generosity demonstrates that a similar increase in housing supply was observed over the course of the Help to Buy scheme for different types of local housing market in England. In particular, the increase in new housing supply was similar in areas that were already more expensive before the Help to Buy scheme and in areas that were less expensive. This again points towards widespread effects on new housing supply in England.
However, there is a risk that this analysis over-estimates the spillover effect in London. Therefore, in the second scenario, it uses the estimated impact from the alternative analysis, presented in section 5.3.1. As described in section 5.3.1, this approach effectively assumes less of a spillover effect in England. Again, in this scenario, the study assumes that the average effect across England is similar to the average effect in areas close to the England/Wales border.
Both of these scenarios rely on strong assumptions about the comparability of different types of area. Although there is some evidence pointing towards effects of a similar scale in other parts of England, the study cannot rule out the possibility that the difference in trends between England and Wales is explained by other factors outside of the Help to Buy scheme.
It therefore considered an alternative scenario in which the effect on housing supply seen in areas close to the England/Wales border is assumed to only apply to other areas that have similar housing markets. In areas with very different housing markets, this scenario assumes that any increase in housing supply is explained by other market factors.
For the third scenario, it used price elasticity of supply estimates from the Institute for Fiscal Studies (IFS, 2024) to scale the estimated effect across different areas.[footnote 12] For English areas within 10 km of the England/Wales border, it uses the results of the analysis of Help to Buy scheme impacts in these areas. This means it assumed that 27% of new dwellings in the EPC database in these areas were caused by the Help to Buy scheme. It applied the same effect for other areas with IFS elasticity estimates that were the same as, or higher than, those areas close to the England/Wales border.
For areas in London within 5 km of the London border, this scenario assumes the Help to Buy scheme had no effect on housing supply. This reflects the analysis of the 2016 increase in the maximum loan value in London, which found no evidence that the change led to an increase in housing supply. It also assumed no effect on housing supply in other areas where the IFS elasticity estimates are the same (or lower) as these areas close to the London border.
For areas with an elasticity estimate between these 2 points, the study proportionally scales the effect so that larger effects are assumed for areas with higher elasticity estimates, and smaller effects are assumed for areas with lower elasticity estimates.
By definition, this scenario will give a smaller estimate of the overall impact on housing supply than the first scenario. This is because it assumes that the Help to Buy scheme did not make any contribution to the increases in housing supply observed in areas with low elasticity estimates, such as much of London and the South East. However, even with these more restrictive assumptions, this scenario indicates a large effect on housing supply, equivalent to around 14% of new dwellings being attributable to the Help to Buy scheme across England.
For the final scenario, the analysis further assumed that the effects on housing supply were only realised in areas close to the England/Wales border and that there could be no spillover to homes that were not bought through the Help to Buy scheme. In practice, this means that the number of additional dwellings assumed to be attributed to the Help to Buy scheme could be no higher than the number of Help to Buy customers in these areas. This represents a very restricted scenario where the effect is heavily constrained geographically (only applying in areas close to the England/Wales border) and allowing for little interaction with the wider housing market (no spillover to homes that were not bought through the Help to Buy scheme). The study treats this scenario as an approximate lower bound on the impact of the Help to Buy scheme on new housing supply.
Table 5.7 shows the effects of the Help to Buy scheme across England as a whole based on each of these scenarios. In the judgement of the evaluation partners, the most plausible answer is that the effect of the Help to Buy scheme on housing supply was equivalent to around 15% of new dwellings recorded between March 2013 and April 2023.
The conclusion is based on the 2 central scenarios in Table 5.7, that is, the results are similar for both:
- an effect that is widespread across much of England, although with a more limited spillover effect (Scenario 2), and
- a larger spillover effect, but an impact that is limited in areas that have a different type of housing market to areas on the England/Wales border (Scenario 3).
The evaluation partners believe this is a reasonable estimate of the impact of the Help to Buy scheme balancing (1) the reasonably strong evidence the study has for an impact close to the England/Wales border, (2) the weaker evidence that effects may be reasonably widespread across England, (3) the possibility for spillover effects as new developments will have included many new homes that were not bought through Help to Buy, and (4) the risks that the increase in new housing supply further away from the England/Wales border may have been driven by factors outside of the Help to Buy scheme.
As there were around 387,000 Help to Buy loans issued across Help to Buy 1 and Help to Buy 2, an impact of this scale is equivalent to around 78% of the number of Help to Buy loans. In other words, it is estimated that for every 100 Help to Buy loans issued, developers built around 78 new homes. As discussed in section 5.3, the additional homes built by developers very likely included homes that were not bought through the Help to Buy scheme.
Table 5.7: Impact on housing supply under different scenarios
| Scenario | Assumption | Number of additional homes during Help to Buy 1 (April 2013 to March 2021) | Number of additional homes during Help to Buy 2 (April 2021 to March 2023) | Percentage of new dwellings attributed to the Help to Buy scheme |
|---|---|---|---|---|
| 1 | The impact from the initial analysis at the England/Wales border also applies throughout England | 434,000 | 140,000 | 27% |
| 2 | The impact from the alternative analysis at the England/Wales border also applies throughout England | 272,000 | 85,000 | 17% |
| 3 | The impact in places with lower estimated elasticity is smaller than in places with higher estimated elasticity | 217,000 | 70,000 | 14% |
| 4 | Effects only apply in areas close to the England/Wales border and there is no spillover to new homes which were not bought through the Help to Buy scheme | 44,000 | 12,000 | 3% |
5.8 Conclusion
The quantitative impact analysis estimates that the Help to Buy scheme supported an increase in new housing supply in England, with the strongest evidence coming from the England/Wales border analysis. The effects can be seen from the second year of the Help to Buy scheme, likely reflecting the fact that some time is needed for new developments to be completed and new homes to become available.
There is some evidence to indicate that the effects on housing supply were reasonably widespread across areas in England. The number of new dwellings recorded increased faster in each English region than in Wales following the introduction of the Help to Buy scheme. There was an especially large increase in London and the South East between 2013 and 2016. Further, the increase in new housing supply is not strongly associated with the relative affordability of different local areas. This suggests that developers built new homes in both more expensive and less expensive areas at the start of the Help to Buy scheme.
However, the study does not find evidence for a positive effect on new housing supply from the increase in the maximum loan value in London in 2016. It also does not find strong quantitative evidence that either the introduction of regional price caps with Help to Buy 2 in 2021, or the end of the Help to Buy scheme in England in 2023, had a substantial effect on new housing supply. This contrasts with the perceptions of developers, who thought that demand had slowed down since 2021, reducing their appetite to build homes. They thought that the introduction of regional price caps and the closure of the Help to Buy scheme in England had been contributory factors in that slowdown.
Together, these findings indicate that the Help to Buy scheme contributed to the recovery of new housing supply following the financial crisis in 2008, improving confidence among developers and encouraging them to progress with more housing developments. But the end of the Help to Buy scheme (and changes to the scheme in 2016 and 2021) appears to have had less of an effect on housing supply.
6. Developer performance
This chapter reports on the impact of the Help to Buy scheme on developers’ financial performance. It presents findings on the scheme’s impact on developers’ revenues, profit before tax, profit margins and market share.
6.1 Summary of key findings
The Help to Buy scheme had a positive impact on developers’ financial performance:
- impacts were identified on developer revenues, profit before tax and profit margins, with the larger sample (of small/medium sized developers) showing statistically significant results from 2016 across all the financial measures
- the results on whether scheme participation impacted developers’ market share are inconclusive and this is partly due to challenges securing adequate data on developers’ overall housing completions
6.2 Revenues
The analysis assessed the differences in revenue between developers who participated in the scheme and those who did not. Developers were matched to control for other variables that might affect results. If the Help to Buy scheme had made an impact on developer revenues, the study would be expected to find a bigger increase in revenues for developers who participated in the scheme compared to those that did not. This could be the result of them increasing the number of homes sold and/or increasing their sales prices.
Figure 6.1 shows that the differences in revenue between Help to Buy scheme developers’ and their non-Help to Buy scheme match increased throughout the Help to Buy scheme. The large confidence intervals make it difficult to quantify the exact impact. However, the results for 2016 onwards for small/medium sized developers were statistically significant and suggest the scheme contributed to increasing revenues for developers that participated.
After accounting for the differences between developers before the scheme, those who participated in the Help to Buy scheme saw on average £40 million in additional revenues in 2019 to 2021 (confidence interval +/- £30 million) (see Figure 6.1). Help to Buy scheme developers may have increased their development of homes at a faster rate than those that did not participate in the scheme. This may have led them to them increasing their revenues at a faster rate also, a pattern that aligns with evidence from the developer interviews.
On average, Help to Buy scheme developers had higher revenues before the scheme’s introduction than the developers they were matched with. This may be an important differentiation, indicating that Help to Buy scheme developers may have had a greater potential to, or likelihood of, increasing their revenues during the scheme. The sample of larger developers was relatively small, meaning this analysis had wider confidence intervals. The results show a similar pattern for larger developers although these are not statistically significant.
Figure 6.1: Differences in revenue between small/medium Help to Buy scheme developers and their matched pair
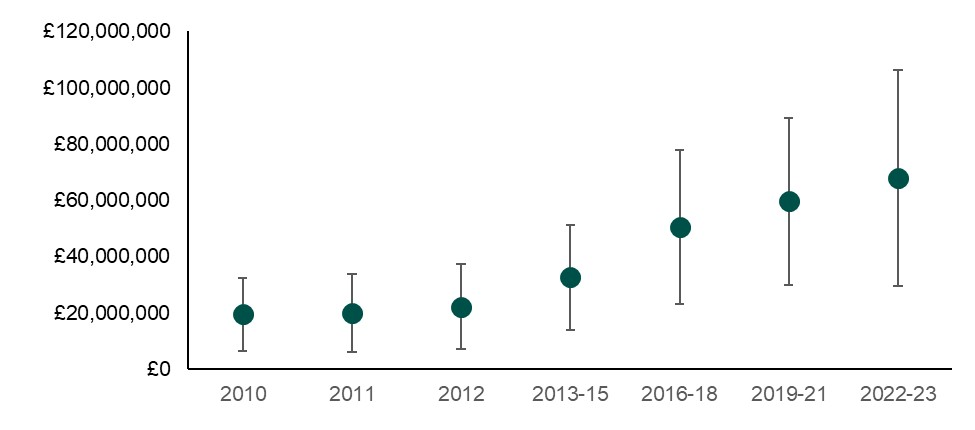
Source: Moodys: Financial Analysis Made Easy
Alternative text
Dot chart showing the difference in revenue between small and medium Help to Buy scheme developers and a matched comparison group from 2010 to 2022–23. The vertical axis ranges from £0 to £120 million. Each point includes an error bar indicating uncertainty.
The difference in revenue is positive throughout the period and increases steadily over time. It starts at around £18–20 million in 2010 and remains similar in 2011, then increases slightly to about £22 million in 2012. During the early scheme period (2013 to 2015), the difference rises to roughly £33 million.
From 2016 to 2018 onwards, the gap widens more sharply, reaching around £50 million. It continues to increase to approximately £60 million in 2019 to 2021 and peaks at around £65–70 million in 2022 to 2023.
Error bars widen in later periods, indicating greater variability, but all estimates remain well above zero.
Overall, the chart shows a consistent and growing revenue advantage for Help to Buy developers compared with the matched group, particularly after the mid-2010s.
6.3 Profit before tax
Help to Buy scheme developers saw similar levels of profit before tax in the pre-Help to Buy scheme period, compared to those who did not participate. If the scheme had had a limited impact on those that participated, it is fair to assume that the differences in average profit before tax would have remained similar throughout the scheme. However, as Figure 6.2 shows, these differences widened from 2013 onwards, reducing somewhat toward the end of the scheme. As noted with revenues, this impact could be the result of Help to Buy scheme developers building at a faster rate. However, it could also be the result of them charging higher prices and/or lowering their expenditure.
Although the confidence intervals for each time period are relatively wide, for small and medium sized developers the impacts in each period from 2013 onward are statistically significant. This suggests the scheme led to higher pre-tax profits for developers. For small and medium sized developers the scheme’s impact was greatest in 2016 to 2018, with an approximate £11 million difference between Help to Buy scheme developers and their matched case (confidence interval +/- £5 million). As above, the small number of larger developers means this analysis has wider confidence intervals. However, there is a similar pattern for larger developers although not statistically significant.
Figure 6.2: Differences in profit before tax between small/medium Help to Buy scheme developers and their matched case
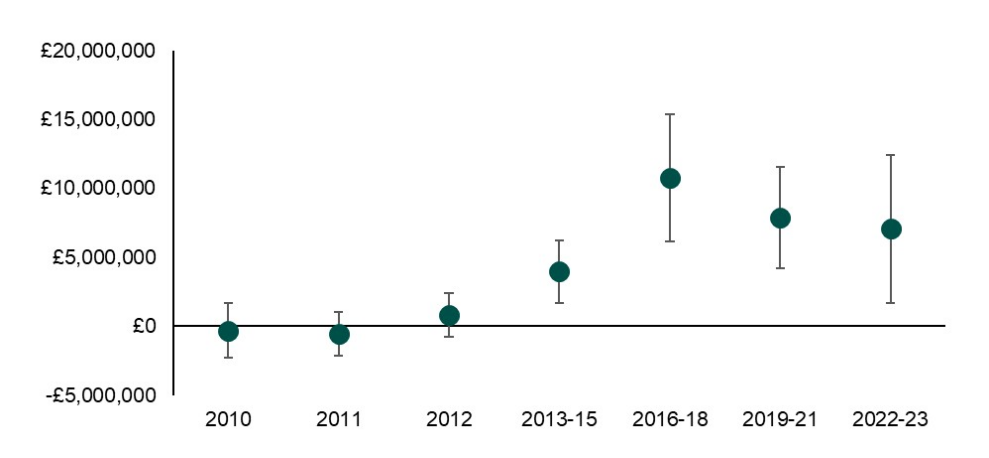
Source: Moodys: Financial Analysis Made Easy
Alternative text
Dot chart showing the difference in profit before tax between small and medium Help to Buy scheme developers and a matched comparison group from 2010 to 2022–23. The vertical axis ranges from about −£5 million to £20 million, with a horizontal line at £0 indicating no difference. Each point includes an error bar representing uncertainty.
Before the Help to Buy scheme, differences are slightly negative. In 2010 the estimate is just below zero at around −£0.5 million, and in 2011 it is slightly more negative at about −£1 million. In 2012 the estimate turns slightly positive at around £1 million, close to zero overall.
During the early scheme period (2013 to 2015), the difference increases to approximately £4 million. From 2016 to 2018, the gap widens further, reaching a peak of around £10–11 million. In later periods, the difference declines somewhat but remains positive, at roughly £7–8 million in 2019 to 2021 and about £6–7 million in 2022 to 2023.
Error bars are relatively wide, especially in later periods, but most estimates after 2013 lie above zero, indicating higher profit before tax for Help to Buy developers compared with the matched group.
Overall, the chart shows a shift from near-zero or negative differences before the scheme to a substantial positive difference in profit before tax during and after the scheme’s operation.
6.4 Profit margins
Developers participating in the Help to Buy scheme had lower profit margins before the Help to Buy scheme compared to non-Help to Buy scheme developers – albeit only statistically significantly lower in 2011. As Figure 6.3 shows, by 2016 to 2018 this relationship had reversed, with Help to Buy scheme developers increasing their profit margins at a faster rate. The results for small and medium sized developers were statistically significant through the period 2016 to 2023. For the small and medium sized developer sample, the differences between the Help to Buy scheme developers and their matched case was 7% in 2016 to 2018 (confidence interval +/- 3%) compared to the pre-Help to Buy scheme year of 2012. This accounts for the 1% difference between the matched pairs before the Help to Buy scheme being initiated. This change suggests the scheme had a positive impact on profit margins for those that participated. The small sample of larger developers means the analysis for this group has wider confidence intervals, though a similar pattern is evident.
Figure 6.3: Differences in profit margins between small/medium Help to Buy scheme developers and their matched case
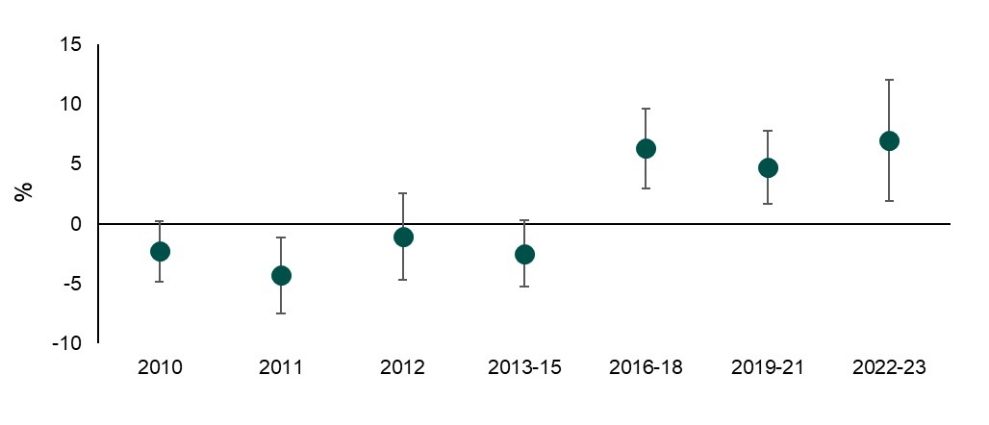
Source: Moodys: Financial Analysis Made Easy
Alternative text
Dot chart showing the percentage difference in profit margins between small and medium Help to Buy scheme developers and a matched comparison group from 2010 to 2022–23. The vertical axis ranges from about −10% to 15%, with a horizontal line at 0% indicating no difference. Each point includes an error bar representing uncertainty.
Before the introduction of Help to Buy, differences are negative. In 2010 the estimate is around −2%, falling to about −4% in 2011. In 2012 the difference is close to zero at roughly −1%.
During the early scheme period (2013 to 2015), the estimate remains negative at around −2% to −3%. From 2016 to 2018 onwards, differences turn positive, with an increase to approximately 6%. The positive gap continues at around 4 to 5% in 2019 to 2021 and rises further to about 7% in 2022 to 2023.
Error bars are wider in later periods but most post-2016 estimates lie above zero, indicating higher profit margins for Help to Buy developers relative to the matched group.
Overall, the chart shows a shift from negative or negligible differences before and during the early years of the scheme to consistently higher profit margins for Help to Buy developers in later years.
6.5 Market share
The evaluation sought to assess the Help to Buy scheme’s impact on developers’ market share, which is reflected by the proportion of new build sales nationally sold by individual developers. To do this, developers’ market share was calculated using National House Building Council (NHBC) data. This dataset includes information on individual housing completions by registered developers, enabling aggregate data to be derived for each developer per year, and across the industry nationally. Differences in market share were then assessed between the developer matched pairs before and during the Help to Buy scheme’s period.
There were a number of limitations with this approach. NHBC does not capture every new build completion, with certain developers choosing to use a different warranty provider. Whilst the data is relatively complete for those that do use NHBC, some individual properties may not be registered for specific reasons. This means that the data is incomplete, creating uncertainty about the true market share of individual developers.
To address this, the analysis is restricted to only those matched pairs where both had completion data from NHBC for each period of study. Figure 6.4 shows the differences in market share for the study’s small/medium sized developer sample. The differences between the pairs shows very little fluctuation from the base period (2005 to 2007) through the Help to Buy scheme’s implementation (2013 to 2023). Furthermore, there are large confidence intervals, with the results not being statistically significant. The findings are therefore inconclusive on the scheme’s impact on market share.
Figure 6.4: Differences in market share between small/medium Help to Buy scheme developers and their matched case
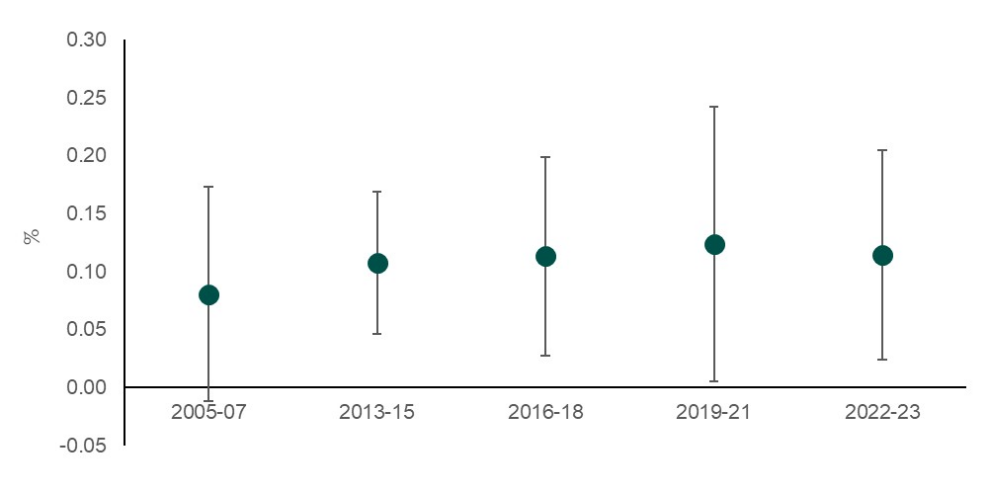
Source: Moodys: Financial Analysis Made Easy, National House Building Council
Alternative text
Dot chart showing the percentage difference in market share between small and medium Help to Buy scheme developers and a matched comparison group across 5 time periods from 2005–07 to 2022–23. The vertical axis ranges from about −0.05% to 0.30%, with a horizontal line at 0% indicating no difference. Each point includes an error bar representing uncertainty.
All estimates are positive, indicating higher market share for Help to Buy developers relative to the matched group across all periods. The difference is around 0.08% in 2005 to 2007, increasing to approximately 0.10% in 2013 to 2015 and about 0.11% in 2016 to 2018. The peak occurs in 2019 to 2021 at roughly 0.12%, followed by a slight decline to about 0.11% in 2022 to 2023.
Error bars are relatively wide for all periods and overlap considerably, indicating uncertainty in the estimates and limited statistical distinction between time periods.
Overall, the chart shows a small but consistently positive difference in market share for Help to Buy developers, with a gradual rise over time and a slight fall in the most recent period.
6.6 Conclusion
In its 2019 progress review, the NAO highlighted significant increases in profits for those developers who participated most in the Help to Buy scheme. Whilst identifying this pattern, the NAO stated that they had not been able to ‘determine what proportion of a developer’s profits directly relates to sales through the scheme’ (NAO, 2019). This chapter has sought to address such questions, exploring how scheme participation may have affected developers’ financial performance.
The analysis suggests that the Help to Buy scheme had a positive impact on those that participated. When matched with similar developers who did not engage with the scheme, those that did increased their revenues, profit before tax and profit margins at a faster rate, with these impacts being most pronounced after 2015.
7. House prices
This chapter reports findings about the impact of the Help to Buy scheme on house prices and mortgage financing. It covers findings about:
- the impact of the Help to Buy scheme on property prices, including the impact from the scheme closure
- price premiums, that is, the extent to which customers paid more for Help to Buy homes than for other similar properties
7.1 Summary of key findings
House prices were steadily increasing across all regions before the start of the Help to Buy scheme, and generally continued to increase at a similar rate over the course of the scheme. Price increases were especially large in London between 2013 and 2018.
The Help to Buy scheme is likely to have contributed to these increasing prices, especially in areas which were already relatively expensive. Average new build prices increased the most in neighbourhoods where first-time buyer (FTB) deposits were already large. In these areas, the Help to Buy scheme was relatively less ‘generous’. For example, in areas where the amount that could be borrowed through the Help to Buy scheme was small relative to the typical local FTB deposit, new build prices increased more than twice as much by the final year of the Help to Buy scheme than in more affordable areas.
As described in chapter 4, these same higher-price areas were also less likely than other (lower price) areas to see an increase in home ownership. This suggests that as prices increased, prospective FTBs were still unable to afford homes in these higher-price areas, despite access to greater finance through the Help to Buy scheme. These are areas which typically required large deposits from first-time buyers. The Help to Buy scheme may not have been enough to overcome affordability barriers in these areas and, given higher demand, may even have contributed to further price rises meaning these areas remained out of reach for many potential FTBs.
However, the evidence about the precise scale of an effect on prices in a given area is mixed. Comparing sales close to the England/Wales border, the evidence suggests that any effect of the Help to Buy scheme on prices in these areas was likely relatively small but non-zero. The econometric analysis indicates that, during Help to Buy 1, the average price of a home on the English side of the border would have been around 2% higher than it would have been if house prices had continued to follow the same trajectory as the Welsh side of the border. For example, if a home was bought for £200,000 (at any point in the Help to Buy period), this home would have cost around £196,000 in the absence of the Help to Buy scheme.
On the other hand, the effect on prices around London is unclear. Average prices increased sharply in London following the introduction of the Help to Buy scheme in 2013. However, given differences between local housing markets, the study cannot confidently say that this increase in prices was caused by the Help to Buy scheme.
The increase in the maximum loan value in London in 2016 provides an opportunity to investigate how increased access to finance affected prices in these areas. The initial analysis suggested there was little effect on prices in London from this change to the Help to Buy scheme. This finding contrasts with previous work (Carozzi and others, 2024), which estimated this change led to a large increase of around 8% in new build prices in London. The study therefore conducted additional analyses, finding that the results are sensitive to different technical choices about how the analysis is conducted, and which transactions are included or excluded.[footnote 13] Given these differences, there is some uncertainty about the scale of this price effect in London. Tentatively, the study concludes that an effect of approximately 2% is most plausible, that is, that the price of a new build home in London was around 2% higher following the increase in the maximum loan value than it would have been without this change to the scheme design. It is also noted that it is likely there were other effects of the Help to Buy scheme on prices in London before this point given the large increase in average prices in London in the first few years of the Help to Buy scheme.
There is also evidence that Help to Buy scheme customers paid slightly more for their homes than other buyers paid for similar homes that were not part of the scheme. This difference was small; this ‘Help to Buy premium’ added around 1% to the cost of homes. That is, on average, the price for a home bought through the Help to Buy scheme was around 1% more expensive than another new build property with similar characteristics in the same area. This result is similar to the ‘Help to Buy premium’ in the National Audit Office 2019 progress report (NAO, 2019).
7.2 Data sources
The analysis of house prices uses the published, transaction-level HM Land Registry Price Paid data. The Price Paid dataset records property sales in England and Wales submitted to HM Land Registry for registration. This dataset includes information about the date of transaction, the price paid, property type, whether the sale was leasehold or freehold and whether the home was a new build property.
However, this dataset has little information about the characteristics of properties. Therefore, the data was merged with property characteristics as recorded in the Energy Performance Certificates database (see Chi and others, 2021) such as property size (floor area) and energy efficiency rating.
Where relevant, the analysis also included data about the characteristics of local areas, in particular:
- local population characteristics as recorded in the 2011 Census
- information about council tax bands, published by the Valuation Office Agency
- information about local recorded crime published by police forces
- information about access to green spaces, published by the Office for National Statistics
See the accompanying technical report for more information about the data used in this analysis.
7.3 The introduction of the Help to Buy scheme in England from April 2013
In this section, the report first investigates the impacts of the Help to Buy scheme on house prices in areas close to the England/Wales border. These areas are likely to be reasonably comparable as the local housing market conditions are likely to be similar either side of the border. It describes the broader national and regional trends in house prices and then discuss evidence for how far the effect on prices varied based on the conditions of the local housing market.
7.3.1 Difference-in-discontinuities: evidence from the England/Wales border
Figure 7.1 and Figure 7.2 show the trends in average prices for (1) new build homes, and (2) all homes, for transactions in postcodes within 10 km of the England/Wales border. The trends are reasonably similar either side of the border, especially for all homes (Figure 7.2), and there is no clear evidence of a difference in average prices.
Figure 7.1: Average new build prices for transactions in postcodes within 10km of the England/Wales border, April 2010 to June 2024
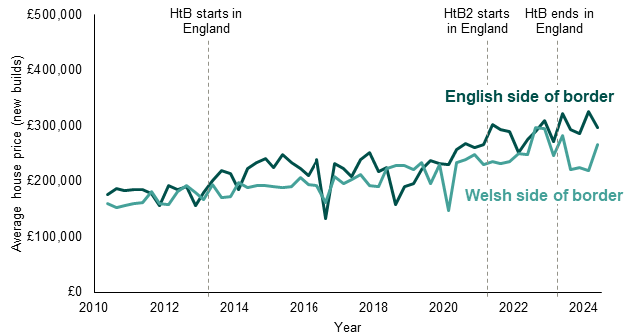
Source: Land Registry Price Paid data
Alternative text
Line chart showing average house prices for new builds on the English side of the border and the Welsh side of the border from 2010 to 2024, with values ranging from £0 to £500,000. Three vertical dashed lines mark policy milestones: the start of Help to Buy in England around 2013, the start of Help to Buy 2 around 2021, and the end of Help to Buy around 2023.
Both series trend upward over time, with the English side consistently higher than the Welsh side. The English side starts at around £180,000 in 2010, rises gradually to about £230,000 to £250,000 by the mid-2010s, and fluctuates before increasing more sharply after 2020 to a peak above £300,000 around 2022 to 2023, ending slightly lower but still near £300,000 in 2024.
The Welsh side begins lower at around £150,000 in 2010 and increases steadily to around £200,000 by the mid-2010s. It continues rising more gradually, reaching approximately £240,000 to £260,000 by the early 2020s, before dipping slightly after 2023 and ending near £260,000 in 2024.
Overall, both lines show long-term growth with some short-term fluctuations, and a widening gap between England and Wales after 2020.
Figure 7.2: Average house prices (including new builds and second-hand homes) for transactions in postcodes within 10km of the England/Wales border, April 2010 to June 2024
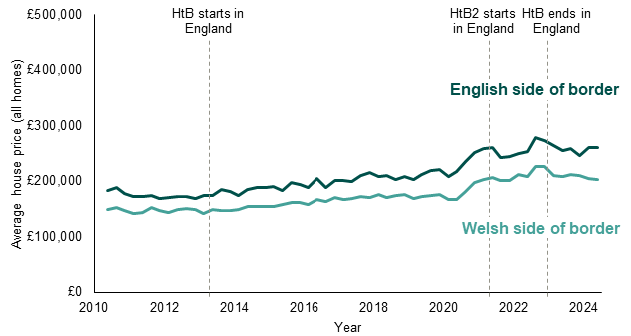
Source: Land Registry Price Paid data
Alternative text
Line chart showing average house prices for all homes on the English side of the border and the Welsh side of the border from 2010 to 2024, with values ranging from £0 to £500,000. Three vertical dashed lines mark policy milestones: the start of Help to Buy in England around 2013, the start of Help to Buy 2 around 2021, and the end of Help to Buy around 2023.
Both series show an overall upward trend, with prices consistently higher on the English side of the border. The English side starts at around £180,000 in 2010, increases gradually through the mid-2010s to about £200,000 to £220,000, then rises more sharply after 2020 to a peak near £275,000 to £280,000 around 2022 to 2023, before easing slightly to around £260,000 in 2024.
The Welsh side begins lower at approximately £150,000 in 2010 and grows steadily to around £170,000 by the mid-2010s. It continues rising to about £200,000 to £220,000 by 2022 to 2023, before flattening or slightly declining to near £200,000 by 2024.
Overall, both lines increase over time with some fluctuations, and the gap between the English and Welsh sides widens notably after 2020.
The quantitative impact analysis uses the same data, adjusting for differences in property characteristics and local housing markets. The intention is to compare changes in prices for similar properties in similar areas to isolate the direct effect of the Help to Buy scheme on prices (see Box 1).
Box 1: Adjusting for property and area characteristics
Why might adjusting for property and area characteristics change the impact estimates?
The Help to Buy scheme could have had a direct effect on house prices: a given property could be more (or less) expensive than it would have been without the Help to Buy scheme. However, as the Help to Buy scheme can affect housing supply (see chapter 5), it could also have an indirect effect on house prices by changing the types of properties available. At the same time, other factors outside of the Help to Buy scheme could also affect the mix of properties, which could then affect prices.
For example, there is some evidence that relatively more new build semi-detached homes were developed in England after the start of the scheme, and relatively fewer terraced homes. The same pattern was not seen in Wales. As semi-detached homes tend to be more expensive than terraced homes, this could lead to a greater increase in average prices in England as compared with Wales. Similarly, if new homes were built in more expensive local areas within England, that would lead to a greater increase in average prices in England.
In this way, without adjusting for property characteristics, a difference in price trends in England and Wales could be due to a combination of (1) similar properties becoming relatively more expensive in England, and (2) more expensive types of properties becoming relatively more common in England.
By adjusting for property characteristics in the impact analysis, the study has focused on the first of these, which represents the direct effect of the Help to Buy scheme on a given property’s price.
Table 7.1 shows the estimated impacts on prices of the introduction of the Help to Buy scheme in England, adjusted for property characteristics and following the difference-in-discontinuities approach described in chapter 3. This analysis is based on transactions up until the end of Help to Buy 1 (March 2021). There is no strong evidence for an effect on new build prices from the introduction of the Help to Buy scheme in these areas.
When the study extends the analysis to include second-hand homes, the analysis suggests there was a relatively small impact on average prices; this analysis suggests that overall house prices were around 2% higher in these areas in England because of the Help to Buy scheme. For example, if a home was bought for £200,000, this analysis suggests that the same home would have cost around £196,000 in the absence of the Help to Buy scheme.
Table 7.1: Estimated impact of the introduction of the Help to Buy scheme on house prices in postcodes within 10 km of the England/Wales border, April 2013 to March 2021
| New build homes | All homes | |
|---|---|---|
| Number of transactions included in the analysis | 1,979 | 78,634 |
| Average price (April 2013-March 2021) | £259,700 | £257,000 |
| Average price if the trend had been the same as on the Welsh side of the border | £266,000 | £251,900 |
| Estimated average impact of Help to Buy 1 | -2.4% | +2.0% |
| 95% confidence interval | -6.3% to +1.7% | +0.8% to +3.3% |
| p-value | 0.241 | <0.001* |
*statistically significant at the 95% level
The results above are based on transactions in postcodes within 10km of the England/Wales border. As shown in Figure 7.3, the study finds similar results if the analysis is restricted to postcodes closer to the border or extended to postcodes further away. The findings are therefore not sensitive to this choice of distance to the border used in the analysis.
Figure 7.3: Estimated impacts of the introduction of the Help to Buy scheme on house prices by distance from the England/Wales border, April 2013 to March 2021
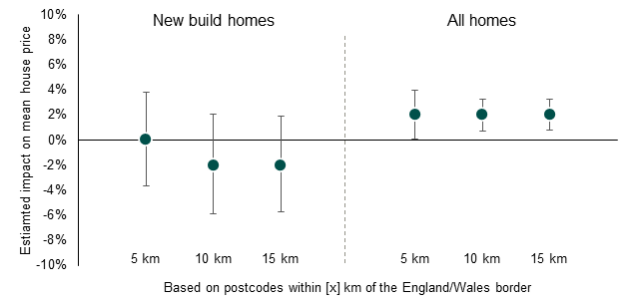
Source: Land Registry Price Paid data; Energy Performance Certificates database
Alternative text
Dot chart showing estimated impacts on mean house prices, split into 2 groups: new build homes and all homes. The vertical axis shows percentage change from −10% to 10%, with a horizontal line at 0% indicating no effect. Each estimate includes an error bar showing uncertainty. Distances from the England–Wales border are shown at 5 km, 10 km, and 15 km, with a vertical dashed line separating the 2 groups.
For new build homes, the estimate is approximately 0% at 5 km, around −2% at 10 km, and about −2% at 15 km. Error bars are wide and extend above and below zero at all distances, indicating substantial uncertainty.
For all homes, the estimates are positive and consistent, at around 2% across 5 km, 10 km, and 15 km. Error bars are narrower than for new builds and remain mostly above zero, indicating more stable positive effects.
Overall, the chart shows little or slightly negative estimated impact for new build prices, compared with a modest positive impact for all homes.
However, the results are sensitive to choices about the geographic coverage of the analysis, and this may explain the difference between the results for new builds and all homes. The difference-in-discontinuities analysis is effectively comparing the change in sales prices for similar properties within the same postcode. By analysing data at the postcode level, the study can account for differences between very localised housing markets; homes may tend to cost more in one postcode than in another nearby postcode. In doing so, it can more reliably isolate the effect of the Help to Buy scheme in these postcodes. Box 2 explains further how postcode level differences are incorporated into the analysis.
A limitation of this approach is that some postcodes are effectively excluded from the analysis. For example, there are many postcodes where there were no new build transactions recorded. As a result, the analysis of all homes is based on a bigger set of postcodes than the analysis of new builds.
As shown in Figure 7.4, this difference in geographic coverage appears to explain the discrepancy between the findings for new builds and all homes described above. When the study limits the analyses to exactly the same set of postcodes, the results are similar for both new builds and all homes.
Box 2: Exclusion of postcodes for the impact analysis
Why are some postcodes excluded from the analysis of impacts on prices?
One challenge for this analysis is that prices can vary substantially between areas; 2 homes in different areas can have very different prices even if otherwise they have very similar characteristics.
The analysis tries to account for these differences in local housing markets. Effectively, it compares the change in prices for similar properties within the same local area. For example, the analysis in Table 7.1, compares changes in prices in individual postcodes. In this way, it reflects very localised differences in housing markets, allowing the analysis to focus on the most comparable properties in the most comparable areas.
However, some areas are effectively excluded from the analysis as a result. To contribute to the estimate of the impact of the introduction of the Help to Buy scheme, an area must have at least one transaction recorded between April 2010 and March 2013 (before the Help to Buy scheme started) and at least one transaction recorded between April 2013 and March 2021 (during Help to Buy 1). Otherwise the model cannot estimate the local change in prices.
For example, the postcode CH3 6BB in Chester has 36 transactions recorded between April 2010 and March 2021. The earliest is in June 2010, and the latest is in February 2021. This means this postcode has data about sales both before and after the introduction of the Help to Buy scheme.
On the other hand, of the 36 transactions recorded in this postcode, only 8 are identified as new builds in the Land Registry Price Paid data. The latest of these new build sales was August 2011. There are no new build sales recorded in this postcode after the introduction of the Help to Buy scheme.
As a result, postcodes like this will be included in the analysis for all homes, but not for new builds. Below, the report investigates how sensitive the findings are to this aspect of the statistical analysis.
Figure 7.4: Estimated impacts of the introduction of the Help to Buy scheme on house prices in postcodes close to the England/Wales border, April 2013 to March 2021
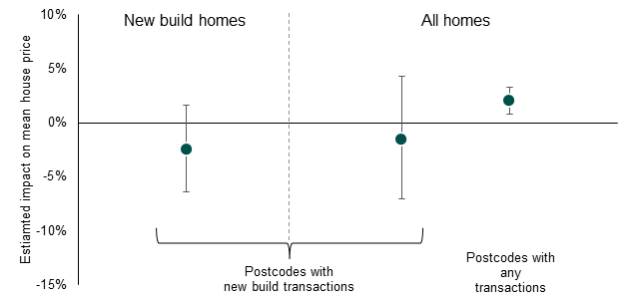
Source: Land Registry Price Paid data; Energy Performance Certificates database
Alternative text
Dot chart showing the estimated impact of the introduction of the Help to Buy scheme on mean house prices in postcodes near the England–Wales border, April 2013 to March 2021. The chart is split into 2 groups, separated by a vertical dashed line: postcodes with new build transactions and postcodes with any transactions. The vertical axis shows percentage change from about -15% to 10%, with a horizontal line at 0% indicating no effect. Each estimate includes an error bar showing uncertainty.
For postcodes with new build transactions, the estimate is negative at around -3%, with a wide error bar extending from approximately -7% to about +1%. For postcodes with any transactions, there are 2 estimates: one slightly negative at around -2% with a wide error bar spanning roughly -7% to +4%, and one positive at about +2% with a narrower error bar that remains above zero.
Overall, the chart shows mixed results, with a negative estimated impact for new build transactions and small, uncertain effects for all transactions, including one modest positive estimate.
The main analysis is based on the change of prices within postcodes to ensure it focuses on the most comparable properties in the most comparable local areas. However, this means that the analysis for new builds effectively excludes the majority of new build transactions. For example, if a new housing development is completed and assigned a new postcode, these transactions would be excluded from the analysis because that postcode would not have any sales from before the introduction of the Help to Buy scheme.
In this way, the results from the postcodes included in the analysis will not necessarily generalise well to areas not included in the analysis. The analysis therefore tested alternative models, so that it could compare results based on postcodes against those based on wider geographies (Figure 7.5):
- postcodes vary in size, with have an average of around 15 homes across the UK
- Output Areas (OAs) are slightly larger (typically 8 to 10 postcodes), with an average of approximately 125 homes
- Lower layer Super Output Areas (LSOAs) are larger again (typically 40 to 50 postcodes), with an average of approximately 650 homes
- wards are the least localised level used, with an average of approximately 3,000 homes
As shown in Figure 7.5, the choice of geographic unit makes very little difference to the results of the difference-in-discontinuities analysis when including second-hand homes. However, the results for new builds are somewhat sensitive to this choice, with larger estimated effects for wider geographic units (such as LSOAs and wards), although none of these differences are statistically significant at the 95% level.
Figure 7.5: Estimated impacts of the introduction of the Help to Buy scheme in postcodes within 10 km of the England/Wales border, April 2013 to March 2021
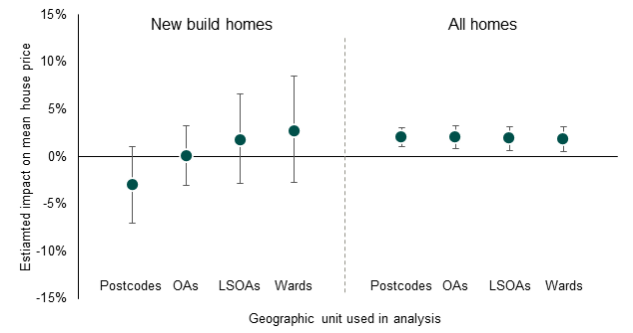
Source: Land Registry Price Paid data; Energy Performance Certificates database
Alternative text
Dot chart showing estimated impacts of the introduction of the Help to Buy scheme on mean house prices in postcodes within 10 km of the England–Wales border, April 2013 to March 2021. The chart is split into 2 sections, new build homes and all homes, separated by a vertical dashed line. The vertical axis shows percentage change from -15% to 15%, with a horizontal line at 0% indicating no effect. Each point includes an error bar showing uncertainty.
For new build homes, estimates vary by geographic unit. Postcodes show a negative effect of around -3%, while output areas are close to 0%. Lower-layer super output areas show a positive effect of about 1 to 2%, and wards show a larger positive effect of around 2 to 3%. Error bars are wide, particularly for larger geographic units, and often span both negative and positive values.
For all homes, estimates are consistently positive across all geographic units. Values are around 2% for postcodes, output areas, lower-layer super output areas, and wards, with relatively narrow error bars that remain above zero.
Overall, the chart shows mixed and uncertain effects for new build homes, but small, consistent positive impacts for all homes regardless of geographic unit.
Broadening the geographic level of the analysis enables coverage of more transactions. Table 7.2 shows how many transactions are included with the analysis at different geographic levels. For example, an analysis based on postcodes effectively only covers 17% of new build transactions during this timeframe.
Table 7.2: Number of transactions included in analyses at different geographic levels for areas within 10 km of the England/Wales border
| Geographic unit | New builds | All homes |
|---|---|---|
| Postcodes | 1,979 (17%) | 78,634 (67%) |
| Output Areas (OAs) | 3,482 (30%) | 107,721 (92%) |
| Lower layer Super Output Areas (LSOAs) | 6,782 (59%) | 110,257 (94%) |
| Wards | 8,956 (78%) | 110,261 (94%) |
| Total number of transactions | 11,476 (100%) | 117,651 (100%) |
However, while wider geographic units cover more transactions, there is also a greater risk that the analysis is not fully accounting for differences between local housing markets. For example, there is a risk that there are differences between typical prices in different areas within a given ward that are not captured by the variables about property and area characteristics included in the analysis.
The evaluation partners did not identify a plausible mechanism by which the Help to Buy scheme would affect overall house prices but not new build prices. Therefore, while the evidence about price effects for new builds in these areas is not conclusive, it is plausible that the Help to Buy scheme led to a modest increase in prices.
7.3.2 Difference-in-differences: national trends
As described above, the difference-in-discontinuities analysis around the England/Wales border does not find evidence for a substantial effect on prices in these areas. However, this does not necessarily rule out larger price effects in other parts of England.
In this section, the study first describes the trends in new build prices in England and Wales. It then considers the extent to which these trends may indicate effects of the Help to Buy scheme.
Figure 7.6 shows the trends in average new build prices in England and Wales. Prices increased steadily in each English region as well as in Wales. This increase started before the beginning of the Help to Buy scheme and, except for London, there is no obvious change in the trend following the start of the Help to Buy scheme or later changes to the scheme. The increase in average new build prices was especially steep in London from 2013 to 2018, starting shortly after the beginning of the Help to Buy scheme.
Figure 7.6: Average new build prices for transactions in English regions and Wales, April 2010 to December 2023
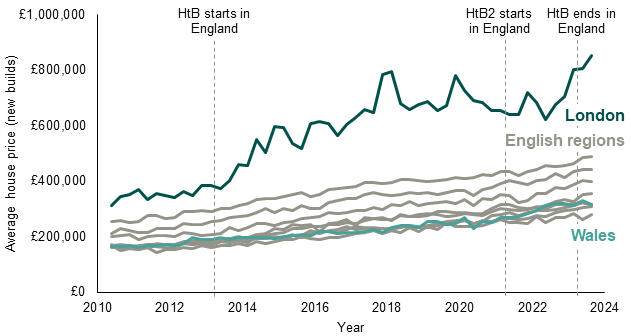
Source: Land registry Price paid data
Alternative text
Line chart showing average new build house prices for English regions and Wales from April 2010 to December 2023, with values ranging from £0 to £1,000,000. Three vertical dashed lines mark policy milestones: the start of Help to Buy in England around 2013, the start of Help to Buy 2 around 2021, and the end of Help to Buy around 2023.
London has the highest prices throughout, starting at around £300,000 in 2010 and rising sharply with fluctuations to peaks of around £750,000 to £800,000 in the late 2010s and early 2020s, ending above £800,000 by 2023.
Other English regions are shown as multiple grey lines, all lower than London but generally increasing over time. These start at around £150,000 to £250,000 in 2010 and rise steadily to approximately £350,000 to £450,000 by 2023, with moderate variation between regions.
Wales remains at the lower end, starting near £150,000 in 2010 and increasing gradually to around £300,000 to £320,000 by 2023, with some fluctuations.
Overall, all areas show an upward trend in new build prices over time, with London diverging strongly from other regions, particularly after the mid-2010s.
Table 7.3 shows the average difference in trends between England and Wales for both new build transactions and for all homes, adjusted for differences in property characteristics. On average, homes (including second-hand homes) were 10% more expensive in England after the Help to Buy scheme started than they would have been had prices in England followed the same trajectory as prices for similar properties in Wales. In other words, a home in England that cost £300,000 would have cost approximately £270,000 had the price trends followed the same trajectory as in Wales.
The difference for new builds was smaller (3% higher than if postcodes in England had followed the same trajectory as postcodes in Wales) although, as shown in Figure 7.7 this result is sensitive to whether the analysis is based on postcodes or larger geographies.
Table 7.3: Difference between England and Wales in average change in house prices following the introduction of the Help to Buy scheme, April 2013 to March 2021
| New build homes | All homes | |
|---|---|---|
| Average price (April 2013-March 2021) | £332,400 | £291,400 |
| Average price if the trend had been the same in England as in Wales | £323,600 | £264,400 |
| Estimated difference in trends following the introduction of Help to Buy 1 | +2.7% | +10.2% |
| 95% confidence interval | +0.9% to +4.6% | +9.5% to +10.9% |
| p-value | <0.001* | <0.001* |
*statistically significant at the 95% level
Figure 7.7: Estimated difference in average house price trends between England and Wales, April 2014 to March 2021 vs. April 2010 to March 2013
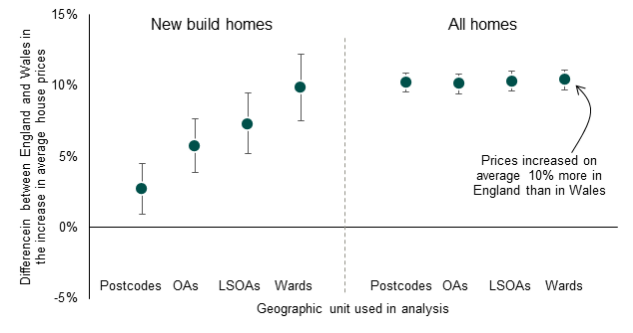
Source: Land registry Price paid data
Alternative text
Dot chart showing the estimated difference in average house price trends between England and Wales, comparing April 2014 to March 2021 with April 2010 to March 2013. The chart is split into 2 sections, new build homes and all homes, separated by a vertical dashed line. The vertical axis shows percentage differences from about -5% to 15%, with a horizontal line at 0% indicating no difference. Each estimate includes an error bar showing uncertainty.
For new build homes, all estimates are positive and increase with larger geographic units. Postcodes show an increase of around 2 to 3 percentage points, output areas around 5 to 6, lower-layer super output areas about 7 to 8, and wards close to 10. Error bars are moderate in size and remain above zero, indicating a consistent positive difference.
For all homes, estimates are consistently positive and tightly clustered around 10% across all geographic units, including postcodes, output areas, lower-layer super output areas, and wards. Error bars are relatively small and remain above zero for all estimates.
A note on the chart indicates that house prices increased on average about 10% more in England than in Wales over the later period. Overall, the chart shows a clear and consistent pattern of stronger house price growth in England compared with Wales.
This difference between trends in England and Wales was partly, but not entirely, driven by London. Figure 7.8 shows how these trends varied by region for new build homes. It shows how much higher average new build prices were in each region over the course of Help to Buy 1 compared with the previous 3 years, adjusting for differences in property characteristics. For example, the average price in London over Help to Buy 1 (April 2013 to Match 2021) was around 40% higher than the average price for a similar property in London in the 3 years before the Help to Buy scheme (April 2010 to March 2013).
The increase in England was especially large in London, followed by the South East, East of England and East Midlands. New build prices increased less in the north of England than in other regions.
Figure 7.8: Average difference in new build house prices, April 2013 to March 2021 vs. April 2010 to March 2013
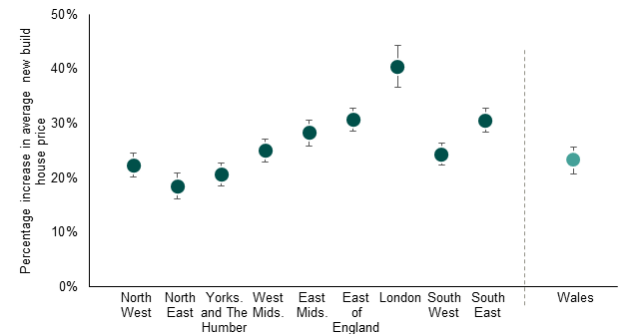
Source: Land Registry Price Paid data; Energy Performance Certificates database
Alternative text
Dot chart showing the percentage increase in average new build house prices, comparing April 2013 to March 2021 with April 2010 to March 2013, across English regions and Wales. The vertical axis ranges from 0% to 50%, with each region represented by a point and an error bar indicating uncertainty. A vertical dashed line separates English regions from Wales.
All regions show positive increases in new build prices over the later period. Among English regions, London has the largest increase at around 40%.
The East of England and South East also show relatively strong growth, at approximately 31% each. The East Midlands is around 28%, and the West Midlands about 25%.
Northern regions show smaller increases: the North West is around 22–23%, Yorkshire and the Humber about 21%, and the North East the lowest at roughly 18–19%. The South West shows a moderate increase of about 24–25%.
Wales, shown separately, has an increase of around 23%, similar to the North West and South West. Error bars are relatively narrow across regions, indicating modest uncertainty.
Overall, the chart shows that new build house prices increased across all regions, with the largest growth in London and the smallest in the North East, and Wales experiencing mid-range growth compared to English regions.
However, interpreting these differences in trends as being caused by the Help to Buy scheme would require very strong assumptions about the comparability of different areas. Differences between local housing markets could lead to different trends in different places even without the Help to Buy scheme. In other words, the risk for the difference-in-differences analysis is that comparisons between areas may not be fair: that the change in prices in Wales does not accurately represent what the change would have been in different areas in England without the scheme.
Figure 7.9 and Figure 7.10 show how the difference-in-differences analysis breaks down by quarter.[footnote 14] For new builds (Figure 7.9), these are reasonably close to zero before 2013/14, suggesting that the underlying trends were reasonably similar before the Help to Buy scheme, adjusting for differences in property characteristics. There is then a steady divergence from 2013 to 2017, with new build prices increasing faster in England than in Wales.
Figure 7.9: Estimated difference in average new build house prices between England and Wales by quarter, April 2010 to March 2021
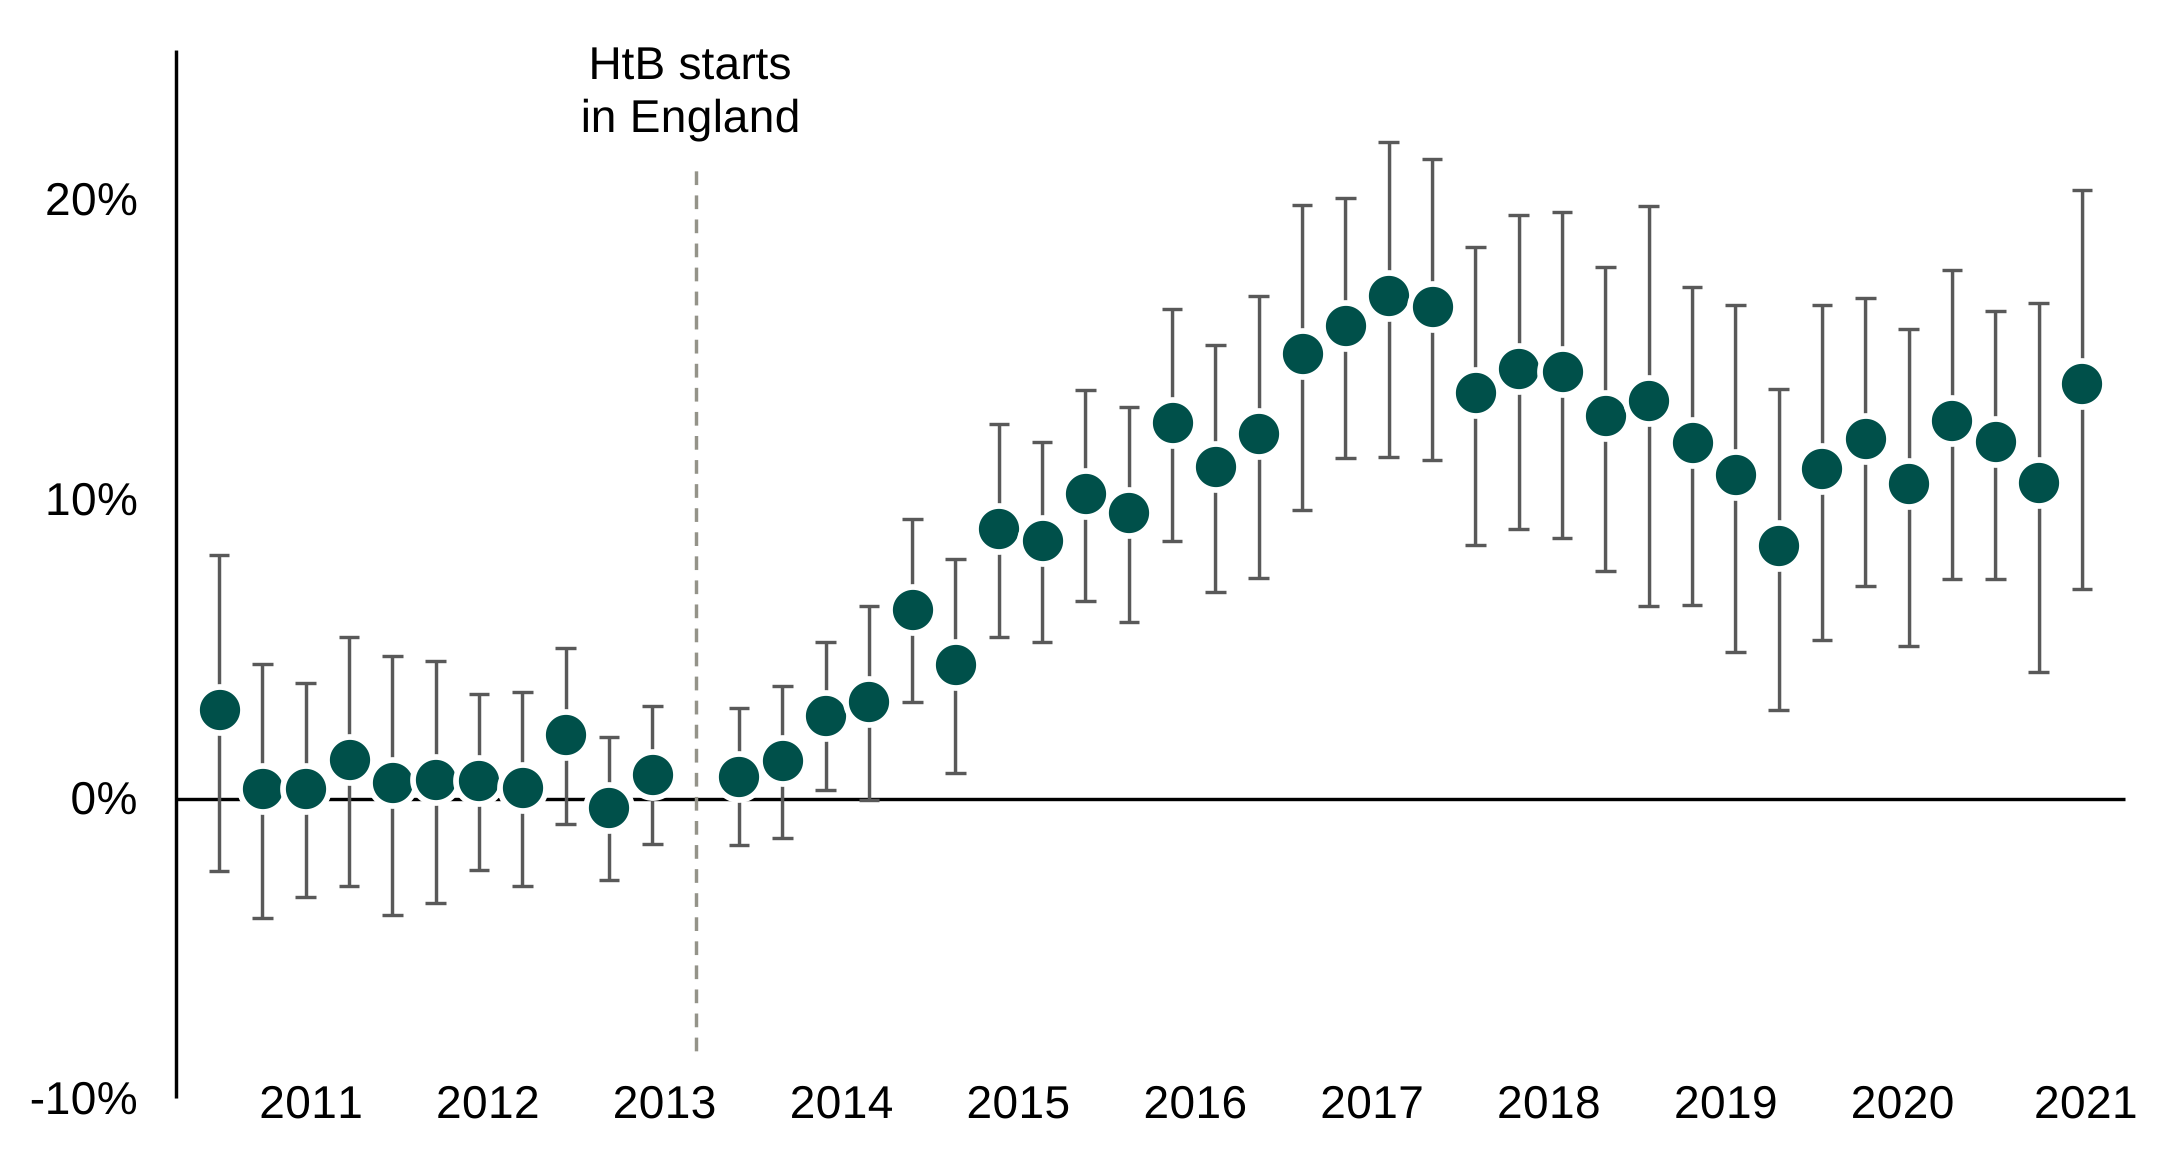
Source: Land registry Price paid data
Alternative text
Dot chart with error bars showing estimated annual impacts from 2010 to 2021, with a vertical dashed line marking the start of Help to Buy in England around 2013 and a horizontal line at zero indicating no effect. The vertical axis ranges from about -10 to 25.
Before the policy, estimates fluctuate around zero, with several negative values between about -4 and -1 in 2010 to 2011, followed by small positive values of around 1 to 3 in 2012. Around the start of the policy in 2013, estimates are close to zero, with slight positive and negative values.
From 2014 onwards, estimates become consistently positive and increase over time. Values rise from around 2 to 4 in 2014 to approximately 6 to 10 by 2015 to 2016, then continue upward to around 10 to 12 in 2017.
The peak occurs around 2018 to 2019, with values reaching roughly 12 to 16. After 2019, estimates remain positive but begin to moderate slightly, generally ranging between about 10 and 14 through 2020 and 2021, with one notable point near zero around 2020.
Error bars are present for all points and are relatively wide, especially in later years, but most estimates after 2014 lie above zero, indicating sustained positive effects following the introduction of Help to Buy.
However, for all homes (Figure 7.10), the underlying trends are already quite different in England and Wales before the Help to Buy scheme started (the values in Figure 7.10 before the start of the Help to Buy scheme are consistently lower than zero, indicating a difference in trends even before the start of Help to Buy). This demonstrates that there were other factors outside of the Help to Buy scheme which had a substantial effect on prices, and that the effects of these factors varied between different parts of the UK.
Figure 7.10: Estimated difference in average house prices between England and Wales by quarter, April 2010 to March 2021
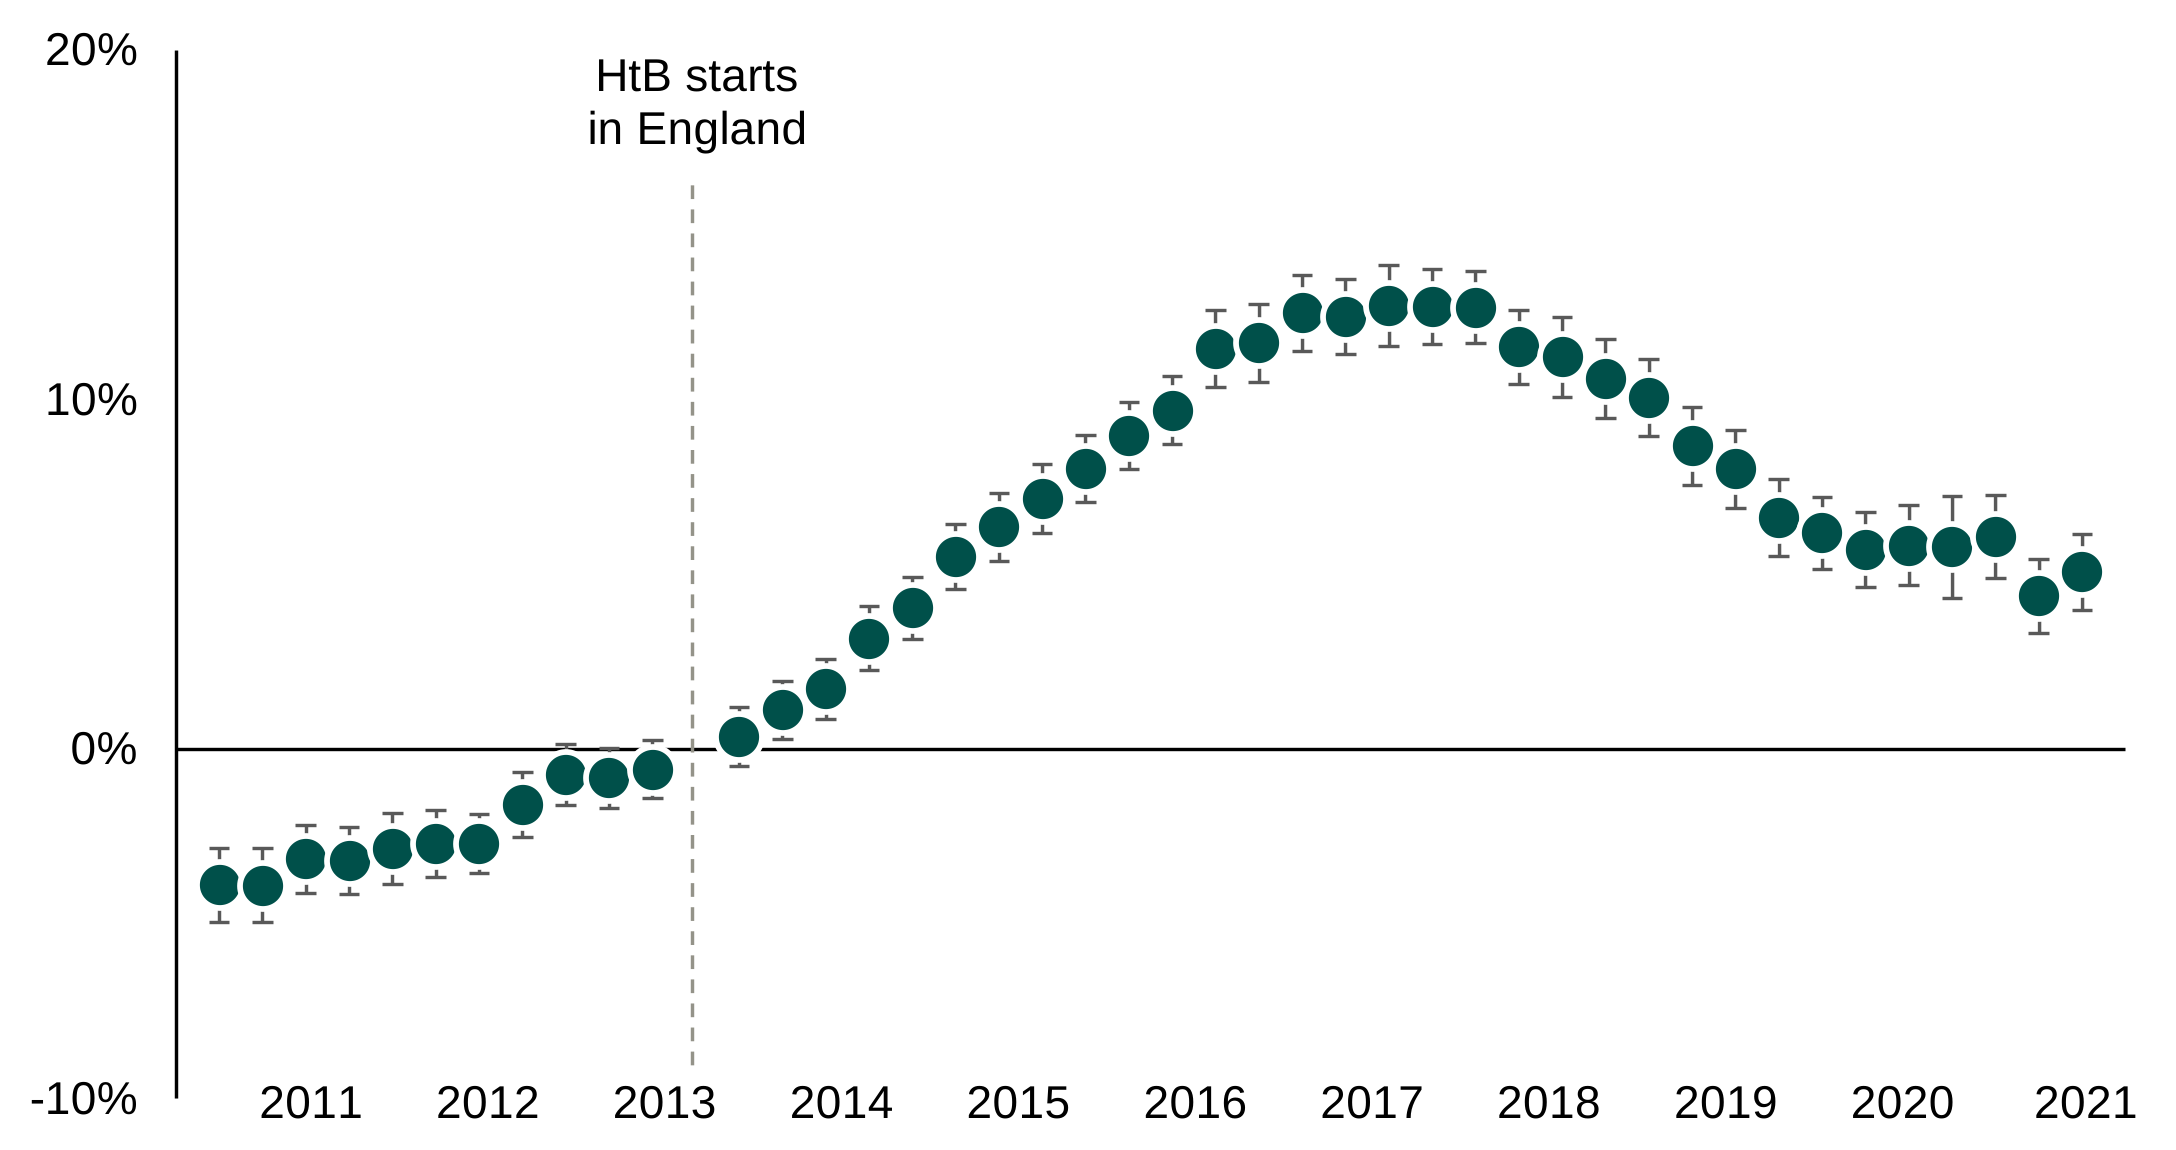
Source: Land registry Price paid data
Alternative text
Dot chart with error bars showing estimated annual impacts from 2010 to 2021, with a vertical dashed line marking the start of Help to Buy in England around 2013 and a horizontal line at zero indicating no effect. The vertical axis ranges from about -10 to 25.
Before the policy, estimates fluctuate around zero, with several negative values between about -4 and -1 in 2010 to 2011, followed by small positive values of around 1 to 3 in 2012. Around the start of the policy in 2013, estimates are close to zero, with slight positive and negative values.
From 2014 onwards, estimates become consistently positive and increase over time. Values rise from around 2 to 4 in 2014 to approximately 6 to 10 by 2015 to 2016, then continue upward to around 10 to 12 in 2017.
The peak occurs around 2018–2019, with values reaching roughly 12 to 16. After 2019, estimates remain positive but begin to moderate slightly, generally ranging between about 10 and 14 through 2020 and 2021, with one notable point near zero around 2020.
Error bars are present for all points and are relatively wide, especially in later years, but most estimates after 2014 lie above zero, indicating sustained positive effects following the introduction of Help to Buy.
This analysis suggests that it is likely that the introduction of the Help to Buy scheme in England contributed to the increase in new build prices in places such as London. However, there are also other factors influencing prices at the same time which the analysis cannot fully account for. The effect on prices including second-hand homes is unclear as the trends were already diverging before the start of the Help to Buy scheme.
Developers also reported that events in the wider economy were at least as influential as the Help to Buy scheme on house prices, and that second-hand house prices increased too. Lenders did not share one simple view about the factors behind house price change but described increased demand affecting prices, greater availability of affordable homes contributing to increased land value and builders’ increased confidence leading to them “putting up prices”.
“There’s no doubt it helped by bringing more buyers into the market and therefore will have affected demand and price. But it’s not the most fundamental thing.” - National developer, built 5,000 to 9,999 properties through Help to Buy scheme
7.3.3 Difference-in-generosities: local housing market conditions
The evidence from the England/Wales border (difference-in-discontinuities) suggests that, if there was an effect of the introduction of the Help to Buy scheme in areas close to the border, it was likely fairly small. The evidence from national trends (difference-in-differences) suggests that the Help to Buy scheme may have contributed to the large increase in prices seen in some areas, especially London.
In this section, the report describes the findings from the analysis of local ‘generosity’, exploring how changes in house prices were associated with different types of local housing market over the course of the Help to Buy scheme.
From this analysis, it is indicated that prices for new build homes increased more in areas that were already less affordable before the Help to Buy scheme. A one point difference in the measure of local ‘generosity’ was associated with just under a one percentage point difference in prices. These results are consistent if excluding Wales and London. In other words, a very similar relationship holds for the English regions.
This relationship is illustrated in Table 7.4 for 3 example areas at the start of the Help to Buy scheme:
- a ‘high generosity’ area (in the top 10% of wards by this generosity measure) in which the amount that could be borrowed through the Help to Buy scheme was 7.5 times a typical local FTB deposit
- a ‘medium generosity’ area (approximately the median ward on this generosity measure) in which the amount that could be borrowed through the Help to Buy scheme was 4 times a typical local FTB deposit
- a ‘low generosity’ area (in the bottom 10% of wards by this generosity measure) in which the amount that could be borrowed through the Help to Buy scheme was 1.5 times a typical local FTB deposit
For each of these areas, the analysis shows how the average price for a new build home increased over one year following the start of the Help to Buy scheme, accounting for differences in property characteristics. The price for a new build home increased by about 7% in the low generosity area, while the price for a new build home in the high generosity area increased by less than 2%.
Table 7.4: Illustration of relationship between new build house price trends and local Help to Buy generosity
| High generosity | Medium generosity | Low generosity | |
|---|---|---|---|
| Median FTB deposit (2012/13) | £16,000 | £30,000 | £80,000 |
| Maximum Help to Buy equity loan (2013/14) | £120,000 | £120,000 | £120,000 |
| Help to Buy ‘generosity’ | 7.5 | 4.0 | 1.5 |
| Estimated average new build price in April 2013 | £175,100 | £190,400 | £291,000 |
| Estimated average new build price in April 2014 | £177,900 | £199,000 | £310,400 |
| Increase in average new build price | +1.6% | +4.5% | +6.7% |
Similarly, Figure 7.11 shows how average prices changed in different areas based on the local generosity of the Help to Buy scheme over the course of Help to Buy 1 and Help to Buy 2. While ‘low generosity’ areas were already less affordable before the Help to Buy scheme, the gap widened substantially, with the fastest price increases in these less affordable areas.
Figure 7.11: Average price for new build homes in England by generosity of area (adjusted for property characteristics, excluding London and Wales), April 2010 to March 2023
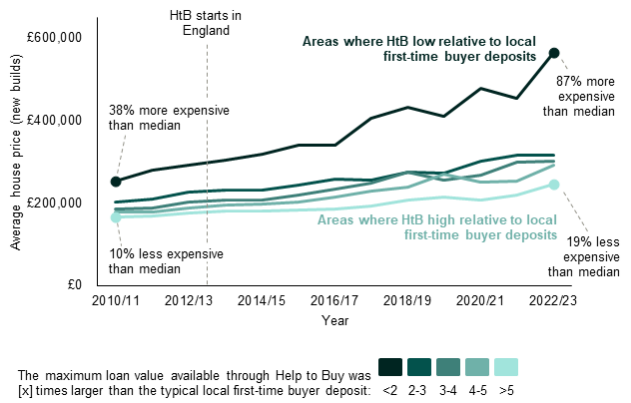
Source: Land Registry Price Paid data; Energy Performance Certificates database; UK Finance Regulated Mortgage Survey
Alternative text
Line chart showing the average price of new build homes in England (excluding London and Wales) from April 2010 to March 2023, grouped by the generosity of Help to Buy relative to local first-time buyer deposits. The vertical axis ranges from £0 to about £600,000. A vertical dashed line marks the start of Help to Buy in England around 2013.
Multiple lines represent areas with different levels of generosity, measured by how many times larger the maximum loan value is compared to a typical deposit. All groups show rising prices over time, but levels differ significantly.
Areas where Help to Buy is low relative to deposits have the highest prices throughout. These start at around £250,000 in 2010 to 2011 (about 38% above the median) and increase steadily, with fluctuations, reaching nearly £600,000 by 2022 to 2023 (around 87% above the median).
Areas where Help to Buy is high relative to deposits have the lowest prices. These start at about £160,000 in 2010 to 2011 (around 10% below the median) and rise gradually to approximately £240,000 to £260,000 by 2022 to 2023 (around 19% below the median).
Intermediate groups fall between these extremes, with steadily increasing prices and relatively stable gaps between groups over time.
Overall, the chart shows sustained price growth across all areas, with consistently higher prices in areas where Help to Buy is less generous relative to local deposits, and a widening gap between the highest- and lowest-priced groups over time.
Box 3: How to read Figure 7.11
Each ward in England was sorted into 1 of 5 categories based on the measure of the local ‘generosity’ of the Help to Buy scheme: the ratio between the amount that could be borrowed through the Help to Buy scheme and the size of typical first-time buyer deposits.
The graph shows an estimate of average house prices for these different groups, after adjusting for property characteristics.
The first (darkest) line represents the wards where this measure of generosity was lowest. In these areas, the amount that could be borrowed through the Help to Buy scheme was less than twice a typical first-time buyer deposit in the same areas. Examples of wards in this group are some wards in central Oxford and wards in rural areas outside Chester.
The last (lightest) line represents the wards where this measure was highest. In these areas, the amount that could be borrowed through the Help to Buy scheme was more than 5 times a typical first-time buyer deposit in the same area. Examples of wards in this group are some wards in central Stoke-on-Trent, and towns and rural areas around Durham.
Areas with ‘low generosity’ were already more expensive before the start of the Help to Buy scheme. However, the gap increased so that new build homes in these wards were much more expensive than other areas by the time the Help to Buy scheme closed in March 2023.
To make this graph easier to interpret, the study has excluded wards in London and Wales. This is because the increase in the maximum loan value in London and the introduction of the Welsh scheme affect the relative generosity of support in those areas. However, the broad pattern is similar if these areas are included.
In combination with the findings about home ownership (see chapter 4), the study finds that (1) areas which were already less affordable before the Help to Buy scheme experienced the fastest increases in prices over the course of scheme, and (2) these areas also saw less of an increase in the number of FTB mortgage sales than other areas.
These findings are consistent with the idea that the scheme contributed to higher prices in some areas where demand was already high, making them less affordable for FTBs. On the other hand, in other areas where there was less demand pressure the scheme did not have such an effect on prices.
These findings also align with developers’ perspectives on how house prices reflect supply constraints. In line with economic theory around supply and demand, they reported in interviews that the house price growth they witnessed was partially a result of housing supply not keeping pace with high demand, and customer competition driving up prices.
7.4 The increase in the maximum loan value in London from February 2016
In this section, the report investigates the effects of the increase in the maximum loan value on housing supply in London.
7.4.1 Difference-in-discontinuities: evidence from the London border
Figure 7.12 and Figure 7.13 show the trends in average prices for (1) new builds and (2) all homes in postcodes within 5 km of the London border. Although there is a faster increase in prices inside London for new build homes, this starts before the increase in the maximum loan value in London from February 2016.
Figure 7.12: Average new build prices for transactions in postcodes within 5km of the London border, April 2010 to December 2023
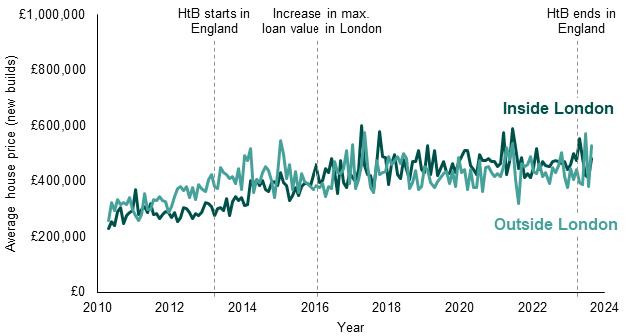
Source: Land Registry Price Paid data; Energy Performance Certificates database
Alternative text
Line chart showing average new build house prices for transactions in postcodes within 5 km of the London border from April 2010 to December 2023. Two lines compare Inside London and Outside London, with values ranging from £0 to £1,000,000.
Three vertical dashed lines mark policy milestones: the start of Help to Buy in England around 2013, an increase in the maximum loan value in London around 2016, and the end of Help to Buy around 2023.
Both series show an overall upward trend with considerable short-term fluctuations. Prices outside London start slightly higher at around £300,000 in 2010, rising to about £400,000 to £450,000 by the mid-2010s, and then fluctuating between roughly £400,000 and £500,000 through to 2023.
Prices inside London begin lower at around £250,000 in 2010, increase steadily and overtake outside London around 2016 to 2017 following the policy change, peaking at around £550,000 to £600,000. After this point, prices inside London fluctuate but generally remain higher than outside London, ending at approximately £500,000 to £550,000 in 2023.
Overall, both areas experience rising prices over time, with greater volatility inside London and a clear shift to higher prices inside London relative to outside London after the increase in the maximum loan value.
Figure 7.13: Average house prices (including new builds and second-hand homes) for transactions in postcodes within 5km of the London border, April 2010 to December 2023
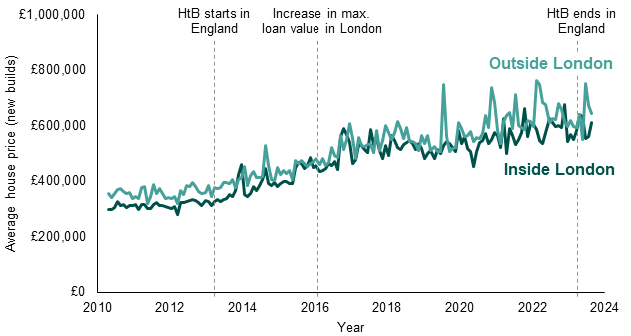
Source: Land Registry Price Paid data; Energy Performance Certificates database
Alternative text
Line chart showing average house prices for all homes, including new builds and existing properties, in postcodes within 5 km of the London border from April 2010 to December 2023. Two lines compare Inside London and Outside London, with values ranging from £0 to £1,000,000.
Three vertical dashed lines mark policy milestones: the start of Help to Buy in England around 2013, an increase in the maximum loan value in London around 2016, and the end of Help to Buy around 2023.
Both series show a general upward trend with noticeable short-term fluctuations. Prices outside London start higher at around £350,000 in 2010 and increase steadily, with volatility, to peaks of about £700,000 to £750,000 around 2022 to 2023, before easing slightly.
Prices inside London begin lower at around £300,000 in 2010 and rise steadily through the mid-2010s, reaching around £500,000 to £600,000 by 2016 to 2017. After this point, prices continue to fluctuate and grow more gradually, remaining below those outside London and ending at approximately £580,000 to £620,000 in 2023.
Overall, both areas experience substantial price growth over the period, with outside London consistently higher than inside London and larger spikes in prices, particularly after 2019.
Table 7.5 shows the estimated impacts from the difference-in-discontinuities analysis, adjusting for differences in property characteristics. The analysis does not show evidence for an effect on average prices, either for new builds or for all homes. As shown in Figure 7.14 and Figure 7.15, these estimates are robust to the geographic units used (whether the analysis is based on postcodes, OAs, LSOAs or wards) and to the choice of distance threshold.
Table 7.5: Estimated impact of the increase in the maximum loan value in London on house prices in postcodes within 5km of the London border, February 2016 to March 2021
| New build homes | All homes | |
|---|---|---|
| Number of transactions within 5km of the London border | 3,959 | 264,965 |
| Average price (February 2016-March 2021) | £464,900 | £561,500 |
| Average price if the trend had been the same as outside the London the border | £462,700 | £562,500 |
| Estimated average impact of the increased maximum loan value in London | +0.5% | -0.2% |
| 95% confidence interval | -3.7% to 4.9% | -1.3% to +1.0% |
| p-value | 0.828 | 0.760 |
Figure 7.14: Estimated impacts of the increase in the maximum loan value in London on house prices in areas close to the London border, February 2016 to March 2021
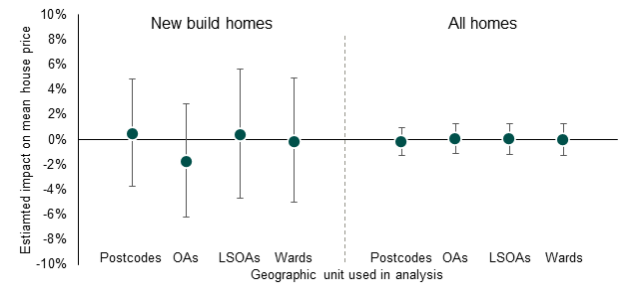
Source: Land Registry Price Paid data; Energy Performance Certificates database
Alternative text
Dot chart showing the estimated impact of the increase in the maximum loan value in London on mean house prices in postcodes near the London border, from February 2016 to March 2021. The chart is split into 2 sections, new build homes and all homes, separated by a vertical dashed line. The vertical axis shows percentage change from about -10% to 10%, with a horizontal line at 0% indicating no effect. Each estimate includes an error bar representing uncertainty.
For new build homes, estimates are close to zero across all geographic units. Postcodes and lower-layer super output areas show small positive effects of around 0 to 1%, while output areas show a negative estimate of about -2%. Wards are slightly negative, close to 0%. Error bars are wide and span both negative and positive values, indicating substantial uncertainty.
For all homes, estimates are very close to zero across postcodes, output areas, lower-layer super output areas, and wards. All values lie between about -1% and 1%, with relatively smaller error bars than for new builds, though still overlapping zero.
Overall, the chart suggests little clear impact of the policy change on house prices, with estimates near zero and considerable uncertainty, especially for new build homes.
Figure 7.15: Estimated impacts of the increase in the maximum loan value in London on house prices in postcodes close to the London border, February 2016 to March 2021
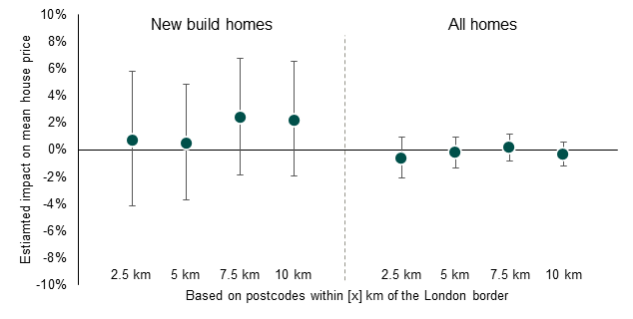
Source: Land Registry Price Paid data; Energy Performance Certificates database
Alternative text
Dot chart showing the estimated impact of the increase in the maximum loan value in London on mean house prices in postcodes close to the London border, from February 2016 to March 2021. The chart is split into 2 sections, new build homes and all homes, separated by a vertical dashed line. The vertical axis shows percentage change from about -10% to 10%, with a horizontal line at 0% indicating no effect. Each point includes an error bar showing uncertainty, and distances are shown at 2.5 km, 5 km, 7.5 km, and 10 km from the border.
For new build homes, estimates are small and mostly positive. The effect is around 1% at 2.5 km, close to 0.5% at 5 km, and increases to about 2 to 2.5% at 7.5 km and 10 km. Error bars are wide at all distances, spanning both negative and positive values, indicating substantial uncertainty.
For all homes, estimates are close to zero across all distances. Values range from slightly negative at around -0.5% at 2.5 km to around 0% to 1% at 5 km and 7.5 km, and slightly negative again at about -0.5% at 10 km. Error bars are narrower than for new builds but still cross zero at all distances.
Overall, the chart shows small and uncertain effects on house prices, with slightly positive estimates for new build homes and near-zero effects for all homes.
Given that the analysis does now show evidence for an increase in housing supply in London at the same time (see chapter 5), it might be expected that an increase in the amount of finance available through the Help to Buy scheme should lead to an increase in prices. Additionally, the results presented above are different to those found by Carozzi and others (2024), who estimate that the change in the maximum loan value in London led to an increase in new build prices of 8%.[footnote 15]
The analytical methods used in the analysis above are very similar to those used by Carozzi and others (2024), although there are differences in which transactions are included. One difference is in how property characteristics from the Energy Performance Certificates database are incorporated into the analysis. In short, the initial analysis relied on a detailed method which attempts to correct and reconcile differences in how addresses are recorded in the 2 databases (Chi and others, 2021). This approach is highly accurate (it usually links a transaction to the correct property in the Energy Performance Certificates database) but for some transactions is unable to find the right property information. As part of this process, the study also excluded homes which were not flagged as being sold at full market value.[footnote 16] For this analysis, about 15% of transactions are excluded for these reasons.
On the other hand, the method used by Carozzi and others (2024) compares addresses as recorded in the 2 databases and, where it is unable to find a matching record, infers property characteristics from the records of other homes in the same postcode. In this way, it excludes fewer cases from the analysis but at the cost of lower accuracy.
See Box 4 and the accompanying technical report for more information comparing these 2 approaches.
If the study repeats the analysis using a similar approach to linking the datasets as Carozzi and others (2024), it finds a larger impact estimate, equivalent to an effect on prices of around 5%. This is in line with the lower of the estimates reported in that study.
Box 4: Alternative methods for linking property characteristics to house price data
Given the differences in the results of the impact analysis, the 2 methods of linking transaction data from the Land Registry Price Paid data with property characteristics from the Energy Performance Certificates (EPC) database were tested. The study drew a random sample of 500,000 transactions and matched these to the EPC database using both methods. For new builds, both methods matched to the same EPC record about 3 quarters (77%) of the time.
It then drew a random sample of 800 records where the methods gave different results and manually checked the records to see which was more accurate. For new builds, where the 2 methods matched to different EPC records:
- 18% of the time both methods identified the correct address (a single address can have more than one EPC record) and so are likely to have matched to the correct property characteristics
- 81% of the time the method originally used (Chi and others, 2021) was more accurate and so more likely to have matched to the correct property characteristics
- 1% of the time it was unclear which method was more accurate
For 6% of new builds included in this test, the alternative method matched to an EPC record and the method initially used (Chi and others, 2021) did not. However, in most of these cases, the alternative method matched to EPC records for different addresses in the same postcode. Therefore, there is a greater risk of the property characteristics used in the analysis for these records to be inaccurate.
One possibility to explain the difference in results is that there was a larger effect on prices, but it was located mainly in the minority of transactions excluded from the initial analysis. Another possibility is that the method which was initially used more accurately accounts for differences in property characteristics and so better represents the effect of the Help to Buy scheme.
To test these possibilities, the study repeated the analysis limiting the data to the transactions where both approaches found matching property characteristics in the Energy Performance Certificates database. As shown in Figure 7.16, using a similar approach to Carozzi and others (2024), limiting the analysis in this way reduces the estimated impact slightly.
This indicates the difference between the 2 analyses is likely to be due to a combination of the 2 points above. In turn, this suggests that some effect on new build prices from the increase in the maximum loan value in London is plausible, but the scale of this effect is likely to be smaller than previously found.
Figure 7.16: Estimated impacts on new build prices from the increase in the maximum loan value in London using different methods for linking property characteristics to house sales data, February 2016 to March 2021
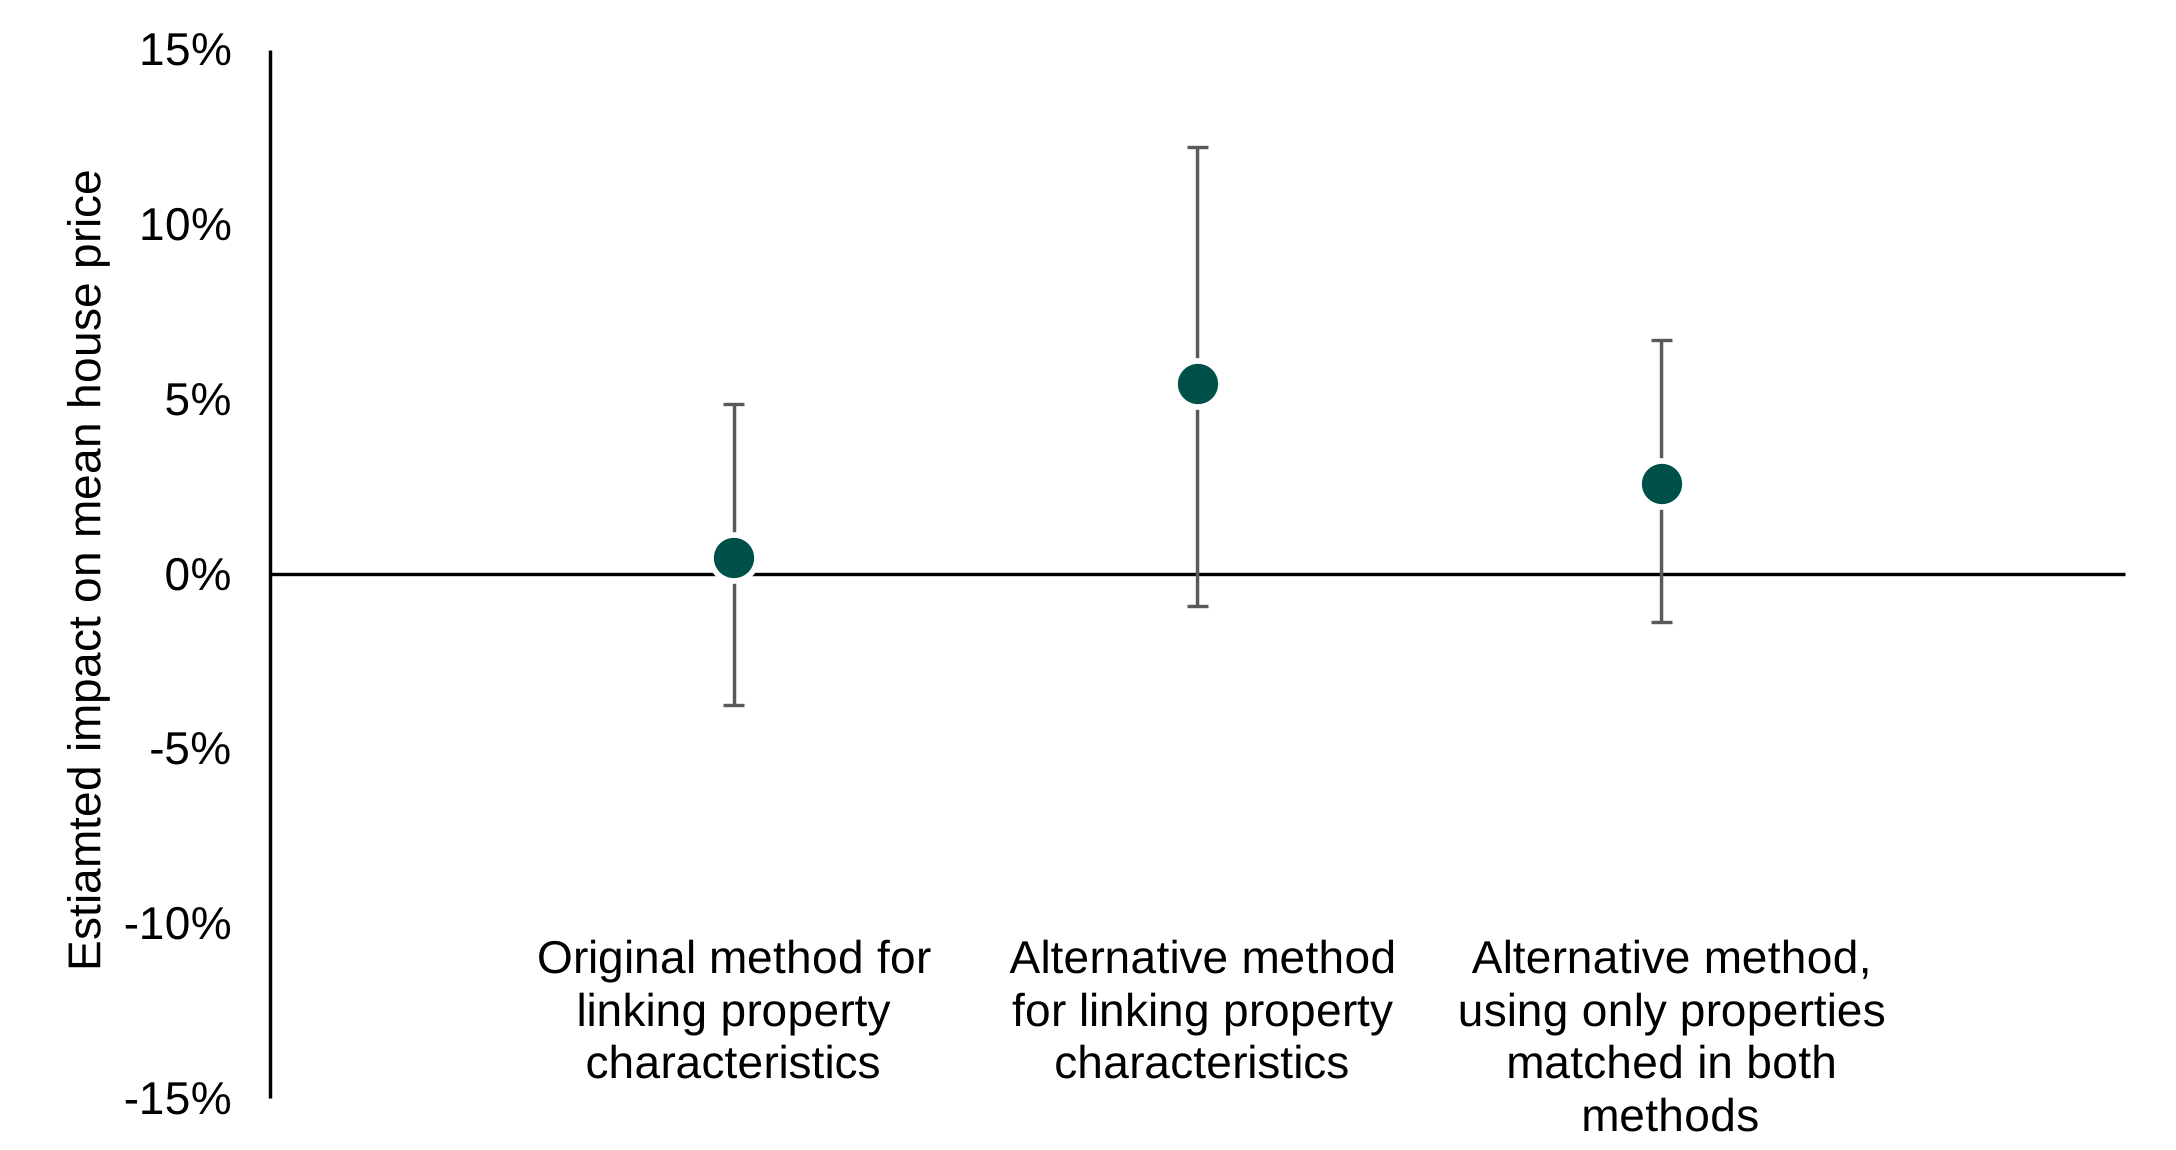
Source: Land Registry Price Paid data; Energy Performance Certificates database
Alternative text
Dot chart showing the estimated impact of the increase in the maximum loan value in London on mean house prices, using 3 different methods for linking property characteristics to house sales data. The vertical axis goes from -15% to 15% with a horizontal line in zero. Each point includes an error bar showing uncertainty.
Using a similar approach to linking the datasets as Carozzi and others (2024), we find a larger impact estimate, equivalent to an effect on prices of around 5%, albeit the confidence intervals cross zero with all approaches.
Box 5: How to read Figure 7.16
| This graph shows the results from 3 methods to estimate the impact of the increase in the maximum loan value on new build prices in London. |
The result on the left (Model 1) is from the initial analysis. This is the same result as shown above in Table 7.5. This analysis is based on 3,959 transactions recorded for postcodes within 5km of the London border between April 2014 and March 2021.
The middle result (Model 2) uses a similar method to Carozzi and others (2024) for linking property characteristics to the Land Registry Price Paid data. As described above, this method excludes fewer transactions (the analysis is based on 4,914 transactions over the same time period) but the property characteristics for these additional transactions are likely to be less reliable.
The result on the right (Model 3) also uses the same method as Model 2 for linking property characteristics to the Land Registry Price Paid data. However, it is restricted to the same set of transactions as Model 1.
The purpose of this analysis is to explore why the results are different for Models 1 and 2. If the results for Models 1 and 3 were very similar, that would suggest that the gap was due to which transactions are included. On the other hand, if the results for Models 2 and 3 were very similar, this would suggest that the gap was due to the more accurate property characteristics used for Model 1.
The fact that the result for Model 3 lies between the results for Models 1 and 2 indicates that both of these factors – differences in the transaction sample and differences in property characteristics – contribute to the difference between Models 1 and 2.
As described in section 7.3.1, broadening the geographic units used in the analysis (to OAs, LSOAs or wards) means that the study can include more transactions, although at the cost of less control over the differences between local housing markets. It can cover a bigger share of transactions but only by reducing the extent to which it focuses on the most comparable areas.
As shown in Figure 7.17, in the originally planned analysis, the results are robust to different geographic units. However, using a similar method to Carozzi and others (2024), the results are more sensitive to this decision. The largest impact estimate is from the model based on postcodes, and the estimates are smaller when wider geographies are used. Table 7.6 shows the number of transactions used in each analysis.
These results again highlight the risk that the larger estimates are from analyses focusing on a small number of transactions in a smaller set of postcodes that may not generalise to other areas.
Figure 7.17: Estimated impacts on new build prices from the increase in the maximum loan value in London by different geographic levels using different methods for linking property characteristics to house sales data, February 2016 to March 2021
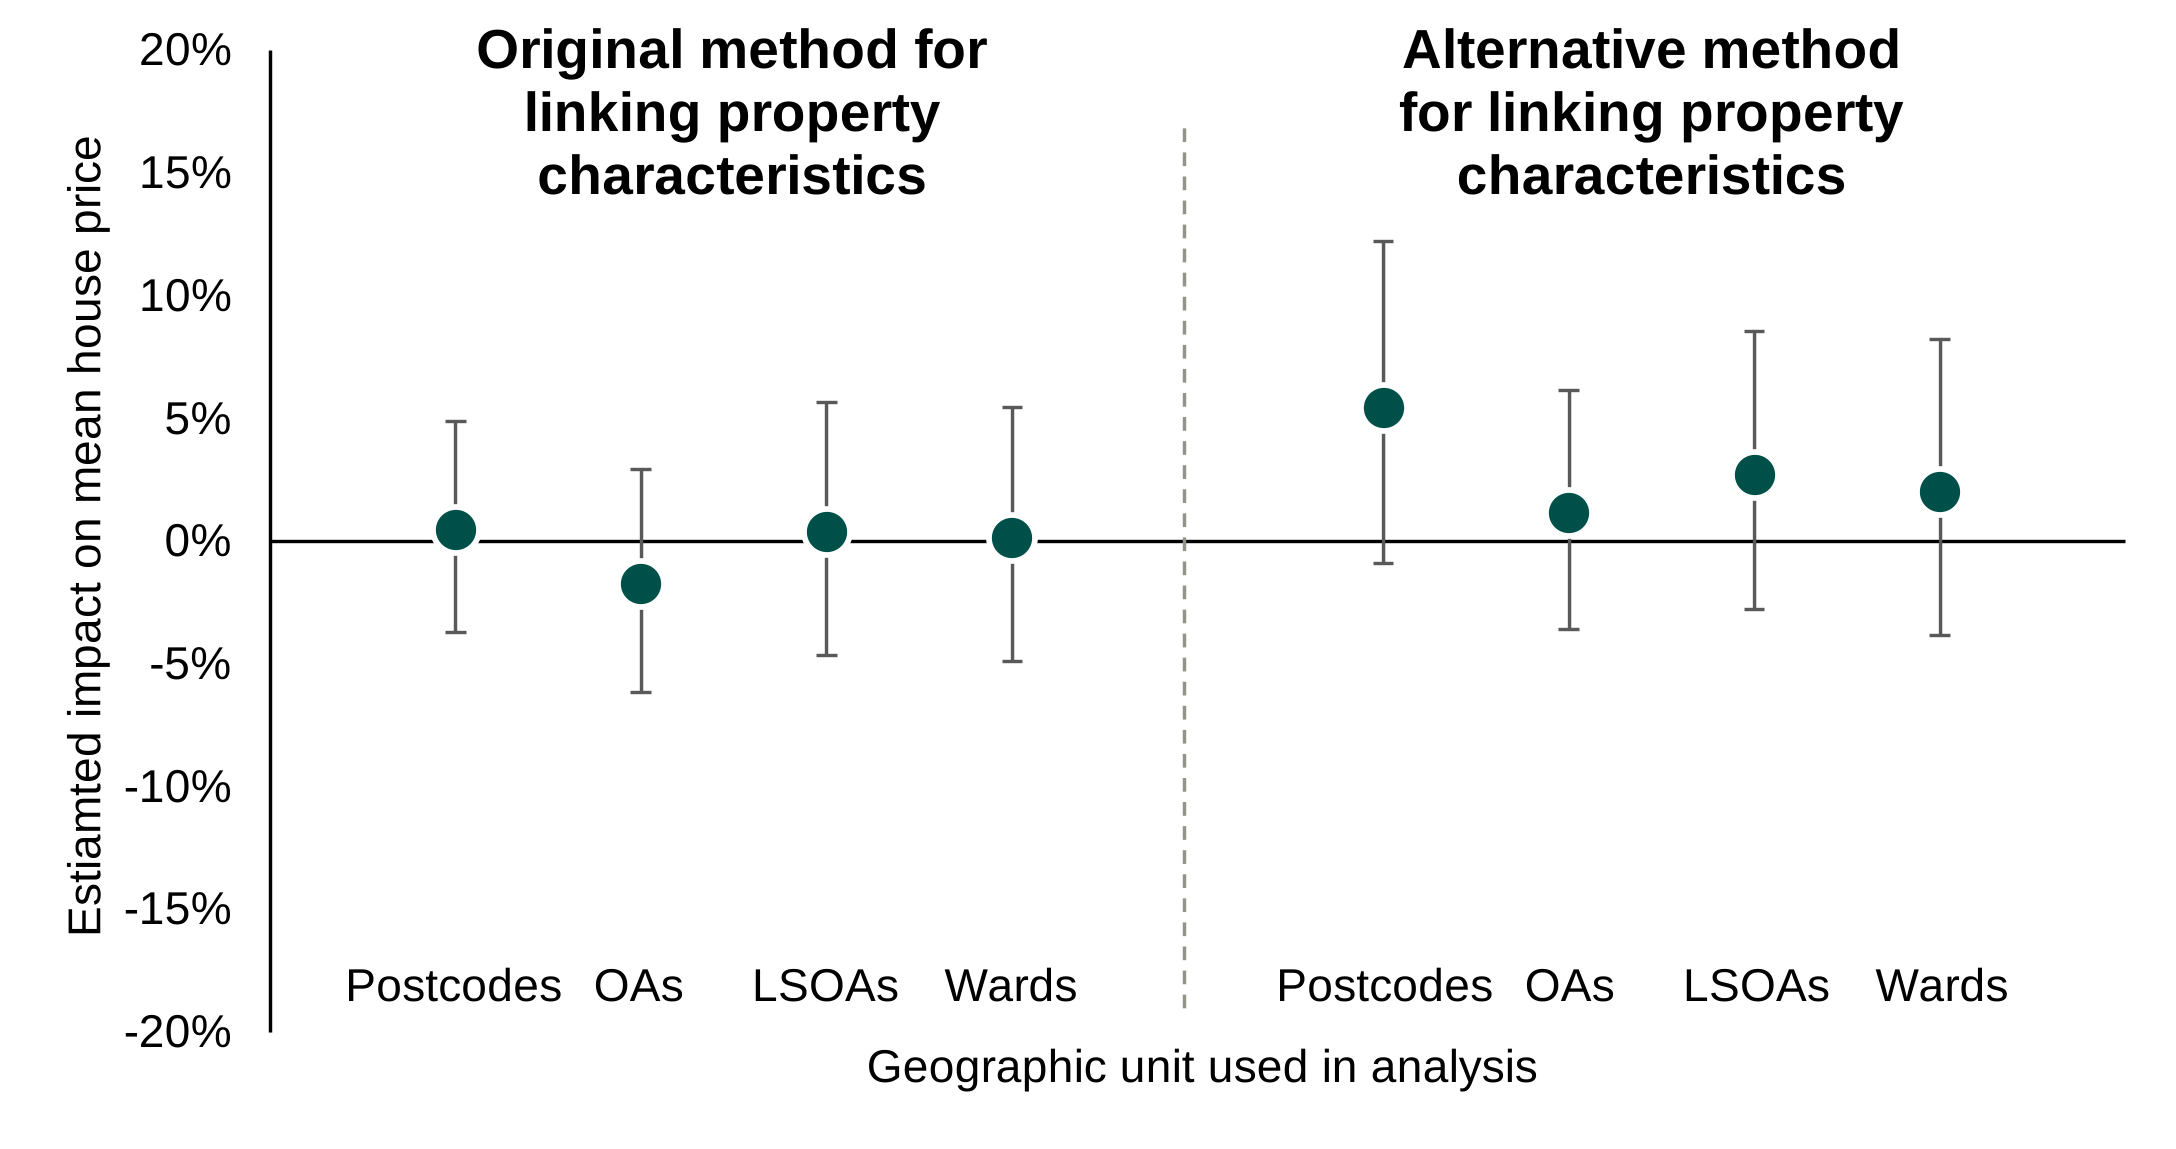
Source: Land Registry Price Paid data; Energy Performance Certificates database
Alternative text
Dot chart showing the estimated impact of the increase in the maximum loan value in London on mean house prices from February 2016 to March 2021., using different methods for linking property characteristics to house sales data. The chart is split into 2 sections, original method and alternative method (similar to Carozzi and others, 2024) , separated by a vertical dashed line. The vertical axis shows percentage change from about -20% to 20%, with a horizontal line at 0% indicating no effect. Each estimate includes an error bar representing uncertainty.
For the original linking method, estimates are close to zero across all geographic units ( postcodes, output areas, lower-layer super output areas, and wards), with all values between about -2% and 1%.
The estimates with the alternative linking method are larger and more sensitive to geographical unit. Going from around 1% (model based in output areas) to more than 5% (model based on postcodes)
Table 7.6: Number of transactions included in analyses at different geographic levels for areas within 5km of the London border
| Geographic unit | Original method for linking property characteristics | Alternative method for linking property characteristics |
|---|---|---|
| Postcodes | 3,959 (13%) | 4,914 (16%) |
| Output Areas (OAs) | 8,351 (27%) | 10,353 (34%) |
| Lower layer Super Output Areas (LSOAs) | 16,211 (52%) | 20,316 (66%) |
| Wards | 25,170 (81%) | 30,901 (100%) |
| Total number of transactions | 30,901 (100%) | 90,901 (100%) |
In addition, the change to the maximum loan value in London came into place after fast increases in both new housing supply (see chapter 5) and prices, as well as a number of other policy changes that might be expected to affect the housing market. New housing supply and new build prices increased substantially in London over the course of Help to Buy 1. However, most of this increase had already happened before the change to the Help to Buy scheme in London in 2016.
The increase in both new housing supply and prices slowed down after 2016. This indicates that there were other factors outside of the scheme which were influencing outcomes over the same timeframe. Examples include: the introduction of additional Stamp Duty for second homes (April 2016), the reduction of buy to let mortgage relief (April 2017), Stamp Duty changes for FTBs (2017), regulatory changes following the Grenfell Tower fire (2017) and potentially uncertainty about the housing market following the Brexit referendum.
The difference-in-discontinuities analysis assumes factors like these had the same impact either side of the border. That assumption may not hold. For example, if investment purchases decreased more inside London than outside, that could put more of a downward pressure on prices inside London, potentially partly counteracting the upward pressure on prices from the change in the Help to Buy scheme.
In summary, although the study did not find evidence for an increase in housing supply following the change to the maximum loan value in London, this does not necessarily mean this change led to a substantial increase in prices in London. The study finds only mixed evidence of an increase in prices at the same time, with the results sensitive to choices about the statistical analysis. Tentatively, the most likely answer is that the change to the scheme led to an increase of around 2% in new build prices in London. However, the evidence is inconclusive about the scale of such an effect.
7.5 The introduction of Help to Buy 2
In this section, the report considers the effects of the introduction of Help to Buy 2 on house prices.
7.5.1 Difference-in-discontinuities: evidence from regional borders
Figure 7.18 and Figure 7.19 show the estimated differences in the change in average house prices across regional borders after the introduction of regional price caps with Help to Buy 2 in April 2021. In most cases, the differences are reasonably small, indicating that the introduction of regional price caps did not lead to substantially different prices either side of the regional borders. The main difference is that new build prices grew more slowly near the border in Yorkshire and the Humber. However, this is unlikely to be due to the regional price caps as the differences in price caps were relatively small at these borders between Yorkshire and the Humber (£228,100 vs. £224,400) or the North East (£228,100 vs. £186,100).
Across other regions, however, new build prices do not appear to have been substantially affected by the introduction of regional price caps. In section 4.5 and section 5.5, the report showed that the introduction of regional price caps with Help to Buy 2 also does not appear to have had a notable effect on home ownership or housing supply. Together, these results indicate that the housing market was less responsive to the Help to Buy scheme (or changes to the scheme) by 2021 than it was when the Help to Buy scheme was first introduced in 2013. In part, this is likely to reflect the different market conditions by 2021. For example, the much wider availability of high LTV mortgages by 2021 meant that potential FTBs had other options than a Help to Buy equity loan and so may not have been constrained by the new price caps.
Figure 7.18: Estimated impact of the introduction of regional price caps on new build house prices for postcodes within 10km of each border, April 2021 to March 2023
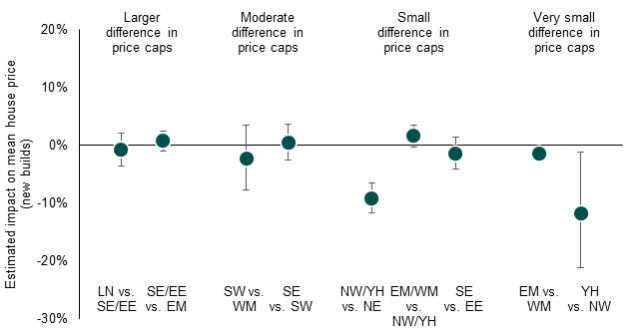
LN = London; SW = South West; SE = South East; EE = East of England; WM = West Midlands; EM = East Midlands; YH = Yorkshire and the Humber; NW = North West; NE = North East
Source: Land Registry Price Paid data; Energy Performance Certificates database
Alternative text
Dot chart showing the estimated impact of the introduction of regional caps on mean new build house prices within 10km of the border, from April 2021 to March 2023. The vertical axis shows percentage change from about -30% to 20%, with a horizontal line at 0% indicating no effect. Each estimate includes an error bar representing uncertainty.
The estimates are presented separately for regions where the difference in price caps was larger (left), moderate, small and very small (right). The estimates in borders with large and moderate price cap difference are close to 0% with CIs crossing zero. However, prices seem to increase less near the border of Yorkshire and the Humber (around 10% less than in the North East side of the border, and around 12% less than in the North West side of the border). These 2 borders are between regions with small or very small difference in price caps.
Figure 7.19: Estimated impact of the introduction of regional price caps on house prices (new build and second-hand homes) for postcodes within 10km of each border, April 2021 to March 2023
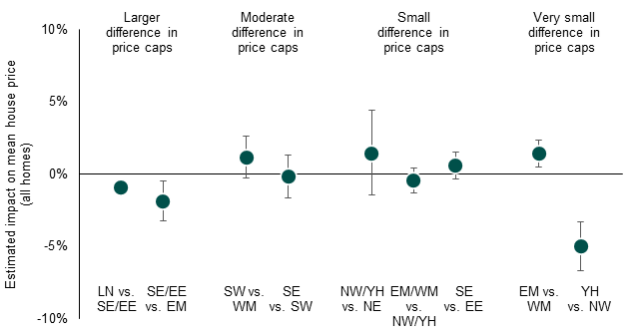
Source: Land Registry Price Paid data; Energy Performance Certificates database
Alternative text
Dot chart showing the estimated impact of the introduction of regional price caps on average house prices, including both new build and existing homes, for postcodes within 10 km of each border from April 2021 to March 2023.
The chart is grouped into 4 categories based on the size of differences in price caps: larger, moderate, small, and very small. The vertical axis ranges from about -10% to 10%, with a horizontal line at 0% indicating no effect. Each estimate includes an error bar representing uncertainty.
For larger differences in price caps, both estimates are negative, at around -1% and -2%, with error bars extending further below zero.
For moderate differences, estimates are mixed, with one positive effect of about 1% and one slightly negative near 0% to -1%, with error bars spanning both positive and negative values.
For small differences, estimates are close to zero or slightly positive. One comparison shows a positive effect of around 1.5%, while others are near zero or slightly negative, with moderate error bars.
For very small differences, estimates diverge. One comparison shows a positive effect of around 1.5%, while the other shows a negative effect of about -5%, with a wider error bar extending further downward.
Overall, the chart shows small and mixed effects on house prices, with no clear consistent pattern across groups and considerable uncertainty in several estimates.
7.6 The end of Help to Buy in England
As previously shown in Figure 7.19, prices continued to rise in England and Wales following the end of the Help to Buy scheme in England in March 2023. However, focusing on the border between England and Wales, the analysis suggests that prices for comparable but new build properties rose slower on the English side of the border than on the Welsh side, adjusting for differences in property characteristics. These results indicate that the end of the Help to Buy scheme in England may have led to new build prices increasing at a slower rate in these areas.
As shown in Table 7.7, new build prices were around 4% lower following the closure of the Help to Buy scheme in England than would be expected based on the trend for similar properties in Wales. This result is robust to different geographic units and different distance thresholds (Figure 7.20 and Figure 7.21). There is no evidence of an impact on overall house prices at the same time.
Table 7.7: Estimated impact of the end of the Help to Buy scheme in England on house prices in postcodes within 10km of the England/Wales border, April 2023 to December 2024
| New build homes | All homes | |
|---|---|---|
| Number of transactions within 10km of the England/Wales border | 1,028 | 22,351 |
| Average price (April 2023-December 2024) | £339,200 | £324,700 |
| Average price if the trend had been the same as on the Welsh side of the border | £352,200 | £324,000 |
| Estimated average impact the end of the Help to Buy scheme in England | -3.7% | +0.2% |
| 95% confidence interval | -7.2% to 0.0% | -0.8% to +1.2% |
| p-value | 0.051 | 0.674 |
Figure 7.20: Estimated impact of the end of Help to Buy on house prices in postcodes close to the England/Wales border, April 2023 to December 2024
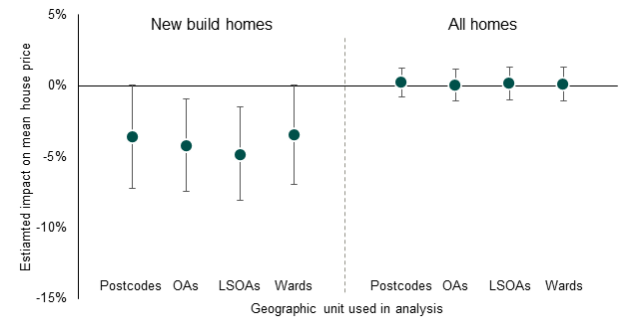
Source: Land Registry Price Paid data; Energy Performance Certificates database
Alternative text
Dot chart showing the estimated impact of the end of the Help to Buy scheme on mean house prices in postcodes close to the England–Wales border from April 2023 to December 2024. The chart is split into 2 sections, new build homes and all homes, separated by a vertical dashed line. The vertical axis ranges from about -15% to 5%, with a horizontal line at 0% indicating no effect. Each estimate includes an error bar showing uncertainty.
For new build homes, all estimates are negative. Postcodes show a decline of around -4%, output areas around -4.5%, lower-layer super output areas about -5%, and wards around -4%. Error bars are relatively wide and extend further downward, though most remain below zero, indicating a consistently negative effect.
For all homes, estimates are close to zero across all geographic units. Values for postcodes, output areas, lower-layer super output areas, and wards range from about -0.5% to 0%, with smaller error bars that straddle the zero line.
Overall, the chart indicates a negative impact of the scheme ending on new build house prices, while effects on overall house prices appear negligible.
Figure 7.21: Estimated impact of the end of Help to Buy on house prices by distance from the England/Wales border, April 2023 to December 2024
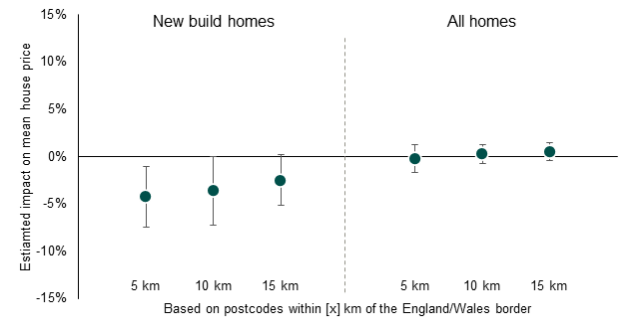
Source: Land Registry Price Paid data; Energy Performance Certificates database
Alternative text
Dot chart showing the estimated impact of the end of the Help to Buy scheme on mean house prices in postcodes close to the England–Wales border from April 2023 to December 2024. The chart is split into 2 sections, new build homes and all homes, separated by a vertical dashed line. The vertical axis ranges from about -15% to 15%, with a horizontal line at 0% indicating no effect. Each estimate includes an error bar showing uncertainty. Distances from the border are shown at 5 km, 10 km, and 15 km.
For new build homes, all estimates are negative. The effect is around -4% at 5 km, around -3.5% at 10 km, and about -2.5% at 15 km. Error bars are wide and extend further downward, though they approach or slightly cross zero at the upper bound, indicating uncertainty but a consistently negative pattern.
For all homes, estimates are close to zero or slightly positive. The effect is around 0% at 5 km, increases slightly to about 0.5% at 10 km, and reaches around 1% at 15 km. Error bars are smaller than for new builds but still cross zero at most distances.
Overall, the chart shows a negative estimated impact on new build house prices following the end of Help to Buy, with little to no clear effect on overall house prices.
7.7 Whether customers paid extra for Help to Buy properties
The ‘new build premium’ refers to the difference between what a buyer pays for a new build home and what they would pay for a similar home that has previously been lived in. The study explored the extent to which there was a new build premium over the course of the Help to Buy scheme, as well as any additional ‘Help to Buy premium’, that is, whether buyers typically paid more for a home bought through the Help to Buy scheme than a similar new build home that was not bought using the scheme.
To estimate price premiums the analysis fits regression models predicting property prices, adjusting for differences in property characteristics such as property type and size. It also accounts for differences between individual postcodes, recognising differences in local housing markets that may not be otherwise captured in the model.
The study included variables in the model for whether the property was identified as a new build in the Land Registry Price Paid Data and for whether a property had been bought through the Help to Buy scheme. To identify the properties bought through the Help to Buy scheme, addresses recorded in the Land Registry Price Paid Data were compared with the addresses recorded in the Homes England Help to Buy customer database. The study found the transaction records for 89% of homes in the Help to Buy customer database.[footnote 17] For any Help to Buy scheme addresses which the study was unable to find a matching record in the Land Registry Price Paid Data, these postcodes were excluded from the analysis to make sure homes were not counted in the wrong category.
This model then effectively compares prices for new build properties against prices of second-hand properties with the same characteristics in the same area. Similarly, it does the same for properties bought through the Help to Buy scheme.
As shown in Table 7.8, the study found evidence for a new build premium: buyers paid on average 5% more for new build homes than for similar second-hand homes in the same postcode. It also found evidence for a small Help to Buy premium of around 1% on top of this. In other words, buyers paid around 5% more for a new build home than a comparable second-hand home, and they paid an additional 1% more for homes bought through Help to Buy.
As an illustration:
- The average price for homes bought through the Help to Buy scheme was £206,200
- It is estimated that the average price for other new build homes with the same characteristics would be £204,300
- It is estimated that the average price for second-hand homes with the same characteristics would be £193,700.
Table 7.8: Estimated price premiums, April 2013 to March 2023
| Estimated price premium | Lower 95% confidence interval | Upper 95% confidence interval | p-value | |
|---|---|---|---|---|
| New builds (vs. second-hand homes) | +5.5% | +5.2% | +5.8% | <0.001* |
| Help to Buy homes (vs. other new build homes) | +0.9% | +0.8% | +1.1% | <0.001* |
*statistically significant at the 95% level
The finding of a 1% Help to Buy premium is consistent with the National Audit Office progress review for the Help to Buy scheme which conducted a similar analysis in 2019 and also concluded that “the difference between buyers who bought with and without the support of the scheme was less than 1%” (NAO, 2019).
Figure 7.22 shows how these price premiums varied over the course of the Help to Buy scheme. The new build premium increased between 2015/16 and 2018/19, before falling again. The Help to Buy premium remained under 1%.
Figure 7.23 shows how the price premiums varied between regions in England. The Help to Buy premiums were low in each region (0-2%), while the new build premium was larger in London than in other regions (8%, as compared with 4-6% in other regions).
Figure 7.24 shows how the price premiums varied between different property types. The Help to Buy premium was again around 1% for flats, semi-detached homes and terraced homes, although lower for detached homes.
Together, these findings suggest that Help to Buy scheme customers paid on average about 1% more for their home than for another comparable new build home in the same area. This holds for different regions, property types and stages of the Help to Buy scheme.
Figure 7.22: Estimated price premiums for Help to Buy homes and new build homes by financial year, April 2013 to March 2023
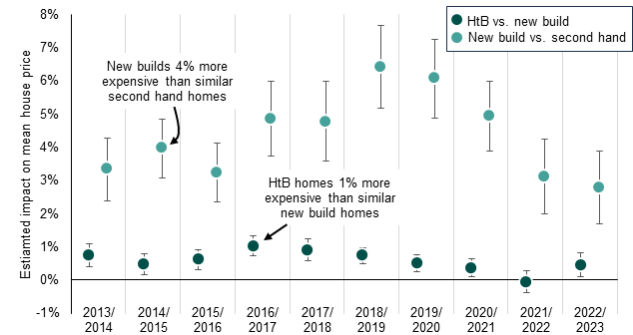
Source: Land Registry Price Paid data; Energy Performance Certificates database; Homes England Help to Buy customer database
Alternative text
Dot chart showing the estimated price premiums for Help to Buy homes compared with other property types from April 2013 to March 2023. The vertical axis ranges from about −1% to 8%, with a horizontal line at 0% indicating no price difference. Each year includes 2 estimates with error bars: one for Help to Buy homes relative to other new build homes, and one for new build homes relative to second-hand homes.
Across all years, new build homes are consistently more expensive than similar second-hand homes, with premiums ranging from about 3% to 6%. The premium is around 3% in 2013 to 2014, rises to about 4% to 5% in the mid-2010s, peaks at roughly 6% to 6.5% around 2018 to 2020, and then declines to around 3%–4% by 2022 to 2023.
Help to Buy homes show smaller and more variable premiums relative to other new builds. These are generally around 0.5% to 1% from 2013–14 to 2017–18, with a small peak of about 1% in 2016 to 2017, then decline to around 0% or slightly negative by 2021 to 2022 before returning to about 0.5% in 2022 to 2023.
Error bars are shown for all estimates, with wider intervals for Help to Buy comparisons.
Overall, the chart indicates that new builds are consistently more expensive than second-hand homes, while Help to Buy homes are priced similarly to other new builds, with only small and fluctuating differences.
Figure 7.23: Estimated price premiums for Help to Buy homes and new build homes by region, April 2013 to March 2023
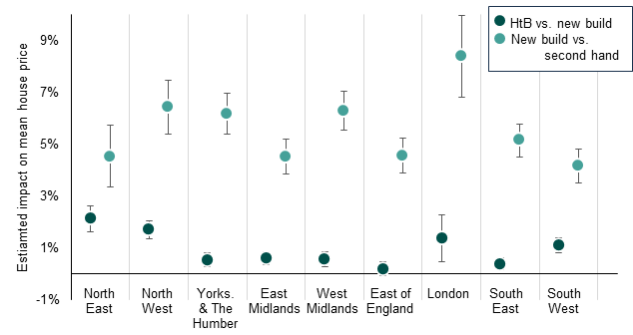
Source: Land Registry Price Paid data; Energy Performance Certificates database; Homes England Help to Buy customer database
Alternative text
Dot chart showing estimated price premiums by region for Help to Buy homes compared with other new builds, and for new build homes compared with second-hand homes, from April 2013 to March 2023. The vertical axis ranges from about −1% to 10%, with a horizontal line at 0% indicating no price difference. Each region has 2 estimates with error bars showing uncertainty.
Across all regions, new build homes are consistently more expensive than similar second-hand homes. Premiums range from about 4% to over 8%, with the highest in London at around 8–9%. Other higher premiums appear in the North West, Yorkshire and the Humber, and the West Midlands at around 6–7%, while the North East and South West are lower at around 4–5%.
Help to Buy homes show smaller premiums relative to other new builds. These are generally between about 0.5% and 2% across most regions.
The highest premiums appear in the North East and London at around 2% to 2.5%, while several regions, including the East of England and South East, are closer to zero or around 0.5%.
Error bars indicate some uncertainty, but new build premiums remain clearly positive across all regions, while Help to Buy premiums are modest and closer to zero.
Overall, the chart shows that new build homes command a consistent price premium over second-hand homes, whereas Help to Buy homes are priced similarly to other new builds with only small regional variation.
Figure 7.24: Estimated price premiums for Help to Buy homes and new build homes by property type, April 2013 to March 2023
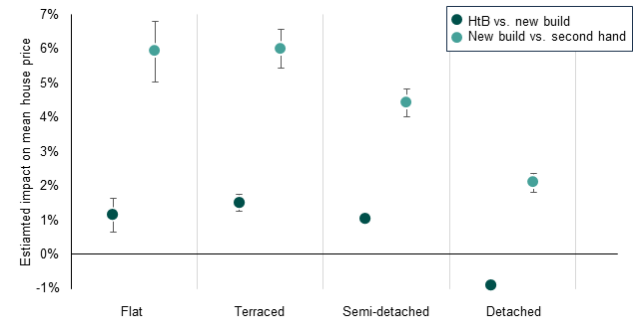
Source: Land Registry Price Paid data; Energy Performance Certificates database; Homes England Help to Buy customer database
Alternative text
Dot chart showing estimated price premiums by property type for Help to Buy homes compared with other new builds, and for new build homes compared with second-hand homes, from April 2013 to March 2023. The vertical axis ranges from about −1% to 7%, with a horizontal line at 0% indicating no price difference. Each property type has 2 estimates with error bars showing uncertainty.
Across all property types, new build homes are more expensive than similar second-hand homes. Premiums are highest for terraced and flat properties at around 6%, slightly lower for semi-detached homes at about 4.5%, and lowest for detached homes at around 2%.
Help to Buy homes show smaller premiums relative to other new builds. Flats have a premium of about 1%, terraced homes around 1.5%, and semi-detached homes about 1%. Detached homes show a slightly negative estimate at around −1%, indicating they may be priced slightly lower than comparable new builds.
Error bars are moderate in size for all estimates.
Overall, the chart shows a consistent premium for new builds over second-hand homes across all property types, while Help to Buy homes are priced similarly to other new builds, with only small differences.
7.8 Conclusion
House prices were generally increasing over the course of the Help to Buy scheme – especially in London between 2013 and 2018 – and the scheme is likely to have been contributing to that increase. Comparing transactions close to the England/Wales border, average prices in English areas (covering both new build and second-hand homes) were around 2% higher than they would have been had prices continued to follow a similar trajectory as areas on the Welsh side of the border.
Evidence about the scale of price impacts in London following the increase to the maximum equity loan value in 2016 is inconclusive. Previous work (Carozzi and others, 2024) found evidence for a large effect on prices, while the analysis of this evaluation suggests these effects may have been modest. As the results are sensitive to choices about the statistical analysis, the scale of these impacts is unclear. This analysis also does not rule out an impact on prices in London before this point, following the introduction of the Help to Buy scheme in 2013.
Across England, prices increased the most in areas that were already relatively less affordable before the start of the Help to Buy scheme, where typical FTB deposits were already relatively large. This suggests that the Help to Buy scheme led to an inflation of prices in these local housing markets, making them more difficult to afford for many potential FTBs.
Homes bought through the Help to Buy scheme were slightly more expensive than comparable new build homes that were not bought through the scheme. However, this difference was small, with this ‘Help to Buy premium’ adding around 1% to the price of new build homes.
8. Value for money
This chapter explores whether the Help to Buy scheme delivered value for the public funds invested into the scheme. To determine value for money, the costs and benefits of the scheme are monetised in line with HM Treasury Green Book (2026) and MHCLG Appraisal Guide (2025). Further detail on the method is in the technical report.
8.1 Summary of key findings
The key value for money findings are as follows:
- the value for money the Help to Buy scheme is estimated to be ‘very high’ – this partly reflects the financial returns it generated, as well as the social benefits derived from supporting an increase in the supply of housing
- the scheme is estimated to have generated a net present social value of £25.1 billion. Approximately £28.6 billion of benefits are derived from the support the scheme provided to increase new housing supply that is estimated to be attributable to the Help to Buy scheme (see chapter 5.7).
- the total cost of the scheme is £3.6 billion in present value terms, which includes the initial cost of equity loans, admin and staffing costs (£30.9 billion) minus the revenue generated from loan repayment and income (£27.3 billion)
8.2 Benefits of Help to Buy
Increasing housing supply generates benefits to society. This includes the welfare gains to people from having access to more and better-quality housing. In line with the MHCLG Appraisal Guide, the benefit to society of housing stock is practically estimated through the land value uplift (LVU) achieved at the time of construction, which represents the increase in value to society of a new dwelling after deducting the costs of land and development for that dwelling. LVU should therefore be considered as a market-based proxy for estimating these societal benefits rather than representing the private benefits to landowners or developers, which are not considered a societal benefit.[footnote 18]
LVU is calculated by comparing the value of residential land associated with new builds estimated to have been attributable to the Help to Buy scheme (as identified by the impact evaluation) with the theoretical value of what that land would have been in the absence of the scheme (the counterfactual). The value of land in the absence of residential development is taken to be a combination of brownfield and agricultural land. As a result, LVU is essentially the conversion of lower value brownfield and agricultural land to more valuable residential land attributable to the Help to Buy scheme.
This analysis considers the increase in LVU through greater housing supply only. While the impact evaluation found that the scheme had some impact on property prices, the impact of Help to Buy on property price changes is not included in the LVU analysis. This is because price changes represent transfers between economic actors rather than benefits and should therefore be excluded in line with the HM Treasury Green Book, assuming no redistribution impacts.
8.3 Additionality of housing supply
The economic evaluation considers the ‘additionality’ of the benefits generated by the Help to Buy scheme, or the extent to which these benefits would have occurred even if the scheme did not happen (i.e. deadweight) and the extent to which benefits would not have occurred elsewhere in the absence of the intervention (i.e. displacement).
The impact evaluation finds that the Help to Buy scheme led to an increase in housing supply at the England/Wales border, with 27% of all new dwellings built in these areas during Help to Buy 1 as being attributable to the scheme. Recognising the limitations on whether this effect can be extended to regions further away from the border, the impact evaluation extends the results to produce national and across scheme estimates through a set of scenarios using price elasticity estimates from the Institute of Fiscal Studies (2024) to account for regional differences if this estimate were to be applied across England (see Section 5.7 Investigating the scale of effects of supply). Assuming that the Help to Buy impact in places with lower estimated elasticity is smaller than in places with higher estimated elasticity (i.e. Scenario 3 in Table 5.7 Impact on housing supply under illustrative scenarios), this results in an estimate of 14%[footnote 19] of new homes built in the period between 2013/14 and 2023/24 across England as being the Help to Buy scheme, which is used in the analysis in this chapter.
As noted in section 5.7, as there were around 387,000 Help to Buy loans issued across Help to Buy 1 and Help to Buy 2, this is equivalent to around 80% of the number of Help to Buy loans. In other words, it is estimated above that for every 100 Help to Buy loans issued, developers built around 80 new homes. As discussed in section 5.3, the additional homes built by developers very likely included homes that were not bought through the Help to Buy scheme, but still contribute to the supply impact monetised in this section.
8.4 Costs of Help to Buy
The cost of the Help to Buy scheme is the cost to the public sector associated with delivering the scheme. The primary costs were the provision of the Help to Buy equity loans itself, as well as Resource Departmental Expenditure Limit (RDEL) spend, Capital Departmental Expenditure Limit (CDEL) spend, and administration and staffing costs. Income was received through the repayment of the Help to Buy Loans, as well as interest payments and management fee income. In line with MHCLG Appraisal Guide (2025), this income is netted from the costs to arrive at a net cost of the Help to Buy scheme. Table 8.1 outlines the costs of the Help to Buy scheme which are unpublished but were provided by Homes England.
Table 8.1: Costs of the Help to Buy scheme
| Cost area | Cost (2024/25 prices, discounted) |
|---|---|
| Value of Help to Buy loans | £30,635.3 million |
| RDEL spending | £166.7 million |
| CDEL spend (excluding loan issue) | £3.1 million |
| Admin and staffing costs | £49.9 million |
| Redemption income | -£25,402.3 million |
| Interest and management fee income | -£1,892.9 million |
| Total net cost | £3,559.8 million |
8.5 Value for money assessment
The table below (Table 8.2) summarises the findings from the economic evaluation, with all costs and benefits expressed in present value terms in 2024/25 prices. The economic evaluation identifies approximately £28.6 billion of benefits derived from the increase in housing supply due to the Help to Buy scheme, measured by land value uplift. The total net public sector cost of the Help to Buy scheme is circa £3.6 billion, which includes both the cost of Help to Buy loans, admin and staffing costs, minus any income received from the repayment of the loans. This suggests a net present social value of £25.1 billion.
Based on the ‘VfM categories’ outlined in MHCLG’s Appraisal Guide, this implies that the Help to Buy scheme achieves ‘very high’ value for money. A benefit cost ratio is not reported in this instance given the Help to Buy scheme is a financial transaction in which the total net cost of the scheme is relatively small due to the repayments of the loan. Therefore, any comparison of this small cost to the relatively large benefits by calculating a benefit cost ratio will not provide a meaningful metric to assess value for money.[footnote 20]
Table 8.2: Value for money results, 2024/25 prices
| Benefit, cost | Present value, 2024/25 prices |
|---|---|
| Land value uplift | £28.6 billion |
| Total benefit | £28.6 billion |
| Costs (Help to Buy loans, admin and staff) | £30.9 billion |
| Loan redemption and interest | -£27.3 billion |
| Total net cost | £3.6 billion |
| Net present social value | £25.1 billion |
| VfM category | Very high |
8.6 Sensitivity analysis
The core value for money analysis is sensitive to several modelling assumptions that are subject to a degree of uncertainty. Sensitivity analysis is used to test this uncertainty and its impact on the value for money results. The table below (Table 8.3) summarises results of this sensitivity analysis.
A key area of uncertainty is the extent to which the findings from the impact evaluation apply across all homes and regions, recognising this is based on difference-in-discontinuity analysis specifically at the England/Wales border. While the impact analysis suggest that a proportion of all new dwellings built in areas near the Welsh border from 2013 to 2021 were attributable to the Help to Buy scheme, the extent to which this effect extends to the rest of England is uncertain. Therefore, 2 sensitivity analyses are conducted to test the impact of the underlying assumptions. In the first, it is assumed that there is zero spillover to non-Help to Buy properties, resulting in only Help to Buy properties to experience land value uplift as a result of the scheme. Under this scenario, 3% of all new dwelling completions are assumed to be attributable to the Help to Buy scheme. The second sensitivity assumes that the treatment effect found at the England/Wales border will only apply to bordering English regions, resulting in zero additionality in all others.
Under both these scenarios, the net present social value falls but still implies the Help to Buy scheme achieves value for money. This suggests that while the analysis is sensitive to the specific application of the impact evaluation results, the benefits of the scheme still outweigh the costs, even under a conservative interpretation of the impact analysis.
Further sensitivity analysis is conducted to account for future uncertainty. This includes a higher future inflation rate, through a 2 percentage point increase to the gross domestic product (GDP) deflator, which has little impact on the value for money result. A further sensitivity conducted assumes a lower level of redemption income to account for a higher percentage of Help to Buy customers defaulting on their loans, resulting in lower income for the government. Even under a very high default rate assumption of 25%, this makes little difference to the result.
The final sensitivity analysis conducted relates to the House Price Index (HPI) which is a key assumption in the redemption income and interest repayment projections. High and low HPI scenarios were provided by Homes England (unpublished) and calculated using house prices, Bank of England base rates and RPI/CPI forecasts. Under the high HPI scenario, future redemption income rise, resulting in a reduction to the net cost of the scheme. Under the low HPI scenario, projected redemption income drops, raising the net cost of the scheme. However, under both these scenarios, the overall VfM category remains very high.
Overall, the results indicate that the value for money assessment is likely to be robust against key uncertainties within the analysis, indicating that the Help to Buy scheme delivers value for money.
Table 8.3: Sensitivity analysis results
| Scenario | Net social benefits | VfM category |
|---|---|---|
| 1. No spillover to non-Help to Buy properties | £2.3 billion | ‘Medium’ |
| 2. Additionality only applied to regions bordering Wales | £4.1 billion | ‘High’ |
| 3. Increased future inflation (GDP deflator + 2 percentage points) | £24.2 billion | ‘Very high’ |
| 4. Reduced future redemption income (25% reduction) | £22.8 billion | ‘Very high’ |
| 5. Higher house price index | £25.3 billion | ‘Very high’ |
| 6. Lower house price index | £24.4 billion | ‘Very high’ |
8.7 Other benefits
It is recognised that there may be other benefits resulting from the Help to Buy scheme that are not possible to monetise but should be considered alongside the quantitative analysis as part of the value for money assessment.
The Help to Buy scheme is likely to provide life satisfaction and wellbeing benefits to residents living in new Help to Buy properties, over and above the value of the property. Increased life satisfaction could be derived from improved living standards or a sense of accomplishment and security associated with home ownership. While there was some evidence of an improvement in life satisfaction scores for residents after the Help to Buy scheme, these results are self-reported and based on a theory-based approach. Given the limited robustness to these estimates, wellbeing benefits are not monetised.
There could also be employment benefits from the Help to Buy scheme. As the Help to Buy scheme led to the development of new homes that would not have been built in the absence of the scheme, it is likely that it contributed to the creation of new jobs in the construction sector. For example, Homes England (2021) reported that building 100 homes is estimated to support 310 jobs in the construction and supply chain, as well as new construction apprenticeships, traineeships and graduate placements. Employment benefits are excluded from the analysis in line with HMT Green Book guidance, as they are considered a macroeconomic effect beyond the scope of individual appraisal. There are likely to be environmental benefits from the efficiency of new homes. Many residents occupying new Help to Buy properties are likely to have lived in homes previously that are less energy efficient, therefore, the scheme has resulted in benefits such as reduced energy costs to households and avoided carbon emissions.
It is also recognised that there are limitations to using LVU as an approach for measuring the economic benefits of a housing scheme. Firstly, the analysis is based on generic land value estimates provided by MHCLG at the lower super output area (LSOA) level and therefore do not necessarily represent the actual market value of the Help to Buy properties themselves. Further, LVU constructs a counterfactual which describes what would have happened to land value in the absence of the scheme. As this counterfactual is theoretical, it is highly assumptions driven and may not reflect what would have happened in reality. For example, the methodology implicitly assumes that residential development is the sole driver of land value, whereas in practice it could be affected by wider development such as transport infrastructure and local amenities.
9. Customer experience
This chapter reports customers’ experience of using the Help to Buy scheme using data from a large-scale survey of customers across the full scheme (Help to Buy 1 and Help to Buy 2), the complete Homes England customer database, and qualitative customer interviews. It covers findings about:
- the benefits and challenges of using the scheme, including any negative consequences from using the scheme
- the types of customers that benefited from the scheme
- the impact the scheme had on customers’ property buying behaviour
- the impact the scheme had on customers’ access to mortgages
- how customers managed their financial commitments to the scheme
- customers’ experience of redeeming the equity loan
- customers’ experience of moving to a property after redeeming their equity loan
- customers’ expectations of what they would have done if they had not used the scheme (their counterfactual)
9.1 Summary of key findings
Overall, the evaluation found customers’ experience of using the Help to Buy scheme to be positive. However, customers who had redeemed their loan reported a more negative experience relative to those with live accounts due to difficult experiences of the redemption process. The key findings from this chapter are that:
- customers were highly satisfied with both their properties and the overall scheme experience, with the new build homes liked amongst all customers
- the scheme benefitted a wide range of customers and household types, with particular benefits for customers who bought alone, households with children, customers who bought in London or older customers
- the scheme was easy to get on to and the communication was limited, but this was preferred by most
- many customers found the scheme easy to understand, but understanding of key equity loan terms was weaker (of interest payments and repayment linked to the property’s current value)
- the scheme’s redemption process was often described as a negative experience, due to having to manage multiple stakeholders, short valuation periods and poor communication from the loan administrator
- customers who were financially struggling, less informed of the scheme or less confident in managing their financial commitments to the scheme reported more negative experiences of the Help to Buy scheme
9.2 About Help to Buy customers
The Homes England’s customer database provides background information about which scheme customers bought through, whether they had bought previously, what sort of property they bought and where and whether they had redeemed their loan. Analysis of this database shows that:
- 85% of customers bought their property through the Help to Buy 1 scheme (2013 to 2021), 15% of customers through the Help to Buy 2 scheme (2021 to 2023)
- 82% of Help to Buy 1 customers were first-time buyers (FTBs) 54% of all customers had live accounts, 46% had redeemed their loan
- there were most customers in South East England (18%) and least in the North East (6%), with 11% of customers in London
- the most popular property purchased was a semi-detached property (33%), followed by a detached property (29%), flats (21%) and terraced properties (17%)
- 3 bedroom properties were most bought under the scheme (44%), followed by 4 bedrooms (23%), 2 bedrooms (24%), 1 bedroom (8%) and 5 bedrooms (2%)
The customer survey, sampled from the Homes England customer database and weighted to be representative of all Help to Buy scheme customers, has provided more information about who Help to Buy scheme customers were demographically. According to the survey findings:
- 28% of customers were aged 18-34, 65% aged 35-54 and 6% aged 55 or older
- nearly all (95%) were in paid employment
- almost half of customer households (47%) had dependent children
- 7% customers had long term health conditions
9.3 Customer experience of the scheme and the Help to Buy property
According to the customer survey, shown in Figure 9.1, most customers were satisfied with their experience of the scheme and the property they bought, with customers highlighting positive experiences around being able to afford a property, the quality of new build properties and their wellbeing.
Over 7 in 10 (71%) customers reported being satisfied or very satisfied with their experience of using the Help to Buy scheme. In contrast, 1 in 6 (17%) of all customers reported being dissatisfied or very dissatisfied with their experience of the scheme. Negative experiences reported from the survey were largely centred around issues with repayment of the loan and poor customer service from the loan administrator. Customers dissatisfied with their scheme experience were more likely than other customers to be financially struggling (32% dissatisfied) and paying interest on the loan (21% dissatisfied).
Figure 9.1: Customer satisfaction with experience of using Help to Buy
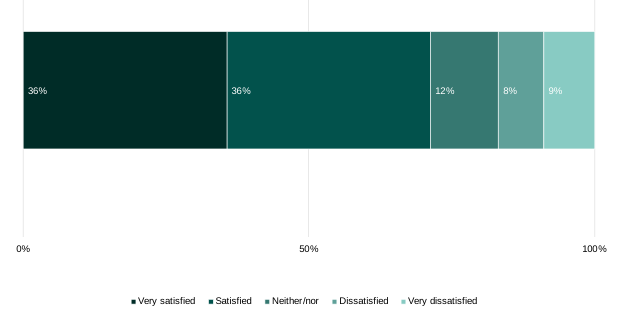
Source: Q29. And overall, how satisfied or dissatisfied are/were you with your experience of using Help to Buy? Base: All respondents (5869).
Alternative text
Horizontal stacked bar chart based on all customers surveyed (n = 5869)
Left to right:
Very satisfied: 36%
Satisfied: 36%
Neither / nor: 12%
Dissatisfied: 8%
Very dissatisfied: 9%
Through the survey customers reported high satisfaction with their Help to Buy scheme property, with 86% of customers feeling satisfied or very satisfied with their property. As shown in Figure 9.2, on the other hand, 8% of customers reported feeling dissatisfied or very dissatisfied with their Help to Buy scheme property. Customers dissatisfied with their property were more likely than other customers to be living in London (13% dissatisfied compared to 7% in other regions), in arrears on their equity loan (22% dissatisfied) or having financial problems (19%). The most common source of dissatisfaction was the quality of the property itself, though customers also shared challenges around the repayment of interest and other charges, such as service charges.
“The development was not to the standard that was expected, both in terms of master planning and build quality.” – Help to Buy 2 customer, with a live account, Yorkshire and the Humber (customer survey)
Figure 9.2: Customer satisfaction with property purchased using Help to Buy
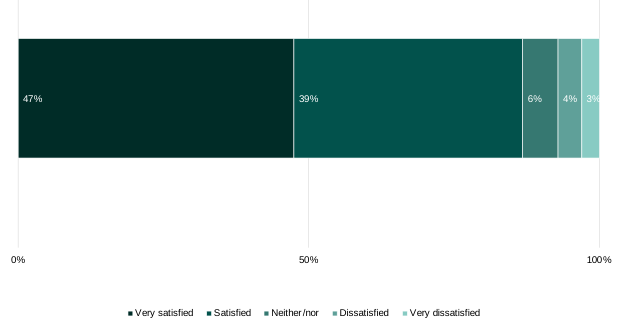
Source: Q27. Overall, how satisfied are/were you with the property you purchased using Help to Buy? Base: All respondents (5,869)
Alternative text
Horizontal stacked bar chart based on all customers surveyed (n = 5869)
Left to right:
Very satisfied: 47%
Satisfied: 39%
Neither / nor: 6%
Dissatisfied: 4%
Very dissatisfied: 3%
9.4 Benefits of the scheme
Customers described in qualitative interviews that the main benefits of the scheme were the scheme’s administration, the speed of purchase (ability to buy quicker), affordability (ability to afford a property), the property type, value and quality, and the 5-year interest free period.
Scheme administration: Customers interviewed described the scheme’s application process to be easy and smooth. Communications from the loan administrator during the scheme were reported to be minimal, which many customers considered a positive of the scheme.
Speed of purchase: Customers interviewed highlighted that the scheme enabled them to purchase a property earlier than they would have been able to. Customers said that this was possible due to their ability to put down a much lower deposit on a property, so would not have had to save for so long.
“It’s made me able to do it far, far earlier than I would’ve otherwise planned to do it.” - Help to Buy 2 customer, with a live account, London
Affordability: Customers interviewed said that the scheme made home ownership attainable or a possibility, particularly through the ability to purchase a home with a smaller deposit than would otherwise be required. FTB and buyers who bought alone particularly shared this sentiment, as they often had small deposits that would not be sufficient for a deposit on a property through traditional home-buying routes. Some customers described being able to retain savings due to the lower deposit and spend this on other costs associated with buying a home (such as furniture).
“That was the most appealing thing, the lower deposit requirement and that the mortgage would be lower. This was attractive to us as first-time buyers.” - Help to Buy 2 customer, with a live account, East Midlands
Property type, value and quality: Customers interviewed reported that they were able to purchase a larger property than they could have afforded without the scheme. This was particularly prevalent amongst FTB. Customers also shared that the scheme enabled them to purchase a higher value property than they otherwise would have been able to afford. The quality of the Help to Buy scheme property was described positively by all customers interviewed. Most customers interviewed experienced few issues or compromises related to the quality of the home.
“Help to Buy was fairly key, if we hadn’t had the Help to Buy Scheme we probably would’ve gone for something much smaller and further out. So it allowed us to sort of take a step up in lifestyle and quality of location.” - Help to Buy 1 customer, with a redeemed account, London
Customers interviewed particularly felt the warranties and guarantees that came with buying a new build to be a positive benefit of the scheme.
“I think the security of having warranties and those kinds of things, and everything being new, that’s more of a reassurance that you know you’re going to be safe financially at least for a couple of years.” - Help to Buy 2 customer, with a redeemed account, Yorkshire and the Humber
Customer survey data indicated that customers saw many positives to buying a newly built home, primarily that they could take advantage of the Help to Buy scheme (71%), with 4 in 10 specifically saying that the scheme enabled them to buy a bigger property (41%). Further reasons for buying new properties included good locations (51%) and avoiding the chain of buyers and sellers (42%).
The 5-year interest free period: This was viewed as an attractive benefit of the scheme by all customers interviewed, as customers felt that it offered a sense of financial relief and reduced the pressure of paying back the loan during the first 5 years of home ownership. Some customers described how they were able to save or overpay their mortgage during the 5-year interest free period.
Customers interviewed whose property value increased saw this to be a benefit of home ownership and therefore a benefit of scheme, as it allowed them to have an asset that they could sell and make a profit on in the future. However, customers interviewed felt an unexpected negative consequence of this was having to pay the interest payments and full equity loan in relation to the current, higher, value of the property rather than its original price. Customers who were financially struggling, less informed of the scheme or less confident in managing their financial commitments particularly shared this sentiment.
9.5 Challenges of the scheme
The customer survey and customer interviews both provide evidence on the challenges customers experienced as a result of using the scheme.
The customer survey asked about the negatives of both the Help to Buy scheme and the Help to Buy scheme’s properties specifically. Customers who were dissatisfied with their property reported the foremost reason for this was that it was poor quality or poorly built (59%). Among customers dissatisfied with the scheme the main reason for dissatisfaction was difficulties with loan or interest repayments (49%). For customers interviewed qualitatively the main challenges with the scheme were around the loan redemption process and the equity loan terms.
Loan redemption process: In the interviews, the redemption process was widely viewed by both customers who had redeemed and customers who had not redeemed as complex and stressful. The challenges reported in interviews by those who had redeemed their loan were around the short length of time the valuation of the property lasts, the loan administrator not being responsive to their queries and having to coordinate and manage multiple stakeholders involved in the redemption process, including solicitors, surveyors, loan administrators, mortgage lenders and Land Registry. Customers interviewed who had not gone through the redemption process had shared their understanding of the redemption process as complicated and stressful, with some having heard negative experiences of the redemption process from friends and family who had redeemed their loans. Some customers who had sold their property found it difficult to sell, with some feeling that the location and smaller size rooms of a new build were less attractive to prospective buyers.
“I just think it’s a bit of a hassle and I think communication is poor between Help to Buy, a lender and a customer… I just feel like it’s a lot of back and forth and it could be made a lot easier.” - Help to Buy 2 customer, with a live account, West Midlands
Some customers interviewed who had redeemed, as well as some who had not yet redeemed, also felt that the additional costs associated with redemption were unfair and expensive. The costs included solicitor fees, surveyor costs and the administration fee to loan administrators to redeem the loan.
“I should’ve asked a few more questions cause you don’t quite realise like the extra financial costs that aren’t cheap when it comes to backend of getting rid of your Help to Buy.” – Help to Buy 1 customer, with a redeemed account, North West
The complexity and costliness of the redemption process was viewed by customers interviewed as a negative unexpected consequence of the scheme, and some customers were put off from moving or selling their property due to this process. This view was shared by both customers who were well informed of the scheme and customers who were less informed of the scheme. There is more on customers who redeemed in section 9.10.
Equity loan terms: Although customers interviewed saw both pros and cons to their property values increasing, several disliked the equity loan terms or did not fully understand them on joining the scheme. This misunderstanding or disagreement was considered a negative consequence of the scheme for these customers, as they did not know they would be paying interest or repaying the loan based on the current property value rather than the original price. Some customers felt it was unfair that the amount to be repaid is linked to the property’s current value, alongside interest payments that increase over time, as this made it harder for them to afford to redeem the equity loan. A few customers said they did not realise the interest payments would not be contributing to paying off the loan.
“I didn’t look at the small print… I should’ve realised at the time, really, that we’re going to end up paying back more than what we borrowed.” - Help to Buy 1 customer, with a live account, West Midlands
9.6 Types of customers who benefited from the scheme
Customers interviewed of all household types (e.g. single, families, couples without children, elderly) said that they benefitted from the scheme. Customers who bought in London and both FTB and previous homeowners expressed how the scheme had a particularly positive impact on them.
Customers interviewed who lived alone, customers with children and elderly reported benefiting from the scheme and described feelings of security, stability and the property meeting the needs of their household. Many customers described how the scheme had improved their household’s wellbeing by giving them access to a larger home with enough space for all household members.
“I definitely think it’s helped with mental health as we have more space, we’re fortunate enough that the kids can have a toy room downstairs, and they’ve got their own space, own bedroom, I’ve got my own office space to work from home, it definitely has a big impact on family life.” - Help to Buy 2 customer, with a live account, North East
This improvement in wellbeing is reflected in the survey findings where customers self-reported their current life satisfaction at an average of 7.4, increasing from 6.8 before the house purchase (self-reported perception of life satisfaction before the purchase of a home under the Help to Buy scheme). This compares well to the national average of 7.5 out of 10 as reported by the Office for National Statistics (ONS, 2025).
Customers interviewed who bought in London had also felt they had benefitted from the scheme, as they believed they would have not been able to afford a home in London without the scheme. This is supported by analysis of the Homes England customer database which shows that customers were considerably less able to afford homes in London than in other regions: only 30% of the Help to Buy 1 scheme’s customers and 22% of Help to Buy 2 scheme customers buying in London could have bought without the scheme compared to the national averages of 78% in Help to Buy 1 and 62% in Help to Buy 2.
Customers in London who took part in the customer survey also reported that their use of the Help to Buy scheme had a positive impact on their finances in general. More than 4 in 10 (49%) based in London said their finances had got a lot or a little better compared with the average (43%).
However, customers interviewed who had bought in London also faced the most challenges with their property for reasons beyond the scheme. They were more likely to be in leasehold flats and experienced issues with poor property quality, additional costs (such as ground rent) and the poor management of their buildings by building management companies.
“It’s around the leasehold system, the fact that Help to Buy allows you to buy into a lease but you don’t understand the issues with ground rent until later on.” - Help to Buy 1 customer, with a redeemed account, London
In the interviews, FTBs from both the Help to Buy 1 and Help to Buy 2 scheme had reported benefitting from the scheme as it allowed them to get on the property ladder much quicker than they could otherwise afford to. However, FTBs interviewed were less likely to be aware of the additional costs associated with buying a new property (such as legal fees, stamp duty, moving costs) and found these costs to be an unexpected negative consequence of purchasing a property. Whereas those interviewed who were previous homeowners, eligible for the scheme through the Help to Buy 1 scheme, benefitted from having a larger deposit and being able to climb up the property ladder (a bigger property and higher value home).
9.7 Property buying behaviour
The scheme affected property buying behaviour by reducing the deposit as a limitation on customers’ ability to purchase. This allowed customers to buy larger, more expensive properties in their desired locations and made home ownership possible for those customers who did not expect to buy at all. It also enabled customers to purchase desired new build properties, including directing customers who were not looking to buy a new build towards these homes.
It reduced the deposit as a limitation on customers’ property purchase
Customers interviewed said that the deposit on a property was the main barrier in purchasing a property and the scheme lowered that barrier by making the deposit a much more affordable amount.
Customers interviewed shared how monthly mortgage payments were comparable or sometimes cheaper than what they would be paying in rent. The scheme also contributed to them owning their property.
It allowed customers to buy a larger, more expensive property in their desired location
Two fifths (41%) of customers from the customer survey said the scheme enabled them to buy a bigger property. In interviews, customers expanded on this saying that they were able to buy a larger, more expensive property in a desired location than they would have been able to afford without the scheme. This was particularly relevant to existing homeowners, who described using the profit from their previous property sale to buy a higher value or larger property in their desired location.
It made home ownership an option for customers who did not foresee being able to buy a property
In the interviews, customers who did not foresee buying a property or did not think they could afford a property in their desired area said that the scheme was the only way they were able to buy a property at that time.
“If this scheme didn’t exist, we couldn’t buy anything here, because we didn’t have money…it was the only option” – Help to Buy 1 customer, with a live account, London
4 in 5 (81%) of customers from the customer survey shared a similar sentiment and said the Help to Buy scheme enabled them to buy a property sooner.
It enabled customers to buy a desired new build property
Customers interviewed who were already interested in buying a new build property said that the scheme made it possible for them to afford one, which suggested that customers viewed new build properties as having a higher price. The impact analysis also shows this to be the case (see section 7.7). Customers interviewed liked new builds for their modern décor and their lack of pre-existing issues, as customers could move in and not have to do any work to the property. Warranties and guarantees on the home’s facilities provided customers with financial and mental reassurance for a few years, since they wouldn’t have to worry about additional costs for repairs.
“We had 11 years of renovating a property, so we wanted to just move in here and not have to do anything… It wasn’t a compromise, this house was more than we could’ve ever hoped for.” - Help to Buy 1 customer, with a live account, North East
It directed customers who were not looking to buy a new build property to purchase one
Customers interviewed who were looking at only second-hand properties or a mixture of both second-hand properties and new builds felt they were steered towards buying new builds because of the scheme. About half (49%) of customers from the customer survey said the Help to Buy scheme completely affected their decision to buy new build.
9.8 Access to mortgage finance
Customers felt the scheme and equity loan helped them access more positive mortgage terms, including lower monthly mortgage payments and more favourable interest rates, notably the Help to Buy 1 scheme’s customers, when interest rates were generally lower. The Help to Buy 1 scheme customers often attributed the low interest rates on their mortgages to the scheme rather than to the financial markets.
Customers said that they mostly found consulting a mortgage broker and finding a mortgage easy, but a few said that the Help to Buy scheme restricted their mortgage options as only specific banks would lend on Help to Buy scheme properties. These customers were told that banks would only lend a certain amount on Help to Buy scheme properties per development, limiting their options. However, despite having fewer borrowing options, customers still bought through the scheme as they found it to be more affordable relative to buying outside the scheme.
“I had no choice at all, they [banks] could only lend me this amount of money, so that’s why I had to give my everything on the deposit.” - Help to Buy 2 customer, with a live account, London
9.9 Management of financial commitments to the scheme
Most customers were managing their financial commitments to the scheme well either by paying interest payments or by redeeming the loan. However, a majority of customers said that they hadn’t yet paid back their loan in full.
9.9.1 Equity loan repayment
Overall, as shown in Figure 9.3, 3 in 5 (58%) customers from the customer survey stated that they hadn’t yet paid back their loan in full. Of these, 2 thirds (66%) indicated they were being charged interest on the Help to Buy scheme’s loan.
For customer with live accounts who responded to the survey, just under half (48%) planned to pay off the loan in the next 5 years, with just under a third (30%) planning to pay off the loan in the next 2 years. Delays in paying off the Help to Buy scheme’s loans were primarily due to customers not having enough savings (58%) or being unlikely to sell (28%).
Figure 9.3: When customers plan to pay off their equity loan (among customers with live accounts)
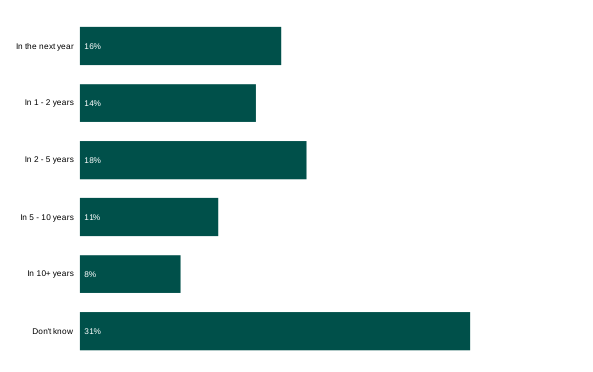
Source: Q20. When do you plan to repay your Help to Buy: Equity loan in full? Base: All respondents who have not fully paid off the equity loan (3074)
Alternative text
Horizontal bar chart among customers who have not yet paid off their equity loan
In the next year: 16%
In 1 - 2 years: 14%
In 2 - 5 years: 18%
In 5 - 10 years: 11%
In 10+ years: 8%
Don’t know: 31%
9.9.2 Interest payments
Over 9 in 10 (94%) customers who were paying interest payments reported through the survey that they were up to date with these. This is 3 percentage points higher than the proportion up to date on interest payments in the Help to Buy scheme’s administrative data (91%), suggesting that some customers may not be aware that they were in arrears on their interest payments.
3 in 5 (59%) of customers paying interest reported through the survey that they were keeping up financial commitments without issues. Customers surveyed who had children, and customers who were struggling financially, were more likely to be in arrears on their interest payments. In qualitative interviews, some customers said they were in arrears because they had to prioritise other payments or experienced administrative difficulties with the loan administrator.
9.9.3 Confidence, knowledge and understanding of financial commitments
The customer survey indicated that confidence in managing Equity Loan payments and levels of understanding of how the loan worked were generally high. At point of purchase, 91% were very or quite confident in their ability to pay the mortgage. A further 79% were confident in paying the equity loan interest and 76% in paying the loan itself. Confidence was lowest when it came to understanding how much the Help to Buy interest payments would be (68%). Over time, while most remained confident in their ability to pay any repayments or interest payments, levels of confidence in ultimately repaying the loan itself fell to 66%. Those who had not paid off any part of the loan were likely to be less confident.
Similarly, knowledge of how the Equity Loan worked was high. A majority (71%) had always been aware repayment amounts depend on property value. A minority (23%) became aware either after taking out the loan or when repaying. A very small proportion (5%) only became aware of this fact when completing the survey. Customer confidence in the ability to manage their mortgage and repayments was typically higher among those who were always aware of how the repayments varied based on property value.
The extent to which customers were confident about managing their finances, or aware and knowledgeable about the Help to Buy scheme determined their ability to manage their financial commitments to the scheme. Through interviews, customers’ accounts suggested that their approach to managing Help to Buy commitments varied considerably. At one end, some customers astutely managed their finances to maximise the scheme’s financial benefits. At the other, some had a more limited understanding of how the scheme works and were correspondingly less financially strategic.
Customers interviewed who were astute financial planners had either redeemed their loan or were saving to pay it before the 5-year interest free period ended. Whereas customers who were less financially strategic were less likely to have redeemed their loan or have plans to redeem their loan before the 5-year interest free period ended.
Astute financial planners: Customers described making the most of the 5-year interest free period (either through using the period to save money, or by overpaying their mortgage so they could re-mortgage and pay off the loan). Astute financial planners said they had either never planned to pay interest payments or were planning to pay interest payments for a few years before redeeming the loan.
Well informed but financially apprehensive: These customers were aware of their commitments, but felt nervous and anxious about paying interest payments and redeeming the loan. Such customers often shared that they had not properly planned when and how they would pay off the loan.
Less financially strategic: These customers felt uncertain about when and how they would pay off the loan. Being the least informed, these customers were most unaware of the scheme’s terms in general, such as the equity loan terms.
“I feel very anxious about it to be honest, more recently. I just feel like I don’t know what that is going to look like. I find it is already quite difficult to manage everything financially the way that it is without adding financial burden on top of that. I don’t know what our finances will look like at the time, but it is also 2 years ago so who knows what my job will look like as well, I might be making more money, it’s just an uncertain feeling about it.” - Help to Buy 2 customer, with a live account, North East
Figure 9.4 illustrates how customers fall into these categories based on their levels of confidence or awareness and knowledgeability of the Help to Buy scheme.
Figure 9.4: How customers are managing financial commitments to the scheme
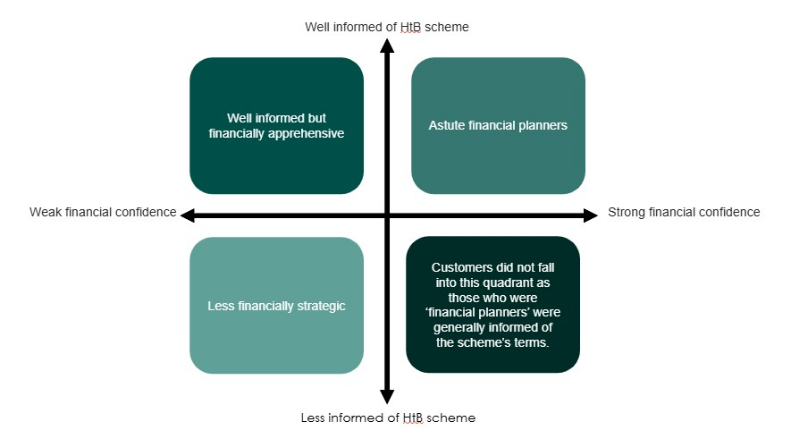
Source: Data from qualitative interviews with Help to Buy scheme customers
Alternative text
Four-quadrant diagram showing customers’ ability to manage Help to Buy financial commitments based on 2 axes: financial confidence (low to high, left to right) and level of knowledge of the scheme (low to high, bottom to top). Top left shows ‘well informed but financially apprehensive’, top right shows ‘astute financial planners’, bottom left shows ‘less financially strategic’, and the bottom right notes that no customers fell into this category, as those with strong financial planning skills were generally well informed about the scheme.
9.9.4 Impact of financial commitment to the scheme
From the survey, 3 in 5 customers (59%) of both live and redeemed accounts reported feeling able to keep up with bills and credit commitments while managing financial commitments to the Help to Buy scheme. However, over a third of customers (36%) reported struggling to keep up with bills and credit commitments while managing financial commitments to the scheme, and 2% were falling behind on bills and credit commitments due to financial commitments to the scheme.
Concerningly, the customer survey found 1 in 6 (17%) respondents had said their general finances had got worse as a result of purchasing a property using the scheme. The survey found that lower-income households, those with children and customers in arrears on their interest payments reported having worse finances as a result of using the scheme (21%, 19% and 38% respectively). For example, some customers interviewed in single-income households said that the mortgages available to them capped the home they could afford and required higher monthly payments than if they had been a dual income household. Customers interviewed who were in arrears described facing significant mental strain due to juggling competing financial pressures, particularly if they had children and their interest payments had increased as a result of their property value increasing.
“We don’t really go out to be honest because by the time you pay your mortgage and then the Help to Buy, there’s not really much money left because you’ve got to pay all the other bills.” - Help to Buy 1 customer, with a live account, in arrears, London
9.10 Redemption of loans and customer experience of moving to a new property after redeeming their loan
The customer survey found that 53% of Help to Buy 1 customers had redeemed their loan, compared with 14% of Help to Buy 2 customers who had fully or partly repaid their loan.
Among customers who had redeemed (either partially or in full), the survey explored their reasons for doing so. 4 in 10 (43%) customers said they redeemed their loan because the interest‑free period was ending. 3 in 10 said they repaid to increase their equity share (31%) or because they wanted to sell the property (31%).
In terms of how redemption was financed, 2 in 5 customers (41%) who redeemed their loan did so by increasing the size of their first charge mortgage. 3 in 10 sold the property (31%), and 19% reported using savings set aside for this purpose.
Qualitative interviews provide additional context on customers’ circumstances following redemption. Interviewees who had redeemed their loan were typically in 1 of 3 situations:
- they had sold their property and were living elsewhere,
- they had redeemed but continued to live in the property, or
- they had moved elsewhere and were renting out the property
Survey data supports this variation in outcomes, indicating that 23% of respondents no longer owned the property and a further 4% owned the property but did not live in it. Among those who had moved out, more than half (56%) reported doing so to move to a bigger property.
Qualitative findings suggest that moves were often driven by changing household needs. Customers who had moved typically described their new property as being in a more desirable area, more convenient for work, or offering better access to schools. Some also reported that moving to a larger property better met the needs of a growing family. A small number of interviewees reported renting out their Help to Buy property, often after moving in with a partner.
However, interviews also highlight challenges associated with redemption linked to property sales. Some customers reported intending to sell their property to fund redemption but found it difficult due to long selling times (in some cases up to a year). Those who were able to sell described the process as stressful, particularly due to the need to align the redemption application with the property sale. The 3-month validity period of property valuations was cited as adding to this pressure.
Among customers who had not yet redeemed, around a third (32%) of those intending to move expected to do so later than they would ideally like. This was more commonly reported among customers in London (36%) and those who bought flats (37%). Customers with additional pressures, such as dependent children or financial constraints, were also more likely to anticipate delays in moving.
9.11 Counterfactuals to using the scheme
The counterfactual evidence suggests that while many of the Help to Buy scheme’s customers could have bought a property without the scheme, it would have required significant compromises in terms of their living situation and finances. The study investigated how the Help to Buy scheme’s customers’ property buying behaviour could have differed in the absence of the scheme using 3 sources of evidence: qualitative interviews with customers, findings from the customer survey, and secondary analysis of the Homes England customer database. These sources use different measures and assumptions, which explains why some figures differ between them.
The secondary analysis of Homes England customer data calculated whether customers could have afforded to buy a home without the scheme, based on their household income for their purchase. It used a simple rule of thumb that lenders usually let people borrow up to 4.5 times their yearly household income. A second piece of analysis of the same data modelled how customers finances would have looked in 2 scenarios: buying without the scheme, or renting and saving for a deposit for a longer period of time.
The mortgage affordability calculations found that most customers on both iterations of the scheme could have afforded to buy an average FTB home in their local authority without the scheme. However, the proportion of customers who could have afforded such a home without the scheme in London was lower than the national average for both schemes. Nationally, nearly 4 in 5 (78%) Help to Buy 1 scheme customers were able to afford an average FTB home in their local authority without the scheme, compared with a proportion in London that was 47 percentage points lower. 3 in 5 (62%) Help to Buy 2 scheme customers nationally were able to afford an average FTB home in their local authority without the scheme, with the corresponding proportion in London 39 percentage points lower.
Despite mortgage affordability calculations suggesting a majority of customers would have been able to buy a home without the scheme, the qualitative interviews and the quantitative counterfactual scenarios found there to be 2 additional counterfactuals to using the scheme.
Customers buying what they could afford themselves at that time: Customers interviewed said they would have bought a smaller property and most probably not in their preferred area.
Additional quantitative analysis of the Help to Buy scheme’s customer data was conducted to consider customers’ financial counterfactuals if they were able to buy without the scheme with the same cash deposit. In this scenario, buying a cheaper home without the scheme, customers would have paid lower mortgage costs, had lower mortgage debt and paid slightly lower mortgage payments. However, on average, a customer would have accrued £14,215 more wealth from the value of their share of their Help to Buy scheme home than from owning 100% of a counterfactual home. Overall, 77% of customers were estimated to be better off financially by buying through the Help to Buy scheme, and 23% were worse off; albeit all had the benefit of living in a higher value home. For more on this analysis and findings please see the technical report.
Customers saving for longer and continuing to rent: Customers interviewed said they would have bought an identical or similar property but after actively saving for a deposit for longer (from a few months to a few years). Customers also said that they would have continued renting or living in their previous home (such as in their parents, previous property, or partner’s home) until they could consider buying a home, often feeling that this would be a very long time. Customers who bought in London particularly shared this sentiment.
In addition, further quantitative analysis of the Help to Buy scheme’s customer data was conducted to consider customers’ financial counterfactuals if they continued renting rather than buying with the scheme. It is estimated that the counterfactual renters would have paid on average £16,063 more rent than they paid on average in cumulative mortgage payments and interest on a Help to Buy scheme property. If in the alternative scenario it is assumed that customers retained a deposit while they rented, then the Help to Buy scheme customer would have gained £40,836 more in wealth from the increase in their Help to Buy scheme home value, than from savings interest on a deposit. For more on this analysis and findings please see the technical report.
9.12 Alternative forms of support
Customers interviewed generally perceived alternative homebuying support, such as shared ownership and 95% mortgages, as offering weaker value for money than the Help to Buy scheme. Customers interviewed described shared ownership as something that was unattractive and not worth the money. They did not see the value in paying rent and a mortgage if they would not own the whole property in the end. Customers had also heard of other people’s negative experiences of shared ownership and wanted to avoid this.
“I wanted to know that the property was mine and when I pay the money over and do the redemption, that it would be then mine at the end of it.” - Help to Buy 2 customer, with a live account, North East
Additionally, many customers interviewed said they had not considered 95% mortgages at all, with some not knowing what they were. Customers who had looked into them for a similar value property as their Help to Buy scheme property found the interest rates on 95% mortgages to be higher, with higher monthly mortgage payments than on the 75% or less loan available to them through taking the Help to Buy equity loan.
10. Conclusions
This chapter summarises the findings of the Help to Buy scheme evaluation and looks at considerations for any future such scheme. It covers:
- the impact on home ownership, housing supply and prices
- value for money of the scheme
- customer experiences and perceptions of the scheme
- overall conclusions
10.1 Expanding home ownership in some areas and accelerating progress on the housing ladder
The findings suggest that the Help to Buy scheme was effective in supporting people into home ownership in some areas, but did not remove affordability barriers for first-time buyers (FTBs) in areas that were already relatively expensive.
The study provides evidence that the introduction of the Help to Buy scheme led to an increase in home ownership in areas close to the England/Wales border, around 15-30% of FTB mortgage sales is attributable to the Help to Buy scheme.
The increase in the maximum equity loan value in London did not lead to an increase in the number of FTB mortgage sales in London, and may have had a small negative effect on home ownership (due to increasing prices in London).
The number of new Help to Buy customers was lower after the end of Help to Buy 1 and there is some evidence that the closure of the scheme had a negative impact on the number of FTB mortgages. However, it is unclear how much influence the scheme design changes for Help to Buy 2 had alongside the effects of events with economic impacts such as COVID-19 and the Growth Plan 2022 (‘mini budget’).
Analysis of data from the customer survey found that almost half (46%) of Help to Buy scheme customers said they would not have been able to buy without the Help to Buy scheme. However, for remaining customers, the Help to Buy scheme was used to buy the home they wanted, even if they said they could have afforded a different home without the scheme.
10.2 The Help to Buy scheme is estimated to have increased new housing supply by around 15%
The impact analysis suggests that the introduction of the Help to Buy scheme supported increases in new housing supply in England. Specifically, the econometric analysis suggests that around 15% of new builds in England built over the course of Help to Buy 1 and Help to Buy 2 (2013 to 2023) were the result of the Help to Buy scheme.
The study does not find strong evidence for an effect on housing supply from either the increase in the maximum loan value in London in 2016 or the introduction of regional price caps with Help to Buy 2 in 2021. Similarly, it does not find evidence that the end of the Help to Buy scheme in 2023 led to a substantial impact on new housing supply. However, developers reported that they perceived that demand had reduced in recent years, including from the end of the Help to Buy scheme.
Taken together, these findings suggest the Help to Buy scheme had an effect on housing supply in the early stages of the scheme but not at later stages. This could be because the introduction of the Help to Buy scheme helped the market start to recover following the financial crisis (leading to an increase in housing supply at this point). Once new housing supply had recovered to similar levels as seen before the financial crisis, the Help to Buy scheme had less of an effect on housing supply.
The Help to Buy scheme had a positive impact on the revenues, profits before tax and profit margins of developers with strongest evidence for small and medium developers and a similar pattern estimated for larger developers. These impacts peaked from 2016 onwards as Help to Buy enabled developers to increase their output. These observations have implications for future schemes. For instance, if the Help to Buy scheme were to be repeated, there are opportunities to ensure the surpluses generated by the scheme are recycled into further development.
10.3 Increase in house prices from the Help to Buy scheme where prices were already high
House prices were steadily increasing across all regions before the start of the Help to Buy scheme and generally continued to increase at a similar rate over the course of the scheme. Price increases were especially large in London between 2013 and 2018. The Help to Buy scheme is likely to have contributed to these increasing prices, especially in areas which were already relatively expensive.
However, the evidence about the precise scale of an effect on prices in a given area is mixed. Comparing sales close to the England/Wales border, the evaluation concludes that any effect of the Help to Buy scheme on prices in these areas was likely small (up to 2%). On the other hand, the effect on prices around London is unclear. The analysis suggests a modest effect on prices in London from the increase in the maximum loan value there in 2016.
The analysis suggests a reduction in average new build house prices in England following the closure of the scheme.
The analysis finds evidence of both a new build premium, prices for new builds being about 5% higher than similar second-hand homes, and a small Help to Buy scheme premium, prices for Help to Buy homes being around 1% higher than similar non-Help to Buy new builds (so a 6% total combined premium).
10.4 The Help to Buy scheme represented good value for money
The Help to Buy scheme represents very high value for money. The Help to Buy scheme is estimated to have generated a net present social value of £25.1 billion in 2024/25 prices. This comes from increasing housing supply, which benefits society, as well as the equity loan that is repaid. Wider non-monetised benefits included improvements in wellbeing for Help to Buy scheme customers, employment benefits by building additional properties and the environmental benefits from efficiency of new homes.
10.5 Help to Buy scheme customers were largely satisfied, though financial literacy was mixed
Customers were largely positive about the Help to Buy scheme. They were highly satisfied with their property, especially liking a new build home. The scheme enabled FTBs to get on the property ladder more quickly than otherwise possible and, during the Help to Buy 1 scheme, enabled existing homeowners to access a larger deposit and climb the property ladder. A wide range of customers and household types benefited from the Help to Buy scheme, though customers who bought alone, households with children, customers who bought in London or older customers particularly benefited from the scheme.
While many customers found the scheme easy to enter, use and understand, understanding of key equity loan terms was weaker; in particular, interest payments and repayment linked to the property’s current value, not the original value. Also, the scheme’s redemption process was often described as a negative experience, due to having to manage multiple stakeholders, short valuation periods and poor communication from the loan administrator.
Customers who were financially struggling, less informed of the scheme or less confident in managing their financial commitments to the scheme reported more negative experiences of the Help to Buy scheme. Therefore, it continues to be important to provide clear information to customers before and after they enter any future such scheme.
Most customers, though, reported that they were financially better off by buying through the Help to Buy scheme as opposed to renting or continuing to save.
10.6 The Help to Buy scheme delivered its aims but impacts varied by context and area
The Help to Buy scheme originally launched in 2013, when housebuilding and buying were at a low point after the financial crisis of 2008-09. The scheme helped to boost both demand and supply of new build homes, especially under the first, Help to Buy 1 scheme. The findings suggest less impact overall from Help to Buy 2, though this was after COVID-19 and at a time of rising interest rates. Any future scheme must be responsive to the wider economic conditions at that time and not expect the same level of impact.
Overall, the Help to Buy scheme expanded home ownership, particularly in already affordable areas. For some people, it helped them onto the housing ladder sooner or for those who may not have been able to afford to buy. For others, including existing homeowners under Help to Buy 1, it supported people to skip a rung on the housing ladder and buy bigger or higher quality properties than they otherwise would have been able to.
The design of any such scheme will therefore influence who can and will take part. The evaluation findings therefore underline the importance of clarity about the intended beneficiaries and geographies of any similar scheme, particularly where the intended effects relate to specific groups or places as well as to national-level outcomes.
Around 15% of new builds in England built over the course of Help to Buy 1 and Help to Buy 2 (2013 to 2023) were estimated to be attributable to the Help to Buy scheme. The scheme boosted developer confidence, especially in the earlier years of the scheme. However, the study did not find strong evidence for an effect on housing supply from either the increase in the maximum loan value in London in 2016 or the introduction of regional price caps with Help to Buy 2 in 2021.
The introduction of the Help to Buy scheme is likely to have contributed to an increase in property prices in some areas, around 2%, especially in the least affordable areas. The analysis finds an additional 1% Help to Buy scheme premium over and above the existing new build premium.
The Help to Buy scheme represented very high value for money to government through supporting new, additional housing supply and being a financial transaction, a loan to be repaid rather than a grant.
Help to Buy scheme customers were largely satisfied, particularly with their new build property. While many customers found the scheme easy to enter, use and understand, understanding of key equity loan terms was weaker.
Today’s socio-economic environment is different to 2013. Inflation is higher than during Help to Buy 1, with interest rates also higher. There are more 95% mortgages available, though the monthly cost of paying a mortgage is higher today than even in early 2022. Any future scheme must therefore consider the ongoing affordability of home ownership as much as access to buying a home in the first place. The impact of the Help to Buy scheme must therefore be seen in its social and economic context.
Bibliography
The evaluation has drawn on the published research and documents listed below.
Barclay, S. (2017) ‘One million Help to Buy: ISAs opened’, HM Treasury. Retrieved from: https://www.gov.uk/government/news/one-million-help-to-buy-isas-opened
Bank of England. (2022) ‘Monetary Policy Summary, December 2022’, Bank of England. Retrieved from: https://www.bankofengland.co.uk/monetary-policy-summary-and-minutes/2022/december-2022
Barker, K. (2004) ‘Delivering stability: Securing our future housing needs, Barker Review of Housing Supply – Final Report’, HM Treasury. Retrieved from: https://webarchive.nationalarchives.gov.uk/ukgwa/+/http:/www.hm-treasury.gov.uk/barker_review_of_housing_supply_recommendations.htm
Benetton, M., Bracke, P., Cocco, J.F. and Garbarino, N. (2019) ‘Housing consumption and investment: Evidence from shared equity mortgages’, Bank of England Staff Working Paper No. 790, Bank of England. Retrieved from: https://www.bankofengland.co.uk/working-paper/2019/housing-consumption-and-investment-evidence-from-shared-equity-mortgages
Boileau, B., Conwell, L. and Levell, L. (2026) ‘Who is helped by Help to Buy schemes? Working paper’, lnstitute for Fiscal Studies. Retrieved from: https://ifs.org.uk/sites/default/files/2026-04/WP202627-Who-is-helped-by-help-to-buy-schemes_0.pdf
Carozzi, F., Hilber, C. and Yu, X. (2024) ‘On the economic impacts of mortgage credit expansion policies: Evidence from Help to Buy’, Journal of Urban Economics, 139. Retrieved from Elsevier: https://www.sciencedirect.com/science/article/pii/S0094119023000815
Chi, B., Dennett, A., Oléron‑Evans, T. and Morphet, R. (2021) ‘A new attribute‑linked residential property price dataset for England and Wales, 2011–2019’, UCL Open: Environment, 2. Retrieved from UCL Press: https://journals.uclpress.co.uk/ucloe/article/id/1332/
Committee of Public Accounts. (2019) ‘Help to Buy: Equity Loan Scheme’, House of Commons. Retrieved from: https://publications.parliament.uk/pa/cm201719/cmselect/cmpubacc/2046/204602.htm
Competition and Markets Authority. (2024) ‘Housebuilding market study: Final report’, Competition and Markets Authority. Retrieved from: https://assets.publishing.service.gov.uk/media/65d8baed6efa83001ddcc5cd/Housebuilding_market_study_final_report.pdf
Craigforth, Newhaven Research and Engage Scotland. (2020) ‘Evaluation of Scottish Government shared equity schemes’, Scottish Government. Retrieved from: https://www.gov.scot/publications/evaluation-scottish-government-shared-equity-schemes/
Department for Communities and Local Government (DCLG). (2016) ‘Evaluation of the Help to Buy Equity Loan Scheme’, DCLG. Retrieved from: https://assets.publishing.service.gov.uk/media/5a7f911840f0b62305b87ed2/Evaluation_of_Help_to_Buy_Equity_Loan_FINAL.pdf
Drayton, E., Levell, P. and Sturrock, D. (2024) ‘The determinants of local housing supply in England’, Institute for Fiscal Studies (IFS). Retrieved from IFS: https://ifs.org.uk/publications/determinants-local-housing-supply-england
Enfield Council and Pocket Living. (2026) ‘Rebuilding the Ladder: The Definitive Set of Reforms for First-Time Buyers’, Enfield Council and Pocket Living. Retrieved from: https://www.thinkhouse.org.uk/site/assets/files/3352/pl0326.pdf
Finlay, S., Ipsos MORI, Williams, P., Whitehead, C., and the London School of Economics. (2016) ‘Evaluation of the Help to Buy Equity Loan Scheme’, Department for Communities and Local Government. Retrieved from: https://www.gov.uk/government/publications/evaluation-of-the-help-to-buy-equity-loan-scheme
Foye, C. and Shepherd, E. (2023) ‘‘Why have the volume housebuilders been so profitable?’, UK Collaborative Centre for Housing Evidence. Retrieved from: https://housingevidence.ac.uk/project/why-have-the-volume-housebuilders-been-so-profitable/
Hilber, C.A.L. (2013) ‘Help to Buy will likely have the effect of pushing up house prices further, making housing become less – not more – affordable for young would-be-owners’, LSE British Politics and Policy Blog, London School of Economics. Retrieved from: https://blogs.lse.ac.uk/politicsandpolicy/help-to-buy-help-to-who/
Hilber, C.A.L. and Mense, A. (2021) ‘Why have house prices risen so much more than rents in superstar cities?’, Centre for Economic Performance Discussion Paper. Retrieved from: https://cep.lse.ac.uk/pubs/download/dp1743.pdf
HM Revenue and Customs. (2017) ‘What you need to know about the new Lifetime ISA’, HM Revenue and Customs. Retrieved from: https://www.gov.uk/government/news/lifetime-isas-available-from-6-april-2017
HM Treasury. (2026) ‘The Green Book: Central Government Guidance on Appraisal and Evaluation’, HM Treasury. Retrieved from: https://www.gov.uk/government/publications/the-green-book-appraisal-and-evaluation-in-central-government/the-green-book-2026
HM Treasury. (2013) ‘Budget 2013: Chancellor’s statement’, HM Treasury. Retrieved from: https://www.gov.uk/government/speeches/budget-2013-chancellors-statement
HM Treasury (2017) ‘Help to Buy: mortgage guarantee scheme Quarterly Statistics’, HM Treasury. Retrieved from: [https://assets.publishing.service.gov.uk/media/5a823b63e5274a2e8ab5830e/H2B_MGS_Official_Statistics_Publication_-September_17.pdf](https://assets.publishing.service.gov.uk/media/5a823b63e5274a2e8ab5830e/H2B_MGS_Official_Statistics_Publication-_September_17.pdf)
Homes England. (2023) ‘Fact Sheet 8: Economic, social and environmental benefits’, Homes England. Retrieved from: https://www.gov.uk/government/publications/new-homes-fact-sheet-8-economic-social-environmental-benefits/fact-sheet-8-economic-social-and-environmental-benefits
Home Builders Federation. (2025) ‘Payback Time: Analysing Exchequer returns from the Help to Buy scheme’, Home Builders Federation. Retrieved from: https://www.hbf.co.uk/documents/14991/Payback_Time_Report.pdf
House of Commons Committee of Public Accounts. (2019) ‘Help to Buy: Equity loan scheme HC 2046’, House of Commons. Retrieved from: https://publications.parliament.uk/pa/cm201719/cmselect/cmpubacc/2046/2046.pdf
House of Commons Communities and Local Government Committee. (2017) ‘Capacity in the homebuilding industry: Tenth Report of Session 2016–17 HC 46’, House of Commons. Retrieved from: https://publications.parliament.uk/pa/cm201617/cmselect/cmcomloc/46/46.pdf
House of Lords Built Environment Committee. (2022) ‘Meeting housing demand: 1st report of session 2021–22’, House of Lords. Retrieved from: https://publications.parliament.uk/pa/ld5802/ldselect/ldbuiltenv/132/13202.htm
Institute for Fiscal Studies. (2024) ‘Housing supply elasticities and percentage changes in number of properties and house prices across England, 1996 to 2021’, London: Institute for Fiscal Studies. Retrieved from: https://ifs.org.uk/data-items/housing-supply-elasticities-and-percentage-changes-number-properties-and-house-prices
Jenrick, R. (2021) ‘Discounted homes for key workers and local residents as flagship First Homes scheme launches’, Ministry of Housing, Communities & Local Government. Received from: https://www.gov.uk/government/news/discounted-homes-for-key-workers-and-local-residents-as-flagship-first-homes-scheme-launches
Letwin, O. (2018) ‘Independent review of build out rates: Draft analysis’, HM Government. Retrieved from: https://assets.publishing.service.gov.uk/media/5b2d1ab2ed915d58821b3dbc/Build_Out_Review_Draft_Analysis.pdf
Manlangit, M., Karadimitriou, N. and Magalhães, C. (2022) ‘Everyone wins? UK housing provision, government shared equity loans, and the reallocation of risks and returns after the Global Financial Crisis’, International Journal of Housing Policy, 23, 1. Retrieved from Taylor & Francis: https://doi.org/10.1080/19491247.2022.2123270
McQuinn, K., O’Toole, C. and Slaymaker, R. (2021) ‘Credit access, macroprudential rules and policy interventions: Lessons for potential first-time buyers’, Journal of Policy Modeling, 43, 5, 944–963. Retrieved from: https://ideas.repec.org/a/eee/jpolmo/v43y2021i5p944-963.html
Ministry of Housing, Communities and Local Government. (2025) ‘The MHCLG Appraisal Guide (3rd ed.)’, HM Government. Retrieved from: https://www.gov.uk/government/publications/the-mhclg-appraisal-guide
Ministry of Housing, Communities and Local Government (MHCLG). (2026) ‘Live tables on net supply of housing’, Ministry of Housing, Communities and Local Government. Retrieved from: https://www.gov.uk/government/statistical-data-sets/live-tables-on-net-supply-of-housing
Money Helper (2026) ‘What are the Right to Buy and Right to Acquire schemes?’. Retrieved from: https://www.moneyhelper.org.uk/en/homes/buying-a-home/right-to-buy-right-to-acquire-in-england-wales-and-n-ireland
Moore, N., Davies, A., Cousins, L., Easton, L. and Houston, D. (2024) ‘Homebuyers’ needs research and the place of Help to Buy – Wales, Welsh Government’, GSR Report No. 48/2024. Retrieved from: https://www.gov.wales/homebuyers-needs-research-and-place-help-buy-wales
National Audit Office. (2019) ‘Help to Buy: Equity Loan scheme – progress review’, National Audit Office. Retrieved from: https://www.nao.org.uk/reports/help-to-buy-equity-loan-scheme-progress-review/
Office for National Statistics (ONS). (2021) ‘How has UK construction performed over the pandemic?’, Office for National Statistics. Retrieved from: https://blog.ons.gov.uk/2021/10/19/how-has-uk-construction-performed-over-the-pandemic/
Office for National Statistics (ONS). (2023) ‘Analysis of wage and price increases, UK’, Office for National Statistics. Retrieved from: https://www.ons.gov.uk/employmentandlabourmarket/peopleinwork/earningsandworkinghours/articles/analysisofwageandpriceincreasesuk/2011to2023
Office for National Statistics (ONS). (2024a) ‘First-time buyer mortgage sales by local authority, UK: 2006 to 2023’, Office for National Statistics. Retrieved from: https://www.ons.gov.uk/releases/firsttimebuyermortgagesalesbylocalauthorityuk2006to2023
Office for National Statistics (ONS). (2024b) ‘Median house prices for administrative geographies: newly built dwellings’, Office for National Statistics. Retrieved from: https://www.ons.gov.uk/peoplepopulationandcommunity/housing/datasets/medianhousepricesforadministrativegeographiesnewlybuiltdwellings
Osbourne, G. (2013) ‘Budget 2013: Chancellor’s statement’, HM Treasury. Retrieved from: https://www.gov.uk/government/speeches/budget-2013-chancellors-statement
RICS. (2024) ‘Why industry can look ahead with cautious optimism’. Retrieved from: https://ww3.rics.org/uk/en/journals/construction-journal/economic-review-material-costs-new-year-outlook.html
TYI. (2025) ‘Policy Note: Developer-Funded, Government-Backed Loan-to-Own Scheme For First Time Buyers’. Retrieved from: https://tyistrategy.co.uk/wp-content/uploads/2026/03/Policy-Note-LTO-Scheme-Final-04.03.26.pdf
Public and Corporate Economic Consultants (PACEC Limited). (2016) ‘Help to Buy – Wales interim evaluation’, Welsh Government. Retrieved from: https://www.gov.wales/sites/default/files/statistics-and-research/2019-07/160309-help-to-buy-wales-interim-en.pdf
UK Government. (2026) ‘Help to Buy ISA’, UK Government. Retrieved from: https://www.gov.uk/help-to-buy-isa
Whitehead, C., Williams, P., Ipsos MORI and the London School of Economics. (2018). ‘Evaluation of the Help to Buy Equity Loan Scheme 2017’, Ministry of Housing, Communities and Local Government. Retrieved from: https://assets.publishing.service.gov.uk/government/uploads/system/uploads/attachment_data/file/751359/Evaluation_of_the_Help_to_Buy_equity_loan_scheme_2017.pdf
Appendices
Please see a separate PDF for the following:
-
Appendix 1: Help to Buy evaluation questions and theory of change
-
Appendix 2: Further notes on the home ownership, supply and house price impact analysis
-
Appendix 3: Customer survey response data tables
Footnotes
-
Wards are geographic areas that make up a part of a local authority. ↩
-
This analysis includes 73 wards in England and 125 wards in Wales. ↩ ↩2
-
As discussed further below, the increase in 2015/16 may partly reflect changes in how the data was recorded. ↩ ↩2
-
For example, in 2013/14, the number of FTB mortgage sales increased by 2 more on average for wards on the English side of the border than for wards on the Welsh side. ↩
-
The study included a variable in the model which represented for each year the ratio between the number of FTB mortgage sales reported in the RMS and in the FCA data for each local authority. ↩
-
This is a smaller distance threshold than used for the previous analysis focused on the England/Wales border, which used wards within 10km of the border. This difference reflects the fact that the areas around London are more built up. It is also consistent with previous work (Carozzi and others, 2024). ↩
-
Formally, this is a type of hurdle model which first predicts whether any new dwellings were recorded in a ward at a given month and then predicts the number of new dwellings recorded. Further information about this analysis can be found in the technical report. ↩
-
This relationship is only approximate as it is possible for there to be more than one site within the same ward. ↩
-
This is a smaller distance threshold than used for the previous analysis focused on the England/Wales border, which used wards within 10km of the border. This difference reflects the fact that the areas around London are more built up. It is also consistent with previous work (Carozzi and others, 2024). ↩
-
Price elasticity of supply is a measure of how supply changes in relation to price. IFS (2024) estimated the percentage change in housing supply related to a 1% change in house prices for each MSOA in England using data from the Land Registry and the Valuation Office Agency. These are estimated based on change in supply and prices over the 25-year period from 1996 to 2021. ↩
-
For example, the 2 analyses use different methods for linking together information about transactions (from the Land Registry) and property characteristics (from the EPC database). The Verian analysis usually links a transaction to the correct property characteristics but finds slightly fewer matches (about 15% of transactions are excluded because the matching process doesn’t find their property characteristics). It is possible that an effect on prices was located mainly in the c.15% of transactions excluded from Verian’s analysis, but this study concludes it is more likely that the Verian analysis more accurately accounts for differences in property characteristics (e.g. property size). ↩
-
Figure 7.9 is based on an analysis using LSOAs rather than postcodes. The general patterns using postcodes are similar. However, with postcodes, the sample size is much smaller and many of the time periods have relatively few transactions recorded. As a result, the confidence intervals are sometimes very wide and the underlying pattern is more difficult to see. ↩
-
Carozzi and others (2024) also report the estimates from alternative statistical models, with estimated impacts ranging from 5% to 8%. ↩
-
Examples of transactions which are not flagged as being full market value are repossessions, company acquisitions and some buy-to-let purchases. ↩
-
If an address, transaction date or transaction value was recorded incorrectly or inconsistently in either dataset, the study may not have been able to find a matching record. For the remaining 11% of Help to Buy scheme addresses that were unmatched, the study was either unable to find the address in the Land Registry Price Paid Data (9%) or found multiple potential matches but it was not clear which was correct (2%). ↩
-
LVU is a revealed preference approach for valuing impacts to society from house building, as prescribed by MHCLG appraisal guidance (2025). Essentially, house values capture the present value of all future benefits (utility) home owners will receive from that house, minus the cost of developing the house. LVU does not relate to private benefits to the initial landowner from a sale, which would be a transfer at a societal level and therefore not a relevant consideration for economic appraisal. For example, any profit obtained by a land owner from a house sale will be perfectly offset by the buyer having to pay this profit for the house, resulting in overall zero net benefit to society. ↩
-
This 14% estimate is based on Scenario 3 in Table 5.7. This is different to the finding of the impact evaluation in Section 5.7 of a 15% effect, as the latter is based on a holistic assessment across all scenarios conducted for the impact evaluation rather than being attached to underlying data that could be used in the economic evaluation. ↩
-
As discussed in MHCLG’s appraisal guidance. ↩