ESPAUR report 2025 to 2026: Chapter 3. Antimicrobial consumption
Published 12 November 2026

© Crown copyright 2026
This publication is licensed under the terms of the Open Government Licence v3.0 except where otherwise stated. To view this licence, visit nationalarchives.gov.uk/doc/open-government-licence/version/3 or write to the Information Policy Team, The National Archives, Kew, London TW9 4DU, or email: psi@nationalarchives.gov.uk.
Where we have identified any third party copyright information you will need to obtain permission from the copyright holders concerned.
This publication is available at https://www.gov.uk/government/publications/english-surveillance-programme-for-antimicrobial-utilisation-and-resistance-espaur/espaur-report-2025-to-2026-chapter-3-antimicrobial-consumption
Main messages
Total NHS antibiotic consumption
Total NHS antibiotic consumption in England fell to 15.9 DIDs (defined daily doses [DDDs] per 1,000 inhabitants per day) in 2025. Consumption was 6.1% lower than in 2024 and remained 10.7% below 2019 levels. General practice remained the largest contributor to consumption (65.4% of total use) and was the main driver of the overall reduction, with consumption 18.8% lower than in 2019, while hospital consumption increased by 5.4% over the same period. This highlights the importance of targeted antimicrobial stewardship across healthcare settings.
Methodological updates, including the exclusion of methenamine from consumption metrics and revisions to secondary care data sources and DDD derivation methods mean that some figures are not directly comparable with those reported in previous ESPAUR reports.
Regional variation
Antibiotic consumption continued to vary across England in 2025, both between regions and integrated care boards (ICBs). Total consumption was highest in the North East and lowest in the South East. In contrast, London had the lowest consumption in primary care and the highest consumption in secondary care. Although all regions reported lower total consumption than in 2019 and 2024, driven by reductions in primary care use, variation in consumption patterns and AMR burden highlights the need for locally tailored antimicrobial stewardship and opportunities for shared learning.
Antibiotic classes
Penicillins without a beta-lactamase inhibitor (BLI) remained the most used antibiotic classes in England in 2025 (30.9% of total consumption), followed by the Tetracyclines and the Macrolides, Lincosamides and Streptogramins classes. Compared with the period following the Group A streptococcal infection surge in winter 2022 to 2023, the distribution of use across antibiotic classes was more closely aligned with expected prescribing patterns based on clinical guidelines and the burden of infectious diseases in 2025.
Consumption of the Tetracyclines class declined mainly because of reduced lymecycline use, potentially reflecting changes in acne management. Small increases in Cephalosporin and Sulfonamide/Trimethoprim classes, alongside a small decrease in Quinolone use, may reflect a shift towards lower-resistance-risk alternatives coinciding with the January 2024 MHRA drug safety update related to the use of systemic fluoroquinolones.
Methenamine hippurate use increased more than eight-fold between 2019 and 2025, reflecting its growing role as a NICE-recommended, antibiotic-sparing option for recurrent UTI prevention. Although excluded from this year’s antibiotic analysis to align with the WHO AWaRe classification, methenamine use continues to be monitored by UKHSA.
NAP targets
The UK NAP targets for antimicrobial consumption aim to:
-
reduce total human antibiotic use by 5% by 2029 compared with the FY 2019 to 2020 baseline. In England, total antibiotic consumption in 2025 was 10.6% lower than the FY 2019 to 2020 baseline, indicating that the target has been achieved ahead of schedule – continued delivery of AMS activities will be essential to ensure that reductions are sustained
-
achieve 70% Access antibiotic (2024 UK-adapted AWaRe classification) use as a proportion of total antibiotic use across primary and secondary care by 2029 – in England, the proportion of Access antibiotic use increased from 61% in 2019 to 65.6% in 2025, consistent with continued progress towards the NAP target
Private (non-NHS) consumption
Following increases since 2019, private (non-NHS) antibiotic consumption declined from 2024 to 2025, driven mainly by reduced community pharmacy supply, which may reflect changes in healthcare-seeking behaviour, increased use of NHS services such as Pharmacy First and optimisation of antibiotic treatment durations in line with NICE guidance. Antibiotics supplied through private (non-NHS) routes represented 4.1% of total primary care antibiotic consumption across both NHS and private sectors in England in 2025.
NHS primary care
Primary care remained the largest contributor to antibiotic consumption in England in 2025, accounting for 75.8% of total use, with overall consumption decreasing by 7.2% compared with 2024 and by 7.5% compared with 2019. Reductions were observed across general practice, dental and other community settings, reflecting lower prescribing following the post-pandemic increases associated with heightened respiratory and Group A Streptococcus activity, alongside ongoing antimicrobial stewardship initiatives promoting appropriate antibiotic use and shorter treatment courses. Antibiotic consumption remained highest in older adults and in more deprived populations, with persistent deprivation-related inequalities despite a narrowing of the gap since its post-pandemic peak. In children, prescribing generally remained below 2019 levels, although antibiotic use in infants aged under one year remained higher than pre-pandemic levels, warranting continued surveillance.
NHS secondary care
Antibiotic consumption in NHS acute hospitals remained stable in 2025 at 4,724 DDDs per 1,000 admissions but continues to exceed pre-pandemic levels (+5.4% vs 2019). While use of several high-priority antibiotic classes for stewardship, including Quinolones (−21%) and Carbapenems (−2%), declined, a marked increase in the Tetracycline class, largely driven by doxycycline, offset these reductions. Use of anti-Clostridioides difficile agents more than doubled since 2019 (+118%), consistent with increased fidaxomicin use following updated treatment guidance. This year’s report uses Rx-Info, replacing IQVIA as the data source for UKHSA’s secondary care antimicrobial surveillance. Differences in data categorisation between the 2 systems should be considered when interpreting trends by care setting and specialty, as a growing proportion of antibiotic consumption could not be assigned to a specific care setting (36% in 2025) or specialty (12% in 2025) due to incomplete or unclear costing and mapping information submitted by some trusts.
NHS dental sector
NHS dental antibiotic continued to decline in 2025, falling 27.6% from the 2020 peak and 14.8% below 2019 levels. While reduced prescribing may reflect changes in service delivery and antimicrobial stewardship, interpretation is limited by the lack of prescribing data from the independent dental sector. Amoxicillin and metronidazole remained the predominant antibiotics used, while the continued rise in phenoxymethylpenicillin use suggests increasing adoption of guideline-recommended, narrower-spectrum prescribing.
Pharmacy First
Antibiotic supply through the Pharmacy First service increased substantially in 2025, with rates 53.1% higher than during the first 11 months following service launch (February to December 2024). However, the proportion of consultations resulting in an antibiotic supply decreased over this period, suggesting that increased activity was accompanied by proportionally lower antibiotic use. Antibiotics supplied through Pharmacy First accounted for 3.4% of all NHS primary care antibiotic prescribing in 2025. Phenoxymethylpenicillin and nitrofurantoin accounted for most supplies. Trends indicate a shift in management of the 7 common conditions covered by the Pharmacy First scheme from general practice to community pharmacy, although changes should be interpreted alongside treatment access, increased public awareness of the service and changes in underlying infection rates.
Newly licenced antibiotics
Consumption of recently licensed Reserve antibiotics in the NHS increased slightly in 2025 but remained low overall (2.25 DDDs per 1,000 admissions), consistent with their role in treating serious multidrug-resistant infections. Ceftazidime with avibactam, cefiderocol (both included within the NHS Antimicrobial Product Subscription Model) and ceftolozane with tazobactam were the most widely used agents. Uptake of other newer antibiotics remained limited and varied substantially between regions and trusts, reflecting differences in local epidemiology, access and commissioning arrangements.
Antifungals
Total systemic antifungal consumption increased by 11% between 2019 and 2025, with 87% of use occurring in the community and notable shifts in hospital consumption towards broader-spectrum antifungal agents. Rising community use, particularly of terbinafine (+13.5% during this period), is of concern given the emergence of terbinafine-resistant Trichophyton indotineae in England.
Antivirals
NHS oseltamivir use closely tracked seasonal influenza activity between 2019 and 2025, with higher antiviral consumption in 2024 to 2025 reflecting increased influenza-related healthcare burden compared with recent seasons.
Use of COVID-19 therapeutics in England declined substantially in 2025, broadly reflecting reduced numbers of reported COVID-19 cases, with nirmatrelvir plus ritonavir remaining the most frequently used antiviral treatment.
Use of antiviral therapy for chronic hepatitis B increased substantially between 2019 and 2025, indicating expanding access to treatment and progress towards reducing HBV-related liver disease. Hepatitis C treatment prescribing remained high over the same period, reflecting the continued use of highly effective direct-acting antivirals in support of elimination efforts.
Antiparasitics
NHS antimalarial use reflected changing travel patterns and malaria management with sustained increases in atovaquone-proguanil prescribing alongside a continued high burden of travel-associated malaria. In contrast, quinine use continued to decline, consistent with its replacement by artemisinin combination therapies as first-line malaria treatment.
NHS anthelmintic consumption patterns continued to evolve in 2025, with marked increases in ivermectin and albendazole use, while mebendazole prescribing declined. The rise in ivermectin prescribing likely reflects increased scabies treatment following its licensing for this indication, updates to national guidance, and shortages of topical alternatives.
Introduction to Chapter 3
This chapter describes trends in antimicrobial consumption in England from 2019 to 2025 across NHS healthcare settings, including the COVID-19 period. While focusing primarily on antibiotics, it also summarises antifungal, antiviral and antiparasitic use. These trends are presented to support targeted action, informing interventions to ensure patients receive the most effective treatments while identifying where reductions in unnecessary prescribing are needed, in line with national ambitions to optimise use of antimicrobials and preserve their effectiveness. Data received by UKHSA is aggregated in age categories and not linkable to clinical information, including indication for prescribing or microbiology data.
Antimicrobial consumption data in this chapter covers NHS primary and secondary care settings. Further detail including data source and methods can be found in the annexe. Data and figures presented in this chapter are available in the Chapter 3 data table and the downloadable infographics figures slide deck.
Antibiotic consumption
Total NHS antibiotic consumption
Total NHS antibiotic consumption in 2025 was 15.9 Defined Daily Doses (DDDs) per 1,000 inhabitants per day (DID), representing a 6.1% decrease compared with 2024 and a 10.7% decrease compared with 2019. Total NHS antibiotic consumption comprises 85% of antimicrobial usage presented in this report for 2025 (infographics). This data excludes consumption within the independent sector (see Antibiotic consumption through private (non-NHS) routes in England below).
Previously reported trends in antimicrobial consumption reflected changes in infection epidemiology during and following the COVID-19 pandemic (see ESPAUR Report 2025). In 2025, antibiotic consumption stabilised, which may reflect a return to more typical pre-pandemic patterns of infection incidence. Readers should also note that methodological changes have been made to the ESPAUR 2025 to 2026 antimicrobial consumption analyses. These include the exclusion of the urinary antiseptic methenamine from consumption metrics and updates to secondary care data sources and Defined Daily Dose (DDD) derivation methods. Additionally, changes to reporting of same day emergency care activity from HES to the Emergency Care Data Set from 2023 means that some trusts’ reported admissions have decreased considerably in the years since 2023. As admissions are used as the denominator for some consumption metrics, estimates for affected trusts may differ from those published in previous ESPAUR reports and should not be directly compared. For the small number of trusts impacted, the reduced denominator may result in artificially higher reported antibiotic consumption rates compared with previous reports. The changes were developed in consultation with key stakeholders to improve the consistency and alignment with other outputs of UKHSA’s national antimicrobial consumption surveillance. Further details are provided in the annexe.
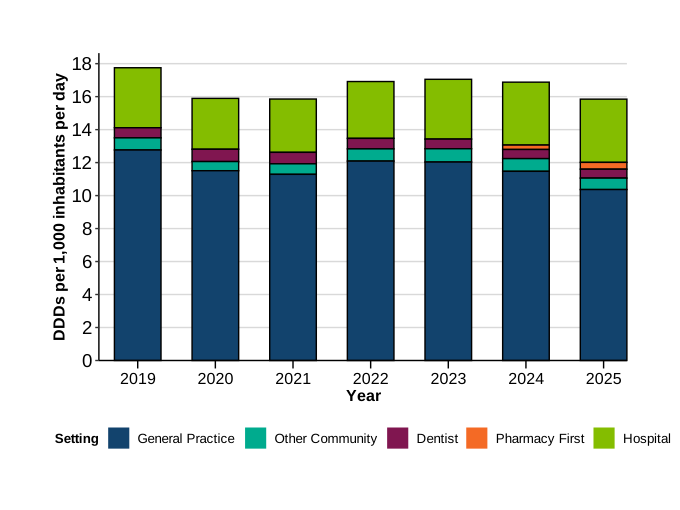
In 2025 in keeping with other years, general practice accounted for the largest share of antibiotic consumption in England representing 65.4% (10.4 DID) of total consumption. This was followed by hospital inpatient and outpatient consumption at 24.2% (3.8 DID), other community settings at 4.5% (0.72 DID), NHS dental services at 3.4% (0.54 DID), and the Pharmacy First scheme at 2.6% (0.41 DID), which was launched in January 2024 (Figure 3.1).
Compared with 2019, antibiotic consumption in general practice was 18.8% lower in 2025 (from 12.8 to 10.4 DID), whereas hospital consumption increased by 5.4% (from 3.6 to 3.8 DID). Other community settings reported a 4.4% decrease (0.75 to 0.72 DID) and NHS dental services decreased antibiotic consumption by 11.7% (from 0.61 to 0.54 DID) between 2019 and 2025. More detailed information on the trends observed within each healthcare setting is provided in the following subsections.
Figure 3.1. Total NHS antibiotic consumption by setting, expressed as DID, England, 2019 to 2025
Regional variation in antibiotic consumption in England
In 2025, antibiotic consumption by region was highest in the North East (18.2 DID), where usage has consistently been the highest, while the South East (14.1 DID) reported the lowest total consumption (Figure 3.2). London displayed a clear contrast between care settings, with the lowest primary care use (10.1 DID) but the highest in secondary care (5.1 DID).
In 2025 total antibiotic consumption (primary and secondary care) by Integrated Care Boards (ICBs) was highest in North East and North Cumbria (0.96 DIDs), Greater Manchester (0.86 DIDs), and Cheshire and Merseyside (0.81) ICBs, and lowest in NHS Somerset (0.14 DIDs), Shropshire, Telford and Wrekin (0.14 DIDs), and NHS Cornwall and the Isles of Scilly (0.15 DIDs) ICBs. Proportion of secondary care to total consumption also varied noticeably and was highest in North West London (41.5%) and North Central London ICBs (36.4%), above the England average of 23.1%, and lowest in Staffordshire and Stoke-on-Trent (14.6%) and Lincolnshire ICBs (15.3%) Figure 3.2. Antibiotic consumption disaggregated by all ICBs is found in Chapter 3 data tables.
These findings likely reflect regional and inter-regional differences in population demographics, service provision and healthcare access (1). London has greater access to walk-in centres, urgent treatment centres and hospital emergency departments (2), alongside higher hospital bed capacity and greater concentration of specialist care. This may contribute to lower levels of prescribing in primary care and higher use in secondary care. In contrast, regions such as the North East have lower GP provision (2 to 5), older populations and greater healthcare needs, factors that may contribute to higher antibiotic consumption.
Patterns of antimicrobial resistance (AMR) and antimicrobial consumption also vary across regions in England. For example, London had the highest AMR burden (Chapter 2), the lowest antibiotic consumption in primary care and the highest antibiotic consumption in secondary care (Chapter 3). These observations highlight the importance of interpreting AMR and consumption data together when identifying local antimicrobial stewardship priorities.
All regions reported lower total antibiotic consumption in 2025 compared with pre-pandemic 2019 and 2024 levels, largely driven by reductions in primary care consumption (reduction range across regions: −7.3% to −9.1%). In secondary care, three regions showed small increases in consumption (London +5.4%, South West +1%, and Yorkshire and Humber +0.1%). The increase in consumption in London ICBs may reflect increased procurement and supply of doxyPEP (6). However, these regional differences warrant further analyses to identify successful interventions or antimicrobial stewardship activities for shared learning.
Figure 3.2. Total, NHS primary care, and secondary care antibiotic consumption by a) UKHSA centres, and b) integrated care board, expressed as DID, England, 2025 [note 1]
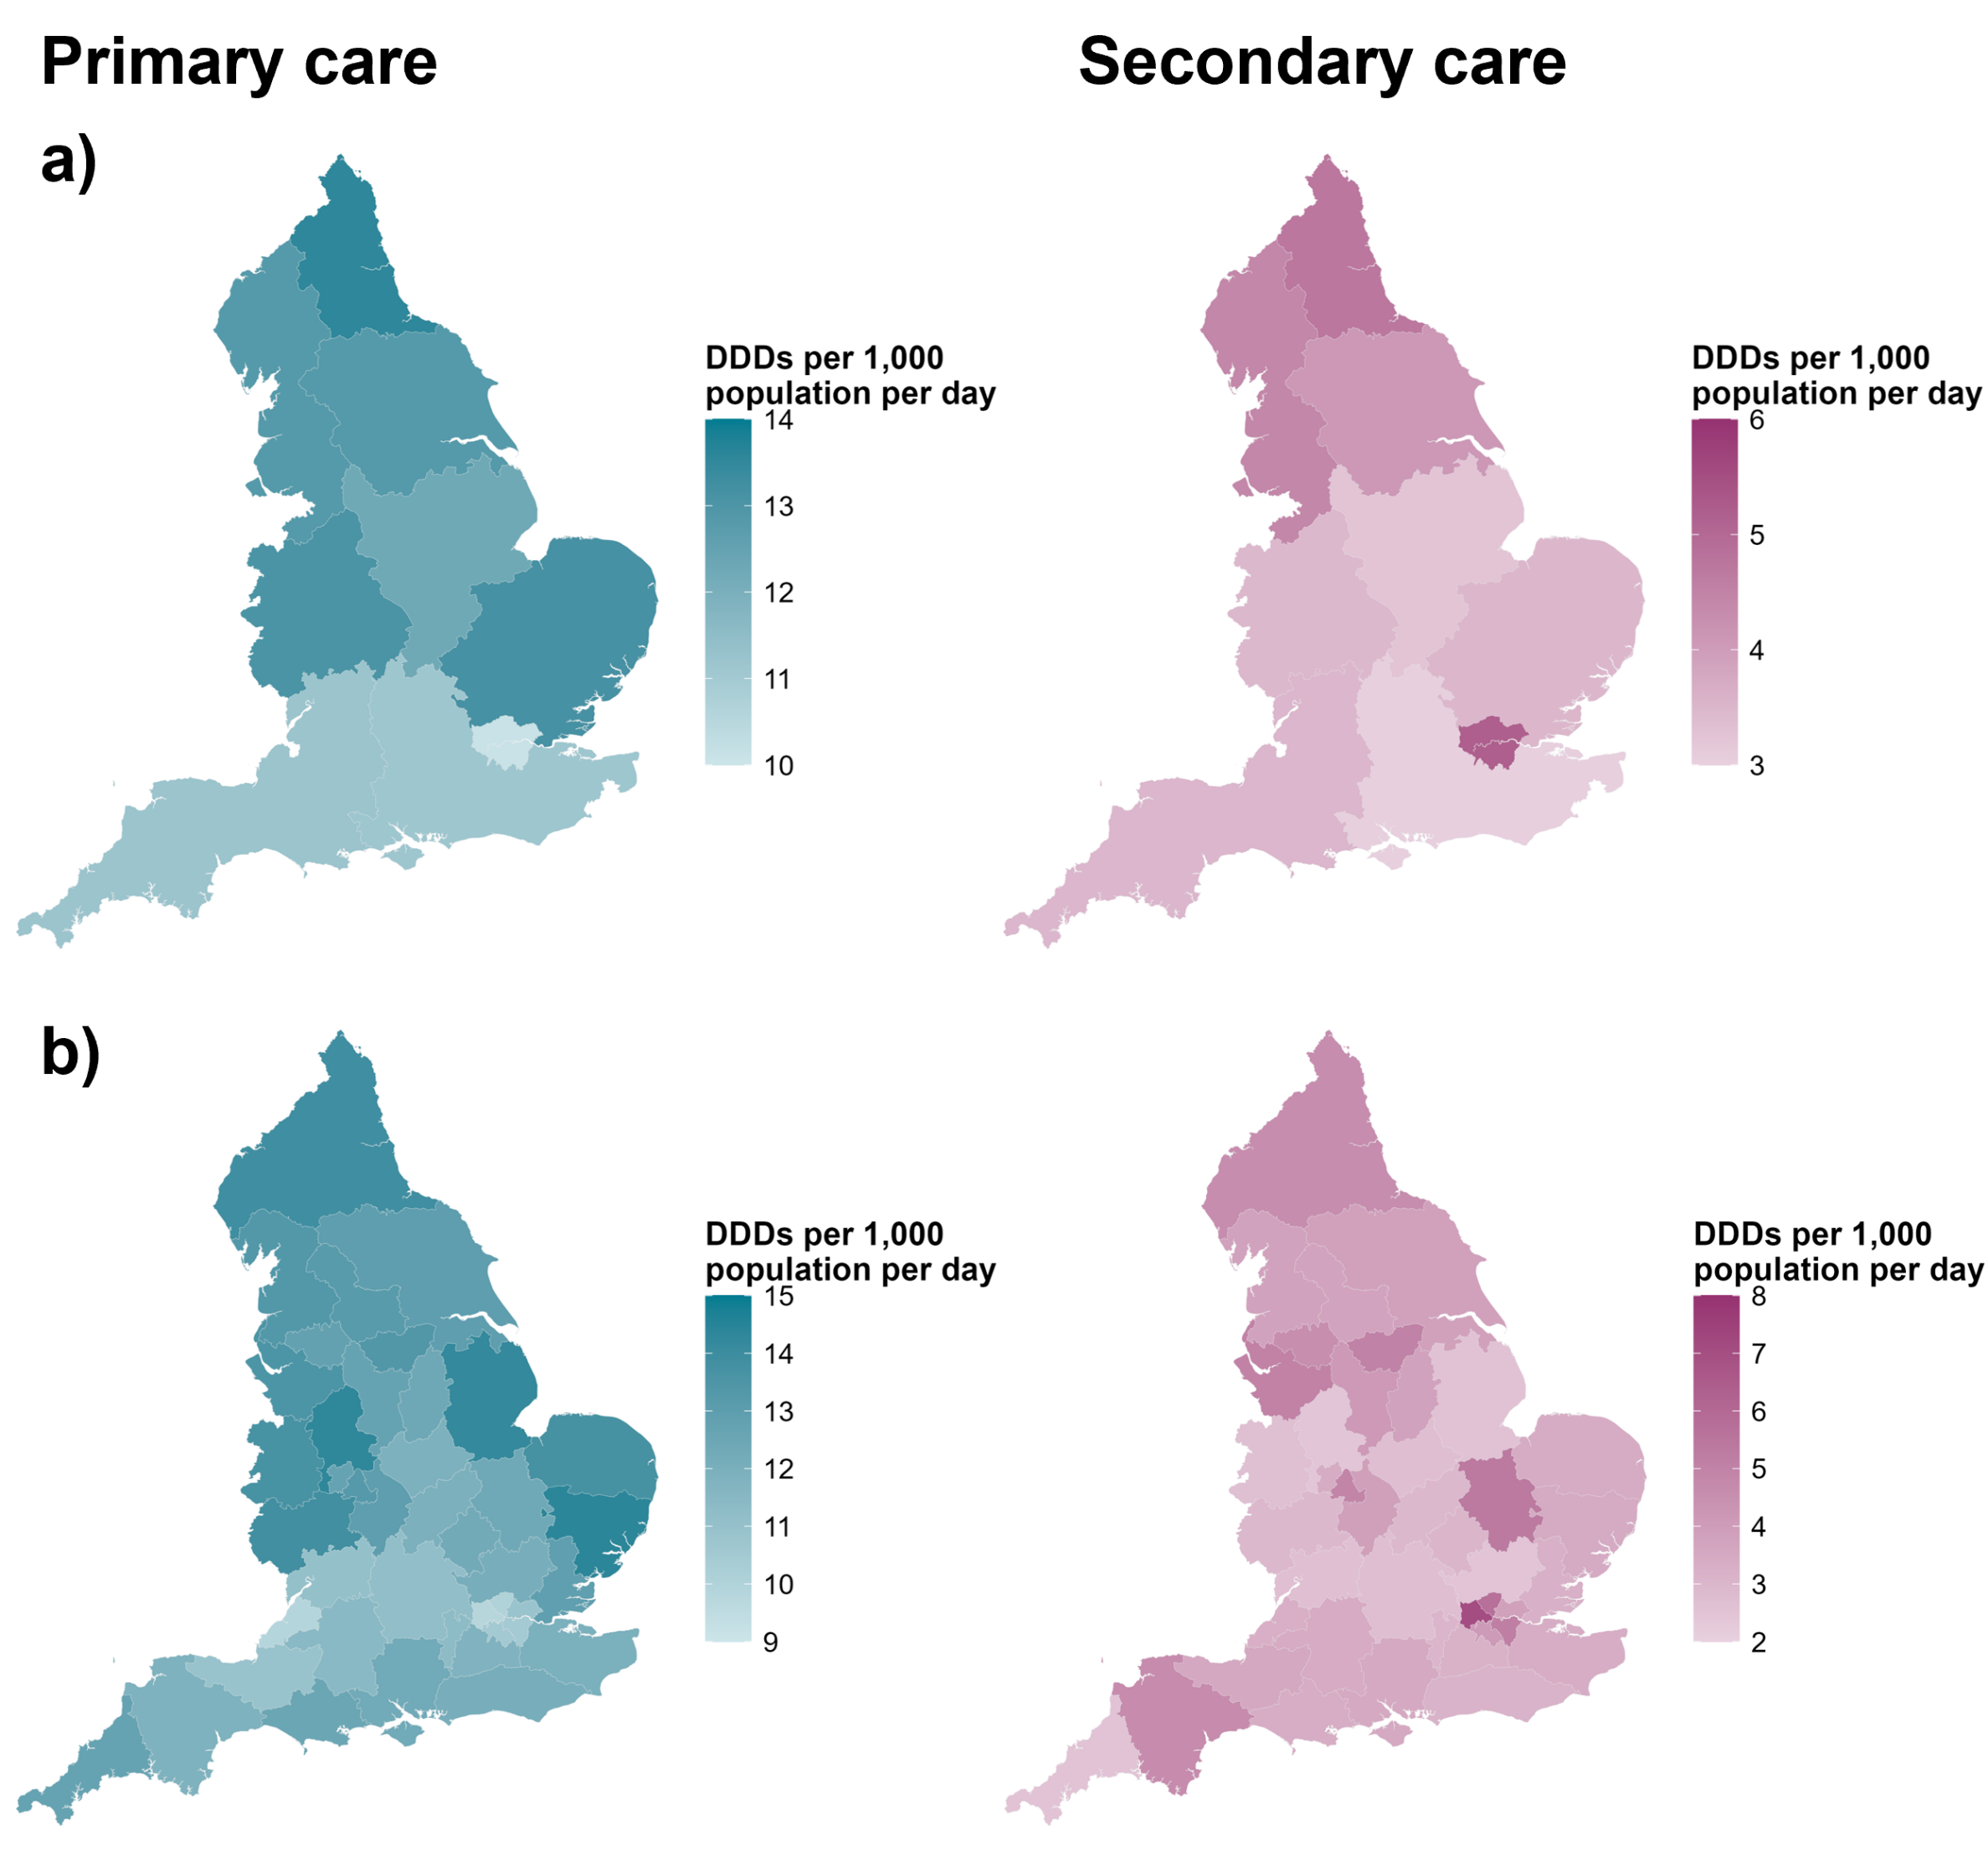
Note 1: NHS primary care data does not include dental care prescribing for 2019 and for all of 2020, as UKHSA centre-level data was not available at the time of production
Antibiotic classes
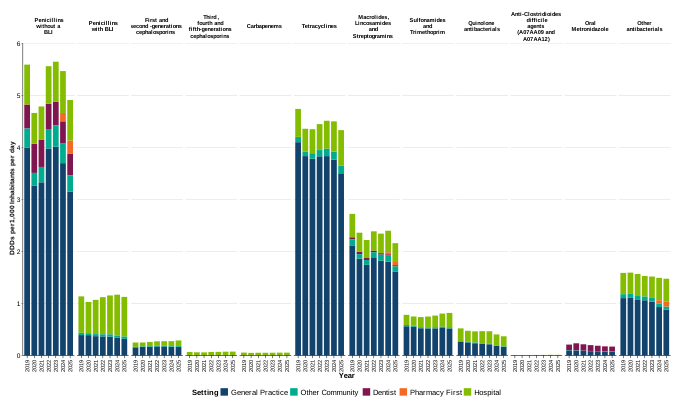
Consistent with previous years and national guidance for common infections, Penicillins without a BLI remained the most used antibiotic class in England in 2025, accounting for 30.9% (4.9 DID) of total consumption. Tetracyclines were the second most used class (27.3%, 4.3 DID), followed by the Macrolides, Lincosamides and Streptogramins class (13.6%, 2.2 DID) (Figure 3.3).
Between 2024 and 2025, antibiotic consumption declined across several antibiotic classes. The largest decrease was observed for penicillins (without a BLI and with BLI) (−0.56 DID), primarily driven by reduced use of amoxicillin and phenoxymethylpenicillin. This likely reflects a return to baseline prescribing following increased use caused by the high incidence of Group A Streptococcus (GAS) infections in 2022 to 2023 (7), alongside national antimicrobial stewardship efforts including promotion of shorter treatment courses, the NHS Oversight Framework, and the TARGET initiative. Use of the macrolides, lincosamides and streptogramins group decreased by 0.24 DID, mainly due to reduced clarithromycin consumption, potentially reflecting lower respiratory infection activity and shorter treatment courses. Tetracycline use declined by 0.17 DID, largely driven by reduced lymecycline prescribing, which may reflect improved acne management. These reductions were primarily observed in the GP setting and may indicate the ongoing impact of antimicrobial stewardship initiatives.
In contrast, small increases were observed in the cephalosporins and sulfonamides and trimethoprim groups, likely reflecting a shift away from fluoroquinolones. Consumption of quinolones declined substantially by 29.4% between 2019 and 2025, with prescribing practice further supported by the Medicines and Healthcare Products Regulatory Agency (MHRA) advice issued in January 2024, which recommends prescribing systemic fluoroquinolones only when other commonly recommended antibiotics are unsuitable. The small increase in cephalosporin consumption may also partly reflect the reclassification of cefalexin to the Access category in the UK’s adapted 2024 AWaRe classification, potentially supporting its use as a preferred treatment option in primary care.
Prescribing of antibiotics recommended as first-line treatment for urinary tract infections showed a shift in first-line choices, with reduced nitrofurantoin, variable trimethoprim use, and rising pivmecillinam consistent with updated guidance supporting its role as an alternative treatment for UTIs in adults (6). Persistent high levels of trimethoprim resistance (7), and antimicrobial stewardship efforts such as the Improving Prescribing of Antibiotics for Primary care (IPAP) programme (8), may also be contributing to increasing pivmecillinam use.
Most antibiotic groups remain below 2019 levels, although Cephalosporins, Trimethoprim and Sulfonamides, and anti‑C. difficile agents (likely linked to the previous rise in C. difficile infections (9) exceeded 2019 levels. In primary care, doxycycline, amoxicillin and lymecycline remain the most used antibiotics, highlighting opportunities to optimise duration and long-term use (Table 3.1) (10, 11). While secondary care use is dominated by doxycycline, co‑amoxiclav and flucloxacillin, compared with other European countries, Penicillins groups also account for a large proportion of secondary care consumption, whereas Tetracyclines groups a small proportion, highlighting England’s differing prescribing pattern of doxycycline use (12). Doxycycline use in secondary care may include use from specialist sexual health services, where it is provided as post-exposure prophylaxis to those at greatest risk of syphilis. Early national surveillance data on doxyPEP provision has recently been reported (13), with further analyses planned to evaluate impact on syphilis trends (14).
Previous ESPAUR reports showed that increases in total consumption of the ‘Other antibacterials’ group were largely driven by rising consumption of methenamine hippurate, a non-antibiotic, urinary antiseptic. As already described in the above section ‘Total NHS antibiotic consumption’, methenamine was excluded from this year’s analysis to align with the WHO AWaRe antibiotic classification, which does not include methenamine within its antibiotic groups. Methenamine consumption continues to be monitored by UKHSA and increased from 0.12 DID in 2019 to 1.03 DID in 2025. This rise likely reflects its growing role as a NICE‑recommended (15) antibiotic‑sparing option for the prophylaxis of recurrent UTI.
Figure 3.3. Antibiotic consumption by antibiotic class and setting expressed as DIDs, in England, 2019 to 2025
Progress against the UK AMR National Action Plan’s (NAP) human health targets: England NHS data
Target 4A (Reduce total antibiotic use in humans by 5% by 2029 against the FY 2019 to 2020 baseline)
In England, total antibiotic consumption in 2025 was 10.6% lower than the FY 2019 to 2020 baseline, indicating that the target has been achieved ahead of schedule (18). However, with three years remaining in the NAP period, continued delivery of coordinated antimicrobial stewardship activities, alongside targeted action in areas with higher antibiotic use and ongoing promotion of appropriate prescribing across primary and secondary care, will be essential to ensure that reductions are sustained through to 2029 while maintaining safe and effective patient care. In line with the agreed annual review process for NAP human health targets, progress against Targets 4A and B (see below) will continue to be examined throughout the 2024 to 2029 NAP period to ensure the target remains appropriate in light of emerging evidence and trends in antibiotic use.
Target 4B (Achieve 70% Access antibiotic [2024 UK-adapted AWaRe classification] use as a proportion of total antibiotic use across primary and secondary care by 2029)
The UK AMR NAP target 4B sets a target for 70% of total antibiotic consumption (DDDs) to be from the Access category (ESPAUR report annexe: AWaRe classification), using the UK-adapted AWaRe classification (18 to 21). Compared with the WHO AWaRe framework, the UK adaptation is more stringent and makes achieving the NAP target more challenging, because commonly prescribed agents, including co-amoxiclav, are classified as Watch rather than Access antibiotics, thereby reducing the proportion of prescribing that contributes to the Access target.
The proportion of antibiotic consumption accounted for by Access antibiotics increased from 61% in 2019 to 65.6% in 2025 (Figure 3.4). This occurred alongside reductions in the absolute use of both Access and Watch antibiotics, with larger declines in Watch antibiotic consumption driving the increase in the Access proportion. Primary care prescribing, where 68.9% of antibiotic use was classified as Access in 2025, was the main contributor to this trend, compared with 55% in secondary care (Figure 3.5).
Figure 3.4. ‘Access’ antibiotics as a proportion of antibiotic consumption in primary care, secondary care, and total use across the healthcare system, England, 2019 to 2025 (2024 UK AWaRe classification)
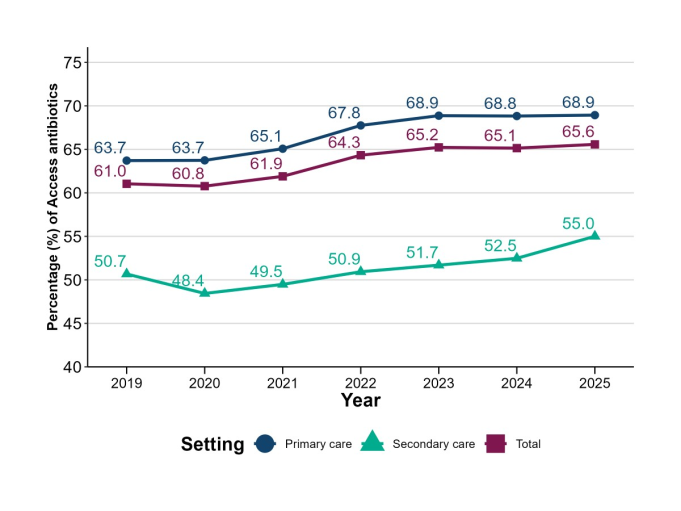
Figure 3.5. Proportion of AWaRe antibiotic use across the healthcare system, England, 2025 (2024 UK AWaRe classification)
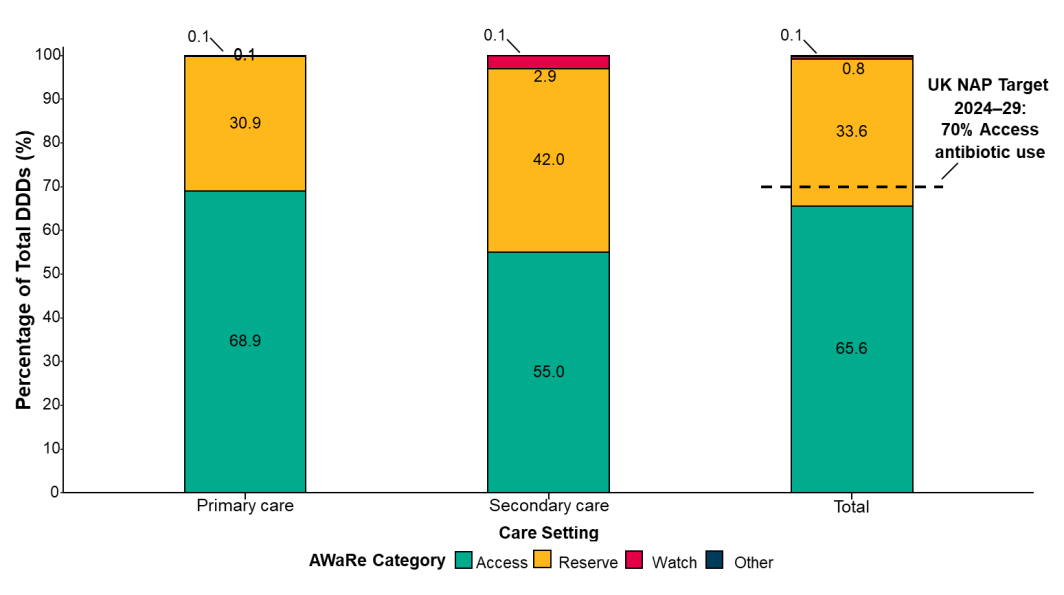
In primary care, the most commonly used Access antibiotics in 2025 were doxycycline, amoxicillin and flucloxacillin, while lymecycline, clarithromycin and azithromycin were the most frequently used Watch or Reserve antibiotics (Table 3.1). In secondary care, doxycycline, flucloxacillin and amoxicillin were the most commonly used Access antibiotics, whereas co-amoxiclav, clarithromycin and ciprofloxacin were the leading Watch or Reserve agents. Co-amoxiclav was the most frequently used antibiotic overall in secondary care, highlighting its substantial contribution to Watch and Reserve antibiotic consumption in this setting.
Table 3.1a. Top 6 antibiotics used in primary care with their associated AWaRe category expressed as DIDs, in England, 2025
| Doxycycline | Tetracyclines | Access | 2.30 DIDs | |
| Amoxicillin | Penicillins without a BLI | Access | 2.10 DIDs | |
| Lymecycline | Tetracyclines | Watch | 1.22 DIDs | |
| Flucloxacillin | Penicillins without a BLI | Access | 1.16 DIDs | |
| Clarithromycin | Macrolides, Lincosamides and Streptogramins | Watch | 1.03 DIDs | |
| Azithromycin | Macrolides, Lincosamides and Streptogramins | Watch | 0.52 DIDs |
Table 3.1b. Top 6 antibiotics used in secondary care with their associated AWaRe category expressed as DIDs, in England, 2025
| Co-amoxiclav | Penicillin with BLI | Watch | 0.66 DIDs | |
| Doxycycline | Tetracyclines | Access | 0.64 DIDs | |
| Flucloxacillin | Penicillins without a BLI | Access | 0.26 DIDs | |
| Amoxicillin | Penicillin with BLI | Access | 0.26 DIDs | |
| Clarithromycin | Macrolides, Lincosamides and Streptogramins | Watch | 0.21 DIDs | |
| Ciprofloxacin | Quinolone antibacterials | Watch | 0.12 DIDs |
Differences in clinical need and case-mix across settings mean this target may be more achievable in primary care than in hospitals. Setting-specific approaches, alongside sustained antimicrobial stewardship and surveillance, will support data-driven improvements and continued progress.
Continued monitoring and optimisation of Watch antibiotic use is particularly important given the ongoing burden of resistant Gram-negative pathogens described in Chapter 2.
Antibiotic consumption through private (non-NHS) routes in England
IQVIA, a commercial provider of healthcare data, collects data on antimicrobial usage across several non-NHS routes, including those listed below (with further details in the annexe) This data does not capture antibiotics dispensing through online healthcare services:
- private hospital purchasing
- private pharmacy purchasing
- private prescriptions dispensed in community pharmacies
- private usage in NHS hospitals
In 2025, total antibiotic purchasing (private pharmacy purchasing and private hospital purchasing) within the independent sector in England was 0.13 DID, while total dispensing (private prescriptions dispensed in community pharmacy and private usage in NHS hospitals) was 0.50 DID. Purchasing does not equate to antibiotic use, as not all purchased antibiotics are dispensed or administered. For comparison by setting, NHS primary care accounted for 12.01 DID, while private prescriptions dispensed in community pharmacies accounted for 0.48 DID, representing 4% of total (NHS and non-NHS) primary care prescribing.
This data provides insight into antibiotic use in the independent sector. However, coverage is incomplete and therefore not directly comparable with total NHS antibiotic consumption. Dispensing is not fully captured across all settings, including dental practices, patient group directions (PGDs) and online routes. In addition, antibiotic use in aesthetic practice is likely under-represented, particularly where activity occurs outside regulated sources.
Total antibiotic consumption (combined purchasing and prescribing) in the independent sector was 0.62 DID in 2025, a 28.8% increase from 2019 (0.48 DID), and an 18.4% decrease from 2024 (0.76 DID). The reduction from 2024 to 2025 was driven by a 20.8% decrease in non-NHS prescriptions dispensed in community pharmacy (0.61 to 0.48 DID) (Figure 3.6). This first decline since the pandemic may reflect stabilisation of post-pandemic infection patterns, reduced reliance on non-NHS prescribing, with changes in healthcare-seeking behaviour and potential shifts back towards NHS care pathways, including the Pharmacy First service which was launched in 2024. Efforts to optimise antibiotic treatment durations in line with NICE guidance, supporting more appropriate antimicrobial use, have likely contributed to these changes (22).
From 2024 to 2025, levels of private hospital purchasing and antibiotic private use by private patients treated in NHS hospitals remained stable (0.081 to 0.083 DID, and 0.015 to 0.015 DID, respectively).
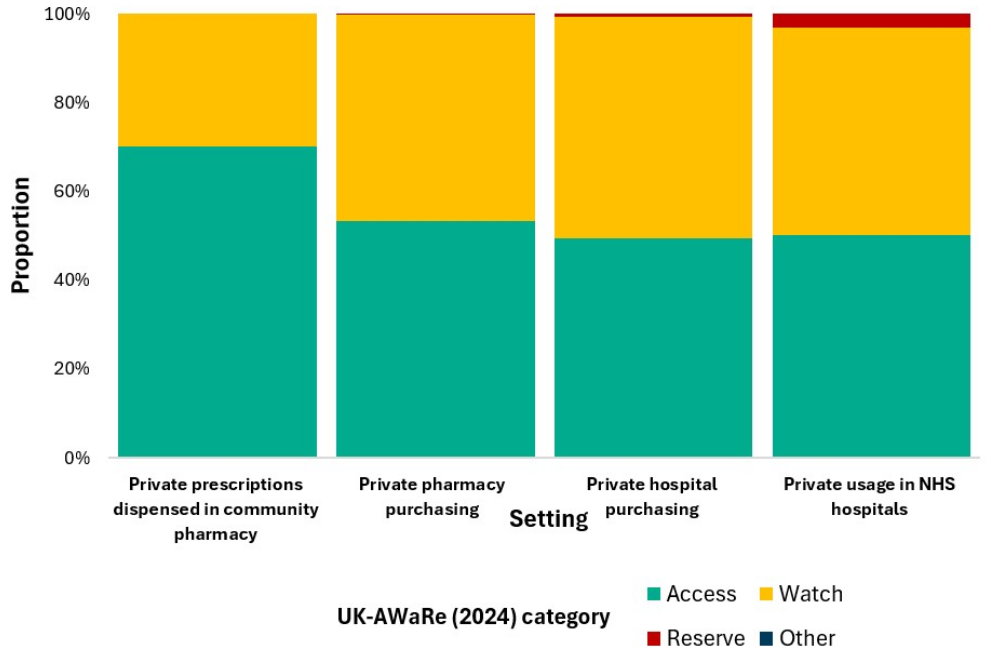
Use of antibiotics across AWaRe categories varied by non-NHS routes. In 2025, the proportion of Access antibiotics was highest in private prescriptions dispensed in community pharmacy (69.9%), followed by 60% of private pharmacy purchasing (Figure 3.7). Access antibiotics also comprised the largest proportion of antibiotics used by private patients treated in NHS hospitals (50.6%). Watch antibiotics accounted for 49.8% of private hospital purchasing and 46.5% of use by private patients treated in NHS hospitals. Compared with other independent sector settings, the highest proportion of Reserve antibiotics was observed in antibiotic use by private patients in NHS hospitals (2.9%). The high proportion of Reserve antibiotic use among private patients treated in NHS hospitals may partly reflect case mix, including a greater proportion of patients from overseas.
Figure 3.6. Private (non-NHS) routes of antibiotics dispensed and purchased in England, by setting, 2019 to 2025, England, A. by primary and secondary care setting, B. all non-NHS routes
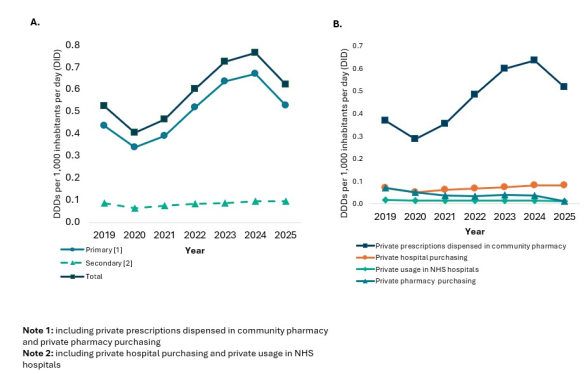
Figure 3.7. Proportion of AWaRe antibiotic use across private (non-NHS) routes in 2024 (2024 UK AWaRe classification)
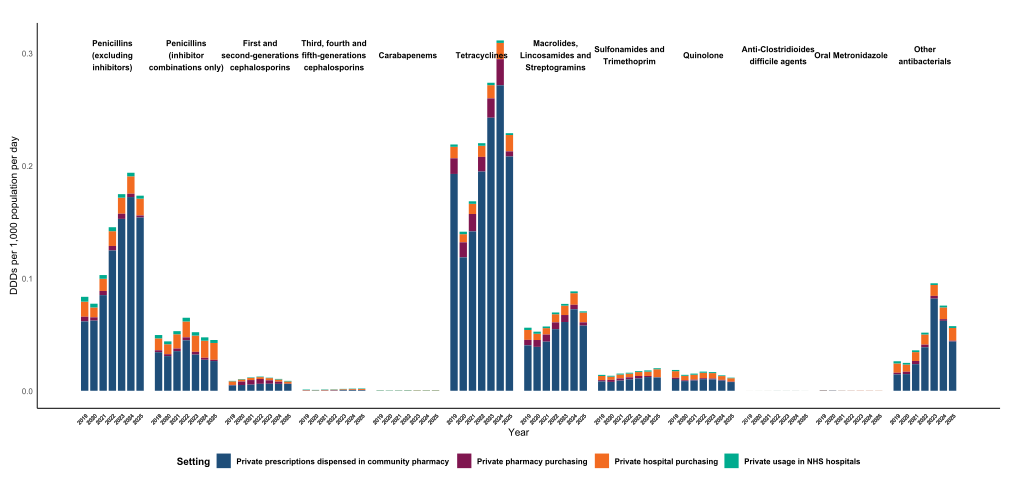
In 2025, tetracyclines (0.23 DID) remained the most frequently used antibiotic class across the combined non-NHS routes, primarily driven by private prescriptions dispensed in community pharmacies (0.20 DID, Figure 3.8). However, use of tetracyclines declined substantially between 2024 and 2025, returning to levels similar to those observed in 2019. Penicillins without a BLI and with BLI, macrolides, lincosamides and streptogramins, and other antibacterials also decreased substantially compared to 2024. The second most used antibiotic class was penicillins without a BLI (0.16 DID), followed by macrolides, lincosamides and streptogramins (0.07 DID). Within the tetracycline class, doxycycline accounted for 0.16 DID (70% of tetracyclines) and was the most frequently used antibiotic across all non-NHS routes, followed by amoxicillin (0.11 DID, 68.3% of penicillins with and without a BLI), lymecycline (0.068 DID; 29.1% of tetracyclines groups), and teicoplanin (0.046 DID, 92% of other antibacterials). This differs from NHS prescribing patterns, where penicillins with and without a BLI is the most frequently used antibiotic group. The higher use of tetracycline class antibiotics via non-NHS routes may reflect differences in case mix between settings. Tetracyclines are commonly used for the management of chronic respiratory conditions, dermatological conditions such as acne or tick-borne infections and some sexually transmitted infections (STIs).
Figure 3.8. Antibiotic consumption in private (non-NHS) routes by antibiotic class and setting, 2019 to 2024, England
Antibiotic consumption in NHS primary care (items by population)
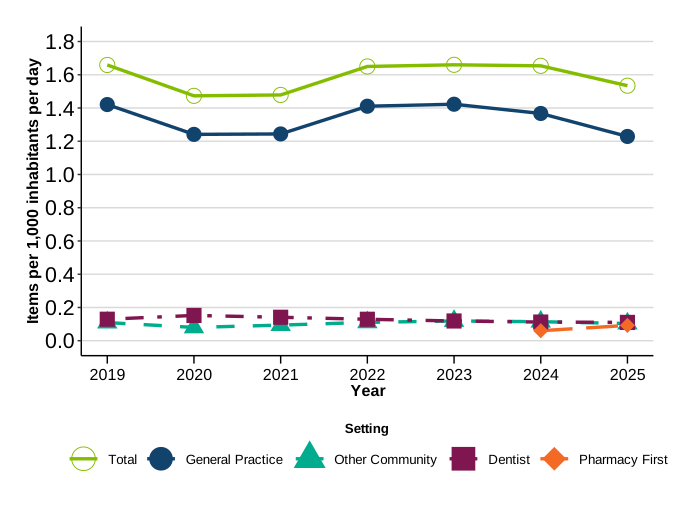
In 2025, primary care accounted for 75.8% of all antibiotic consumption (Figure 3.9), with use decreasing by 7.5% compared with 2019 (from 1.65 items per 1,000 inhabitants per day in 2019 to 1.53 items per 1,000 inhabitants in 2025) and by 7.2% compared with 2024.
This reflects reductions in general practice, dental, and other community settings between 2024 and 2025 (1.37 to 1.23, 0.112 to 0.110, and 0.114 to 0.103 items per 1,000 inhabitants per day, respectively). However, there was an increase in Pharmacy First consumption (0.06 to 0.09 items per 1,000 inhabitants per day), reflecting growing uptake of the scheme following its launch in January 2024 (Figure 3.9).
Figure 3.9. Total antibiotic consumption in primary care by settings, expressed as items per 1,000 inhabitants per day, England, 2019 to 2025
General practice (GP) consumption
GP antibiotic consumption decreased to 1.23 items per 1,000 inhabitants per day in 2025, representing a 13.5% reduction compared with 2019 levels (Figure 3.9). Prescribing patterns between 2020 and 2024 were affected by the COVID-19 pandemic which was associated with reduced antibiotic consumption in primary care, followed by increased prescribing in 2022 and 2023 during periods of heightened respiratory and Group A Streptococcus infection activity. The lower consumption observed in 2025 may reflect a return to more typical infection incidence and prescribing levels, alongside ongoing antimicrobial stewardship efforts, including the promotion of shorter antibiotic treatment courses.
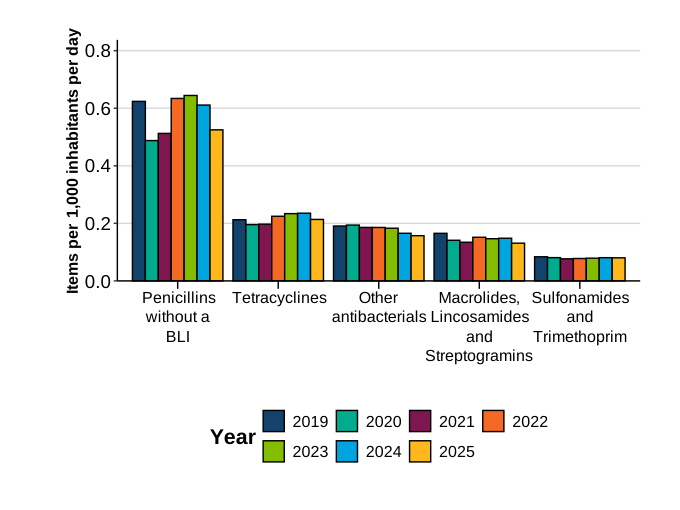
In keeping with UK guidelines for the management of common infections, Penicillins without a BLI remain the most commonly used antibiotic group within the GP setting, accounting for 42.7% of all antibiotic consumption within this setting in 2025. This is followed by the Tetracyclines (17.4%), Other antibacterials (12.8%), and Macrolides, Lincosamides and Streptogramins (10.7%) groups (Figure 3.10).
In 2025, Penicillins (without a BLI and with BLI combinations) usage declined compared with 2019 (−15.9%), with a large reduction (−14.1%) in the last 2 years (0.64 to 0.53 items per 1,000 inhabitants per day from 2024 to 2025). This pattern is mirrored, to a lesser extent, with reductions observed across the other most commonly used antibiotic groups (apart from Sulfonamides and Trimethoprim) in 2025 (Figure 3.10).
Figure 3.10. Most commonly used antibiotics in the GP setting, expressed as items per 1,000 inhabitants per day, England, 2019 to 2025
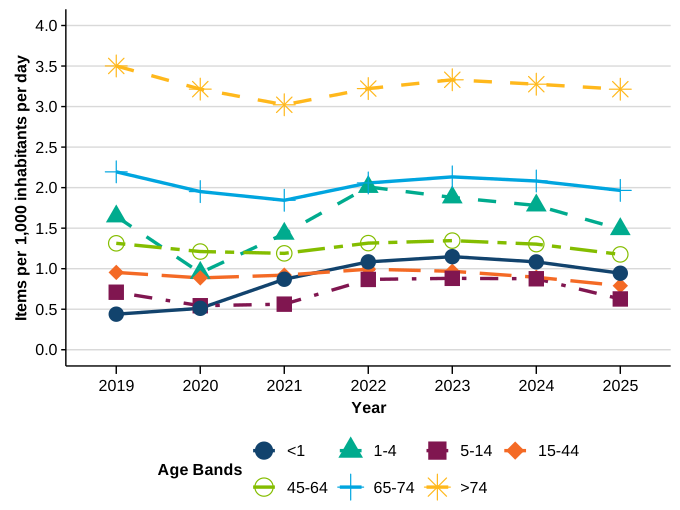
As with previous years, the rate of antibiotic use was highest amongst the oldest age groups in 2025 (1.97 and 3.21 items per 1,000 inhabitants per day in those aged 65 to 74 years and 75 years and above, respectively) (Figure 3.11).
When compared with 2019, rates of antibiotic consumption in 2025 were lower across all age groups, except for in children under one year (link to Paediatric section), although this age group only accounts for a small proportion of total prescribing. In other children and young people (1 to 4 years and 5 to 14 year groups) an increase in prescribing observed during the 2022 to 2023 surge in Group A Streptococcus (GAS) had resolved by 2025 (Figure 3.11).
Figure 3.11. Antibiotic items per 1,000 inhabitants per day, in general practices by age group, England, 2019 to 2025
General practice antibiotic consumption by paediatric age groups
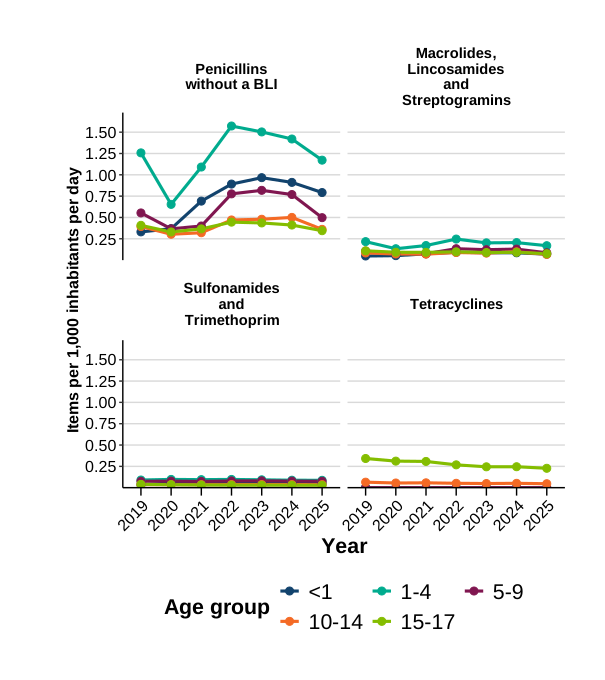
The most commonly prescribed antibiotic group for children and young people (0 to 17 years) in general practice in 2025 were penicillins without a BLI (3.17 items per 1,000 inhabitants per day), followed by macrolides, lincosamides and streptogramins (0.47 items per 1,000 inhabitants per day). Together, these 2 classes accounted for 81.6% of total antibiotic consumption in children (71.1% and 10.5% respectively), consistent with most prescriptions in this age group being prescribed for respiratory infections (16). Antibiotic consumption was below 2019 levels for all age groups in children, except for in infants under one year, where antibiotic prescribing was 115.1% higher in 2025 compared to 2019 (0.9 versus 0.4 items per 1,000 inhabitants). This usage was primarily driven by penicillins without a BLI (Figure 3.12) which despite decreasing from 2024, remained more than double levels from 2019 (0.8 compared to 0.3 items per 1,000 inhabitants respectively).
Sulfonamides and trimethoprim, and tetracyclines were the third and fourth most frequently prescribed groups (6.2% each). Tetracyclines groups are indicated for the treatment of acne (17), bacterial infections of the respiratory tract, and certain sexually transmitted infections. In line with National Institute for Health and Care Excellence (NICE) guidance advising against use of tetracyclines for children under 12 years old (18), consumption was reported for the age groups 10 to 14 years and 15 to 17 years, but not for younger age groups. Sulfonamides and trimethoprim, commonly used to prevent and treat urinary tract infections (6), accounted for 6.2% of general practice antibiotic consumption in all children (0 to 17 years) (6). In line with NICE guidance for the management of common infections, penicillins with BLI accounted for a relatively small proportion of antibiotic use in paediatric age groups in general practice, ranging from 1.6% (0.015 items per 1,000 inhabitants per day in infants under one year) to 2.5% (0.018 items per 1,000 inhabitants per day in children aged 5 to 9 years).
The national Respiratory Syncytial Virus (RSV) vaccination programme, introduced in September 2024, may contribute to changes in antibiotic prescribing in younger age groups over time by reducing viral respiratory infections that may otherwise lead to inappropriate antibiotic use. Maternal vaccination aims to protect infants via transferred antibodies, providing approximately 70% protection against severe RSV infection in the first 6 months of life (19). Early evidence from Scotland, where rollout began in August 2024, indicates the programme’s effectiveness, with a 62% reduction in RSV-related hospitalisations among older adults during the 2024 to 2025 winter, alongside increasing uptake in both older adults and pregnant women (20).
In 2025, England age-stratified data demonstrated a reduction in antibiotic items among children under 5 years, compared with 2024. However, similar reductions were observed across all paediatric and adult age groups and may also reflect ongoing efforts to reduce unnecessary antibiotic prescribing in children through the NHS Oversight Framework target for paediatric antibiotic prescribing. As such, and given the timing of the programme, these reductions cannot yet be clearly attributed to the RSV vaccination programme alone. Further surveillance, including analysis of clinical indications and consultation rates, will be important to clarify the underlying causes of this decrease in antibiotic prescribing in children.
In 2025, the proportion of antibiotic consumption comprising Access antibiotics declined with increasing age: from 90.9% in infants under one year, 86.3% in 1-to-4 year olds, 85.1% in 5-to-9 year olds, 79.1% in 10-to-14 year olds and 66.4% in 15-to-17 year olds. This is reflective of higher usage of Penicillins without a BLI in younger age groups, and usage of Tetracyclines (for example Lymecycline for acne) in older age groups.
Figure 3.12. Rate of top 4 most used antibiotic classes in general practice setting by paediatric age groups, 2019 to 2025
Age and sex distribution
Within the setting of primary care in 2025, consumption of antibiotic items (excluding non-systemic antibiotics, methenamine hippurate, anti-leprotic and anti-tubercular agents) varied by age and sex (Figure 3.13). Usage of antibiotics was highest among adults aged 75 and over (2.6 items per 1,000 inhabitants in males and 3.4 items per 1,000 inhabitants in females). The next highest rates were observed in children aged 1 to 4 years (1.6 and 1.5 items per 1,000 inhabitants in males and females, respectively), reflecting the substantial burden of common childhood infections managed in primary care. Apart from the 2 youngest paediatric groups, females consumed more primary care antibiotics than males across all age groups. The largest difference by sex was among those aged 45 to 64 years, where female sex use was nearly double that of males (1.5 items compared to 0.8 items per 1,000 inhabitants).
Figure 3.13. Primary care antibiotic consumption (items per 1,000 inhabitants per day) by age and sex in England, 2025
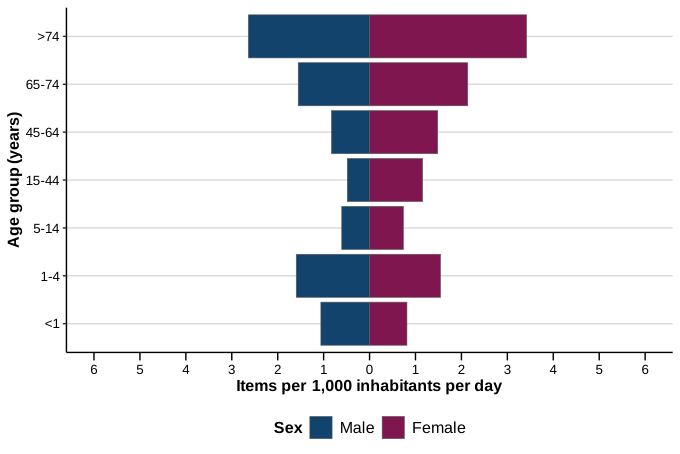
The age distribution of primary care antibiotic consumption broadly mirrors the epidemiology of bacteraemia and resistant bacteraemia reported in Chapter 2, with the highest burden observed among adults aged 75 years and over. While antibiotic treatment of bacteraemia would be mostly captured within secondary care data, the similar trends reflect the propensity of different age groups to develop infections. Notably, paediatric antibiotic consumption in primary care was highest among children aged 1 to 4 years, illustrating the burden of childhood infections treated in outpatient care. In contrast, antibiotic use corresponding to high rates of bacteraemia and resistant bacteraemia in infants (children aged under one year) is not displayed in this graph, as it typically occurs in neonatal units and paediatric hospital wards. Primary care antibiotic consumption was higher in females across most adult age groups, whereas rates of bacteraemia and resistant bacteraemia were higher in males. Further information on age- and sex-related patterns of bacteraemia and resistant bacteraemia can be found in Chapter 2.
Ethnicity
Ethnicity information was available for 87.6% of antibiotic items dispensed in primary care in 2025. Antibiotic consumption was highest in the White ethnic group. Compared with the White group, consumption was 14% lower in the Asian or Asian British ethnic group. 28% lower in the Black, African, Caribbean or Black British ethnic group, 43% lower in the Mixed or Multiple ethnic group, and 50% lower in the Other ethnic group.
Figure 3.14. Primary care antibiotic consumption (items per 1,000 inhabitants per day) by age, sex and ethnic group in England, 2025
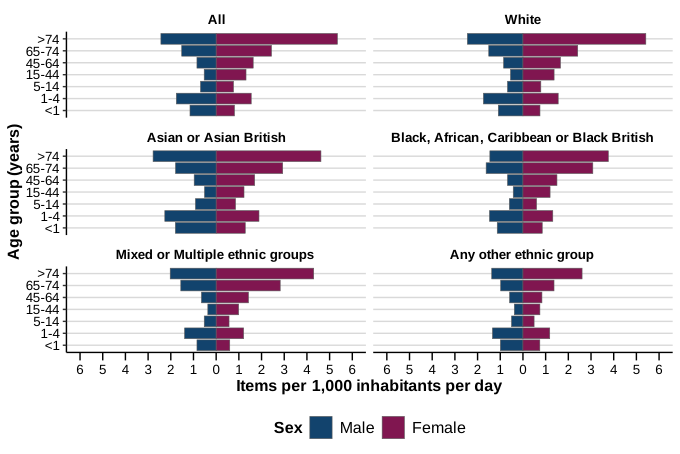
Across all ethnic groups, females aged over 74 years had the highest antibiotic use. Among males, antibiotic use was generally highest in the Asian or Asian British group across age categories (Figure 3.14, Chapter 3 data tables).
The highest rate of resistant bacteraemia was observed in the Asian or Asian British ethnic group (46.6 per 100,000 population), with 42.4% of bacteraemia episodes resistant. Further information on variation in bacteraemia by ethnic group can be found in Chapter 2.
Deprivation
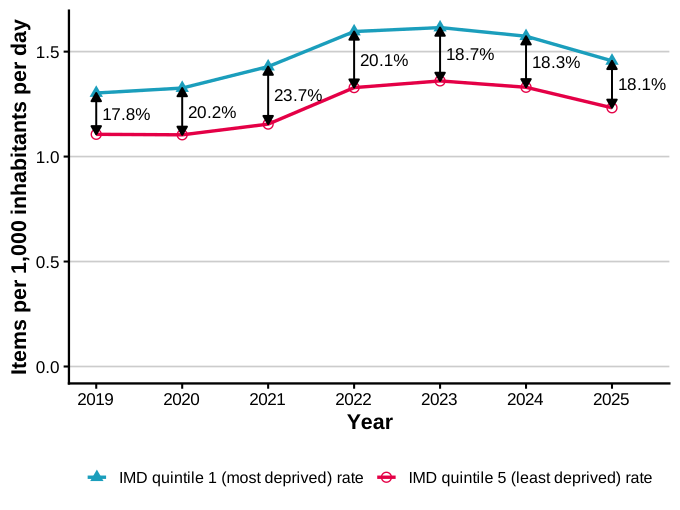
Of those antibiotics dispensed with deprivation information available (85.5%) in 2025, the most deprived IMD quintile had the highest rate of antibiotic usage (1.5 items per 1,000 inhabitants per day), which was 18.1% (Figure 3.15) higher than those in the least-deprived IMD quintile (1.20 items per 1,000 inhabitants per day). Notably, the percentage difference in antibiotic consumption between the most and least deprived quintiles has narrowed since a post-COVID-19 peak, from 23.7% in 2021 to 18.1% in 2025 (p<0.001), now close to pre-pandemic levels (17.8% in 2019). While antibiotic treatment of bacteraemia would be mostly captured within secondary care data, a similar pattern was observed for rates of bacteraemia in these groups, though deprivation-related inequalities remain more pronounced for resistant bacteraemia (Chapter 2, Figure 2.6). Further information on the variation by IMD quintile in the estimated rate of bacteraemia and resistant bacteraemia can be found in Chapter 2, Figure 2.6.
Figure 3.15. Primary care antibiotic consumption (items per 1,000 inhabitants per day) for most and least deprived IMD quintiles, 2019 to 2025
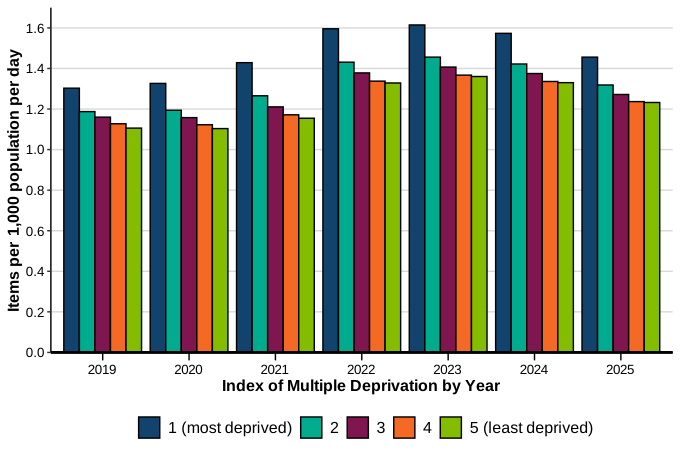
Although the deprivation gradient in antibiotic consumption has narrowed since 2022 (p <0.001) (Figure 3.16), higher levels of antibiotic use remain concentrated in the more deprived quintiles. While current data does not include infection history or prescribing indication, it could be hypothesised that the most deprived are at higher risk for infections, requiring more antibiotic use in this segment of the population. This was described by Bell and colleagues and Thomson and colleagues, who showed that most deprived areas had higher levels of antibiotic prescribing even after adjusting for health need and other confounders (4, 21). Higher antibiotic exposure may also increase the likelihood of drug-resistant infections, and this risks accentuating inequalities in AMR further compared to 2024.
Figure 3.16. Primary care antibiotic consumption (items per 1,000 inhabitants per day) by IMD quintile, 2019 to 2025
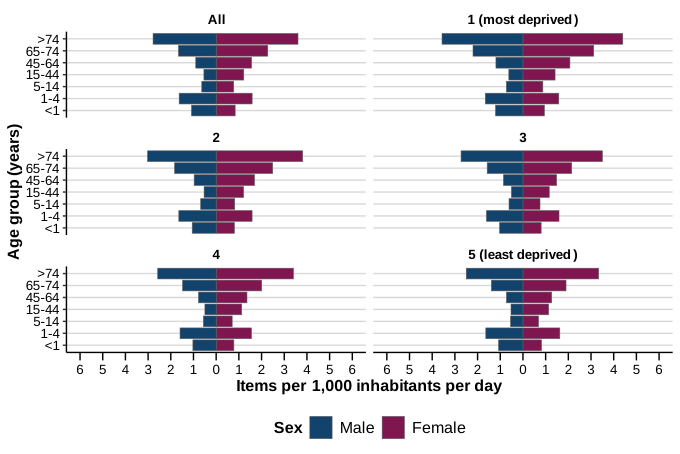
When stratifying deprivation and antibiotic consumption by sex and age group, no considerable differences were found (Figure 3.17) between deprivation quintiles, which may suggest a uniform association between deprivation and antibiotic consumption across age-groups. Other factors, for example, ethnicity, likely interact with deprivation in ways this summary-level analysis does not capture, reinforcing the need for targeted surveillance that examines how deprivation effects antibiotic consumption across population subgroups.
Figure 3.17. Primary care antibiotic consumption (items per 1,000 inhabitants per day) by age, sex and IMD quintile, 2025
Other community use
Antibiotic consumption in ‘other community’ settings decreased by 9.7% between 2024 and 2025, and by 5.2% compared with 2019. The 2024 to 2025 ESPAUR report showed an increase in antibiotic use within the ‘other community’ setting, this was largely related to the inclusion of Pharmacy First service activity (34). In this report, the Pharmacy First service supply has been reported separately, resulting in a clearer representation of underlying trends within the ‘other community’ category.
Increases seen between 2022 to 2023, in both in ‘other community’ and general practice, exceeding pre-pandemic 2019 levels, suggests increased infection incidence and healthcare demand during this period, across various settings, rather than changes in the provision of services alone.
In 2025, out-of-hours primary care centres accounted for the largest share of antibiotic consumption within the other community setting (47.7%), followed by other community services (21.1%) and urgent care centres (10.9%). Antibiotic use within out-of-hours primary care centres decreased by 12.5% between 2019 and 2025. Use has also declined since the peak observed during the surge in GAS and respiratory infections in 2023 (−15.8%, from 0.059 to 0.049 items per 1,000 inhabitants per day between 2023 and 2025). Some antibiotics provided through alternative supply routes, such as Patient Group Directions, which allow specified medicines to be supplied or administered to predefined groups of patients without an individual prescription, or direct sourcing from wholesalers, may not be fully captured in prescribing data. These factors, along with natural fluctuations in infection rates, should be considered when interpreting trends.
NHS dental use
Following a peak in 2020, antibiotic consumption in dental settings decreased by 27.6% to 0.11 items per 1,000 inhabitants per day in 2025. Consumption fell below pre-pandemic (2019) levels in 2023 and was 14.8% lower in 2025 than in 2019.
While reductions in NHS dental antibiotic consumption may reflect changes in service delivery, improved access to urgent dental care and antimicrobial stewardship initiatives, the lack of private prescribing data limits assessment of antibiotic use across the whole dental system. Wider implementation of dental e-prescribing could improve the completeness and timeliness of prescribing surveillance across NHS and independent dental settings. However, implementation would require legislative and regulatory changes, including amendments to the Dental Act. This direction is supported by both the College of General Dentistry and the British Dental Association.
The most commonly used antibiotics in dental care in 2025 were amoxicillin (67.2%), metronidazole (27.4%), phenoxymethylpenicillin (1.8%) and erythromycin (1.7%). Consumption of all decreased compared with 2024, except phenoxymethylpenicillin, which increased by 8.1%. Although overall use remained low (43,170 items in 2025), phenoxymethylpenicillin consumption has increased 5-fold since 2019, consistent with guidance recommending it as the first-line antibiotic for dento-alveolar infections and suggesting a shift towards narrower-spectrum prescribing (22, 23).
Pharmacy First
The Pharmacy First service was commissioned by NHS England in 2023, enabling participating community pharmacies from January 2024 to supply prescription-only medicines, including antimicrobials, for 7 common conditions following structured consultation (see ESPAUR report annexe and Chapter 6 for further information). While intended to reduce pressure on general practice and support appropriate usage, trends in antibiotic use observed likely reflect complementary shifts in patient pathways from other healthcare settings and should be interpreted alongside these data limitations (expanded caveats in ESPAUR report annexe) and variation in infection rates.
During the first 11 months following the introduction of the Pharmacy First service (February to December 2024), antibiotic use was 0.06 items per 1,000 inhabitants per day. Across the subsequent full calendar year (January to December 2025), this increased to 0.092 items per 1,000 inhabitants per day (+53.1%). The monthly trend demonstrates this increase in supply through the Pharmacy First service over this time and continued expansion and adoption of the service (Figure 3.18).
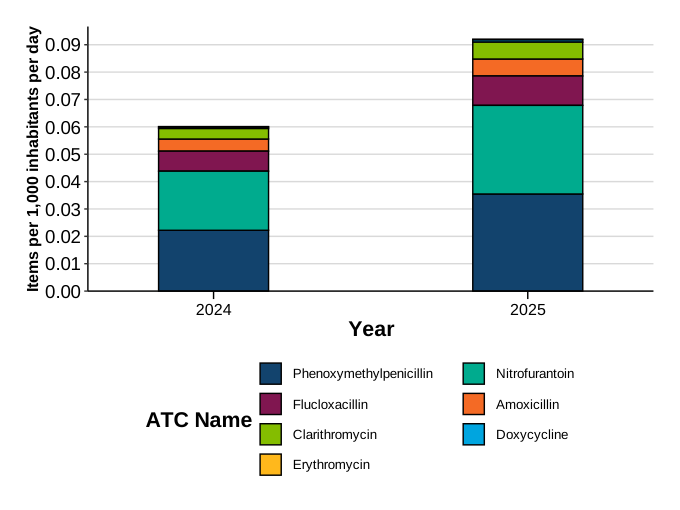
In 2025, the most supplied antimicrobials under the Pharmacy First service pathways were phenoxymethylpenicillin (38.5%; 0.035 items per 1,000 inhabitants per day), nitrofurantoin (35.2%; 0.032 items per 1,000 inhabitants per day), flucloxacillin (11.7%; 0.011 items per 1,000 inhabitants per day), amoxicillin and clarithromycin (both at 6.7%; 0.006 items per 1,000 inhabitants per day) (Figure 3.19).
Since the introduction of the Pharmacy First service in February 2024, supply of phenoxymethylpenicillin, the most frequently supplied antibiotic through the scheme, has increased by 59.6% (0.22 to 0.35 items per 1,000 inhabitants per day), alongside increased supply of all included antibiotics in the scheme. This contrasts with the declining Penicillin (excluding beta-lactam/beta-lactamase inhibitor combinations) prescribing in general practices, suggesting a shift from general practice to community pharmacy (although not accounting fully for the overall reduction seen in general practice consumption). Pharmacy First data also reflects changes in access to healthcare, with the number of consultations increasing in 2025 across all indications (see Chapter 6). Although antibiotic supply has increased alongside consultation numbers; the proportion of consultations resulting in an antibiotic supply decreased in 2025 compared with 2024, that is a lower rate of antibiotic supply per consultation. The increasing use of phenoxymethylpenicillin highlights the growing role of community pharmacy in the management of sore throat and antimicrobial stewardship. Chapter 4 explores how different UK community pharmacy models, including the use of rapid point-of-care testing in Wales, may influence antibiotic prescribing for sore throat.
Total consumption across all nitrofurantoin formulations in primary care increased slightly by 0.8% between 2024 (February to December) and 2025 (January to December) (an increase of 34,150 items). Within the general practice setting, however, nitrofurantoin items decreased by 5.3% (a reduction of 184,730 items). A similar reduction was seen in other community settings (excluding Pharmacy First), where items fell by 3.7% (a reduction of 10,471 items) over the same period.
Conversely, nitrofurantoin was the second most commonly supplied antibiotic through the Pharmacy First scheme (UTI pathway for females aged 16 to 64 years), with consumption increasing by 49.5% between 2024 (February to December) and 2025 (January to December) (an increase of 229,351 items). Supply through Pharmacy First is limited to nitrofurantoin 100mg modified-release tablets, or 50mg immediate-release tablets or capsules.
Given the reductions observed in general practice and other community dispensing, the modest overall uplift in nitrofurantoin usage appears to be driven largely by supply through Pharmacy First. This suggests a shift in the management of uncomplicated UTIs from general practice to community pharmacies. It may also reflect a shift away from private GP prescribing towards Pharmacy First, alongside other explanations such as improved treatment access, increased public awareness of the Pharmacy First service, or changes in underlying infection rates.
Figure 3.18. Pharmacy First service antibiotic consumption, items per 1,000 inhabitant day, England, February 2024 to December 2025 [note 1]
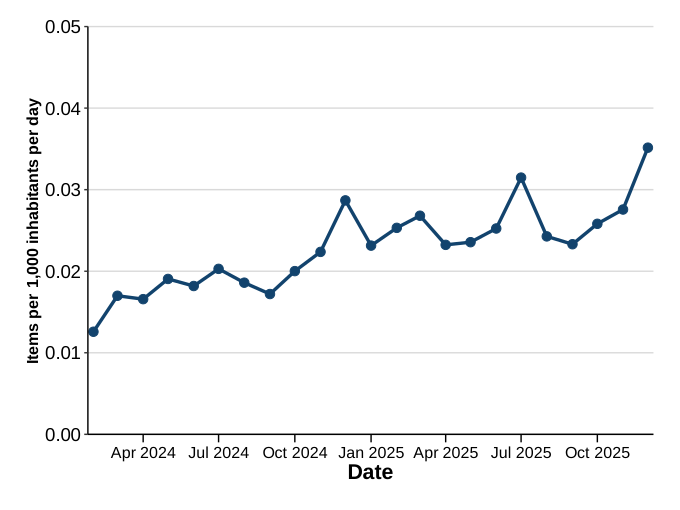
Note 1: total items dispensed for antibiotics covered by Pharmacy First clinical pathways have been included (nitrofurantoin, flucloxacillin, clarithromycin, erythromycin, phenoxymethylpenicillin, amoxicillin, doxycycline)
Figure 3.19. Pharmacy First service use by antibiotic, items per 1,000 inhabitant day, England, February 2024 to December 2025
Antibiotic use in NHS secondary care (DDDs by admissions)
Total antibiotic use in secondary care
Antibiotic consumption in this section is reported using hospital admissions as the denominator, with inpatient activity commonly used as a proxy for overall hospital activity. However, this approach has methodological limitations, as the numerator includes antibiotic consumption from both inpatients and outpatients. Trusts with higher or differing outpatient activity may therefore have antibiotic use under- or over-estimated when using admissions only. Furthermore, changes to Same Day Emergency Care (SDEC) reporting implemented from 2023 led to reductions in reported admissions for some trusts. As admissions are used as the denominator, these changes may influence antibiotic consumption rates independently of any true change in antimicrobial use and should be considered when interpreting trends.
In 2025, antibiotic use in NHS acute hospital trusts was 4,724 DDDs per 1,000 admissions. Antibiotic use has remained elevated since 2020, with levels in 2025 5.4% higher than in 2019. Since 2022, consumption has stabilised, with levels broadly comparable between 2024 and 2025, increasing marginally by 0.3% (from 4,709 DDDs per 1,000 admissions).
This year’s report uses Rx-Info as the data source for secondary care antimicrobial surveillance (see Methods in ESPAUR report annexe), representing the first change in data source for ESPAUR secondary care consumption reporting. Although Rx-Info has replaced the IQVIA HPA dataset, antimicrobial consumption metrics remain broadly comparable with those reported in previous ESPAUR reports. Unlike the previously used IQVIA HPA dataset, Rx-Info captures a wider range of care settings but with less distinction between inpatient and outpatient use. In 2025, 36% of secondary care antibiotic consumption was assigned to an ‘unknown’ care setting category, a proportion that has increased since 2021 and should be considered when interpreting trends (Figure 3.20).
Based on current categories, both inpatient and outpatient antibiotic use were lower in 2025 than in 2019. However, against a backdrop of stable total secondary care consumption, these trends should be interpreted with caution. Over the same period, increases in the ‘mix of inpatient and outpatient care’ (+16%) and ‘unknown’ (+26%) categories reduce confidence in attributing consumption to specific care settings. Comparison by care setting (that is inpatient and outpatient) activity is therefore limited in this year’s report. These differences in classification and completeness should be considered when interpreting trends and reinforces the importance of continued development of surveillance data.
Figure 3.20. Antibiotic consumption, total and by care setting within trust, expressed as DDDs per 1,000 admissions, England, 2019 to 2025
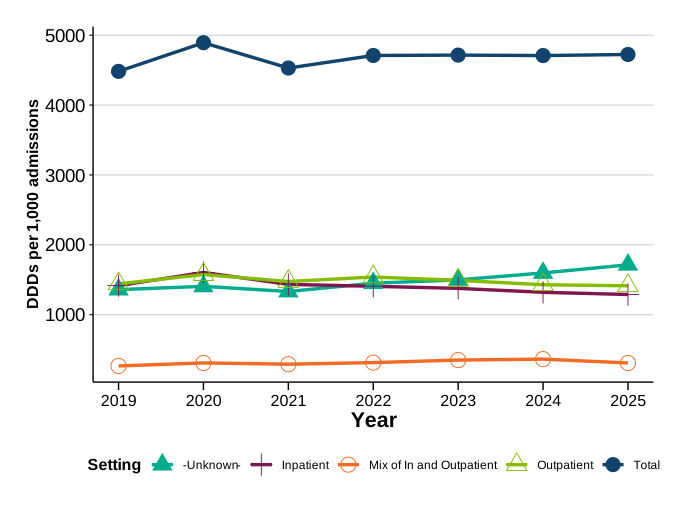
Note 1: Inpatients include: ‘Inpatient’ and ‘Inpatient-Service’. Outpatients: ‘Outpatient’, ‘Day case’, ‘Homecare’ and ‘Discharge/TTA’ (full list in chapter 3 of the ESPAUR report annexe).
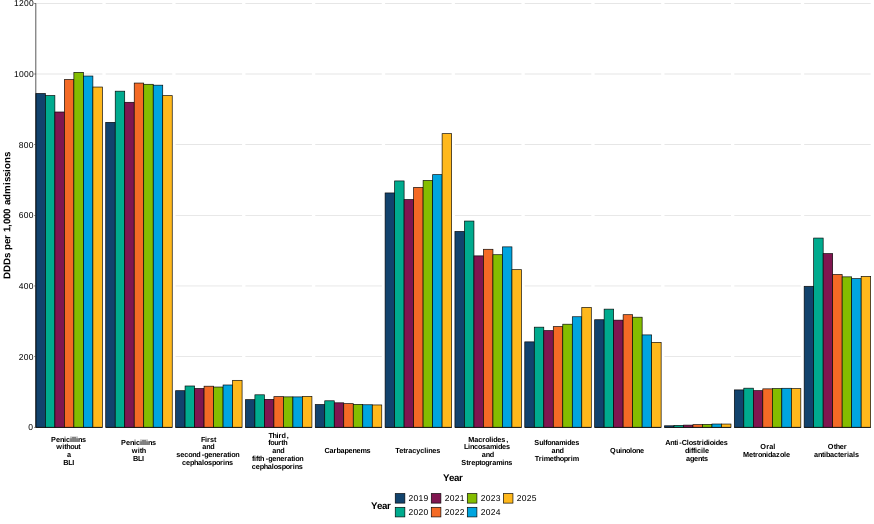
Figure 3.21 shows antibiotic usage (DDDs per 1,000 admissions) by antibiotic group from 2019 to 2025. In 2025, penicillins groups had the highest use in secondary care, accounting for 40% of acute trust antibiotic consumption. This was followed by tetracyclines at 18%, macrolides, lincosamides and streptogramins at 9%, other antibacterials at 9%. These proportions in prescribing groups remains relatively unchanged from 2024 and previous years.
Between 2019 and 2025, use of several antibiotics in secondary care declined (Figure 3.21). Consumption of antibiotics from the quinolone class decreased by 21% (from 304.4 to 240.5 DDDs per 1,000 admissions), macrolides, lincosamides and streptogramins by 19.5% (554.4 to 446.1 DDDs per 1,000 admissions), aminoglycosides by 12.7% (154.2 to 134.7 DDDs per 1,000 admissions), and carbapenems by 2% (64.5 to 63.2 DDDs per 1,000 admissions). The decline in use of the carbapenem class was largely driven by reductions in meropenem (from 54.3 to 51.0 DDDs per 1,000 admissions, respectively). In contrast, consumption of the tetracyclines, and sulfonamides and trimethoprim classes increased (by 25.3%, from 663.3 to 831.1 DDDs per 1,000 admissions and 40.4% from 241.8 to 339.4 DDDs per 1,000 admissions, respectively) over this time period. One of the most striking changes in Figure 3.21 is the rise in tetracycline groups in 2025 (+16.2%, 715.1 to 831.1 DDDs per 1,000 admissions from 2024). The increase was largely driven by doxycycline consumption. While doxycycline is used for a range of indications, including respiratory infections and as an oral step-down option in line with the IV-to-oral switch (IVOS) antimicrobial stewardship initiative in adults (see Chapter 6), linked indication data is not available to assess changes in use by indication. The observed increase is likely to be driven by the rollout of doxyPEP services, with supplies transferred from hospital pharmacies to sexual health clinics.
Anti-Clostridioides difficile agents increased by 117.5% between 2019 and 2025 (from 4.2 to 9.2 DDDs per 1,000 admissions), although consumption decreased slightly compared with 2024 (9.3 DDDs per 1,000 admissions), potentially reflecting rising rates of hospital-onset C. difficile infections. This increase may reflect rising rates of hospital-onset C. difficile infection and coincides with the publication of updated NICE guidelines for C. difficile prescribing, recommending fidaxomicin use. This has progressively led to integration of fidaxomicin into primary and secondary care formularies, thereby improving access to this agent (24).
Speciality prescribing
The transition from IQVIA HPA to Rx-Info as the secondary care data source has resulted in differences in how antibiotic consumption activity is linked to clinical specialties. Rx-Info assigns antibiotic use based on the ward or department from which medicines are supplied, reflecting stock movement and dispensing activity, whereas IQVIA linked consumption to the specialty responsible for patient care. As a result, 12% of secondary care DDDs in 2025 (increasing from 8% in 2019) could not be assigned to a specialty and were excluded from the specialty-specific analyses presented here. These DDDs remain included in overall total and secondary care consumption figures. These differences in data classification and the increasing proportion of unclassified data should therefore be taken into account when interpreting the findings.
Consumption data for specialist groups in secondary care is presented in Table 3.2. Within the specialist groups, intensive care units (ICUs) continue to have the highest rate of antibiotic usage, with 39.9 DDDs per ICU admission in 2025. The next highest rate of antibiotic usage was observed in accident and emergency (A&E) and non-specified outpatient departments, with 19.3 DDDs per speciality admission. Linking this data with clinical information, such as indication and microbiological results, would enable identification of targeted opportunities to optimise prescribing practices.
Between 2019 and 2025, many speciality groups showed an increase in antibiotic use, with the exception of general medicine (−13.6%), geriatrics (−10.5%), specialist surgery (−13.7%), paediatrics (−12.3%), and obstetrics and gynaecology (−5%) which decreased below pre-pandemic levels. The greatest increase in antibiotic consumption from 2019 was observed in A&E and non-specific outpatient departments (+4.9%, 14.4 to 19.3 DDDs per admission). This finding highlights the importance of understanding antibiotic prescribing in A&E and ambulatory care settings as they may represent an important opportunity for targeted antimicrobial stewardship interventions.
Table 3.2. Antibiotic consumption in secondary care by speciality, expressed as DDDs, % DDDs per specialist group, and DDDs per speciality admission, England, 2025
| Specialist group | 2025 DDDs | % of DDDs accounted for by specialist group | DDDs per admission |
|---|---|---|---|
| Intensive care unit | 1,519,073 | 2% | 39.9 |
| A&E/Non-specific out-patient department | 14,149,161 | 17% | 19.3 |
| Specialist medicine | 8,827,872 | 11% | 2.8 |
| General surgery | 7,568,308 | 9% | 3.3 |
| Geriatrics | 3,071,959 | 4% | 2.8 |
| Orthopaedics | 2,866,035 | 3% | 2.4 |
| Obstetrics and gynaecology | 3,354,370 | 4% | 2.0 |
| Paediatrics | 2,176,507 | 3% | 1.4 |
| General medicine | 22,823,895 | 28% | 3.3 |
| Specialist surgery | 5,332,152 | 6% | 1.8 |
| Other | 663,940 | 1% | 0.8 |
| Unknown | 9,701,557 | 12% | Not available |
Figure 3.21. Antibiotic consumption in trusts by antibiotic class, expressed as DDDs per 1,000 admissions, England 2019 to 2025
Antibiotics licensed in the UK since 2015 and used in the NHS, including those in the Antimicrobial Product Subscription Model
The Antimicrobial Products Subscription Model is a way for the NHS to purchase newly developed antibiotics, using a payment model to incentivise pharmaceutical companies to invest in antibiotic development. The model targets agents against infections caused by WHO priority bacterial pathogens, typically classified as Reserve antibiotics, reflecting the need to use them sparingly and only when clearly indicated (serious, multidrug-resistant infections) to preserve their effectiveness for patients who most need them and delay the emergence and spread of resistance to these valuable new treatments.
Antimicrobials currently included in the NICE and NHS England (NHSE) antimicrobial product subscription model are cefiderocol and ceftazidime with avibactam. Our surveillance also includes other newer Reserve antibiotics targeting multidrug-resistant infections, including ceftolozane with tazobactam, eravacycline, imipenem with relebactam, and aztreonam with avibactam. In recent years, several antimicrobials have been developed and approved for use in the UK (mentioned above). More recently, aztreonam with avibactam, was launched in the UK in June 2024 for the treatment of aerobic Gram-negative bacterial infections, including those caused by Pseudomonas aeruginosa and Klebsiella pneumoniae. Uptake of newer antibiotics remains variable across NHS trusts.
In 2025, prescribing of more established agents such as ceftazidime with avibactam and cefiderocol were reported by a high number of trusts (119 and 98 out of 134 trusts, respectively). The high level of reporting may suggest that the Antimicrobials Subscription Model has improved awareness and supports more consistent reporting of their use across trusts. The uptake of newer or less widely used agents, including ceftobiprole and aztreonam with avibactam, remained limited (5 and 36 out of 134 trusts, respectively). Reporting increased slightly between 2024 and 2025 for the majority of antibiotics, apart from ceftazidime with avibactam (122 to 119 trusts reporting use between 2024 and 2025). Variation in the use of newer Reserve antibiotics should be interpreted alongside local AMR epidemiology and local commissioning arrangements, including joint Formulary Committee decisions that determine formulary access to these agents.
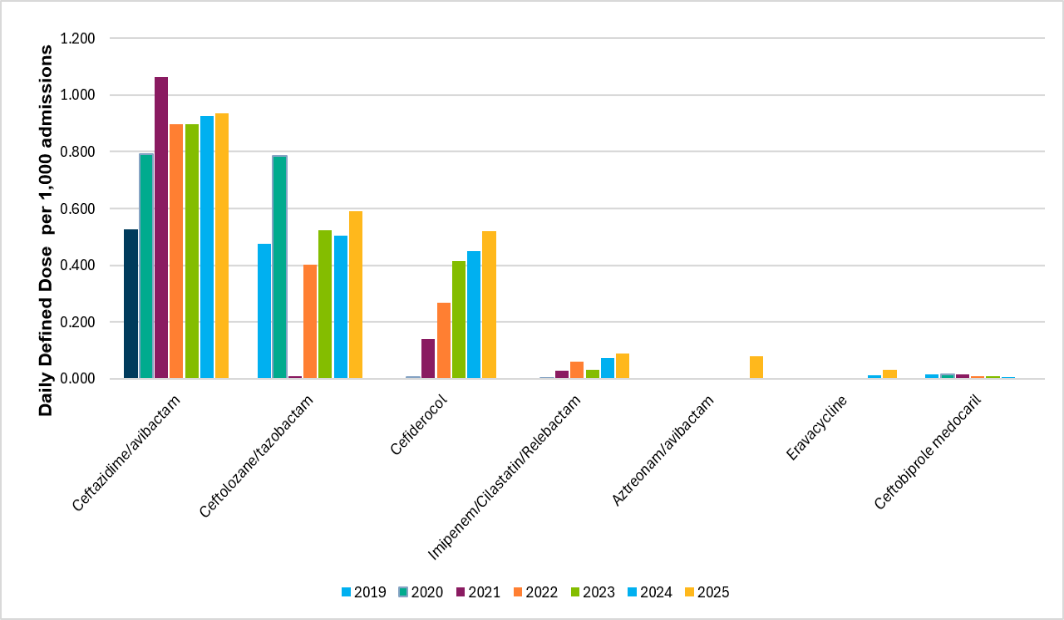
Between 2024 and 2025, consumption of newer antibiotics generally increased, although total use remained low (1.98 and 2.25 DDDs per 1,000 admissions) respectively, consistent with their classification as Reserve antibiotics for treatment of highly resistant infections. Ceftazidime with avibactam use increased slightly by 0.8% (0.927 to 0.935 DDDs per 1,000 admissions), while larger increases were observed for cefiderocol (+15.7%, 0.45 to 0.52 DDDs per 1,000 admissions) and ceftolozane with tazobactam (+16.9%, 0.50 to 0.59 DDDs per 1,000 admissions) following its significant decline in 2021 due to UK-wide shortages. Although published evidence from a subset of acute NHS trusts in the UK have identified cefiderocol resistance, which may present an emerging clinical concern, investigations into potential testing (disc diffusion versus broth microdilution) differences and reporting gaps are ongoing to ensure national resistance of novel antimicrobials is accurate and representative (25, 26). National AMR estimates for cefiderocol are therefore not currently included in this report.
Use of imipenem/cilastatin/relebactam (launched in February 2020) also increased (+24.2%, from 0.072 to 0.090 DDDs per 1,000 admissions). Eravacycline use (launch in May 2023) remained low (0.03 DDDs per 1,000 admissions in 2025), as did ceftobiprole (from 0.005 to 0.004 DDDs per 1,000 admissions) (Figure 3.22).
Figure 3.22. New antibiotic consumption, expressed as DDDs per 1,000 admissions, England, 2019 to 2025
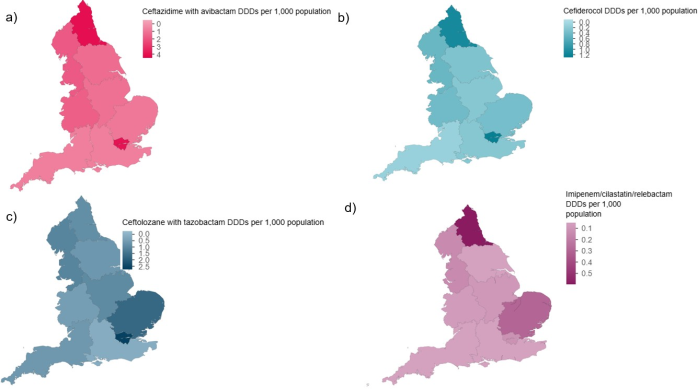
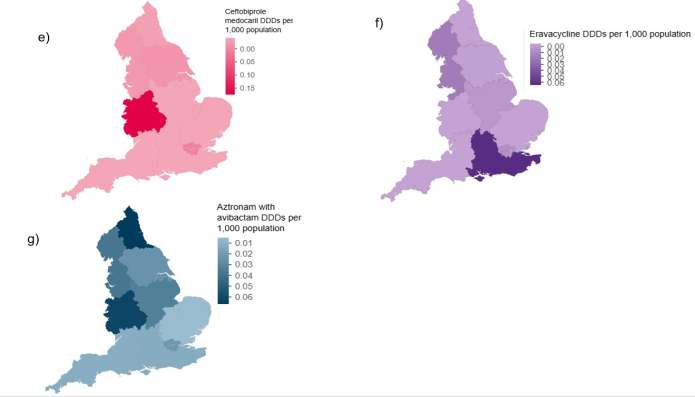
The highest consumption rates of the subscription model antibiotics for ceftazidime with avibactam and cefiderocol were observed in London, followed by the North East region (Figure 3.23 and Annexe 3.4).
Ceftolozane with tazobactam was the third most commonly used newer antimicrobials, with highest use in the East of England and London. Imipenem/cilastatin/relabactam use dominated in the North East, whilst the West Midlands had the highest consumption of ceftobiprole.
Aztreonam with avibactam and eravacycline had very low use, with most consumption reported in the North East and West Midlands for aztreonam with avibactam, and eravacycline use dominated in the South East and was only used by 4 of 9 regions (Figure 3.23).
As highlighted in Chapter 2, acquired CPO infections have a very limited number of effective treatment options, and require healthcare systems to rely more heavily on newer Reserve antibiotics to successfully treat the severe infections caused by these multidrug-resistant organisms. Some of the individual novel antimicrobial consumption points to the regions with higher reported CPOs from sterile sites requiring treatment, but this is not reflected equally across regions/ICBs by the CPO mechanism requiring targeted treatment (Chapter 2, Figure 2.10). For example, NDM CPOs are the dominant mechanism in London, however, there is minimal uptake of the aztreonam with avibactam compared to other regions.
As surveillance of new antibiotic consumption continues to expand, there is growing interest in ‘non-traditional’ antibacterials (small molecule antibacterials, monoclonal antibodies, proteins or live biotherapeutics such as bacteriophages) as potential alternatives to antibiotics. Incorporating these non-traditional agents into emerging antimicrobial resistance surveillance and broadening the scope to include resistance monitoring for all new antimicrobials could support efforts to monitor their introduction and use, detect emerging resistance and promoting responsible antimicrobial use.
Figure 3.23. 2025 England regional consumption, DDDs per 1,000 population, (a) ceftazidime with avibactam (b) cefiderocol (c) ceftolozane with tazobactam (d) imipenem/cilastatin/relebactam (e) ceftobiprole medocaril (f) eravacycline (g) aztreonam with avibactam
Antifungal consumption
Total NHS antifungal consumption
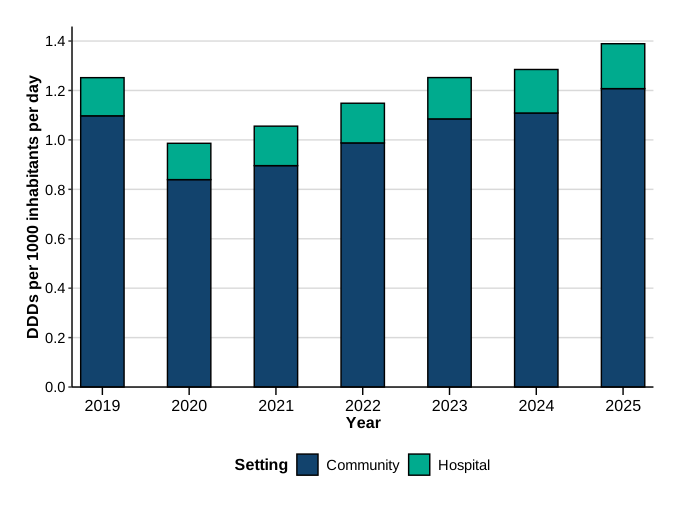
Total consumption of systemic antifungals in England in 2025 was 1.39 DID, this comprises 7.4% of antimicrobial usage presented in this report (infographics) and is higher than that seen in 2019 (+11%, Figure 3.24). In 2025, 87% of systemic antifungals were used in the community setting. This is likely an underestimate of community use, as several antifungal agents are supplied as over the counter (OTC) medicines, and not captured in this data set.
Figure 3.24. Total consumption of systemic antifungals in the community and acute hospitals, expressed as DDDs per 1,000 population per day (DID), England 2019 to 2025
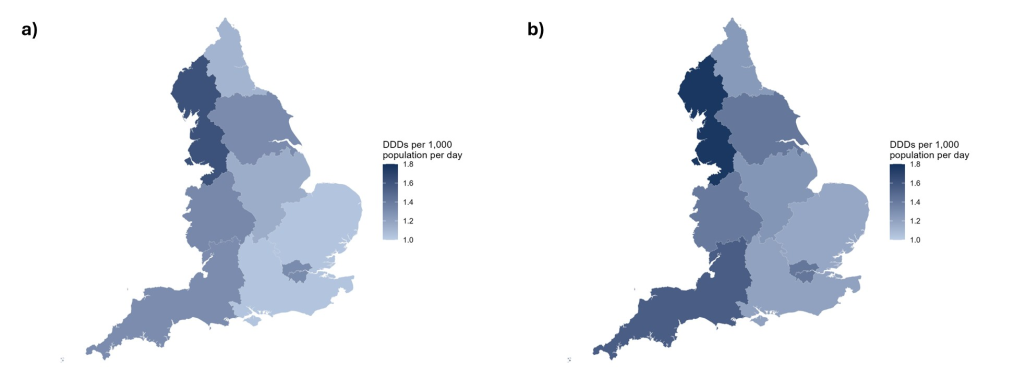
There was marked regional variation in use of antifungals in England (Figure 3.25). In 2025, the North West had the highest prescribing rate (1.72 DID) – this is also the region with the highest reported incidence of fungaemia (see AMR chapter annexe). The East of England used the fewest antifungals (1.20 DID). Differences in the resident population characteristics and distribution of specialist care trusts may account for the variations seen between regions.
Figure 3.25. Total consumption (primary and secondary care) of systemic antifungals expressed as DDDs per 1,000 inhabitants per day, by region in England (a) 2019 (b) 2025
Antifungal prescribing in NHS primary care
The total use of systemic antifungals in the community in 2025 was higher in comparison to 2019 (+10.0%, from 1.097 to 1.207 DID). Figure 3.24 shows a large decrease in total systemic antifungals prescribed in the community during the COVID-19 pandemic, that is between 2019 and 2020 (−23.5%, 1.097 to 0.839 DID). There have since been year-on-year increases from 2020 to 2025 (+43.9%, 0.839 to 1.207 DID).
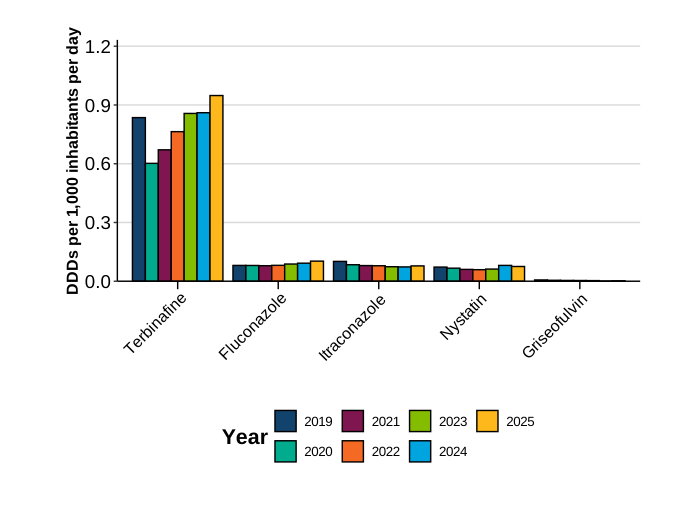
Figure 3.26 shows that the most frequently used antifungal in the community was terbinafine (0.948 DID in 2025), an oral antifungal agent active against common dermatophyte infections of the skin, hair and nails. Usage of terbinafine decreased by 27.8% from 2019 to 2020, likely related to the COVID-19 pandemic ‘lockdowns’, where transmission of dermatophyte infections was reduced. There has been a year-on-year increase in terbinafine use between 2020 and 2025 (+45.3%, 0.602 to 0.948 DID), surpassing 2019 levels. Overall, terbinafine use increased by 13.5% between 2019 and 2025 (0.836 to 0.948 DID). This increase in terbinafine use is concerning given the emerging resistance to terbinafine in the dermatophyte Trichophyton indotineae in England highlighted in Chapter 4 (Emerging concerns – Trichophyton indotineae).
Fluconazole usage has increased consistently over the last 4 years and is higher than in 2019 (+27.0%, 0.081 DID in 2019 to 0.103 DID in 2025). Oral fluconazole, most often used for cutaneous and mucosal yeast infections, is available over the counter, hence the numbers presented may not reflect true use. Nystatin use was also slightly higher in 2025 in comparison to 2019 (+4.2%, from 0.072 to 0.075 DID). Itraconazole use was lower in 2025 than in 2019 (−22.7%, from 0.101 to 0.078 DID). Griseofulvin usage has remained low (0.002 DID in 2025).
There are a limited number of drugs shown in Figure 3.26, as there are limited types of antifungals prescribed for systemic use in community settings. More variety can be seen in the hospital setting.
Figure 3.26. Total consumption of systemic antifungals in the community, expressed as DDDs per 1,000 population per day, England 2019 to 2025
Antifungal prescribing in NHS secondary care
As can be seen in Figure 3.27, total consumption of systemic antifungal agents in NHS acute trusts in 2025 was 224 DDDs per 1,000 admissions. This represents an increase of 3% from 2024 (217 DDDs per 1,000 admissions), and a 18.2% increase in comparison to 2019 (189 DDDs per 1,000 admissions). However, the 2019 data does not include terbinafine or griseofulvin due to missing data, which accounts for an average of 10.2 and 0.4 DDDs per 1,000 admissions each year, respectively, over the reporting period. In contrast to the use of systemic antifungals in the community, their use increased in NHS acute trusts during the COVID-19 pandemic, that is between 2019 and 2020.
Figure 3.27. Total consumption of systemic antifungals in NHS acute hospital trusts, expressed as DDDs per 1,000 admissions, England 2019 [note] to 2025
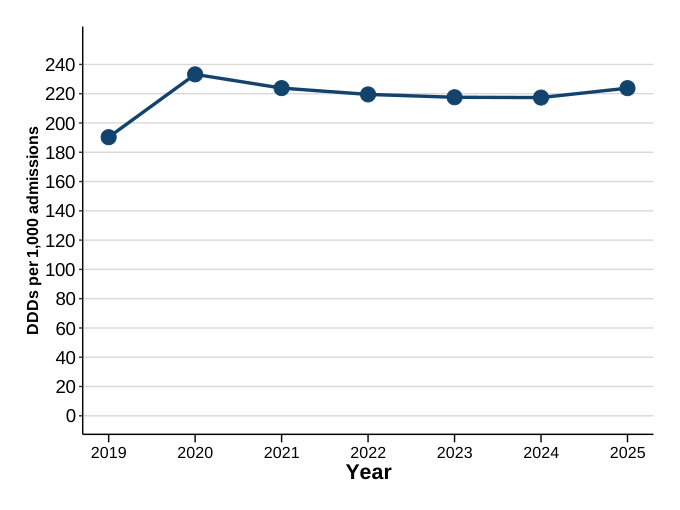
Note: Data for terbinafine and griseofulvin was unavailable for 2019.
Figure 3.28 shows the consumption of individual systemic antifungals in secondary care between 2019 and 2025. Fluconazole was the most frequently prescribed antifungal in 2025 (69 DDDs per 1,000 admissions), followed by posaconazole (53 DDDs per 1,000 admissions). Outbreaks of fluconazole resistant C. auris in England will influence future fluconazole use (see Chapter 2). Itraconazole and voriconazole usage has decreased between 2019 and 2025, with 36.6% and 19.6% reductions respectively during this time period, possibly representing a switch to posaconazole due to its broad spectrum of activity against moulds and more predictable pharmacokinetics meaning it is better tolerated by the body.
Amphotericin B is a broad-spectrum antifungal agent suitable for most invasive yeast and mould infections. Consumption of the drug decreased by 27% between 2019 and 2025 (from 5.9 to 4.3 DDDs per 1,000 admissions).
In 2025, consumption of echinocandin antifungals was 3.4, 7.7 and 0.3 DDDs per 1,000 admissions for anidulafungin, caspofungin and micafungin, respectively. Since 2019 both anidulafungin and caspofungin usage has increased (2019 to 2025: +32.1% and +55.5% respectively), although use is still low. Micafungin usage, however, decreased by 66.4%, from 0.766 to 0.257 DDDs per 1,000 admissions between 2019 and 2024. Rezafungin is currently in use in England, but prescribing remains low.
Flucytosine, which is not prescribed as a sole agent but often in combination with amphotericin B, has low levels of consumption at 0.083 DDDs per 1,000 admissions. Similarly to primary care, terbinafine usage, for which 2019 data was not available, increased between 2020 and 2025 (from 8.8 to 11.5 DDDs per 1,000 admissions).
Figure 3.28. Total antifungal consumption by drug in NHS acute trusts, England, 2019 [note] to 2025
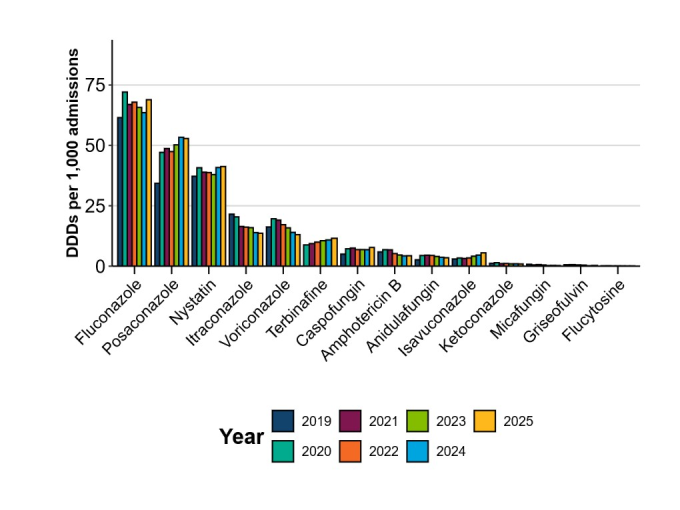
Note: Data for terbinafine and griseofulvin was unavailable for 2019.
In 2025, the specialty with the highest systemic antifungal consumption was clinical haematology (1,072 DDDs per 1,000 admissions). Patient-level data, including antifungal dosing and indication, would provide valuable insights as to the intention to provide prophylaxis or treatment of a confirmed fungal infection.
Antiviral consumption
This section covers antiviral consumption for the treatment of influenza, COVID-19, hepatitis B, hepatitis C and herpes simplex virus (aciclovir) in the NHS. It totalled 0.94 DID in 2025, accounting for 5% of antimicrobial usage.
NHS antiviral use for influenza
Between 2019 and 2025, consumption of oseltamivir in primary care for consultations for influenza-like illness (ILI) and in secondary care for influenza admissions, showed similar seasonal patterns. Use typically increased from October, peaked in December or January, and returned to baseline levels by April.
The highest peak in monthly ILI consultations occurred during the 2022 to 2023 influenza season (3 October 2022 to 21 May 2023), reaching 91.6 consultations per 100,000 population in December 2022. During the same season, primary care oseltamivir consumption peaked at approximately 43,600 DDDs (Figure 3.30). In the most recent complete influenza season (2024 to 2025), primary care oseltamivir consumption peaked in January 2025, at approximately 60,700 DDDs, representing a 39% increase compared with the 2022 to 2023 peak. This occurred despite a lower peak ILI consultation rate of 81.9 per 100,000 population (Figure 3.30).
In secondary care, oseltamivir consumption closely followed influenza admissions (Figure 3.31). The highest monthly consumption occurred in December 2022 during the 2022 to 2023 season, reaching approximately 255,600 DDDs alongside 46,5000 influenza admissions. This equated to approximately 5.5 DDDs of oseltamivir per influenza admission. In 2024 to 2025, secondary care oseltamivir consumption peaked at approximately 217,800 DDDs, with around 39,800 influenza admissions, again corresponding to approximately 5.5 DDDs per influenza admission.
When standardised by overall hospital activity, oseltamivir consumption in secondary care was highest in the most recent complete influenza season (2024 to 2025), at 52.9 DDDs per 1,000 hospital admissions, compared with 15.7 DDDs per 1,000 admissions in 2023 to 2024 and 23.1 DDDs per 1,000 admissions in 2019 to 2020 (Figure 3.29).
Figure 3.29. Defined daily doses of oseltamivir in secondary care per 1,000 hospital admissions, for years running September to August, 2019 to 2020 to 2024 to 2025
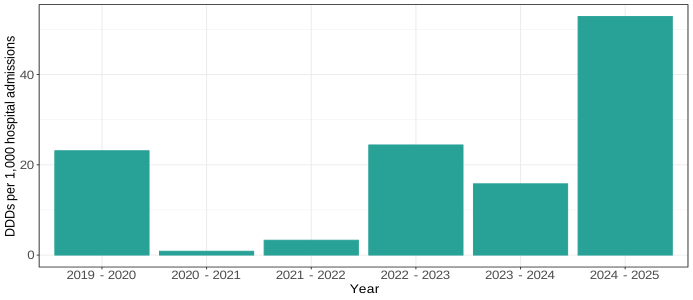
Consumption of zanamivir in secondary care remained low relative to oseltamivir throughout the 2019-to-2025 period, consistent with its use as a second-line treatment. Zanamivir consumption peaked in January 2019 at approximately 5,800 DDDs (Figure 3.31).
Prescriptions of influenza antivirals in primary care settings through FP10 prescriptions were permitted only after notification from the Chief Medical Officer and Chief Pharmaceutical Officer that influenza was circulating in the community. Prior to September 2025, prescribing was generally permitted from autumn until May of the following year. Regulations were amended in September 2025 to allow prescribing of influenza antivirals throughout the year.
Recent evidence may have implications for future influenza antiviral prescribing. Preliminary REMAP-CAP Influenza Antiviral Domain results (2026 preprint, note peer-reviewed) (27) suggest that, among critically ill patients with influenza, oseltamivir met the trial’s predefined criterion for inferiority. The study reported a 98-to-99% probability that 90-day mortality was higher among patients receiving oseltamivir than among those receiving standard care (27).
Figure 3.30. Monthly Defined daily doses of oseltamivir and estimated influenza-like illness consultation rates in primary care settings, January 2019 to December 2025
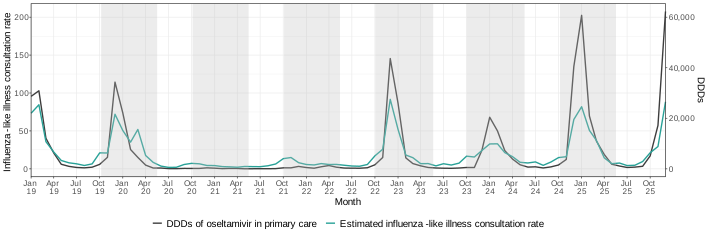
Note: consultation rate is estimated per 100,000 population of England.
Figure 3.31. Defined daily doses of oseltamivir and zanamivir in secondary care and influenza hospital admissions, 1 January 2019 to 31 December 2025, aggregated over each month
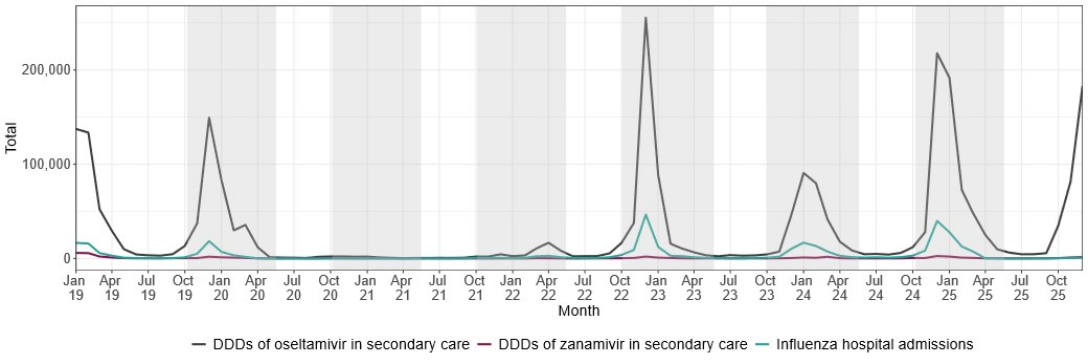
Note: shading indicates the influenza seasons analysed.
SARS-CoV-2: COVID-19 therapeutics
Four direct-acting antiviral treatments were used against SARS-CoV-2 (COVID-19) in England from 2020 to 2025 (28). Between 2024 and 2025, the total consumption of these agents decreased by 59.2%, from 135,237 to 55,144 DDDs. This reduction corresponds with a decline in the number of reported COVID-19 cases during the same period, from 128,105 in 2024 to 66,692 in 2025.
Figure 3.32 displays consumption rates (across primary and secondary care), expressed as DDDs per 1,000 COVID-19 cases, in England. As denominator data was unavailable for individuals who were eligible and were offered and accepted each treatment, the number of COVID-19 cases was used. Denominator data will be presented in the ESPAUR 2026-2027 report. Nirmatrelvir plus ritonavir continue to be most frequently dispensed therapeutic agent across both primary and secondary care settings, with the rate in December 2025 at 353 DDDs per 1,000 reported COVID-19 cases. This was followed by remdesivir at 338 DDDs per 1,000 cases. Molnupiravir and sotrovimab were administered exclusively in secondary care settings, with usage rates of 55 and 2 DDDs per 1,000 cases, respectively.
Consumption was higher in 2025 compared to 2020 due to the decrease in COVID-19 cases diagnosed and recorded (and hence the denominator) (Figure 3.31).
Figure 3.32. Total consumption of COVID-19 therapeutics, expressed as DDDs per 1,000 COVID-19 cases, England, 2020 to 2025
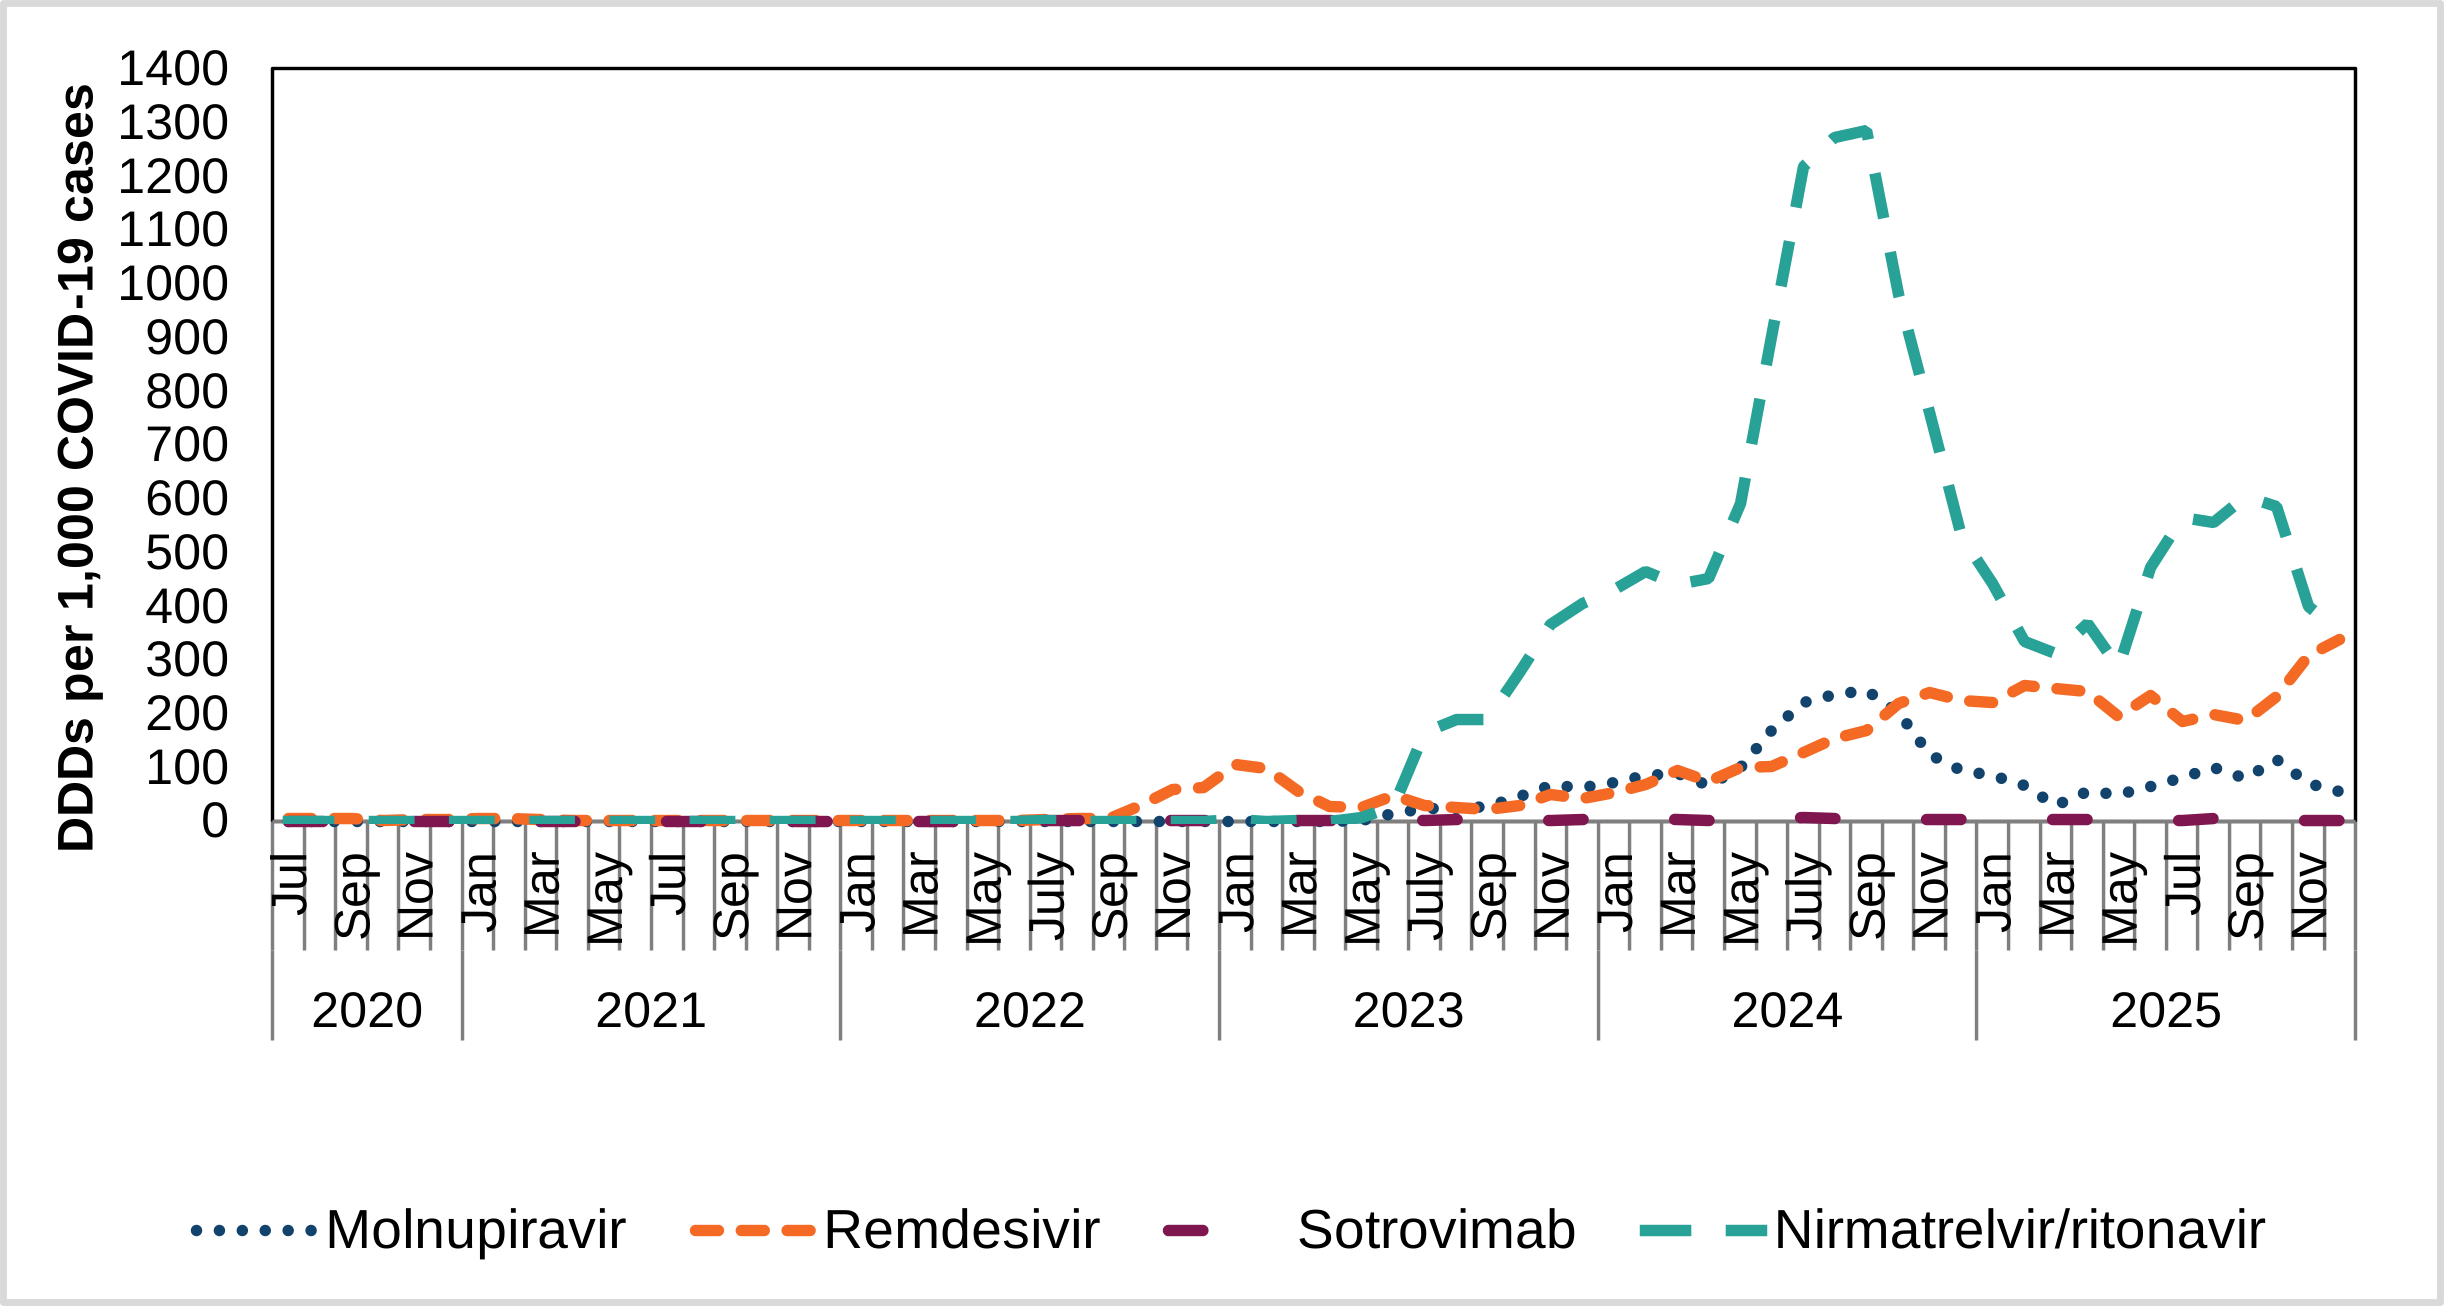
Hepatitis B virus: Antiviral NHS prescribing for the treatment of HBV
Entecavir and tenofovir disoproxil are the primary recommended options for people in whom antiviral treatment is indicated. Surveillance of antiviral treatment coverage of individuals living with diagnosed chronic hepatitis B is required to monitor equity in access and outcome from treatments. The main aim of current treatment strategies is to prevent chronic liver disease progression through endpoints of long-term suppression of HBV replication with HBsAg loss being the optimal endpoint.
As treatment eligibility has historically been complex and can change over a person’s life, with many people being monitored but not on treatment for years, attrition of retention in care can occur. Simplified treatment guidelines may improve patient engagement, require less specialist follow up, and expedite achievement of public health programme goals. European Association for the Study of the Liver (EASL) and WHO have recently simplified guidance on treatment eligibility to (i) those with HBV DNA >2,000 IU/ml, elevated alanine aminotransferase (ALT) and/or at least moderate histological lesions, and (ii) all cirrhotic patients with detectable HBV DNA.
Although a national comprehensive treatment surveillance system has not yet been established, IQVIA collects data on antiviral prescriptions dispensed in secondary care pharmacies in England. Volume data (number of packs) was extracted from IQVIA for entecavir (0.5mg or 1mg once daily) and for tenofovir disoproxil (245mg once daily) between 2019 and 2025. The number of doses was estimated by number of packs provided by IQVIA. Tenofovir, in combination with other antiretroviral drugs, is also a treatment for HIV and is recorded as a combination treatment in Rx-Info. We identified any single use of tenofovir disoproxil as indicating HBV treatment.
The average number of prescriptions (which equates to packs) per year between 2019 and 2025 was 93,621 units for entecavir and 130,854 units for tenofovir disoproxil. Numbers of prescriptions increased between 2019 and 2025 from 55,746 to 156,721 units for entecavir and from 116,746 to 160,026 units for tenofovir disoproxil. Between 2019 and 2024, an estimated annual average of 7,695 individuals were treated with entecavir and 10,755 individuals treated with tenofovir disoproxil (Figure 3.33). Between 2019 and 2025 the estimated number of individuals treated with entecavir increased from 4,582 to 12,881 and from 9,596 to 13,153 for tenofovir disoproxil. For London, an estimated annual average of 3,763 individuals were treated with entecavir and 4,765 with tenofovir disoproxil. Outside London the estimated numbers were 3,932 and 5,990 individuals, respectively.
Refer to the Hepatitis B annual report for further information.
Figure 3.33. Estimated number of individuals treated with a) entecavir and b) tenofovir disproxil in secondary care between 2019 and 2024, by treatment location
a)
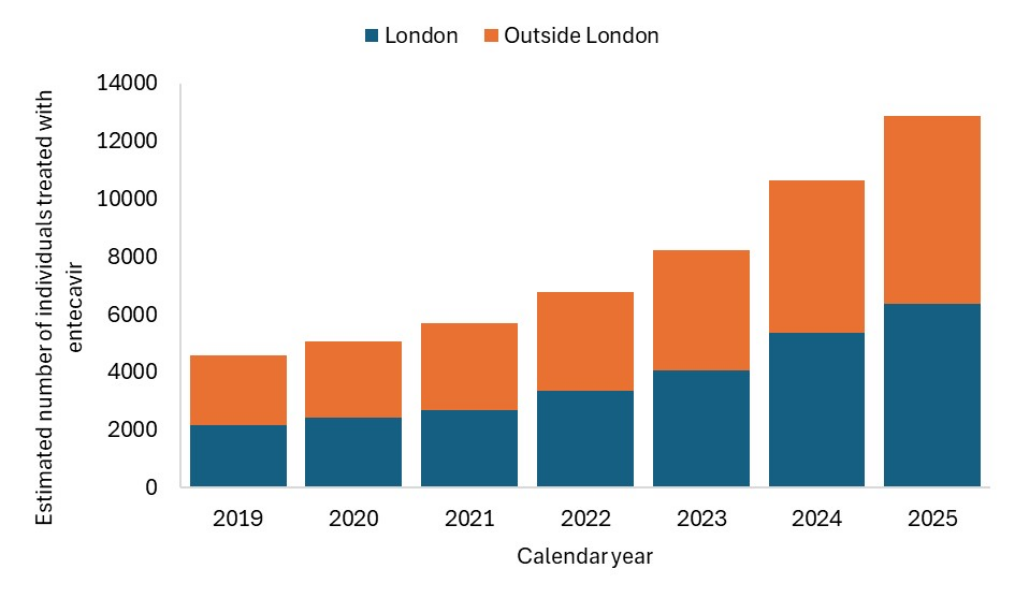
b)
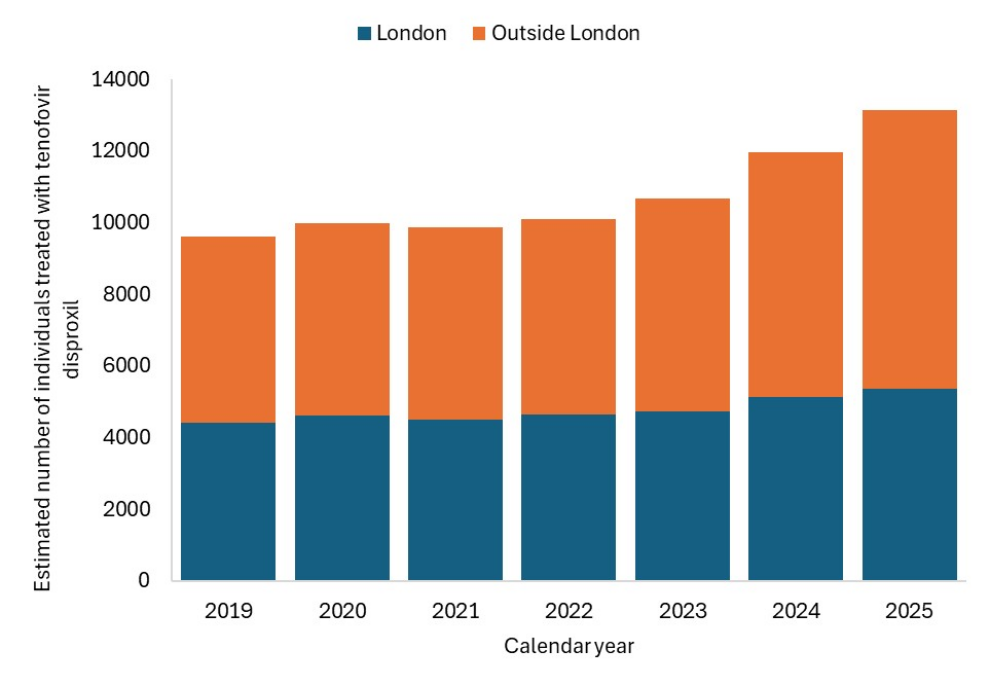
Hepatitis C virus: Direct-acting antiviral (DAA) NHS therapies for the treatment of hepatitis C
Highly effective and tolerable direct-acting antiviral (DAA) therapies were introduced in 2011 to 2012, which offered an all-oral, interferon-free based regimen, with a shorter treatment duration, which were more effective and better tolerated for those living with chronic hepatitis C. Sofosbuvir, a second-generation DAA, was released in most Western countries in 2013 and 2014 (including the US, 28 European member states, Australia, Canada and New Zealand), followed by approvals of other second-generation DAAs including Simepravir, and the introduction of additional IFN-free regimens. In 2015, the NHS funded DAA therapies for individuals with severe liver disease, with restrictions on disease stage lifted in 2017 to anyone with viraemic HCV infection eligible for treatment.
Data on DAA prescribing is collated by UKHSA from NHSE’s Blueteq system, a web-based software system for the approval and management of high-cost medicines. Prescriptions were counted using the Blueteq number, a unique identifier per prescription, and can represent treatment for a new case of hepatitis C, an individual who requires re-prescribing following treatment failure or treatment interruption (for example, due to non-completion of treatment or loss of medication), or an individual who may have been previously treated and subsequently experienced reinfection.
The average number of prescriptions (Blueteq submissions) per year between 2019 and 2025 was 9,613. Between 2019 and 2026, 6 main different treatment regimens were prescribed. The highest average number of prescriptions per year was for Sofosbuvir/Velpatasvir (SOF/VEL) with 5,533, followed by Elbasvir/Grazoprevir (EBR/GZR) with an average of 2,486 prescriptions per year, and Glecaprevir/Pibrentasvir (GLE/PIB) with 1,882 per year.
SOF/Ledipasvir (LDV) had an average of 1060 prescriptions per year between 2019 and 2025, SOF/VEL/Voxilaprevir (VOX) had on average 255 prescriptions, and SOF/LDV + ribavirin (RBV) had on average 80 prescriptions (Figure 3.34). Whilst for most of the treatment regimens the number of prescriptions per year have remained consistent, a decrease was observed in SOF/LDV from 2,554 prescriptions in 2019 to 397 prescriptions in 2025.
Further information on hepatitis C treatment is available in the Hepatitis C in England 2025 report (Hepatitis C in England 2025).
Figure 3.34. Estimated number of prescriptions reported to blueteq by treatment regime between 2019 and 2025
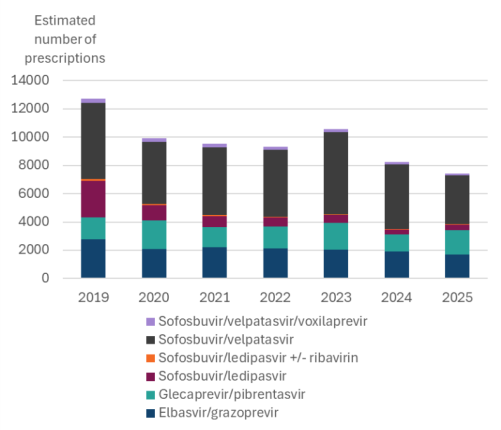
Antiparasitic consumption
Assessment of the consumption of antiparasitic drugs is included below and includes antimalarial and anthelmintic drugs. The addition of antiparasitic use within the independent sector is a new addition to the ESPAUR report this year. Consumption data is provided for the antiparasitics used in England, for which DDDs are available according to the WHO. Data is presented as DIDs, combined for NHS primary and secondary care, and across independent sector settings, further details of which are provided in the annexe (29).
Antiparasitic consumption, including antimalarials and anthelmintics, in the NHS totalled 0.47 DID in 2025, this comprises 2.5% of antimicrobial usage presented in this report (infographics).
Antimalarial NHS consumption
The UKHSA has reported a sustained high level of travel-acquired malaria, with 1,629 imported cases diagnosed in 2025, most of which were preventable (30). The case load is linked to an increase in overseas travel following removal of COVID-19 pandemic restrictions, combined with a global resurgence of malaria cases beyond pre-pandemic levels. The UKHSA Malaria Expert Advisory Group (previously known as the Advisory Committee on Malaria Prevention) publishes annual updates of the Malaria prevention guidelines for travellers from the UK.
Antimalarial consumption is reported for the treatment and prophylaxis against malaria (Figure 3.35).
Consumption of atovaquone-proguanil (A-P, commonly known as Malarone®) within the NHS increased between 2019 and 2025 (from 0.005 to 0.011 DID, +145.6%). A-P is used in both the prevention and treatment of malaria, but as Artemisinin Combination Therapies (ACTs) are the first line for malaria treatment in the UK, most prescriptions for A-P are likely to be for chemoprophylaxis, especially in the community, as malaria is predominantly treated in secondary care. A-P is typically prescribed privately, since the NHS does not fund its cost for chemoprophylaxis. The sustained increase from 2019 onwards likely reflects recovery and continued growth in international travel following the COVID-19 pandemic and highlights the strong relationship between international travel and demand for malaria chemoprophylaxis.
Quinine is the most frequently used antimalarial drug in the NHS (0.431 DID in 2025). Consumption of quinine has seen a steady decline over the past 7 years (37.2% decrease in DIDs between 2019 and 2025) in contrast to the sustained level of travel-acquired malaria cases as reported in the Malaria Reference Laboratory. This is likely to be due to the change from quinine to ACT as first line antimalarial therapy in the UK. Not all quinine prescribing can be attributed to malaria treatment and may include prescribing for other conditions, although the only indication for quinine apart from malaria listed in the British National Formulary is nocturnal leg cramps.
Whilst some antimalarial drugs are also used to treat other conditions, or as chemoprophylaxis, ACT is only used in the treatment of malaria. Oral ACT is the first line treatment for P. falciparum, with severe or complicated cases receiving intravenous artesunate prior to oral ACT. Consumption data indicates that artemisinin compound prescriptions have remained stable over the 7 years to 2025, (0.0003 DIDs NHS use), except for an observed decrease to 0.0001 DIDs, coinciding with the COVID-19 pandemic in 2020. The relatively low and stable levels of ACT prescribing are consistent with malaria case numbers, which have fluctuated around a stable mean and are gradually returning to pre-pandemic levels (31).
Figure 3.35. Antimalarial use in the NHS, DDDs per 1,000 inhabitants per day, England, 2019 to 2025 [note 1] [note 2] [note 3] [note 4]
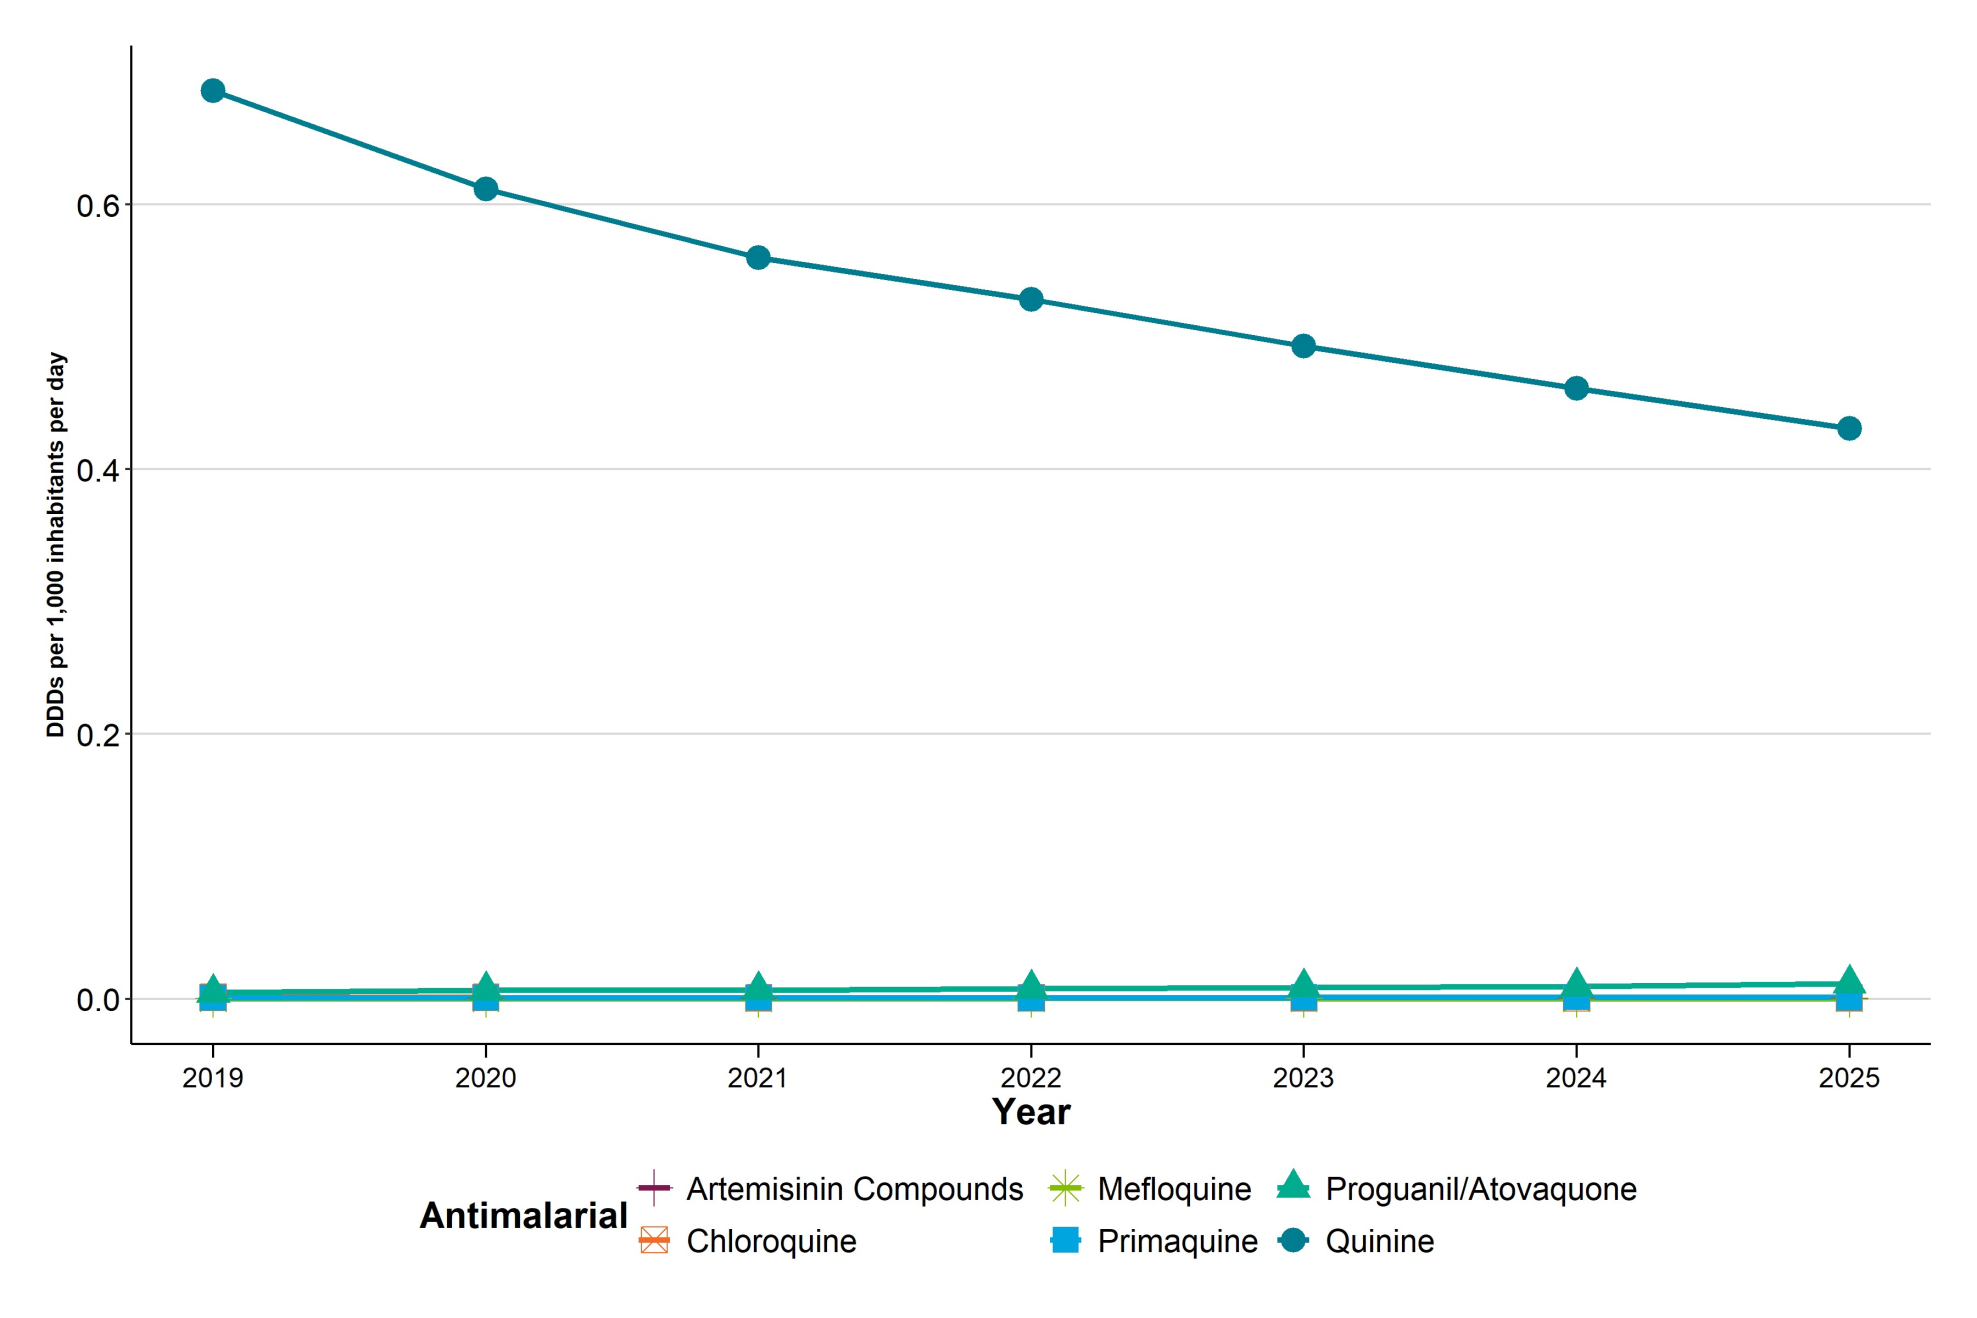
Note 1: Quinine includes: quinine bisulfate, quinine dihydrochloride, quinine sulfate.
Note 2: Proguanil/atovaquone includes: proguanil (proguanil as a single agent was discontinued in the UK in 2023), proguanil/atovaquone, atovaquone. (Atovaquone alongside use as antimalarial may also be used for treatment of Pneumocystis pneumonia).
Note 3: Chloroquine includes: chloroquine chloroquine/proguanil and chloroquine phosphate.
Note 4: Artemisinin compounds includes: artemether/lumefantrine, artesunate, piperaquine phosphate/artenimol.
Anthelmintic NHS consumption
Consumption of anthelmintics can be seen in Figure 3.36. The data indicates that ivermectin use has been steadily increasing in the NHS sector since 2019, with the largest proportional increases seen between 2023 and 2024 (from 0.0007 to 0.0025, +260%), followed by a further substantial increase to 0.0068 DID in 2025. Ivermectin is indicated for use in travel-associated helminth infections such as strongyloidiasis, as well as oral treatment of ectoparasitic infections, including pediculosis (lice infestation) and scabies (mite infestation). A national increase in scabies cases was reported in 2024, with observed incidence rates above the 5-year average in 2024 (32). National shortages of the 2 main topical treatment options (permethrin and malathion) may have resulted in an increase in consumption of systemic oral ivermectin, which was licensed for scabies by the MHRA in 2023. Oral ivermectin subsequently became available in the UK for scabies in March 2024, and the NICE guidelines were updated accordingly (33, 34), which likely contributed to the continued rise in prescribing observed in 2025.
Figure 3.36. Anthelmintic use in the NHS, DDDs per 1,000 inhabitants per day, England, 2019 to 2025
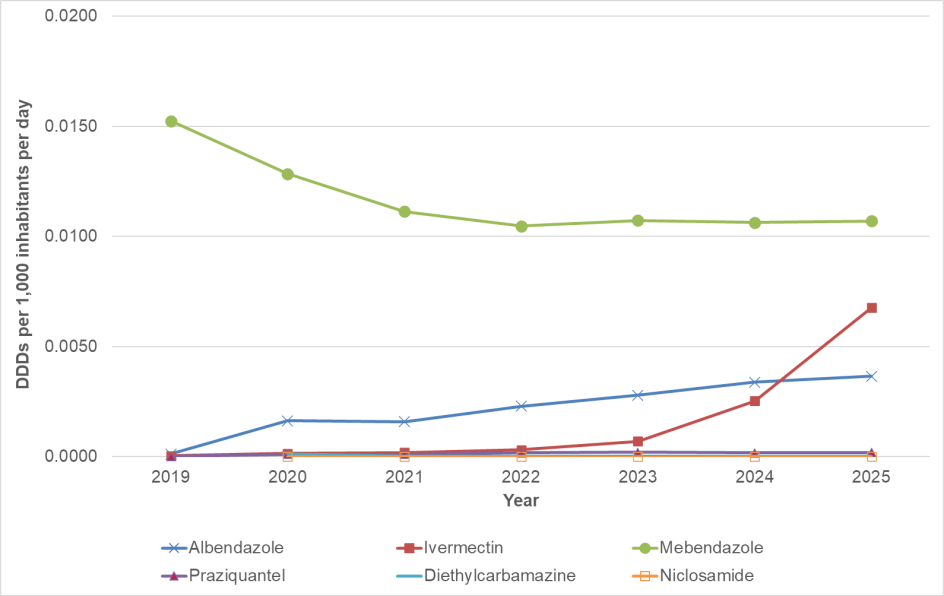
Mebendazole consistently remains one of the most frequently used anthelmintic drugs in England (0.0107 DID in 2025). The rate of mebendazole consumption within the NHS decreased between 2019 and 2025 (−0.0045 DIDs, −29.8%). Mebendazole is indicated for the treatment of several helminth infections, including threadworm.
Mebendazole is available as an over the counter (OTC) medication (following a public consultation in 2018), without prescription, for certain indications, such as threadworm (Enterobius vermicularis), the most common parasitic worm infection in the UK, particularly in children aged between 4 to 11 years old (NICE, 2023). Whilst the data includes community pharmacy consumption, it does not capture anthelmintics supplied OTC, therefore the data is therefore likely to underestimate mebendazole consumption. Mebendazole is also indicated for the treatment of whipworm (trichuriasis), hookworm and roundworm (ascariasis) and, whilst these infections are not endemic to England, previous reports by the UKHSA suggest that helminth infections may affect up to 20% of migrants from endemic countries (OHID, 2021). Unfortunately, as with the antimalarial data, it is not possible to distinguish prescribing by indication in the presented anthelmintic consumption data.
Consumption of albendazole within the NHS was relatively stable between 2019 and 2021 and has since increased steadily, reaching 0.0036 DID in 2025 (more than a 2-fold increase since 2021). Some of this increase may represent increasing recognition and treatment of echinococcosis. Praziquantel consumption, indicated for the travel-associated helminth infection schistosomiasis, increased slightly from 2019 to 2025 (from 0.0001 to 0.0002 DIDs), but continues to contribute only a small proportion of the overall anthelmintic DIDs.
Current UK collaboration (4 nations) and participation in international surveillance
Consumption data for England continues to be monitored and collated alongside those of the devolved administrations (Northern Ireland, Scotland, and Wales) to understand the UK-wide picture of total primary and secondary care consumption and progress made towards the UK AMR 5-year NAP for antimicrobial reduction targets (35).
England, in collaboration with the other UK administrations, submits and validates antibacterial and antifungal consumption data to the WHO Global AMR and Use Surveillance System (GLASS) antimicrobial consumption module (GLASS-AMC). Recent submissions have been for England and Scotland data, for the years covering 2016 to 2024.
International collaborations
We plan to work with the European Centre for Disease Prevention and Control (ECDC) under the UKHSA-ECDC Joint Action Plan on aligning work on the next round of the national point prevalence survey (PPS) on healthcare-associated infections (HCAIs), antimicrobial use (AMU) and antimicrobial stewardship (AMS) in England in 2028. We will also build on previous collaborative work between the UKHSA and the Transatlantic Taskforce on Antimicrobial Resistance (TATFAR) and continue to develop international relations through our Global AMR Surveillance workstream.
References
1. Office for National Statistics. ‘Population and household estimates, England and Wales: Census 2021, unrounded data’ 2022
2. Health London Partnership. ‘Coordinated, consistent and clear urgent and emergency care – Implementing the urgent and emergency care vision in London’ 2017
3. UK Health Security Agency (UKHSA). ‘Health inequalities in health protection report 2025’ 2025
4. Thomson K and others. ‘An examination of trends in antibiotic prescribing in primary care and the association with area-level deprivation in England’ BMC Public Health 2020: volume 20, issue 1, page 1,148
5. McCloskey AP and others. ‘Antibiotic prescribing trends in primary care 2014-2022’ Research in Social and Administrative Pharmacy 2023: volume 19, issue 8, pages 1,193 to 1,201
6. National Institute for Health and Care Excellence (NICE). ‘Urinary tract infection (lower): Antimicrobial prescribing’ 2018
7. Lodise TP and others. ‘Review of the In Vitro Microbiological Activity of Mecillinam Against Common Uropathogens in Uncomplicated Urinary Tract Infection: Focus on Resistant Pathogens’ Open Forum Infectious Diseases 2024: volume 11, issue 6, page ofae296
8. Health Research Authority. ‘IPAP‑UTI – Improving primary care antibiotic prescribing to reduce antibiotic resistant urine infections: the IPAP‑UTI series of cluster randomised controlled trials’ 2024
9. Department of Health and Social Care (DHSC). ‘C. difficile infection counts and 12-month rolling rates of all cases, by reporting acute trust and month’ 2024
10. NICE. ‘Pneumonia (community-acquired): antimicrobial prescribing’ 2019
11. NICE. ‘Impetigo: antimicrobial prescribing’ 2020
12. European Centre for Disease Prevention and Control. ‘Antimicrobial consumption in the EU/EEA (ESAC-Net) – Annual Epidemiological Report for 2023’ 2023
13. UKHSA. ‘Sexually transmitted infections quarterly report, England, June 2026’ 2026
14. UKHSA. ‘Monitoring and evaluation plan of doxycycline post-exposure prophylaxis (doxyPEP)’ 2026
15. NICE. ‘Urinary tract infection (recurrent): Antimicrobial prescribing’ 2018
16. NHS. ‘Colds, coughs and ear infections in children’ 2021
17. NICE. ‘British National Formulary for Children: Treatment Summary: Acne’ 2024
18. NICE. ‘British National Formulary for Children: Tetracycline’ 2024
19. NHS England. ‘Landmark moment as NHS kicks off first ever RSV jab rollout’ 2024
20. Public Health Scotland. ‘UK‑wide report highlights success of Scotland’s RSV vaccination programme’ 2025
21. Bell A and others. ‘Antibiotic prescribing and use in United Kingdom general practices in socio-economically deprived areas: a critical interpretive synthesis’ Journal of Health Equity 2026: volume 3, issue 1, page 2606722
22. Scottish Dental Clinical Effectiveness Programme. ‘First‑line antibiotics (Dental abscess)’ 2025
23. Palmer NE. ‘Antimicrobial Prescribing in Dentistry: Good Practice Guidelines (third edition)’ 2020
24. NICE. ‘Clostridioides difficile infection: antimicrobial prescribing’ 2021
25. Baltas I and others. ‘Resistance profiles of carbapenemase-producing Enterobacterales in a large centre in England: are we already losing cefiderocol? – right to reply – authors’ response’ Journal of Antimicrobial Chemotherapy 2025: volume 80, issue 5, pages 1,464 to 1,465
26. Baltas I and others. ‘Carbapenem-resistant Enterobacterales across the UK: A nationwide study of carbapenemase testing and novel antimicrobial activity’ International Journal of Antimicrobial Agents 2026: volume 67, issue 10, page 107,898
27. Murthy S, Green C and Berry L. ‘Oseltamivir for Critically Ill Patients with Influenza: A Randomised Trial’ 2026
28. Falola A and others. ‘COVID-19 Therapeutics Use by Social Deprivation Index in England, July 2020–April 2023’ COVID 2024: volume 4, issue 5, pages 645 to 651
29. UKHSA. ‘Hepatitis C in England 2024’ 2024
30. New data show a rise in travel-acquired malaria cases [press release] 2024
31. UKHSA. ‘Malaria imported into the UK: 2023’ 2024
32. Royal College of General Practitioners (RCGP). ‘College Chair comments on rising rates of scabies cases seen in general practice’ 2024
33. UKHSA. ‘UKHSA guidelines for the management of scabies cases and outbreaks in communal residential settings’ 2025
34. NICE. ‘How up-to-date is this topic? – Scabies: changes’ 2025
35. DHSC. ‘Confronting antimicrobial resistance 2024 to 2029’ 2024