Employment advisers in improving access to psychological therapies: evaluation of the impact of employment adviser support in Steps2Wellbeing IAPT (Southampton and Dorset)
Updated 5 May 2022

© Crown copyright 2022
This publication is licensed under the terms of the Open Government Licence v3.0 except where otherwise stated. To view this licence, visit nationalarchives.gov.uk/doc/open-government-licence/version/3 or write to the Information Policy Team, The National Archives, Kew, London TW9 4DU, or email: psi@nationalarchives.gov.uk.
Where we have identified any third party copyright information you will need to obtain permission from the copyright holders concerned.
This publication is available at https://www.gov.uk/government/publications/employment-advisers-in-improving-access-to-psychological-therapies/employment-advisers-in-improving-access-to-psychological-therapies-evaluation-of-the-impact-of-employment-adviser-support-in-steps2wellbeing-iapt-so
DWP research report no. 1014
A report of research carried out by IFF and Bryson Purdon Social Research LLP on behalf of the Work and Health Unit.
Crown copyright 2022.
You may re-use this information (not including logos) free of charge in any format or medium, under the terms of the Open Government Licence
Or write to:
Information Policy Team
The National Archives
Kew
London
TW9 4DU
Email: psi@nationalarchives.gov.uk
This document/publication is also available on our GOV.UK website
If you would like to know more about DWP research, email: socialresearch@dwp.gov.uk
First published April 2022.
ISBN 978-1-78659-403-7
Views expressed in this report are not necessarily those of the Department for Work and Pensions or any other government department.
Executive summary
This report is part of a suite of reports published as part of the evaluation of the Employment Advisers (EAs) in Improving Access to Psychological Therapies (IAPT) initiative, funded by the cross-government Work and Health Unit (WHU), jointly sponsored by the Department for Work and Pensions (DWP) and the Department of Health and Social Care (DHSC). It uses data standardly collected by the Dorset and Southampton Steps2Wellbeing IAPT service, linked with data on benefit receipt held by the DWP. The purpose of this report is to measure the impact of seeing an EA as part of the IAPT service on clients’ mental health; their daily functioning; and their employment and benefit receipt.
Using this data, the impact of seeing an EA as part of IAPT has been measured by comparing the outcomes of IAPT clients who saw an EA against those of a matched comparison group of IAPT clients who did not. The impact of seeing an EA is reported separately for three groups, based on their employment status at the start of their IAPT therapy: (a) clients who reported they were working at their assessment, but not in receipt of Statutory Sick Pay (SSP), referred to as ‘working’; (b) clients who reported being off work on SSP, referred to as ‘off work sick’; and (c) clients who were not working (e.g. unemployed, long-term sick or disabled, homemakers and carers). The impact on clients’ mental health and daily functioning was measured at the final therapy session. Employment status was measured at the client’s final appointment, which was often the final therapy session but could have been the final EA appointment if employment support continued post therapy. This is referred to in the report as the ‘final session’. Benefit receipt was measured 12 and 18 months after the start of therapy.
The analysis shows that, for those out of work, EAs supported a return to work and their involvement was associated with improved mental health. In contrast for those in work, seeing an EA was associated with increased movement out of work, while for those off sick there was no employment impact. Across all cohorts there is no evidence of detrimental mental health outcomes, with some evidence of statistically significant positive outcomes. In more detail, the key findings are:
- Take up of EA support was highest among IAPT clients who were off work sick at the point they entered the service. A third (36 per cent) of those off work sick took up EA support compared to 20 per cent of those who were unemployed, 13 per cent of those who were working and nine per cent of those who were longterm sick or disabled. The strongest predictor of take up was the client’s perception of the extent to which their mental health issues impaired their ability to work.
- Among IAPT clients who were working when they entered the service, seeing an EA reduced the likelihood of them working by their final session and increased the likelihood that they perceived their issues as affecting their ability to work at the final therapy appointment. They were also more likely to be in receipt of SSP at this point.
* Evidence from the wider evaluation suggests that working clients who accepted EA support were those who more often perceived their mental health issues to be impairing their ability work and were more likely to be having difficulties in their current job. Thus, having left their current employment by the end of therapy could have been a positive outcome for many, if it resulted in improvements in their mental health or them spending time looking for alternative, more suitable, work. * Among those working when they entered IAPT, there is no significant evidence that seeing an EA had a positive impact on the mental health. However, the fact that there is no evidence of it having a negative effect may be an indication that those moving out of work did so voluntarily. Wider evidence suggests that involuntarily moving out of employment is linked with negative impacts on mental health. - Clients who were off work sick who had seen an EA were also more likely than their matched comparison group to perceive their issues as affecting their ability to work at the final therapy session (whilst, again, not affecting their daily functioning overall), and less likely to be working. However, there is potential evidence of EA support keeping IAPT clients in or close to the labour market: the reduced propensity to be working was matched by an increased propensity to be unemployed, rather than long-term sick or disabled. There is also some evidence to suggest that seeing an EA had a positive impact on reducing levels of anxiety and depression among this group by the final therapy session.
- For clients who were out of work when they entered IAPT, seeing an EA had a positive impact, both on their mental health and on the likelihood of them entering the labour market compared to their matched comparison group. Seeing an EA also significantly reduced the likelihood of them perceiving that their issues affected their ability to work by the final therapy appointment (while not having a significant impact on their daily functioning overall). Moreover, the evidence is that seeing an EA increased the propensity for these clients to be actively engaged in the labour market even if they were not working: they were more likely than their matched comparison group to report being unemployed – and conversely less likely to report being long-term sick or disabled – at the final session. For those who remain unemployed, those who had seen an EA were more likely than those who had not to be in receipt of unemployment benefits,[footnote 1] Which may reflect EAs giving advice and encouragement to clients to claim benefits to which they were entitled.
Acknowledgements
We would like to thank Lyndon Clews, Laura Parkhouse, David Johnson, Owen Davis, Navneet Dalton, Mark Langdon, Anna Saunders and Chris Sutton in the Work Health Unit’s (WHU’s) Employment Advisers in Improving Access to Psychological Therapies (EA in IAPT) Evaluation Team for their guidance and contributions throughout the project, and to Chris Sutton and Anna Saunders who designed the evaluation.
We would also like to thank:
Joel Hooper, Service Manager, and Amy Manning, Data Lead, at Steps2Wellbeing for providing us with the IAPT data for this report, as well as their input and advice throughout the analysis and reporting.
Dr Matthew Franklin and Dr Monica Hernandez of the School of Health and Related Research at the University of Sheffield for their work mapping the PHQ-9 and GAD-7 to a preference-based measure to estimate Quality Adjusted Life Years (QALYs).
David Hurst and Ravinder Boparai for their support in the data transfer process, as well as Hayley Moore Purvis for providing guidance and knowledge in linking data and Mike Daly for his continuous support throughout this evaluation.
Authors and researchers
Susan Purdon and Caroline Bryson of Bryson Purdon Social Research LLP led the analysis and reporting for this report.
IFF Research was the lead contractor for the evaluation, with Christabel Downing, Senior Research Manager, part of the team responsible for the overall management of the study.
Glossary of terms
| Term | Definition |
|---|---|
| Caseness | A person is described as having suggested case level anxiety or depression if their scores on the Generalised Anxiety Disorder (GAD-7) and Patient Health Questionnaire (PHQ-9) scales suggests they would exceed the ‘caseness thresholds’ used by Improved Access to Psychological Therapies. Diagnosis of anxiety and depression respectively would be based on a clinical interview and would take account of additional evidence, to which the GAD-7 and PHQ-9 scores may contribute. |
| Clinical Commissioning Group (CCG) | NHS organisations in England responsible for the planning and commissioning of health care services for their local areas. |
| Cognitive Behavioural Therapy (CBT) | A talking therapy commonly used to treat anxiety and depression. |
| Disability Living Allowance (DLA) | A non-means tested benefit to help with the extra costs incurred by having a long-term physical or mental health condition or disability. For working age adults, this is being replaced by the Personal Independence Payment (PIP). |
| Employed | Clients who report they were working at their assessment and not in receipt of Statutory Sick Pay (SSP). |
| Employed off sick | Clients who reported being off work and receiving SSP. |
| Employment Adviser (EA) | Person providing a range of support and advice on issues related to employment to clients who are in and out of work. |
| Employment and Support Allowance (ESA) | A benefit for people who have an illness, health condition or disability that affects how much they can work. ESA offers financial support if people are unable to work, and personalised help so that people can work if they are able to. |
| Improving Access to Psychological Therapies (IAPT) | The IAPT programme that began in 2008 and delivers services that provide evidence-based psychological therapies to people with anxiety disorders and depression. |
| Incapacity Benefit (IB) | A benefit for those who have an illness, health condition or disability that affects how much they can work. It is being replaced by Employment and Support Allowance (ESA). |
| Income Support (IS) | An income-related benefit for people who have no income or are on a low income, and who cannot actively seek work. It is mainly for people who cannot seek work due to childcare responsibilities. |
| Individual Placement and Support (IPS) | An employment support service integrated within community mental health teams for people who experience severe mental health conditions. It provides intensive, individual support to people to help them to move towards and into or stay in employment. |
| Jobcentre Plus (JCP) | Government-funded employment service that aims to help people of working age find employment. JCPs provide resources to enable job searchers to find work, offer information about training opportunities, and administer claims for benefits. |
| Jobseeker’s Allowance (JSA) | An unemployment benefit for people who are actively looking for work. |
| Mental Health Care cluster | Care clusters are a framework for planning and organising mental health services, and the care and support that can be provided for individuals. |
| Out of work | Clients who were not working (e.g. unemployed or long-term sick, disabled, homemakers and carers). |
| Personal Independence Payment (PIP) | A non-means tested benefit to help with the extra costs incurred by having a long-term physical or mental health condition or disability. |
| Propensity score matching | A statistical method for generating a matched comparison group for an intervention. It is useful in instances where data on a potential comparison group is available, but where there are observable profile or baseline differences between the intervention group and the comparison group. Propensity score matching generates weights for the comparison group which, when applied, reduce any such differences. |
| ReQoL-UI | A brief patient-reported outcome measures focusing on the process of recovery for users of mental health services, for which there is a Utility Index (ReQoLUI) to enable such measures to be used when estimating quality-adjusted life years (QALYs). |
| Quality Adjusted Life Year (QALY) | A measure of the state of health or a person in which the benefits, in terms of length of life, are adjusted to reflect the quality of life. |
| Senior Employment Adviser (SEA) | Manage and support a team of EAs in offering a support service to individuals with common mental health problems to gain, return to or retain employment. |
| Standard deviation | A statistical measure of how much or how little all values for a group vary from the overall mean for the group. A low standard deviation indicates that the values tend to be close to the mean, while a high standard deviation indicates that the values are spread out over a wider range. |
| Statistical significance | A statistic derived from a study, such as the difference between two groups, is said to be statistically significant if the size of that statistic has only a low probability of arising by chance alone. The probability of a statistic of that size occurring by chance alone is termed the ‘p-value’. By convention, if the p-value is less than 0.05 then it is stated that the statistic is ‘significant’. In this report patterns of results across outcomes are commented on even if some do not reach significance Statutory Sick Pay (SSP) – The minimum amount an employer must pay employees who are too ill to work. |
| Universal Credit (UC) | An in and out of work benefit designed to support people with their living costs. Most new claims by people with a health condition or disability are now made to UC. |
| Wave one | Refers to randomly-allocated CCGs where there was an increase in the number of Employment Advisers embedded in IAPT services from March 2018. |
| Wave two | Refers to randomly-allocated CCGs where there was an increase in the number of Employment Advisers embedded in IAPT services from March 2019. |
| Work and Health Unit (WHU) | A joint unit between the Department for Work and Pensions and Department of Health and Social Care. It leads on the Government’s strategy to support working-age disabled people or those with long-term conditions, to access and retain good quality employment. |
Summary
Introduction
This report is part of a suite of reports published as part of the evaluation of the Employment Advisers (EAs) in Improving Access to Psychological Therapies (IAPT) initiative. It uses data standardly collected by the Steps2Wellbeing IAPT service, which provides IAPT for Dorset and Southampton Clinical Commissioning Groups[footnote 2] (CCGs), linked with data on benefit receipt held by the Department for Work and Pensions (DWP). It measures the impact of seeing an EA as part of the IAPT service on clients’ mental health; their daily functioning; their employment and benefit receipt.
The EAs in IAPT initiative is funded by the Work and Health Unit (WHU), the cross-government unit jointly sponsored by the Department for Work and Pensions (DWP) and the Department of Health and Social Care (DHSC). IAPT is an NHS England programme that provides evidence based psychological treatments for people with common mental health problems, principally anxiety and depression. EAs in IAPT is a combined service that brings together employment advice and support with IAPT provision, to enable IAPT clients to stay in, return to, or take up work and improve their mental health. Both IAPT and EAs in IAPT are voluntary interventions.
EAs were first introduced into IAPT services in 2008. Findings from a pilot report suggested that they may be effective in supporting an individual back to work (DWP, 2013).[footnote 3] The WHU later provided funding for approximately 350 additional EAs and Senior Employment Advisers (SEAs) across IAPT services in 40 per cent of CCGs, split into two waves. IAPT services in CCGs involved in the first wave recruited their EAs so that they were ready to see clients from 1st March 2018, whilst services in CCGs that came on board in wave 2 received investment later so that their EAs were in place to start to see clients on 1st March 2019.
In 2017, the WHU commissioned a process and impact evaluation of this provision, led by IFF Research and conducted in partnership with ICF, Bryson Purdon Social Research (BPSR) and the School of Health and Related Research (ScHARR) at the University of Sheffield. The aim of the evaluation was to understand how EA support was implemented within IAPT, and to measure its impact on those who took it up.
This report adds to the evaluation evidence, by providing an assessment of the impact of EA support within IAPT on clients’ employment and benefit status and mental health outcomes using standardised assessment scales. In particular, the Steps2Wellbeing IAPT data includes information on clients’ perceptions on the extent to which their issues impaired their ability to work when they entered the IAPT service, as a single item included within a wider scale measuring impaired functioning. Having this data with which to match EA clients and other IAPT clients enabled a more robust measure of the impact of EA support, in a way that was not possible with the survey data or previous pilot evaluation[footnote 4] where this data was not available.
Methodology
The impact of receiving combined employment support and therapy as part of Steps2Wellbeing IAPT service has been measured by comparing the outcomes of IAPT clients who saw an EA against those of a matched comparison group[footnote 5] of IAPT clients who did not, focusing on:
- Clients’ mental health, and the extent to which health-related issues impaired their daily functioning in general and their ability to work in particular;
- Clients’ employment status and benefit receipt.
The impact on clients’ mental health and daily functioning are measured at the final therapy session. Employment status and receipt of Statutory Sick Pay (SSP) is measured at the client’s final appointment, which was often the final therapy session but could be from a final post-therapy EA appointment. This is referred to in the report as the ‘final session’. Benefit receipt is measured 12 and 18 months after the start of therapy.[footnote 6]
The impact of seeing an EA is reported separately for three groups, based on their employment status at their assessment session on entry to IAPT:
- Clients who report they were working at their assessment, but not in receipt of SSP, referred to in the report as ‘working’;
- Clients who reported being off work on SSP, referred to in the report as ‘off work sick’;
- Clients who were not working (e.g. unemployed or long-term sick, disabled, homemakers and carers). The data is based on 20,898 client records who entered IAPT treatment between 1st January 2018 and 1st January 2020.
Take up of EA support
Overall, the take up of EA support was 14 per cent in those who attended two or more IAPT therapy sessions. Take up of EA support was highest among IAPT clients who were off work sick at the point they entered the service. Just over a third (36 per cent) of those off work sick took up EA support compared to 20 per cent of those who were unemployed, 13 per cent of those who were working and nine per cent of those who were long-term sick or disabled. The strongest predictors of take up were the client’s perception of the extent to which their issues impaired their ability to work and age (with take up tending to increase with age up to the age of 59). For those working but not off sick, and for those out of work, the more severe the depression, the higher the take up.
Impacts of EA support on those working on entry to IAPT
Among IAPT clients who were working when they entered the service, seeing an EA reduced the likelihood of them working by their final session and increased the likelihood that they perceived their issues as affecting their ability to work at the final therapy session. They were also more likely to be in receipt of SSP by this point, suggesting that those who remained in work were more likely to have gone off sick if they had seen an EA. A year after starting IAPT, and again after 18 months, those who had seen an EA were more likely than their matched comparison group to be claiming out of work benefits.[footnote 7]
Despite these movements out of work, there is no significant evidence that seeing an EA had an impact on their mental health. However, the fact that there is no evidence of it having a negative effect may be an indication that those moving out of work did so voluntarily.[footnote 8]
It helps to view these findings within the context of why clients who were working chose to see an EA. Evidence across the evaluation suggests that most workers who chose to do so were having difficulties at work on which they wanted to seek advice. Those who did so were very likely to feel that their mental health issues were impairing their ability to work and that they were experiencing difficulties in the workplace. The methodological challenges this causes are discussed in Chapter 2.5.
Reviewing the impact findings within this context, it is reasonable to conclude that leaving current employment by the end of therapy would have been a positive outcome for many, while they spend time looking for alternative, more suitable, work, or concentrating in the immediate term on their health.
Impacts of EA support on those off-work sick on entry to IAPT
As with those who were working when they started IAPT, those off work sick who had seen an EA were more likely than their matched comparison group to perceive their issues as affecting their ability to work at the final therapy session (although, again, not affecting their perceptions of their overall daily functioning). They were also less likely than their matched comparison group to be working at this stage. However, this was matched with a higher proportion of those who had seen an EA reporting being unemployed. This suggests that seeing an EA meant that they were likely to remain within the labour market seeking (potentially more suitable) work elsewhere.
There is also statistically significant evidence to suggest that seeing an EA had a positive impact on reducing levels of anxiety and depression at the final therapy session among those off work sick.
Impacts of EA support on those out of work on entry to IAPT
For those who were out of work when they entered IAPT, seeing an EA had a positive impact, both on their mental health and on the likelihood of them entering the labour market.
There is strong and consistent statistically significant evidence that IAPT clients who were out of work when they started, who saw an EA, had better mental health outcomes – in relation to both depression and anxiety – than their matched comparison group who had not seen an EA at the final therapy session.
Seeing an EA also significantly reduced the likelihood of them perceiving that their issues affected their ability to work at the final therapy session and increased the likelihood of them being in work at the final session (although there is no significant impact on how well clients perceive their daily functioning). Moreover, the evidence is that seeing an EA increased the propensity for clients who were out of work at the start to be actively engaged in the labour market by the final session. They were more likely than their matched comparison group to report being unemployed – and conversely less likely to report being long-term sick or disabled. This is reflected in the benefits data: those who saw an EA were significantly more likely to be in receipt of unemployment benefits[footnote 9] one year later and less likely to be disability benefits.[footnote 10] A comparison of those who were in receipt of benefits when they came into IAPT and those who were not suggests that EAs may have also helped clients to claim benefits to which they were entitled. There was a statistically significant four percentage point impact on receipt of out of work benefits after 12 months for those not on benefits at the start of IAPT, compared to a percentage point difference of minus one among those already on benefits.
Discussion
Within Steps2Wellbeing IAPT, there is clear evidence of the benefits of providing EA support for clients who entered the service out of work, both in relation to their mental health and their employment status. Similarly, while the evidence of the benefits of EA support is patchy, and not as strong, for clients who entered the service when they were off work sick, the overall picture is largely positive. There is some evidence of the benefits on these clients’ mental health and of them remaining engaged in the labour market - although those seeing an EA were also significantly more likely to perceive that their issues were affecting their ability to work at their final session.
The findings which are most difficult to interpret are those for the IAPT clients who were working when they entered the service. Seeing an EA was significantly associated with them being out of work by the end of IAPT, as well as being on SSP, and associated with these clients being more likely to perceive their issues as affecting their ability to work. Despite this increase in unemployment, there is no evidence that seeing an EA had an impact on clients’ mental health.
There are a number of reasons why this may be the case. The first is methodological: given the decision to see an EA is voluntary, how well does the matched comparison group reflect what would have happened in the absence of EA support to those who saw an EA? There is reasonable evidence that matching on their ‘work impairment’ scores on entry to IAPT does result in a good matched comparison group, but it is not possible to rule out that there may be other, nonobserved, differences between the two groups.
Alternatively, the significant reduction at the end of therapy in the percentage of these clients who were in work could be the result of the EA helping the client to make the best decision for them, given their circumstances. It is possible people who volunteer for employment support are those who are contemplating a change in their status and those still working feeling that they might not be able to carry on much longer. A move away from work – either temporarily while other work is sought or other issues addressed – will in at least some cases be a ‘positive employment outcome’. Certainly, the impact on clients’ perceptions about the extent to which their issues impair their ability to work, suggests that part of the process of seeing an EA has been to increase clients’ awareness of this.
1. Introduction
1.1. Overview
The Employment Advisers (EAs) in Improving Access to Psychological Therapies (IAPT) initiative is funded by the Work and Health Unit (WHU), the cross-government unit jointly sponsored by the Department for Work and Pensions (DWP) and Department of Health and Social Care (DHSC). The service seeks to provide combined psychological treatment and employment support to enable people to stay in, return to, or take up work.
In 2017, the WHU commissioned a mixed methods evaluation of EAs in IAPT, led by IFF Research and conducted in partnership with ICF, Bryson Purdon Social Research (BPSR) and the School of Health and Related Research (ScHARR) at The University of Sheffield.
This report, led by BPSR, is part of a suite of reports published as part of the evaluation.[footnote 11] It uses data standardly collected by IAPT services, linked with data on benefit receipt held by the DWP. It measures the impact of seeing an EA as part of the IAPT service on clients’ levels of mental health; their daily functioning and ability to work; their employment and benefit receipt.
The report presents the impact of seeing an EA on three groups of IAPT clients, based on their reported employment status when they entered the IAPT service: those who were working but not on Statutory Sick Pay (SSP); those who were off sick on SSP; and those who were out of work (e.g. unemployed or long-term sick or disabled). This introduction provides the context for the findings in later chapters, covering:
- The background for the EAs in IAPT initiative;
- A description of how the Steps2Wellbeing IAPT service in Dorset and Southampton operate EAs in IAPT;
- Key findings from qualitative interviews and a longitudinal survey with individuals using EA support;
- The aims of the Steps2Wellbeing IAPT impact analysis presented in this report;
- Signposting the remaining report sections.
1.2. The EAs in IAPT programme
IAPT, established in 2008, is an NHS England programme that provides evidence based psychological treatments for people with common mental health problems, principally anxiety and depression.
In 2009, an EA pilot pathfinder programme was introduced in 11 areas in IAPT services across England, which set out to test the benefits of offering employment support via EAs to help IAPT clients remain in or return to work. Findings from a DWP commissioned evaluation in 2013[footnote 12] suggested that EAs may be effective in supporting an individual back to work. At the time of the 2013 report, the EA service was only available for employed clients, i.e. those working or those employed but off sick. A recommendation of the report was to expand access to include out of work clients. Shortly after its inception in 2015, the WHU secured funding to extend the employment advice component of IAPT provision. The key catalyst in renewing the EAs in IAPT pilot was a policy recommendation in the 2014 RAND Europe report on psychological well-being and work,[footnote 13] which specified that vocational support should be embedded in local IAPT or psychological therapy services, based on the principles of the Individual Placement and Support (IPS) model of supported employment.[footnote 14]
The programme adds additional capacity to deliver employment support to the target areas, by funding 350 additional EA and Senior Employment Adviser (SEAs) posts across 40 per cent of Clinical Commissioning Groups (CCGs). The original IAPT business case recommended a 1:8 ratio between EAs and therapists, and the additional funding added sought to bring the EA to therapist ratio closer to 1:8. The programme was rolled out in two waves: Wave One which went live in March 2018 and Wave Two which went live in March 2019. Each CCG or service directly recruited their EAs or commissioned a third party to provide them. The EAs in IAPT delivery model has been designed as a single service that brings together employment advice and support with IAPT provision. Therapists and EAs are expected to work collaboratively to deliver a personalised service to clients based on their individual needs. The service is designed to support people with common mental health conditions who are either:
- In work but struggling or facing difficulties in the workplace;
- Off work sick/suspended from work; or
- Looking for work.
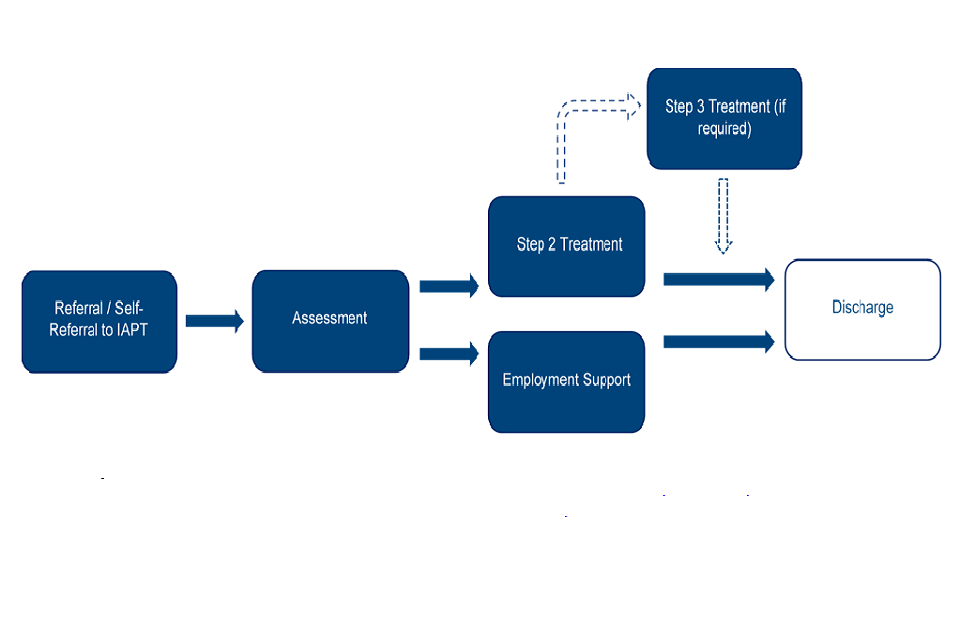
Participation in employment support is voluntary and can be accessed at any point in the client journey from referral to discharge. Clients referred to the IAPT service are intended to follow one of four pathways according to their needs, although there is some variation between CCGs. Following assessment by a therapist they will receive:
1. Therapeutic treatment only;
2. Therapeutic treatment and employment support simultaneously;
3. Employment support continued beyond point of discharge/after their therapeutic treatment has been completed;
4. Employment support while waiting for therapeutic treatment.
The approach is client-led, so that if there are no pressing employment concerns during assessment or subsequent therapeutic sessions, only therapeutic treatment will be offered. If employment support is clearly indicated at the outset, pathway two or four (depending on the waitlist for therapy and considered appropriateness of starting employment support first) would be followed and if it only emerges later that employment is an issue, then pathway three would be followed.
As well as delivering a combined employment advice and therapy service to the target group, the programme aims to contribute towards a wider systemic and cultural change, whereby structural barriers to integrated working around employment and health are challenged. At the local level, the intention was to support change through developing collaborative working relationships between EAs in IAPT providers and local employers, trade unions, Jobcentre Plus (JCP) and support organisations within the local labour market.
1.3. Steps2Wellbeing IAPT
The analysis in this report uses data routinely collected from the IAPT services to estimate the impacts of EA support on mental health, functioning, employment and benefit receipt of IAPT clients. The original intention was to use data from across the full range of EA pilot sites to make this assessment, using data supplied by NHSDigital, however failure to agree a Data Sharing Framework Contract meant this analysis was not feasible.
The Steps2Wellbeing IAPT service is provided by Dorset HealthCare NHS Foundation Trust for the populations of Dorset and Southampton Clinical Commissioning Groups (CCGs). EA support was introduced into the service in June 2017. This service was chosen for the impact evaluation because as a wave one service they had sufficient volumes of clients receiving employment to support a standalone impact assessment. Another advantage of using this service for the evaluation is that the EAs collected the full range of Patient Recorded Outcome Measures, making it possible to analyse the continued impact of employment support that took place after discharge from therapy (see Appendix D).
While the impact findings reported on here are only valid for Steps2Wellbeing IAPT, and for the period covered by the evaluation (referrals between 1st January 2018 and 1st January 2020), it is important to note that the recovery rates achieved by this service prior to EAs in IAPT investment (August 2017) are similar to the national average (Table 1.1). While it cannot formally be inferred that the impact of EAs in other areas will be the same as these, it is a reasonable assumption that they will be broadly similar, especially in those areas operating a very similar model to Steps2Wellbeing.
Table 1.1: Comparison of recovery rates of Steps2Wellbeing and National Average
| Recovery rate | 2016/17 | 2017/18 | 2018/19 | 2019/20 |
|---|---|---|---|---|
| Recovery Rate | ||||
| Steps2Wellbeing | 56% | 47% | 57% | 53% |
| National | 49.3% | 50.8% | 52.1% | 51.1% |
| Reliable Improvement | ||||
| Steps2Wellbeing | 72% | 65% | 74% | 70% |
| National | 65.1% | 66.4% | 67.4% | 67% |
Source: NHS Digital Annual Reports
When clients self-refer or are referred to Steps2Wellbeing, they are offered a primary care psychological assessment. If the service can meet the client’s needs, then step 2 or step 3 interventions are offered. These are primarily based on Cognitive Behavioural Therapy (CBT); however non-CBT options are also available as per the IAPT handbook[footnote 15]. At assessment, if the service is not appropriate to the client’s needs, they are referred elsewhere or discharged from the service. A full outline of the process can be seen in Figure 1.
Within Steps2Wellbeing, EAs are co-located with Therapists and other IAPT practitioners. The employment service is generally offered to all clients at the point of their IAPT assessment. The main exception to this is if the IAPT service is not suited to the client’s needs and they are subsequently discharged or signposted to an external service. Clients that were deemed eligible for IAPT and accepted this offer of employment support were generally offered an appointment with an EA fairly promptly after their initial IAPT assessment. Some of these clients were able to access this support whilst awaiting an intervention, whereas others were receiving employment support alongside their psychological treatment. This is especially the clients opted for technologically enabled therapy types, which generally incur very short waits for the commencement of treatment. Clients will receive employment support before or alongside their treatment for up to one-month post-discharge from the service unless there is a good reason to continue employment support (for example they are actively working on an issue with the EA). EA’s offer support including benefit advice, assist clients and employers to implement reasonable adjustments and graduated return to work, improving job searching skills, developing CV’s and job applications. They also provide support in seeking educational and training opportunities as well as seeking alternative and more appropriate roles should they wish to leave their current employment.
Figure 1: Clients journey through IAPT service
For the time period covered by this report, 3,825 clients saw an EA, (the average number of sessions being 3.5). Twenty per cent had just one session, and 28 per cent had five or more sessions.
1.4. Key impact findings from the Survey[footnote 16] and Qualitative Research
The primary aim of the evaluation was to measure the extent to which EA support within IAPT provides additional employment and health outcomes across a range EA in IAPT services. Part of this research involved a longitudinal telephone survey among IAPT clients in areas where EA support had been introduced or increased, surveying clients five months and twelve months after they entered the IAPT service; and a further telephone survey among IAPT clients in areas where EA support had not yet been introduced or increased, conducted twelve months after entering the IAPT service. These latter clients provided a comparison group, statistically matched using propensity score matching, against which to estimate the impact of EA support. Analysis from the survey was supported by longitudinal qualitative interviews with clients from eight case study IAPT services (including Steps2Wellbeing) which were providing new or increased EA support, around five months and twelve months after entering the service.
The survey research identified the following impacts of seeing an EA within IAPT for those who were off work sick and those who were looking for work when they started IAPT:
- Those who were looking for work when they started IAPT were significantly more likely to be working after 12 months. In terms of health, they were significantly less likely to have seen their GP within the previous two weeks.
- For those still seeking work after 12 months, there was non-significant evidence that those who had EA support were doing more job search activity and had a stronger desire to find work. However, counter to this, they also appeared to be less confident that they would find work and to have lower levels of well-being than the matched comparison group (although not statistically significant).
- In contrast, there was very little statistically significant evidence of EA support having an impact on those employed but off sick on IAPT entry: the broad pattern of non-significant results suggest that they were in fact less likely to be employed and in work after 12 months than the matched comparison group.
- Overall, the pattern of results on these clients’ well-being suggests that those who had seen an EA had lower levels of well-being after receiving the support, but they also had (statistically significantly) lower levels of anxiety.
It proved infeasible to measure the impact of EA support on IAPT clients who were working at the time they started IAPT. There was insufficient data in the survey to find a robust matched comparison group of clients who were working but had issues related to their work which might have led them to choose to see an EA.[footnote 17]
1.5. Report outline
Subsequent sections of this report cover:
- Chapter 2: The methodology used to estimate the impact of EAs in IAPT in Steps2Wellbeing IAPT;
- Chapter 3: The profile of IAPT clients and those taking up EA support;
- Chapter 4: The impact of EA support on those who were working or off sick when they started IAPT;
- Chapter 5: The impact of EA support on those who were out of work when they started IAPT;
- Chapter 6: A discussion of the findings.
Further analysis is presented in the Appendices.
2. Methodology
2.1. Overview
The impact of seeing an Employer Adviser (EA) as part of Steps2Wellbeing Improving Access to Psychological Therapies (IAPT) is measured by comparing the post-therapy outcomes of IAPT clients who saw an EA against those of a matched comparison group of IAPT clients who did not. The report focuses on the impacts of seeing an EA within IAPT on:
- Clients’ mental health measuring using the clinical measures collected by IAPT;
- the extent to which health-related issues are perceived to impair daily functioning;
- the extent to which health-related issues are perceived to impair their ability to work;
- Clients’ employment status and benefit receipt.
With the exception of benefit receipt and employment status, the impacts are measured at the point of the final IAPT therapy session, using data recorded by the therapist. This gives data that is recorded in the same way for both the EA and matched comparison groups.[footnote 18] Final employment status is as recorded at the final appointment, whether that be the final therapy session or the final EA session. The average time interval between assessment and final therapy session is 139 days.
Department for Work and Pensions (DWP) data on benefit receipt provides longerterm outcomes, up to 18 months after the start of therapy. The impact of seeing an EA is reported separately for three groups, based on their employment status at the start of their IAPT therapy:
- Clients who report they were working at their assessment, but not in receipt of Statutory Sick Pay (SSP) (12,918 clients in the dataset, of whom 13 per cent saw an EA), referred to in the report as ‘working’;
- Clients who reported being off work on SSP[footnote 19] at their assessment (1,340 clients in the dataset, of whom 36 per cent saw an EA), referred to in the report as ‘off work sick’;
- Clients who were not working at their assessment (e.g. unemployed or longterm sick or disabled) (6,640 clients in the dataset, of whom 11 per cent saw an EA). Of this group, 2,619 (39.5 per cent) were on an out of work benefit[footnote 20] at assessment, and 4,021 were not, with very similar percentages seeing an EA: 12 per cent and 10 per cent respectively.
2.2. The data
The data used in this report is based on 20,898 client records who were referred to the Steps2Wellbeing IAPT service between 1st January 2018 and 1st January 2020 and who received at least one therapy session after their assessment.
The initial dataset compiled by the Steps2Wellbeing team included 61,839 records, but after excluding those who did not enter treatment, this reduced to 28,054. There were then a series of other exclusions to get to the 20,898:
- Only those records that could be matched to DWP data (see ‘Matching the client records to DWP data’) were included;
- Those recorded as retired or ‘not stated’ on their initial employment status, and those with a recorded age outside of the range 19 to 66 were excluded, on the grounds that very few of these clients saw an EA;
- The Work and Social Adjustment Scale (WSAS) work question was a key matching variable in the creation of matched comparison groups, so those clients where no score was recorded in the dataset were excluded. Those scoring nine however were included (these being the group who concluded they could not give a point on the main scale)[footnote 21];
- There were a small number of other exclusions including deaths and those judged not suitable for IAPT or referred to another service.
The datafile also excluded those who opted out of their data for secondary use.
Matching the client records to DWP data
The DWP fuzzy-matching process aims to map the individuals who went through IAPT services to their respective National Insurance Number (NINo). As all the information DWP holds about its customers is anchored to a NINo, it is essential to retrieve the NINo of individuals to extract their benefit information.
The process derives the NINo of individuals using the personal identifiable information (PII) supplied by Steps2Wellbeing. A deterministic matching technique is used to evaluate a series of match-key combinations of the PII variables. The Steps2Wellbeing data and the DWP customer dataset are compared using the match-keys and, where a unique agreement is found, a match-status is assigned to the pair.
The uniqueness of a match-key is defined as the proportion of records in the DWP customer dataset that the match-key uniquely identifies. For example, a match-key consisting of date of birth, postcode, first name, surname and middle name is a strong match with a uniqueness of 99.98 per cent, whereas a match-key using postcode, first name initial and surname initial is a weaker match with a uniqueness of 70.6 per cent. For each individual on the inbound dataset, a match is first attempted on the strongest match-key and if unsuccessful, it is attempted on the next strongest match-key until a match-status is given. The uniqueness threshold for the fuzzy-matching process in the IAPT evaluation was 90 per cent therefore only match-keys with a uniqueness greater than or equal to 90 per cent were used.
In the IAPT evaluation, the PII involved in the fuzzy-matching process were name, date of birth, and address and therefore a series of match-keys were evaluated based on these variables.
The fuzzy-matching process successfully derived a NINo for 98.6 per cent of individuals on the inbound file. Weekly DWP data on benefit receipt was attached to each of the Steps2Wellbeing client records for the two years prior to the IAPT assessment date and up to 78 weeks after the assessment date. For the post assessment period, complete data for 52 weeks was attached for all 20,898 records with the exception of just five. Complete data for the 78 weeks were attached for 17,391 records, the exceptions being those clients with the most recent assessment dates.
2.3. Outcomes[footnote 22]
Mental health
The evaluation measured whether seeing an EA as part of Steps2Wellbeing IAPT had an impact on clients’ mental health at the end of the therapy sessions using two standardised scales routinely collected in IAPT. It also measured the impact on IAPT defined measures of clients’ ‘recovery’, ‘improvement’ and ‘reliable improvement’ derived from changes in their scores across the mental health measures used during their therapy sessions:
- The PHQ-9 (Patient Health Questionnaire) is a nine-item scale designed to facilitate the recognition of depression (Kroenke et al, 2001)[footnote 23]. Individuals answer nine statements about the last two weeks using a scale of 0 to 3, where 0 denotes ‘not at all’, 1 ‘several days’, 2 ‘more than half the days’ and 3 ‘nearly every day’. The statements cover issues such as feeling down and depressed, sleeping problems and concentration issues. An overall score ranging from 0 to 27 is derived from adding up the scores across all nine items, with a higher score indicating a greater level of depression. The scores are also grouped into ‘no depression’ (0 to 4), ‘mild depression’ (5 to 9), ‘moderate depression’ (10 to 14), ‘moderately severe depression’ (15 to 19) and ‘severe depression’ (20 to 27).
- The GAD-7 (General Anxiety Disorder) scale is a seven-item scale designed
primarily as a measure for generalised anxiety (Spitzer et al, 2006)[footnote 24]. Individuals answer seven statements about the last two weeks using a scale of 0 to 3, where 0 denotes ‘not at all’, 1 ‘several days’, 2 ‘more than half the days’ and 3 ‘nearly every day’. The statements cover issues such as high levels of worry, anxiety and restlessness. An overall score ranging from 0 and 21 is derived from adding up the scores across all seven items, with a higher score indicating a greater level of anxiety. The scores are also grouped into ‘no anxiety’ (0 to 4), ‘mild anxiety’ (5 to 9), ‘moderate anxiety’ (10 to 14), ‘severe anxiety’ (15 to 21). For both the PHQ-9 and GAD-7, the analysis compares those seeing an EA and their matched comparison group in relation to:
- the proportion of clients whose score at the final therapy session suggests ‘caseness’ (a score of 10 or more for PHQ-9 and a score of eight or more for GAD-7) – that is, the thresholds used by IAPT to suggest that the client would probably receive a diagnosis of anxiety;[footnote 25]
- the proportion of clients whose score at the final therapy session shows ‘reliable change’ – improvement or deterioration (that is, a positive or negative change score of four or more on the GAD-7 and 6 or more on the PHQ-9) compared to their score at the first session;
- the proportion of clients in each of the categories at the final therapy session;
- their mean scores at the final therapy session
- the change in mean scores between the first and final therapy session.
- ‘Reliable improvement’ in IAPT is a clinically significant improvement in a client’s condition when comparing their levels of anxiety and/or depression at their first and final therapy sessions. It draws on a client’s PHQ-9 score and their level of anxiety measured with an Anxiety Disorder Specific Measure (ADSM) (either GAD-7 or a scale more suitable for the nature of a client’s specific anxiety disorder). An improvement is deemed reliable if (a) there is a decrease on at least one measure which is greater than the reliable change threshold for the measure and (b) there is not an increase on at least one measure which is greater than the reliable change threshold for that measure.[footnote 26]
- ‘Recovery’ in IAPT is measured in terms of a client’s shift from the first to their final therapy session away from their symptoms of anxiety and/or depression being sufficiently severe to reach ‘caseness’ (i.e. regarded as a clinical case of that condition). Again, depression is measured by the PHQ-9, with anxiety measured with an ADSM (either GAD-7 or a scale more suitable for the nature of a client’s specific anxiety disorder).[footnote 27]
- ‘Reliable recovery’ in IAPT is where a client has met the criteria for both reliable improvement and recovery. That is, they have moved from being a clinical case at the start of IAPT to not being a clinical case at the final therapy session, and there has also been a clinically significant improvement in their condition.[footnote 28]
For those who continued to see an EA beyond the last therapy session, there is data on their PHQ-9 and GAD-7 scores beyond the end of therapy. However, the impact of seeing an EA is measured by comparing outcomes at the last therapy session. If the later data were to be included, it would not be possible to determine if any further change was an additional impact of seeing an EA or natural recovery over time. As expected, the mental health outcomes improve using scores beyond the end of therapy, which is further discussed in Appendix D.
Quality-Adjusted Life Years (QALYs) and the Recovering Quality of Life – Utility Index (ReQoL-UI)
Quality-adjusted life years (QALYs) are often used in order to estimate the cost effectiveness of care interventions. QALYs are a metric measured on a preference based quality-adjustment scale, anchored at 0 (a state equivalent to dead) and 1 (full health), combined with length of life allowing comparisons between interventions that affect quantity and/or quality of life. The preference-based quality-adjustment scale captures health-related quality of life, quantifying a representative sample of a population’s ‘preferences’ between alternative health states; the associated preference-based values are also often referred to as ‘utility’ scores. In comparison, ‘length of life’ tends to be the duration of a study and/or data collection period of interest; for example, if a study focussed on the time period between a baseline assessment and then 8-weeks later as the final assessment point, the ‘length of life’ would be 8-weeks in this instance.
An example QALY calculation is that one QALY equates to one year of life in full health (e.g. a utility score of 1 x 1 year = 1 QALY). Alternatively, a QALY of 0.5 potentially equates to six months of full health (e.g. a utility score of 1 x 0.5 year = 0.5 QALY) or one year in a state equivalent to a utility score of 0.5 (e.g. a utility score of 0.5 x 1 year = 0.5 QALY). QALYs are considered cross-comparable based on the “QALY is a QALY” assumption.
QALYs can be estimated via preference-based measures (also referred to as ‘utility weighted’ or ‘utility-based’ measures), which uses a pre-estimated preference-based quality-adjustment scale as part of its scoring system. In this instance, the preference-based measure used is the Recovering Quality of Life – Utility Index (ReQoL-UI). The ReQoL suite of measures are brief outcome measures focusing on the process of recovery for users of mental health services. They were developed by a team at The University of Sheffield to capture the concerns of mental health service users on their quality of life. The development of the ReQoL measures was commissioned and funded by the Department of Health Policy Research Programme in England for use in the NHS. The ReQoL-UI is specifically designed for estimating QALYs in mental health service users and, as such, is particularly useful for an evaluation within the context of IAPT. However, the ReQoL-UI is not directly collected in the IAPT dataset, rather the ReQoL-UI’s preference-based value set scores have to be estimated using the outcomes that are collected, something that prior to this evaluation had not been attempted.
As part of this research, researchers at the School of Health and Related Research (ScHARR) at the University of Sheffield used a dataset from another similar IAPT based study that collected PHQ-9 and GAD-7 alongside the ReQoL-UI, to develop a mapping function from the PHQ-9 and GAD-7 to the ReQoL-UI. After mapping from the GAD-7 and PHQ-9 to the ReQoL-UI, the ReQoL-UI scores can then be used to calculate QALYs for the duration of the IAPT treatment per patient. Full details of the methods used by ScHARR are given in Appendix H.
The mapped ReQoL-UI scores are based on PHQ-9 summary scores, GAD-7 summary scores, age, and gender. A number of potential models were developed by ScHARR, with the range of possible ReQoL-UI values depending on the exact model specification. The final choice of mapping model to be used in this report was based on assessing model fit statistics e.g. a model with the lowest predictive error[footnote 29], alongside other model fit statistics described in Appendix H. Using this model the ReQoL-UI value ranges from -0.134 to 0.944, with higher scores indicating a better preference-based health state.[footnote 30] ReQoL-UI mean values are presented in this report at assessment and at the time of the final therapy session.
The calculation of QALYs from ReQoL-UI scores is, in theory, straightforward when there are only two data collection time points: QALYs are calculated per person based on a person’s ReQoL-UI score at assessment plus their score at follow-up, divided by two and then multiplied by the proportion of a year that has elapsed between the two scores (e.g. if the elapsed time is six months the multiplier would be 0.5). This is described in the literature as the total area under the curve method.
However, an issue arises in this study because the average time interval between assessment and final therapy session is systematically longer for those seeing an EA relative to the matched comparison groups (the average for the EA group being 163 days and the average for the matched comparison groups being 132 days). This is discussed further in Section 2.5. Even if the impact of seeing an EA on ReQoL-UI was zero, with the mean being the same for both the EA and matched comparison groups, the QALYs would be higher for the EA group (by a factor of 163/132) simply because they are measured over a longer period.
To address this inherent bias in the QALY impacts, it is necessary to make some assumptions about what the ReQoL-UI scores would be for the matched comparison group if they had been observed for the same average time interval as the EA group. Firstly, an artificial end time point has been imputed for the matched comparison group, so that the imputed end time points for the matched comparison group is very similar to that of the EA group.[footnote 31] For the analysis presented in this report, it is then assumed that the ReQoL-UI measured at the final therapy session would hold constant until this imputed time. That is, there is no improvement or deterioration in the ReQoL-UI scores over the imputed period after the end of therapy. To test the sensitivity of the findings to this assumption, a second analysis was run where the assumption made was that the trend in the ReQoL-UI scores between assessment and final therapy continued. This analysis is included in Appendix H. and did not change the overall QALY findings presented in this report.
Impaired functioning
In addition to using standardised measures of mental health, the evaluation looked at the impact of EA support on the extent to which clients’ lives were impaired as a result of their mental health issues. For this it used clients’ scores on the Work and Social Adjustment Scale (WSAS) (Mundt et al, 2002)[footnote 32] at the final therapy session:
- WSAS is a five-item scale designed to measure impaired functioning. Individuals rate the extent to which their problem impairs their ability to carry out five activities (ability to work, home management, social leisure activities, private leisure activities, and forming and maintaining close relationships), using a scale from 0 to 8, where 0 denotes ‘not at all’ and 8 denotes ‘very severely’. If an item is left unanswered or not applicable it is given a code 9.
An overall score ranging from 0 to 40 is derived from adding up the scores across all five items (excluding 9s), with a higher score indicating a greater level of impairment. The scores are also grouped into ‘low’ (0 to 9), ‘moderate’ (10 to 20) and ‘severe impairment (21 to 40).
The analysis uses both the overall WSAS score as well as single item on scale that measured clients’ ability to work. It compares those seeing an EA and their matched comparison group:
Across the full scale:
- Proportion of clients in each of the four categories at the final therapy session;
On the ability to work item:
- Scoring the statement “Because of my [problem] my ability to work is impaired”, the proportion of clients rating their ability to work as ‘not’ (0), ‘slightly’ (1 or 2), ‘definitely’ (3 to 5), ‘markedly’ (6 or 7), ‘very severely’ (8), or ‘if you are retired or choose not to have a job for reasons unrelated to your problem’ (9).
Employment status and benefit receipt
Finally, the evaluation looked at whether seeing an EA as part of Steps2Wellbeing IAPT had an impact on clients’ economic status and receipt of SSP at the end of the service – which, for those seeing an EA, could be the final therapy session or their final EA appointment - and their receipt of benefits 12 and 18-months after entering the service:
- Employment status: using data recorded by IAPT therapists or EAs at the final session, the evaluation measures the impact of EA support on the percentage of clients who were reported as working (versus not working) at the final session. It also measured the impact across four categories: those reported as working at the end of IAPT, being long-term sick or disabled, being unemployed or another description of their economic status (e.g. homemaker, student, retired). This information should be self-reported by the client. However, in some cases, it may have been recorded by the therapist or EA based on their knowledge of the client’s situation.
- Receipt of Statutory Sick Pay (SSP): using data recorded by the IAPT therapists or EAs at the final session, the evaluation measures the impact of EA support on the percentage of clients who were reported as on SSP.
-
Benefit receipt: focusing on 52 and 78 weeks after the first therapy session, the evaluation measures the impact of EA support on (a) the percentage of clients on benefit at each time point and (b) the mean number of weeks on benefit in the previous 52 or 78 weeks, reporting on receipt of:
- Any out-of-work benefit (i.e. the unemployment benefits and other out-of-work benefits listed in the next two bullet points);
- Any unemployment benefit for those actively seeking work (Jobseeker’s Allowance, Universal Credit with searching for work conditionality);
- Another out-of-work benefit (Incapacity Benefit, Employment Support Allowance), Income Support, Universal Credit in the following three conditionality groups: preparing for work, planning for work or working with conditionality;
- A disability benefit not conditional on employment status (Personal Independence Payment, Disability Living Allowance).
- Any of the above benefits.
Details on how these benefit states were derived by DWP are included in Appendix F. In addition, the impact of EA support at 13, 26 and 39 weeks are included in Appendix C.
2.4. Client groups
The provision of EA support within IAPT aims to improve the mental health and daily functioning of IAPT clients, regardless of their employment status when they enter the service. However, the aims of EA support within IAPT – or what would be viewed as a ‘positive’ outcome – in relation to paid work and benefit receipt are more complex, and potentially different for those working when they enter IAPT compared to those who are not.
Given it is the client’s choice whether or not to take up the offer of seeing an EA, it is reasonable to assume that most workers who choose to do so are having difficulties at work on which they would like to seek advice. This is certainly the case in terms of the responses to the WSAS work item at their first assessment (see Chapter 3).
Indeed, survey research with EA clients also points to this; when asked why they took up the employment support, around three quarters (74 per cent) of working clients (either currently working or off sick) explicitly stated either that they were experiencing difficulties in the workplace, they needed support to remain in work, or that wished to move out of their current work.[footnote 33] Furthermore, difficulties in the workplace – generally or with regards workplace relationships – were the most common reason for taking up EA support among these groups (51 per cent of those who were working and 35 per cent among those off sick).
Qualitative interviews highlighted the relationship between clients’ employment circumstances and their mental health, with issues with work a feature for most of those seeking support. In some cases, clients wanted to stay with their employer and resolve these problems but, for others, the preference was to find alternative employment. Commonly reported problems were:
- Anxiety made worse by being at work;
- Anxiety and depression directly caused by a problematic work situation such as unsupportive manager or high workload;
- Work ‘taking over’ in life with little time or energy for anything else;
- The impact of bullying or harassment at work.
A positive outcome for these clients, therefore, could be to remain in work (in the same job or a different job or different working conditions) or to leave (temporarily or more long-term) if it helps them improve their mental health.
Similarly, what counts as a positive outcome for clients who are not working when they enter IAPT depends on their circumstances. It might be to enter work; to increase their engagement in the labour market (and, thus, view themselves as unemployed rather than long-term sick or disabled); or to take time away from the labour market (re-categorised as long-term sick or disabled rather than unemployed).
Survey data from the Client Research showed that most of these individuals were keen to return to employment: 72 per cent took up employment support because ‘they felt it could help them get back into work’. However, the timeline to get back into work was unclear. Survey respondents who were out of work when they entered IAPT talked about liking ‘the idea of receiving additional help and support’ (32 per cent), while a quarter (24 per cent) took up the support ‘because their IAPT therapist encouraged them to’. Qualitative interviews indicated that these clients tended to be seeking practical support for job searching; for example, help with writing a CV and cover letter, knowing where to look for jobs and how to develop their interview technique.
Some clients mentioned the need for general career guidance such as planning for a career change, or exploring different sectors or roles that they could work in.
Because of the different potential drivers for choosing to take up EA support, this report presents separate impact estimates for:
- Clients who reported that they were working at the first therapy session, and not on SSP, referred to in the report as ‘working’;
- Clients who reported being on SSP, referred to in the report as ‘off work sick’;
- Clients who reported being unemployed; long-term sick; in education; a full-time homemaker or carer; not receiving benefits and not working or actively seeking work; and those doing unpaid voluntary work and not actively seeking employment.[footnote 34] This group is referred to as the ‘out of work’ group in this report.
2.5. Approach to measuring impact
The impact analysis compares the outcomes of clients seeing an EA with those of a matched comparison group who opted not to see an EA and received therapy only. Three matched comparison groups have been generated, one for each of the three main EA groups: those working and not on SSP; those off work sick on SSP; and those out of work.
The matched comparison groups are essentially a weighted version of the relevant[footnote 35] ‘therapy-only’ group of clients, where the effect of the weights is to give a sample that has a very similar demographic profile, assessment scores, and benefit histories, as the EA support group. Each matched comparison group is assumed to give an estimate of the counterfactual for EA clients (that is, what their outcomes would have been in the absence of the EA sessions).
For all three EA groups, the matched comparison group was generated using propensity score matching. Essentially, therapy-only clients who have characteristics very similar to EA clients are given a large (propensity score) weight, and therapy only clients who are dissimilar are given a much smaller weight. After applying the weights to the therapy-only group, it acts as a matched comparison group. Further details on generating the matched comparison samples can be found in Appendix D.
With the exception of data on benefit receipt, the matching variables used are based on clients’ self-report collected as part of the IAPT assessment:
- Benefit receipt in the two years prior to assessment
- Gender
- Age
- Ethnic group
- Whether disabled
- Whether had a long-standing condition
- Whether on prescribed psychotropic medicine
- Number of previous referrals to IAPT
- Employment status
- Index of multiple deprivation quintile
- PHQ-9 score at assessment
- GAD-7 score at assessment
- WSAS score at assessment
- WSAS ability to work score at assessment
- Mental Health care cluster
- Social phobia score at assessment
- Agoraphobia score at assessment
- Specific phobia score at assessment.
Generating matched comparison groups does not eliminate all risk of bias in the estimates of impact. Although the propensity score matching does ensure that the EA and matched comparison groups are very similar on all of the matching variables, the groups may still be dissimilar on other variables that are not collected, and any such dissimilarity could introduce bias. In particular, data is not available on the type or severity of work problems employed clients had, and whether they perceive there to be a risk of losing that employment. Other strands of the evaluation show that difficulties in the workplace – generally or with regards to workplace relationships - were the main reason in-work clients chose to receive employment support. The closest proxy for these issues is the WSAS ability to work score[footnote 36], but it is nevertheless a proxy.
In matching on WSAS ability to work, alongside all of the other matching variables, it is assumed that the EA working group and the matched comparison group are very similar in terms of the risk of leaving their job due to their health condition. This cannot, however, be demonstrated.
There are similar issues for the out of work group. For those out of work who opt to see an EA, there is not good data on their reasons for doing so. Nor do we have data on factors such as work history (although benefits history is available), or qualifications. It is assumed that by matching on all of the variables in the list above, there will also be a good match on these other, unobserved, variables, but it remains an assumption.
Impact of EAs on the number of therapy sessions
One set of variables that are available but are not included in the matching is the number of therapy sessions for each client. To isolate out the impact of the EAs on client outcomes from the impact of the therapy, it would seem natural to match on the number of high and low intensity sessions attended, so that the EA and matched comparison groups are similar in the amount of therapy received. However, there is anecdotal evidence that seeing an EA actually impacts on the number of therapy sessions because it helps to engage clients with the service. If this is the case, then matching on the number of therapy sessions would mask at least some of the impact of the EAs. For this reason, the number of therapy sessions was not included in the matching. As a result, where EA support is observed as having an impact on clients’ outcomes, this may, in part, be due to the fact that they have, on average, a greater involvement with the IAPT therapy.
Table 2.1 does support the claim that EAs impact on the number of therapy sessions. The table shows the number of high and low intensity sessions for the EA groups and their matched comparison groups (with the third, sixth and ninth data columns showing the percentage point difference). For those in the ‘working’ group, 20 per cent of those seeing an EA had 11 or more high intensity sessions and 31 per cent had six or more low intensity sessions, compared to just 14 per cent and 16 per cent respectively for the matched comparison group. Similar differences are seen for the other two groups.
Related to this, although the time interval between assessment and final therapy session would ordinarily be matched on, this cannot be done. As a result, the time intervals for the EA groups are systematically longer, by around 31 days on average, than the time intervals for the matched comparison groups. As was discussed in Section 2.3, this has implications for the calculation of QALYs.
Table 2.1 Number of IAPT therapy sessions for EA and matched comparison
groups[footnote 37]
table 2.1a Working at assessment
| Intensity sessions | EA group % | Matched comparison group % | Pp difference |
|---|---|---|---|
| Number of high intensity sessions | |||
| 0 | 53 | 50 | 2 |
| 1 to 6 | 13 | 20 | -7 |
| 7 to 10 | 15 | 16 | -1 |
| 11 or more | 20 | 14 | 5 |
| Number of low intensity sessions | |||
| 0 | 28 | 37 | -9 |
| 1 or 2 | 19 | 24 | -5 |
| 3 to 5 | 23 | 23 | 0 |
| 6 or more | 31 | 16 | 15 |
| Average number of days between assessment and final therapy session | 162 | 131 | |
| Base | 1,706 | 11,212 |
Table 2.1b On SPP at assessment
| Intensity sessions | EA group % | Matched comparison group % | Pp difference |
|---|---|---|---|
| Number of high intensity sessions | |||
| 0 | 57 | 55 | 1 |
| 1 to 6 | 12 | 20 | -7 |
| 7 to 10 | 14 | 16 | -2 |
| 11 or more | 17 | 9 | 7 |
| Number of low intensity sessions | |||
| 0 | 24 | 30 | -6 |
| 1 or 2 | 17 | 28 | -11 |
| 3 to 5 | 29 | 26 | 3 |
| 6 or more | 30 | 16 | 14 |
| Average number of days between assessment and final therapy session | 150 | 115 | |
| Base | 488 | 852 |
Table 2.1c Out of work at assessment
| Intensity sessions | EA group % | Matched comparison group % | Pp difference |
|---|---|---|---|
| Number of high intensity sessions | |||
| 0 | 38 | 40 | -3 |
| 1 to 6 | 18 | 25 | -8 |
| 7 to 10 | 19 | 16 | 3 |
| 11 or more | 20 | 18 | 8 |
| Number of low intensity sessions | |||
| 0 | 41 | 45 | -5 |
| 1 or 2 | 21 | 25 | -4 |
| 3 to 5 | 18 | 16 | 2 |
| 6 or more | 20 | 13 | 7 |
| Average number of days between assessment and final therapy session | 175 | 143 | |
| Base | 733 | 5,907 |
2.6. Key considerations when interpreting the results
The Steps2Wellbeing dataset, linked with DWP benefits data, provides rich data on clients at the start of IAPT making it possible to match EA clients with those who did not take up the offer of support. It includes a wider range of outcomes than available in the Client Research survey. Nonetheless, there are a number of limitations with the data which should be taken into account when interpreting the findings. These include:
The counterfactual
1. The WSAS item on how far clients’ issues impair their ability to work as they enter IAPT provides an important variable on which to match the comparison group against those who take up EA support. Likewise, they are matched on their benefits history. However, it is possible that those who take up EA support were different in the nature of their work-related issues and in their motivations than those who choose not to take up EA support. This is particularly the case for those who choose to take up EA support whilst already in work, where the motivation to seek EA support is less clear. If this is the case, unobservable differences may be biasing the estimates of impact.
2. It is possible that having EAs in the service could have led to some spill-over effects to the comparison group if the EAs influenced the practice of the therapists. If this happened, it would bias the estimates of impact downwards.
The outcomes
1. With the exception of the benefits data, the outcomes were measured immediately at the end of therapy or EA support. As a result, it is not possible to measure the medium to longer-term impact of EA support on clients’ mental health or impaired functioning or understand whether leaving employment was associated with positive longer-term mental health impacts.
2. Information on employment outcomes was collected at the final appointment and not based on administrative data. For the EA group, this final appointment was with the EA in 28 per cent of cases. If stricter definitions of employment status were used by EAs than therapists then this could, in theory, bias the impacts. However, there is no evidence that the relationship between DWP recorded benefit receipt and recorded employment status differs according to the appointment type, so the risk of bias looks to be small.
3. There is no data to unpack the impacts of EA support on clients’ employment status at the final session, particularly whether reductions in the proportions in employment are due to clients making proactive decisions rather than involuntarily leaving their work. This makes it difficult in places to interpret the findings.
Moreover, as Universal Credit claims can include in-work support, benefit receipt cannot be used reliably to measure whether or not clients are in work after 12 and 18-months (i.e. how long lasting any early impacts on employment are). Data was not available on other employment outcomes such as pay and progression.
Replicability
1. The findings reported apply to Steps2Wellbeing. It is not possible to be sure that these would be replicated more widely across the EAs in IAPT initiative.
2. The later benefit outcomes for those in the sample entering IAPT towards the end of the period coincided with the Covid pandemic and may not reflect the level of impact that might be found in other years.
2.7. Table format, statistical tests and p-values
Most of the tables in this report use the same format. For all but the benefit receipt outcomes (Tables 4.6, 4.8 and 5.4), the tables present the results for each outcome on entry to IAPT at the assessment session and at the final therapy session or final session (depending on the outcome). The benefit receipt tables present receipt at on entry to IAPT at the assessment session and at both 52 and 78 weeks after entry to IAPT. At each data collection point, the percentage or mean score is shown for those who had seen an EA and for those in the matched comparison group. Where the outcome is a change score from the first to last therapy session (e.g. percentage improving or deteriorating), there is necessarily no data at the assessment point (denoted by n/a).
The tables show for each outcome the p-value significance level of the difference between those seeing an EA and the matched comparison group. The p-value is the probability of an observed difference being due to chance alone, rather than being a real underlying difference for the population. A p-value of less than five per cent is conventionally taken to indicate a statistically significant difference (p < 0.05). The p-values have been calculated in the complex samples module of SPSS. Where the differences between the two groups are statistically significant (that is the p-value is less than 0.05), these are highlighted in red and with an asterisk. The term ‘statistically significant’ is often abbreviated in the text to ‘significant’. In this report patterns of results across outcomes are commented on, even if some do not reach significance.
The p-values take into account the nature of the outcome data. For binary and categorical outcomes, chi-squared tests are used; for ordered categories ordinal tests are used. For the final session outcomes, the p-values are calculated after controlling for the outcome measures taken at assessment on entry to IAPT via a regression. This is a more sensitive test than a simple comparison.
P-values are dependent on sample size. For any given observed difference, the smaller the sample size the larger the p-value. However, as the sample sizes differ across the three main groups, the minimum size of impact that will lead to a p-value of less than 0.05 also differs. As a very crude rule of thumb, for outcomes presented as percentages that are around the 50 per cent mark, the difference between the EA and matched comparison group has to be around two and a half percentage points to reach significance for the working group, around six percentage points for the off work sick group, and around four percentage points for the out of work group.
Due to rounding, column percentages do not always total 100 per cent. The unweighted sample sizes are cited at the end of each table.
3. Profile of Improving Access to Psychological Therapies clients and those taking up Employment Adviser support
3.1. Overview
This chapter describes the take-up of Employment Adviser (EA) support by Improving Access to Psychological Therapies (IAPT) clients who were working, off work sick or out of work when they entered the service. It reports on the percentage take-up for each group, and the factors which most strongly predict whether or not a client receives EA support.
The chapter provides an overview of the findings, with the full detail provided in Appendix B. Tables B.1, B.2 and B.3 of Appendix B show the percentage of clients taking up EA support within the three main client groups across a range of characteristics: demographics; benefit history; and scores on clinical measures collected on entry to IAPT. Where there is a statistically significant difference across categories the take-up percentages are highlighted in red and marked with an asterisk. To complement these figures, Tables B.4, B.5 and B.6 in Appendix B show the differences in the profile of EA clients compared to therapy only clients.
3.2. Take-up among those who were working
For clients who were working when they entered IAPT, the overall take-up of EA support was 13 per cent. This varied across a wide range of the variables in the tables, partly because the large sample sizes means that relatively small differences reach statistical significance. However, a regression analysis of the predictors of take-up for this group suggests that the variable on entry to IAPT that is the strongest predictor of take-up is their score on the Work and Social Adjustment Scale (WSAS) item on their ability to work.[footnote 38] For those with a score of zero (no impairment), the take-up rate was just five per cent. As the scores increased, so did the take-up, with those with a score of eight having a take-up rate of 32 per cent.
This suggests that the WSAS ability to work score is strongly related to perceived concerns about employment that clients thought EAs may be able to help with.
Other strong predictors of take-up for those working were:
- age-group (take-up broadly increased with age and was highest for those aged 40 to 59);
- employment status (the self-employed had lower take up than other employment groups);
- and the PHQ-9 score on entry to IAPT (the higher the depression score, the higher the take-up).
Figure 2 shows the percentage take-up for these four predictors.
Figure 2: Take up of EA support across key sub-groups for those working on entry to IAPT
Work and Social Adjustment Scale (WSAS) - ability to work score
| WSAS - ability to work score | Percentage |
|---|---|
| None (0) | 5% |
| Slightly (1 to 2) | 8% |
| Definitely (3 to 5) | 14% |
| Markedly (6 to 7) | 22% |
| Very severely (8) | 32% |
| Not answered (9) | 10% |
Age group
| Age group | Percentage |
|---|---|
| 19-24 | 9% |
| 25-29 | 12% |
| 30-34 | 11% |
| 35-39 | 11% |
| 40-44 | 14% |
| 45-49 | 16% |
| 50-54 | 16% |
| 55-59 | 20% |
| 60-66 | 18% |
Employment status
| Employment status | Percentage |
|---|---|
| Employed full-time | 14% |
| Employed part-time | 12% |
| Employed zero-hours contract | 16% |
| Self-employed | 9% |
PHQ-9 score
| PHQ-9 score | Percentage |
|---|---|
| No depression (0-4) | 4% |
| Mild depression (5 to 9) | 9% |
| Moderate depression (10 to 14) | 13% |
| Moderately severe depression (15 to 19) | 14% |
| Severe depression (20 to 27) | 17% |
3.3. Take-up among those who were off sick receiving Statutory Sick Pay
For those off work sick the overall rate of take-up was much higher at 36 per cent, suggesting that this is a group more likely to perceive that EA support may be of help. There is a similar pattern of take-up across the variables in the tables, but the differences are less stark. The strongest two predictors of take-up were:
- the WSAS ability to work score (take-up ranges from 25 per cent for those with a score to zero to 48 per cent for those with a score of eight); and
- age-group (take-up rates are highest for those aged 45 to 59).
Figure 3 shows the take up of EA support for those on Statutory Sick Pay.
Figure 3: Take up of EA support across key sub-groups for those on Statutory
Sick Pay on entry to IAPT
Work and Social Adjustment Scale (WSAS) - ability to work score
| WSAS - ability to work score | Percentage |
|---|---|
| None (0) | 25% |
| Slightly (1 to 2) | 23% |
| Definitely (3 to 5) | 30% |
| Markedly (6 to 7) | 36% |
| Very severely (8) | 48% |
| Not answered (9) | 24% |
Age group
| Age group | Percentage |
|---|---|
| 19-24 | 32% |
| 25-29 | 26% |
| 30-34 | 24% |
| 35-39 | 26% |
| 40-44 | 34% |
| 45-49 | 42% |
| 50-54 | 45% |
| 55-59 | 51% |
| 60-66 | 42% |
Employment status
| Employment status | Percentage |
|---|---|
| Employed full-time | 37% |
| Employed part-time | 35% |
3.4. Take-up among those who were out of work
For those out of work on entry to IAPT, the overall take-up rate was the lowest of all the three client groups at just 11 per cent. This in large part reflects the composition of this group: take-up was 20 per cent for those who reported being unemployed, but just nine per cent for those reporting being long-term sick or disabled and even lower for other sets of clients (for example, just five per cent for full time homemakers or carers). After controlling for these differences, once again the strongest predictors of take up were the WSAS ability to work scores and age group, with the relationship between these two variables and take-up being similar to the employed groups. As with the in work group, take-up increased with the PHQ-9 score (the higher the depression score, the higher the take-up (7% take-up for mild depression, and 11% take up for severe depression)).
Figure 4 shows the take up on EA support across WSAS, age and employment status.
Figure 4: Take up of EA support across key sub-groups for those on entry to IAPT
Work and Social Adjustment Scale (WSAS) - ability to work score
| WSAS - ability to work score | Percentage |
|---|---|
| None (0) | 7% |
| Slightly (1 to 2) | 10% |
| Definitely (3 to 5) | 12% |
| Markedly (6 to 7) | 8% |
| Very severely (8) | 13% |
| Not answered (9) | 8% |
Age group
| Age group | Percentage |
|---|---|
| 19-24 | 6% |
| 25-29 | 11% |
| 30-34 | 9% |
| 35-39 | 12% |
| 40-44 | 11% |
| 45-49 | 17% |
| 50-54 | 16% |
| 55-59 | 14% |
| 60-66 | 15% |
Employment status
| Employment status | Percentage |
|---|---|
| Full time homemaker or carer | 5% |
| Full time student | 3% |
| Long term sick or disabled | 9% |
| Other not actively seeking work | 17% |
| Unemployed | 20% |
| Unpaid voluntary work | 4% |
4. Impacts on those working or on Statutory Sick Pay on entry to Improving Access to Psychological Therapies
4.1 Overview
This chapter reports the impacts of seeing an Employment Adviser (EA) as part of Steps2Wellbeing Improving Access to Psychological Therapies (IAPT) among IAPT clients who were working and those who were off work on Statutory Sick Pay (SSP) when they entered the service.
For each group, the impact of seeing an EA is measured by comparing the outcomes of clients who saw an EA against those of a matched comparison group of IAPT clients who did not.
Among IAPT clients who were working when they entered the service, seeing an EA reduced the likelihood of them working by their final session and increased the likelihood that they perceived their issues as affecting their ability to work. However, it did not impact significantly on the extent to which they perceived their issues as affecting their daily functioning overall. A year after starting IAPT, and again after 18 months, those who had seen an EA were more likely than their matched comparison group to be claiming out of work benefits. There is little discernible difference (in percentage point terms) between the mental health outcomes of those who did and did not see an EA.
The picture for those who were off work sick when they entered the service is more complicated. As with those who were working when they started IAPT, those off work sick who had seen an EA were more likely than their matched comparison group to perceive their issues as affecting their ability to work at the final therapy session (but, again, did not impact significantly on their daily functioning overall) and less likely to be in work. However, this was matched with a higher proportion of those who had seen an EA reporting being unemployed. This suggests that seeing an EA meant that they were likely to remain within the labour market, seeking (potentially more suitable) work elsewhere. There is also some statistically significant evidence to suggest that seeing an EA had a positive impact on reducing levels of anxiety and depression among those off work sick.
The following sections present these results in more detail, reporting first on the impacts of seeing an EA on clients’ mental health, followed by the impacts on levels of impaired functioning, employment status and benefit receipt.
4.2. Mental health
Among those who were working when they came into IAPT, there is no statistically significant evidence that seeing an EA has an impact on their mental health above that of seeing a therapist alone (Table 4.1).
Nine in ten IAPT clients entered the service with levels of depression (89 per cent, as measured by the Patient Health Questionnaire (PHQ-9)) and/or anxiety (90 per cent, measured using Generalised Anxiety Disorder Assessment (GAD-7)) suggestive of caseness.[footnote 39] While these percentages dropped by more than half by the final therapy session, the same was true both for those who had received EA support and for their matched comparison group (for example, 35 per cent of those receiving EA support and 36 per cent of the matched comparison group had a PHQ- 9 score reaching caseness at the final therapy session). In turn, this means that there was no significant impact on IAPT recovery rates (a shift away from a client having either depression and/or anxiety at a level reaching caseness).[footnote 40] This pattern of close similarity between the two groups was consistent across the categories of depression and anxiety, and clients’ mean scores, and change in mean scores, on both scales.
Likewise, there were no significant impacts of receiving EA support on the percentage of clients showing reliable improvement at the end of IAPT (a change of six or more on the PHQ-9 or four or more on the GAD-7 scales, or the IAPT ‘reliable improvement’ measure).[footnote 41]
In line with these findings, there were no significant impacts on clients’ quality adjusted life years measured via the ReQoL-UI preference scores or Quality Adjusted Life Years (QALYs).[footnote 42]
Table 4.1 Impact of Employment Advisers on the mental health of those
working on entry to IAPT
On entry to IAPT
| PHQ-9 depression scale (score 0 to 27, lower score better) | EA group | Matched comparison group | Pp difference | p-value |
|---|---|---|---|---|
| % depression level suggesting caseness | 89 | 89 | 0 | 0.937 |
| Reliable change | % | % | n/a | |
| Improvement | n/a | n/a | ||
| No change | n/a | n/a | ||
| Deterioration | n/a | n/a | ||
| Categories | 0.982 | |||
| No depression (04) | 1 | 1 | 0 | |
| Mild depression (5-9) | 10 | 10 | 0 | |
| Moderate depression (10-14) | 31 | 31 | 0 | |
| Moderately severe depression (15-19) | 32 | 32 | 0 | |
| Severe depression (20-27) | 26 | 26 | 0 | |
| Mean (sd) | 15.78 (sd 5.25) | 15.70 (sd 5.28) | 0.567 | |
| Mean of change score (sd) |
At final therapy session
| PHQ-9 depression scale (score 0 to 27, lower score better) | EA group | Matched comparison group | Pp difference | p-value |
|---|---|---|---|---|
| % depression level suggesting caseness | 35 | 36 | -1 | 0.606 |
| Reliable change | % | % | 0.174 | |
| Improvement | 60 | 57 | 2 | |
| No change | 37 | 41 | -3 | |
| Deterioration | 3 | 2 | 1 | |
| Categories | 0.529 | |||
| No depression (04) | 28 | 28 | 0 | |
| Mild depression (5-9) | 36 | 36 | 1 | |
| Moderate depression (10-14) | 18 | 18 | 0 | |
| Moderately severe depression (15-19) | 10 | 11 | 0 | |
| Severe depression (20-27) | 7 | 8 | 0 | |
| Mean (sd) | 8.74 (sd 6.17) | 8.77 (sd 6.19) | 0.665 | |
| Mean of change score (sd) | -7.03 (sd 6.47) | -6.92 (sd 6.31) | 0.665 |
On entry to IAPT
| GAD-7 anxiety scale (score 0 to 21, lower score better) | EA group | Matched comparison group | Pp difference | p-value |
|---|---|---|---|---|
| % anxiety levels suggesting caseness | 90 | 90 | 0 | 0.503 |
| Reliable change | % | % | n/a | |
| Improvement | n/a | n/a | ||
| No change | n/a | n/a | ||
| Deterioration | n/a | n/a | ||
| Categories | 0.976 | |||
| No anxiety (0-4) | 2 | 2 | 0 | |
| Mild anxiety (5-9) | 17 | 17 | 0 | |
| Moderate anxiety (10-14) | 33 | 33 | 0 | |
| Severe anxiety (15-21) | 47 | 47 | 0 | |
| Mean (sd) | 13.69 (sd 4.56) | 13.72 (sd 4.60) | 0.824 | |
| Mean of change score (sd) |
All final therapy session
| GAD-7 anxiety scale (score 0 to 21, lower score better) | EA group | Matched comparison group | Pp difference | p-value |
|---|---|---|---|---|
| % anxiety levels suggesting caseness | 39 | 40 | -1 | 0.605 |
| Reliable change | % | % | 0.054 | |
| Improvement | 67 | 64 | 2 | |
| No change | 29 | 31 | -2 | |
| Deterioration | 4 | 4 | 0 | |
| Categories | 0.148 | |||
| No anxiety (0-4) | 32 | 37 | 1 | |
| Mild anxiety (5-9) | 38 | 37 | 1 | |
| Moderate anxiety (10-14) | 17 | 17 | 0 | |
| Severe anxiety (15-21) | 13 | 15 | -2 | |
| Mean (sd) | 7.65 (sd 5.39) | 7.80 (sd 5.47) | 0 | 0.297 |
| Mean of change score (sd) | -6.05 (sd 5.65) | -5.92 (sd 5.71) | 0.297 |
On entry to IAPT
| IAPT post-therapy change scores | EA group | Matched comparison group | Pp difference | p-value |
|---|---|---|---|---|
| % reliable improvement | n/a | n/a | n/a | |
| % recovery | n/a | n/a | n/a | |
| % reliable recovery | n/a | n/a | n/a |
All final therapy session
| IAPT post-therapy change scores | EA group | Matched comparison group | Pp difference | p-value |
|---|---|---|---|---|
| % reliable improvement | 75 | 73 | 2 | 0.190 |
| % recovery | 57 | 55 | 1 | 0.459 |
| % reliable recovery | 53 | 52 | 1 | 0.373 |
On entry to IAPT
| Quality of life outcomes (higher score better) | EA group | Matched comparison group | Pp difference | p-value |
|---|---|---|---|---|
| ReQoLReQoL-UI mean (sd) | 0.731 (sd 0.10) | 0.730 (sd 0.11) | 0.729 | |
| QALY mean (sd) |
All final therapy session
| Quality of life outcomes (higher score better) | EA group | Matched comparison group | Pp difference | p-value |
|---|---|---|---|---|
| ReQoLReQoL-UI mean (sd) | 0.342 (sd 0.22) | 0.345 (sd 0.23) | 0.592 | |
| QALY mean (sd) |
On entry to IAPT
| Base | EA group | Matched comparison group | Pp difference | p-value |
|---|---|---|---|---|
| Base: all working on entry to IAPT | 1,706 | 11,212 |
All final therapy session
| Base | EA group | Matched comparison group | Pp difference | p-value |
|---|---|---|---|---|
| Base: all working on entry to IAPT | 1,706 | 11,212 |
Among clients who were off work sick when they enter IAPT, seeing an EA was associated with a statistically significant increased likelihood of achieving reliable change in clients’ levels of depression and anxiety above seeing a therapist alone.[footnote 43]
Two thirds (67 per cent) of clients who saw an EA experienced reliable improvement in their PHQ-9 depression score (an improvement of six or more points) compared to 60 per cent among the matched comparison group. The parallel figures for reliable change in GAD-7 anxiety scores (an improvement of four or more points) were 72 per cent versus 65 per cent (Table 4.2).
While the impacts on other mental health measures did not reach statistical significance, there is a general pattern that those who saw an EA had somewhat better mental health outcomes at the end of therapy. As with clients who were working when they entered IAPT, very high percentages of those off work sick entered the service with levels of depression (94 per cent, as measured by the PHQ-9)) and/or anxiety (92 per cent of those seeing an EA and 93 per cent of the matched comparison group, measured using GAD-7)) suggestive of caseness.[footnote 44] While these percentages dropped by more than half by the final therapy session, there was a general, not statistically significant, pattern that the outcomes of those who had received EA support improved more than their matched comparison group. For example, 37 per cent of those receiving EA support had a level of depression reaching caseness at the final therapy session compared with 41 per cent among the matched comparison group. Looking at the categories of depression, those who saw an EA were more likely to be in the ‘mild depression’ category and less likely to be categorised as having ‘moderately severe’ or ‘severe’ depression at the final therapy session than their matched comparison group. The pattern is similar in terms of GAD-7.
Table 4.2 Impact of Employment Advisers on mental health of those off work
sick on entry to IAPT
On entry to IAPT
| PHQ-9 depression scale (score 0 to 27, lower score better) | EA group | Matched comparison group | Pp difference | p-value |
|---|---|---|---|---|
| % depression level suggesting caseness | 94 | 94 | 0 | 0.871 |
| Reliable change | % | % | n/a | |
| Improvement | n/a | n/a | ||
| No change | n/a | n/a | ||
| Deterioration | n/a | n/a | ||
| Categories | 0.879 | |||
| No depression (04) | 1 | 1 | 0 | |
| Mild depression (5-9) | 5 | 5 | 0 | |
| Moderate depression (10-14) | 23 | 23 | 0 | |
| Moderately severe depression (15-19) | 35 | 35 | 0 | |
| Severe depression (20-27) | 36 | 37 | -1 | |
| Mean (sd) | 17.26 (sd 5.25) | 17.37 (sd 5.28) | 0.728 | |
| Mean of change score (sd) |
All final therapy session
| PHQ-9 depression scale (score 0 to 27, lower score better) | EA group | Matched comparison group | Pp difference | p-value |
|---|---|---|---|---|
| % depression level suggesting caseness | 37 | 41 | -4 | 0.144 |
| Reliable change | % | % | 0.023* | |
| Improvement | 67 | 60 | 7 | |
| No change | 31 | 38 | -7 | |
| Deterioration | 2 | 2 | ) | |
| Categories | 0.327 | |||
| No depression (04) | 25 | 29 | -3 | |
| Mild depression (5-9) | 38 | 30 | 8 | |
| Moderate depression (10-14) | 18 | 16 | 2 | |
| Moderately severe depression (15-19) | 9 | 12 | -3 | |
| Severe depression (20-27) | 9 | 13 | -3 | |
| Mean (sd) | 9.15 (sd 6.23) | 9.68 (sd 6.92) | 0.217 | |
| Mean of change score (sd) | -8.11 (sd 6.35) | -7.70 (sd 6.80) | 0.217 |
On entry to IAPT
| GAD-7 anxiety scale (score 0 to 21, lower score better) | EA group | Matched comparison group | Pp difference | p-value |
|---|---|---|---|---|
| % anxiety levels suggesting caseness | 92 | 93 | -1 | 0.549 |
| Reliable change | % | % | n/a | |
| Improvement | n/a | n/a | ||
| No change | n/a | n/a | ||
| Deterioration | n/a | n/a | ||
| Categories | 0.954 | |||
| No anxiety (0-4) | 1 | 1 | 0 | |
| Mild anxiety (5-9) | 16 | 15 | 0 | |
| Moderate anxiety (10-14) | 28 | 28 | 0 | |
| Severe anxiety (15-21) | 56 | 55 | 0 | |
| Mean (sd) | 14.42 (sd 4.56) | 14.52 (sd 4.60) | 0.726 | |
| Mean of change score (sd) |
All final therapy session
| GAD-7 anxiety scale (score 0 to 21, lower score better) | EA group | Matched comparison group | Pp difference | p-value |
|---|---|---|---|---|
| % anxiety levels suggesting caseness | 39 | 43 | -4 | 0.182 |
| Reliable change | % | % | 0.021* | |
| Improvement | 72 | 65 | 7 | |
| No change | 24 | 31 | -8 | |
| Deterioration | 5 | 4 | 0 | |
| Categories | 0.066 | |||
| No anxiety (0-4) | 33 | 32 | 1 | |
| Mild anxiety (5-9) | 36 | 32 | 4 | |
| Moderate anxiety (10-14) | 17 | 15 | 2 | |
| Severe anxiety (15-21) | 14 | 21 | -7 | |
| Mean (sd) | 7.68 (sd 5.47) | 8.30 (sd 5.29) | 0.080 | |
| Mean of change score (sd) | -6.75 (sd 5.79) | -6.21 (sd 5.87) | 0.080 |
On entry to IAPT
| IAPT post-therapy change scores | EA group | Matched comparison group | Pp difference | p-value |
|---|---|---|---|---|
| % reliable improvement | n/a | n/a | n/a | |
| % recovery | n/a | n/a | n/a | |
| % reliable recovery | n/a | n/a | n/a |
All final therapy session
| IAPT post-therapy change scores | EA group | Matched comparison group | Pp difference | p-value |
|---|---|---|---|---|
| % reliable improvement | 78 | 74 | 4 | 0.140 |
| % recovery | 58 | 55 | 4 | 0.397 |
| % reliable recovery | 55 | 52 | 4 | 0.479 |
On entry to IAPT
| Quality of life outcomes (higher score better) | EA group | Matched comparison group | Pp difference | p-value |
|---|---|---|---|---|
| ReQoLReQoL-UI mean (sd) | 0.699 (sd 0.124) | 0.688 (sd 0.149) | 0.237 | |
| QALY mean (sd) |
All final therapy session
| Quality of life outcomes (higher score better) | EA group | Matched comparison group | Pp difference | p-value |
|---|---|---|---|---|
| ReQoLReQoL-UI mean (sd) | 0.816 (sd 0.106) | 0.803 (sd 0.132) | 0.202 | |
| QALY mean (sd) | 0.304 (0.225) | 0.310 (0.236) | 0.628) |
On entry to IAPT
| Base | EA group | Matched comparison group | Pp difference | p-value |
|---|---|---|---|---|
| Base: all working on entry to IAPT | 486 | 852 |
All final therapy session
| Base | EA group | Matched comparison group | Pp difference | p-value |
|---|---|---|---|---|
| Base: all working on entry to IAPT | 488 | 852 |
Despite the statistically significant results on reliable change on the PHQ-9 and GAD-7 scores, this did not translate into a statistically significant impact of EA support on the IAPT reliable improvement, recovery or reliable recovery measures. Due to the smaller sample sizes for this cohort, the four percentage point difference between the EA support and matched comparison groups for each measure was not significant with a change closer to six percentage points required to reach statistical significance.
There are, in addition, no significant impacts on quality of life as measured by the ReQoL-UI preference scores or QALYs.
For those off sick when they started IAPT, the impacts of seeing an EA were larger when measured at their final session than at the final therapy session. In other words, taking into account the fact that, for some, EA sessions continued after the end of therapy, their outcomes continued to improve, with impacts reaching statistical significance. For instance, while the percentage point impact on the proportion of clients reaching caseness on the PHQ-9 scale was four at the final therapy session, it reached seven by the final session. Likewise, the percentage point impact on case level anxiety measured by the GAD-7 scale rose from four to eight. (See Table D.1 in Appendix D for full results.) However, the fact that we do not observe the comparison period over this period after therapy means that these findings need to be treated with caution, as this continued improvement could be due to natural recovery over time rather than the additional EA support received.
4.3. Impaired functioning
Using the Work and Social Adjustment Scale (WSAS), there were no statistically significant impacts of seeing an EA on the extent to which clients perceived their issues as impairing their ability to function in their daily lives (Tables 4.3 and 4.4).
However, clients who were working or off work sick when they came into IAPT were significantly more likely to perceive that their ability to work was impaired by their issues in their final therapy session if they had seen an EA.
This was measured using a single WSAS item asking clients to rate the extent to which their issues impaired their ability to work, from a scale of 0 to 8 (with 9 ‘not answered’[footnote 45]).[footnote 46]
Those who had seen an EA who were working on entry to IAPT were less likely than their matched comparison group to feel that their issues only ‘slightly’ impaired their ability to work (26 per cent compared to 32 per cent) or did not impair it at all (12 per cent compared to 20 per cent). Similarly, among those off work sick, 21 per cent of those who had seen an EA felt their issues ‘slightly’ impaired their ability to work compared to 32 per cent of the matched comparison group, with percentages reporting ‘not at all’ eight versus 13 per cent. This finding may be explained by a clients’ heightened awareness or acknowledgement of their workplace issues after talking to an EA. That is, the process of seeing an EA leads clients to re-evaluate their current work, and how it could or should be improved, either within the current workplace or by leaving or changing jobs.
Table 4.3 Impact of Employment Advisers on perceived functioning among
those working on entry to IAPT
On entry to IAPT
| Work and Social Adjustment full scale (score 0 to 40, lower score better) | EA group | Matched comparison group | Pp difference | p-value |
|---|---|---|---|---|
| Low impairment (0 to 9) | 11 | 11 | 0 | 0.513 |
| Moderate impairment (10 to 20) | 43 | 43 | 1 | |
| Severe impairment (21 to 40) | 46 | 4 | -1 | |
| Base: all working on entry to IAPT | 1,706 | 11,212 |
At final therapy session
| Work and Social Adjustment full scale (score 0 to 40, lower score better) | EA group | Matched comparison group | Pp difference | p-value |
|---|---|---|---|---|
| Low impairment (0 to 9) | 38 | 41 | -3 | 0.080 |
| Moderate impairment (10 to 20) | 41 | 37 | 4 | |
| Severe impairment (21 to 40) | 21 | 22 | -1 | |
| Base: all working on entry to IAPT | 1,706 | 11,212 |
On entry to IAPT
| Ability to work impaired (score 0 to 8, plus 9 not answered, lower score lower perceived impact) | EA group | Matched comparison group | Pp difference | p-value |
|---|---|---|---|---|
| Not at all (0) | 4 | 4 | 0 | 0.933 |
| Slightly (1 or 2) | 14 | 14 | 0 | |
| Definitely (3 to 5) | 44 | 44 | 0 | |
| Markedly (6 or 7) | 24 | 24 | 0 | |
| Very severely (8) | 9 | 8 | 1 | |
| Not answered (9) | 6 | 6 | 0 | |
| Base: all working on entry to IAPT with individual data on ability to work | 902 | 5,299 |
At final therapy session
| Ability to work impaired (score 0 to 8, plus 9 not answered, lower score lower perceived impact) | EA group | Matched comparison group | Pp difference | p-value |
|---|---|---|---|---|
| Not at all (0) | 12 | 20 | -7 | <0.001* |
| Slightly (1 or 2) | 26 | 32 | -6 | |
| Definitely (3 to 5) | 34 | 29 | 5 | |
| Markedly (6 or 7) | 12 | 9 | 3 | |
| Very severely (8) | 4 | 2 | 1 | |
| Not answered (9) | 12 | 9 | 3 | |
| Base: all working on entry to IAPT with individual data on ability to work | 902 | 5,299 |
Table 4.4 Impact of Employment Advisers on perceived functioning among
those on Statutory Sick Pay on entry to IAPT
On entry to IAPT
| Work and Social Adjustment scale (score 0 to 40, lower score better) | EA group | Matched comparison group | Pp difference | p-value |
|---|---|---|---|---|
| Low impairment (0 to 9) | 5 | 5 | 0 | 0.340 |
| Moderate impairment (10 to 20) | 37 | 34 | ||
| Severe impairment (21 to 40) | 58 | 61 | -3 | |
| Base: all off work sick on entry to IAPT | 488 | 852 |
At final therapy session
| Work and Social Adjustment scale (score 0 to 40, lower score better) | EA group | Matched comparison group | Pp difference | p-value |
|---|---|---|---|---|
| Low impairment (0 to 9) | 36 | 37 | -1 | 0.594 |
| Moderate impairment (10 to 20) | 39 | 34 | 4 | |
| Severe impairment (21 to 40) | 25 | 29 | -4 | |
| Base: all off work sick on entry to IAPT | 488 | 852 |
On entry to IAPT
| Ability to work impaired (score 0 to 8, plus 9 not answered, lower score lower perceived impact) | EA group | Matched comparison group | Pp difference | p-value |
|---|---|---|---|---|
| Not at all (0) | 1 | 1 | 0 | 0.990 |
| Slightly (1 or 2) | 2 | 1 | 0 | |
| Definitely (3 to 5) | 19 | 19 | 0 | |
| Markedly (6 or 7) | 33 | 36 | -2 | |
| Very severely (8) | 39 | 36 | 3 | |
| Not answered (9) | 6 | 7 | 0 | |
| Base: all off work sick on entry to IAPT with individual data on ability to work | 263 | 349 |
At final therapy session
| Ability to work impaired (score 0 to 8, plus 9 not answered, lower score lower perceived impact) | EA group | Matched comparison group | Pp difference | p-value |
|---|---|---|---|---|
| Not at all (0) | 8 | 13 | -5 | 0.019* |
| Slightly (1 or 2) | 21 | 32 | -11 | |
| Definitely (3 to 5) | 29 | 22 | 7 | |
| Markedly (6 or 7) | 15 | 11 | 4 | |
| Very severely (8) | 12 | 10 | 2 | |
| Not answered (9) | 15 | 11 | 3 | |
| Base: all off work sick on entry to IAPT with individual data on ability to work | 263 | 349 |
4.4. Employment status and benefit receipt
Among IAPT clients who were working when they came into the service, seeing an EA was associated with a statistically significant drop in the percentage of clients employed at the end of IAPT. Those seeing an EA were also significantly more likely to be in receipt of SSP at this point (Table 4.5).
At the final session, 88 per cent of clients who had seen an EA were reported as employed, compared to 93 per cent in the matched comparison group. They were more likely than the matched comparison group to report being unemployed (nine per cent compared to three per cent). Thus, it appears that although seeing an EA was more likely to result in a client leaving their work, they remained actively looking to re-enter the labour market. However, among those employed when they came into IAPT, it seems that seeing an EA increased the propensity for clients who were employed at the final session to be off sick: seven per cent of clients who had seen an EA were in receipt of SSP at the final session compared to three per cent of the matched comparison group.
Table 4.5 Impact of Employment Advisers on employment status and SSP of
those working on entry to IAPT
At final session
| Working status | EA group (%) | Matched comparison group (%) | Pp difference | p-value |
|---|---|---|---|---|
| Working | 88 | 93 | -5 | 0.000* |
| Base: all in work on entry to IAPT | 1,706 | 11,212 |
| Employment status | EA group (%) | Matched comparison group (%) | Pp difference | p-value |
|---|---|---|---|---|
| Working | 88 | 93 | -5 | 0.000* |
| Long-term sick or disabled | 1 | 1 | 0 | |
| Unemployed | 9 | 3 | 6 | |
| Other | 2 | 3 | -1 | |
| Base: all in work on entry to IAPT | 1,706 | 11,212 |
| Employment status | EA group (%) | Matched comparison group (%) | Pp difference | p-value |
|---|---|---|---|---|
| On SSP | 7 | 3 | 4 | <0.001* |
| Base: all in work on entry to IAPT | 1,706 | 11,212 |
Considering this finding alongside the finding that seeing an EA was also associated with clients perceiving their issues as affecting their ability to work (see Section 4.3), might suggest that the EA sessions can lead to a heightened awareness of negative associations between work – or their current job - and their mental health issues. Seeing an EA may lead to a decision to leave their current job, either to take time out or to look for another job.[footnote 47] Whatever the mechanism, it is important to note that this movement out of employment was not associated with any negative impacts on the mental health of those who saw an EA (Table 4.1).
This is mirrored in the DWP data on clients’ benefit receipt both a year and 18 months after they entered the IAPT service. Clients who had seen an EA were statistically significantly more likely to be in receipt of out of work benefits[footnote 48] than clients in the matched comparison group 12 and 18 months after starting IAPT (Table 4.6). Twelve months after clients started IAPT, there was a four percentage point difference between the percentage receipt among clients who saw an EA and the matched comparison group (12 per cent versus eight per cent). By 18 months the comparative figures were 11 and eight per cent (a three-percentage point difference). The differences between those seeing an EA and the matched comparison group were statistically significant in relation both to unemployment benefits[footnote 49] and other out of work benefits. The impact of seeing an EA was also statistically significant in relation to the mean number of weeks’ receipt of each of these benefit types.
There is also evidence that clients who had seen an EA were more likely than their matched comparison group to be claiming a disability benefit.[footnote 50]
At 12 months, the mean number of weeks’ receipt of disability benefit among those seeing an EA was statistically significantly higher than among the matched comparison group (2.28 (sd 10.11) versus 1.84 (sd 9.34)). After 18 months, both the percentage of clients in receipt of disability benefits (six per cent versus five per cent) and the difference between the mean number of weeks (3.92 (sd 15.96) versus 3.35 (sd 15.21) are statistically significant. Given disability benefits can be received alongside out of work benefits, this may reflect EAs providing education and advice about benefits that IAPT clients were eligible to receive and increasing clients’ confidence in applying for these.
Table C.1 in Appendix C provides a more granular map of clients’ benefit receipt from their assessment then 13, 26, 39 and (replicating the figures in Table 4.6) 52 weeks later. It seems that the impact of receipt of out of work benefits started relatively early in the process and that those clients who saw an EA were significantly more likely to leave their work within the first 13 weeks of therapy. Clients who were working when they started IAPT were statistically significantly more likely to be in receipt of unemployment or other out of work benefits after 13 weeks and continued to be at each of the subsequent time points.
Table 4.6 Impact of Employment Advisers on benefit receipt at 12 and 18 months among those working on entry to IAPT[footnote 51]
On entry to IAPT
| Any out of work benefit | EA group | Matched comparison group | Pp difference | p-value |
|---|---|---|---|---|
| % in receipt | 4 | 4 | 0 | 0.609 |
| Mean weeks receipt (sd) | 1.95 (sd 8.54) | 1.97 (sd 8.50) | 0.937 |
| Unemployment benefit | EA group | Matched comparison group | Pp difference | p-value |
|---|---|---|---|---|
| % in receipt | 2 | 1 | 0 | 0.600 |
| Mean weeks receipt (sd) | 0.78 (sd 4.98) | 0.67 (sd 4.37) | 0 | 0.437 |
| Other out of work benefit | EA group | Matched comparison group | Pp difference | p-value |
|---|---|---|---|---|
| % in receipt | 3 | 3 | 0 | 0.827 |
| Mean weeks receipt (sd) | 1.17 (sd 6.42) | 1.30 (sd 6.82) | 0.494 |
| Disability benefit | EA group | Matched comparison group | Pp difference | p-value |
|---|---|---|---|---|
| % in receipt | 3 | 3 | 0 | 0.662 |
| Mean weeks receipt (sd) | 1.43 (sd 8.30) | 1.41 (sd 8.27) | 0.940 |
| Any other benefits | EA group | Matched comparison group | Pp difference | p-value |
|---|---|---|---|---|
| % in receipt | 7 | 7 | 0 | 0.896 |
| Mean weeks receipt (sd) | 3.15 (sd 11.32) | 3.03 (sd 11.03) | 0.707 |
| Base: all work on entry to IAPT | EA group: 1,706, Matched comparison group: 11,212 |
At 52 weeks
| Any out of work benefit | EA group | Matched comparison group | Pp difference | p-value |
|---|---|---|---|---|
| % in receipt | 12 | 8 | 4 | <0.001* |
| Mean weeks receipt (sd) | 4.65 (sd 12.12) | 3.17 (sd 10.28) | <0.001* |
| Unemployment benefit | EA group | Matched comparison group | Pp difference | p-value |
|---|---|---|---|---|
| % in receipt | 6 | 4 | 2 | <0.001* |
| Mean weeks receipt (sd) | 2.26 (sd 7.86) | 1.34 (sd 6.01) | <0.001* |
| Other out of work benefit | EA group | Matched comparison group | Pp difference | p-value |
|---|---|---|---|---|
| % in receipt | 6 | 4 | 1 | 0.002* |
| Mean weeks receipt (sd) | 2.39 (sd 8.39) | 1.83 (sd 7.73) | <0.001* |
| Disability benefit | EA group | Matched comparison group | Pp difference | p-value |
|---|---|---|---|---|
| % in receipt | 5 | 4 | 1 | 0.095 |
| Mean weeks receipt (sd) | 2.28 (sd 10.11) | 1.84 (sd 9.34) | <0.001* |
| Any other benefits | EA group | Matched comparison group | Pp difference | p-value |
|---|---|---|---|---|
| % in receipt | 15 | 11 | 5 | <0.001* |
| Mean weeks receipt (sd) | 6.23 (sd 14.63) | 4.52 (sd 12.90) | <0.001* |
| Base: all work on entry to IAPT | EA group: 1,706, Matched comparison group: 11,212 |
At 78 weeks
| Any out of work benefit | EA group | Matched comparison group | Pp difference | p-value |
|---|---|---|---|---|
| % in receipt | 11 | 8 | 3 | <0.001* |
| Mean weeks receipt (sd) | 7.36 (sd 17.90) | 5.20 (sd 15.50) | <0.001* |
| Unemployment benefit | EA group | Matched comparison group | Pp difference | p-value |
|---|---|---|---|---|
| % in receipt | 6 | 4 | 2 | <0.001* |
| Mean weeks receipt (sd) | 3.52 (sd 11.29) | 2.21 (sd 8.87) | <0.001* |
| Other out of work benefit | EA group | Matched comparison group | Pp difference | p-value |
|---|---|---|---|---|
| % in receipt | 5 | 4 | 1 | 0.015* |
| Mean weeks receipt (sd) | 3.85 (sd 12.68) | 2.99 (sd 11.69) | <0.001* |
| Disability benefit | EA group | Matched comparison group | Pp difference | p-value |
|---|---|---|---|---|
| % in receipt | 6 | 5 | 1 | 0.045* |
| Mean weeks receipt (sd) | 3.92 (sd 15.96) | 3.35 (sd 15.21) | <0.001* |
| Any other benefits | EA group | Matched comparison group | Pp difference | p-value |
|---|---|---|---|---|
| % in receipt | 15 | 12 | 4 | <0.001* |
| Mean weeks receipt (sd) | 10.02 (sd 22.01) | 7.63 (sd 20.07) | <0.001* |
| Base: all work on entry to IAPT | EA group: 1,397, Matched comparison group: 10,716 |
As with those who were working when they came into the service, clients off work sick who saw an EA were more likely than the matched comparison group to report being unemployed by the final session (11 per cent versus five per cent) (Table 4.7).
However, unlike for those working at the start of IAPT, there as no statistically significant impact on the percentage of clients who report working by the final session. There was a two percentage point difference between those who had or had not seen an EA, both in the percentages in work, and in the percentages on SSP. Rather, the statistically significant impact of seeing an EA on clients’ employment status by the final session is driven by clients being less likely to report either being in work or long-term sick or disabled. Given employment status was reliant on clients’ self-report, this could suggest that, for some, seeing an EA resulted in a greater likelihood of feeling able to actively seek work.
Table 4.7 Impact of Employment Advisers on employment status and SSP of
those on Statutory Sick Pay on entry to IAPT
At final session
| Employment status | EA group (%) | Matched comparison group (%) | Pp difference | p-value |
|---|---|---|---|---|
| Working | 84 | 86 | -2 | 0.314 |
| Employment status | EA group (%) | Matched comparison group (%) | Pp difference | p-value |
|---|---|---|---|---|
| Working | 84 | 86 | -2 | 0.003* |
| Long-term sick or disabled | 3 | 5 | -3 | |
| Unemployed | 11 | 5 | 6 | |
| Other | 2 | 3 | -1 |
| Employment status | EA group (%) | Matched comparison group (%) | Pp difference | p-value |
|---|---|---|---|---|
| On SSP | 18 | 20 | -2 | 0.505 |
Base: all off work sick on entry to IAPT EA group: 488, Matched comparison group: 852.
In terms of how this translated into benefit receipt a year after clients entered the IAPT service, the pattern in relation to out of work benefits was very similar to that for clients who were working when they entered IAPT.
After 12 months, clients who had seen an EA were statistically significantly more likely to be in receipt of out of work benefits than clients in the matched comparison (Table 4.8).
Twelve months after clients started IAPT, there was a six-percentage point difference between the percentage receipt among clients who saw an EA and the matched comparison group (17 per cent versus 11 per cent). The differences between those seeing an EA and the matched comparison group were statistically significant after 12 months, in relation both to unemployment benefits[footnote 52] and other out of work 52 Jobseeker’s Allowance or Universal Credit with searching for work conditionality, received by those actively seeking work. benefits.[footnote 53] The impact of seeing an EA was also statistically significant in relation to the mean number of weeks’ receipt of each of these benefit types.
Table C.2 in Appendix C provides a more granular map of clients’ benefit receipt from their assessment then 13, 26, 39 and (replicating the figures in Table 4.8) 52 weeks later. The impact of EA support on receipt of out of work benefits started somewhat later for this group, compared to those who were working when they started IAPT. Comparing those on SSP who did and did not see an EA, there was no statistically significant difference in the percentages receiving out of work benefits after 13 weeks. However, there was a statistically significant difference in the percentages in receipt of unemployment benefits by 26 weeks (the average length of IAPT therapy in this study).
However, by 18 months after the start of IAPT, for clients off work sick when they began IAPT, seeing an EA was no longer associated with being more likely to be claiming unemployment benefit. The mean number of weeks’ receipt was still statistically significant, but the percentage in receipt at the 18-month point was five per cent among those who had seen an EA and the matched comparison group.
Although those who had seen an EA were more likely than the matched comparison group to be on disability benefits 12 and 18 months after starting IAPT, these differences were not statistically significant.
Table 4.8 Impact of Employment Advisers on benefit receipt at 12 and 18 months among those on Statutory Sick Pay on entry to IAPT[footnote 54]
On entry to IAPT
| Any out of work benefit | EA group | Matched comparison group | Pp difference | p-value |
|---|---|---|---|---|
| % in receipt | 6 | 7 | 0 | 0.123 |
| Mean weeks receipt (sd) | 1.39 (sd 6.71) | 1.95 (sd 7.91) | 0 | 0.205 |
| Unemployment benefit | EA group | Matched comparison group | Pp difference | p-value |
|---|---|---|---|---|
| % in receipt | 1 | 2 | -1 | 0.532 |
| Mean weeks receipt (sd) | 0.23 (sd 1.73) | 0.38 (sd 2.44) | 0.145 |
| Other out of work benefit | EA group | Matched comparison group | Pp difference | p-value |
|---|---|---|---|---|
| % in receipt | 5 | 5 | 0 | 0.199 |
| Mean weeks receipt (sd) | 1.16 (sd 6.21) | 1.57 (sd 7.08) | 0.320 |
| Disability benefit | EA group | Matched comparison group | Pp difference | p-value |
|---|---|---|---|---|
| % in receipt | 6 | 5 | 0 | 0.579 |
| Mean weeks receipt (sd) | 2.11 (sd 9.87) | 2.06 (sd 9.35) | 0.938 |
| Any other benefits | EA group | Matched comparison group | Pp difference | p-value |
|---|---|---|---|---|
| % in receipt | 10 | 11 | 0 | 0.142 |
| Mean weeks receipt (sd) | 3.19 (sd 11.23) | 3.56 (sd 11.26) | 0.610 |
| Base: all work on entry to IAPT | EA group: 488, Matched comparison group: 852 |
At 52 weeks
| Any out of work benefit | EA group | Matched comparison group | Pp difference | p-value |
|---|---|---|---|---|
| % in receipt | 17 | 11 | 6 | <0.001* |
| Mean weeks receipt (sd) | 6.75 (sd 13.82) | 4.87 (sd 12.58) | <0.001* |
| Unemployment benefit | EA group | Matched comparison group | Pp difference | p-value |
|---|---|---|---|---|
| % in receipt | 7 | 3 | 3 | <0.001* |
| Mean weeks receipt (sd) | 2.69 (sd 8.17) | 1.72 (sd 6.50) | 0.003* |
| Other out of work benefit | EA group | Matched comparison group | Pp difference | p-value |
|---|---|---|---|---|
| % in receipt | 10 | 7 | 3 | 0.035* |
| Mean weeks receipt (sd) | 4.06 (sd 10.58) | 3.15 (sd 10.00) | <0.030* |
| Disability benefit | EA group | Matched comparison group | Pp difference | p-value |
|---|---|---|---|---|
| % in receipt | 10 | 9 | 2 | 0.275 |
| Mean weeks receipt (sd) | 4.46 (sd 13.79) | 4.01 (sd 13.14) | <0.369 |
| Any other benefits | EA group | Matched comparison group | Pp difference | p-value |
|---|---|---|---|---|
| % in receipt | 23 | 17 | 6 | <0.001* |
| Mean weeks receipt (sd) | 9.83 (sd 17.58) | 7.59 (sd 16.39) | <0.001* |
| Base: all work on entry to IAPT | EA group: 488, Matched comparison group: 852 |
At 78 weeks
| Any out of work benefit | EA group | Matched comparison group | Pp difference | p-value |
|---|---|---|---|---|
| % in receipt | 15 | 11 | 4 | <0.047* |
| Mean weeks receipt (sd) | 10.67 (sd 20.56) | 7.32 (sd 18.30) | <0.001* |
| Unemployment benefit | EA group | Matched comparison group | Pp difference | p-value |
|---|---|---|---|---|
| % in receipt | 5 | 5 | 0 | <0.705 |
| Mean weeks receipt (sd) | 3.84 (sd 10.87) | 2.43 (sd 8.85) | 0.009* |
| Other out of work benefit | EA group | Matched comparison group | Pp difference | p-value |
|---|---|---|---|---|
| % in receipt | 10 | 6 | 4 | 0.016* |
| Mean weeks receipt (sd) | 6.83 (sd 16.83) | 4.88 (sd 15.30) | 0.016* |
| Disability benefit | EA group | Matched comparison group | Pp difference | p-value |
|---|---|---|---|---|
| % in receipt | 11 | 9 | 3 | 0.081 |
| Mean weeks receipt (sd) | 7.62 (sd 21.80) | 6.05 (sd 19.73) | 0.115 |
| Any other benefits | EA group | Matched comparison group | Pp difference | p-value |
|---|---|---|---|---|
| % in receipt | 22 | 17 | 5 | <0.015* |
| Mean weeks receipt (sd) | 15.53 (sd 26.61) | 11.46 (sd 24.41) | <0.001* |
| Base: all work on entry to IAPT | EA group: 411, Matched comparison group: 723 |
5. Impacts on those out of work on entry to Improving Access to Psychological Therapies
5.1. Overview
This chapter reports the impacts of seeing an Employment Adviser (EA) as part of Steps2Wellbeing Improving Access to Psychological Therapies (IAPT) among IAPT clients who were out of work (e.g. unemployed or long-term sick or disabled) when they entered the service.[footnote 55] The impact of seeing an EA is measured by comparing the post-therapy outcomes of clients who saw an EA against those of a matched comparison group of IAPT clients who did not.
For those who were out of work when they entered IAPT, seeing an EA had a positive impact, both on their mental health and on the likelihood of them entering the labour market.
There is strong and consistent statistically significant evidence that IAPT clients who were out of work when they started and saw an EA had better mental health outcomes – in relation to both depression and anxiety – than the matched comparison group who had not seen an EA when they left the service.
Although seeing an EA did not significantly impact on clients’ daily functioning overall, it did significantly reduce the likelihood of them perceiving that their issues affected their ability to work and increased the likelihood of them being in work.
Moreover, the evidence is that seeing an EA increased the propensity for these clients to be actively engaged in the labour market: they were more likely than their matched comparison group to report being unemployed – and conversely less likely to report being long-term sick or disabled – at the final session. This is reflected in those who saw an EA being significantly more likely to be in receipt of unemployment benefits one year later.
The following sections present these results in more detail, reporting first on the impacts of seeing an EA on clients’ mental health, followed by the impacts on levels of impaired functioning, employment status and benefit receipt.
5.2. Mental health
Among those who were out of work when they came into IAPT, there is statistically significant evidence that seeing an EA had a positive impact on their mental health (Table 5.1).
Nine in ten IAPT clients entered the service with levels of depression (93 per cent, as measured by the Patient Health Questionnaire (PHQ-9) and/or anxiety (91 per cent, measured using Generalised Anxiety Disorder Assessment (GAD-7) suggestive of caseness.[footnote 56] While these percentages dropped to around half by the final therapy session in both groups, the improvement was greatest among those who had seen an EA. For instance, 50 per cent of those who had seen an EA had PHQ-9 depression score reaching caseness at the final therapy session compared to 56 per cent of those in the matched comparison group. The differences between the two groups within the categories of depression, show the clients who had seen an EA were more likely to report ‘mild depression’ than the matched comparison group and less likely to report higher levels of depression.[footnote 57] Just over half (53 per cent) of clients who saw an EA experienced reliable improvement in their PHQ-9 depression score (an improvement of six or more points) compared to 45 per cent among the matched comparison group.
The pattern was similar but less pronounced in relation to clients’ anxiety levels measured by the GAD-7 scale. While the percentage of clients whose anxiety reached caseness at the final therapy session was not statistically significant between those who had seen an EA and those who had not, those who had seen an EA were statistically significantly more likely to have seen reliable improvement[footnote 58] in their anxiety levels (a change of four or more points on the scale) and to experience mild rather than more severe levels of anxiety.[footnote 59]
The statistically significant impacts on reliable change[footnote 60] for the two scores resulted in a positive significant impact of EA support on clients’ IAPT reliable improvement scores. Two thirds (66 per cent) of those who had seen an EA experienced a reliable improvement in their mental health compared to 59 per cent of those in the matched comparison group. Although the percentage point differences were in the same positive direction in relation to clients’ recovery rates or reliable recovery rates, these were not statistically significant.[footnote 61]
In line with these findings, there was a positive impact on the ReQoL-UI preference scores, the mean at the final therapy session being 0.796[footnote 62] for the EA group and 0.782 for the matched comparison group, a difference of 0.014. This did not, however, translate into a significant difference in Quality Adjusted Life Years (QALYs). The mean QALY for the EA group for the period of treatment (which averages 175 days) was 0.359, and just slightly lower at 0.356 for the matched comparison group, a difference of just 0.003.[footnote 63]
Table 5.1 Impact of Employment Advisers on mental health of those out of
work on entry to IAPT
On entry to IAPT
| PHQ-9 depression scale (score 0 to 27, lower score better) | EA group | Matched comparison group | Pp difference | p-value |
|---|---|---|---|---|
| % depression level suggesting caseness | 93 | 93 | 0 | 0.917 |
| Reliable change | % | % | n/a | |
| Improvement | n/a | n/a | ||
| No change | n/a | n/a | ||
| Deterioration | n/a | n/a | ||
| Categories | 0.805 | |||
| No depression (04) | 1 | 2 | 0 | |
| Mild depression (5-9) | 6 | 6 | 0 | |
| Moderate depression (10-14) | 26 | 25 | 1 | |
| Moderately severe depression (15-19) | 31 | 32 | -1 | |
| Severe depression (20-27) | 36 | 36 | 0 | |
| Mean (sd) | 17.11 (sd 5.15) | 17.07 (sd 5.27) | 0.833 | |
| Mean of change score (sd) |
At final therapy session
| PHQ-9 depression scale (score 0 to 27, lower score better) | EA group | Matched comparison group | Pp difference | p-value |
|---|---|---|---|---|
| % depression level suggesting caseness | 50 | 56 | -6 | 0.003* |
| Reliable change | % | % | <0.001* | |
| Improvement | 53 | 45 | 8 | |
| No change | 43 | 51 | -8 | |
| Deterioration | 4 | 4 | 0 | |
| Categories | 0.002* | |||
| No depression (04) | 17 | 17 | 0 | |
| Mild depression (5-9) | 33 | 27 | 6 | |
| Moderate depression (10-14) | 20 | 20 | -1 | |
| Moderately severe depression (15-19) | 17 | 19 | -2 | |
| Severe depression (20-27) | 13 | 17 | -4 | |
| Mean (sd) | 11.07 (sd 6.59) | 11.85 (sd 6.97) | 0.002* | |
| Mean of change score (sd) | -6.04 (sd 6.49) | -5.22 (sd 6.48) | 0.002* |
On entry to IAPT
| GAD-7 anxiety scale (score 0 to 21, lower score better) | EA group | Matched comparison group | Pp difference | p-value |
|---|---|---|---|---|
| % anxiety levels suggesting caseness | 91 | 91 | -1 | 0.602 |
| Reliable change | % | % | n/a | |
| Improvement | n/a | n/a | ||
| No change | n/a | n/a | ||
| Deterioration | n/a | n/a | ||
| Categories | 0.999 | |||
| No anxiety (0-4) | 2 | 2 | 0 | |
| Mild anxiety (5-9) | 15 | 15 | 0 | |
| Moderate anxiety (10-14) | 34 | 34 | 0 | |
| Severe anxiety (15-21) | 49 | 49 | 0 | |
| Mean (sd) | 13.99 (sd 4.54) | 13.99 (sd 4.52) | 0.999 | |
| Mean of change score (sd) |
All final therapy session
| GAD-7 anxiety scale (score 0 to 21, lower score better) | EA group | Matched comparison group | Pp difference | p-value |
|---|---|---|---|---|
| % anxiety levels suggesting caseness | 53 | 57 | -3 | 0.096 |
| Reliable change | % | % | <0.031* | |
| Improvement | 54 | 50 | 4 | |
| No change | 40 | 42 | -2 | |
| Deterioration | 6 | 8 | -2 | |
| Categories | 0.059* | |||
| No anxiety (0-4) | 21 | 21 | 0 | |
| Mild anxiety (5-9) | 37 | 30 | 7 | |
| Moderate anxiety (10-14) | 19 | 24 | -4 | |
| Severe anxiety (15-21) | 23 | 26 | -3 | |
| Mean (sd) | 9.41 (sd 5.70) | 9.93 (sd 5.98) | 0.018* | |
| Mean of change score (sd) | -4.58 (sd 5.67) | -4.06 (sd 5.68) | 0.018* |
On entry to IAPT
| IAPT post-therapy change scores | EA group | Matched comparison group | Pp difference | p-value |
|---|---|---|---|---|
| % reliable improvement | n/a | n/a | n/a | |
| % recovery | n/a | n/a | n/a | |
| % reliable recovery | n/a | n/a | n/a |
All final therapy session
| IAPT post-therapy change scores | EA group | Matched comparison group | Pp difference | p-value |
|---|---|---|---|---|
| % reliable improvement | 66 | 59 | 7 | 0.002* |
| % recovery | 41 | 37 | 3 | 0.097 |
| % reliable recovery | 38 | 35 | 3 | 0.141 |
On entry to IAPT
| Quality of life outcomes (higher score better) | EA group | Matched comparison group | Pp difference | p-value |
|---|---|---|---|---|
| ReQoLReQoL-UI mean (sd) | 0.711 (sd 0.127) | 0.709 (sd 0.134) | 0.714 | |
| QALY mean (sd) |
All final therapy session
| Quality of life outcomes (higher score better) | EA group | Matched comparison group | Pp difference | p-value |
|---|---|---|---|---|
| ReQoLReQoL-UI mean (sd) | 0.796 (sd 0.113) | 0.782 (sd 0.132) | 0.003* | |
| QALY mean (sd) | 0.359 (sd 0.241) | 0.356 (sd 0.238) | 0.851) |
On entry to IAPT
| Base | EA group | Matched comparison group | Pp difference | p-value |
|---|---|---|---|---|
| Base: all working on entry to IAPT | 733 | 5,907 |
All final therapy session
| Base | EA group | Matched comparison group | Pp difference | p-value |
|---|---|---|---|---|
| Base: all working on entry to IAPT | 733 | 5,907 |
5.3. Impaired functioning
Using the Work and Social Adjustment Scale (WSAS), there were no statistically significant impacts of seeing an EA on the extent to which clients perceive their issues as impairing their ability to function in their daily lives (Table 5.2). However, the pattern of non-significant results was largely positive, with those who had seen an EA more likely to report only moderate impairment and less likely to report severe impairment.
However, clients who were out of work when they came into IAPT were significantly less likely if they had seen an EA to perceive that their ability to work was ‘severely impaired’ by their issues or to not answer the item[footnote 64] in their final therapy session.
This was measured using a single WSAS item, asking clients to rate the extent to which their issues impaired their ability to work.[footnote 65]
Those who had seen an EA who were out of work, were more likely than their matched comparison group to feel that their issues ‘slightly’ to ‘markedly’ impaired their ability to work. The positive impact of seeing an EA appeared to be in reducing ‘severe’ impairment (26 per cent compared to 32 per cent) or feeling unable to answer the question (37 per cent compared 42 per cent). However, they were also less likely to report having no issues at all regarding their ability to work (six per cent of those seeing an EA compared to nine per cent of those in the matched comparison group).
Table 5.2 Impact of Employment Advisers on perceived functioning among
those out of work on entry to IAPT
On entry to IAPT
| Work and Social Adjustment scale (score 0 to 40, lower score better) | EA group | Matched comparison group | Pp difference | p-value |
|---|---|---|---|---|
| Low impairment (0 to 9) | 7 | 9 | -2 | 0.939 |
| Moderate impairment (10 to 20) | 35 | 33 | 2 | |
| Severe impairment (21 to 40) | 57 | 58 | -1 | |
| Base: all out of work on entry to IAPT | 733 | 5,907 |
At final therapy session
| Work and Social Adjustment scale (score 0 to 40, lower score better) | EA group | Matched comparison group | Pp difference | p-value |
|---|---|---|---|---|
| Low impairment (0 to 9) | 25 | 26 | -1 | 0.279 |
| Moderate impairment (10 to 20) | 39 | 35 | 4 | |
| Severe impairment (21 to 40) | 36 | 39 | -3 | |
| Base: all out of work on entry to IAPT | 733 | 5,907 |
On entry to IAPT
| Ability to work impaired (score 0 to 8, plus 9 not answered, lower score better) | EA group | Matched comparison group | Pp difference | p-value |
|---|---|---|---|---|
| Not at all (0) | 1 | 2 | 0 | 0.994 |
| Slightly (1 or 2) | 5 | 5 | 1 | |
| Definitely (3 to 5) | 17 | 17 | 0 | |
| Markedly (6 or 7) | 27 | 26 | 1 | |
| Very severely (8) | 17 | 18 | 0 | |
| Not answered (9) | 32 | 33 | -1 | |
| Base: all out of work on entry to IAPT with individual data on ability to work | 357 | 2,675 |
At final therapy session |
| Ability to work impaired (score 0 to 8, plus 9 not answered, lower score better) | EA group | Matched comparison group | Pp difference | p-value |
|---|---|---|---|---|
| Not at all (0) | 6 | 9 | -2 | 0.037* |
| Slightly (1 or 2) | 15 | 12 | 4 | |
| Definitely (3 to 5) | 18 | 15 | 4 | |
| Markedly (6 or 7) | 15 | 12 | 3 | |
| Very severely (8) | 9 | 12 | -3 | |
| Not answered (9) | 37 | 42 | -5 | |
| Base: all out of work on entry to IAPT with individual data on ability to work | 357 | 2,675 |
5.4. Employment status and benefit receipt
Among IAPT clients who were out of work when they came into the service, seeing an EA was associated with a statistically significant increase in the percentage of clients in work at the end of IAPT (Table 5.3).
At the final session, 26 per cent of clients who had seen an EA were reported as working, compared to 21 per cent in the matched comparison group. They were also more likely than the matched comparison group to report being unemployed (48 per cent compared to 34 per cent). Thus, it appears that seeing an EA was likely to result in a client being active in the labour market either through working or looking for work.
Table 5.3 Impact of Employment Advisers on IAPT clients’ employment status
and conditions among those out of work on entry to IAPT
At final session
| Employment status | EA group (%) | Matched comparison group (%) | Pp difference | p-value |
|---|---|---|---|---|
| Working | 26 | 21 | 5 | 0.004* |
| Employment status | EA group (%) | Matched comparison group (%) | Pp difference | p-value |
|---|---|---|---|---|
| Working | 26 | 21 | 5 | <0.001* |
| Long-term sick or disabled | 13 | 23 | -10 | |
| Unemployed | 48 | 34 | 14 | |
| Other | 13 | 22 | -9 |
| Employment status | EA group (%) | Matched comparison group (%) | Pp difference | p-value |
|---|---|---|---|---|
| On SSP | 1 | 2 | -1 | 0.160 |
| Base: all out of work on entry to IAPT | 733 | 5,907 |
The shift towards clients reporting themselves as unemployed is mirrored in the benefits data. Both after a year and after 18 months after clients entered the IAPT service, clients who had seen an EA were statistically significantly more likely to be in receipt of unemployment benefits[footnote 66] than clients in the matched comparison (Table 5.4).
Twelve months after clients started IAPT, there was a three-percentage point difference between the percentage receipt of unemployment benefit among clients who had seen an EA and the matched comparison group (18 per cent versus 15 per cent). After 18 months, the percentage point difference had increased to four. The impact of seeing an EA was also statistically significant in relation to the mean number of weeks’ receipt of unemployment benefit at both time points.
The self-reported economic status of clients at the end of IAPT is also reflected in the DWP benefits data on receipt of disability benefits.[footnote 67] There is evidence at 12 months that clients who were out of work on entry to IAPT and had seen an EA, were statistically significantly less likely than their matched comparison group to be claiming a disability benefit. A year after starting IAPT, 17 per cent of those who had seen an EA and 20 per cent of those in the matched comparison group were in receipt of a disability benefits. The mean number of weeks’ receipt of disability benefit among those seeing an EA was statistically significantly lower than among the matched comparison group (8.70 (sd 18.95) versus 9.34 (sd 19.38)). The difference at 18 months was not statistically significant.
Table C.3 in Appendix C provides a more granular map of clients’ benefit receipt from their assessment then 13, 26, 39 and (replicating the figures in Table 5.4) 52 weeks later. It seems that the impact of receipt of unemployment benefits started relatively early in the process. Clients who were out of work when they started IAPT were statistically significantly more likely to be in receipt of unemployment after 13 weeks and continued to be at each of the subsequent time points. This likely reflects the EAs giving advice and encouragement to clients to claim benefits to which they were entitled.
Table 5.4 Impact of Employment Advisers on benefit receipt after 12 and 18 months among those out of work on entry to IAPT[footnote 68]
On entry to IAPT
| Any out of work benefit | EA group | Matched comparison group | Pp difference | p-value |
|---|---|---|---|---|
| % in receipt | 44 | 45 | -1 | 0.939 |
| Mean weeks receipt (sd) | 17.31 (sd 21.78) | 17.92 (sd 22.09) | 0.487 |
| Unemployment benefit | EA group | Matched comparison group | Pp difference | p-value |
|---|---|---|---|---|
| % in receipt | 22 | 23 | 0 | 0.619 |
| Mean weeks receipt (sd) | 7.04 (sd 14.61) | 7.24 (sd 14.78) | 0 | 0.739 |
| Other out of work benefit | EA group | Matched comparison group | Pp difference | p-value |
|---|---|---|---|---|
| % in receipt | 21 | 21 | -1 | 0.642 |
| Mean weeks receipt (sd) | 10.28 (sd 19.00) | 10.68 (sd 19.31) | 0.586 |
| Disability benefit | EA group | Matched comparison group | Pp difference | p-value |
|---|---|---|---|---|
| % in receipt | 15 | 15 | 0 | 0.943 |
| Mean weeks receipt (sd) | 6.75 (sd 17.04) | 6.74 (sd 16.89) | 0.979 |
| Any other benefits | EA group | Matched comparison group | Pp difference | p-value |
|---|---|---|---|---|
| % in receipt | 49 | 50 | -1 | 0.824 |
| Mean weeks receipt (sd) | 19.79 (sd 22.85) | 20.26 (sd 22.91) | 0.603 |
Base: all work on entry to IAPT, EA group: 733, Matched comparison group: 5,907
At 52 weeks
| Any out of work benefit | EA group | Matched comparison group | Pp difference | p-value |
|---|---|---|---|---|
| % in receipt | 42 | 40 | 2 | <0.049* |
| Mean weeks receipt (sd) | 23.49 (sd 22.99) | 22.20 (sd 23.38) | <0.002* |
| Unemployment benefit | EA group | Matched comparison group | Pp difference | p-value |
|---|---|---|---|---|
| % in receipt | 18 | 15 | 3 | <0.012* |
| Mean weeks receipt (sd) | 11.22 (sd 17.93) | 9.26 (sd 16.87) | <0.001* |
| Other out of work benefit | EA group | Matched comparison group | Pp difference | p-value |
|---|---|---|---|---|
| % in receipt | 24 | 25 | -1 | 0.880 |
| Mean weeks receipt (sd) | 12.27 (sd 19.81) | 12.95 (sd 20.51) | 0.641 |
| Disability benefit | EA group | Matched comparison group | Pp difference | p-value |
|---|---|---|---|---|
| % in receipt | 17 | 20 | -2 | 0.011* |
| Mean weeks receipt (sd) | 8.70 (sd 18.95) | 9.34 (sd 19.38) | 0.039* |
| Any other benefits | EA group | Matched comparison group | Pp difference | p-value |
|---|---|---|---|---|
| % in receipt | 50 | 48 | 2 | 0.093 |
| Mean weeks receipt (sd) | 26.84 (sd 23.43) | 25.77 (sd 23.92) | <0.006* |
Base: all work on entry to IAPT, EA group: 733, Matched comparison group: 5,907
At 78 weeks
| Any out of work benefit | EA group | Matched comparison group | Pp difference | p-value |
|---|---|---|---|---|
| % in receipt | 40 | 37 | 3 | <0.064 |
| Mean weeks receipt (sd) | 33.21 (sd 33.14) | 31.48 (sd 34.03) | <0.034* |
| Unemployment benefit | EA group | Matched comparison group | Pp difference | p-value |
|---|---|---|---|---|
| % in receipt | 17 | 13 | 4 | <0.024* |
| Mean weeks receipt (sd) | 15.11 (sd 24.21) | 12.28 (sd 23.21) | <0.003* |
| Other out of work benefit | EA group | Matched comparison group | Pp difference | p-value |
|---|---|---|---|---|
| % in receipt | 23 | 23 | -1 | 0.905 |
| Mean weeks receipt (sd) | 18.10 (sd 28.94) | 19.20 (sd 30.11) | <0.679 |
| Disability benefit | EA group | Matched comparison group | Pp difference | p-value |
|---|---|---|---|---|
| % in receipt | 20 | 22 | -2 | 0.153 |
| Mean weeks receipt (sd) | 14.25 (sd 29.25) | 15.11 (sd 29.57) | <0.082 |
| Any other benefits | EA group | Matched comparison group | Pp difference | p-value |
|---|---|---|---|---|
| % in receipt | 49 | 47 | 2 | <0.115 |
| Mean weeks receipt (sd) | 39.07 (sd 34.25) | 37.88 (sd 35.28) | <0.055 |
Base: all work on entry to IAPT, EA group: 619, Matched comparison group: 4,922
Given that 45 per cent of those reporting themselves out of work when they entered IAPT were not in receipt of out of work benefits at that time, a hypothesis that was explored was whether the employment and benefit impacts on those out of work when they came into IAPT may be different for those claiming benefits at that point and those who were not. It is plausible, for example, that EAs would help those eligible for benefits but not claiming them to make a claim. Table 5.5 shows a few impacts dividing the data in this way, with benefit receipt being shown at weeks 13, 16 and 52 so that any change over time is evident.
These impacts suggest that EAs increased the numbers of clients in work, and the numbers who reported being unemployed, irrespective of their benefit status when they started IAPT, but with some evidence that the impacts on employment are slightly larger for the ‘not on benefits’ group (a seven percentage point impact versus a four percentage point impact). There is some evidence to support the hypothesis that EAs helped clients to claim benefits, with a five-percentage point impact on out of work benefit[footnote 69] receipt at 26 weeks, and four percentage points at 52 weeks for those not on benefits at the start of IAPT.
Table 5.5 Impact of Employment Advisors on employment and benefit receipt
for those out at work on entry to IAPT, by benefit receipt on entry to IAPT On benefits on entry to IAPT Not on benefits on entry to IAPT
On benefits on entry to IAPT
Employment status at final session
| Employment status | EA group (%) | Matched comparison group (%) | Pp difference | p-value |
|---|---|---|---|---|
| Employment status at final session | <0.001* | |||
| Working | 14 | 11 | 4 | |
| Long-term sick or disabled | 24 | 39 | -16 | |
| Unemployed | 54 | 38 | 16 | |
| Other | 8 | 12 | -4 |
Any out of work benefit
| Benefit | EA group (%) | Matched comparison group (%) | Pp difference | p-value |
|---|---|---|---|---|
| % in receipt at 13 weeks | 83 | 81 | 1 | 0.278 |
| % in receipt at 26 weeks | 78 | 75 | 2 | 0.116 |
| % in receipt at 52 weeks | 68 | 69 | -1 | 0.914 |
Unemployment benefit
| Benefit | EA group (%) | Matched comparison group (%) | Pp difference | p-value |
|---|---|---|---|---|
| % in receipt at 13 weeks | 41 | 35 | 6 | 0.040* |
| % in receipt at 26 weeks | 33 | 28 | 4 | 0.090 |
| % in receipt at 52 weeks | 26 | 24 | 2 | 0.414 |
Other out of work benefit
| Benefit | EA group (%) | Matched comparison group (%) | Pp difference | p-value |
|---|---|---|---|---|
| % in receipt at 13 weeks | 42 | 46 | -4 | 0.360 |
| % in receipt at 26 weeks | 45 | 47 | -2 | 0.944 |
| % in receipt at 52 weeks | 41 | 45 | -3 | 0.642 |
Disability benefit
| Benefit | EA group (%) | Matched comparison group (%) | Pp difference | p-value |
|---|---|---|---|---|
| % in receipt at 13 weeks | 32 | 32 | -1 | 0.704 |
| % in receipt at 26 weeks | 33 | 34 | -1 | 0.603 |
| % in receipt at 52 weeks | 33 | 36 | -3 | 0.091 |
Base: EA group 360, Matched comparison group 2,654
Not on benefits on entry to IAPT
Employment status at final session
| Employment status | EA group (%) | Matched comparison group (%) | Pp difference | p-value |
|---|---|---|---|---|
| Employment status at final session | <0.001* | |||
| Working | 37 | 30 | 7 | |
| Long-term sick or disabled | 3 | 8 | -5 | |
| Unemployed | 43 | 31 | 12 | |
| Other | 17 | 31 | -14 |
Any out of work benefit
| Benefit | EA group (%) | Matched comparison group (%) | Pp difference | p-value |
|---|---|---|---|---|
| % in receipt at 13 weeks | 11 | 9 | 2 | 0.217 |
| % in receipt at 26 weeks | 16 | 11 | 5 | 0.015* |
| % in receipt at 52 weeks | 18 | 13 | 4 | 0.023* |
Unemployment benefit
| Benefit | EA group (%) | Matched comparison group (%) | Pp difference | p-value |
|---|---|---|---|---|
| % in receipt at 13 weeks | 7 | 6 | 2 | 0.254 |
| % in receipt at 26 weeks | 11 | 7 | 5 | 0.004* |
| % in receipt at 52 weeks | 10 | 7 | 3 | 0.068 |
Other out of work benefit
| Benefit | EA group (%) | Matched comparison group (%) | Pp difference | p-value |
|---|---|---|---|---|
| % in receipt at 13 weeks | 4 | 3 | 0 | 0.731 |
| % in receipt at 26 weeks | 5 | 5 | 0 | 0.921 |
| % in receipt at 52 weeks | 8 | 6 | 1 | 0.322 |
Disability benefit
| Benefit | EA group (%) | Matched comparison group (%) | Pp difference | p-value |
|---|---|---|---|---|
| % in receipt at 13 weeks | 1 | 2 | -1 | 0.693 |
| % in receipt at 26 weeks | 1 | 3 | -1 | 0.195 |
| % in receipt at 52 weeks | 2 | 4 | -1 | 0.298 |
Base: EA group 373, Matched comparison group 3,253
6. Discussion
Within Steps2Wellbeing Improving Access to Psychological Therapies (IAPT), there is clear evidence of the benefits of providing Employment Adviser (EA) support for clients who were out of work when they entered the service. For these clients, there were statistically significant positive impacts on their mental health, their perceptions about their ability to work and on their engagement with the labour market – either working or unemployed (rather than inactive). This is consistent with the findings from the Client Research Report in relation to those who were looking for work (albeit with a different measurement of outcomes).
Similarly, while the evidence of the benefits of EA support is not as strong for clients who entered the service when they were off work sick, the overall picture is largely positive. For those off work sick, there is some evidence of the benefits on their mental health. By the final session, while the EA support had not resulted in a significant impact in the percentage of clients in work it appeared to help them to continue to be looking to enter the labour market. Compared to those that had not, those who had seen an EA were significantly more likely to be unemployed, rather than reporting themselves as long-term sick or disabled. Again, this largely echoes the findings from the Client Research for this group.
However, it is important to note that, among those off work sick when they started IAPT, those seeing an EA were significantly more to perceive that their issues were affecting their ability to work, than those who had not seen an EA. This could reflect an increased recognition by clients having talked to the EA about the relationship between their health issues and their work. There is no data available to answer whether this led to later changes within their existing workplace (e.g. hours, conditions) or switches between jobs. However, it may partly explain the shift into unemployment and the increase in out of work benefit receipt.
The findings which are most difficult to interpret are those for the IAPT clients who were working when they entered the service. For this group, seeing an EA was significantly associated with being out of work by the time of the final session and associated with clients being more likely to perceive their issues as affecting their ability to work. There is no significant evidence that seeing an EA had a positive impact on their mental health. However, the fact that there is no evidence of it having a negative effect may be an indication that those moving out of work did so voluntarily. Wider evidence suggests that involuntarily moving out of employment is linked with negative impacts on mental health.
One consideration must be the profile of clients who are working who choose to see the EA. Certainly, on average, their ability to work is more severely impaired than other IAPT clients who are working and who do not choose to take up EA support (see Chapter 3, which shows the take-up of EA support to be much higher than average for those with the worst Work and Social Adjustment Scale (WSAS) ability to work scores). This is corroborated from the survey of IAPT clients[footnote 70] which showed the majority (76 per cent) of working EA clients sought the support because of issues in the workplace or needing help to remain in work. In contrast, just over half (54 per cent) of those who were working who did not take up EA support said that they did not have any employment needs or issues that they felt the support would address.
To a large extent, the impact analysis should be taking this into account, comparing the outcomes of working clients who took up EA support against a matched comparison group with very similar levels of impairment to work. However, it is not feasible to rule out the possibility that those who take up EA support differ systematically to those who chose not to in dimensions not captured in the data. If, for example, they had a more complex range of issues at work or were less attached to the labour market they may have a greater propensity to leave their jobs than the matched comparison group irrespective of the support they receive.
Alternatively, the significant reduction at the end of therapy in the percentage of these clients who were in work could be the result of the EA helping the client to make the best decision for them, given their circumstances. A move away from work – either temporarily while other work is sought or other issues addressed – will in at least some cases be the ‘positive outcome’, moving away from work which negatively impacts on a clients’ mental health or providing time to retrain or change career or employment sector. Certainly, the impact on clients’ perceptions about the extent to which their issues impair their ability to work suggests that part of the process of seeing an EA has been to increase clients’ awareness of this.
Appendix A: Responses to the Patient Experience Questionnaire
Improving Access to Psychological Therapies (IAPT) data collection requirements include the collection of feedback from clients in the form of a Patient Experience Questionnaire. There is little in the Step2Wellbeing IAPT data to suggest that the clients who chose and did not choose to see an Employment Adviser (EA) experienced the IAPT service differently. Both groups provided largely positive feedback. Close to nine in ten clients or more reported that all or most of the time:
- staff listened to them and treated their concerns
- the service helped them better understand and address their difficulties;
- they felt involved in making choices about their treatment and care;
- they got the help that mattered to them;
- they had confidence in their therapist and their skills and techniques.
The only evidence that those who saw an EA had a better experience than those who did not was among those who were out of work when they came into the service. Among these clients, those who had seen an EA were statistically significantly more likely to say that they had got the help that mattered to them. Three quarters (76 per cent) of those who saw an EA reported this happened at all times and a further 17 per cent said it happened most of the time. This compares to 69 per cent and 20 per cent of those who had not seen an EA.
See Tables A.1 to A.3 for a full breakdown of clients’ responses
Table A.1 Reported experience of the IAPT service from the Patient Experience Questionnaire by those seeing an EA and those who did not: those working on entry to IAPT
Working on entry to IAPT
| Question and response | Saw an EA (%) | Did not see an EA (%) | Total (%) | p-value |
|---|---|---|---|---|
| Did the staff listen to you and treat your concerns? | 0.486 | |||
| At all times | 93 | 94 | 94 | |
| Most of the time | 6 | 5 | 5 | |
| Sometimes | 1 | 1 | 1 | |
| Rarely | 0 | 0 | 0 | |
| Never | 0 | 0 | 0 | |
| Do you feel that the service has helped you to better understand and address your difficulties? | 0.174 | |||
| At all times | 71 | 71 | 71 | |
| Most of the time | 21 | 20 | 20 | |
| Sometimes | 8 | 7 | 7 | |
| Rarely | 0 | 1 | 1 | |
| Never | 0 | 0 | 0 | |
| Did you feel involved in making choices about your treatment and care? | 0.143 | |||
| At all times | 82 | 83 | 83 | |
| Most of the time | 14 | 12 | 12 | |
| Sometimes | 3 | 5 | 4 | |
| Rarely | 1 | 1 | 1 | |
| Never | 0 | 0 | 0 | |
| On reflection, did you get the help that mattered to you? | 0.420 | |||
| At all times | 76 | 75 | 76 | |
| Most of the time | 17 | 17 | 17 | |
| Sometimes | 6 | 6 | 6 | |
| Rarely | 1 | 1 | 1 | |
| Never | 0 | 1 | 1 | |
| Did you have confidence in your therapist and his/her skills and techniques | 0.513 | |||
| At all times | 89 | 90 | 90 | |
| Most of the time | 8 | 7 | 7 | |
| Sometimes | 2 | 2 | 2 | |
| Rarely | 0 | 0 | 0 | |
| Never | 0 | 0 | 0 | |
| Base: all working on entry to IAPT providing PEQ feedback | 1,212 | 4,287 | 5,499 |
Table A.2 Reported experience of the IAPT service from the Patient Experience Questionnaire by those seeing an EA and those who did not: those on
Statutory Sick Pay on entry to IAPT
On Statutory Sick Pay on entry to IAPT
| Question and response | Saw an EA (%) | Did not see an EA (%) | Total (%) | p-value |
|---|---|---|---|---|
| Did the staff listen to you and treat your concerns? | 0.691 | |||
| At all times | 94 | 93 | 94 | |
| Most of the time | 5 | 6 | 5 | |
| Sometimes | 1 | 1 | 1 | |
| Rarely | 0 | 0 | 0 | |
| Never | 0 | 0 | 0 | |
| Do you feel that the service has helped you to better understand and address your difficulties? | 0.427 | |||
| At all times | 73 | 76 | 74 | |
| Most of the time | 20 | 16 | 18 | |
| Sometimes | 6 | 7 | 7 | |
| Rarely | 1 | 1 | 1 | |
| Never | 1 | 0 | 0 | |
| Did you feel involved in making choices about your treatment and care? | 0.530 | |||
| At all times | 80 | 84 | 82 | |
| Most of the time | 16 | 12 | 14 | |
| Sometimes | 3 | 3 | 3 | |
| Rarely | 1 | 1 | 1 | |
| Never | 0 | 0 | 0 | |
| On reflection, did you get the help that mattered to you? | 0.866 | |||
| At all times | 75 | 78 | 77 | |
| Most of the time | 17 | 14 | 16 | |
| Sometimes | 6 | 6 | 6 | |
| Rarely | 1 | 1 | 1 | |
| Never | 1 | 0 | 0 | |
| Did you have confidence in your therapist and his/her skills and techniques | 0.933 | |||
| At all times | 90 | 89 | 89 | |
| Most of the time | 8 | 9 | 8 | |
| Sometimes | 2 | 2 | 2 | |
| Rarely | 0 | 0 | 0 | |
| Never | 0 | 0 | 0 | |
| Base: all off work sick on entry to IAPT providing PEQ feedback | 344 | 301 | 645 |
Table A.3 Reported experience of the IAPT service from the Patient Experience Questionnaire by those seeing an EA and those who did not: those out of work on entry to IAPT
Out of work on entry to IAPT
| Question and response | Saw an EA (%) | Did not see an EA (%) | Total (%) | p-value | |
|---|---|---|---|---|---|
| Did the staff listen to you and treat your concerns? | 0.476 | ||||
| At all times | 93 | 91 | 92 | ||
| Most of the time | 6 | 7 | 6 | ||
| Sometimes | 1 | 2 | 1 | ||
| Rarely | 0 | 0 | 0 | ||
| Never | 0 | 0 | 0 | ||
| Do you feel that the service has helped you to better understand and address your difficulties? | 0.070 | ||||
| At all times | 69 | 66 | 67 | ||
| Most of the time | 23 | 22 | 22 | ||
| Sometimes | 6 | 10 | 9 | ||
| Rarely | 1 | 2 | 2 | ||
| Never | 0 | 1 | 1 | ||
| Did you feel involved in making choices about your treatment and care? | 0.711 | ||||
| At all times | 80 | 78 | 78 | ||
| Most of the time | 15 | 15 | 15 | ||
| Sometimes | 4 | 5 | 5 | ||
| Rarely | 1 | 1 | 1 | ||
| Never | 0 | 0 | 0 | ||
| On reflection, did you get the help that mattered to you? | 0.020* | ||||
| At all times | 76 | 69 | 70 | ||
| Most of the time | 17 | 20 | 19 | ||
| Sometimes | 5 | 9 | 8 | ||
| Rarely | 1 | 2 | 2 | ||
| Never | 0 | 1 | 1 | ||
| Did you have confidence in your therapist and his/her skills and techniques | 0.453 | ||||
| At all times | 89 | 87 | 87 | ||
| Most of the time | 9 | 10 | 10 | ||
| Sometimes | 1 | 3 | 2 | ||
| Rarely | 0 | 0 | 0 | ||
| Never | 0 | 0 | 0 | ||
| Base: all out of work on entry to IAPT providing PEQ feedback | 441 | 1913 | 2354 |
Appendix B: Take up of EA support across sub-groups and the profile of those taking up EA support
Tables B.1, B.2 and B.3 show the percentage of clients taking up Employment Adviser (EA) support within the three main client groups across a range of characteristics: demographics; benefit history; and outcomes on entry to IAPT. Where there was a statistically significant difference across categories the take-up percentages are highlighted in red and marked with an asterisk.
Table B.1: Take up of EA by demographic, health and employment characteristics
Working on entry to IAPT
Gender
| Gender | Taking up EA | Therapy only | % taking up EA support |
|---|---|---|---|
| Female | 1,053 | 7,473 | 12* |
| Male | 653 | 3739 | 15* |
Age group
| Ages | Taking up EA | Therapy only | % taking up EA support |
|---|---|---|---|
| 19 to 24 | 131 | 1,250 | 9* |
| 25 to 29 | 256 | 1,932 | 12* |
| 30 to 34 | 230 | 1,854 | 11* |
| 35 to 39 | 201 | 1,618 | 11* |
| 40 to 44 | 204 | 1,256 | 14* |
| 45 to 49 | 199 | 1,068 | 16* |
| 50 to 54 | 172 | 917 | 16* |
| 55 to 59 | 187 | 757 | 20* |
| 60 to 66 | 126 | 560 | 18* |
Ethnic group
| Ethnic group | Taking up EA | Therapy only | % taking up EA support |
|---|---|---|---|
| White | 1,608 | 10,699 | 13* |
| Asian or Asian British | 29 | 148 | 16* |
| Black or Black British | 15 | 61 | 20* |
| Mixed | 28 | 187 | 13* |
| Other Ethnic Groups | 19 | 54 | 26* |
| Not available | 7 | 63 | 10* |
Disabled
| Disabled | Taking up EA | Therapy only | % taking up EA support |
|---|---|---|---|
| Has Disability | 90 | 372 | 19* |
| No Disability | 1,576 | 10,564 | 13* |
| Not available | 40 | 276 | 13* |
Long-term health condition
| Long-term health condition | Taking up EA | Therapy only | % taking up EA support |
|---|---|---|---|
| Yes | 605 | 3,262 | 16* |
| No | 1,095 | 7,906 | 12* |
| Not available | 6 | 44 | 12* |
Employment status at assessment
| Employment status at assessment | Taking up EA | Therapy only | % taking up EA support |
|---|---|---|---|
| Employed full-time | 1,211 | 7,219 | 14* |
| Employed part-time | 374 | 2,857 | 12* |
| Employed zero hours contract | 14 | 74 | 16* |
| Full-time homemaker or carer | - | - | - |
| Full-time student | - | - | - |
| Long term sick or disabled | - | - | - |
| Not receiving benefits and not working or actively seeking work | - | - | - |
| Self employed | 107 | 1,062 | 9* |
| Unemployed | - | - | - |
| Unpaid voluntary work (not actively seeking work) | - | - | - |
Totals
| Total | Taking up EA | Therapy only | % taking up EA support |
|---|---|---|---|
| Total | 1,706 | 11,212 | 13 |
On SPP on entry to IAPT
Gender
| Gender | Taking up EA | Therapy only | % taking up EA support |
|---|---|---|---|
| Female | 308 | 559 | 36 |
| Male | 180 | 293 | 36 |
Age group
| Ages | Taking up EA | Therapy only | % taking up EA support |
|---|---|---|---|
| 19 to 24 | 18 | 38 | 32* |
| 25 to 29 | 30 | 87 | 26* |
| 30 to 34 | 42 | 132 | 24* |
| 35 to 39 | 47 | 131 | 26* |
| 40 to 44 | 57 | 110 | 34* |
| 45 to 49 | 72 | 100 | 42* |
| 50 to 54 | 82 | 99 | 45* |
| 55 to 59 | 87 | 83 | 51* |
| 60 to 66 | 53 | 72 | 42* |
Ethnic group
| Ethnic group | Taking up EA | Therapy only | % taking up EA support |
|---|---|---|---|
| White | 473 | 829 | 36 |
| Asian or Asian British | - | - | - |
| Black or Black British | - | - | - |
| Mixed | - | - | - |
| Other Ethnic Groups | - | - | - |
| Not available | - | - | - |
Disabled
| Disabled | Taking up EA | Therapy only | % taking up EA support |
|---|---|---|---|
| Has Disability | 42 | 55 | 43 |
| No Disability | 440 | 776 | 36 |
| Not available | 6 | 21 | 22 |
Long-term health condition
| Long-term health condition | Taking up EA | Therapy only | % taking up EA support |
|---|---|---|---|
| Yes | 209 | 325 | 39 |
| No | 278 | 524 | 35 |
| Not available | - | - | - |
Employment status at assessment
| Employment status at assessment | Taking up EA | Therapy only | % taking up EA support |
|---|---|---|---|
| Employed full-time | 379 | 643 | 37 |
| Employed part-time | 107 | 200 | 35 |
| Employed zero hours contract | - | - | - |
| Full-time homemaker or carer | - | - | - |
| Full-time student | - | - | - |
| Long term sick or disabled | - | - | - |
| Not receiving benefits and not working or actively seeking work | - | - | - |
| Self employed | - | - | - |
| Unemployed | - | - | - |
| Unpaid voluntary work (not actively seeking work) | - | - | - |
Totals
| Total | Taking up EA | Therapy only | % taking up EA support |
|---|---|---|---|
| Total | 486 | 852 | 36 |
Out of work on entry to IAPT
Gender
| Gender | Taking up EA | Therapy only | % taking up EA support |
|---|---|---|---|
| Female | 406 | 4,191 | 9* |
| Male | 327 | 1,716 | 16* |
Age group
| Ages | Taking up EA | Therapy only | % taking up EA support |
|---|---|---|---|
| 19 to 24 | 115 | 1,716 | 6* |
| 25 to 29 | 110 | 854 | 11* |
| 30 to 34 | 65 | 630 | 9* |
| 35 to 39 | 69 | 520 | 12* |
| 40 to 44 | 59 | 458 | 11* |
| 45 to 49 | 85 | 420 | 17* |
| 50 to 54 | 81 | 429 | 16* |
| 55 to 59 | 74 | 440 | 14* |
| 60 to 66 | 75 | 440 | 15* |
Ethnic group
| Ethnic group | Taking up EA | Therapy only | % taking up EA support |
|---|---|---|---|
| White | 675 | 5,450 | 11 |
| Asian or Asian British | 14 | 143 | 9 |
| Black or Black British | 8 | 80 | 9 |
| Mixed | 16 | 135 | 11 |
| Other Ethnic Groups | 11 | 57 | 16 |
| Not available | 9 | 42 | 18 |
Disabled
| Disabled | Taking up EA | Therapy only | % taking up EA support |
|---|---|---|---|
| Has Disability | 89 | 909 | 9* |
| No Disability | 631 | 4,848 | 12* |
| Not available | 13 | 150 | 8* |
Long-term health condition
| Long-term health condition | Taking up EA | Therapy only | % taking up EA support |
|---|---|---|---|
| Yes | 308 | 2,540 | 11 |
| No | 423 | 3,335 | 11 |
| Not available | 2 | 32 | 6 |
Employment status at assessment
| Employment status at assessment | Taking up EA | Therapy only | % taking up EA support |
|---|---|---|---|
| Employed full-time | - | - | - |
| Employed part-time | - | - | - |
| Employed zero hours contract | - | - | - |
| Full-time homemaker or carer | 50 | 1,056 | 5* |
| Full-time student | 60 | 1,700 | 3* |
| Long term sick or disabled | 118 | 1,136 | 9* |
| Not receiving benefits and not working or actively seeking work | 5 | 25 | 17* |
| Self employed | - | - | - |
| Unemployed | 498 | 1,944 | 20* |
| Unpaid voluntary work (not actively seeking work) | 2 | 46 | 4* |
Totals
| Total | Taking up EA | Therapy only | % taking up EA support |
|---|---|---|---|
| Total | 733 | 5,907 | 11 |
Table B.2: Take up of EA support by recent benefit history
Working on entry to IAPT
On an out of work benefit on assessment date
| Response | Take up EA | Therapy only | % taking-up EA support |
|---|---|---|---|
| Yes | 76 | 433 | 15 |
| No | 1,630 | 10,779 | 13 |
Number of weeks on out of work benefits in the six months prior to assessment
| Number of weeks | Take up EA | Therapy only | % taking-up EA support |
|---|---|---|---|
| None | 1,596 | 10,568 | 13 |
| 1 to 4 weeks | 27 | 111 | 20 |
| 5 or more weeks | 83 | 533 | 13 |
On an unemployment benefit on assessment date
| Response | Take up EA | Therapy only | % taking-up EA support |
|---|---|---|---|
| Yes | 30 | 144 | 17 |
| No | 1,676 | 11,068 | 13 |
Number of weeks on unemployment benefits in the six months prior to assessment
| Number of weeks | Take up EA | Therapy only | % taking-up EA support |
|---|---|---|---|
| None | 1,645 | 10,924 | 13* |
| 1 to4 weeks | 22 | 67 | 17* |
| 5 or more weeks | 39 | 221 | 13* |
On other out of work benefits on assessment date
| Response | Take up EA | Therapy only | % taking-up EA support |
|---|---|---|---|
| Yes | 46 | 289 | 14 |
| No | 1,660 | 10,923 | 13 |
Number of weeks on other out of work benefits in the six months prior to assessment
| Number of weeks | Take up EA | Therapy only | % taking-up EA support |
|---|---|---|---|
| None | 1,631 | 10,732 | 13 |
| 1 to 4 weeks | 22 | 115 | 16 |
| 5 or more weeks | 53 | 365 | 13 |
On a disability benefit on assessment date
| Response | Take up EA | Therapy only | % taking-up EA support |
|---|---|---|---|
| Yes | 51 | 262 | 16 |
| No | 1,655 | 10,950 | 13 |
Number of weeks on disability benefits in the six months prior to assessment
| Number of weeks | Take up EA | Therapy only | % taking-up EA support |
|---|---|---|---|
| None | 1,651 | 10,943 | 13 |
| 1 to 4 weeks | - | - | - |
| 5 or more weeks | 50 | 261 | 16 |
On SPP on entry to IAPT
On an out of work benefit on assessment date
| Response | Take up EA | Therapy only | % taking-up EA support |
|---|---|---|---|
| Yes | 30 | 68 | 31 |
| No | 458 | 784 | 37 |
Number of weeks on out of work benefits in the six months prior to assessment
| Number of weeks | Take up EA | Therapy only | % taking-up EA support |
|---|---|---|---|
| None | 455 | 761 | 37* |
| 1 to 4 weeks | 8 | 13 | 38* |
| 5 or more weeks | 25 | 78 | 24* |
On an unemployment benefit on assessment date
| Response | Take up EA | Therapy only | % taking-up EA support |
|---|---|---|---|
| Yes | 7 | 24 | 23 |
| No | 481 | 828 | 37 |
Number of weeks on unemployment benefits in the six months prior to assessment
| Number of weeks | Take up EA | Therapy only | % taking-up EA support |
|---|---|---|---|
| None | 476 | 802 | 37* |
| 1 to4 weeks | 7 | 16 | 30* |
| 5 or more weeks | 5 | 34 | 13* |
On other out of work benefits on assessment date
| Response | Take up EA | Therapy only | % taking-up EA support |
|---|---|---|---|
| Yes | 23 | 44 | 34 |
| No | 465 | 808 | 37 |
Number of weeks on other out of work benefits in the six months prior to assessment
| Number of weeks | Take up EA | Therapy only | % taking-up EA support |
|---|---|---|---|
| None | 460 | 781 | 37 |
| 1 to 4 weeks | 5 | 14 | 34 |
| 5 or more weeks | 23 | 57 | 36 |
On a disability benefit on assessment date
| Rersponse | Take up EA | Therapy only | % taking-up EA support |
|---|---|---|---|
| Yes | 27 | 34 | 44 |
| No | 461 | 818 | 36 |
Number of weeks on disability benefits in the six months prior to assessment
| Number of weeks | Take up EA | Therapy only | % taking-up EA support |
|---|---|---|---|
| None | 460 | 818 | 36 |
| 1 to 4 weeks | - | - | - |
| 5 or more weeks | 24 | 31 | 44 |
Out of work on entry to IAPT
On an out of work benefit on assessment date
| Response | Take up EA | Therapy only | % taking-up EA support |
|---|---|---|---|
| Yes | 323 | 2,296 | 12* |
| No | 410 | 3,611 | 10* |
Number of weeks on out of work benefits in the six months prior to assessment
| Number of weeks | Take up EA | Therapy only | % taking-up EA support |
|---|---|---|---|
| None | 378 | 3,386 | 10* |
| 1 to 4 weeks | 37 | 143 | 21* |
| 5 or more weeks | 318 | 2,378 | 12* |
On an unemployment benefit on assessment date
| Response | Take up EA | Therapy only | % taking-up EA support |
|---|---|---|---|
| Yes | 170 | 701 | 20* |
| No | 563 | 5,206 | 10* |
Number of weeks on unemployment benefits in the six months prior to assessment
| Number of weeks | Take up EA | Therapy only | % taking-up EA support |
|---|---|---|---|
| None | 528 | 5,029 | 10* |
| 1 to4 weeks | 45 | 149 | 23* |
| 5 or more weeks | 180 | 729 | 18* |
On other out of work benefits on assessment date
| Response | Take up EA | Therapy only | % taking-up EA support |
|---|---|---|---|
| Yes | 153 | 1,595 | 9* |
| No | 580 | 4,312 | 12* |
Number of weeks on other out of work benefits in the six months prior to assessment
| Number of weeks | Take up EA | Therapy only | % taking-up EA support |
|---|---|---|---|
| None | 533 | 4,023 | 12* |
| 1 to 4 weeks | 20 | 115 | 15* |
| 5 or more weeks | 180 | 1,769 | 8* |
On a disability benefit on assessment date
| Response | Take up EA | Therapy only | % taking-up EA support |
|---|---|---|---|
| Yes | 111 | 1,276 | 8* |
| No | 622 | 4,631 | 12* |
Number of weeks on disability benefits in the six months prior to assessment
| Number of weeks | Take up EA | Therapy only | % taking-up EA support |
|---|---|---|---|
| None | 622 | 4,621 | 12* |
| 1 to 4 weeks | 4 | 32 | 11* |
| 5 or more weeks | 107 | 1,254 | 6* |
Table B.3: Take up of EA support by health scores on entry to IAPT
Working on entry to IAPT
| Health score | Taking up EA (n) | Therapy only (n) | % taking-up EA support |
|---|---|---|---|
| PHQ-9 categories: No depression (0 to 4) | 22 | 475 | 4* |
| Mild depression (5 to 9) | 170 | 1,715 | 9* |
| Moderate depression (10 to 1414) | 525 | 3,606 | 13* |
| Moderately severe depression (15 to 19) | 541 | 3,259 | 14* |
| Severe depression (20 to 27) | 448 | 2,157 | 17* |
| GAD-7 categories: No anxiety (0 to 4) | 42 | 359 | 10* |
| Mild anxiety (5 to 9) | 297 | 2,141 | 12* |
| Moderate anxiety (10 to 14) | 560 | 3,858 | 13* |
| Severe anxiety (15 to 21) | 807 | 4,854 | 14* |
| Work and Social Adjustment scale: Low impairment (0 to 9) | 190 | 1,990 | 9* |
| Moderate impairment (10 to 20) | 735 | 5,394 | 12* |
| Severe impairment (21 to 40) | 781 | 3,828 | 17* |
| Work and Social Adjustment - work: None (0) | 70 | 1,272 | 5* |
| Slightly (1 to 2) | 231 | 2,632 | 8* |
| Definitely (3 to 5) | 712 | 4,549 | 14* |
| Markedly (6 to 7) | 446 | 1,579 | 22* |
| Very severely (8) | 153 | 323 | 32* |
| Not answered (9) | 94 | 857 | 10* |
| Mental Health Care Cluster: Common Mental Health Problems (Low Severity with Greater Need) | 1,146 | 6,786 | 14* |
| Non-Psychotic (Moderate Severity) | 480 | 3879 | 11* |
| Other | 80 | 547 | 13* |
| Number of previous referrals (in last two years): None | 1,355 | 8,812 | 13 |
| 1 | 292 | 1,965 | 13 |
| 2 or more | 59 | 435 | 12 |
On SPP on entry to IAPT
| Health score | Taking up EA (n) | Therapy only (n) | % taking-up EA support |
|---|---|---|---|
| PHQ-9 categories: No depression (0 to 4) | 4 | 10 | 29 |
| Mild depression (5 to 9) | 25 | 72 | 26 |
| Moderate depression (10 to 1414) | 112 | 209 | 35 |
| Moderately severe depression (15 to 19) | 170 | 273 | 38 |
| Severe depression (20 to 27) | 177 | 288 | 38 |
| GAD-7 categories: No anxiety (0 to 4) | 5 | 15 | 25 |
| Mild anxiety (5 to 9) | 76 | 140 | 35 |
| Moderate anxiety (10 to 14) | 136 | 283 | 32 |
| Severe anxiety (15 to 21) | 271 | 414 | 40 |
| Work and Social Adjustment scale: Low impairment (0 to 9) | 24 | 69 | 26* |
| Moderate impairment (10 to 20) | 182 | 335 | 35* |
| Severe impairment (21 to 40) | 282 | 448 | 39* |
| Work and Social Adjustment - work: None (0) | 5 | 15 | 25* |
| Slightly (1 to 2) | 13 | 44 | 23* |
| Definitely (3 to 5) | 89 | 209 | 30* |
| Markedly (6 to 7) | 166 | 298 | 36* |
| Very severely (8) | 188 | 201 | 48* |
| Not answered (9) | 27 | 85 | 24* |
| Mental Health Care Cluster: Common Mental Health Problems (Low Severity with Greater Need) | 354 | 527 | 40* |
| Non-Psychotic (Moderate Severity) | 119 | 293 | 29* |
| Other | 15 | 32 | 32* |
| Number of previous referrals (in last two years): None | 406 | 676 | 38 |
| 1 | 70 | 154 | 31 |
| 2 or more | 12 | 22 | 35 |
Out of work on entry to IAPT
| Health score | Taking up EA (n) | Therapy only (n) | % taking-up EA support |
|---|---|---|---|
| PHQ-9 categories: No depression (0 to 4) | 10 | 138 | 7* |
| Mild depression (5 to 9) | 41 | 530 | 7* |
| Moderate depression (10 to 1414) | 189 | 1,414 | 12* |
| Moderately severe depression (15 to 19) | 229 | 1,764 | 11* |
| Severe depression (20 to 27) | 264 | 2,061 | 11* |
| GAD-7 categories: No anxiety (0 to 4) | 18 | 147 | 11* |
| Mild anxiety (5 to 9) | 109 | 887 | 11 |
| Moderate anxiety (10 to 14) | 248 | 1,821 | 12 |
| Severe anxiety (15 to 21) | 358 | 3,052 | 10 |
| Work and Social Adjustment scale: Low impairment (0 to 9) | 53 | 625 | 8* |
| Moderate impairment (10 to 20) | 260 | 2,105 | 11* |
| Severe impairment (21 to 40) | 420 | 3,177 | 12* |
| Work and Social Adjustment - work: None (0) | 14 | 179 | 7* |
| Slightly (1 to 2) | 42 | 377 | 10* |
| Definitely (3 to 5) | 134 | 959 | 12* |
| Markedly (6 to 7) | 186 | 859 | 8* |
| Very severely (8) | 118 | 821 | 13* |
| Not answered (9) | 239 | 2,711 | 8* |
| Mental Health Care Cluster: Common Mental Health Problems (Low Severity with Greater Need) | 441 | 3,183 | 12* |
| Non-Psychotic (Moderate Severity) | 267 | 2,399 | 10* |
| Other | 25 | 325 | 7* |
| Number of previous referrals (in last two years): None | 502 | 4,251 | 11 |
| 1 | 170 | 1,242 | 12 |
| 2 or more | 61 | 414 | 13 |
Tables B.4 to B.6 show the profile of those taking up EA support against those with therapy only. They are based on the same data as Tables B.1 to B.3 but show column percentages rather than row percentages.
Table B.4: EA and therapy only groups by demographic, health and
employment characteristics.
Working at assessment
| Demographic | Taking up EA (%) | Therapy only (%) |
|---|---|---|
| Gender: Female | 62 | 67 |
| Male | 38 | 33 |
| Age group: 19 to 24 | 8 | 11 |
| 25 to 29 | 15 | 17 |
| 30 to 34 | 13 | 17 |
| 35 to 39 | 12 | 14 |
| 40 to 44 | 12 | 11 |
| 45 to 49 | 12 | 10 |
| 50 to 54 | 10 | 8 |
| 55 to 59 | 11 | 7 |
| 60 to 66 | 7 | 5 |
| Ethnic group: White | 94 | 95 |
| Asian or Asian British | 2 | 1 |
| Black or Black British | 1 | 1 |
| Mixed | 2 | 2 |
| Other Ethnic Groups | 1 | 0 |
| Not available | 0 | 1 |
| Disabled: Has Disability | 5 | 3 |
| No Disability | 92 | 94 |
| Not available | 2 | 2 |
| Long-term health condition: Yes | 35 | 29 |
| No | 64 | 71 |
| Not available | 0 | 0 |
| Employment status at assessment: Employed full-time | 71 | 64 |
| Employed part-time | 22 | 25 |
| Employed zero hours contract | 1 | 1 |
| Full time homemaker or carer | - | - |
| Full-time student | - | - |
| Long term sick or disabled | - | - |
| Not receiving benefits and not working or actively seeking work | - | - |
| Self-employed | 6 | 9 |
| Unemployed | - | - |
| Unpaid voluntary work (not actively seeking work) | - | - |
| Base | 1,706 | 11,212 |
On SPP at assessment
| Demographic | Taking up EA (%) | Therapy only (%) |
|---|---|---|
| Gender: Female | 63 | 66 |
| Male | 37 | 34 |
| Age group: 19 to 24 | 4 | 4 |
| 25 to 29 | 6 | 10 |
| 30 to 34 | 9 | 15 |
| 35 to 39 | 10 | 15 |
| 40 to 44 | 12 | 13 |
| 45 to 49 | 15 | 12 |
| 50 to 54 | 17 | 12 |
| 55 to 59 | 18 | 10 |
| 60 to 66 | 11 | 8 |
| Ethnic group: White | 97 | 97 |
| Asian or Asian British | - | - |
| Black or Black British | - | - |
| Mixed | - | - |
| Other Ethnic Groups | - | - |
| Not available | - | - |
| Disabled: Has Disability | 9 | 6 |
| No Disability | 90 | 91 |
| Not available | 1 | 2 |
| Long-term health condition: Yes | 43 | 38 |
| No | 57 | 62 |
| Not available | - | - |
| Employment status at assessment: Employed full-time | 78 | 75 |
| Employed part-time | 22 | 23 |
| Employed zero hours contract | - | - |
| Full time homemaker or carer | - | - |
| Full-time student | - | - |
| Long term sick or disabled | - | - |
| Not receiving benefits and not working or actively seeking work | - | - |
| Self-employed | - | - |
| Unemployed | - | - |
| Unpaid voluntary work (not actively seeking work) | - | - |
| Base | 488 | 852 |
Out of work at assessment
| Demographic | Taking up EA (%) | Therapy only (%) |
|---|---|---|
| Gender: Female | 55 | 71 |
| Male | 45 | 29 |
| Age group: 19 to 24 | 16 | 29 |
| 25 to 29 | 15 | 14 |
| 30 to 34 | 9 | 11 |
| 35 to 39 | 9 | 9 |
| 40 to 44 | 8 | 8 |
| 45 to 49 | 12 | 7 |
| 50 to 54 | 11 | 7 |
| 55 to 59 | 10 | 7 |
| 60 to 66 | 10 | 7 |
| Ethnic group: White | 92 | 92 |
| Asian or Asian British | 2 | 2 |
| Black or Black British | 1 | 1 |
| Mixed | 2 | 2 |
| Other Ethnic Groups | 2 | 1 |
| Not available | 1 | 1 |
| Disabled: Has Disability | 12 | 15 |
| No Disability | 86 | 82 |
| Not available | 2 | 3 |
| Long-term health condition: Yes | 42 | 43 |
| No | 58 | 56 |
| Not available | 0 | 1 |
| Employment status at assessment: Employed full-time | 0 | 0 |
| Employed part-time | 0 | 0 |
| Employed zero hours contract | 0 | 0 |
| Full time homemaker or carer | 7 | 18 |
| Full-time student | 8 | 29 |
| Long term sick or disabled | 16 | 19 |
| Not receiving benefits and not working or actively seeking work | 1 | 0 |
| Self-employed | 0 | 0 |
| Unemployed | 68 | 33 |
| Unpaid voluntary work (not actively seeking work) | 0 | 1 |
| Base | 733 | 5,907 |
Table B.5: EA and therapy only groups by recent benefit history
Working at assessment
| Benefit history | Taking up EA (%) | Therapy only (%) |
|---|---|---|
| On an out of work benefit on assessment date: Yes | 4 | 4 |
| No | 96 | 96 |
| Number of weeks on out of work benefits in the six months prior to assessment: None | 94 | 94 |
| 1 to 4 weeks | 2 | 1 |
| 5 or more weeks | 5 | 5 |
| On an unemployment benefit on assessment date: Yes | 2 | 1 |
| No | 98 | 99 |
| Number of weeks on unemployment benefits in the six months prior to assessment: None | 96 | 97 |
| 1 to 4 weeks | 1 | 1 |
| 5 or more weeks | 2 | 2 |
| On other out of work benefits on assessment date: Yes | 3 | 3 |
| No | 97 | 97 |
| Number of weeks on other out of work benefits in the six months prior to assessment: None | 96 | 96 |
| 1 to 4 weeks | 1 | 1 |
| 5 or more weeks | 3 | 3 |
| On a disability benefit on assessment date: Yes | 3 | 2 |
| No | 97 | 98 |
| Number of weeks on disability benefits in the six months prior to assessment: None | 97 | 98 |
| 1 to 4 weeks | - | - |
| 5 or more weeks | 3 | 2 |
| Base | 1,706 | 11,212 |
On SPP at assessment
| Benefit history | Taking up EA (%) | Therapy only (%) |
|---|---|---|
| On an out of work benefit on assessment date: Yes | 6 | 6 |
| No | 94 | 92 |
| Number of weeks on out of work benefits in the six months prior to assessment: None | 93 | 89 |
| 1 to 4 weeks | 2 | 2 |
| 5 or more weeks | 5 | 9 |
| On an unemployment benefit on assessment date: Yes | 1 | 3 |
| No | 99 | 97 |
| Number of weeks on unemployment benefits in the six months prior to assessment: None | 98 | 94 |
| 1 to 4 weeks | 1 | 2 |
| 5 or more weeks | 1 | 4 |
| On other out of work benefits on assessment date: Yes | 5 | 5 |
| No | 95 | 95 |
| Number of weeks on other out of work benefits in the six months prior to assessment: None | 94 | 92 |
| 1 to 4 weeks | 1 | 2 |
| 5 or more weeks | 5 | 7 |
| On a disability benefit on assessment date: Yes | 6 | 4 |
| No | 94 | 96 |
| Number of weeks on disability benefits in the six months prior to assessment: None | 94 | 96 |
| 1 to 4 weeks | - | - |
| 5 or more weeks | 5 | 4 |
| Base | 488 | 852 |
Out of work at assessment
| Benefit history | Taking up EA (%) | Therapy only (%) |
|---|---|---|
| On an out of work benefit on assessment date: Yes | 44 | 39 |
| No | 56 | 61 |
| Number of weeks on out of work benefits in the six months prior to assessment: None | 52 | 57 |
| 1 to 4 weeks | 5 | 2 |
| 5 or more weeks | 43 | 40 |
| On an unemployment benefit on assessment date: Yes | 23 | 12 |
| No | 77 | 88 |
| Number of weeks on unemployment benefits in the six months prior to assessment: None | 72 | 85 |
| 1 to 4 weeks | 6 | 3 |
| 5 or more weeks | 22 | 12 |
| On other out of work benefits on assessment date: Yes | 21 | 27 |
| No | 79 | 73 |
| Number of weeks on other out of work benefits in the six months prior to assessment: None | 73 | 68 |
| 1 to 4 weeks | 3 | 2 |
| 5 or more weeks | 25 | 30 |
| On a disability benefit on assessment date: Yes | 15 | 22 |
| No | 85 | 78 |
| Number of weeks on disability benefits in the six months prior to assessment: None | 85 | 78 |
| 1 to 4 weeks | 1 | 1 |
| 5 or more weeks | 15 | 21 |
| Base | 733 | 5,907 |
Table B.6: EA and therapy only groups by baseline health scores
Working at assessment
| Baseline health scores | Taking up EA (%) | Therapy only (%) |
|---|---|---|
| PHQ-9 categories: No depression (0 to 44) | 1 | 4 |
| Mild depression (5 to 9) | 10 | 15 |
| Moderate depression (10 to 14) | 31 | 32 |
| Moderately severe depression (15 to 19) | 32 | 29 |
| Severe depression (20 to 27) | 26 | 19 |
| GAD-7 categories: No anxiety (0 to 4) | 2 | 3 |
| Mild anxiety (5 to 9) | 17 | 19 |
| Moderate anxiety (10 to 14) | 33 | 34 |
| Severe anxiety (15 to 21) | 47 | 43 |
| Work and Social Adjustment scale: Low impairment (0 to 9) | 11 | 18 |
| Moderate impairment (10 to 20) | 43 | 48 |
| Severe impairment (21 to 40) | 46 | 34 |
| Work and Social Adjustment – work: None (0) | 4 | 11 |
| Slightly (1 to 2) | 14 | 23 |
| Definitely (3 to 5) | 42 | 41 |
| Markedly (6 to 7) | 26 | 14 |
| Very severely (8) | 9 | 3 |
| Not answered (9) | 6 | 8 |
| Mental Health Care Cluster: Common Mental Health Problems (Low Severity | ||
| with Greater Need) | 67 | 61 |
| Non-Psychotic (Moderate Severity) | 28 | 35 |
| Other | 5 | 5 |
| Number of previous referrals (in last two years): None | 79 | 79 |
| 1 | 17 | 18 |
| 2 or more | 3 | 4 |
| Base | 1,706 | 11,212 |
On SPP at assessment
| Baseline health scores | Taking up EA (%) | Therapy only (%) |
|---|---|---|
| PHQ-9 categories: No depression (0 to 44) | 1 | 1 |
| Mild depression (5 to 9) | 5 | 8 |
| Moderate depression (10 to 14) | 23 | 25 |
| Moderately severe depression (15 to 19) | 35 | 32 |
| Severe depression (20 to 27) | 36 | 34 |
| GAD-7 categories: No anxiety (0 to 4) | 1 | 2 |
| Mild anxiety (5 to 9) | 16 | 16 |
| Moderate anxiety (10 to 14) | 28 | 33 |
| Severe anxiety (15 to 21) | 56 | 49 |
| Work and Social Adjustment scale: Low impairment (0 to 9) | 5 | 8 |
| Moderate impairment (10 to 20) | 37 | 39 |
| Severe impairment (21 to 40) | 58 | 53 |
| Work and Social Adjustment – work: None (0) | 1 | 2 |
| Slightly (1 to 2) | 3 | 5 |
| Definitely (3 to 5) | 18 | 25 |
| Markedly (6 to 7) | 34 | 35 |
| Very severely (8) | 39 | 24 |
| Not answered (9) | 6 | 10 |
| Mental Health Care Cluster: Common Mental Health Problems (Low Severity with Greater Need) | 73 | 82 |
| Non-Psychotic (Moderate Severity) | 24 | 34 |
| Other | 3 | 4 |
| Number of previous referrals (in last two years): None | 83 | 79 |
| 1 | 14 | 18 |
| 2 or more | 2 | 3 |
| Base | 488 | 852 |
Out of work at assessment
| Baseline health scores | Taking up EA (%) | Therapy only (%) |
|---|---|---|
| PHQ-9 categories: No depression (0 to 44) | 1 | 2 |
| Mild depression (5 to 9) | 6 | 9 |
| Moderate depression (10 to 14) | 26 | 24 |
| Moderately severe depression (15 to 19) | 31 | 30 |
| Severe depression (20 to 27) | 36 | 35 |
| GAD-7 categories: No anxiety (0 to 4) | 2 | 2 |
| Mild anxiety (5 to 9) | 15 | 15 |
| Moderate anxiety (10 to 14) | 34 | 31 |
| Severe anxiety (15 to 21) | 49 | 52 |
| Work and Social Adjustment scale: Low impairment (0 to 9) | 7 | 11 |
| Moderate impairment (10 to 20) | 35 | 36 |
| Severe impairment (21 to 40) | 57 | 54 |
| Work and Social Adjustment – work: None (0) | 2 | 3 |
| Slightly (1 to 2) | 6 | 6 |
| Definitely (3 to 5) | 18 | 16 |
| Markedly (6 to 7) | 25 | 15 |
| Very severely (8) | 16 | 14 |
| Not answered (9) | 33 | 46 |
| Mental Health Care Cluster: Common Mental Health Problems (Low Severity | ||
| with Greater Need) | 60 | 64 |
| Non-Psychotic (Moderate Severity) | 36 | 41 |
| Other | 3 | 6 |
| Number of previous referrals (in last two years): None | 66 | 72 |
| 1 | 23 | 21 |
| 2 or more | 8 | 7 |
| Base | 733 | 5,907 |
Appendix C: Benefit outcomes at weeks 13, 26, 39 and 52
Table C.1 Impact of Employment Advisers on benefit receipt at 13, 26, 39 and 52 weeks among those working on entry to IAPT
On entry to IAPT
| Benefit | EA group | Matched comparison group | Pp difference | p-value |
|---|---|---|---|---|
| Any out of work benefit: % receipt | 4 | 4 | 0 | 0.609 |
| Unemployment benefit: % receipt | 2 | 1 | 0 | 0.600 |
| Other out of work benefit: % receipt | 3 | 3 | 0 | 0.827 |
| Disability benefit: % receipt | 3 | 3 | 0 | 0.662 |
| Base: all in work on entry to IAPT | 1,706 | 11,212 |
At 13 weeks
| Benefit | EA group | Matched comparison group | Pp difference | p-value |
|---|---|---|---|---|
| Any out of work benefit: % receipt | 7 | 5 | 2 | 0.020* |
| Unemployment benefit: % receipt | 3 | 2 | 2 | <0.001* |
| Other out of work benefit: % receipt | 4 | 3 | 1 | 0.049* |
| Disability benefit: % receipt | 4 | 3 | 0 | 0.251 |
| Base: all in work on entry to IAPT | 1,706 | 11,212 |
At 26 weeks
| Benefit | EA group | Matched comparison group | Pp difference | p-value |
|---|---|---|---|---|
| Any out of work benefit: % receipt | 9 | 6 | 3 | <0.001* |
| Unemployment benefit: % receipt | 5 | 3 | 2 | <0.001* |
| Other out of work benefit: % receipt | 4 | 3 | 1 | 0.011* |
| Disability benefit: % receipt | 5 | 4 | 1 | 0.069 |
| Base: all in work on entry to IAPT | 1,706 | 11,212 |
At 39 weeks
| Benefit | EA group | Matched comparison group | Pp difference | p-value |
|---|---|---|---|---|
| Any out of work benefit: % receipt | 11 | 7 | 4 | <0.001* |
| Unemployment benefit: % receipt | 5 | 3 | 2 | <0.001* |
| Other out of work benefit: % receipt | 5 | 4 | 2 | <0.001* |
| Disability benefit: % receipt | 5 | 4 | 1 | 0.069 |
| Base: all in work on entry to IAPT | 1,706 | 11,212 |
At 52 weeks
| Benefit | EA group | Matched comparison group | Pp difference | p-value |
|---|---|---|---|---|
| Any out of work benefit: % receipt | 12 | 8 | 4 | <0.001* |
| Unemployment benefit: % receipt | 6 | 4 | 2 | <0.001* |
| Other out of work benefit: % receipt | 6 | 4 | 1 | <0.002* |
| Disability benefit: % receipt | 5 | 4 | 1 | 0.095 |
| Base: all in work on entry to IAPT | 1,706 | 11,212 |
Table C.2 Impact of Employment Advisers on benefit receipt at 13, 26, 39 and 52 weeks among those on Statutory Sick Pay on entry to IAPT
On entry to IAPT
| Benefit | EA group | Matched comparison group | Pp difference | p-value |
|---|---|---|---|---|
| Any out of work benefit: % receipt | 6 | 7 | 0 | 0.123 |
| Unemployment benefit: % receipt | 1 | 2 | -1 | 0.600 |
| Other out of work benefit: % receipt | 5 | 5 | 0 | 0.827 |
| Disability benefit: % receipt | 6 | 5 | 0 | 0.199 |
| Base: all in work on entry to IAPT | 488 | 852 |
At 13 weeks
| Benefit | EA group | Matched comparison group | Pp difference | p-value |
|---|---|---|---|---|
| Any out of work benefit: % receipt | 10 | 10 | 0 | 0.529 |
| Unemployment benefit: % receipt | 4 | 4 | 0 | <0.519 |
| Other out of work benefit: % receipt | 6 | 6 | 0 | 0.937 |
| Disability benefit: % receipt | 7 | 7 | 0 | 0.705 |
| Base: all in work on entry to IAPT | 488 | 852 |
At 26 weeks
| Benefit | EA group | Matched comparison group | Pp difference | p-value |
|---|---|---|---|---|
| Any out of work benefit: % receipt | 14 | 10 | 5 | <0.002* |
| Unemployment benefit: % receipt | 6 | 4 | 2 | <0.018* |
| Other out of work benefit: % receipt | 8 | 6 | 2 | 0.067 |
| Disability benefit: % receipt | 9 | 8 | 1 | 0.417 |
| Base: all in work on entry to IAPT | 488 | 852 |
At 39 weeks
| Benefit | EA group | Matched comparison group | Pp difference | p-value |
|---|---|---|---|---|
| Any out of work benefit: % receipt | 16 | 11 | 5 | <0.002* |
| Unemployment benefit: % receipt | 7 | 4 | 3 | <0.005* |
| Other out of work benefit: % receipt | 9 | 7 | 2 | <0.149 |
| Disability benefit: % receipt | 10 | 9 | 1 | 0.398 |
| Base: all in work on entry to IAPT | 488 | 852 |
At 52 weeks
| Benefit | EA group | Matched comparison group | Pp difference | p-value |
|---|---|---|---|---|
| Any out of work benefit: % receipt | 17 | 11 | 6 | <0.001* |
| Unemployment benefit: % receipt | 7 | 3 | 3 | <0.001* |
| Other out of work benefit: % receipt | 10 | 7 | 3 | <0.035* |
| Disability benefit: % receipt | 10 | 9 | 2 | 0.275 |
| Base: all in work on entry to IAPT | 488 | 852 |
Table C.3 Impact of Employment Advisers on benefit receipt at 13, 26, 39 and 52 weeks among those out of work on entry to IAPT
On entry to IAPT
| Benefit | EA group | Matched comparison group | Pp difference | p-value |
|---|---|---|---|---|
| Any out of work benefit: % receipt | 44 | 45 | -1 | 0.939 |
| Unemployment benefit: % receipt | 23 | 23 | 0 | 0.619 |
| Other out of work benefit: % receipt | 21 | 21 | -1 | 0.642 |
| Disability benefit: % receipt | 15 | 15 | 0 | 0.943 |
| Base: all in work on entry to IAPT | 733 | 5,907 |
At 13 weeks
| Benefit | EA group | Matched comparison group | Pp difference | p-value |
|---|---|---|---|---|
| Any out of work benefit: % receipt | 46 | 44 | 2 | 0.035* |
| Unemployment benefit: % receipt | 24 | 20 | 4 | <0.003* |
| Other out of work benefit: % receipt | 23 | 24 | -2 | 0.364 |
| Disability benefit: % receipt | 16 | 17 | -1 | 0.270 |
| Base: all in work on entry to IAPT | 733 | 5,907 |
At 26 weeks
| Benefit | EA group | Matched comparison group | Pp difference | p-value |
|---|---|---|---|---|
| Any out of work benefit: % receipt | 46 | 43 | 4 | 0.002* |
| Unemployment benefit: % receipt | 22 | 17 | 5 | <0.001* |
| Other out of work benefit: % receipt | 24 | 26 | -1 | 0.780 |
| Disability benefit: % receipt | 17 | 18 | -1 | 0.057 |
| Base: all in work on entry to IAPT | 733 | 5,907 |
At 39 weeks
| Benefit | EA group | Matched comparison group | Pp difference | p-value |
|---|---|---|---|---|
| Any out of work benefit: % receipt | 44 | 41 | 2 | <0.058 |
| Unemployment benefit: % receipt | 19 | 15 | 4 | <0.004* |
| Other out of work benefit: % receipt | 24 | 26 | -2 | <0.533 |
| Disability benefit: % receipt | 17 | 19 | -2 | 0.077 |
| Base: all in work on entry to IAPT | 733 | 5,907 |
At 52 weeks
| Benefit | EA group | Matched comparison group | Pp difference | p-value |
|---|---|---|---|---|
| Any out of work benefit: % receipt | 42 | 40 | 2 | <0.049* |
| Unemployment benefit: % receipt | 18 | 15 | 3 | <0.012* |
| Other out of work benefit: % receipt | 24 | 25 | -1 | <0.035* |
| Disability benefit: % receipt | 17 | 20 | -2 | 0.011* |
| Base: all in work on entry to IAPT | 733 | 5,907 |
Appendix D: Generating the matched comparison samples (propensity score matching)
This report compares outcomes of clients seeing an Employment Adviser (EA) with those of a matched comparison group. The matched comparison group is essentially a weighted version of the therapy-only group, with the purpose being to generate a weighted sample that, on entry to Improving Access to Psychological Therapies (IAPT), has a very similar profile to the EA clients. The matched comparison group is then assumed to give an estimate of the counterfactual for EA clients, with any significant difference in outcomes for the EA client and matched comparison groups being evidence of impact.
Three matched comparison groups have been generated:
1. Matched comparison group for the EA clients in work but not on Statutory Sick. Pay (SSP) on entry to IAPT
2. Matched comparison group for the EA clients on SSP on entry to IAPT.
3. Matched comparison group for the EA clients out of work on entry to IAPT.
For all three, the matched comparison group was generated using propensity score matching, the main steps of which are:
- The probability (or propensity) of an individual receiving EA support (rather than the therapy only group) is estimated from a logistic regression model of the data. The binary outcome variable in the model is the group (1=EA client; 0=therapy only), and the predictors are all the characteristics and outcomes collected baseline plus the Department for Work and Pensions (DWP) benefit history data.
- The therapy-only group is then weighted so that the distribution of propensity scores in the therapy-only group is the same as in the EA group.
To ensure as good a match as possible, six separate propensity score models were run in total for six separate sub-groups. This allows for the possibility that the predictors of taking up EA support may differ depending on Work and Social Adjustment Scale (WSAS) ability to work score for those employed, and for different sub-groups of the out of work, without the need to introduce multiple interaction terms into the models:
Model 1: Those in work on entry to IAPT and not on SSP, but with a WSAS ability to work score of 0 to 5.
Model 2: Those in work on entry to IAPT and not on SSP, and with a WSAS ability to work score of 6 to 8, and 9.
Model 3: Those on SSP on entry to IAPT.
Model 4: Long-term sick or disabled.
Model 5: Unemployed.
Model 6: Other inactive.
The technical details of the matching undertaken are as follows:
- The logistic regression model was fitted within SPSS with PHQ-9 and GAD-7 scores initially entered (to ensure a good match on these two key baseline variables), and forward stepwise selection of all other variables.
- The weights for the therapy-only group were calculated as inverse propensity weights (i.e. p/1-p). Therapy-only group members who are very similar to EA clients, and hence have a high propensity score, are given a large weight; therapy-only group members who are dissimilar to EA clients, and hence have a low propensity score are given a small weight.
- Extreme weights (below or above the 2nd and 98th percentiles) were trimmed.
The propensity score matching was repeated for the WSAS ability to work outcomes and for the benefits at 78 weeks’ outcomes, because these outcomes are only available for a sub-set of clients.
The matching variables included in the propensity score models were:
- Gender
- Age group (19-24; 25-29; 30-34; 35-39; 40-44; 45-49; 50-54; 55-59; 60-66)
- Ethnic group (Back and Minority Ethnic (BME); white/not recorded)
- Whether disabled (disabled; not disabled/not recorded)
- Whether has a long-standing condition (long-term condition; no long-term condition/not recorded)
- Whether on prescribed psychotropic medicine (prescribed; not prescribed/not recorded)
- Number of previous referrals to IAPT (0; 1; 2 or more)
- Detailed employment status
- Index of multiple deprivation quintile
- Benefit receipt in the two years prior to assessment
- number of weeks on any out of work benefit in six months before assessment (entered as continuous variable)
- number of weeks on any out of work benefit in six to 12 months before assessment (entered as continuous variable)
- number of weeks on any out of work benefit in 12 to 18 months before assessment (entered as continuous variable)
- number of weeks on any out of work benefit in 18 to 24 months before assessment (entered as continuous variable)
- number of weeks on any unemployed benefit in six months before assessment (entered as continuous variable)
- number of weeks on any unemployed benefit in six to 12 months before assessment (entered as continuous variable)
- number of weeks on any unemployed benefit in 12 to 18 months before assessment (entered as continuous variable)
- number of weeks on any unemployed benefit in 18 to 24 months before assessment (entered as continuous variable)
- number of weeks on any other out of work benefit in six months before assessment (entered as continuous variable)
- number of weeks on any other out of work benefit in six to 12 months before assessment (entered as continuous variable)
- number of weeks on any other out of work benefit in 12 to 18 months before assessment (entered as continuous variable)
- number of weeks on any other out of work benefit in 18 to 24 months before assessment (entered as continuous variable)
- number of weeks on any disability benefit in six months before assessment (entered as continuous variable)
- number of weeks on any disability benefit in six to 12 months before assessment (entered as continuous variable)
- number of weeks on any disability benefit in 12 to 18 months before assessment (entered as continuous variable)
- number of weeks on any disability benefit in 18 to 24 months before assessment (entered as continuous variable)
- on an out of work benefit on the assessment date
- on an unemployment benefit on the assessment date
- on another out of work benefit on the assessment date
- on a disability benefit on the assessment date
- Grouped PHQ-9 score at assessment
- Grouped GAD-7 score at assessment
- Grouped WSAS score at assessment
- Grouped WSAS ability to work score at assessment
- Mental Health care cluster (Common Mental Health Problems (Low Severity with Greater Need); Non-Psychotic (Moderate Severity); other)
- Social phobia score at assessment (entered as continuous variable)
- Agoraphobia score at assessment (entered as continuous variable)
- Specific phobia score at assessment (entered as continuous variable)
- Area (Dorset; Southampton)
- Assessment date grouped (divided into quintiles).
A reasonable test of whether the propensity score matching has generated a good matched comparison group is simply to compare the profiles of the two groups: EA client and matched comparison. The matching is judged to have been successful if there are no statistically significant differences between the two groups on any of the matching variables – which is the case. Table D.1 shows the profile of the EA and matched comparison groups for the three main client groups.
Table D.1: Baseline differences between the participants and matched comparison groups
Working on entry to IAPT
| Demographic | EA group (%) | Matched comparison group (%) | p-value EA |
|---|---|---|---|
| Gender | 0.467 | ||
| Female | 62 | 63 | |
| Male | 38 | 37 | |
| Age group | 1.000 | ||
| 19 to 24 | 8 | 8 | |
| 25 to 29 | 15 | 15 | |
| 30 to 34 | 13 | 14 | |
| 35 to 39 | 12 | 12 | |
| 40 to 44 | 12 | 12 | |
| 45 to 49 | 12 | 12 | |
| 50 to 54 | 10 | 10 | |
| 55 to 59 | 11 | 11 | |
| 60 to 66 | 7 | 7 | |
| Ethnic group | 0.265 | ||
| White/not stated | 95 | 95 | |
| BME | 5 | 5 | |
| Disabled | 0.321 | ||
| No Disability/not available | 95 | 95 | |
| Has Disability | 5 | 5 | |
| Long-term health condition | 0.598 | ||
| No/not available | 65 | 65 | |
| Yes | 35 | 35 | |
| Whether on prescribed medication | 0.328 | ||
| No | 48 | 47 | |
| Yes | 52 | 53 | |
| Employment status at assessment | 0.910 | ||
| Employed full-time | 71 | 71 | |
| Employed part-time | 22 | 22 | |
| Employed zero hours contract | 1 | 1 | |
| Full time homemaker or carer | |||
| Full-time student | |||
| Long term sick or disabled | |||
| Not receiving benefits and not working or actively seeking work | |||
| Self employed | 6 | 6 | |
| Unemployed | |||
| Unpaid voluntary work (not actively seeking work) | |||
| On an out of work benefit on assessment date | 0.751 | ||
| No | 96 | 96 | |
| Yes | 4 | 4 | |
| On an unemployment benefit on assessment date | 0.256 | ||
| No | 98 | 99 | |
| Yes | 2 | 1 | |
| On any other out of work benefit on assessment date | 0.669 | ||
| No | 97 | 97 | |
| Yes | 3 | 3 | |
| On a disability benefit on assessment date | 0.854 | ||
| No | 97 | 97 | |
| Yes | 3 | 3 | |
| PHQ-9 categories | 0.999 | ||
| No depression (0 to 4) | 1 | 1 | |
| Mild depression (5 to 9) | 10 | 10 | |
| Moderate depression (10 to 14) | 31 | 31 | |
| Moderately severe depression (15 to 19) | 32 | 32 | |
| Severe depression (20 to 27) | 26 | 26 | |
| GAD-7 categories | 0.999 | ||
| No anxiety (0 to 4) | 2 | 2 | |
| Mild anxiety (5to 9) | 17 | 17 | |
| Moderate anxiety (10 to 14) | 33 | 33 | |
| Severe anxiety (15 to 21) | 47 | 47 | |
| Work and Social Adjustment scale | 0.801 | ||
| Low impairment (0 to 9) | 11 | 11 | |
| Moderate impairment (10 to 20) | 43 | 43 | |
| Severe impairment (21 to 40) | 46 | 47 | |
| Work and Social Adjustment - work | 0.999 | ||
| None (0) | 4 | 4 | |
| Slightly (1 to 2) | 14 | 14 | |
| Definitely (3 to 5) | 26 | 26 | |
| Markedly (6 to 7) | 32 | 31 | |
| Very severely (8) | 19 | 19 | |
| Not answered (9) | 6 | 6 | |
| Mental Health Care Cluster | 0.923 | ||
| Common Mental Health Problems (Low Severity with Greater Need) | 67 | 67 | |
| Non-Psychotic (Moderate Severity) | 28 | 29 | |
| Other | 5 | 5 | |
| Number of previous referrals (in last two years) | 0.814 | ||
| None | 79 | 79 | |
| 1 | 17 | 17 | |
| 2 or more | 3 | 4 | |
| Mean | Mean | ||
| Number of weeks on any out of work benefit in six months before assessment | 1.00 | 1.02 | 0.843 |
| Number of weeks on any out of work benefit in six to 12 months before assessment | 0.95 | 0.95 | 0.962 |
| Number of weeks on any out of work benefit in 12 to 18 months before assessment | 0.91 | 0.93 | 0.903 |
| Number of weeks on any out of work benefit in 18 to 24 months before assessment | 0.87 | 0.88 | 0.947 |
| Number of weeks on any unemployed benefit in six months before assessment | 0.40 | 0.36 | 0.534 |
| Number of weeks on any unemployed benefit in six to 12 months before assessment | 0.38 | 0.32 | 0.406 |
| Number of weeks on any unemployed benefit in 12 to 18 months before assessment | 0.34 | 0.31 | 0.671 |
| Number of weeks on any unemployed benefit in 18 to 24 months before assessment | 0.37 | 0.30 | 0.302 |
| Number of weeks on any other out of work benefit in six months before assessment | 0.60 | 0.66 | 0.464 |
| Number of weeks on any other out of work benefit in six to 12 months before assessment | 0.58 | 0.63 | 0.580 |
| Number of weeks on any other out of work benefit in 12 to 18 months before assessment | 0.57 | 0.61 | 0.652 |
| Number of weeks on any other out of work benefit in 18 to 24 months before assessment | 0.50 | 0.58 | 0.364 |
| Number of weeks on any disability benefit in six months before assessment | 0.72 | 0.73 | 0.917 |
| Number of weeks on any disability benefit in six to 12 months before assessment | 0.71 | 0.68 | 0.799 |
| Number of weeks on any disability benefit in 12 to 18 months before assessment | 0.66 | 0.66 | 0.997 |
| Number of weeks on any disability benefit in 18 to 24 months before assessment | 0.66 | 0.66 | 0.974 |
| Phobia Scales | |||
| Social phobia score | 3.46 | 3.49 | 0.634 |
| Agoraphobia score | 2.85 | 2.80 | 0.404 |
| Specific phobia score | 2.28 | 2.28 | 0.917 |
| Bases: | 1,706 | 11,212 |
Off work sick on entry to IAPT
| Demographic | EA group (%) | Matched comparison group (%) | p-value EA |
|---|---|---|---|
| Gender | 0.419 | ||
| Female | 63 | 65 | |
| Male | 37 | 35 | |
| Age group | 1.000 | ||
| 19 to 24 | 4 | 4 | |
| 25 to 29 | 6 | 6 | |
| 30 to 34 | 9 | 8 | |
| 35 to 39 | 10 | 10 | |
| 40 to 44 | 12 | 12 | |
| 45 to 49 | 15 | 14 | |
| 50 to 54 | 17 | 16 | |
| 55 to 59 | 18 | 18 | |
| 60 to 66 | 11 | 11 | |
| Ethnic group | 0.645 | ||
| White/not stated | 97 | 97 | |
| BME | 3 | 3 | |
| Disabled | 0.638 | ||
| No Disability/not available | 91 | 92 | |
| Has Disability | 9 | 8 | |
| Long-term health condition | 0.743 | ||
| No/not available | 57 | 58 | |
| Yes | 43 | 42 | |
| Whether on prescribed medication | 0.684 | ||
| No | 31 | 30 | |
| Yes | 69 | 70 | |
| Employment status at assessment | 0.316 | ||
| Employed full-time | 78 | 74 | |
| Employed part-time | 22 | 25 | |
| Employed zero hours contract | 0 | ||
| Full time homemaker or carer | |||
| Full-time student | |||
| Long term sick or disabled | |||
| Not receiving benefits and not working or actively seeking work | |||
| Self employed | 0 | 1 | |
| Unemployed | |||
| Unpaid voluntary work (not actively seeking work) | |||
| On an out of work benefit on assessment date | 0.746 | ||
| No | 94 | 93 | |
| Yes | 6 | 7 | |
| On an unemployment benefit on assessment date | 0.369 | ||
| No | 99 | 98 | |
| Yes | 1 | 2 | |
| On any other out of work benefit on assessment date | 0.855 | ||
| No | 95 | 95 | |
| Yes | 5 | 5 | |
| On a disability benefit on assessment date | 0.955 | ||
| No | 94 | 95 | |
| Yes | 6 | 5 | |
| PHQ-9 categories | 0.996 | ||
| No depression (0 to 4) | 1 | 1 | |
| Mild depression (5 to 9) | 5 | 5 | |
| Moderate depression (10 to 14) | 23 | 23 | |
| Moderately severe depression (15 to 19) | 35 | 35 | |
| Severe depression (20 to 27) | 36 | 37 | |
| GAD-7 categories | 1.000 | ||
| No anxiety (0 to 4) | 1 | 1 | |
| Mild anxiety (5to 9) | 16 | 15 | |
| Moderate anxiety (10 to 14) | 28 | 28 | |
| Severe anxiety (15 to 21) | 56 | 55 | |
| Work and Social Adjustment scale | 0.474 | ||
| Low impairment (0 to 9) | 5 | 5 | |
| Moderate impairment (10 to 20) | 37 | 34 | |
| Severe impairment (21 to 40) | 58 | 61 | |
| Work and Social Adjustment - work | 0.999 | ||
| None (0) | 1 | 1 | |
| Slightly (1 to 2) | 3 | 3 | |
| Definitely (3 to 5) | 10 | 10 | |
| Markedly (6 to 7) | 21 | 20 | |
| Very severely (8) | 60 | 60 | |
| Not answered (9) | 5 | 5 | |
| Mental Health Care Cluster | 0.964 | ||
| Common Mental Health Problems (Low Severity with Greater Need) | 73 | 73 | |
| Non-Psychotic (Moderate Severity) | 24 | 24 | |
| Other | 3 | 3 | |
| Number of previous referrals (in last two years) | 0.166 | ||
| None | 83 | 79 | |
| 1 | 14 | 19 | |
| 2 or more | 2 | 2 | |
| Mean | Mean | ||
| Number of weeks on any out of work benefit in six months before assessment | 0.90 | 1.26 | 0.175 |
| Number of weeks on any out of work benefit in six to 12 months before assessment | 0.49 | 0.68 | 0.337 |
| Number of weeks on any out of work benefit in 12 to 18 months before assessment | 0.52 | 0.73 | 0.339 |
| Number of weeks on any out of work benefit in 18 to 24 months before assessment | 0.68 | 0.66 | 0.920 |
| Number of weeks on any unemployed benefit in six months before assessment | 0.16 | 0.28 | 0.142 |
| Number of weeks on any unemployed benefit in six to 12 months before assessment | 0.07 | 0.10 | 0.490 |
| Number of weeks on any unemployed benefit in 12 to 18 months before assessment | 0.10 | 0.15 | 0.545 |
| Number of weeks on any unemployed benefit in 18 to 24 months before assessment | 0.08 | 0.16 | 0.172 |
| Number of weeks on any other out of work benefit in six months before assessment | 0.74 | 0.98 | 0.309 |
| Number of weeks on any other out of work benefit in six to 12 months before assessment | 0.42 | 0.59 | 0.399 |
| Number of weeks on any other out of work benefit in 12 to 18 months before assessment | 0.42 | 0.58 | 0.420 |
| Number of weeks on any other out of work benefit in 18 to 24 months before assessment | 0.60 | 0.50 | 0.640 |
| Number of weeks on any disability benefit in six months before assessment | 1.14 | 1.19 | 0.901 |
| Number of weeks on any disability benefit in six to 12 months before assessment | 0.97 | 0.88 | 0.773 |
| Number of weeks on any disability benefit in 12 to 18 months before assessment | 0.91 | 0.82 | 0.773 |
| Number of weeks on any disability benefit in 18 to 24 months before assessment | 0.82 | 0.77 | 0.861 |
| Phobia Scales | |||
| Social phobia score | 3.77 | 3.89 | 0.452 |
| Agoraphobia score | 3.43 | 3.49 | 0.715 |
| Specific phobia score | 2.42 | 2.43 | 0.983 |
| Bases: | 488 | 852 |
Out of work on entry to IAPT
| Demographic | EA group (%) | Matched comparison group (%) | p-value EA |
|---|---|---|---|
| Gender | 0.155 | ||
| Female | 55 | 58 | |
| Male | 45 | 42 | |
| Age group | 0.878 | ||
| 19 to 24 | 16 | 16 | |
| 25 to 29 | 15 | 14 | |
| 30 to 34 | 9 | 10 | |
| 35 to 39 | 9 | 9 | |
| 40 to 44 | 8 | 8 | |
| 45 to 49 | 12 | 11 | |
| 50 to 54 | 11 | 12 | |
| 55 to 59 | 10 | 9 | |
| 60 to 66 | 10 | 10 | |
| Ethnic group | 0.862 | ||
| White/not stated | 93 | 93 | |
| BME | 7 | 7 | |
| Disabled | 0.848 | ||
| No Disability/not available | 88 | 88 | |
| Has Disability | 12 | 12 | |
| Long-term health condition | 0.211 | ||
| No/not available | 58 | 55 | |
| Yes | 42 | 45 | |
| Whether on prescribed medication | 0.600 | ||
| No | 43 | 42 | |
| Yes | 57 | 58 | |
| Employment status at assessment | 0.163 | ||
| Employed full-time | |||
| Employed part-time | |||
| Employed zero hours contract | |||
| Full time homemaker or carer | 7 | 6 | |
| Full-time student | 8 | 10 | |
| Long term sick or disabled | 16 | 16 | |
| Not receiving benefits and not working or actively seeking work | 1 | 0 | |
| Self employed | |||
| Unemployed | 68 | 68 | |
| Unpaid voluntary work (not actively seeking work) | 0 | 0 | |
| On an out of work benefit on assessment date | 0.639 | ||
| No | 56 | 55 | |
| Yes | 44 | 45 | |
| On an unemployment benefit on assessment date | 0.885 | ||
| No | 77 | 77 | |
| Yes | 23 | 23 | |
| On any other out of work benefit on assessment date | 0.466 | ||
| No | 79 | 78 | |
| Yes | 21 | 22 | |
| On a disability benefit on assessment date | 0.937 | ||
| No | 85 | 85 | |
| Yes | 15 | 15 | |
| PHQ-9 categories | 0.991 | ||
| No depression (0 to 4) | 1 | 1 | |
| Mild depression (5 to 9) | 6 | 6 | |
| Moderate depression (10 to 14) | 26 | 25 | |
| Moderately severe depression (15 to 19) | 31 | 32 | |
| Severe depression (20 to 27) | 36 | 36 | |
| GAD-7 categories | 1.000 | ||
| No anxiety (0 to 4) | 2 | 2 | |
| Mild anxiety (5to 9) | 15 | 15 | |
| Moderate anxiety (10 to 14) | 34 | 34 | |
| Severe anxiety (15 to 21) | 49 | 49 | |
| Work and Social Adjustment scale | 0.229 | ||
| Low impairment (0 to 9) | 7 | 9 | |
| Moderate impairment (10 to 20) | 35 | 33 | |
| Severe impairment (21 to 40) | 57 | 58 | |
| Work and Social Adjustment - work | 0.974 | ||
| None (0) | 2 | 2 | |
| Slightly (1 to 2) | 6 | 6 | |
| Definitely (3 to 5) | 11 | 11 | |
| Markedly (6 to 7) | 19 | 18 | |
| Very severely (8) | 30 | 30 | |
| Not answered (9) | 33 | 34 | |
| Mental Health Care Cluster | 0.970 | ||
| Common Mental Health Problems (Low Severity with Greater Need) | 60 | 60 | |
| Non-Psychotic (Moderate Severity) | 36 | 37 | |
| Other | 3 | 3 | |
| Number of previous referrals (in last two years) | 0.296 | ||
| None | 68 | 70 | |
| 1 | 23 | 23 | |
| 2 or more | 8 | 7 | |
| Mean | Mean | ||
| Number of weeks on any out of work benefit in six months before assessment | 9.47 | 9.79 | 0.502 |
| Number of weeks on any out of work benefit in six to 12 months before assessment | 7.85 | 8.15 | 0.508 |
| Number of weeks on any out of work benefit in 12 to 18 months before assessment | 7.16 | 7.41 | 0.578 |
| Number of weeks on any out of work benefit in 18 to 24 months before assessment | 6.57 | 6.74 | 0.701 |
| Number of weeks on any unemployed benefit in six months before assessment | 4.22 | 4.30 | 0.834 |
| Number of weeks on any unemployed benefit in six to 12 months before assessment | 2.81 | 2.95 | 0.668 |
| Number of weeks on any unemployed benefit in 12 to 18 months before assessment | 2.06 | 2.13 | 0.788 |
| Number of weeks on any unemployed benefit in 18 to 24 months before assessment | 1.72 | 1.61 | 0.643 |
| Number of weeks on any other out of work benefit in six months before assessment | 5.24 | 5.49 | 0.536 |
| Number of weeks on any other out of work benefit in six to 12 months before assessment | 5.03 | 5.21 | 0.661 |
| Number of weeks on any other out of work benefit in 12 to 18 months before assessment | 5.10 | 5.28 | 0.653 |
| Number of weeks on any other out of work benefit in 18 to 24 months before assessment | 4.85 | 5.13 | 0.478 |
| Number of weeks on any disability benefit in six months before assessment | 3.55 | 3.56 | 0.989 |
| Number of weeks on any disability benefit in six to 12 months before assessment | 3.20 | 3.18 | 0.946 |
| Number of weeks on any disability benefit in 12 to 18 months before assessment | 3.03 | 2.94 | 0.765 |
| Number of weeks on any disability benefit in 18 to 24 months before assessment | 2.82 | 2.78 | 0.907 |
| Phobia Scales | |||
| Social phobia score | 4.07 | 4.12 | 0.643 |
| Agoraphobia score | 3.54 | 3.60 | 0.540 |
| Specific phobia score | 2.71 | 2.78 | 0.513 |
| Bases: | 733 | 5,907 |
Appendix E: Sensitivity of the impact estimates to the selected ‘end-point’ and to the number of EA sessions included
In this report, impacts on mental health and impaired functioning are estimated based on outcomes at the final therapy session. However, an alternative approach would be to base the estimates on outcomes at the final session, whether that be a therapy session or an Employment Adviser (EA) session. Overall, for 28 per cent of the sample of 2,917 clients having seen an EA, the final appointment was with the EA, with the average interval between final therapy session and final EA appointment for this group being 27 days.[footnote 71]
The argument for not using final session, rather than final therapy session, is that to use final session systematically lengthens the period between assessment and outcome for the EA group relative to the matched comparison group. If mental health/functioning outcomes tend to improve over time while clients are engaged with IAPT, this will bias the impact estimates upwards. The way around this would be to control for the time period differences between the two groups, but this is not feasible here because of the anecdotal evidence that one of ways that EAs impact on clients is that they improve engagement with IAPT more generally. Controlling for the time interval would then bias the impact estimates downwards, because it would involve comparing EA clients with a matched comparison sample who had, for other reasons, engaged with IAPT for longer. Overall, the judgement made was that final therapy session leads to less risk of bias.
For completeness, Table E.1 shows estimated impacts for a small range of the mental health outcomes bases on the two approaches: final therapy session, and final session. As hypothesised, the impacts based on final session are slightly larger, the difference being more marked for those off sick at the start of IAPT.
Table E.1 Estimated percentage point impacts based on final therapy session compared to final session[footnote 72]
Working on entry to IAPT
| Health | Percentage point impact based on final therapy session | Percentage point impact based on last session |
|---|---|---|
| PHQ-9: % depression level suggesting caseness | -1 | -2 |
| GAD-7: % anxiety levels suggesting caseness | -1 | -1 |
| % reliable improvement | 2 | 3 |
| % recovery | 1 | 2 |
| % reliable recovery | 1 | 2 |
Off work sick on entry to IAPT
| Health | Percentage point impact based on final therapy session | Percentage point impact based on last session |
|---|---|---|
| PHQ-9: % depression level suggesting caseness | -4 | -7 |
| GAD-7: % anxiety levels suggesting caseness | -4 | -8 |
| % reliable improvement | 4 | 8 |
| % recovery | 4 | 6 |
| % reliable recovery | 4 | 7 |
Out of work on entry to IAPT
| Health | Percentage point impact based on final therapy session | Percentage point impact based on last session |
|---|---|---|
| PHQ-9: % depression level suggesting caseness | -6 | -7 |
| GAD-7: % anxiety levels suggesting caseness | -3 | -5 |
| % reliable improvement | 7 | 8 |
| % recovery | 3 | 3 |
| % reliable recovery | 3 | 3 |
Another aspect to the analysis considered was whether the EA group should be restricted just to those with at least two sessions with an EA. Overall 81[footnote 73] per cent of those seeing an EA had more than one session, but the 19 per cent with just one session could potentially dilute impacts. To test this, those with just one session were excluded and the propensity score matching re-run.
As with the results based on the final session, the impacts are slightly larger if those with just one EA session are excluded from the intervention arm. This does lend support to the overall finding that seeing an EA leads to better mental health outcomes, especially for the out of work group, with multiple EA sessions being better than just one where appropriate. However, those with more than one EA session also had more therapy sessions than those with just one session, so unpicking the contribution of each is difficult.
Table E.2 Estimated percentage point impacts based on all EA group compared to EA group excluding those with just one EA session
Working on entry to IAPT
| Health | Percentage point impact based on all EA group | Percentage point impact for those with 2+ EA sessions |
|---|---|---|
| PHQ-9: % depression level suggesting caseness | -1 | -2 |
| GAD-7: % anxiety levels suggesting caseness | -1 | -2 |
| % reliable improvement | 2 | 3 |
| % recovery | 1 | 2 |
| % reliable recovery | 1 | 2 |
Off Work sick on entry to IAPT
| Health | Percentage point impact based on all EA group | Percentage point impact for those with 2+ EA sessions |
|---|---|---|
| PHQ-9: % depression level suggesting caseness | -4 | -5 |
| GAD-7: % anxiety levels suggesting caseness | -4 | -6 |
| % reliable improvement | 4 | 6 |
| % recovery | 4 | 5 |
| % reliable recovery | 4 | 5 |
Out of Work on entry to IAPT
| Health | Percentage point impact based on all EA group | Percentage point impact for those with 2+ EA sessions |
|---|---|---|
| PHQ-9: % depression level suggesting caseness | -6 | -8 |
| GAD-7: % anxiety levels suggesting caseness | -3 | -5 |
| % reliable improvement | 7 | 9 |
| % recovery | 3 | 5 |
| % reliable recovery | 3 | 5 |
Appendix F: Benefit outcomes
Benefit spells were coded into seven binary variables spanning the 104-week period before the IAPT assessment date and for up to 78 weeks after the assessment date. A week was marked as having a claim to a particular benefit or time in employment if at least one day of a spell was contained within the week.
The seven benefits included in this evaluation were:
1. Universal Credit (UC). Introduced from 2013 to replace 6 legacy benefits, including Jobseeker’s Allowance (JSA) and Employment and Support Allowance (ESA).
2. Jobseeker’s Allowance (JSA). The primary legacy benefit paid to unemployed individuals now being replaced by UC.
3. Income Support (IS). A legacy income-related benefit paid to people who have no income or are on a low income, and who cannot actively seek work and now being replaced by UC.
4. Employment Support Allowance (ESA). A legacy benefit for people who have an illness, health condition or disability that affects how much they can work and now being replaced by UC.
5. Incapacity Benefit (IB). A benefit for individuals who could not work due to ill health, replaced by ESA which has since been replaced by UC.
6. Disability Living Allowance (DLA). A benefit for disabled people to help with the cost of living. It is not means tested or conditional on being out of the labour market. It was replaced by Personal Independence Payment (PIP).
7. Personal Independence Payment (PIP). A benefit paid to help with some of the extra costs if an individual has a long term physical or mental health condition or disability. This benefit is not means tested or conditional on being out of the labour market.
Universal Credit
In 2013, a change to the benefit system started its phased rollout in the form of Universal Credit (UC). The intention of UC is to replace 6 legacy benefits, including Jobseeker’s Allowance (JSA) and Employment and Support Allowance (ESA).
UC uses a series of conditionality groups, which determine the amount and type of work-related activity that an individual is required to do to remain eligible for the benefit. These conditionality groups are more fluid than the separate legacy benefits, and claimants move between them much more freely dependent on their circumstances. If a claimant is eligible for more than one conditionality group, they are assigned the group with the lowest level of conditionality, where low levels of conditionality mean there are fewer work-related requirements for a claimant to satisfy to be eligible. In order of lowest to highest levels of conditionality, the groups are as follows:
- Working – no requirements
- No work requirements
- Planning for work
- Preparing for work
- Working – with requirements
- Searching for work
UC conditionality groups do not map directly on to legacy benefit types, and a feature of UC design brings Legacy benefits and UC conditionality groups do not map directly onto one another, so it is only possible to approximate equivalencies between the two systems.
Following The Work Programme Quantitative Impact Assessment, for the purposes of this analysis the following approximations have been made to create four benefit states for a given week:
1. Unemployment benefit. The individual is in receipt of either Jobseeker’s Allowance or Universal Credit with searching for work conditionality. They are likely to be unemployed or working with low earnings.
2. Other out of work benefits. The individual is receiving one or more of Employment and Support Allowance, incapacity Benefit, Income Support or Universal Credit in the following three conditionality groups: preparing for work, planning for work or working with conditionality.
3. Any out of work benefit. An individual is classified as receiving any out of work benefit if they fall into either the Other Out of Work Benefits of Unemployment Benefit group.
4. Disability benefit. When an individual is receiving either Personal Independence Payment or Disability Living Allowance, both are non-means tested benefits that help with some of the extra costs if an individual has a long-term health condition or disability. It is possible to be in receipt of a disability benefit and out of work benefits so these groups are not mutually exclusive.
The table below shows how the legacy and Universal Credit conditionality groups have been combined in this analysis.
| Benefit/employment status | Existing Benefit | Legacy Benefit | Universal Credit | Out of Work Benefit | JSA and UC searching for work | Other OW benefits | Disability Benefit |
|---|---|---|---|---|---|---|---|
| Jobseeker’s Allowance | No | Yes | No | Yes | Yes | No | No |
| Employment and Support Allowance | No | Yes | No | Yes | No | Yes | No |
| Incapacity Benefit | No | Yes | No | Yes | No | Yes | No |
| Income Support | No | Yes | No | Yes | No | Yes | No |
| Searching for Work | No | No | Yes | Yes | Yes | No | No |
| Working – with requirements | No | No | Yes | Yes | No | Yes | No |
| Planning for Work | No | No | Yes | Yes | No | Yes | No |
| Preparing for Work | No | No | Yes | Yes | No | Yes | No |
| Working – no requirements | No | No | Yes | No | No | No | No |
| No work requirements | No | No | Yes | No | No | No | No |
| Personal independence payment | Yes | No | No | No | No | No | Yes |
| Disability Living Allowance | No | Yes | No | No | No | No | Yes |
Appendix G: Sensitivity of the Quality Adjusted Life Years estimates to assumptions made
As is described in Section 2.3, a problem arises in the calculation of the impact on QALYs in this study, because the average time interval between assessment and final therapy session is systematically longer for those seeing an EA relative to the matched comparison groups (the average for the EA group being 163 days and the average for the matched comparison groups being 132 days). This is believed to be an impact of the EAs, so cannot be controlled for (see Section 2.5). The implication is that, even if the impact of seeing an EA on the ReQoL-UI preference scores[footnote 74] was zero, with the mean being the same for both the EA and matched comparison groups, the QALYs would be higher for the EA group (by a factor of 163/132) simply because they are measured over a longer period.
To address this inherent bias in the QALY impacts it is necessary to make some assumptions about what the ReQoL-UI scores would be for the matched comparison group if they had been observed for the same average time interval as the EA group. Firstly, an artificial end time point has been imputed for the matched comparison group, so that the imputed end time points for the matched comparison group is very similar to that of the EA group.[footnote 75] For the main analysis presented in this report, it is then assumed that the ReQoL-UI measured at the final therapy session would hold constant until this imputed time. That is, there is no improvement or deterioration in the ReQoL-UI scores over the imputed period after the end of therapy. In Table G.1 this is ‘Assumption A’.
To test the sensitivity of the findings to this assumption, a second analysis was run where the assumption made was that the upward trend in the ReQoL-UI scores between assessment and final therapy continued[footnote 76]. Inevitably this increases the values of QALYs for the matched comparison groups, with the mean QALY for the three matched comparison groups being uniformly larger than for the EA groups, but the overall finding of no significant impacts on QALYs stays. In Table G.1 this is ‘Assumption B’.
Table G.1: Mean QALYs under the two different assumptions
| Assumption | Working on entry to IAPT | Off work sick on entry to IAPT | Out of work on entry to IAPT |
|---|---|---|---|
| EA group | 0.342 | 0.304 | 0.359 |
| Matched comparison group: Assumption A | 0.345 | 0.310 | 0.356 |
| Matched comparison group: Assumption B | 0.351 | 0.318 | 0.361 |
Appendix H: Mapping the Patient Health Questionnaire-9 and Generalised Anxiety Disorder-7 to the Recovering Quality of Life Index using adjusted limited dependent variable mixture models
Authors
Read about Matthew Franklin
Health Economics and Decision Science (HEDS), ScHARR
University of Sheffield
Regent Court
30 Regent Street
Sheffield
S1 4DA
Email: matt.franklin@sheffield.ac.uk
Read about Monica Hernández Alava
Health Economics and Decision Science (HEDS), ScHARR
University of Sheffield
Regent Court
30 Regent Street
Sheffield
S1 4DA
Email: monica.hernandez@sheffield.ac.uk
Preface and contact information
The following appendix provides an overview of the mapping study used to estimate the mapping function which led to the prediction of the Recovering Quality of Life Utility Index (ReQoL-UI) from Patient Health Questionnaire-9 (PHQ-9) and Generalised Anxiety Disorder-7 (GAD-7) summary scores. The ReQoL-UI predicted values could then be used to estimate quality-adjusted life years (QALYs) for the purpose of the analysis described in the main report. The full mapping study is currently being written up for the purpose of publication in a peer-reviewed journal, with the intention to submit for publication by April 2022.
For those people interested in using the:
mapping function from the PHQ-9 and/or GAD-7 to the ReQoL-UI; contact Dr Matthew Franklin: matt.franklin@sheffield.ac.uk
adjusted limited dependent variable mixture models (ALDVMMs); contact Dr Monica Hernández Alava: monica.hernandez@sheffield.ac.uk
Background
Quality-adjusted life years (QALYs) are often used in order to estimate the cost effectiveness of care interventions. QALYs are a metric measured on a preference based quality-adjustment scale, anchored at 0 (a state equivalent to dead) and 1 (full health), combined with length of life allowing comparisons between interventions that affect quantity and/or quality of life. The preference-based quality-adjustment scale captures health-related quality of life, quantifying a representative sample of a population’s ‘preferences’ between alternative health states; the associated preference-based values are also often referred to as ‘utility’ scores. In comparison, ‘length of life’ tends to be the duration of a study and/or data collection period of interest; for example, if a study focussed on the time period between a baseline assessment and then 8-weeks later as the final assessment point, the ‘length of life’ would be 8-weeks in this instance.
However, often an evidence gap exists between clinical measures of effect that are available, e.g. Patient Health Questionnaire-9 (PHQ-9) and Generalised Anxiety Disorder-7 (GAD-7) as routinely collected IAPT measures, and the detailed preference-based information needed to estimate QALYs. Instruments like the more commonly known and used EQ-5D three-level version (EQ-5D-3L) have preference-based scoring systems and are favoured by organisations such as the National Institute for Health and Care Excellence (NICE) in England and Wales for the estimation of QALYs[footnote 77]. However, the limitations of the EQ-5D-3L in mental health populations have been noted with the suggestion for a more mental health focussed preference-based measure for mental health service users (e.g. IAPT users)[footnote 78]. The Recovering Quality-of-Life 20-item (ReQoL-20) and 10-item (ReQoL-10) versions are ‘recovery-focussed quality-of-life’ measures for mental health service users[footnote 79]. A UK preference-based value set has been developed to calculate QALYs from seven ReQoL-10 items: the ReQoL Utility Index (ReQoL-UI)[footnote 80]. The ReQoL-UI’s developers suggest it’s arguably a more mental health focused generic measure relative to the more physical health focused EQ-5D-3L.
Preference-based measures like the EQ-5D-3L or ReQoL-UI are frequently absent from clinical studies or routine service data collection including in Employment Advisers in IAPT, which prevents the direct calculation of QALYs. The term ‘mapping’ is used to describe the process of estimating a statistical relationship between observed clinical outcome measures and preference-based measures using a dataset (i.e. an estimation dataset) containing both types of information. The estimated ‘mapping’ model can then be used to predict the missing preference-based measures for clinical studies or routine service data collection based on the observed clinical outcome measure information. For the purpose of this study, we focus on the use of adjusted limited dependent variable mixture models (ALDVMM) which was first proposed to deal with the distributional features presented by the EQ-5D-3L[footnote 81]. However, ALDVMM has various advantages over standard models and has already been shown to be useful when modelling other preference-based measures such as EQ-5D five level version (EQ- 5D-5L), Short-Form Six-Dimension (SF-6D), and Health Utilities Index Mark 3 (HUI-3)[footnote 82]. This makes it a viable and desirable model in order to map from the PHQ-9 and GAD-7 to preference-based measures other than the EQ-5D-3L, such as the ReQoL-UI used in this study. The distribution of preference-based measures tends to exhibit characteristics that make standard regression-based models inappropriate for this mapping exercise; e.g. significant departure from a normal distribution.
The ReQoL-UI is designed for use in mental health service users. There is work ongoing to assess its psychometric properties in different groups of mental health service users (e.g. community-based services like IAPT, inpatient and outpatient mental health service users), with some work already completed in an IAPT-based population from which the dataset has been made available for this mapping study[footnote 83].
A 2019 systematic review[footnote 84] only identified one previous mapping study from mental health measures like the PHQ-9 and GAD-7 to preference-based measure such as the EQ-5D and SF-6D; this previous mapping study concluded: “mapping from mental health condition-specific measures, such as the widely used PHQ-9, GAD and HADS, may not be an appropriate approach to generating EQ-5D and SF-6D scores as these measures focus on specific symptoms and not on the wider impact of mental health conditions”[footnote 85].
This previous mapping study did in part inform our decision to map to the ReQoL-UI, as well as the availability of an estimation dataset in an IAPT-based population which included the relevant measures to conduct this mapping study (i.e. ReQoL-UI, PHQ- 9, and GAD-7). We are unaware of any other credible mapping studies from the PHQ-9 and/or GAD-7 to a preference-based measure.
This appendix describes mapping from the GAD-7 and PHQ-9 to the ReQoL-UI based on suggested existing ‘best practice’ mapping methods, a summary of results from the mapping study, and a discussion of the best performing mapping function which has been used for the purpose of analysis as described in the main report.
Methods
Estimation data source
The data for this mapping study was obtained from a parallel-groups, randomised waitlist-controlled trial examining the effectiveness and cost-effectiveness of internetdelivered Cognitive Behavioural Therapy (iCBT) for patients presenting with depression and anxiety which was conducted at an established IAPT service. NHS England Research Ethics Committee provided trial ethics approval (REC Reference:17/NW/0311). The trial was prospectively registered: Current Controlled Trials ISRCTN91967124. The trial is completed with the results published[footnote 86].
Trial participants were recruited between June 2017 and April 2018. The trial inclusion criteria were people: (i) aged between 18-80 years; (ii) above clinical thresholds for depression (PHQ-9 ≥ 10) or anxiety (GAD-7 ≥ 8), and (iii) suitable foriCBT (i.e. willing to use iCBT, internet access). Exclusion criteria included: suicidal ideation/intended (PHQ-9 question 9 score > 2 and/or during clinical interview); psychotic illness; organic mental health disorder; alcohol and/or drug misuse; and currently receiving psychological treatment.
The trial collected data including the ReQoL-UI (score range: -0.195 to 1), PHQ-9 (score range: 0 to 27), and GAD-7 (score range: 0 to 21) at baseline and 8-week across both trial-arms; additional data collection time-points for the intervention-arm only were at 3-, 6-, 9-, and 12-months. All observed case data across all time-points and trial-arms are used for the purpose of this mapping study.
Mapping model and performance statistics
This mapping study is focussed on fitting ALDVMMs to the ReQoL-UI. We used the aldvmm[footnote 87] command within the statistical software package Stata Version 15 for this purpose[footnote 88]. ALDVMMs are flexible models that can approximate many distributional forms by combining (mixing) multiple component distributions; each component’s distribution is allowed to have different parameters.
That is, different measure scores have different distributions; for example, Figure 5 shows the distribution of the ReQoL-UI, PHQ-9, and GAD-7 from the estimation dataset. Whereas some measures’ distributions could be considered to represent a specific type of single parametric distribution (e.g. a normal distribution which visually looks like a bell shape and has specific properties, such as the mean, mode, and median are all equal), preference-based measures in particular don’t have such a simple distribution. In fact, they could have complex shapes that could represent the presence of a combination (mixture) of underlying component distributions within one single distribution (e.g. how sub-populations based on age or gender would have their own distributions within a single distribution representing a whole UK population). The ReQoL-UI’s distribution from our estimation dataset as our overall distribution of interest is presented in Figure 5.
Mixture models, such as ALDVMMs, aim to specify how many underlying distributions may exist (e.g. the number of component distributions), and then quantify to what extent specific parameters (e.g. GAD-7 and PHQ-9 score) suggest where an individual may sit within any given component distribution. Additional ‘probability variables’ (i.e. pvars) predict the probability of each observation belonging to each component (e.g. the probability a person may sit within any specific component distribution, again based on specified parameters such as PHQ- 9 and/or GAD-7 score). We estimated ALDVMMs with 2- to 4-components. For all models, we included PHQ-9 summary score (continuous variable), GAD-7 summary score (continuous variable), age (continuous variable), and gender (binary variable) to predict the ReQoL-UI within the components; however, we evaluate models with different variables and specifications.
To compare results across models, we considered standard model fit measures/criteria such as absolute mean error (AE), mean absolute error (MAE), root mean square error (RMSE), log-likelihood (LL), Akaike information criteria (AIC), Bayesian information criteria (BIC), and graphical methods for model selection in mapping[footnote 89]. An AE closer to zero, higher LL, and lower MAE, RMSE, AIC, and BIC indicated a better fit. Nevertheless, standard measures based on “errors” (i.e. the difference between the observed data and the model prediction) often provide conflicting results because they are based on different scoring functions. For example, RMSE penalizes the existence of large outliers more than MAE. Both AIC and BIC are likelihood-based criteria with a penalty for model complexity, but the penalty BIC imposes tends to be larger, often resulting in AIC and BIC selecting models with different number of parameters. Because of these issues, graphical methods have been shown to be essential for mapping model selection. Specifically, we plotted the mean of the predicted ReQoL-UI scores with the mean observed values by PHQ-9 and GAD-7 scores. We also simulated data from the models and plotted the cumulative distribution functions (CDFs) comparing simulated with observed data across the severity range. Throughout we also followed ISPOR good practice mapping guidance[footnote 90].
Results
Descriptive statistics of the estimation dataset population
Overall, 353 people at baseline across both trial-arms (237 intervention; 116 control) completed the ReQoL-UI, GAD-7, and PHQ-9. There were a total of 1340 observed value scores for each of the ReQoL-UI, GAD-7, and PHQ-9 across the trial’s data collection timepoints. Descriptive statistics of the patient sample (i.e. age and gender) at baseline are presented in Table 1, and ReQoL-UI, GAD-7, and PHQ-9 scores at baseline and across all time-points are presented in Table 1 and Figure 5.
Model fit statistics and comparing mean predicted and observed utility scores
Model fit statistics for 12 ALDVMMs models are presented in Table 2. Generally, increasing the number of components improved model fit and this can be seen within those models with the same pvars. Between pvar specifications, the lowest predictive errors (i.e. lowest MAE and RMSE values) were attained when the pvars were PHQ-9, GAD-7, and gender (e.g. model 6). Including age as an additional pvar does increase goodness of fit (i.e. higher LL and lower AIC values); however, it does so by increasing the predictive error (i.e. increased RMSE and MAE values) for example when comparing between model 3 and 6. The lowest BIC was for model 11 which is not surprising given the way BIC penalises having more variables, despite the benefits the inclusion of more variables has on the performance statistics other than BIC such as for models 3 and 6.
Figure 6 presents the mean predicted and observed utility scores for the two 4-component models deemed to have desirable model fit statistics i.e. model 3 (highest LL, lowest AIC, and AE closest to zero) and model 6 (lowest MAE and RMSE). The benefits of model 6’s lower MAE and RMSE relative to for model 3 becomes more apparent in Figure 6, particularly based on the observed versus predicted utility scores at the lower end of the PHQ-9 score scale i.e. below or equal to 23. That is, we can visually see that the predicted error for model 3 is larger than for model 6 for those people with a PHQ-9 score below or equal to 23. Across the GAD-7 score scale, the predicted errors seems visually similar between models 3 and 6. In terms of the cumulative distribution functions for the two models as shown in Figure 7, there is little difference between the actual and modelled data for both models 3 and 6, so this suggests that both models fit equally well in terms of the distribution.
Choosing a mapping function
Model 6 was chosen for the purpose of mapping to the ReQoL-UI, subsequently used to estimate QALYs in the main report’s analysis. This model was chosen due to its lowest MAE and RMSE (see Table 2), but also based on the visual comparisons across the mean predicted and observed utility scores across the PHQ-9 and GAD-7 score ranges (see Figure 6). Comparisons were made across all 12 models before coming to this decision; however for descriptive purposes within this appendix, we have focussed just on the comparison between model 3 and 6.
Model 6 was a 4-component model where utility within each component was a function of PHQ-9, GAD-7, age, and gender, and the probability of component membership was a function of PHQ-9, GAD-7, and gender. This mapping function has been estimated from an IAPT-based population to be used in an IAPT-based population for the purpose of estimating QALYs when a preference-based measure wasn’t collected, but the PHQ-9 and GAD-7 summary scores were routinely collected and available for analysis.
Anyone interested in using this study’s mapping function can contact the relevant author(s) of this appendix. A range of other model specifications were included in the mapping study with varying degrees of potential desirability for future studies, but are not included in this Appendix. This included mapping functions using just the PHQ-9 or the GAD-7, and mapping to an alternative preference-based measure i.e. the EQ- 5D-5L. These additional analyses and results are not reported here, but are planned to be included in a future peer-reviewed publication; please contact the appendix author(s) for more details.
Conclusion
Our mapping function can be used to predict the ReQoL-UI from the PHQ-9 and GAD-7 summary scores. Our analyses found that including more than one component improved model fit, with the preferred model being based on a 4- component model. Our analyses can be used in economic evaluations to predict utility as a function of variables routinely collected within IAPT services or non-IAPT based mental health trials that collect the PHQ-9 and/or GAD-7.
Table 1: Descriptive statistics of estimation sample at baseline and across the six data collection points
Baseline (N = 353)
| Data type | Mean | SD | Min | Max |
|---|---|---|---|---|
| ReQoL-UI | 0.778 | 0.141 | 0.115 | 0.995 |
| PHQ-9 | 14.4 | 5.0 | 2 | 27 |
| GAD-7 | 12.6 | 4.6 | 0 | 21 |
| Age | 33.0 | 12.3 | 18 | 74 |
| Female, n (%) | 251 (71.1%) | - | - | - |
All time-points (Obs = 1340)
| Data type | Mean | SD | Min | Max |
|---|---|---|---|---|
| ReQoL-UI | 0.819 | 0.145 | 0.114 | 1 |
| PHQ-9 | 9.7 | 6.3 | 0 | 27 |
| GAD-7 | 8.8 | 5.7 | 0 | 21 |
| Age | - | - | - | - |
| Female, n (%) | - | - | - | - |
Footnote. N that completed the ReQoL-UI, PHQ-9, and GAD-7 by time-point: baseline, 353; 8-week, 283; 3-month, 183; 6-month, 179; 9-month, 173; 12- month, 169.
Acronyms. GAD-7, generalised anxiety disorder-7; PHQ-9, patient health questionnatire-9; ReQoL-UI, recovering quality of life – utility index; SD, standard deviation.
Figure 5: Distribution of ReQoL-UI, PHQ-9, and GAD-7 scores at baseline and across all time-points
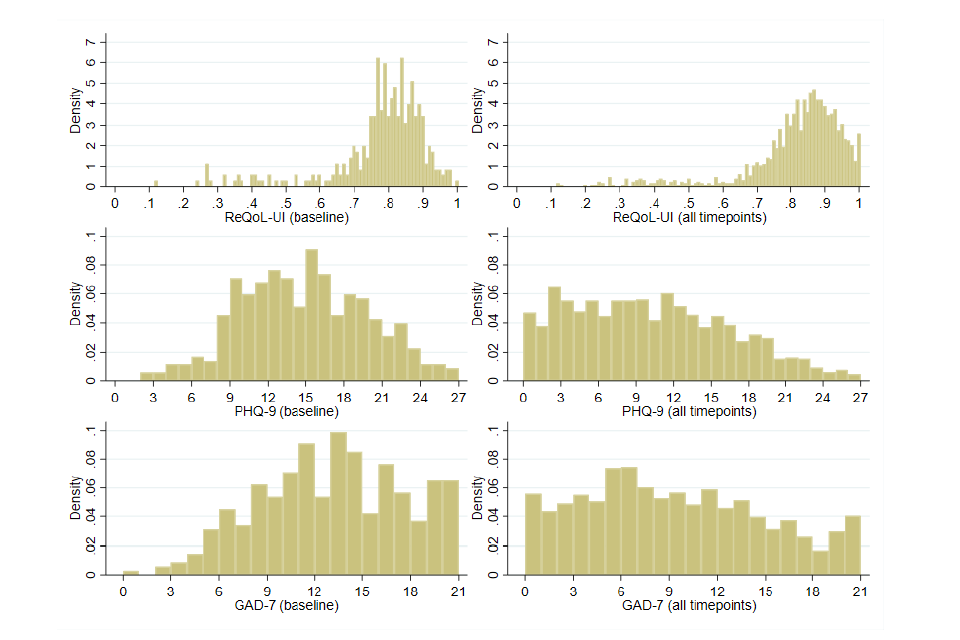
Table 2: Model fit statistics for the ALDVMMs for the ReQoL-UI
| Model No. | Probability variables (p-vars) | Components | DF | LL (higher) AIC (lower) | BIC (lower) | AE (closer to zero) | MAE (lower) | RMSE (lower) | |
|---|---|---|---|---|---|---|---|---|---|
| 1 | PHQ-9, GAD-7, age, gender | 2 | 17 | 1468.78 | -2903.57 | -2815.16 | .00048 | 0.0764 | 0.1199 |
| 2 | PHQ-9, GAD-7, age, gender | 3 | 28 | 1512.10 | -2968.21 | -2822.59 | 0.00020 | 0.0763 | 0.1203 |
| 3 | PHQ-9, GAD-7, age, gender | 4 | 39 | 1534.46 | -2990.93 | -2788.11 | 0.00006 | 0.0758 | 0.1199 |
| 4 | PHQ-9, GAD-7, gender | 2 | 16 | 1468.71 | -2905.41 | -2822.21 | 0.00035 | 0.0763 | 0.1199 |
| 5 | PHQ-9, GAD-7, gender | 3 | 26 | 1509.95 | -2967.91 | -2832.70 | -0.00019 | 0.0760 | 0.1203 |
| 6 | PHQ-9, GAD-7, gender | 4 | 36 | 1510.45 | -2948.90 | -2761.68 | 0.00018 | 0.0751 | 0.1179 |
| 7 | PHQ-9, age, gender | 2 | 16 | 1468.47 | -2904.95 | -2821.74 | 0.00020 | 0.0762 | 0.1198 |
| 8 | PHQ-9, age, gender | 3 | 26 | 1509.11 | -2966.23 | -2831.02 | -0.00019 | 0.0761 | 0.1202 |
| 9 | PHQ-9, age, gender | 4 | 36 | 1511.52 | -2951.03 | -2763.82 | -0.00021 | 0.0761 | 0.1199 |
| 10 | PHQ-9, gender | 2 | 15 | 1468.46 | -2906.91 | -2828.91 | 0.00014 | 0.0762 | 0.1197 |
| 11 | PHQ-9, gender | 3 | 24 | 1507.50 | -2967.00 | -2842.19 | -0.00067 | 0.0758 | 0.1202 |
| 12 | PHQ-9, gender | 4 | 33 | 1518.07 | -2970.14 | -2798.53 | -0.00093 | 0.0757 | 0.1204 |
Footnote
All models used the same number of observations (N = 1340) and the same within component variables (Xvars): PHQ-9, GAD-7, age, gender. The best performing model specification within each performance statistic (i.e. LL, AIC, BIC, AE, MAE, and RMSE) is highlighted using bold font; the model number (Model No) is also highlighted in bold font in this instance. Please note, an AE closer to zero, higher LL, and lower MAE, RMSE, AIC, and BIC indicated a better fit.
Variable types. PHQ-9, GAD-7, and age were classed as continuous variables; gender was classed as a binary variable.
Acronyms. AE, absolute error; AIC, Akaike information criteria; BIC, Bayesian information criteria; DF, degrees of freedom; GAD-7, generalised anxiety disorder-7; LL, log likelihood; MAE, mean absolute error; PHQ-9, patient health questionnatire-9; ReQoL-UI, recovering quality of life – utility index; RMSE, root mean square error.
Figure 6: Mean predicted and observed utility scores for models 3 and 6
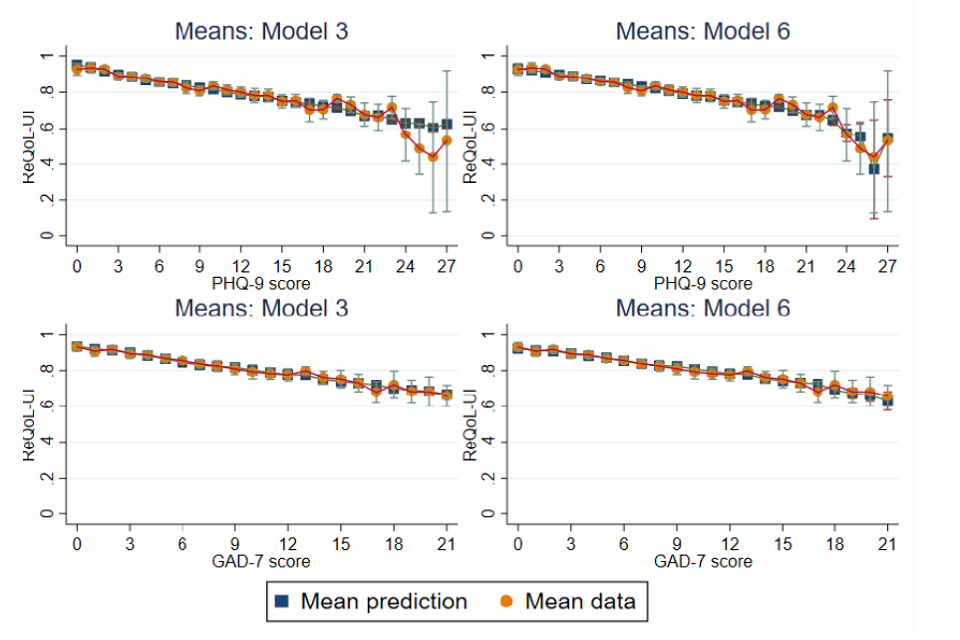
Figure 7: Cumulative distribution function for the simulated data for models 3 and 6
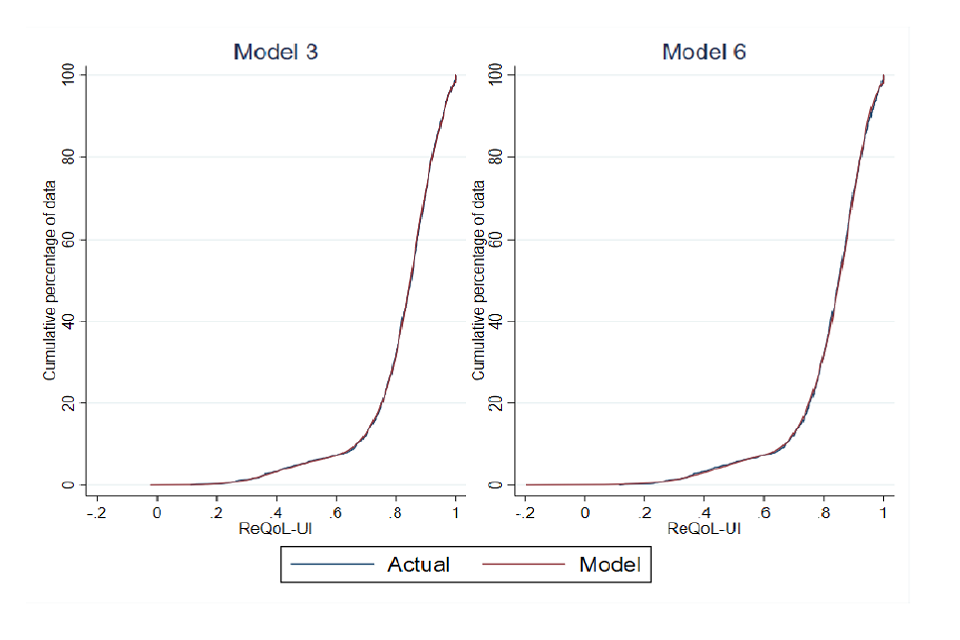
-
Jobseeker’s Allowance or Universal Credit with searching for work conditionality, received by those actively seeking work. ↩
-
Clinically-led statutory NHS bodies responsible for the planning and commissioning of health care services for their local area. ↩
-
Hogarth et al. (2013) Evaluation of Employment Advisers in the Improving Access to Psychological Therapies programme. ↩
-
DWP (2022) Employment Advisers in Improving Access to Psychological Therapies: Client Research. ↩
-
Using propensity score matching including demographic information and outcomes at the start of IAPT. ↩
-
With findings from further time points (13, 26 and 39 weeks included in Appendix C). ↩
-
Jobseeker’s Allowance, Universal Credit, Employment and Support Allowance, Incapacity Benefit and Income Support. ↩
-
Wider evidence suggests that involuntarily moving out of employment is linked with negative impacts on mental health. ↩
-
Jobseeker’s Allowance or Universal Credit with searching for work conditionality, received by those actively seeking work. ↩
-
Personal Independence Payment or Disability Living Allowance. ↩
-
DWP (2022) Employment Advisers in Improving Access to Psychological Therapies: Client Research ↩
-
Hogarth et al. (2013) Evaluation of Employment Advisers in the Improving Access to Psychological Therapies programme. ↩
-
Van Stolk et al. (2014) Psychological Wellbeing and Work. ↩
-
IPS is an employment support service integrated within community mental health teams for people who experience severe mental health conditions. It provides intensive, individual support to people to help them to move towards and into or stay in employment. ↩
-
See: NHS England - The Improving Access to Psychological Therapies Manual ↩
-
DWP (2022) Employment Advisers in Improving Access to Psychological Therapies: Client Research ↩
-
In contrast, the standardly collected IAPT data includes an item collected on their entry to IAPT from the Work and Social Adjustment Scale (WSAS) on the extent to which their health condition impair their ability to work. ↩
-
Appendix A demonstrates how the mental health impacts change if final session (either EA or therapy) is used for the outcome data, rather than therapy appointment. ↩
-
Self-reported receipt of SSP is the closest indicator available for whether a client is off work sick. It is probable that this under-represents those who are off work sick, particularly employees being paid occupational sick pay above the statutory minimum and/or individuals off work sick who do not qualify for SSP. ↩
-
In receipt of Universal Credit, Jobseekers’ Allowance, Employment Support Allowance, Income Support or Incapacity Benefit. ↩
-
For some client records only data on the total WSAS score was included in the dataset, and not the individual items. These records had to be excluded. ↩
-
IAPT data collection requirements also include the collection of feedback from clients in the form of a Patient Experience Questionnaire (PEQ), the results of which are reported in Appendix A. ↩
-
Kroenke K, Spitzer RL, Williams JB. The PHQ-9: validity of a brief depression severity measure. J Gen Intern Med. 2001 Sep;16(9):606-13. doi: 10.1046/j.1525-1497.2001.016009606.x. PMID: 11556941; PMCID: PMC1495268. ↩
-
Spitzer RL, Kroenke K, Williams JB, Löwe B. A brief measure for assessing generalized anxiety disorder: the GAD-7. Arch Intern Med. 2006 May 22;166(10):1092-7. doi: 10.1001/archinte.166.10.1092. PMID: 16717171. ↩
-
It is important to note that a clinical diagnosis of anxiety or depression would take into account a number of factors, rather than rely on a single screening tool. See: https://digital.nhs.uk/binaries/content/assets/website-assets/data-and-information/data-sets/iapt/iapt-v2.0-docs/iapt-v2.0-guidance-document.pdf ↩
-
See: https://digital.nhs.uk/binaries/content/assets/website-assets/data-and-information/data-sets/iapt/iapt-v2.0-docs/iapt-v2.0-guidance-document.pdf ↩
-
See: https://digital.nhs.uk/binaries/content/assets/website-assets/data-and-information/data-sets/iapt/iapt-v2.0-docs/iapt-v2.0-guidance-document.pdf ↩
-
See: https://digital.nhs.uk/binaries/content/assets/website-assets/data-and-information/data-sets/iapt/iapt-v2.0-docs/iapt-v2.0-guidance-document.pdf ↩
-
Model predictive error is in essence the difference between the observed values and the predicted values. ↩
-
The original ReQoL-UI scores range from -0.195 to 1, with values below zero regarded as states worse than dead. ↩
-
This has been done by running the percentiles for the time interval per group and then using a linear regression to model the relationship between the percentile values for the EA group from the percentile values for the matched comparison group. This gives a predicted value for all members of the comparison group. ↩
-
Mundt, J., Marks, I., Shear, M., & Greist, J. (2002). The Work and Social Adjustment Scale: A simple measure of impairment in functioning. British Journal of Psychiatry, 180(5), 461-464.doi:10.1192/bjp.180.5.461 ↩
-
Statements included in this percentage are: ‘I was experiencing difficulties with relationships at work, and wanted advice / support in relation to this’, ‘I was experiencing other difficulties at work, and wanted advice / support in relation to this’, ‘I felt it could help me remain in work’ and ‘Help finding a new line of work / change of career’. ↩
-
The small number of clients who reported being retired were excluded from the analysis. ↩
-
That is, the matched comparison group for the ‘working’ EA group is derived from the therapy-only set of clients who are working. Likewise, for the other two EA groups. ↩
-
The WSAS ability to work statement is ‘Because of my [problem] my ability to work is impaired. ‘0’ means ‘not at all impaired’ and ‘8’ means ‘very severely impaired to the point I can’t work’. ↩
-
Due to rounding, column percentages do not always total 100 per cent. ↩
-
This is based on a forward stepwise logistic regression, with the first variable entered being taken to be the strongest predictor ↩
-
That is, the threshold used by IAPT to suggest that the client probably would receive a diagnosis. However, it is important to note that a clinical diagnosis of depression or anxiety would take into account a number of factors, rather than rely on a single screening tool for each condition. See: A guide to IAPT data and publications ↩
-
See Section 2.3 for an explanation of recovery. ↩
-
See Section 2.3 for an explanation of reliable improvement. ↩
-
See Section 2.3 for an explanation of these measures. ↩
-
See Section 2.3 for an explanation of reliable change in PHQ-9 and GAD-7. ↩
-
That is, the threshold used by IAPT to suggest that the client probably would receive a diagnosis. However, it is important to note that a clinical diagnosis of depression or anxiety would take into account a number of factors, rather than rely on a single screening tool for each condition. See Psychological Therapies A guide to IAPT data and publications ↩
-
In some instances, clients who feel unable to work leave this item unanswered rather than code ‘severely impaired’. Here, an unanswered category is read as a high level of impairment. ↩
-
See Section 2.3 for a description of the measure. ↩
-
Although there is no data on whether or not a client left their work voluntarily. ↩
-
Universal Credit, Jobseekers’ Allowance, Employment Support Allowance, Income Support or Incapacity Benefit. ↩
-
Jobseeker’s Allowance or Universal Credit with searching for work conditionality, received by those actively seeking work. ↩
-
Personal Independence Payment or Disability Living Allowance, both of which can be received by people who are employed or out of work. ↩
-
Mean weeks’ receipt = for baseline and 52 weeks, mean weeks in last year; for 78 weeks, mean weeks in last 18 months. ↩
-
Jobseeker’s Allowance or Universal Credit with searching for work conditionality, received by those actively seeking work. ↩
-
Employment Support Allowance, Income Support, Incapacity Benefit or Universal Credit in the following three conditionality groups: preparing for work, planning for work or working with conditionality. ↩
-
Mean weeks’ receipt = for baseline and 52 weeks, mean weeks in last year; for 78 weeks, mean weeks in last 18 months ↩
-
Early analysis looked separately at those who self-reported unemployed or long-term sick or disabled. Their similar pattern of impacts led to a decision to combine them in the final reporting. ↩
-
That is, the threshold used by IAPT to suggest that the client probably would receive a diagnosis. However, it is important to note that a clinical diagnosis of depression or anxiety would take into account a number of factors, rather than rely on a single screening tool for each condition. See: A guide to IAPT data and publications ↩
-
The percentages reporting no depression is the same in both groups. ↩
-
See Section 2.3 for an explanation of reliable improvement. ↩
-
As with the percentages reporting no depression, the percentage reporting no anxiety is the same in both groups. ↩
-
See Section 2.3 for an explanation of reliable change on the PHQ-9 and GAD-7 scales. ↩
-
See Section 2.3 for an explanation of recovery rates and reliable recovery rates. ↩
-
See Section 2.3 for an explanation of the ReQol-UI, but a mean of 1 would imply perfect health and a mean of 0 would impact a state equivalent to death. ↩
-
Differences in QALYs are less likely to be detected as significant than differences in the ReQol-UI scores because their means and smaller but their standard deviations larger. ↩
-
In some instances, clients who feel unable to work leave this item unanswered rather than code ‘severely impaired’. Here, an unanswered category is read as a high level of impairment. ↩
-
See Section 2.3 for a description of the measure. ↩
-
Jobseeker’s Allowance or Universal Credit with searching for work conditionality, received by those actively seeking work. ↩
-
Personal Independence Payment or Disability Living Allowance. ↩
-
Mean weeks’ receipt = for baseline and 52 weeks, mean weeks in last year; for 78 weeks, mean weeks in last 18 months ↩
-
Universal Credit, Jobseekers’ Allowance, Employment Support Allowance, Income Support or Incapacity Benefit. ↩
-
DWP (2022) Employment Advisers in Improving Access to Psychological Therapies: Client Research ↩
-
This does not vary greatly across the three groups: for those working on entry to IAPT it was 28 per cent (mean extra days = 27); for those off work sick it was 30 per cent (mean extra days=29); and for those out of work it was 27 per cent (mean extra days=23). ↩
-
See Section 2.3 for an explanation of these measures. ↩
-
The percentage is 81 per cent for those working on entry to IAPT, 87 per cent for those off work sick and 78 per cent for those out of work. ↩
-
See Section 2.3 for an explanation of these measures. ↩
-
This has been done by running the percentiles for the time interval per group and then using a linear regression to model the relationship between the percentile values for the EA group from the percentile values for the matched comparison group. This gives a predicted value for all members of the comparison group. ↩
-
Calculated per person as (imputed therapy elapsed time/observed elapsed therapy time)*(ReQoLUI at final therapy session-ReQoL-UI at assessment)+ ReQoL-UI at assessment. ↩
-
NICE. Guide to the methods of technology appraisal. In: National Institute for Health and Care Excellence (NICE), ed. London, 2013. ↩
-
Finch AP, Brazier JE, Mukuria C. What is the evidence for the performance of generic preference based measures? A systematic overview of reviews. Eur J Health Econ. 2018; 19: 557-70, ↩
-
Keetharuth AD, Brazier J, Connell J, et al. Recovering Quality of Life (ReQoL): a new generic self reported outcome measure for use with people experiencing mental health difficulties. Br J Psychiatry. 2018; 212: 42-49. ↩
-
Keetharuth A.D., Rowen D., Bjorner J., et al. Estimating a Preference-Based Index for mental health from the Recovering Quality of Life (ReQoL) measure: Valuation of ReQoL-UI. Value Health. 2020. ↩
-
Hernández Alava M, Wailoo AJ, Ara R. Tails from the peak district: adjusted limited dependent variable mixture models of EQ-5D questionnaire health state utility values. Value in Health. 2012; 15: 550-61. ↩
-
Hernández Alava M, Wailoo A, Pudney S, et al. Mapping clinical outcomes to generic preference based outcome measures: development and comparison of methods. Health Technology Assessment (Winchester, England). 2020; 24: 1. ↩
-
Franklin M, Enrique A, Palacios J, et al. Psychometric assessment of EQ-5D-5L and ReQoL measures in patients with anxiety and depression: construct validity and responsiveness. Qual Life Res. 2021. ↩
-
Mukuria C, Rowen D, Harnan S, et al. An Updated Systematic Review of Studies Mapping (or Cross-Walking) Measures of Health-Related Quality of Life to Generic Preference-Based Measures to Generate Utility Values. Appl Health Econ Health Policy. 2019: 1-19. ↩
-
Brazier J, Connell J, Papaioannou D, et al. A systematic review, psychometric analysis and qualitative assessment of generic preference-based measures of health in mental health populations and the estimation of mapping functions from widely used specific measures. Health Technol Assess. 2014; 18: vii. ↩
-
Richards D, Enrique A, Eilert N, et al. A pragmatic randomized waitlist-controlled effectiveness and cost-effectiveness trial of digital interventions for depression and anxiety. NPJ Digit Med. 2020; 3: 1-10. ↩
-
Hernández Alava M, Wailoo A. Fitting adjusted limited dependent variable mixture models to EQ-5D. The Stata Journal. 2015; 15: 737-50. ↩
-
StataCorp. Stata Statistical Software: Release 15. College Station, TX: StataCorp LLC,, 2017. ↩
-
Hernández Alava M, Wailoo A, Pudney S, et al. Modelling generic preference based outcome measures-development and comparison of methods. Health technology assessment. 2019. ↩
-
Wailoo AJ, Hernandez-Alava M, Manca A, et al. Mapping to estimate health-state utility from non–preference-based outcome measures: an ISPOR good practices for outcomes research task force report. Value in Health. 2017; 20: 18-27. ↩