DWP annual report and accounts 2022 to 2023
Updated 7 August 2023
Applies to England, Scotland and Wales

© Crown copyright 2023
This publication is licensed under the terms of the Open Government Licence v3.0 except where otherwise stated. To view this licence, visit nationalarchives.gov.uk/doc/open-government-licence/version/3 or write to the Information Policy Team, The National Archives, Kew, London TW9 4DU, or email: psi@nationalarchives.gov.uk.
Where we have identified any third party copyright information you will need to obtain permission from the copyright holders concerned.
This publication is available at https://www.gov.uk/government/publications/dwp-annual-report-and-accounts-2022-to-2023/dwp-annual-report-and-accounts-2022-to-2023
Annual Report and Accounts 2022-23 for the year ended 31 March 2023
Accounts presented to the House of Commons pursuant to section 6 (4) of the Government Resources and Accounts Act 2000
Annual Report presented to the House of Commons by Command for His Majesty
Ordered by the House of Commons to be printed on 6 July 20
This publication is licensed under the terms of the Open Government Licence v3.0 except where otherwise stated. To view this licence, visit nationalarchives.gov.uk/doc/open-government-licence/version/3/
Where we’ve identified any third-party copyright information you will need to obtain permission from the copyright holders concerned.
This publication is available on our website at: www.gov.uk/official-documents
Any enquiries regarding this publication should be sent to us at:
Finance Director General’s Office
5th Floor, Caxton House
6-12 Tothill Street
London SW1H 9NA
ISBN 978-1-5286-4261-3
E02933881 07/23
Printed on paper containing 75% recycled fibre content minimum.
Printed in the UK by HH Associated Ltd. on behalf of the Controller of His Majesty’s Stationery Office.
Performance report: Secretary of State’s Foreword
The hallmark of a civilised society is one that improves the day to day lives of its citizens and helps them to build a secure and prosperous future, while protecting the most vulnerable.
This is DWP’s overarching mission. It delivers the many different services, programmes and support the Department provides across the country, whether that is helping people to thrive in work, ensuring people can enjoy the retirement they deserve, supporting disabled people to live independently or delivering extra financial support to those most in need.
In a challenging year when families have been feeling the pressure from global price rises caused by supply chain pressures following the pandemic and Putin’s illegal invasion of Ukraine, I’m proud that DWP has been at the forefront of delivering this vital support.
At an impressive pace and scale, DWP provided cost of living payments to over 7 million low-income households, with millions of additional payments going to pensioners and disabled people. In the year ahead, we are administering further cost of living support to households that need it. Our Household Support Fund has also continued to enable councils across England to help families with the cost of groceries, bills and other essentials. I am pleased that we are extending this support again for 2023-24. Together with extra funding for Scotland, Wales and Northern Ireland, this represents £1 billion of additional funding to help people in every part of the UK.
In addition, we have also increased working-age benefits by 10.1% and protected pensioners with the biggest ever increase to the state pension, honouring our manifesto commitment on the triple lock. We have also improved the uptake of Pension Credit, increasing access to pension benefits.
This is what a compassionate society looks like.
Alongside this focus on protecting the most vulnerable, the government is investing £3.5 billion over the next 5 years to boost workforce participation and grow the economy. Through a wide-ranging new package of measures, we will reduce economic inactivity, which has risen from an historic low before the pandemic.
This means delivering new employment programmes and support, targeted for those specific groups who face the greatest barriers to the labour market, for example the over 50s, parents and disabled people. Through Transforming Support: The Health and Disability White Paper, we will improve the way the disability benefits system works to better support and incentivise disabled people and those with health conditions to start, stay and succeed in work. This will build on our 2017 ambition to see 1 million more disabled people in work, a milestone we reached 5 years earlier than planned.
For claimants who are already in the labour market, we are bringing more people into intensive support and increasing expectations to help them progress and make it less likely they fall into inactivity.
To ensure public funds go to those who need it most, we are cracking down on fraudsters. Every pound we lose to fraud is a pound less we have to invest in public services, to reduce national debt or to return to taxpayers.
That’s why, through our £900 million Fraud Plan launched last year, we are targeting those who seek to abuse the system. In 2022-23, we saw fraud and error rates fall. This is encouraging but there is still much to do. Our Fraud Plan will help drive down rates further and save billions by bolstering our counter-fraud frontline and, in due course, bringing forward a raft of new powers to catch and punish fraudsters.
In the year ahead, we will build on the important progress we have made in 2022-23 to ensure the welfare system provides a strong financial safety net that protects the most vulnerable. Alongside this, through our workforce participation measures, and with a focus on innovative employment support and concerted wider action across government to break down barriers, we will fill posts and fulfil potential. In turn, this will support our wider priorities to halve inflation, get debt falling and grow the economy.
Rt Hon Mel Stride MP
Secretary of State for Work and Pensions
Permanent Secretary’s overview
DWP continues to play a pivotal role for the country. The government’s focus on growing the economy by bringing more people into the labour market from inactivity demonstrates our role in supporting economic growth. Alongside that, the continuing elevated levels of demand for benefits, demonstrate the importance of our role in supporting the vulnerable.
Over 2022-23 we have continued to play an essential role in helping people move into and progress in work by delivering Way to Work and Plan for Jobs. We have increased our dedicated support for the 50 plus age group, while continuing to provide individually tailored Work Coach support to young people aged 16-24. Our Autumn Statement and Spring Budget measures help us to continue to reduce unemployment, focus on the drivers of economic inactivity and start to transform the benefits system for people with disabilities.
The increased service demand has created extra pressure on the Department. We have continued to drive delivery, clearing backlogs and modernising our services. Throughout the year we have made strides in boosting efficiency and productivity for the benefit of those we serve. For example, by increasing our clearance rate for Pension Credit by 250%, we have been able to support the large growth in new claims that we have seen this year.
Overpayments of fraud and error have reduced by 10% compared to last year, although there is still an immense challenge ahead to tackle loss, with fraud growing across the economy. In May 2022, we published our ‘Fighting Fraud in the Welfare System’ plan. This has been backed by additional funding to boost frontline defences. We have also started to make progress in driving fraud out of the system through our Targeted Case Review in Universal Credit.
We spent £230.5 billion in Resource AME, which covers benefits paid through the welfare system in 2022-23 including £94.8 billion on people of working age and approximately £137.3 billion on pensioners. Of total welfare spend, around £33.8 billion was spent on benefits to support disabled people and people with health conditions.
In another extraordinary year colleagues at DWP have adapted quickly and shown resilience throughout. I am particularly proud of our quick-footed approach to support the delivery of new Cost of Living payments in response to the challenging economic environment. In 2022-23 we have provided this targeted support to customers totalling over £8 billion. This support will continue into the next financial year with further payments being made for households receiving means-tested benefits, tax credits and qualifying disability benefits and pensioner households. We have also played a significant role in helping Ukrainian refugees settle into the UK. We helped families requiring access to benefits, housing and employment. On top of that, with the sad passing of Her Majesty Queen Elizabeth II, colleagues brought forward millions of payments so that customer payments were not affected by the funeral arrangements.
Our Values, We Deliver, We Adapt, We Care, We Value Everybody and We Work Together describe DWP when we are at our best. I am proud of all that our 85,000 colleagues have achieved this year for the benefit of those we serve.
Peter Schofield
Permanent Secretary and Accounting Officer
Performance overview
This section provides a summary of the purpose, plans and performance of the Department for Work and Pensions. This includes an overview of our organisation, services and structure.
DWP Overview
Our Vision and Our Role
DWP aims to improve people’s day to day lives and help them build financial resilience and a more secure and prosperous future. We do this by helping people to move into work, and supporting those already in work to progress, with the aim of increasing overall workforce participation. We help people to plan and save for later life, while providing a safety net for those who need it now. We want to deliver excellent services to the millions of customers every day, including the most vulnerable in society, improving their customer experience while maximising value for money for the taxpayer.
The services we offer improve the daily lives of millions of people. Every day, we support thousands of people to move into work and progress. Through our Jobcentre Plus offer and our key services and programmes we support individuals to develop the skills they need to live more independently, including supporting disabled people and those with long-term health conditions. We work with others across government to tackle the root causes of poverty, improve financial resilience, and support families with children.
Our people are our biggest asset, and ensuring they have the right skills and capability to deliver is essential to realising our vision. To deliver our vision we continue to focus on our 3 core objectives. Everyone in DWP has a role to play in achieving them.

Our Values
Our values guide how we work with each other, customers, and others. Understanding how we live up to them helps us learn for the future.
- we care
- we deliver
- we adapt
- we work together
- we value everybody
Every colleague, regardless of position, rank, or place, is essential to achieving our goals and realising our vision.
Our Services
| Service user groups | Our Services |
|---|---|
| People seeking employment | Jobcentre Plus provides personal tailored employment advice combined with detailed knowledge of local labour markets to match people to suitable job vacancies and help those in low-paid work to progress and increase their earnings through our network of jobcentres. |
| People seeking employment | ‘Find a job’ online site, allows jobseekers to search for work at a time convenient for them, offering jobseekers and employers a simpler and more streamlined way to log in and access their information. |
| People seeking employment | Universal Credit: The government believes that the best way to support peoples living standards is through good work, better skills and higher wages. Through Universal Credit, the government has designed a modern benefit system that ensures it pays to work and withdraws support at a steady rate as claimants move into and progress in work. |
| People seeking employment | DWP Youth Offer is the wrap around scheme for young people to access vital skills, training and employment opportunities. DWP’s Youth Offer commenced in September 2020 – increasing support offered to young people aged 18-24 in the Intensive Work Search group on Universal Credit. |
| People seeking employment | DWP’s Sector-based Work Academy Programme (SWAP) placements offer training, work experience and a guaranteed job interview to those ready to start a job. These allow people to learn the skills and behaviours that employers in particular industries look for. |
| People seeking employment |
Kickstart (for 16-24 year olds) enables participants to gain work based experience through paid 6 month roles, to improve their chances of progressing into long-term sustainable work. The final participants ended their posting at the end of September 2022. |
| People seeking employment | Fuller Working Lives is an employer-led strategy that aims to increase the retention, retraining and recruitment of older workers by bringing about change in the perceptions and attitudes of employers. |
| People seeking employment | Restart supports people who have been unemployed for at least 9 months. Restart launched in summer 2021 in England and Wales, with Scotland and Northern Ireland receiving funding. |
| Disabled people and people with health conditions | The Work and Health Programme provides support to disabled people and people with health conditions on a voluntary basis. The programme also supports people who have been unemployed for more than two years. |
| Disabled people and people with health conditions | Intensive Personalised Employment Support provides personalised, intensive support for disabled people who have complex barriers to work and who the Work Coach considers to be more than 12 months from the labour market. |
| Disabled people and people with health conditions | Disability Confident is a business-led scheme that puts employers firmly at the centre of a national movement to increase employment opportunities for disabled people, encouraging employers to think differently about disability and to take action to improve how they attract, recruit, and retain disabled employees. |
| Disabled people and people with health conditions | Access to Work is a scheme tailored to an individual’s needs, providing financial assistance for pre-employment (work experience, supported internships and traineeships) and during employment. |
| Disabled people and people with health conditions | Personal Independence Payment helps people between age 16 and pension age with the additional costs associated with a disability or long-term health condition. |
| People planning for or in retirement | The Money and Pensions Service ensures that people have access to the information and guidance they need to help them make effective financial decisions over their lifetime. |
| People planning for or in retirement | Pension Credit protects pensioners on a low income by topping up any income already received to a standard minimum amount, with higher amounts for pensioners with caring responsibilities, a severe disability or certain housing costs. |
| People planning for or in retirement | The Pensions Regulator protects UK workplace pensions by making sure employers, trustees, pension specialists and business advisers fulfil their duties to scheme members, and by ensuring they meet their automatic enrolment duties. |
| Children and families | Get Help Arranging Child Maintenance is a free service to help parents decide the best maintenance arrangement for themselves and their children. The service also supports parents to put a maintenance arrangement in place. |
| Children and families | The Statutory Child Maintenance Scheme can arrange child maintenance on behalf of separated parents who may be unable to agree a child maintenance arrangement between themselves. |
| Children and families | The Reducing parental conflict programme aims to decrease the number of children that have to live with damaging levels of parental conflict, by giving parents access to evidence based support to increase collaboration, whether they are together or separated. |
Our Structure
We are led by the Secretary of State for Work and Pensions and the Permanent Secretary who is our most Senior Civil Servant. As of the 31st of March 2023, there were 84,944 people working in our departmental group, which includes our core department and our arm’s length bodies.
As of March 2023, our Director General led groups are:

Our Priority Outcomes
This summary provides an at-a-glance overview of how we worked towards delivering our Priority Outcomes in 2022-23.
This high-level overview is expanded upon in the Performance Analysis section of this report which includes further details of our activities and further analysis of progress against performance indicators.
| Priority Outcome 1 | Maximise Employment across the country to aid economic recovery following COVID-19 |
|---|---|
| Summary | We have continued to play an essential role in providing support to individuals and families whose livelihoods have been impacted as the country continues to build back from the pandemic through a range of support including Way to Work and Plan for Jobs, supporting individuals to move into and progress in work. |
| Performance Metrics | Employment rate of 16-64 year olds. UK and regional Employment rate of 16-24 year olds. UK and regional Number of Kickstart participants Number of Job-Entry Targeted Support (JETS) participants Number of Sector based Work Academy Programme (SWAP) participants Number of Starts on Restart |
| UN Sustainable Development Goals | SDG1: No poverty SDG4: Quality education SDG5: Gender equality SDG8: Decent work and economic growth |
| Performance Analysis | See Performance Analysis |
| Priority Outcome 2 | Improve opportunities for all through work, including groups that are currently under-represented in the workforce |
|---|---|
| Summary | We have continued to offer comprehensive support to help people we know are currently under-represented in the workforce to start, stay, and succeed in work. This includes disabled people and people with health conditions, those over 50, serving prisoners, and people undergoing clinical treatment for substance dependency. |
| Performance Metrics | Disability employment rate gap (%) |
| UN Sustainable Development Goals | SDG3: Good health and well-being SDG8: Decent work and economic growth |
| Performance Analysis | See Performance Analysis |
| Priority Outcome 3 | Address poverty through enabling progression into the workforce and increasing financial resilience |
|---|---|
| Summary | We spent £230.5 billion in Resource AME, which covers benefits paid through the welfare system in 2022-23 including £94.8 billion on people of working age and £137.3 billion on pensioners. Of total welfare spend, around £33.8 billion was spent on benefits to support disabled people and people with health conditions. Through the Cost of Living Payments, we have provided additional targeted support to claimants who needed it most. We have provided over 7 million households on means-tested benefits with Cost of Living Payment up to £650, costing a total of over £8 billion. |
| Performance Metrics | Absolute poverty before housing costs (%) Number of children in workless households Percentage of claims processed within planned timescales |
| UN Sustainable Development Goals | SDG1: No poverty SDG5: Gender equality SDG8: Decent work and economic growth |
| Performance Analysis | See Performance Analysis |
| Priority Outcome 4 | Deliver a reliable, high-quality welfare and pensions system which customers have confidence in |
|---|---|
| Summary | Throughout 2022-23 we have continued work to modernise how we deliver some of our key services to improve customer experience and simplify processes. Exploiting digital solutions to make it easier for customers who are able to self-serve, so that our staff can provide additional support to customers with complex needs. We have worked to strengthen our complaints and appeals process, learning lessons to help improve customer satisfaction levels going forwards. Last year, our Fraud Plan mapped out our proposals for reducing fraud and error. This year, we have seen a fall in fraud and error, in part due to the re-introduction of the controls removed during the pandemic. An extra £900 million investment over 3 years is helping boost our frontline defences still further, whilst the introduction of Targeted Case Reviews will help detect Universal Credit overpayments and underpayments and drive down fraud across future years. |
| Performance Metrics | Percentage of claimants satisfied with DWP services overall. For the following metrics, see the Fraud, Error and Debt section Gross monetary value of fraud and error (by value and proportion) Monetary value of official error |
| UN Sustainable Development Goals | SDG16: Peace, justice and strong institutions |
| Performance Analysis | See Performance Analysis |
Our Strategic Enablers
Further detail on the key activities facilitating the department to execute its strategy and deliver outcomes can be found in the Performance Analysis section of this report.
| Strategic Enabler 1 | Workforce, Skills, Location |
|---|---|
| Mandatory Objectives | Investing in skills, championing expertise and strengthening leadership Reflecting the country we serve and creating opportunities around the UK |
| Performance Analysis | Performance Analysis |
| Strategic Enabler 2 | Innovation, Technology, Data |
|---|---|
| Mandatory Objectives | Finding new ways to solve problems to deliver for the public Seizing the full potential of data and technology |
| Performance Analysis | Performance Analysis |
| Strategic Enabler 3 | Delivery, Evaluation, Collaboration |
|---|---|
| Mandatory Objectives | Achieving excellence in project and public service delivery. Making it easy to collaborate and provide a seamless experience for the public |
| Performance Analysis | Performance Analysis |
| Strategic Enabler 4 | Sustainability |
|---|---|
| Mandatory Objectives | Improving the environmental performance of our estate and operations to reduce negative environmental impacts. |
| UN Sustainable Development Goals | SDG7: Affordable and clean energy SDG11: Sustainable cities and communities SDG12: Responsible consumption and production SDG13: Climate action SDG15: Life on land |
| Performance Analysis | Performance Analysis |
Risks impacting the delivery of DWP’s objectives
Introduction
The Department’s operating environment has remained challenging throughout 2022-23 due to COVID-19 legacy impacts, cost of living pressures, and the wider economic environment. Persistent uncertainty driven by external factors at home and abroad, has meant that the Department has continued to operate in a rapidly changing environment.
DWP’s risk management approach
In last year’s accounts, we set out our top 3 risk themes for 2022-23:
1. Stabilisation, recovery, and transformation of services, increasing capacity and capability to maximise delivery.
2. Fraud, error, and debt.
3. Leading the national effort to get people into jobs, improve lives, help communities, and rebuild the economy.
These principal risk themes remain current and have continued to affect delivery during this financial year while being affected by domestic, international, and economic developments. Throughout the year, the Executive Team has been focused on developing and delivering mitigations to our principal top level risks, ensuring that there are robust plans in place to manage them. Although there is still more to do, we have made significant progress to make the organisation more resilient and secure. Our key areas of focus include:
- Managing the continued high demand for DWP services (due in the main to legacy impacts for COVID-19 and the cost of living). Our response has included moving resources to underperforming areas to support recovery.
- Delivery of our ambitious programme of change, and transformation as well as keeping delivery of existing and new priorities on track. This has required ongoing assessment of affordability and deliverability including our capacity to absorb and integrate new people and new work effectively.
- The wellbeing and safety of our people and industrial relations due to demand for our services, claimant stress factors and the economic climate.
- Cyber-threats and increasing global insecurity where we have made significant progress on making our IT more resilient and secure, increasing our protection against cyber-attacks and other external threats.
- Driving down fraud and error and managing debt effectively across our services.
During 2022-23 the Risk and Control Assessment (RCA) programme has continued to provide assurance on the effectiveness of internal controls and risk management across the Department. The programme supports each Director General by providing second line assurance on the effectiveness of the internal control environment and we will continue to test the effectiveness of mitigations in place as our risk landscape evolves. A more detailed statement on the main issues and risks that DWP has managed through 2022-23 can be found in the Governance Statement
Chief Finance Officer Review
Our Finances
We have one of the largest expenditure budgets of any department across government. The Department’s running costs are covered by the Departmental Expenditure Limit (DEL) and most welfare spending is classified as Annually Managed Expenditure (AME).
The cost of running our department in 2022-23 was £9,146 million, paid from DEL. We also paid out £231 billion in benefit, pension, and Social Fund payments from Resource AME, including over £8 billion for Cost of Living Payments, and £70 million from Capital AME including £16 million on Support for Mortgage Interest payments and £110 million in Universal Credit Advances, offset by recoveries of £63 million of Social Fund loans, in 2022-23. See a detailed breakdown of our expenditure.
For information on spending rends and more detailed analysis of budget changes please see the DWP Main and Supplementary Estimate Select Committee Memoranda on parliament.uk
Departmental Expenditure Limit 2022-23
The chart below shows how we spent our DEL budget of £9,146 million, broken down by organisational group.
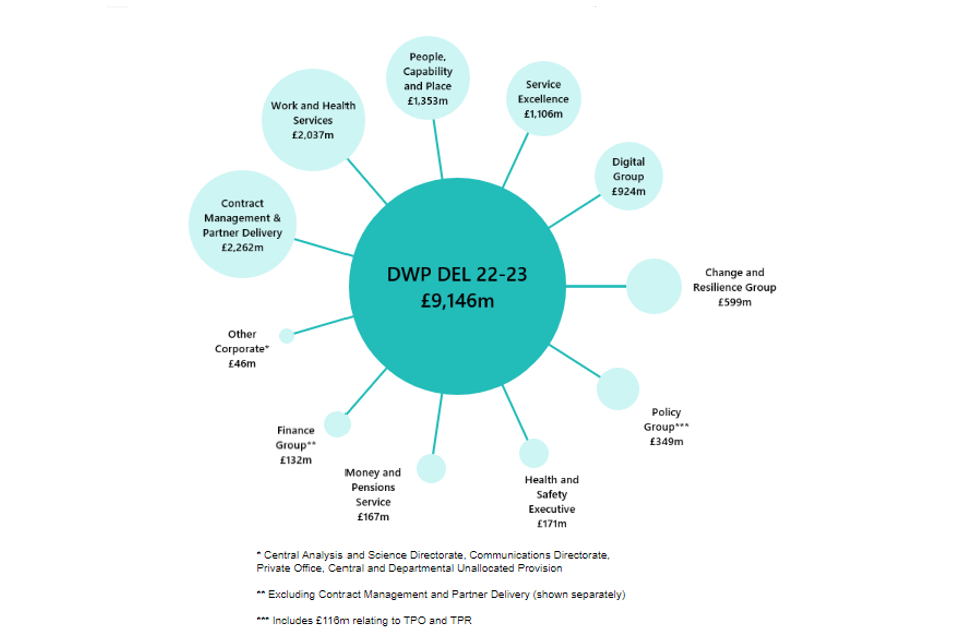
DWP’s 2022-23 budget was initially set at Spending Review 21 (SR21) at £8.3 billion (excluding depreciation). As the economic environment evolved, the Treasury made additional funding available, including to support those most in need via the Household Support Fund. At Supplementary Estimates funding was adjusted to reflect changing requirements. This included adjustments for Kickstart and Restart as economic growth was stronger than initially forecasted. The Department also reprofiled funding through a surrender of some underspends in 2022-23 in return for a corresponding increase for the following year to enable delivery across the Spending Review settlement period.
In 2022-23 the Department focussed on:
- maximising employment across the country including funding continuing labour market programmes introduced in the Plan for Jobs such as the Restart scheme (£435 million) to provide 12 months of tailored support to long-term unemployed people, Kickstart scheme (£222 million), and significant funding for Work Coaches to ensure all unemployed claimants who are looking for work on UC can benefit from personalised Work Coach support.
- enhancing the welfare system to deliver for working age and pensioner customers. This included digital activity to support delivery of benefits and transform how customers interact with the welfare system and to upgrade and maintain DWP estates and an additional £146 million to improve the department’s capability and capacity to detect and deter benefit fraud.
- helping those in financial difficulties including through the extension of the Household Support fund (£842 million) to support those most in need with the rising cost of living as part of government response to global inflationary challenges. This was in addition to delivering the Cost of Living Payments, which is outlined below.
- delivering additional Work Coach support to help eligible older workers find work through the expansion of DWPs 50+ offer and increasing support to those on Universal Credit with the increase of the Administrative Earnings Threshold to 15 hours from January 2023.
Annually Managed Expenditure (AME)
Our Expenditure
We make benefit and pension payments to over 20 million people to support them through life events such as being out of work, retirement and disability.
In 2022-23, Total Resource AME was £230.5 billion, including Cost of Living Payments, details of which are set out as below. This was around £14.6 billion (almost 7%) more than in 2021-22 mainly driven by the inclusion of Cost of Living Payments worth over £8 billion. This increase is also as a result of the annual uprating of pensions and benefits, the continued roll-out of Universal Credit, which includes payments formerly made through personal Tax Credits paid by HM Revenue and Customs, and higher outturn for disability benefits also increased spending.
The chart below shows a breakdown of the Total Resource AME.
Total Resource AME

Overall, 60% of our benefit spending went to pensioners, with the State Pension (£110.5 billion), accounting for almost half of all spending. The cost of the State Pension increased by £6.0 billion (6%) from 2021-22.
Nearly 30% (£65.2 billion) supported disabled people and people with health conditions (including pensioners). This is an increase of £2.1 billion (5%) from 2021-22.
Around £54.7 billion was spent on a range of other benefits, with the majority (£39.3 billion, over 70%) going to working age people (including £26.5 billion to UC (excluding payments relating to incapacity or carer), and £5.7 billion to means-tested and disability benefits Cost of Living Payments), and the remainder to pensioners. This is an increase of £7.7 billion (16%) from 2021-22.
Further to the above Resource AME expenditure, we spent £70 million on Capital AME in 2022-23, including £16 million Support for Mortgage Interest payments, £110 million Universal Credit Advances and £7 million Estates dilapidations, this was offset by £63 million net recoveries of Social Fund loans.
| DWP AME benefits expenditure summary | 2022-23 expenditure £bn | 2021-22 expenditure £bn |
|---|---|---|
| Pension age benefits | 137.3 | 127.7 |
| State Pension | 110.5 | 104.7 |
| Support for disabled people and people with health conditions | 11.4 | 10.6 |
| Housing Benefit | 5.6 | 5.5 |
| Other benefits | 7.2 | 6.9 |
| Cost of Living Support Payment | 2.6 | 0.0 |
| Working age benefits | 94.8 | 87.4 |
| Universal Credit | 41.2 | 40.6 |
| Other support for disabled people and people with health conditions | 22.4 | 19.9 |
| Housing Benefit | 9.3 | 10 |
| Employment Support Allowance | 12.1 | 12.7 |
| Other benefits | 4.1 | 4.2 |
| Cost of Living Support Payment | 5.7 | 0.0 |
| Total benefit expenditure | 232.1 | 215.1 |
| Other AME | (1.6) | 0.9 |
| Total Resource AME | 230.5 | 216.0 |
More detailed information on benefit expenditure outturn and forecasts can be found in our benefit expenditure tables on GOV.UK
Cost of Living Payments
Through the Cost of Living Payments announced in May 2022, we have provided over £8 billion in additional targeted support to customers who needed it the most.
Eligible households received:
- Up to £650 Cost of Living Payment to those on means tested benefits
- A £300 one-off payment to all pensioners
- A £150 one-off disability Cost of Living Payment to those on non-means tested disability payments
In total, more than 7 million households on means-tested benefits received up to £650 in Cost of Living Payments and a further 6 million people who qualified for disability benefit received a one-off £150 disability Cost of Living Payment, at a total cost of £5.7 billion.
Over 8 million pensioner households received a pensioner Cost of Living Payment of £300 alongside their winter fuel payment in November/December 2022, at a total cost of £2.6 billion.
We will make further Cost of Living Payments in 2023-24, with the most vulnerable households receiving up to £1,350.
Welfare Cap
The welfare cap is a limit on the amount that government can spend on certain social security benefits and tax credits. HM Treasury sets the level of the cap and the year in which it will apply, normally at the first fiscal event of each new Parliament. It also sets a pathway for relevant welfare spending in each year running up to the year of the welfare cap. HM Treasury also sets a percentage margin for the cap and pathway in each year.
The cap is formally assessed by the Office for Budget Responsibility (OBR) at the first fiscal event of each new Parliament. The current welfare cap applies to 2024-25, with the next formal assessment at the first fiscal event of the next Parliament.
If the OBR’s formal assessment shows that the welfare cap is breached, then the Secretary of State for Work and Pensions will either:
- Lay a paper before the House of Commons proposing government policy measures which will reduce welfare spending to within the level of the cap; or,
- Explain to the House of Commons why a breach of the welfare cap is considered justified
A debate on a votable motion will then be held in the House of Commons, normally within 28 sitting days, on the suitability of the Secretary of State’s response to the breach.
At Spring Budget 2023, we saw that expenditure subject to the welfare cap is forecast to be £4.1 billion above the cap plus margin in 2024-25. This breach is mainly driven by higher forecasted demand for disability benefits.
Catherine Vaughan
Director General, Finance
Performance Analysis
This section expands on the Performance Overview section and includes details of our activities and further analysis of progress against performance indicators.
Priority Outcome 1- Maximise employment across the country to aid economic recovery following COVID-19
Introduction
We have continued to play an essential role in providing support to individuals and families who have been impacted by the pandemic through Way to Work and Plan for Jobs, helping people to move into and progress in work.
Employment levels have remained high. As of January 2023, all countries and regions of the UK now have more people in Pay As You Earn Employment than in January 2022. Unemployment is below its pre-pandemic rates and the number of people claiming unemployment-related benefits has fallen significantly since the pandemic peak. However, economic inactivity amongst working age individuals remains high and the economic inactivity rate currently sits at 21.04%, which is above the pre-pandemic historic low rate of 20.2%. For more information please see Priority Outcome.
As we look to the future and following announcements made at Spring Budget 2023, we will be working across government to deliver an additional wide-ranging package of measures designed to support people to enter work, and to increase and extend their working lives. These measures focus on key groups who we know face additional barriers to work, including disabled people and those with health conditions, the over-50s, parents and carers.
Achievements and Progress
Jobcentre Plus Support
Our Jobcentre Plus network has continued to provide vital support to individuals. Work Coaches use their local knowledge and expertise to provide personal and tailored support to help people move closer towards and into work and progress. They build positive relationships with claimants to encourage them to overcome barriers to work, to search and apply for jobs and to increase their hours and earnings. As part of this tailored support, Work Coaches use their skills and knowledge to refer people to wider support and services relevant to the individual needs of the claimant, some of which are set out in more detail later in this section.
Work Coaches, supported by work psychologists, help customers with complex needs. They are also able to access other sources of support such as the Flexible Support Fund (FSF), to help with additional costs, including upfront childcare and additional travel costs linked to a new job. The FSF can also be used to commission training to meet the needs of local jobseekers and employers. For more information on how Work Coaches have supported disabled people and those with health conditions please see Priority Outcome 2 ‘Continuing and developing support’.
Plan for Jobs
Throughout the pandemic, the government provided unprecedented levels of support to the economy. Plan for Jobs also included key DWP programmes, such as Restart and Kickstart, alongside other measures to boost work searches, skills, and apprenticeships. As we see the unemployment rate fall below pre-pandemic levels, some of these programmes have closed while others continue to support people as shown below.
Restart began in July 2021 and is providing up to 12 months of intensive, tailored support to help Universal Credit (UC) and Jobseeker’s Allowance claimants who have been unemployed for more than 9 months move into sustained employment. Through regular contact with participants, providers develop a strong understanding of individuals’ employment history, skills, aspirations, and needs to develop the right package of support to help each person succeed. As of the end of April, 450,000 people have started this scheme since July 2021 and 150,000 people have reported first earnings.
Kickstart was designed to support 16 to 24 year olds on UC at risk of long-term unemployment. The programme launched in September 2020 and provided funded, 6-month jobs. Kickstart ended in September 2022 having supported over 163,000 young people.
Job Entry: Targeted Support (JETS) was launched to support UC and New Style Jobseeker’s Allowance claimants who had been unemployed for at least 13 weeks to re-enter employment. This scheme provided up to 6 months light-touch personalised employment support to help people effectively re-engage with the labour market and focus on job search by building on providers’ links with local employers. JETS referrals ended on 30 September 2022 and the last participants finished the programme in April 2023. JETS supported 340,000 customers in total.
Sector-based Work Academy Programmes (SWAPs) help customers compete for local jobs. SWAPs offer training, work experience and a guaranteed interview for a job or apprenticeship; helping businesses with recruitment and enabling customers to learn the skills and behaviours employers want and need. SWAPs are being used to fill jobs in sectors such as construction, health and social care, logistics, hospitality, public sector, and security. As of 12 March 2023, jobcentres have delivered 91,600 SWAP starts in 2022-23. The 2023 Spring Budget provided additional funding for an extension of 40,000 SWAP starts across the two financial years. This will enable DWP to deliver 80,000 SWAP starts in both 2023-24 and 2024-25.
Way to Work
The recovery from the COVID-19 pandemic was accompanied by record levels of vacancies and, as a result, the government introduced the Way to Work campaign on 26 January 2022, with a commitment to see 500,000 moves into work by customers by the end of June 2022.
Way to Work was aimed at job-ready claimants on Universal Credit (UC) and New Style Jobseeker’s Allowance claimants in England, Scotland, and Wales. Way to Work saw us working closely with employers, building on our experience through the Kickstart scheme whilst strengthening our core support through additional Work Coach time and by ensuring jobseekers kept to the agreements they made in their Claimant Commitment. The campaign exceeded its target. Vacancies are down from their record high, but there remains more to do to help support people into work to fill employers’ vacancies.
In-Work Progression
As well as supporting people to move towards and into work, the government is committed to supporting people in low-paid jobs to progress, helping them increase their earnings and move into better-paid jobs. To achieve this, we have reshaped some of our key services:
- Firstly, we have raised the Administrative Earnings Threshold (AET) in Universal Credit (UC). The AET determines the level of Work Coach support that UC claimants receive, with claimants earning less than the AET receiving the most intensive Work Coach support. In September 2022, we raised the AET to £494 per calendar month for individual claimants and £782 per calendar month for couples. This was equivalent to an individual working 12 hours per week (previously the equivalent of 9 hours) at the National Living Wage (NLW) rate and to a couple working 19 hours (previously the equivalent of 14.4 hours) between them. In January 2023 we raised the AET further. It is now £617 per calendar month (equivalent to working 15 hours per week) for individual claimants and £988 per calendar month for couples (equivalent to working 24 hours per week).
- These changes to the AET mean that almost a quarter of a million more UC claimants will receive support from a Work Coach on a weekly or fortnightly basis and agree appropriate steps to progress in their employment and increase their earnings. These claimants will also be eligible for access to training and intensive job-seeking support.
- Jobcentres are being assisted by a network of 37 new District Progression Leads across Great Britain. Progression leads will work with partners including local government, employers, and skills providers to identify and develop opportunities and address barriers that can make it hard for people to progress, such as childcare, transport or lack of appropriate skills provision.
- Secondly, we have introduced a new In-Work Progression Offer for working claimants with earnings above the AET, backed up by £99 million of funding from the 2021 Spending Review. In 2022-23 we have been focused on offering voluntary in-work progression support. This has now been rolled out across Great Britain. We now estimate that around 1.2 million low-paid benefit claimants will be eligible to volunteer for support to progress into higher-paid work. This support is being provided by Work Coaches and is focussed on removing barriers to progression, such as confidence, skills or access to help with childcare costs and providing progression support and provision of advice, including identifying training opportunities.
Support for Older Jobseekers
For People over 50
We are increasing our dedicated support to the 50 Plus age group by introducing Additional Work Coach Time at 13, 26, and 39 weeks into their claim for Universal Credit. This provides more time to recognise and address some of the additional challenges people in this age group can face, both staying in and returning to work. From February 2023 this became operational across the entire Jobcentre Plus network.
From September 2022 each of the 37 Jobcentre Plus districts was supported by a 50Plus Champion. The 50Plus Champions work collaboratively with Work Coaches, employers and stakeholders to raise awareness on the importance of supporting older jobseekers as well as to identify opportunities to tailor provision and recruitment to support this group’s return to work.
Through financial resilience, health and skills planning for those in their 40s, 50s and 60s, the Mid-Life MOT supports older workers to stay in and return to work, and plan towards their retirement. From January 2023 we began the roll-out of the Mid-Life MOT across the Jobcentre Plus network. We also issued an Invitation to Tender on 6 January 2023 to identify providers for a Mid-Life MOT programme to be delivered through employers direct to their employees.
DWP’s Youth Offer
We also continue to provide individually tailored Work Coach support to young people aged 16 to 24 claiming Universal Credit (UC). DWP’s Youth Offer includes 3 elements:
- The Youth Employment Programme is a structured 13-week programme of intensive Work Coach support, focused on helping young people access work-related support and find employment.
- Youth Employability Coaches provide flexible support to young people who are experiencing complex needs and barriers, such as homelessness, to assist them in finding work.
- Youth Hubs combine employment support from a Jobcentre Plus Work Coach and place-based support from partner organisations with an in-depth understanding of local jobs and skills gaps, to help young people into work across Great Britain.
Our Approach to Key Sectors
As well as the support we offer for all jobseekers and all jobs, we know that there are specific challenges that need to be addressed to help our customers start, stay, and succeed in work in key sectors, such as haulage and social care. Our approach throughout 2022-23 has been to work with other government departments and businesses to understand and address the specific employment challenges key sectors face, including on recruitment, retention, and progression. Jobcentres across the country are delivering tailored support to jobseekers and employers. New initiatives launched this year such as the Green Jobs Delivery Group and the Digital Skills Council ensure that government and industry work closely together to support key sectors. Working closely with other departments, the actions were taken to support key sectors, which include refreshing and updated guidance for Work Coaches and jobseekers challenging misconceptions; running public facing communications campaigns centred around key sectors; promoting SWAPs, Skills Bootcamps, and other skills support; work with local authorities to shape Bus Service Improvement Plans; and working with a wider range of employers.
Our Performance
The key metrics below show progress made over 2022-23 towards achieving our priority outcomes as we saw an increase to both the overall and youth employment levels on the year, though both remain below pre-COVID-19 levels. We will continue to monitor our key metrics in 2023-24.
UK Employment rate: 16-64 years (2012-2023)
The latest available data, covering January to March 2023, shows the UK employment rate at 75.9% for working-age adults (between 16 and 64). The rate has increased by 0.3 percentage points on the year but remains 0.7 percentage points lower than December to February 2020 (prior to the impact of COVID-19).
At a regional/national UK level, the majority saw an increase in their employment rate on the year.
UK employment rate - 16 to 64 years (2012 to 2023)

Source: Employment rate (aged 16 to 64, seasonally adjusted): % - Office for National Statistics (ons.gov.uk) and X01 Regional labour market: Estimates of employment by age – Office for National Statistics (ons.gov.uk)
UK Employment rate: 16-24 years (2012-2023)
The latest available data, covering January to March 2023, shows the UK employment rate at 55.5% for young people (aged 16-24). This is more than 20 percentage points below the UK employment rate for people aged 16-64. The employment rate for young people has increased by 1.1 percentage points on the year and remains 0.14 percentage points lower than December to February 2020 (prior to the impact of COVID-19).
At a regional/national UK level, 7 of 12 regions and nations had a reduction in the employment rate for young people.
As noted above, we are providing additional support to young people to help them move towards and into work through our Youth Offer.

*UK figures are seasonally adjusted whilst the regional figures are not.
Source: X01 Regional labour market: Estimates of employment by age – Office for National Statistics (ons.gov.uk) and A06 SA: Educational status and labour market status for people aged from 16 to 24 (seasonally adjusted) – Office for National Statistics (ons.gov.uk)
Priority Outcome 2 - Improve opportunities for all through work, including groups that are currently under-represented in the workforce
Introduction
Ensuring that everyone is able to and has the opportunity to enter and progress in work remains a key priority for the Department. We know that groups that were under-represented in the labour market were disproportionately affected by the COVID-19 pandemic, and throughout 2022-23 we continued to provide much needed support to help them to start, stay, and succeed in work.
Figures released by the Office for National Statistics in May 2022 showed that the number of disabled people in employment had increased by 1.3 million between 2017 and 2022, delivering on the government goal to see 1 million more disabled people in work in the decade to 2027[footnote 3].
Long-term trends of falling economic inactivity were reversed during the pandemic with increases predominantly driven by an increase in those reporting long-term sickness as the main reason for economic inactivity[footnote 4]. The increase has predominantly been seen amongst those aged 50 to 64. However, between April to June 2022 and January to March 2023 overall economic inactivity decreased by 0.4 percentage points (or 161,000 people – 7,000 of which were aged 50 to 64). Conversely, long-term sickness, as the main reason for economic inactivity, continues to rise – up 2.4 percentage points (or 164,000 people) between April to June 2022 and January to March 2023.
We have focused support on groups that are under-represented including disabled people and people with health conditions, ex-offenders and people undergoing clinical treatment for substance dependency. By introducing more dedicated resource in the Jobcentre network, increasing capacity in our contracted provision, creating stronger links between work and health, and developing new channels for information sharing, we improved the support we offer to these key groups. But we are not complacent and DWP continues to work with other departments and stakeholders to build on existing initiatives, to deliver additional support, including the extensive package announced in Spring Budget 2023, and the reforms set out in the Health and Disability White Paper.
Achievements and Progress
Working with Health Systems
Disabled people are more likely to fall out of work and, once out of work, are less likely to return. Employment is a wider social determinant of health and being in good employment is, in general, better for people’s health. The Joint Work and Health Directorate (JWHD) is a collaboration between DWP and the Department of Health and Social Care (DHSC) established to drive improved work and health outcomes for disabled people and people with health conditions. It has improved alignment of employment and health systems to deliver evidence-based programmes, trials, and tests.
The Employment Advisers in NHS Talking Therapies programme is designed to help with common mental health conditions such as stress, anxiety, and depression. Through the Employment Advisers in NHS Talking Therapies programme, we are co-locating employment advisers alongside therapists to offer combined psychological and employment support.
Following positive evidence from evaluation published in April 2022 - which included a finding that two thirds (68%) of those who accessed the service reported either remaining in work or finding work 12 months after using the service - we were able to secure a further £122 million of funding over this Spending Review period to expand the service throughout England[footnote 5].
In October 2022 we announced we would increase the reach of the existing programme from 40% to 100% coverage across all NHS Talking Therapies services in England, to provide combined employment support and talking therapy to 100,000 people per year by 2024-25.
Improving the Use of the Fit Note
Together with DHSC, we remain committed to improving the use of the Fit Note. We worked with professional and regulatory bodies to implement changes that would support better work and health conversations.
In April 2022 we amended the existing regulations, removing the requirement for a signature in ink to authorise fit notes. Instead, a new version of the form was introduced which means fit notes can now be completed, authorised, and sent digitally if that is the patient’s preference. This makes it easier for patients to access, store and share their fit note with DWP or their employer - reducing paper and risk of requiring a re-issued fit note. To better draw upon the skills and experience of other healthcare professionals, from 1 July 2022 we changed the regulations to enable Registered Nurses, Occupational Therapists, Physiotherapists and Pharmacists, in addition to doctors, to certify fit notes within their scope of practice[footnote 6].
Drawing on the skills and experience of these healthcare professions working as part of multi-disciplinary teams, fit notes can be a more effective tool in managing sickness absence. We are now monitoring and evaluating these regulatory changes through commissioned qualitative research and internal quantitative analysis.
Influencing Positive Employer Behaviours
In the response to the Health is Everyone’s Business consultation, on proposals to reduce ill-health related job loss, we committed to continuing to work across departments and with external stakeholders to raise awareness and understanding around existing rights and responsibilities under the Equality Act 2010[footnote 7]. This includes the duty to make reasonable adjustments. Since November 2022, strengthened Health and Safety Executive guidance has given a set of clear and simple ‘principles’ that employers would be expected to apply to support disabled people and people with health conditions in the work environment.
To help support in-work activity around disability and health, we have created an integrated, tailored employer Information and Advice service. The service is publicly available in national live testing and helps employers to understand their legal responsibilities.
Using a directed guidance approach, the service supports employers through key considerations and suggests practical steps to consider individual employee needs and make adjustments to aid recruitment and retention. The service can be found at: Support with Employee Health and Disability - GOV.UK (dwp.gov.uk)[footnote 8]
Occupational Health (OH) continues to be a focus in helping disabled people and people with health conditions to remain and thrive in work. We have progressed our programme of OH reform to improve disparities in access for Small and Medium Enterprises (SME) and the self-employed, including through developing the test for a financial incentive scheme.
In January 2023, we launched a £1 million fund to stimulate innovation in the OH market, focused on increasing access to and capacity in OH. The fund encourages the development of new models of OH tailored to SME and the self-employed through better use of technology. Options for a financial incentive scheme for SME and self-employed people to access OH are being developed for further testing
Through the Disability Confident scheme, we provide employers with advice, support, and free resources to help them attract, recruit, retain and develop disabled people in the workplace[footnote 9].
The scheme is promoted widely, including by working closely with the Disability Confident Business Leaders Group, which includes senior representatives from major businesses throughout the UK. The scheme, and the business benefits of disability employment, are also promoted through the Work and Health Programme Providers, Jobcentre Plus, other stakeholder events, communication campaigns, social media channels, and through GOV.UK (www.gov.uk)
As of 31 March 2023, there are approximately 17,500 members of the Disability Confident scheme, and they estimate over 11 million employees working in their businesses. Once again, we are working in collaboration with the Business Disability Forum to include 3 Disability Confident Awards for employers who have actively encouraged the employment of disabled people during the last year.
Following the Thriving at Work review in 2017, the Mental Health and Productivity Pilot (MHPP) began in July 2019 to support employers across the Midlands understand and act on the link between mental health and productivity[footnote 10]. The pilot offers a package of resources which work towards ensuring employees are happy, satisfied, and able to thrive at work.
DWP has extended funding for the MHPP for a further 18 months from April 2022 to December 2023, meaning the MHPP has continued to deliver support this year and will provide robust evaluation to support future policy development. The MHPP has delivered promotion and prevention interventions to over 800 employers with potential reach of over 650,000 employees. An interim report for the MHPP was released in October 2022 evaluating the initial phase of the pilot. The final evaluation will be produced during the next financial year[footnote 11].
During 2022-23, we received a significant increase in applications to the Access to Work scheme and have recruited new staff to meet this demand and reduce the time it takes to make decisions. We have prioritised new applications with an imminent start date and renewal applications, whilst working to reduce all wait times and improve processes.
To further help the decision-making process for Access to Work applications, we are delivering a series of Adjustments Passport pilots. An Adjustment Passport provides a living document of an individual’s adjustments and in-work support needs. This helps an individual have a structured conversation with jobcentre plus Work Coaches and potential employers, and can reduce the need for an Access to Work assessment.
Following a successful pilot in the Jobcentre Plus Health Model Offices in 2021, an Adjustment Passport was rolled out in May 2022 to support disabled jobseekers and raise awareness of Access to Work. In addition, an Adjustment Passport pilot supporting transition from education programmes started in February 2023.
Continuing and Developing Support
Through Jobcentre Plus, we started trialling Additional Work Coach Support, a new offer providing more Work Coach support for disabled people and people with health conditions to help them move closer to and into employment. This increased one-to-one personalised Work Coach support is available for claimants receiving Universal Credit or Employment Support Allowance, who are awaiting their Work Capability Assessment and those who have been found to have limited capability for work or ‘limited capability for work and work-related activity’ that want, or could benefit from, more help to move into work. For claimants who have been found to have limited capability for work and work-related activity following a Work Capability Assessment, all participation in this support and time spent with Work Coaches is voluntary.
This support became available in two-thirds of jobcentres from May 2023 and will be available nationally by 2024. Current rollout is being informed by feedback from the initial trial in one-third of jobcentres.
Work Coaches are supported by Disability Employment Advisors (DEAs) who provide expert knowledge on how to support disabled customers.
Supported Employment Programmes
The recent Budget announced funding for a new employment programme called Universal Support. Universal Support is designed to help disabled people, people with health conditions and people with additional barriers to employment into sustained work by using an internationally recognised supported employment model of employment provision. The supported employment model is based on the concept of ‘place and train’, which incorporates 5 stages: engagement, vocational profiling, job finding, employer engagement and on and off the job support. Through these 5 stages, supported employment provision helps match someone to a job that is right for them at the earliest opportunity, trains them to do the job in the way the employer wants it done and provides personalised, ongoing support to sustain their employment. Universal Support will include help for the individual to address issues like debt, manage their health condition and help employers to put in place job shaping or other adjustments to accommodate the individual’s needs. Eligible people will be able to opt into Universal Support and receive up to 12 months support.
Universal Support will start delivery in 2024 and expand to support at least 50,000 people a year at its capacity. It is important US reflects local job opportunities and aligns with other national and local employment support. As such, we are engaging with a wide range of key local area stakeholders, employers, providers, and experts in delivery of ‘place and train’ support to inform design and delivery decisions.
As part of the first phase of Universal Support, DWP and the Department of Health and Social Care are funding several areas to deliver Individual Placement and Support in Primary Care (IPS-PC).
Delivered in health settings with referrals primarily made via healthcare and community pathways, IPS-PC is an important part of our response to combatting health related inactivity contributing towards greater productivity and economic growth. It is aimed at people with physical or common mental health disabilities to support them to access paid jobs, and then support both the individual and their employer to ensure that the job is sustained. The service will also support people struggling in work or off sick to retain employment and prevent inactivity.
Following a competed grant exercise, 6 places (covering 30 Local Authority (LA) areas) will deliver IPS-PC in England from April 2023 until March 2025, supporting up to an estimated 12,400 disabled people with common physical or mental health disabilities to secure or retain employment. Areas delivering IPS-PC will support early delivery of ‘place and train’ model outlined above.
Through Contracted Employment Provision
Many individuals benefit from more intensive employment support delivered under contract by external organisations.
The Work and Health Programme (WHP) provides personalised support to disabled people and disadvantaged groups who are motivated to work and expect to find it within 12 months. Using the expertise of private, public, voluntary, and community sector providers, the WHP helps participants with a wide range of barriers to work receive coordinated and holistic support, including agencies working with families, ex-offenders, care leavers, refugees, drug and alcohol users, and veterans, amongst others.
Rolled out across England and Wales between November 2017 and March 2018, by February2023, 260,000 people had started the programme, 110,000 people started work and 68,000 people achieved a sustained job outcome or 6 months of being in self-employment. Around 3-quarters of starts on the programme who achieve a first earnings outcome are disabled people.
The programme continues to build on the experience of what has worked well in the past and learning lessons from other contracted provision. The programme has been extended from November 2022 to September 2024 providing additional support for around another 100,000 people.
The Intensive Personalised Employment Support (IPES) programme is voluntary provision for unemployed and inactive disabled people who have multiple barriers to employment, which may be a combination of personal and work-related barriers. This may be an impairment or condition which significantly increases their barriers to work for example, a learning disability or barrier such as homelessness, substance misuse or low self-esteem. Providing intensive and flexible support from a dedicated key worker for up to 15 months, with an additional 6 months intensive in-work support for those who gain employment, IPES integrates with local, specialist support organisations to build a holistic package around each individual participant.
IPES is the most intensive of our contracted employment support. It was launched in December 2019 in England and Wales to provide support for up to 10,000 people over a 4 year period. To meet the expected increase in demand for support we increased available places from January 2022 to raise the total number of disabled people being supported on the programme to over 11,000 across the life of the programme.
The Local Supported Employment (LSE) programme is designed to enable more people with learning disabilities and/or autism to access the support they need to start and sustain employment, and is delivered through the ‘place and train’ model.
Following a successful proof of concept, we have provided funding to 23 lead local authorities to deliver LSE across England and Wales from November 2022 to March 2025. LSE will support around 2,000 adults with learning disabilities, autism, or both to move into and stay in work through intensive one-to-one support over the entire programme period.
Other under-represented groups
Prison leavers have access to our network of 200 Prison Work Coaches (PWC) covering all prisons in England, Wales, and Scotland. PWCs provide training, employment support, and benefits support before release. We have begun testing different ways for prisoners to start Universal Credit claims and their claimant commitment before release, working with the Ministry of Justice in 15 prisons. Our aim is that prisoners can access Universal Credit and advance payments more quickly on release.
Individual Placement and Support for Drug and Alcohol Dependency (IPS-AD) provides employment support alongside clinical treatment for substance dependency, enabling individuals to overcome barriers that often limit participation in the labour market.
IPS-AD was trialled in 7 Local Authority (LA) areas in England between 2018-2021. As recommended in Dame Carol Black’s independent review of drugs and announced in the Government’s Drug Misuse Strategy in December 2021, IPS-AD is now being rolled out to all 150 LA areas in England by March 2025[footnote 12]. To date, the programme has been expanded to cover over
Our Performance
The key metrics below show progress made over 2022-23 towards achieving our priority outcomes.
Disability Employment

There were 5.1 million disabled people in employment in January to March 2023, an increase of 2.2 million since January to March 2014 (the earliest comparable date), and 320,000 since January to March 2022. In addition to the number of disabled people in employment, we continue to monitor the disability employment gap, the difference between the disabled and non-disabled employment rates. The gap has decreased by 4.8 percentage points over the last 9 years, from 33.8 percentage points in January to March 2014 (the earliest comparable date), to 29.0 percentage points in January to March 2023. However, it has increased by 0.8 percentage points over the last year, from 28.2 percentage points in January to March 2022. These measures are ‘outcome measures’ reflecting the real-world improvements the government wants to see, rather than direct measures of DWP performance. They are affected by external factors such as the size of the underlying disabled population and overall labour market performance, as well as DWP activity.
Priority Outcome 3 - Address poverty through enabling progression into the workforce and increasing financial resilience
Introduction
DWP provides a vital safety net to those who need it and are committed to tackling poverty and supporting people on lower incomes. The economic environment has been very challenging throughout 2022-23, contributing to the continued high levels of inactivity and impacts of rising cost of living pressures, which disproportionately affect the most vulnerable in society. DWP’s focus has rightly been on supporting our claimants adversely impacted by changing economic circumstances.
We spent £230.5 billion in Resource AME, which covers benefits paid through the welfare system in 2022-23, including £94.8 billion on people of working age and children, and £137.3 billion on pensioners. Of total welfare spend, £33.8 billion was spent on benefits to support disabled people and people with health conditions.
In addition to the direct payment of benefits, we also play an important role in ensuring that people have the stability of a safe and secure home, itself an important stepping stone to finding employment. To help people with their housing costs, we have ensured the administration of around £30 billion in 2021-22 of housing support through Housing Benefit and Universal Credit.
Achievements and Progress
Supporting the most vulnerable
Cost of Living Payments
We have provided over 7 million households on means-tested benefits with Cost of Living Payments up to £650, costing a total of over £4 billion. 6 million people who receive a qualifying disability benefit also received a one-off £150 Disability Cost of Living Payment, at a total cost of £0.9 billion. Over 8 million pensioner households received a Pensioner Cost of Living Payment of £300 alongside their Winter Fuel Payment in November/December, at a total cost of over £2 billion. For people who need additional support, we have also provided £842 million to enable two extensions to the Local Authority run Household Support Fund in England, so Local Authorities can provide households with further help with the cost of essentials throughout 2022-23.
Universal Credit (UC) is the cornerstone of our benefit system combining 6 legacy benefits into one to support individuals in work on low incomes, those who are out of work and those who unable to work. As set out in Priority Outcome 1, we have continued to expand support for UC claimants to progress into better-paid jobs through increases to the Administrative Earnings Threshold (AET) and the introduction of a new In-Work Progression Offer.
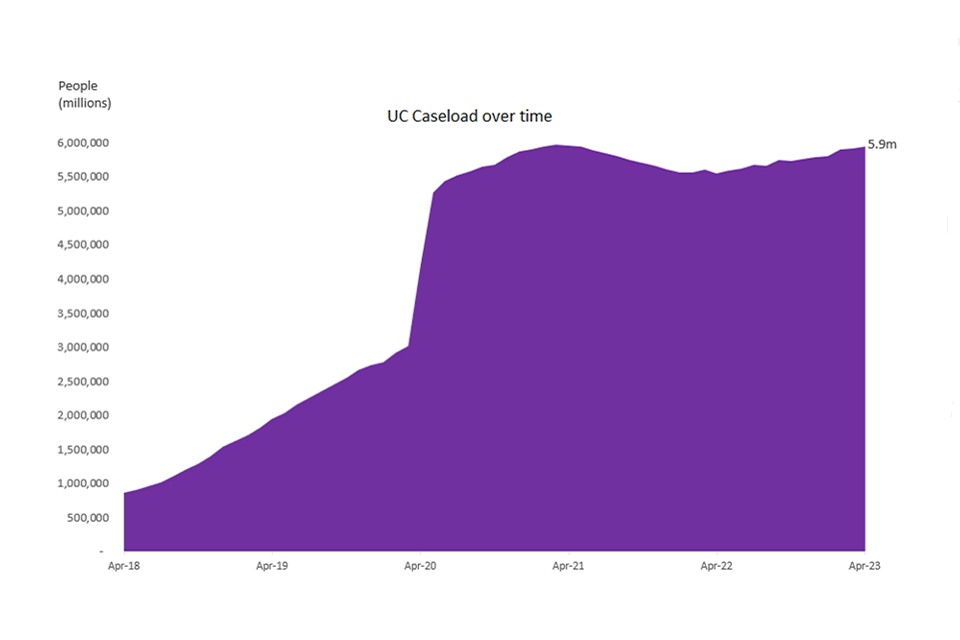
The latest statistics for April 2023 show that there were 5.9 million people claiming UC. In March 2023, 2.2 million people or 38% of the caseload were in employment.
The Move to UC programme is making good progress through managed moves to move claimants on to UC from legacy benefits, with our strategy for implementing the final phase of UC. Learning from how UC has operated during the pandemic and from key insights, we have revised the working strategy for the migration of approximately 2.6 million households from legacy benefits and tac credits to UC by 2024. In April 2022, we published our 2022 to 2024 strategy for implementing the final phase of UC, ‘Completing the move to Universal Credit’.
In May 2022, we started a multi-location approach across the country with a small number of claimants, being brought into the mandatory migration process. We continue to develop our processes and systems to scale the migration process and complete the migration of legacy benefit claimants to UC.
As part of the 2022 Autumn Statement, the Chancellor announced a delay in the moving of Employment and Support Allowance (ESA) only and ESA with Housing Benefit (HB) onto UC until 2028. This provides a welfare saving of around £1 billion by 2027-28, as overall UC is more generous than the benefits it replaces. ESA claimants are still able to make a claim for UC if they believe that they will be better off, and this will not affect the managed migration of other legacy benefits onto UC.
In January 2023 we also published findings from the initial managed migration Discovery work, for moving remaining benefit and tax credit claimants to UC, ‘Completing the move to Universal Credit: Learning from the Discovery Phase’. In April 2023, we began increasing the number of migration notices that we are issuing to tax credit only claimants throughout 2023-24[footnote 13]. This expansion will incrementally expand across all of Great Britain, notifying approximately 500,000 households of the need to claim Universal Credit, to continue to receive financial support from the government.
Bereavement Support Payment
Bereavement Support Payment (BSP) was introduced in April 2017 and replaced Widowed Parents Allowance, Bereavement Allowance, and the Bereavement Payment. 41,000 (81%) were receiving the standard rate, while 9,600, who were entitled to Child Benefit, (19%) were receiving the higher rate.
Support for disabled people and people with health conditions
Personal Independence Payment (PIP) provides financial support to working-age individuals with a long-term health condition or disability with extra costs. PIP replaced Disability Living Allowance (DLA) for new working age claims and for existing DLA recipients who were aged 16 to 64 on 8 April 2013 or reached age 16 since then. From April 2022 to March 2023, the Department received 851,000 claims for PIP, of which 773,000 were new claims and 78,000 were DLA reassessments across England and Wales. In comparison, from April 2021 to March 2022, the Department received 715,000 claims for PIP, of which 643,000 were new claims and 72,000 were DLA reassessments across England and Wales. We have continued to see high levels of PIP claims over the year and have worked hard to process new claims and change in circumstances promptly, with new claims now being cleared in 13 weeks on average, down from 26 weeks in August 2021.
Health Transformation Programme
The Health Transformation Programme (HTP) will transform benefit services for disabled people and people with health conditions by developing and creating a single new Health Assessment Service (HAS) and by transforming the entire Personal Independence Payments (PIP) service.
The programme is taking a long-term phased approach that will move us away from the current ways we are operating gradually and carefully. The programme is currently focussed on building the foundations and creating the environment to enable us to begin to transform these services for the future.
In our two small-scale in-house test sites – the Health Transformation Area (HTA) – we have continued to develop, test and iterate the new HAS and PIP service on a small scale, ahead of national expansion from 2029. We have now completed assessments for over 7,500 cases.
We are procuring new assessment provider contracts worth approximately £2 billion over their lifetime, which will run from 2024–2029. They will replace the current model with a single supplier for all functional assessment services in a geographic area and provide the foundation for the new HAS. Alongside the new assessment provider contracts, we will be providing the IT to support PIP assessments, consistent with our approach to providing IT for the Work Capability Assessments (WCA). The contract for the PIP IT managed service was signed in May 2022. Providing the IT opens up the market by removing a barrier to entry for new assessment providers.
We continue to test our new online Apply for PIP service, which will provide customers with a greater choice over the channels they use to interact with the Department. We are testing this at small scale, currently inviting up to 300 claimants per week to make their claim online.
The National Audit Office (NAO) commenced a Value for Money study into HTP in July 2022, with the report published in June 2023. The Public Accounts Committee will be examining the NAO report in a hearing in July. The Department will be considering the recommendations of the NAO and the PAC carefully, in due course.
Health and Disability White Paper
We published Transforming Support: The Health and Disability White Paper in March 2023[footnote 14]. Responding to the Health and Disability Green Paper consultation, it sets out our plans to transform health and disability support so that more disabled people can start, stay, and succeed in work and to improve people’s experience of the health and disability benefits system. At the centre of the White Paper are plans to transform the benefits system for the future so that it focuses on what people can do rather than what they cannot and gives people the confidence to try work. This includes removing the Work Capability Assessment so that in future there is only one health and disability assessment – the PIP assessment.
This will require primary legislation which we will aim to take early in a new Parliament when Parliamentary time allows. These reforms will then be rolled out to new claims only on a staged, geographical basis from 2026-27 at the earliest. We expect the new claims roll out to be completed by 2029, when we will then migrate the existing caseload onto the new system.
Special benefit rules
The Department is committed to providing support to people who are nearing the end of their lives. For people in this position, the Special Rules allow simple and fast access to financial support through the benefits system. Those eligible under the Special Rules get their claims fast-tracked, which means they do not have to wait as long to start getting payments. They are not required to take part in a functional assessment and, in most cases, those claiming will qualify for the highest rate of benefit.
For many years, the Special Rules have applied to people who are likely to have 6 months or less to live, but recent changes mean that they now apply to people who are likely to have 12 months or less to live. The new 12 month Special Rules criteria aligns with the end of life approach in the NHS where clinicians are encouraged to identify individuals who may be in their final year of life and consider what support they may need, including financial support.
On 4 April 2022, the 12 month Special Rules criterion was introduced for those on Universal Credit and Employment and Support Allowance. On 3 April 2023, the commencement of the Social Security (Special Rules for End of Life) Act 2022 brought similar changes to Personal Independence Payment, Disability Living Allowance and Attendance Allowance. These changes to the “Special Rules” means that thousands of people nearing the end of life can receive vital financial support in their final year, 6 months earlier than they were previously able to.
Payment timeliness
We administered payments of £230.5 billion through the welfare system in 2022-23. There are a number of factors which impacted the Department’s ability to pay benefits in full and on time to claimants, including legacy impacts of COVID-19. Several customer journeys are different to pre-2020, where changes have been made to improve customer journeys, but have implications for overall processing times.
In 2022-23, 62.7% of new claims measured were processed within planned timescales. However, this does not take into account over 70% of State Pension claims that are processed via Get Your State Pension (GySP), where over 90% of claims are cleared within 24 hours of a claim being made. Were we able to include GySP in the DWP calculation, we estimate that overall timeliness would increase by 4 percentage points.
We have experienced unprecedented demand in areas such as Pension Credit (PC) and PIP - likely due to cost of living pressures and our campaign to encourage uptake. PC claims in 2022-23 were more than double the level seen in the previous year. In the second half of the year, we have made significant progress in working down outstanding PC claims by two thirds between August – March but this means that we have been working through older cases which has a negative impact on the timeliness measure. The percentage of PC claims cleared within expected timescales fell to a low of 25.3% in October 2022, recovering to 76.3% by the end of March 2023.
Elsewhere, despite increased demand, we have increased our capacity within the Health Assessment part of PIP claims which has resulted in sustained improvement in overall journey times. We also experienced a challenge in JSA when an attempted system improvement led to a period of worsening performance until we were able to recover.
Supporting people to meet the costs of housing
Local Housing Allowance (LHA) determines the maximum financial support available for renters in the private rented sector in receipt of Housing Benefit or the Universal Credit housing costs. In response to the COVID-19 pandemic, in April 2020, LHA rates were increased to the 30th percentile of local market rents to further support tenants through this challenging period. For 2022-23, we maintained the LHA rates in cash terms, ensuring no rates reduced. New exemptions for victims of domestic abuse and modern slavery were also introduced in October 2022. These exemptions will benefit around 11,000 people per year.
For 2022-23, the government made available £100 million in Discretionary Housing Payments funding for local authorities in England and Wales to help support vulnerable people with housing costs.
In addition, we have improved the support available to mortgage holders in receipt of income related benefits through Support for Mortgage Interest (SMI). From 3 April 2023 the qualifying period for the scheme was reduced from 9 months to 3 months and the zero earnings rule has been abolished. These changes will benefit up to 200,000 UC claimants. 24,000 households have received an SMI loan from April 2018 to November 2022. This includes loans that are no longer in payment.
DWP and the Department for Levelling Up, Housing and Communities (DLUHC) are working collaboratively to establish how existing and new government levers can be used effectively in the short, medium, and long term to address a range of challenges such as the supply, affordability, and quality of housing. DWP also supports the work of DLUHC to deliver private rented sector reform, including to quality standards, as set out in their White Paper published in June 2022.
Protecting long-term outcomes for children
Child Maintenance Service
Through the Child Maintenance Service (CMS) we have continued to provide support to children in separated families. In the first 3 quarters of 2022-23, the CMS has arranged over £903 million in child maintenance payments via direct pay and collect and pay services and in the quarter ending December 2022, the CMS managed 641,000 arrangements for 588,900 paying parents and 885,800 children. This is a 10% increase in children since December 2021 and a 11% increase in arrangements.
In April 2022, we launched “Get Help Arranging Child Maintenance”, allowing parents to make CMS applications or get information about making family-based arrangements online at their convenience. Over 90% of applications are now made online, which has helped to make the service more accessible for customers and has also helped to manage and reduce the number of telephone applications.
This increase has had an impact on existing CMS backlogs due to the unprecedented increase in cases although this is now reducing (please see ‘Backlogs in Service Delivery’ to understand the full picture). We have also expanded our online service ‘My Child Maintenance Case’ and now the vast majority of changes can be made online allowing parents to promptly report a change of circumstances or contact the service.
Processing child maintenance payments
Child maintenance payments are paid into the Child Maintenance Service (CMS) client fund account before they are paid out to the receiving parent. Whilst cash balances can exist for a variety of reasons, it became evident during the audit of the Child Maintenance Client Fund Accounts that some unallocated payments related to overpayments by clients which were not visible to caseworkers.
We are committed to supporting separated parents, ensuring they have a safe and reliable system to make and receive child maintenance payments. We have acted promptly to strengthen controls on the CMS system going forwards to prevent this issue occurring in the future, made changes to our systems to resolve technical issues, and introduced new processes to alert staff to unallocated collections occurring so these can be cleared at the earliest opportunity. We are in the process of implementing these changes and aim to have completed the final changes by September 2023.
Reducing Parental Conflict
Through our Reducing Parental Conflict programme, DWP has continued developing the evidence base on what works to reduce parental conflict. It has offered ongoing support to Local Authorities (LAs) across England to embed their work on parental relationships. In 2022, we launched the Reducing Parental Conflict local grant, providing up to £7 million of funding in 2022-23 (up to £19 million across 2022-25) for 151 LAs to train their workforce and deliver support to parents through programmes and services tailored to the needs of their local families.
We also launched a £3.6 million Challenge Fund to develop innovative approaches to working with a diverse range of families and digital approaches to helping parents in need of relationship support. We launched a £1 million Evidence and Dissemination Grant to continue our work to further expand the evidence base on reducing parental conflict and support local development. The central delivery of parental conflict support as part of our intervention testing is complete with around 4,800 parents starting an intervention and around 2,700 completing. We are continuing an evaluation of these findings to provide LA partners with an understanding of their impacts for children and families.
Building on our work on reducing parental conflict, DWP continues close cross-government working on family support. Reducing Parental Conflict is within the DLUHC Supporting Families Outcomes Framework and the DfE Family Hubs service expectations. Reducing Parental Conflict is included in the £45 million Families First for Children Pathfinder run by DfE, which aims to simplify and align funding streams from across government that support families.
Increasing Financial Resilience for current and future Pensioners
State Pensions
In the year to August 2022, the number of people receiving a State Pension rose by 130,000 to 12.6 million.
The reintroduction of the triple lock guarantee for 2023-24 will provide an extra 10.1% for those in receipt of State Pension, in line with inflation (as of September 2022).
The second government Review into State Pension Age was published on 30 March 2023. This Review concluded that the planned increase in State Pension age from 66 to 67 will take place between 2026-28. The Government noted the Independent Report recommendations on the rise from 67 to 68 but highlighted that Baroness Neville-Rolfe was unable to take into account the long-term impact of recent significant external challenges, bringing uncertainty to the data on life expectancy, the economic position and labour market. The government concluded that there will be a further review within two years of the start of the next Parliament to consider when the State Pension age should rise to 68.
Pension Credit
In 2022-23, we have continued to provide vital financial support to pensioners on a low income through Pension Credit. In April, we launched a comprehensive communications campaign to raise awareness of Pension Credit and encourage pensioners to apply for it. The campaign included advertising in national and regional newspapers and on broadcast radio and television as well as promotion of Pension Credit via internet search engines and on social media. This, together with cost of living pressures, led to more than double the level in Pension Credit applications compared to the previous year.
Winter fuel payments, cold weather payments
The Department estimates that 11.6 million pensioners received the Winter Fuel Payment and pensioner Cost of Living Payment. The WFP National Statistics for 2022-23 will be published in Autumn 2023. An estimated 5.5 million Cold Weather Payments worth £138 million have been issued to households in England and Wales between November 2022 and March 2023 for support with energy bills this winter.
Pensions Dashboards
The Department is continuing to prepare for the introduction of Pensions Dashboards which will allow individuals to view information about their pensions, including State Pension, in one place online. This will put the saver in control and help reconnect people with their lost pension pots, transforming how consumers think and plan for their retirement.
The Minister for Pensions recently announced a reset of the Pensions Dashboards Programme to allow more time to deliver the complex technical solution to enable the connection of pension providers and schemes[footnote 15].
Opportunity to save
Since the introduction of Automatic Enrolment (AE) in 2012 participation in workplace pension saving in the private sector has significantly increased from 42% to 86% in 2021. More than 10.8 million workers have enrolled in a workplace pension and an additional £33 billion in real terms has been saved in 2021 compared to 2012, increasing financial resilience for these individuals in later life. Workplace pension saving is proving resilient in the current economic conditions, with less than 1% of active savers choosing to stop saving each month.
Alongside the evolution of AE, the Department has been exploring how to make it easier for the self-employed to save for their retirement. This involves building and testing retirement savings solutions in digital platforms, such as accountancy software, used by self-employed people to manage their money. In December 2022 we completed the initial trialling and research programme delivered through NEST insight, and the published results[footnote 16] will provide the foundation to support the next phase of research.
Providing pension savers with better access to information, support, and protection
Improving value for savers
Ensuring hard-working savers have a pension system they can trust and delivers for them is a key priority for the Department. In January 2023, we launched a policy consultation which sets out a transformative framework of metrics and standards to assess Value for Money (VFM) across Defined Contribution pension schemes. VFM is not simply about costs and charges, it should mean that savers are getting good value from their investments and receive a quality level of service. Final proposals will improve the availability and transparency of information and data on these key factors, enabling schemes to compare and improve the overall value for money they provide. Our VFM framework will improve competition across the market, drive performance and facilitate further consolidation by removing underperforming schemes from the market, improving retirement outcomes for savers.
To help ensure that employers can provide pensions to their employees that will provide an income for life at a fixed cost and without paying for expensive guarantees, we introduced a legislative framework for Collective Defined Contribution pensions schemes which came into effect on 1 August 2022. On 30 January 2023, we launched a consultation on how best to extend this framework to multi-employer schemes, master trusts, and decumulation products.
The Stronger Nudge to pension guidance came into force on 1 June 2022 requiring occupational pension schemes to offer to book a Pension Wise appointment for pension scheme members when accessing their defined contribution pension savings. We are monitoring the use of pension guidance, and the operation of the Stronger Nudge.
Preventing Pension Scams
Throughout 2022-23 we have been reviewing, with the support of the pensions industry, the regulations relating to the statutory right to transfer that were introduced in November 2021. The review has centred on ensuring the regulations deliver the policy intent to minimise the risks to individuals of falling victim to scammers or fraudsters and consider whether any amendments were required.
We published a report on the review in June 2023. The report concludes that DWP will conduct further work with the pensions industry and the Pensions Regulator to consider if changes could be implemented to the regulations, namely the red and amber flags, to improve the pension transfer experience, without undermining the policy intent.
Defined Benefit Scheme Funding continues to implement the provisions in the Pensions Schemes Act 2021. During 2022, we issued a consultation on the draft Occupational Pension Schemes (Funding and Investment Strategy and Amendment) Regulations 2023. The new measures will encourage better long-term planning and provide clearer funding standards which will enable the Pensions Regulator to intervene more effectively to protect members’ benefits when needed.
Our Performance (metrics)
Number of Children in Workless Households
The number of children in workless households fell by 84,000 in the year to Oct-Dec 2022 (a fall within the margin of error of the survey source). As of Oct-Dec 2022 it stands at 1.28 million or 10.0% of children.
The number of children growing up in homes where no one works has fallen by 620,000 since 2010.

Source: Table K Children in households by combined economic activity status of household members - Office for National Statistics (ons.gov.uk)
Absolute Poverty Before Housing Costs
In 2021-22, 13% of all individuals, 8.9 million people in the UK, were in absolute poverty before housing costs.
This represents a decrease of 3 percentage points, or 1 million people, since 2009-10. This includes 200,000 fewer children, 500,000 fewer working age adults and 300,000 fewer pensioners.
Households below average income: for financial years ending 1995 to 2022 - GOV.UK (www.gov.uk)[footnote 18]

New claims processed within planned timescales
In 2022-23, 62.7% of new claims for Universal Credit (UC), Jobseeker’s Allowance (JSA), Employment and Support Allowance (ESA), State Pension (SP), Pension Credit (PC), Disability Living Allowance (DLA), Personal Independence Payment (PIP) and Child Maintenance (CMG) were processed within planned timescales.
Whilst overall performance remains similar to 2021-22, several factors are affecting performance. See the payment timeliness section for further information.

Data for 2018-19 includes new claims for JSA, ESA, IS, State Pension (SP), Pension Credit (PC), Personal Independence Payment (PIP), Disability Living Allowance for Children (DLAc), and Child Maintenance (CMG). From 2019-20, data no longer includes IS but also includes new claims for Universal Credit (UC) and reflects the current view of expected timescales for all products.
Priority Outcome 4 - Deliver a reliable, high-quality welfare and pensions system which customers have confidence in
Introduction
The pandemic in 2020-21 placed considerable pressure on the Department as we redeployed significant resources from across our Service Excellence Group to manage the upsurge in benefit applications. While the Department successfully managed the increase in claims ensuring that vital support was provided to those most in need, it resulted in backlogs across several areas of work, impacted further by increased and deferred demand. During 2022-23 our ability to recover from the pandemic has been impacted by ongoing cost of living challenges as demand across many of our service lines, such as Pension Credit and Child Maintenance Service, has reached record levels.
While we expect demand for our services to remain high in the short to medium term, the Department has again adapted to meet the needs of our customers, flexing resources and streamlining processes. We are continuing to exploit digital solutions through our service modernisation activity to make it easier for customers, who are able to, to self-serve, enabling our staff to provide additional support to customers with complex needs. We have worked to strengthen our complaints and appeals process, learning lessons to help improve customer satisfaction levels going forwards.
Over the course of 2022-23 we have worked hard to address existing backlogs, making positive progress and clearing over half of all Service Delivery backlogs. Although we may not see the complete impact on service lines until the end of 2023-24 due to continued high demand.
Achievements and Progress
Balancing Increase Demand with Modernising Services
We have seen significant increases in volumes across some of our key services this year, primarily due to cost of living pressures, including Pension Credit (up 73% on last year), Bereavement and Child Maintenance (up 42% on last year).
Even with this challenging backdrop, we have cleared just over half of all Service Delivery backlogs this year. This has been achieved through the redeployment and recruitment of staff as well as making efficiency improvements. For example, changes to processes in Disputes has led to productivity uplifts of 50% in PIP Mandatory Reconsideration handling and 30% in Appeals. Furthermore, the ongoing modernisation of our online services such as Apply for Pension Credit, Get your State Pension and Get Help Arranging Child Maintenance, assists with demand management and provides our customers with a service choice.
Increased demand for our services means the current pressures the department is facing are likely to continue into 2023-24. However, we are confident that the robust delivery and risk monitoring plans that we have in place will ensure that we can drive down our remaining backlogs.
Quality
Our focus on continued improvements as part of our back-to-basics plan has delivered some improvements over 2022-23. These include:
- Universal Credit improvements in the levels of Identity Verification (IDV) errors entering the benefit system; the levels peaked at 3.6% in July 2022 but with continuous improvement this has reduced to 1.2% in February 2023
- We have seen similar improvements in the levels of claimant commitment errors in UC claims peaking at 4.9% in June 2022 and reducing to 2.9% in February 2023
- Official error overpayments decreased to lowest recorded rates in latest Fraud and Error publication, however underpayments increased from 0.3% to 0.6%
- We have seen improvements in the Extra Amount for Severe Disability (EASD) underpayment levels in Pension Credit new claims, reducing from 2.72% in July 2022 to 0.8% in February 2023, ensuring vulnerable customers receive vital support
However, there is still more to do to address errors due to the high volume of new recruits and staff movement within our service lines.
We have developed and implemented a Quality Assurance Framework, which sets out how the department will evaluate and improve the quality of our services to ensure our customers receive high standards of support. This framework has recently been expanded to include Advanced Customer Support Standards, which sets out how we identify and support vulnerable customers.
National Insurance Numbers
The National Insurance Number application process (NINo) has undergone significant transformation over the last two years. This was previously a clerical process that took an average of 15-20 days to complete and required an in-person documentary check to be undertaken by DWP staff. We replaced this with Apply for a NINo (AfN), an online digital application, improving the experience for customers, reducing average processing times to less than 10 days and enabling more efficient decision making.
AfN is now supporting more than 5 times the forecast volume of activity whilst service improvements have enabled a 42% reduction in resources required. The number of registrations from non-UK overseas nationals for the year ending December 2022 were 1.1 million.
Service Modernisation
The Service Modernisation Programme (SMP) will modernise the vital welfare and pension services that we currently provided to around 20 million customers. It will simplify processes for our customers as well as colleagues, exploiting opportunities to automate and digitalise to enhance customer experience whilst also reducing the scope for fraud and error to enter the system.
The following graphic outlines some early significant outcomes:

Future activity will include replacing outdated legacy systems with new, digitally enabled ways of working, which will provide a better and more accessible service and faster financial assistance to our customers.
Future Methods of Payment
The Future Method of Payment project concluded in November 2022, migrating around 3 million customers who previously used a Post Office card account to collect benefits either through opening their own bank accounts or using the Payment Exception Service (for particularly vulnerable customers). As a result, we now have only around 60,000 customers paid via a payment exception service, meaning more customers are financially included.
Fraud and Error within the welfare system
The total rate of benefit expenditure overpaid in 2022-23 fell to 3.6% (£8.3 billion).
Prior to the pandemic, the level of overall welfare spending that was being overpaid had fallen to near to historic lows . When COVID-19 first broke in March 2020, DWP suspended certain control measures in order to prioritise paying people who needed support and keep them safe. However, certain people exploited this and we worked hard to reinstate our normal checks and balances at the earliest opportunity. The return of our defences has had a positive impact in terms of preventing fraudulent claims, and this is now starting to be reflected in our fraud and error statistics. This year’s results are based on measurement which took place September 2021 and October 2022 when some COVID-19 restrictions/easements remained in place. We will see further decreases as certain measures continue to play out.
We set out in our Fraud Plan what else DWP is doing through additional investment totalling around £900 million, which we believe will prevent a further £2.4 billion of loss by 2024-25. We talk more about this, and our performance in 2022-23, in the ‘Fraud, Error and Debt Report’. We also need to ensure we pay people correctly, and the report goes on to explain how we are resolving any historic underpayment errors, particularly in State Pension, before concluding with a look at how we recovered over £1.0 billion in overpayments (together with Local Authorities), whilst supporting benefit debtors.
Detail of the work undertaken by the Department over 2022-23 can be found in the Fraud, Error and Debt report.
Progress continues to be made against each of the Legal Entitlements Administrative Practice (LEAP) exercises, including corrective action to address the underpayment of State Pension. Details of progress across 2022-23 can be found in the Fraud, Error and Debt report.
Home Responsibilities Protection (HRP) scheme (replaced in 2010) was set up to help protect parents’ and carers’ State Pension. The Department identified some administrative discrepancies in the recording of some women’s HRP on their National Insurance records, which resulted in State Pension errors and we are currently working with HM Revenue and Customs to correct any errors. Further details on this can be found in the Fraud, Error and Debt report.
Customer Experience
The Department wants to deliver excellent services for our customers. Our transformation activity will significantly improve our performance against our critical customer measures, delivering a modern service that is simple, inclusive and efficient.
Customer satisfaction with DWP Services
The Customer Experience Survey covers benefit customers in receipt of: Universal Credit, Personal Independence Payment, Employment Support Allowance, Disability Living Allowance for Children, Attendance Allowance, Carer’s Allowance, State Pension and Pension Credit. It measures the percentage of customers who were either fairly or very satisfied with the overall service they received.
Customer satisfaction with DWP services in 2022-23 is 84% which is broadly in line with figures from previous years. The 2022-23 satisfaction score is taken from the first 3 quarters of the survey year (April to December 2022).
In 2020-21, due to the COVID-19 pandemic a number of easements were put in place that streamlined service delivery processes. This is reflected in the high annual customer satisfaction score for 2020-21 (88%). Following the removal of these easements, customer satisfaction has returned to levels more in line with previous years.
The Customer Experience Survey replaced the previous Claimant Service and Experience Survey. Due to significant methodological changes the results are not directly comparable across the two surveys. Moreover, COVID-19 prevented the completion of fieldwork in 2019-20, meaning there is no annual data to report for that year.
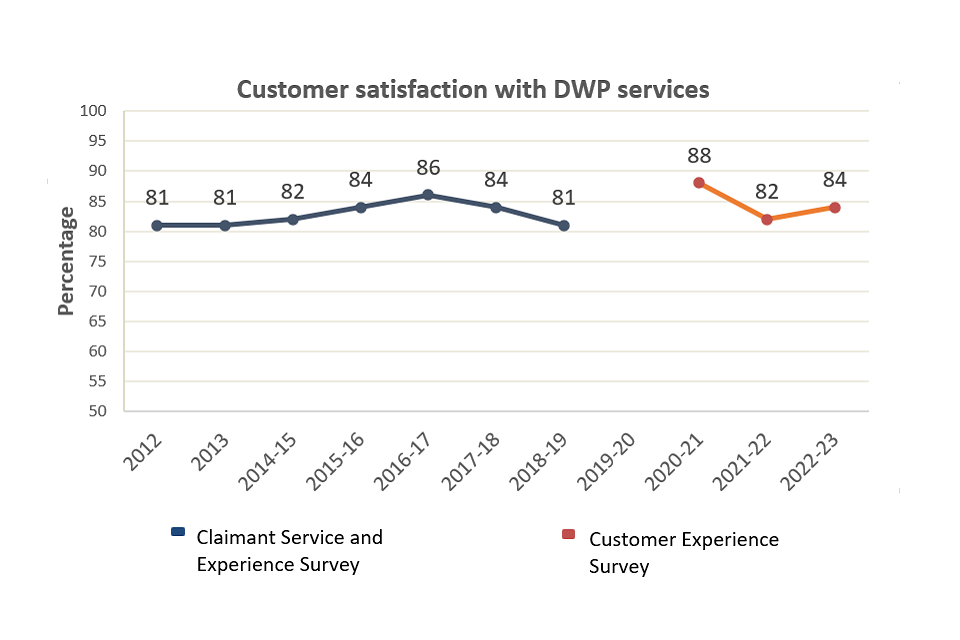
Customer Complaints
Over the course of 2022-23 we have been continuing our work to improve customer experience of the complaints process. This year we have developed a new quality framework for complaint resolution to create consistency across the service, which has been implemented across the majority of our service delivery areas. This framework aligns with the Parliamentary and Health Service Ombudsman (PHSO) standards published in October 2022, and we will continue to work closely with the PHSO and other government departments to embed these standards.
We will roll this framework out not only across service delivery areas, but also wider teams that work with complaints such as ICE and PHSO liaison and Special Payments to ensure we have a consistent quality focus across the whole complaints service.
Customer complaints data
| DWP complaints data | 2020-21 | 2021-22 | 2022-23 |
|---|---|---|---|
| Tier 1 (complaint resolution) | 19,548 | 19,175 | 22,101 |
| Tier 2 (complaints review) | 619 | 11 | 0 |
| Total | 20,167 | 19,186 | 22,101 |
*DWP introduced a single tier complaints process on 9 July 2020. Any complaints received or closed prior to this date have been handled under the previous two-tier complaints process. As expected, the numbers recorded against Complaints Review (Tier 2) have steadily decreased, with none being recorded in the final quarter in 2021-22. All complaints handled under the single tier approach are included in Complaints Resolution (Tier 1) figures.
The number of complaints increased this year compared to the previous two years. The number of complaints decreased substantially in 2020-21 due to the impact of COVID-19 which continued into 2021-22. The number of complaints about our service continue to represent less than 1% of our customer base but they provide important insight and we use the feedback to inform improvements to our services.
Independent Case Examiner
Customers can ask the Independent Case Examiner (ICE) to investigate their complaint if, having completed DWP’s complaint process, they remain dissatisfied with the outcome.
The ICE office endeavours to resolve complaints at the earliest opportunity by brokering a resolution between the customer and the relevant business area, or through early settlement. Where this is not possible, evidence is requested and a full investigation is undertaken. The ICE will then adjudicate on the merits of the complaint, reach a finding, and consider what, if any, recommendations are appropriate to put matters right.
In 2022-23 the ICE office continued to receive high volumes of complaints, in line with the previous year. As in previous years, the ICE office continued to increase its clearance rate.
| Complaints about DWP* | 2020-21 | 2021-22 | 2022-23 |
|---|---|---|---|
| Received by ICE | 3,926 | 4,740 | 4,732 |
| Accepted for examination by ICE | 889 | 1,642 | 1,630 |
| Cleared by ICE | 932 | 1,195** | 1,683* |
| ICE partially/fully upheld | 467 | 578 | 578 |
| PHSO partially/fully upheld DWP complaints | 5 | 0 | 0 |
*The table includes complaints about the Pension Protection Fund (PPF) but excludes complaints about providers as they are responsible for managing complaints about their service. DWP and our associate bodies play no role in considering or responding to such complaints (which escalate directly to the ICE Office).
**This figure differs from the 2021-22 “Cleared By ICE” figure previously reported which included provider, NISSA and NI CMS cases (212 cases).
| All complaints including DWP, contracted providers, NISSA and NI CMS | 2020-21 | 2021-22 | 2022-23 |
|---|---|---|---|
| Received by ICE | 4,225 | 4,916 | 4,911 |
| Accepted for examination by ICE | 1,019 | 1,709 | 1,711 |
| Cleared by ICE | 1,236 | 1,407 | 1,783 |
| ICE partially/fully upheld | 489 | 602 | 584 |
| PHSO partially/fully upheld all complaints | 5 | 0 | 0 |
In 2022-23 ICE cleared 1,683 DWP complaints. Of these:
34 were withdrawn by the complainant
617 were resolved or settled with the complainant’s agreement
578 were upheld, fully or partially, by the ICE
450 were not upheld by the ICE
In addition to investigating case specific complaints of maladministration, the ICE also has a role to play in identifying wider Service Improvement Observations (SIOs) which, if addressed, will limit the scope for future service failures and improve the service provided to customers. In 2022-23 ICE highlighted 10 SIOs to DWP, an example of two of these SIOs is covered in the case studies shown below.
Learning from complaints is a key priority and we undertake regular analysis to understand themes and emerging issues. In addition to complaints insight, it is important that we use feedback from the ICE to improve our services too. We regularly share complaint insight across the department to help make services better for our customers.
Learning from ICE cases:
Continuously improving our operations is at the heart of how we work,” says Elizabeth Fairburn, Director of Customer Experience “and the ICE plays an important role in helping us to do this. Recently, the ICE highlighted a gap in our processes which meant State Pension age customers who incorrectly claimed Universal Credit could have their Tax Credit claims closed with no way to reopen them.
Once alerted to the issue, we were able to change legislation to stop this happening; because of fast action and a collaborative approach, we have stopped customers losing out on money due to a simple error.” “The ICE also identified inconsistencies in how we updated Child Maintenance records to ensure changes were recorded on the accounts of both parents. As a result we have updated our guidance to make the process much clearer for colleagues to understand which will improve the experience for our customers.
Complaints investigated by the PHSO
If customers remain dissatisfied with the outcome of the ICE’s intervention, they may pursue their case with the PHSO. The PHSO publish their figures a year behind other data but in recent years the number of upheld complaints has been very low by comparison with ICE investigation findings.
| Complaints investigated by the PHSO | 2019-20 | 2020-21 | 2021-22 |
|---|---|---|---|
| Number of complaints investigated | 15 | 17 | 14 |
| Number/% of complaints not upheld | 8 (53%) | 9 (53%) | 3 (22%) |
| Number/% of complaints partly upheld | 3 (20%) | 5 (29%) | 7 (50%) |
| Number/% of complaints upheld | 2 (13%) | 0 (0%) | 2 (14%) |
| Number/% of other outcomes | 2 (13%) | 3 (18%) | 2 (14%) |
*Due to PHSO publication dates the 2022-23 data is not available for inclusion.
Complaints to the Parliamentary Ombudsman in 2021-22
| Departmental Business | Resolved at initial check | Complaints accepted for investigation | Complaints resolved at detailed investigation | Complaints fully upheld | Complaints partially upheld | Complaints not upheld | Complaints discontinued | Recommendations complied with (some complaints have more than one recommendation) |
|---|---|---|---|---|---|---|---|---|
| Child Maintenance Service | 2 | 4 | 0 | 0 | 3 | 1 | 1 | 3 |
| DWP (corporate) | 1 | 6 | 1 | 2 | 2 | 1 | 0 | 5 |
| Independent Case Examiner | 1 | 2 | 0 | 0 | 0 | 0 | 0 | 0 |
| Health Assessment Advisory Service | 0 | 2 | 0 | 0 | 1 | 0 | 0 | 1 |
| Health and Safety Executive | 0 | 1 | 0 | 0 | 1 | 1 | 0 | 1 |
| Pensions Regulator | 0 | 1 | 0 | 0 | 0 | 0 | 0 | 0 |
| Total | 4 | 16 | 1 | 2 | 7 | 3 | 1 | 10 |
Complaints about State Pension age changes
The PHSO is investigating 6 sample complaints around maladministration in the Department’s communication of State Pension changes affecting 1950s born women. This is a 3-stage process of which only two stages have concluded. The published findings are available at ombudsman.org.uk[footnote 19].
The Department is cooperating with the investigation and will fully consider the Ombudsman’s report when it is published. The continued investigation remains confidential.
Customer Redress
In 2022-23, we authorised 11,169 ex-gratia payments totalling £1.2 million (£1.20 million in 2021-22) for maladministration. The figure excludes financial redress paid for loss of statutory entitlement because it is not an extra cost arising from maladministration, but payment of benefit that should have been made anyway. The figure also excludes payments to residual cases identified after a special exercise is completed, to address cases where legislation did not allow for payments intended by Parliament or Ministers.
Ministerial Correspondence
In line with Cabinet Office guidance for handling correspondence, we aim to reply to routine correspondence within 20 working days of receipt. For complex cases, Departments should reply as quickly as possible and keep the relevant elected official updated on the progress of the case. We ensure we follow this rule by initially confirming receipt of the correspondence and immediately detailing the timeframe we work to, keeping the elected official in the loop as to their case’s status if they enquire with us directly and if needed, proactively reaching out to them to explain why we may be delayed in responding.
In the year 2022-23, we have received 11,019 pieces of correspondence from elected officials and members of the public. We have issued 10,482 responses, of which, 7,541 responses were issued within 20 working days.
Of the 11,019 pieces of correspondence received, 270 were transferred to other government departments to respond. We also received 54 pieces of correspondence that did not require a response. 213 cases did not receive a reply in the year 2022-23 but were actioned in the year 2023-24.
The majority of our received correspondence has related to the cost of living, querying specific dates that cost of living payments would be issued, eligibility criteria and other related themes. All our Ministers have received correspondence on this subject, reflecting the ongoing media coverage and interest in both Houses.
Correspondence intake
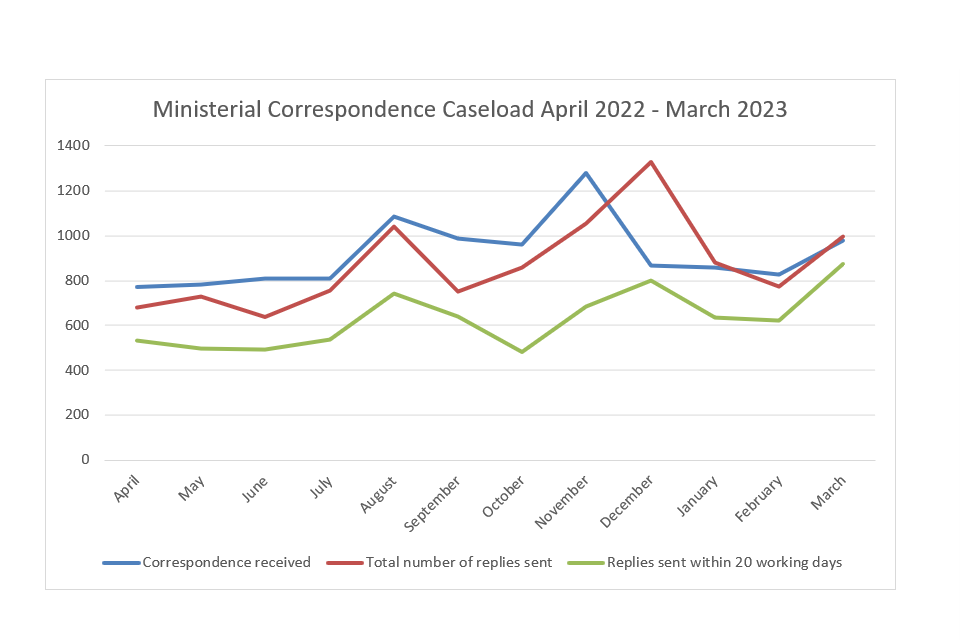
At the start of the financial year, the majority of the correspondence received related to Universal Credit, the State Pension and a Carer’s UK cost of living campaign. There was also a marked increase in correspondence relating to Child Maintenance.
Correspondence levels increased from August onwards, driven as mentioned by numerous cost of living queries, including payment eligibility and why some benefits, such as contribution-based Employment Support Allowance and Housing Benefit, were excluded. Correspondence also covered additional pressures faced by disabled customers and pensioners.
We have also responded to several large-scale campaigns, including an Age UK fuel poverty campaign, a British Sign Language recognition campaign, a Christians Against Poverty cost of living campaign and a campaign by Shelter on Local Housing Allowance and homelessness.
Advanced Customer Support
Advanced Customer Support Senior Leaders
The department’s Advanced Customer Support Senior Leaders (ACSSLs) coach and engage colleagues across DWP services to help support our most vulnerable customers. Key to the ACSSL role is the building and maintaining of relationships with external organisations that support vulnerable citizens, who may also be customers of DWP. ACSSLs are a critical link into external agencies’ escalation routes, enabling increased cross-agency case collaboration and more holistic support for customers.
The table below shows the number of referrals made to ACSSLs in each month across 2022-23, where ACSSLs have supported over 12,000 customer cases.
| Referrals | Apr 2022 | May 2022 | Jun 2022 | Jul 2022 | Aug 2022 | Sep 2022 | Oct 2022 | Nov 2022 | Dec 2022 | Jan 2023 | Feb 2023 | Mar 2023 |
|---|---|---|---|---|---|---|---|---|---|---|---|---|
| ACSSL Referrals Received | 841 | 927 | 963 | 1,126 | 1,164 | 1,019 | 990 | 1,025 | 928 | 1,154 | 995 | 1,110 |
| Of which from External Sources e.g. Local Authority, Social Services, etc. | 263 | 294 | 302 | 337 | 381 | 318 | 362 | 388 | 297 | 418 | 373 | 384 |
During 2022-23 we have introduced further roles to provide direct support for the ACSSLs and the work they take forward, with 18 additional colleagues now helping to provide even more local support and strengthen the national ACSSL network.
Supporting Ukrainian Families:
DWP played a significant role in helping Ukrainian refugees settle into the UK; the ACSSL network really demonstrated the important role it plays. When 21 Ukrainian families were airlifted from the country to the UK for urgent children’s cancer treatment, we were able to provide support as soon as they landed.
With the families requiring access to benefits, housing and employment we were able to identify all of the elements needed, and co-ordinated a quality multiorganisation wrap-around service,” said Cheryl, operational lead of the ACSSL network. “There were multiple challenges to overcome, such as language, proving their ID, opening UK bank accounts and hospital appointments. By working across teams and departments we were able to give these families the care and support they needed at a desperate time in their lives.
The co-ordinated efforts with partners ensured immediate needs in the form of cash, food and hotel accommodation were met on arrival in the UK, and DWP paid benefits within days giving the families the safety and stability they needed.
Internal Process Reviews
Internal Process Reviews (IPRs) form a core part of the Department’s overall approach to learning and help inform improvement activities across all DWP product lines, to ensure that we support the continuous improvement of capability, culture, behaviour and processes.
IPRs do not investigate a customer’s death, but look to provide an internal, high quality, investigation that shows where the customer experience has fallen short of expected standards and sets clear and achievable actions for business areas to minimise future risks.
Referral and Acceptance of IPRs
The criteria for a case to be considered for an IPR is:
- There is a suggestion or allegation that the department’s actions or omissions may have negatively contributed to the customer’s circumstances, and a customer has suffered serious harm, has died (including by suicide) or where we have reason to believe there has been an attempted suicide: or
- The department is asked to participate in a Safeguarding Adults Review or is named as an Interested Person at an Inquest, an IPR will be conducted regardless of whether there is an allegation against the department.
Any colleague within DWP can refer a case to be considered for an IPR, and these will be conducted in all cases where the criteria is met. To aid this the Department created an IPR Focal Point to provide advice and assist colleagues when making a referral, along with making an electronic referral form to enable cases to be referred.
Across 2022-23, 89 IPR referrals have been received on the team, of which 60 met the above criteria and have been taken forward for a full IPR.
| IPRs | Apr 2022 | May 2022 | Jun 2022 | Jul 2022 | Aug 2022 | Sep 2022 | Oct 2022 | Nov 2022 | Dec 2022 | Jan 2023 | Feb 2023 | Mar 2023 |
|---|---|---|---|---|---|---|---|---|---|---|---|---|
| IPRs received in month | 4 | 10 | 10 | 10 | 7 | 10 | 3 | 5 | 7 | 11 | 8 | 4 |
| IPRs meeting criteria in month | 3 | 8 | 7 | 7 | 4 | 5 | 2 | 4 | 3 | 9 | 6 | 2 |
IPR categorisation
IPRs may be carried out where either a customer has died or where there has been customer harm. The table below shows the categories that cases accepted for IPRs have been recorded under over the last 12 months, by month received.
| Month IPR received | Apr 2022 | May 2022 | Jun 2022 | Jul 2022 | Aug 2022 | Sep 2022 | Oct 2022 | Nov 2022 | Dec 2022 | Jan 2023 | Feb 2023 | Mar 2023 |
|---|---|---|---|---|---|---|---|---|---|---|---|---|
| Customer Death[1] | 3 | 7 | 5 | 7 | 3 | 5 | 2 | 3 | 2 | 7 | 5 | 1 |
| Customer Harm[2] | 0 | 1 | 2 | 0 | 1 | 0 | 0 | 1 | 1 | 2 | 1 | 1 |
[1] Customer Death includes the categories: death, alleged suicide and confirmed suicide.
[2] Customer Harm includes the categories: self-harm, serious harm, attempted suicide and ‘other’.
Service line breakdown for IPRs
Cases received for IPRs can cover more than 1 DWP service as customers may have more than 1 benefit in payment, meaning the customer can have more than 1 primary service line recorded for the IPR. The chart below shows the primary services relating to the customers’ cases accepted to IPR across 2022-23.
Accepted IPRs by Primary Service Line 2022 to 2023

*There were 90 primary service lines in relation to the 60 IPRs accepted across 2022-23 due to some customers being in receipt of more than 1 benefit or service at the time of the event that has led to an IPR being conducted.
Learning from IPRs
The principal reason for conducting IPRs is to ensure DWP learns lessons where the customer experience has fallen short of expected standards, and to see what improvements the department can make from a review of the case. This means that findings from IPRs are not necessarily linked to the event that led to the IPR being referred.
Across 2022-23, there were 181 actions closed from IPRs, and in addition to learning from the individual IPR cases, these findings also inform and evidence issues and concerns taken forward through the department’s Serious Case Panel.
Serious Case Panel
The Serious Case Panel (the Panel) is chaired by a non-executive director and met quarterly throughout 2022-23. The Panel’s purpose is to consider issues and themes arising from serious cases and other insight and agree recommendations to address these.
The Panel is currently overseeing the development, impacting and implementation of changes in alignment with the department’s wider strategic aims including:
- Mental Health Awareness training being rolled out to colleagues across the department, which includes support for colleagues when they are interacting with a customer who is at risk of suicide or self-harm. As of March 2023, over 45,000 service delivery colleagues have undergone this training
- Funding for the expansion of speech analytics to 100% of our telephony network, to improve our service for customers with complex needs. This project has now entered the commercial procurement phase.
- Resourcing a multi-disciplinary project to improve all aspects of our service offer in relation to appointees, based on discovery work previously commissioned by the Panel in December 2021.
- Working with digital colleagues to explore how the department can better support vulnerable customers who choose to correspond with DWP in writing, either when making an application or providing supporting evidence.
- In relation to the use of sanctions and with a specific focus on the measures in place to protect vulnerable customers, the Panel agreed the need to continue to review and strengthen these measures to ensure desired outcomes from the use of sanctions whilst mitigating the risk for vulnerable customers.
- Commissioning improvement activity in relation to our service when a vulnerable customer requires us to call them back to resolve an issue and on reducing errors when a vulnerable customer changes address.
- Directing activity through the Future Method of Payment project to reduce the number of customers with Payment Exception Service as their payment method through financial inclusion conversations aimed at migrating customers to bank accounts. They also commissioned the development of consistent and effective processes across all benefits for establishing contact with customers when expired vouchers are returned to the department.
This is long term improvement activity; progress will be provided in next year’s ARA.
Equality
Public Sector Equality Duty – DWP Customers
The Public Sector Equality Duty (PSED) covers the 9 protected characteristics:
- age
- disability
- gender reassignment
- pregnancy and maternity
- race
- religion or belief
- sex
- sexual orientation
- marriage and civil partnerships
The department has in place a wide range of programmes and policies to ensure we provide our customers with the service they need. We also offer online guidance to our staff to ensure that customers with one or more of the protected characteristics receive equal treatment.
Reasonable Adjustment Forum
The Reasonable Adjustment Forum (RAF) enables us to regularly engage with external stakeholders and disability organisations to share insight and to help identify, test, and recommend improvements to services provided for those with accessible communication needs.
Through the RAF we have worked collaboratively with forum members representing multiple disability groups to improve the accessibility of several products. For example, we worked with a range of members to strengthen the alternative format screen in Universal Credit (UC) and change the language to make it more accessible. Additionally, we made it easier for claimants to flag their accessibility needs on the UC site via changes to the on-screen options available for selection.
We also consulted with stakeholders on the NINo claimant journey to make several improvements. Here, forthcoming changes include being able to select which type of braille is required as an alternative format (Grade 1 or 2) and being able to choose the audio type (USB, CD or cassette).
Pension Participation (Equality)
Automatic Enrolment (AE) was introduced in October 2012, to support those who were previously excluded or poorly served by the private pension system. Alongside the State Pension and initiatives to enable longer working lives, it is supporting the financial resilience of future pensioners. Following the introduction of AE, the proportion of employees who participate in a workplace pension has increased amongst all groups of employees. However, gaps in participation do remain between groups.
Workplace pension participation among younger AE eligible employees aged 22 to 29 increased from 35% in 2012 to 86% in 2021 (the latest data available). Compared to AE eligible employees aged 40 to 49, who are the age group most likely to participate, the gap in participation is now 4 percentage points, down from 27 percentage points in 2012.
Among AE-eligible full-time employees, workplace pension participation in 2021 was 91% for female employees, higher than the 89% for male employees. Both represent increases since 2012, when the proportions were 59% for full-time eligible female employees and 53% for full-time eligible male employees. Among AE-eligible part-time employees in 2021, female employees also had a higher workplace pension participation rate (86%) than male employees (74%). Workplace pension participation amongst AE-eligible part-time employees has increased since 2012, when it was 58% for female employees and 34% for male employees.
The average workplace pension participation rate amongst AE-eligible White employees was 86% from 2018-19 to 2020-21. This was the higher than any group of minority ethnic employees, with the largest gap being 20 percentage points to eligible Pakistani and Bangladeshi employees. This gap has reduced since 2011-12-2013-14, when 59% of eligible White employees participated compared to 36% of eligible Pakistani and Bangladeshi employees. The smallest gap between these two ethnic groups was 15 percentage points in their averages from 2014-15-2016-17.
In 2020-21 workplace pension participation amongst eligible disabled employees was 88%, 1 percentage point higher than eligible non-disabled employees. This gap has been reversed since 2012-13, when 53% of all eligible disabled employees and 56% of all eligible non-disabled employees participated in a workplace pension.
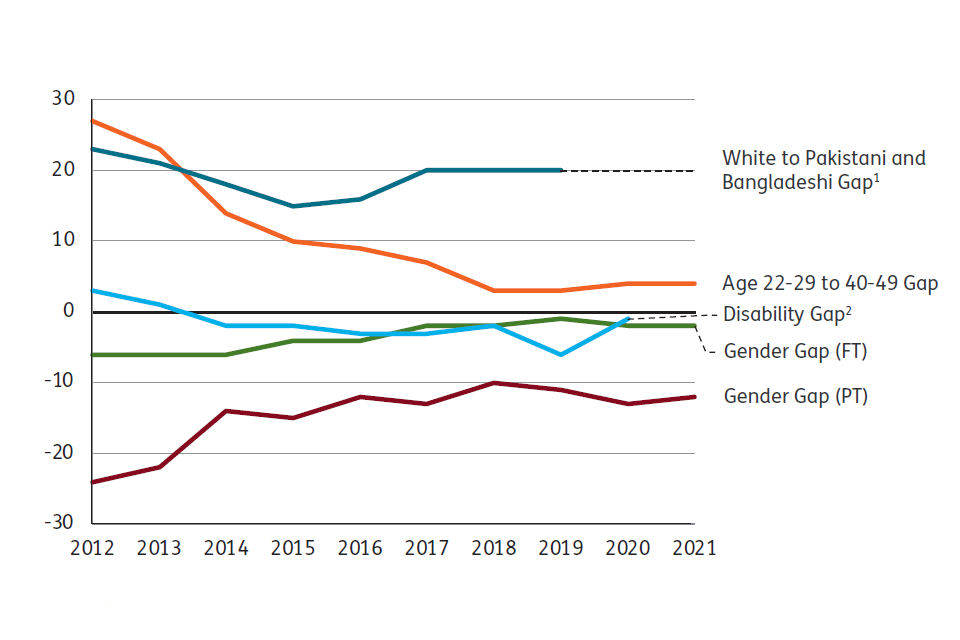
Source: DWP Workplace pension participation and savings trends: 2009 to 2021.
Note 1: White to Pakistani and Bangladeshi gap indicated by the middle year of 3-year financial year average.
Note 2: Disability gap indicated by the first year of a measure across financial years.
For further equality information relating to the Public Sector Equality Duty – DWP Staff, Employment equality for age, ethnic minority and gender please see the Remuneration and staffing report and for employment equality relating to disabled people, please see Priority Outcome 2.
Devolved Administrations and Non-Financial Information
Devolved Administrations
The Department continues to work with all 3 devolved administrations in line with the agreed principles in the joint Concordats, which set out the high-level framework for constructive cross-government working.
Scotland
The Scotland Act 2016 devolved significant social security powers and additional employment support powers to the Scottish Parliament. The Department provides extensive support to the Scottish Government in implementing these devolved powers, notably through a dedicated Scottish Devolution Programme for changes in social security, and through interactions between Jobcentre Plus and devolved employment support provision.
Employment
The Scottish Government introduced Fair Start Scotland in 2018 to help eligible unemployed people into sustainable employment. Jobcentre Plus, which remains a reserved policy is a major point of referral into this support, accounting for around two thirds of referrals each month.
Social Security
The Scotland Act 2016 devolved additional needs disability benefits, industrial injuries disablement benefits, carers benefits which are not means-tested, maternity and funeral expense payments, and benefits to provide winter heating assistance to the Scottish Parliament. DWP maternity and funeral expense provision was replaced by Scottish Government provision in December 2018 and September 2019 respectively.
The past year has been the most ambitious and challenging to date for both the Scottish Government and DWP in implementing changes to the social security system. These include:
- in July 2021, Child Disability Payment (CDP) replaced Disability Living Allowance for children (DLAc). Almost all the cases maintained by DWP on the Scottish Government’s behalf have now been transferred safely and securely to Social Security Scotland.
- in March 2022, Adult Disability Payment (ADP) replaced Personal Independence Payment (PIP). This was a significant milestone for both the Scottish Government and DWP, marking the introduction of the largest and most complex benefit to date. The Department has begun replacing over 300,000 benefit cases it has been maintaining on the Scottish Government’s behalf pending the introduction of ADP.
- in November 2022, DWP supported the Scottish Government’s extension of the Scottish Child Payment (SCP) to parents of children under the age of 16. In February 2023, Winter Heating Payment (WHP) replaced Cold Weather Payments. Eligibility to both SCP and WHP is linked to receipt of certain reserved means-tested benefit and is verified by data sharing between DWP and Social Security Scotland. DWP has worked closely with the Scottish Government to meet its delivery timetables for both benefits.
Winter Fuel Payments (WFP) remain a DWP benefit in Scotland while the Scottish Government develops its plans to replace them.
Universal Credit (UC) remains reserved, but the Scottish Parliament has powers to vary the frequency of payments, make payments directly to the landlord, split payments within a household, and vary the spare room subsidy reduction.
Attendance Allowance, Carer’s Allowance, DLA, PIP, Industrial Injuries Disablement Benefit and Severe Disablement Allowance are devolved benefits in Scotland. However, they continue to be delivered temporarily by DWP on behalf of the Scottish Ministers under Agency Agreements while the Scottish Government builds its capacity to replace them.
Northern Ireland
All matters covered by the Department are transferred in Northern Ireland. The Department continues to work closely with the Department for Communities (DfC) in Northern Ireland in view of the parity principle between the two social security systems. Exceptionally, however, in the absence of a fully functioning Assembly and Executive, the Department, with the agreement of DfC’s Caretaker Minister (May 2022) and Permanent Secretary (January 2023), took the exceptional step of legislating for and delivering the Cost of Living Payments in Northern Ireland where these are made to households in receipt of qualifying means-tested benefits and people in receipt of qualifying disability benefits. This ensured that people in Northern Ireland received these payments at the same time as people in Great Britain.
Wales
All matters covered by the Department are reserved in Wales, but related areas such as skills, training, health, education, childcare, and social care are devolved. The Department works closely with the Welsh Government to ensure devolved and reserved provision works effectively together.
Non-Financial Information
Better Regulation
DWP is committed to supporting businesses and reducing regulatory burdens whilst balancing the importance of protecting customers. The Department has introduced two regulatory provisions this year, which particularly focus on protecting pension savers with a net cost to business of £491.5 million, which attributed towards the government’s overall £9,894 million net costs to business from Qualifying Regulatory Provisions between December 2021 to December 2022.
The government is required to publish a report on the progress made towards the current Business Impact Target (BIT) which is currently set to zero. See the third report ran from 17 December 2021 to 16 December 2022: The Better Regulation: Government’s Annual Report, 2021-2022[footnote 20]
Human Rights
DWP is committed to meeting the UK’s obligations under the European Convention on Human Rights and we strive to ensure that decisions we make regarding individuals who use our services are compliant with the Convention. DWP supports the implementation across its remit of the UN Convention on the Rights of Persons with Disabilities and works across government to implement and deliver it.
The Department’s policies on welfare reform and pensions impact a significant percentage of the UK population. We work hard to understand the impact of proposed changes to existing policies and new policies that we intend to introduce, to ensure that final policies are proportionate and have minimised the risk of unintended consequences. One way that the Department does this is by consulting members of the public, trade bodies and other interested parties through our public consultation process prior to introducing or amending existing policies. Feedback received through DWP’s public consultation process is taken into consideration ahead of making final policy decisions.
During 2022-23 DWP ran 20 public consultations[footnote 21] providing members of the public and other interested parties a chance to share their views on the likely impact of proposed changes, including impacts on protected groups and vulnerable individuals. In addition, departmental lawyers give close consideration to questions of whether any potential infringements of Human Rights are legally justified. An example is the consideration given to eligibility criteria when drawing up recent emergency legislation to make Cost of Living Payments to those already on benefits. This ensured that DWP could deliver much needed support to large numbers of the UK population at pace, whilst minimising the risks of unintended consequences.
Prior to introducing policy changes DWP conducts equality impact assessments to test whether our proposed approach is proportionate. Equality impact assessments aim to understand the effect that our policies, services and procedures have on people from protected groups.
DWP has a robust complaints and appeals process, where individuals can appeal decisions relating to benefits they are receiving or have applied for. These include DWP’s internal complaints procedures and the option for individuals to raise their complaint with independent case examiners or, ultimately, the Parliamentary and Health Service Ombudsman where they remain dissatisfied with the outcome. For more information, please see the customer complaints section in Priority Outcome 4.
In addition, through the UK judicial review system individuals and affected organisations can examine the legality of departmental decisions.
Anti-bribery and corruption
The Department has a zero tolerance approach to fraud, bribery, and corruption and has structures in place for the effective management of these threats.
Departmental policies published on the intranet, training programmes, and commercial agreements with suppliers and providers promote an anti-fraud, bribery, and corruption culture.
Fraud, error, and debt learning is included in the Department’s induction programme and mandatory annual learning for all our employees. All employees must also complete DWP’s security and data protection e-learning annually.
Working with other agencies is a key part of DWP’s counter fraud response. The Government Internal Audit Agency deploys a Counter Fraud and Investigation Team provides specialist counter fraud services to DWP, which include the investigation, and where appropriate support to the prosecution, of allegations of fraud, bribery, and corruption. For further information on our approach to tackling fraud and organised crime please see the Fraud, Error and Debt section.
Strategic Enablers
Strategic Enabler 1: Workforce, Skills and Location
Ambition
Our ambition is to make DWP a great place to work and be a flexible, inclusive, and continuously learning organisation. During 2022-23 we continued to lead on our ability to attract and retain people for an inclusive organisation, representative of the customers we serve, investing in technical, professional and leadership skills.
We have delivered the first year Spending Review Plans of a smaller, better, greener estate, whilst investing to improve DWP’s core critical assets, and creating a culture where sustainability is aligned to achieving our strategic outcomes and objectives.
Stabilising the workforce
As of the 31st March 2023 DWP employs 84,944 people operating across almost 1,000 sites with most employees working in service delivery or delivering Universal Credit in Job centres and service centres.
Since March 2022, we have achieved much greater stabilisation in the workforce through our offer of permanent contracts to those brought into the department on temporary and fixed term appointments during the pandemic. In autumn 2021 we began making offers of permanency to c.18,000 colleagues, c.9,500 Executive Officers (EOs) and c.5000 Administrative Officers (AOs) have since accepted permanent contracts. This has allowed us to refresh our plans and meet a number of challenging priorities that support our customers. Following a peak in September 2021 of 22%, fixed term and temporary contract colleagues they now represent only 0.4% of our overall workforce.
Building on our ambition as an inclusive employer
We have worked to increase promotion and attraction of DWP as an employer of choice, widening our diverse talent pool by developing recruitment, attraction branding material and website content, alongside our current methods and trialling the use of a diverse jobs board to target those who are under-represented in the workforce.
We piloted programmes such as Discover DWP, to engage and develop a diverse group of external candidates, preparing them for senior level roles across DWP professions. And Leaders Like You, a unique 1-year Programme tailored to individuals, with targeted career support and aims to accelerate the progression of colleagues from diverse groups and strengthen the DWP talent pipeline. Following rigorous selection processes, we launched the Programme in early 2023.
The capability of our people
Over the last twelve months we have continued to invest significantly in building the capability of our people at all levels. Having a skilled and capable workforce is essential for the effective delivery of the department’s priorities.
In early 2022, we introduced a Skills Assessment approach to map all activity and identify new approaches for understanding our skills, how we assess skills, and how we identify gaps. This work connects closely to the Government Reform ambition on skills identification, ensuring that we have the best people leading and working in government to deliver better outcomes for our customers.
We have acted as a driver for more effective and efficient ways of working by improving digital skills to fulfil the departmental capability priority. A one-day digital session has been delivered to over 30,000 new recruits since its inception, 4,500 of which were in 2022-23; with shorter bitesize sessions delivered to more than 12,000 colleagues, of which 3,600 attended in 2022-23. Feedback has been very positive with 98% saying that they learnt skills that will make their job easier and 88% saying their digital confidence and capability has improved.
During 2022-23 attendance across the department for both Leadership Essentials and Leadership Foundations, which is our tailored leadership learning and management development offer, has been positive and above industry average. We have had over 14,000 sign ups to 1 or more of the 9 Leadership Essentials webinars and over 16,000 places have been made available in Leadership Foundations learning. We have also trained leaders to facilitate our learning offer over the last year to meet the increased demand.
Delivery of our learning
Our technical learning for our colleagues has continued to transform. We have built a much greater flexibility across our teams allowing us to deploy resource into product transformation and continuous learning sessions reducing our overall costs. The development of our products has allowed us to move away from lengthy learning to more modular products with follow up of more targeted bite size or self-paced learning at the point of need – when required. The impact of this style of learning can be seen in the reduction of learning days delivered to colleagues throughout 2022-23 ensuring less time away from service delivery.
| Learning | 2020-2021 | 2021-2022 | 2022-2023 |
|---|---|---|---|
| Learning Days | 335,381 | 233,853 | 133,847 |
| E-Learning | 38,206 | 38,946 | 45,944 |
| Open Learning | 4,087 | 5,511 | 7,375 |
Apprenticeships
DWP continues to place apprenticeships at the heart of our long-term strategy to build capability, by providing good quality entry and progression routes within a range of careers and designed to attract, develop, and retain people from all backgrounds and locations.
Under our new DWP Apprenticeship strategy, launched in Spring 2023, apprenticeships will be integrated into departmental skills and capability plans, ways of working and our people strategies. This includes supporting professions and departments to develop career pathways inclusive of apprenticeships.
We currently have 4% of our headcount who are apprentices and the proportion of our apprentices from lower socio-economic backgrounds is at 39%. We are achieving levelling up targets and our completion rates have increased on last year rising to 49%.
In 2022-23 we continued to build upon our Social Mobility Apprenticeships (SMA). We widened the scheme to include school leavers piloting the approach in two locations, which will support our inclusion and diversity agenda even further whilst strengthening our talent pipeline.
As a result of all our work DWP was recognised as 5th in the top 100 Apprenticeship Employers nationally and achieved 22nd in the Social Mobility Index last year.
We now provide 39 different Apprenticeship Standards across the department ensuring colleagues have the right knowledge, skills and behaviours and access to the right learning. This also allows colleagues the opportunity to become professionally accredited, building a more professionalised workforce that overall improves service delivery to customers.
The location of our people and services
DWP employs 16% of the Civil Service (as at December 2022) and makes up 20% of the government’s civil estate. Much of our estate is old, inefficient, and of poor quality with 38% of our buildings overdue for essential updates and maintenance work. In addition, following the COVID-19 pandemic and the introduction of hybrid working, we have reduced the need for physical office space. With hybrid working in place, DWP started this Spending Review year with capacity for over 158,000 people against a requirement for space for approximately 87,000. We are playing a key part in the Government Property Strategy delivery of smaller, better, greener.
With our buildings spread across the UK totalling approximately 1.6 million m2 (at April 2022), we have reduced the overall total floor space to approximately 1.5 million m2 in 2022-23. By the end of this Spending Review period, 17% of our buildings will meet the top two Energy Performance Criteria, against the current position of only 3.3%, and we are on track to have 100% of our buildings meeting the top two Energy Performance Criteria by 2030.
By moving out of poorer quality buildings and investing in refurbishments at those we keep, we will be able to move closer to realising our ambition of making our offices a great place for our people to work and in the case of Jobcentres a better environment for customers to visit. It will also ensure our estate is more sustainable and energy efficient, helping meet the government’s carbon reduction target.
These changes are being delivered through the Workplace Transformation Programme, a 10-year programme which focuses on how and where we will work, determining our future locations and working practices. This will deliver efficiencies and enable genuine modernisation and transformation within DWP. Alongside this there is a structured programme of essential works to ensure our ageing buildings remain safe and fit for purpose for both customers and colleagues delivered through our Estate function. Together they support the Government Property Strategy to deliver a smaller, better, and greener estate.
In 2022-23, we have generated estimated savings of £3.1 million, and we anticipate delivering gross recurrent savings of £49.5 million per annum by the end of the current Spending Review period in the 2024-25 financial year. We are looking to identify opportunities for further efficiencies to be delivered in the next Spending Review period.
For our back-office locations, where we provide virtual services and do not need to see customers face-to-face, the Department has used lease breaks to exit poorer quality buildings and remove underutilised space; delivering value for money for the taxpayer by only paying for the space we need. Hybrid working also allows more people to work from newer or refurbished better locations and achieve a better work-life balance. Larger multi-functional locations allow our people a broader career path with more opportunities, given a wider range of job roles are undertaken in larger buildings.
In 2022-23 we exited 40 properties in total including 25 back-office sites. This has enabled DWP to move away from having small numbers of colleagues spread across multiple locations and instead consolidate into fewer, larger, multi-product line sites where the aim is to accommodate upwards of around 300 people to aid collaboration and provide opportunities for development as well as building business resilience.
So far, we have successfully retained, retrained, or redeployed most of the 8,800 people impacted by the changes to our back-office estate, with a small number transferring to other government departments and some leaving the Department on Voluntary Redundancy.
For Jobcentres, DWP is gradually improving its estate to create workplaces where we can deliver our services when, where and how they are needed by our customers. We will do this by:
- consolidating services in some locations where there is another nearby office which offers better accommodation for customers and colleagues
- looking to close older and poorer quality buildings and permanently relocate to the temporary Jobcentre where it offers better accommodation and value for money, making it an established site
- co-locating with key delivery partners
- in some cases, securing new premises
To date we have exited 13 jobcentres, taking advantage of lease breaks to move to better premises.
We are also returning the Jobcentre network to its pre-pandemic size by decommissioning the temporary Jobcentres (where sites are not suitable to be swapped-out with the established site). In 2022-23, we decommissioned 19 buildings.
In the same period we also exited and relocated services from two Health Assessment Centres.
For both back-office sites and Jobcentres, further refurbishment work will take place in 2023-24. In addition, we have also embarked on major programmes of work to modernise our security infrastructure and replace obsolete IT platforms, reprocure our workplace security and facilities management contracts, and replace outdated major assets in sites we anticipate retaining in the longer term, avoiding the costs and risks associated with critical infrastructure failure.
Case Study
Temporary Job Centres
During COVID-19 DWP saw a significant increase in Universal Credit claims, coupled with a requirement to introduce social distancing measures. This meant we needed more Jobcentre space and more Work Coaches to continue to deliver services for our customers. Under uniquely challenging conditions we responded quickly and flexibly to acquire more space whilst ensuring we maintained proportionate governance, scrutiny and standards. We collaborated with suppliers and across government to secure 194 temporary Jobcentre sites which included utilising extra space in some of our existing Jobcentres – all within half the normal timescale for government property acquisition – a huge achievement.
To ensure flexibility, shorter 3-year leases were negotiated, securingproperties with a basic minimum fit-out level tailored specifically to pandemic need such as agreements with landlords to house short term ‘appointment only’ services. Now the pandemic has passed, we have started to decommission the temporary Jobcentres using a phased approach to limit the risk of disruption to our services. We decommissioned 19 temporary Jobcentres in 2022-23.
In some cases, the temporary offices offer a more modern, greener environment for customers and colleagues and provide better value for money for the taxpayer. In these cases, we are exploring whether we can swap them for existing Jobcentres. For example, in Brighton and Hove we were able to take advantage of lease breaks at two existing Jobcentres and moved colleagues and services into the temporary Jobcentre at Brighton Queens Square, making that the established Jobcentre providing a better building and environment for both colleagues and customers.
Places for Growth
DWP is fully committed to supporting Places for Growth and we have achieved some notable successes in the last 12 months against our targets.
| Target number | What we’ve done |
|---|---|
| Target 1 | We have continued to increase the percentage of our Senior Civil Service (SCS) roles outside of London, supporting our target of having over 50% of all SCS roles outside London and the South East by 2025. In February 2023, 58.4% of our SCS roles are based out of London and the South East. In the last 12 months, 68.4% of our new SCS appointments have been outside of London. |
| Target 2 | We achieved our target to reduce our SCS in functional areas based in London to 40% by December 2022. We continue to monitor our progress in this area and build communities in all of our hub locations. In February 2023, 36.8% of our functional SCS are based in Caxton House, London. |
| Target 3 | In 2021, we achieved our third target by announcing Leeds as DWP’s second headquarters. We are continuing to embed this within our working practices in the Department. |
| Target 4 | DWP has committed to the movement of 400 roles out of London and the South East. This includes the movement of 215 roles within 1 of our Arms Length Bodies, the Money and Pensions Service (MaPS), which we expect to be complete by Spring 2024. |
82.2% of our total DWP workforce is based ouside London. We have utilised 3 existing service centres in Glasgow, Treforest, and in Birmingham to include corporate function jobs, enabling more career progression and tapping into new talent pools. This further supports delivery of our Places for Growth targets and the government’s wider Levelling Up Agenda.
Strategic Enabler 2: Innovation, Technology and Data
Achievements and Progress
The Department has continued to invest in modernising our IT infrastructure and phasing out our legacy systems to enable delivery of reliable, secure, and cost-effective services which are essential to the 22 million claimants that the Department serves. We have continued to think strategically and build IT solutions for the future as part of our day-to-day activity, echoing ‘Our vision’ to develop and deliver world-class digital services that benefit society today and improve the lives of future generations. Our achievements throughout 2022 continue to receive recognition via Civil Service and IT Industry awards.
In April 2022, DWP embarked on an ambitious transformation agenda to modernise our services across Retirement Services, Health and Disability, Child Maintenance, Working Age and Disputes to improve the experience for our customers and staff whilst enabling efficiencies throughout the Spending Review period. We are doing this by supporting the Department’s Change Programmes including Universal Credit, Health Transformation, and Service Modernisation programmes.
In the face of high demand for our systems, we have continued to proactively deliver new, and exploit existing, technologies whilst demonstrating innovation and flexibility. Following the cost of living pressures, the Department adapted existing processes at pace to promptly administer Cost of Living Payments to eligible customers.
Transforming the use of data and analytics
We have made significant progress in our mission to make data more accessible, usable and governed which is helping to improve the effectiveness of the services and support that we provide to our customers and help drive informed decision-making across DWP and wider government. Achievements this year reflect our ability to collaborate and respond to rapidly changing events to provide support to those most affected. For example:
- the new Way to Work Dashboard provides a historical view of vacancy volumes by country, region, and county and provides the ability to drill down at Local Authority level. All vacancies can be filtered by sector role and salary bands, helping strategy planning and resourcing.
- a cold snap at the start of 2023 saw 29 weather station triggers, prompting a Cold Weather Payment to an estimated 982,000 qualifying claimants in England and Wales, equating to £24.5 million (estimated) in additional support towards heating costs.
- supporting the Department for Digital Culture, Media, and Sport (DCMS) by confirming broadband Social Tariff applicants are in receipt of a relevant social security benefit. This is reducing fraud, speeding up processing times, and increasing take up.
- providing the Department for Business Energy & Industrial Strategy (BEIS) helpline with the ability to check benefit status as part of their Warm Homes Discount Scheme entitlement check
- overseas Healthcare Service is now providing real-time benefit information, enabling NHS to establish citizens’ entitlement to state provided healthcare.
- healthy Start Service is now providing real-time benefit information to enable NHS to establish claimant’s entitlement to Healthy Start payments for the purchase of fruit, vegetables and whole milk.
‘Build Once, Use Many’ to drive efficiencies in the way we build new services
We have laid the foundations to further exploit our Strategic Reference Architecture which focuses on using common digital components that can be used to build new services that interact with each other. This will enable us to deliver faster and more efficient service to our customers. Some example achievements of reusing 19 common components of the Strategic Reference Architecture:
- automating Identity Verification on Employment & Support Allowance and Personal Independence Payment telephony lines, allowing us to get to the customers’ reason for calling quicker on more than 10 million calls using this journey.
- real Time Prescription Exemption Checking Service is providing a real-time view on a citizen’s eligibility to NHS prescription charge exemption and has been extended to improve service for our UC customers and is expected to save £250 million per year for the NHS.
- child Maintenance Group facilitated their first Real Time Video Assessment becoming the second Line of Business to utilise this video solution offering remote assessments, which should improve the number of successful appointments by reducing the travel barrier for customers.
- electoral Integrity Programme (EIP) now have access to verify that a person has lived in the UK at some point, thus giving them the right to vote in UK elections. The next phase, which verifies addresses, is an extension of the existing checks to provide more accuracy to EIP
- improving the Maternity Allowance claims journey using a new Calculate Service to provide a better experience for our customers, improved service stability, increased security, reduced cost and greater accuracy.
- internet Service Providers (ISP) can automatically confirm citizen eligibility to lower broadband prices. Currently 4 ISPs are using this capability with a further 15 planning to come on board, contributing to reducing cost of living and health inequity driven by digital exclusion for claimants.
- simplifying the Department for Education Free School Meals process and reducing manual interventions by automatically checking the eligibility of Customers, which in turn, reduces the claim time for our customers, and fraud within our systems.
- “Legacy Bridge” allows the transformation of the Customer journeys coupled with a reduction of fraud and official error. Leveraging data held in legacy systems allows digital transformation to happen in parallel with meeting customer needs. Without it we would have to wait for all the legacy systems to be replaced first before being able to deliver any digital transformation.
- driving efficiency and effectiveness by supporting over 500 million fully automated real time exchanges between IT systems per month.
- delivered Personal Independent Payment, Disability Living Allowance and Attendance Allowance Award Data to Carers Allowance Eligibility and Motability. In September 2022, Motability onboarded all their dealerships and in almost 5 days Motability processed 1,341 DLA checks. This simplifies the process reducing both v and errors for DWP Staff since the check is now automated.
Deliver modern digital services
Digital delivery has remained largely on track against the existing plan. Key successes include:
- rapidly collaborating with colleagues across DWP and other government organisations to ensure Cost of Living payments were made.
- launched digital services for Maternity Allowance and Attendance Allowance.
- launched a “nil award” digital service for Pension Credit, introducing automated claim processing to a small range of Pension Credit applications received online which are ineligible to go into payment.
- provided the solution for Scottish Government to expand Adult Disability Payments for new claims.
- we now host 70% of services in the Cloud. This optimises price performance, empowers innovation and accelerates delivery and has helped avoid a capital reinvestment of £90 million in refreshing the Datacentre Infrastructure.
- trialling a new Health Assessment Service tool which provides a greater understanding of our customers’ individual situations ensuring we provide the right service for them.
- delivered key process changes in Deductions from Earnings, resulting in payments being received an average 11 days faster and the number of payments received increasing by 40%.
- a ‘Check child added to two claims’ is now identifying duplication errors in UC claims worth c£37 million per annum.
DWP Digital’s continues to collaborate across central government supporting initiatives such as 1 Login and Government Digital Exchange (GDX). We have maintained our reputation as a leading Digital, Data and Technology profession within government.
Provide reliable, secure, cost-effective services
We have continued to refine our model that aims to optimise the investment in the maintenance of our systems to ensure we deliver a high-quality service expected from our staff and customers.
Service availability is at its highest ever and consistently matches industry standards with 0.04% Users Hours lost (system outage / slow running) and a 22% (circa 79,000) reduction in user IT incidents raised versus 2021-22.
This results in less downtime meaning our staff continue to deliver a seamless end to end service for our customers with our services being available when our staff / customers need them most.
Our efforts have seen User Satisfaction in IT increasing by 13% when compared to 2019 displaying the view that our services are well received by our agents and fulfil their requirements.
Social Fund Cold Weather Payments 2022-2023
The Social Fund Cold Weather Payments (CWP) scheme makes an important contribution towards the additional heating costs incurred in England and Wales during periods of exceptionally cold weather. This represents an estimated 3.7 million eligible people at the start of the Cold Weather Payments Season (1 November to 31 March) in England and Wales, 1.2 million of whom are in receipt of Pension Credit.
The Cold Weather Payment scheme uses a network of 72 weather stations across England and Wales which record daily temperatures. Each eligible customer’s postcode is linked to 1 of these stations. A payment of £25 is made when the average temperature has been recorded as, or is forecast to be, 0ºC or below over 7 days at the weather station linked to the eligible customer’s postcode. DWP strives to make a payment within 14 working days of a trigger to ensure claimants receive payments at the time of need.
Northern Ireland runs a separate scheme which mirrors the scheme for England and Wales. Social Security Scotland has introduced the Winter Heating Payment scheme for eligible claimants living in Scotland from 1 November 2022.
During the 2022-2023 Cold Weather Payments Season there were 118 cold weather triggers, resulting in over 5 million payments.
| Estimate of all eligible recipients and payments made |
Total | England | Wales |
|---|---|---|---|
| Number of triggers | 118 | 108 | 19 |
| Total eligible recipients | 3,714,000 | 3,463,000 | 251,000 |
| Number of payments made | 5,504,000 | 5,192,000 | 313,000 |
| Estimate of eligible recipients received Pension Credit and payment made |
Total | England | Wales |
|---|---|---|---|
| Number of triggers | 118 | 108 | 19 |
| Total eligible recipients | 1,202,000 | 1,122,000 | 80,000 |
| Number of payments made | 1,787,000 | 1,687,000 | 100,000 |
Most recently, a cold snap at the start of 2023 saw 29 weather station triggers, prompting a Cold Weather Payment to an estimated 982,000 qualifying claimants in England and Wales, equating to £24.5 million (estimated) in additional support towards heating costs.
DWP publishes Cold Weather Payment estimates on GOV.UK. Exact figures on the amount paid out in each financial year are available in the Social Fund White Paper Accounts and DWP budget information published after the end of the financial year.
An online tool is available for claimants to check if they are due a payment. Official Statistics Background and methodology: Cold Weather Payment estimates 2022 to 2023
Strategic Enabler 3: Delivery Evaluation and Collaboration
Over 2022-23 we have sustained focus on improving our internal processes to ensure that we can deliver the strongest outcome to citizens and taxpayers.
Delivery
In 2022-23 we have reshaped the way that we deliver some of our services to provide additional and/or targeted support to vulnerable customers with the cost of living impacts, and delivery of new initiatives announced by government to drive further efficiencies and increase participation in the Labour Market.
At the start of the year DWP agreed a 3-year Departmental Plan for 2022-2025, which set out the Strategic Objectives, and associated Priority Outcomes and Strategic Enablers for the current Spending Review period.
This year’s focus has been to implement and embed the planning processes that we introduced last year to support DWP’s Executive Team (ET) and Ministers to visualise the scale of the Department’s transformation and strategic ambitions, and the progress that we are making towards delivery of those ambitions. For example, over the course of the year we have strengthened the strategic performance and planning conversations across the business to aid senior managers understanding of key cross-cutting risks, emerging issues that could impact the Department’s ability to realise our ambitions by the end of the Spending Review period. To support decision making, we have provided regular evidenced based quarterly and monthly progress reports to ET and the Departmental Board on performance using key metrics, with agreed expectations, and deliverables, and where risks are identified an objective assessment on the likely effectiveness of mitigation plans. In addition, we have regularly assessed the deliverability of our Departmental Plan in line with key fiscal events to aid ET’s understanding of key challenges to delivery and options to mitigate these risks and challenges.
Evaluation
Providing transparent accountability through regular reporting, both within the Department, to the centre and Parliament.
The Department regularly evaluates the programmes and pilots that we run to learn lessons and apply best practice to future work. Below are some examples of key evaluation activities we are undertaking.
Restart - We have undertaken a comprehensive, mixed-methods evaluation including a quasi-experimental impact evaluation, a longitudinal cohort survey which looks at the customer journey and support received, provider research and geographical case studies to understand local delivery challenges, which is due to be completed in Spring-Winter 2024.
Kickstart - The evaluation has included a process evaluation, capturing the views and experiences of Kickstart participants and of employers and gateway organisations. This will conclude in Spring 2023, and findings will be published in line with official protocols for government social research and statistics once finished.
New Youth Offer - This evaluation consists of 3 strands: an in-house quantitative impact assessment, an in-house process evaluation (completed) and an externally commissioned mixed method process evaluation. The externally commissioned research commenced in January 2023 and is gathering views from young people and those working with them to help us understand the effectiveness of the Youth Offer and make improvements.
Cross-cutting Evaluation of Plan for Jobs – A 2-year mixed methods process evaluation of how DWP’s parts of Plan for Jobs worked together as a system. This included ten case studies exploring how Plan for Jobs support was delivered in different areas and a two-wave survey of groups of Universal Credit claimants who participated in different Plan for Jobs support packages and those who did not participate, to compare their experiences.
As part of the evaluation of Plan for Jobs, the below report summaries how well Work Coaches were able to provide and refer to employment support in 2021 and 2022. Work Coach provision of employment support[footnote 22].
Work and Health Programme (WHP) – the programme evaluation benefitted from substantial research analysis exploiting the Randomised Control Trial design.
Job Entry Targeted Support (JETS) – The JETS programme ended in September 2022 and first phase the programme evaluation consisted of qualitative case studies to assess the programme’s effectiveness and customers’ experience.
Health Transformation Programme (HTP) – Our evaluation strategy is underpinned by the HTP Theory of Change which we will have revised to reflect developments within the programme and aligned with the programme’s strategic objectives. As the in-house test areas volumes are low, evaluation to date has been small scale qualitative research. The evaluation strategy is available to see here: Health Transformation Programme evaluation strategy[footnote 23]
Reducing Parental Conflict – The first phase of the RPC programme ran between 2018-22. To date, 3 interim reports have been published, with a final report due in 2023 [footnote 24]. Research to evaluate the successor programme, the RPC Local Grant started in 2022 [footnote 25].
In addition, we regularly review our services through independent reviews as well as external reports to ensure we are delivering good value for money and robust services. We also report regularly to the Infrastructure and Projects Authority (IPA) on those programmes on the Government Major Project and Programme portfolio and Programmes engage with the IPA Gateway assurance reviews as appropriate.
Collaboration
We recognise the importance of working in partnership with other government departments and arm’s length bodies to share knowledge and best practice to aid the delivery of our key objectives and develop solutions to cross-cutting issues.
Working in partnerships with other government departments
We have continued to collaborate with other government departments, including HM Treasury, Department for Education, Department for Levelling Up, Housing and Communities (DLUHC), and Department for Health and Social Care to deliver on our cross-cutting strategic objective to maximise employment, tackle issues on workforce participation and supporting in-work progression.
In addition, we work with DLUHC and other government departments on the delivery of the UK Shared Prosperity Fund. We share our expertise and knowledge to support the People and Skills Priority of reducing the barriers some people face to employment and support them to move towards employment and education, thus addressing inequality within and between the regions so that wraparound employment, skills, and social inclusion provisions are targeted to reflect the needs of people and organisations in local areas. Further details of the Shared Prosperity Fund can be found in DLUHC’s Outcome Delivery Plan.
We also work closely with other government departments on initiatives to build support for claimants facing multiple complex needs. DWP supports DLUHC’s Supporting Families Programme, which provides co-ordinated support across England for families with multiple and complex needs.
For information on how we work with Local Authorities please see Priority Outcome 3.
Working with arm’s length bodies
We work closely with arm’s length bodies (ALBs) to both improve the service we provide to our customers and to help us deliver our goals. Two examples are:
- to support the universal provision of Automatic Enrolment the department has worked closely throughout 2022-23 with the National Employment Savings Trust (NEST) to ensure it continues to deliver an affordable and good quality pension that helps low to moderate earners save for retirement. Through its Public Sector Obligation NEST ensures all eligible employers can offer a workplace pension to their staff, helping its 11 million members prepare for retirement.
- the department has supported The Pensions Ombudsman (TPO) in the establishment of a dedicated Pensions Dishonesty Unit (PDU) to investigate allegations of serious breaches of trust, misappropriation of pension funds and dishonest or fraudulent behaviour by pension scheme trustees. The PDU aims to hold the wrongdoers responsible for the unlawful gains they have made and ensure they repay these monies to the scheme members. In just over a year, the PDU has made determinations amounting to over £15 million against dishonest pension scheme trustees.
Strengthening functional expertise and delivery
Our function leads provide an essential role in strengthening functional expertise, ensuring alignment to standards as set by the centre of government, and enabling a culture of continuous improvement. To further strengthen functions, we have introduced an annual review between departmental and central functional leaders to discuss and agree actions against cross-functional short, medium and longer-term priorities. Further information on functional standards is provided in the Governance Statement.
Strategic Enabler 4: Sustainability
Achievements and Progress
Sustainability remains central to the way we make policy, run our buildings and purchase goods and services. Through our services we are contributing to social wellbeing, safeguarding the environment and supporting the UK economy.
We are on course to meet Greening Government Commitment (GGC) targets to reduce total waste generated, our paper use and our water use. All of these metrics are still significantly below the 2017-18 baseline year, although there have been some increases compared to last year, as more of our employees have returned to the office.
Total greenhouse gas emissions remain below the 2017-18 baseline year. Direct carbon emissions are lower than our baseline but higher than target. As our estate footprint reduces, we will see a reduction from peak emissions (see Strategic Enabler 1 for more information on the Workplace Transformation Programme). We have seen a fall in domestic and international flights compared with baseline year.
We are also making good progress in investing in heat decarbonisation via Public Sector Decarbonisation Scheme grant funding and completing programmes funded through the 2021 Spending Review to deliver on our Carbon, Water and Sustainability management plans (see case study below on Public Sector Decarbonisation Scheme at Quarry House).
Overall we have seen a decrease in the waste recycled against the 2017-18 baseline year due to a significant reduction in paper use since the pandemic. Due to initiatives undertaken by Estates, the proportion of waste recycled has increased this year compared with last year.
There has been a significant reduction in Consumer Single Use Plastics on the estate compared with last year, following removal of COVID-19 measures and a reduction in the number of catered sites and an increase in re-usable cups. DWP Estates has been working with our facilities management supplier on increasing food waste collection.
For more information on sustainability, please see our Sustainability Report.
Case Study
Quarry House
“Quarry House is 1 of the very largest DWP sites, and as such was the second highest consumer of natural gas on the estate,” says Tim Saxon, Environmental Sustainability Strategy and Delivery Oversight Lead. “However, we knew that by introducing a range of decarbonisation and energy efficiency measures we could significantly reduce its carbon emissions.”
The project involved a huge amount of work, installing a range of measures. “We have worked on the Quarry House project across two years,” says Tim, “and we made a lot of changes. We removed boilers completely by connecting to a heat network, installed solar panels on the roof, increased the usage of low-energy LED lighting and optimised the building’s heating, cooling and ventilation controls.”
“I’m really proud of the results – we managed to cut in half the carbon emissions
from Quarry House, and this was recognised when we made it to the final of the Sustainability Award at the Government Property Awards in 2022.”
Fraud Error and Debt Report
Introduction: What is Fraud and Error?
Measuring loss
Fraud and error is a big challenge for DWP. It is made up of overpayments (and underpayments) of benefit that fall into 1 or more of the following categories:
Fraud: This includes all cases where the following 3 conditions apply:
- the conditions for receipt of benefit, or the rate of benefit in payment, are not being met.
- the claimant can reasonably be expected to be aware of the effect on entitlement.
- benefit stops or reduces as a result of the review.
Claimant Error: The claimant has provided inaccurate or incomplete information, failed to report a change in their circumstances, or failed to provide requested evidence, but there is no fraudulent intent on the claimant’s part.
Official Error: Benefit has been paid incorrectly due to inaction, delay or a mistaken assessment by the DWP, a Local Authority or HM Revenue and Customs to which no one outside of that Department has materially contributed, regardless of whether the business unit has processed the information.
The Monetary Value of Fraud and Error (MVFE) is our headline measure for overpayments and underpayments. It expresses loss in monetary terms (£s) and as a percentage of benefit expenditure. Measurement as a percentage is a better expression of loss, as total benefit expenditure is affected by the increases in rates we apply each year and varies with demand as the wider economic conditions change. This means monetary loss (£s) can increase even though the percentage of loss falls.
To calculate the level of loss, we use the following methodology:
- benefits that have large expenditures, such as Universal Credit, are measured continuously. This year, we measured the levels of fraud and error in Universal Credit, Pension Credit, Employment Support Allowance, Housing Benefit (Standard Working Age) Personal Independence Payments and State Pension.
- to measure the levels, we select a sample of cases from each benefit. A claimant is then contacted by telephone and asked to provide evidence to support their claim which is compared to the information held on our computer systems. This process identifies where a claimant may have been overpaid or underpaid.
- once all of the reviews are complete, the Fraud and Error Measurement Analysis team will take an extract of the data and gross-up the sample data to estimate the levels of fraud and error in each benefit.
- there are a number of benefits we don’t measure in this way. Some benefits will have been reviewed before and we apply the previous rate of fraud and error when calculating loss. Other benefits, usually those with a small expenditure, will have a proxy measure applied from a benefit that is administered in a similar way such that we can reasonably assume and apply the same rate of fraud and error.
- we add up all of the overpayment and underpayment amounts for every benefit and divide it by that total expenditure to give us the percentage overpaid.
- this year, the sampling period took place between September 2021 and October 2022. This allows for the results to be quality assured but means there is a lag in the results.
We talk about our 2022-23 results in our results section. Fraud is the greatest cause of loss (2.7% of overall expenditure) and Universal Credit has the greatest rate of loss (12.8% of Universal Credit expenditure). Universal Credit accounts for 19% of benefit expenditure (35% if State Pension is excluded) but 66% of overpaid expenditure, so Universal Credit fraud and error will have a disproportionate impact on overall levels of loss. This is why we focus a lot of our attention on fraud and on Universal Credit.
Chart A: Fraud and Error losses by benefit
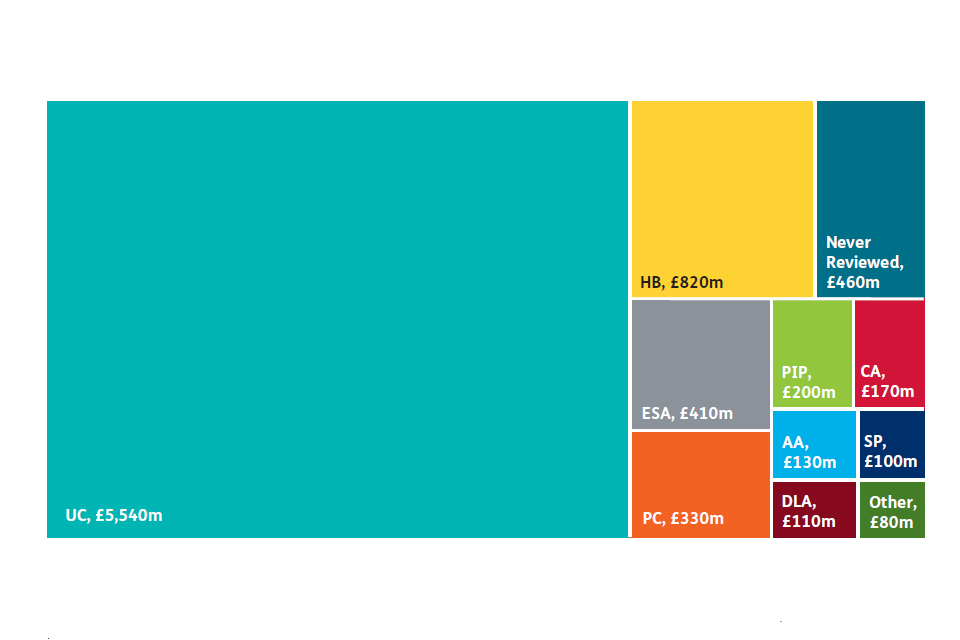
Measuring savings in monetary terms
We also measure the impact of our fraud and error controls and activities in terms of Annually Managed Expenditure (AME) savings – i.e., how much we have reduced the cost to the taxpayer as a result of our interventions. We typically estimate these savings by adding up both historic overpayments (discounted to take account of our debt recovery rates) and future overpayments that we estimate we have prevented (based on assumptions about how long the overpayment would have continued to exist if we hadn’t found it). We also estimate the savings from our up-front controls by comparing with a counter-factual world where that control doesn’t exist.
Our Fraud, Error and Debt Report
Part 1 of the Fraud, Error and Debt Report talks about what we have done to tackle overpayments and prevent loss. This section looks particularly at our work to reduce fraud and tackle Universal Credit loss.
We are of course equally conscious of the need to pay people their full entitlement, and Part 2 of the Report looks at how we are correcting historic, long standing underpayment errors.
Finally, when we cannot prevent overpayments happening, we look to recover the money at the earliest opportunity, whilst working closely with customers in order to avoid hardship. Part 3 of the Report (page y) sets out how we have been managing debt recovery.
Part 1: Tackling Fraud and Error
Management Summary
Fraud is growing across the economy, with 41% [footnote 26] of all crimes now a result of fraud. DWP is not immune to this trend and fraud and error has significantly increased since the start of the Covid pandemic. The increases have primarily been driven by some people who exploited the necessary easements that we introduced to support the most vulnerable during the height of the pandemic.
To deal with the increases of fraud, DWP published its plan ‘Fighting Fraud in the Welfare System’ and has taken clear action to tackle loss.
The Plan has been backed by additional funding, with an extra £900 million investment over 3 years helping boost frontline defences, and the Department is starting to make real progress in tackling loss. For example:[footnote 27]
1. We re-introduced the controls removed during Covid which include identification verification and gainful self-employed checks. Our frontline staff have delivered the full range of controls to ensure we pay the right money to the right claimants, saving at least an estimated £0.2 billion in 2022-23.
2. As noted in the recent report, ‘Tackling fraud and corruption against government’, DWP (as with HM Revenue and Customs) has its own, ‘fraud investigation and enforcement legal powers and counter-fraud activities embedded within operations and have other counter-fraud expertise not available to other departments’[footnote 28], which means we are able to actively prevent and disrupt fraud. We have secured additional counter fraud front-line staff and enhanced our data, analytics and investigative capability, increasing our disrupt capability and growing our ability to detect and correct serious and organised crime, which helped us deliver total Counter Fraud and Compliance savings of around £1.1 billion for 2022-23.
3. We expanded our use of Real Time Information (RTI) about Earnings and Pensions in the Verify Earnings and Pensions (VEPs) programme to achieve savings of £0.07 billion.
4. We introduced Targeted Case Reviews (TCR) that detect Universal Credit overpayments and underpayments and provides feedback to prevent fraud and error in Universal Credit. It reviews the entitlement and circumstances of Universal Credit cases at risk of being incorrect, including suspicious cases which entered the system at the height of the pandemic. In 2022-23, we recruited 600 staff to conduct in-depth Universal Credit case reviews, which has enabled us to review 25,000 Universal Credit claims, saving £0.014 billion of 2022-23 expenditure.
5. We maintained our continuous improvement approach with our interventions feeding back into intelligence, policy and service design. We have also bid for legislation to help tackle rising levels of fraud and defeat those intent on stealing from the state.
When the pandemic hit, we rightly eased some of our control measures so that people could get the help they needed – see the next section. Some people exploited this and DWP losses increased in each of the next 2 years, rising from 2.4% in 2019-20 to 4.0% in 2021-22.
Controls are back in place, and our 2022-23 results show that overpayments due to fraud and error fell to 3.6% (£8.3 billion), a drop of 10% compared to the 4.0% level recorded for 2021-22.
When considering the long-term impact of overpayments on the taxpayer, we use an alternative measure that tracks overall overpaid welfare spending which includes components that are not defined as fraud or error. This is because overall overpaid welfare spending is the combination of the overpayments due to fraud and error in DWP benefits, Tax Credits error and fraud in the claimant’s favour and Tax Credits in-year overpayments. The latter are primarily a consequence of the late reporting or identification of changes of circumstances which are addressed prior to the end-of-year finalisation process for Tax Credits and are therefore not defined as being fraud or error within Tax Credits. But, as Tax Credits claims close, they are moving in to Universal Credit where this category does not exist and therefore would be defined as fraud or error should they continue to occur. Including them in this measure, therefore enables a long-term trend analysis in order to estimate the full system effect of the introduction of Universal Credit. [footnote 29]
Looking at it through this lens, prior to the pandemic, the level of overall welfare spending that was being overpaid had fallen to near to historic lows. However, this metric also rose, from 3.1% in 2019-20 to 4.3% in 2020-21, when the pandemic struck.
But we know we need to go even further. The fraud landscape is changing, and the tactics used by criminals evolve quickly. We therefore want to create new legal powers to investigate potential fraud, punish fraudsters and strengthen our in-house abilities to disrupt organised crime, including measures that would bring us into line with HM Revenue and Customs and reduce the burden on police and court time.
Tackling Fraud
Reintroducing controls
Easements introduced during Covid impacted the level of fraud and error reported in this year’s statistics, but the picture is improving.
In March 2020, the government took the decision to streamline controls to ensure that people could make a claim and still stay at home. This decision meant that the Department successfully paid, at the peak of Covid, an additional 2.4 million claims (there were approx. 3 million people on Universal Credit before Covid). These easements impacted a number of benefits, including Universal Credit.
The fraud and error levels reported in the 2022-23 statistics are based on sampling exercises performed between September 2021 to October 2022. This means that some of the cases sampled will still include new claims or changes made when controls were eased. All controls over benefit expenditure that DWP relaxed have now been fully reinstated or absorbed into business as usual, however there is a delay between the reintroduction of a control and any commensurate fall in our fraud and error statistics. Reinstatement of Gainfully Self-Employed (GSE) interviews and the Minimum Income Floor (MIF) is a good example of this.
The control framework below, shows some of the key easements we have removed over the last 2 – 3 years, but which have still impacted this year’s sample. The table also reflects the fact that some measures will unwind over time. For example, GSE interviews recommenced August 2021 on a rolling basis as we cleared cases, which took approximately 12 months, with MIF only coming into effect a year after an individual’s GSE interview.
Chart B: Easements and the impact on our 2022-23 sample
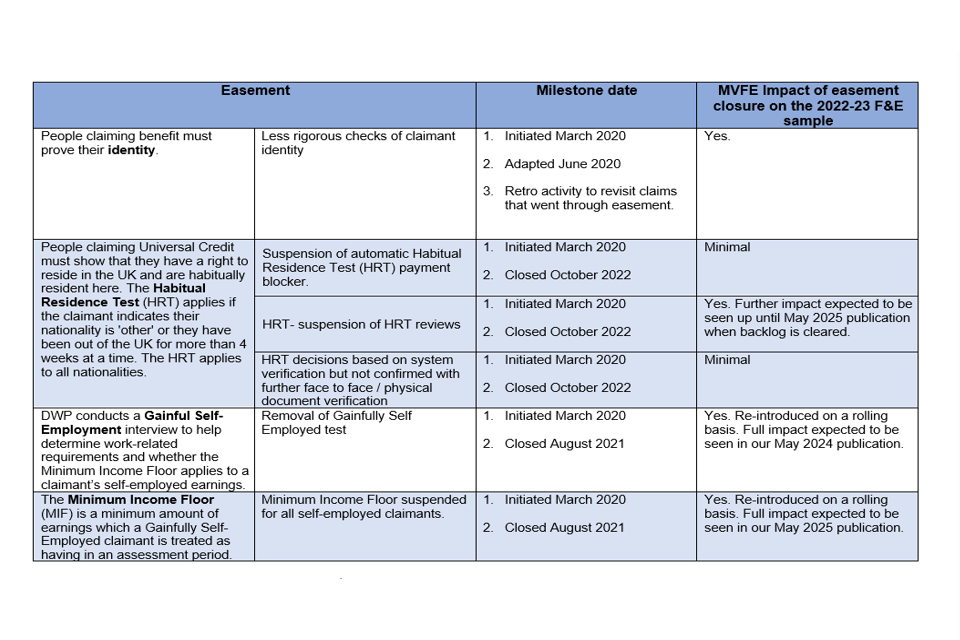
The Fraud and Error statistics that were published in May show that the reintroduction of these controls has contributed towards a drop in overpayments in the cases that claimed Universal Credit during the height of the pandemic and to those cases that started claiming more recently.
Counter Fraud and Compliance
Our Operational Fraud teams have the tools and abilities to make a real difference.
DWP’s Counter Fraud and Compliance operational teams look to prevent, disrupt and detect fraud. DWP deploys its Counter Fraud and Compliance resources to the highest risks identified. This approach has seen Counter Fraud and Compliance deliver over £1.0 billion savings for 2022-23.
Counter Fraud and Compliance tackles fraud in a number of ways. Referrals, including hotline allegations, are processed through a case preparation function, with any fraud judged to be in excess of £3,000 sent for investigation. From this point, if the value of the fraud is above £5,000 a prosecution is sought.
For fraud between £3,000 and £5,000, a penalty is set; if this is not paid a prosecution is considered. Fraud under £3,000 receives a civil or compliance intervention.
Information on some of the teams who handle referrals, can be found in the table below.
Table C: Counter Fraud and Compliance Teams
| Aim | Enhanced Review Team | (ERT) | Interventions | Compliance | Investigations | Economic Serious Organised Crime (ESOC) |
|---|---|---|---|---|---|---|
| Purpose | Tackle incorrectness through pre-payment verification and post-payment disruption activity. | Tackle incorrectness through scripted interviews; cases identified by data matching rules and pre-payment staff referrals. | Tackle incorrectness through robust and challenging interviews; cases identified by data matching, staff and public referrals. | Tackling fraud by delivering criminal sanctions against the most serious cases, bringing criminals to account and providing a deterrence impact. Tackling serious and organised crime and exploitation of individuals, creating jeopardy for organised crime gangs. | ||
| Outputs | ERT reviewed 164k claims and corrected payments on 57k. | 198k cleared, including Employment Support Allowance and Pension Credit Verifying Earnings & Pensions alerts. | 231k cases have been checked and 49k of them have had their payments corrected. | Fraud Investigation teams secured 768 Administrative Penalties and 482 Prosecutions. | ESOC has achieved 449 positive outcomes and they continue to feed work to ERT for their action. | |
| Savings 2022-23 | £0.65bn | £0.21bn | £0.17bn | £0.02bn | £0.01bn |
As of January 2023, Counter Fraud and Compliance has no Covid related backlogs (caused by re-allocating staff to administer claims during Covid) and all functions have now returned to normal. We are also now able to see people face to face, with secure interview rooms back in place. Prosecution numbers will therefore start to increase as cases come to Court.
The next sections provide more information on our Enhanced Review Team and how data is increasingly helping Counter Fraud and Compliance fight fraud.
Enhanced Review Team (ERT)
Part of Counter Fraud and Compliance, the Enhanced Review Team plays a vital role in tackling suspicious claims.
Immediate and serious risk, requiring a rapid response is addressed via our ERTs. This prevents fraud in addition to detecting fraudulent claims in payment. The sources of data for ERT cases are a combination of referrals from Universal Credit colleagues and our Integrated Risk and Intelligence Service – see next section.
ERT colleagues have had to develop their approaches to keep 1 step ahead of fraudsters – with organised criminal gang activity also a factor here.
Officers conduct robust conversations by telephone and face to face and can ask customers to upload documentation to verify their claim. They are also able to remove elements that are not verified and suspend or close the claim if no contact or verification documents have been received.
Case study
Weeding out photoshopped images has played a significant part in saving taxpayer’s money. A member of the team said:
‘During the last two years the team has received thousands of manipulated and constructed documents to try and pursue claims whilst being abroad.
Skilled fraud officers can quickly detect and prevent and repair any fraud area that’s emerging, and they have to be much more experienced looking at these fraud trends.’
In 1 example of fraud, analysts noticed that the same lime green door appeared in photos offered by a number of claimants seeking to prove that they lived in the UK.
Suspensions will remain in place until full identity has been verified, however ERT’s new standard process means we will close the claim after 30 days if not verified or where a claimant does not engage. Through this activity we suspended 425,510 cases between May 2020 and March 2023 and recorded £650 million of savings for 2022-23.
Customers will be clear why a claim has been suspended and what steps they need to take to progress the matter.
Enhanced data, analytics and investigative techniques
Data is at the heart of what we do. It helps us identify threats and allows us to target our counter fraud resource.
The Integrated Risk and Intelligence Service (IRIS) is at the heart of the Department’s response to fraud and error and continues to build on its expansion over the last two years. The focus has been on developing new, and expanding existing, capability and on partnership working across the Department and government.
IRIS has deployed its considerable expertise and understanding of fraud and error in the welfare system to develop a comprehensive insight into the root causes of fraud and error and has developed initiatives like Transaction Risking. This delivers new digital infrastructure capability (platforms, tooling and enhanced data intelligence) that will assess levels of fraud and error in every transaction across the welfare system at the point of application and throughout the lifecycle of a claim, to combat those causes.
IRIS was integral to the development, testing and deployment in May 2022 of a Fraud risk model, the first of its kind within DWP.
The Fraud Risk Model
1. The model is used to flag Universal Credit Advance applications that represent a potentially increased risk of incorrectness or fraud.
2. The model assigns a risk score. Cases scoring above an agreed threshold are referred to a caseworker for review.
3. A random sample of claims scoring below the threshold are also sent to a caseworker for review, which is intended to quantify the residual risk and consider bias in the process, ensuring a fair consideration of the potential fraud. The caseworker is not informed why the claim was selected for review; they undertake each review with the same rigour.
4. The caseworker will look at all the information and either pay the advance or ask the claimant for further information to enable them to make a decision as to whether the advance is paid or not. This does not delay payment of any award, only payment of the advance.
5. Prior to Covid all advance requests used to have the delay which we now only have for claims above the threshold, so for most claimants, advances will be paid more swiftly than previously. We also used to insist on a face to face intervention when deciding whether an advance should be paid or not, so it’s likely that even those claimants where a review is undertaken will get a response more quickly than in the past.
Through our use of advanced analytics and machine learning, deployed in Universal Credit Advances, we are developing other models based on fraud and error risks. We plan to implement these following the same principles and rigorous assurance. Central to this is that a caseworker always makes the final decision. We monitor the outcomes of the human decision making and feed this information into the learning of the model. Using this approach we monitor, review and enhance the model’s performance. We will also monitor and review the model’s fairness and provide further information about this in future reports.
Our data matching and analytical expertise has been utilised by Operational colleagues to pursue riskier fraud cases and detect and correct error in the different benefit systems. This is just 1 example of multi-disciplinary teams across the Department working together.
Safeguards
We use data ethically and adhere to strict guidelines.
The Department is committed to ensuring that the right assurances and governance are in place for its data and analytics functions in relation to fraud and error. We deploy comprehensive safeguards aligned with government best practice, standards, codes and working principles, alongside internal digital and legal review and approval processes. We ensure we meet our responsibilities under UK General Data Protection Regulation and the Data Protection Act. DWP does not use automation to replace human judgement when investigating fraud and error to either determine or deny a payment to a claimant. A final decision in these circumstances always involves a human agent.
Working across government
Tackling fraud and sharing data requires a joined up approach.
The Department is committed to working with the new Public Sector Fraud Authority (PSFA), launched in August 2022 and backed by investment of £48.8 million over 3 years. Working closely with PSFA and other Departments will enable government and enforcement agencies to step up their efforts to reduce fraud and error.
The NAO found that PSFA will need to draw heavily on DWP and HM Revenue and Customs, which contain most of government’s mature counter-fraud capability, in order to win the support of departments with less capability.
IRIS already has close links with other agencies including strong collaborative relationships with the Financial Sector, the associated Fraud and Financial Crime Trade Associations and Law Enforcement Agencies to understand and identify wider Financial and Organised Crime trends. This includes overall engagement with the financial industry, the development of new payment technologies and the receipt of intelligence/insight to reduce fraud and error losses within the welfare system.
IRIS continues to explore and utilise new data sources and has close links with other government departments, credit reference agencies and other private sector companies.
Continuous Improvement
Reporting changes
Notifying the Department of any changes in circumstance is key.
Most overpayments occur when a claimant fails to report a change in circumstance rather than the claim being incorrect at the outset. We understand that people’s circumstances will alter, but it is vital that everyone reports changes when they happen, as changes can affect eligibility or the amount due to be paid. We want to help people avoid unnecessary debt. We also want to ensure everyone receives their full entitlement, but we can only do this if people keep their claims up to date. (We say more about underpayments in Part 2 of this report).
Targeting loss areas
Many of our initiatives address incorrectness however it occurs. Our Universal Credit Continuous Improvement Plan is a case in point.
The key loss areas in Universal Credit are overpayments caused by undeclared earnings (particularly self-employed earnings), undeclared partner (‘living together’), undeclared capital and incorrect housing costs. We saw decreases in many (but not all) of our key loss areas in 2022-23.
Chart D: Percentage of Universal Credit expenditure overpaid by the key loss areas

Overpayments due to undeclared self-employed earnings (as a percentage of benefit expenditure) in Universal Credit was 2.5% (£1.1 billion) in 2022-23 down from 3.9% (£1.6 billion) in 2021-22. The percentage of cases known to have self-employed earnings overpayments was 5% in 2022-23, having dropped from 6.8% in 2021-22. ‘Housing Costs’ overpayments also fell in 2022-23 as did fraud and error due to incorrect identity (which is categorised under the ‘Conditions of Entitlement’ cause of loss).
Cross functional teams from across DWP work closely together to tackle all the key Universal Credit loss areas. Problems are quantified and prioritised, and potential solutions are fed into a plan of action. Some key initiatives are shown in the table below.
Chart E: Continuous improvement initiatives in Universal Credit
Capital
- customers are provided additional supportive information about what we mean by Capital when they are making their claim or updating their claim. This information helps customers provide correct information.
- DWP Agents can now see information about the Capital a customer has provided on the current claim as well as all of their previous claims, which helps identify potentially incorrect information.
Earnings
- we have updated the information customers see when they are asked to describe their employment status and, if self-employed, their expenses, to ensure that they are able to provide the correct information from the outset.
- DWP Agents have new appointments they use to meet with Self-Employed customers to check (and challenge) declared expenses and income.
Living Together
- we are looking to improve on-screen advice and definitions of Living Together (LT) for new customers, to help them provide their correct relationship status and prevent incorrect first payments.
- we want to enhance Universal Credit (UC) to enable more frequent contact with customers. The aim is to help customers understand what DWP means by LT, thereby preventing loss to DWP and personal debt for the customer.
- there is now additional DWP Agent contact with customers where there is a risk of LT, which allows them to self-report changes.
- we review past payments of UC and start corrective actions where LT was not reported correctly.
Housing
- we are looking to re-verify housing costs following a reported change (to housing costs) or when customers report they have separated from a partner.
Children
- we have delivered the ability to identify children who are listed on more than 1 active UC claim, allowing DWP agents to work with the customers to correct their claims.
Reclaims
- DWP Agents can see previous claims the customer has made when verifying evidence. This helps identify potentially incorrect information provided on the new claim.
Self Employed Earnings
Tackling self-employed loss is 1 of our biggest challenges, but we are making progress.
Overpayments due to Self-Employed Earnings were the largest cause of loss in 2021-22. The proportion of the Universal Credit caseload that are self-employed has dropped by around 20% since then, so we would expect the proportion of the Universal Credit caseload overpaid due to self-employed to naturally drop by around the same percentage. The fact that we have seen the self-employed overpayments drop by more than that indicates that our efforts to combat self-employed overpayments have had an effect.
As reported last year, DWP re-introduced the Gainfully Self-Employed (GSE)[footnote 30] interviews for all new self-employed claimants in August 2021, which should help drive behaviours in terms of reporting earnings correctly. We also believe that re-introducing the GSE removed some of the fraud and error that was a consequence of claimants having failed to inform us that their self-employed business had revived after the end of the pandemic.
The re-introduction of the Minimum Income Floor (MIF) – an assumed level of earnings used in the monthly Universal Credit payment calculation – accompanied the reinstatement of GSEs. Self-employed claimants are usually given 12 months before the MIF is applied, and so for some claims this will only have impacted toward the end of the period sampled for the 2022-23 Fraud and Error statistics. This year, we estimate that the suspension of the MIF increased overpayments by around 0.4% for Universal Credit. We therefore expect fraud and error to drop by a similar amount once the effects of reintroducing the MIF are fully in place.
Targeted Case Reviews (TCR)
TCR will help reduce both fraud and error, with agents cleansing our Universal Credit caseload.
The additional funding we received at recent fiscal events is allowing us to deliver TCRs, which forms a key pillar in our bid to fight fraud and error within Universal Credit going forward. The initiative will see specially trained agents review the entitlement and circumstances of Universal Credit cases that are at risk of being incorrect, with checks performed in accordance with the in-depth approach we deploy when calculating our national Fraud and Error statistics.
This is a long-term initiative. Over the next 6 years we expect to review millions of potentially high-risk Universal Credit claims. Through our total investment in TCR of £450 million over the 3 years of the Spending Review period we plan to deliver £750 million of savings and £6.4 billion if we continue this increased funding a further 3 years until 2027-28.
Our plans are progressing at pace. At the end of 2022-23 financial year, 887 agents were in post across seventeen sites in Great Britain, with further expansion planned into the next financial year. A new, bespoke, end-to-end process has been developed, including the ability for customers to securely upload requested information, such as bank statements straight from their smartphone or computer.
Claims that are identified as having potential incorrectness are referred by IRIS for additional review. Customers are supported to provide the right evidence, which verifies their circumstances and entitlement to claim Universal Credit. Our agents work closely with vulnerable customers to support them through the process.
We want to find incorrectness early on, preventing our customers from falling further into debt and identifying changes which result in an underpayment, all whilst reminding customers of their commitment to keep us updated on changes to their circumstances.
Where incorrectness is found, claims will be corrected retrospectively. Any resulting overpayments will be recovered through the Department’s Debt Management Team. Underpayments will be paid back in full where a prior change in circumstances hasn’t been reported, as legislation allows.
Those who are suspected of seeking to abuse the Welfare System will be passed to our Counter Fraud and Compliance teams to follow up for criminal investigation including, prosecution or penalty action.
This initiative will also provide vital intelligence on new and emerging ways to identify fraud and error entering the welfare system. These learnings will be used as part of our wider agenda to further drive out fraud and error in the future and inform and identify where improvements to our policies, service design and processes in the Universal Credit system are needed.
End of year outcomes are encouraging. As we build our evidence base further we expect to be able to say more in the coming year.
Chart F: Early TCR results
| Item | Results |
|---|---|
| Total TCRs completed 2022-23 | 25,000 |
| Overpayments | 7,600 |
| Underpayments | 240 |
| 2022-23 expenditure saved | £14 million |
Our results
Fraud and error levels
The work we have undertaken has led to a fall in the overall rate of fraud and error in 2022-23.
DWP’s estimates – published May 2023 – show that the overall level of overpayments in 2022-23 due to fraud and error was 3.6% (£8.3 billion) of benefit expenditure, compared with 4.0% (£8.7 billion) in 2021-22. Overall, 76% of DWP’s overpayments were the result of fraud.
Chart G: Percentage of DWP expenditure overpaid each year, broken down by benefit[footnote 31]
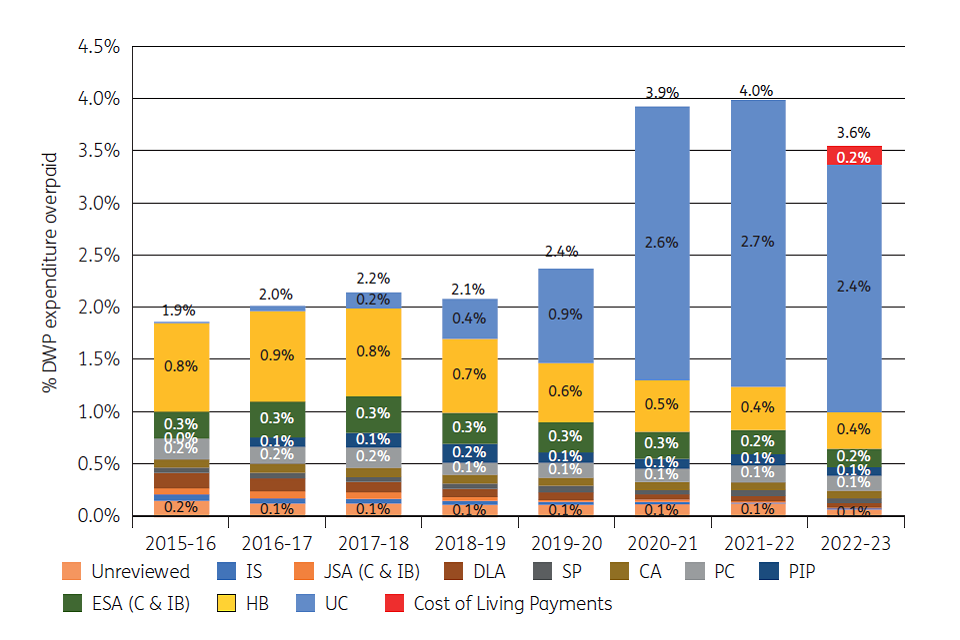
The Universal Credit overpayment rate was 12.8% (£5.5 billion), which was a decrease from 14.7% (£5.9 billion) last year. Universal Credit underpayments were up, at 1.6% (£680 million) in 2022-23 from 1.0% (£410 million) in 2021-22.
This is the second year that we have measured State Pension in full. State Pension cost £110 billion and accounted for 47% of total benefit expenditure in 2022-23. Overpayments remained at 0.1% of State Pension expenditure in both 2022-23 (£100 million) and 2021-22 (£130 million). Underpayments accounted for 0.6% (£670 million) of State Pension expenditure in 2022-23, as opposed to 0.5 % (£540 million) in 2021-22.
The main reason for the drop in the overall DWP level of overpayments is due to a decrease in Universal Credit overpayments, though falls in Personal Independence Payment, Employment and Support Allowance and Pension Credit also contributed.
The overpayment figure for 2022-23 is not directly comparable with the figure from 2021-22, as the latest year includes estimated Cost of Living Payment overpayments (4.9% or £410 million) which were calculated with reference to rates of entitlement loss, as measured in the associated passporting benefits. This was the first time the Department has made such a payment and eligibility was based on being entitled to specified benefits. The rate in 2022-23 would have been 3.5% had Cost of Living Payments been excluded.
The tables below provide a breakdown of both overpayments and underpayments across these measured benefits, along with an overall (all benefits) figure. They are also broken down by fraud, claimant error and official error.
Chart H: Overpayments and Underpayments by client group and error type
Overpayments
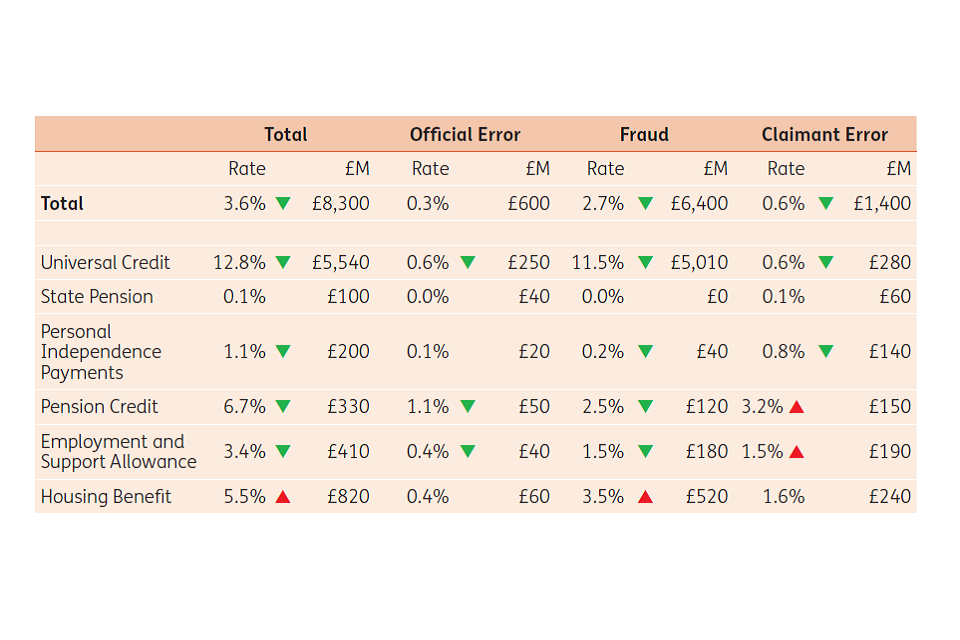
Underpayments

State Pension accounts for around half of DWP’s benefit expenditure and thus has a very large impact on the fraud and error figures. If State Pension is excluded from the fraud and error rate for the last two years, then overpayments have fallen from 7.7% to 6.6%, although the underpayment rate has risen from 1.9% to 2.1%.
COVID-19 cohorts in Universal Credit
The chart below shows the rate of overpaid expenditure in Universal Credit for those cases that came into the caseload prior to Covid-19, those that came on during the height of Covid-19 (defined as between 17 March 2020 and 2 June 2020) and those that have come on to Universal Credit since the height of Covid-19.
It shows that the drop in overpayments that occurred in 2022-23 was visible in both the cases that came on during the height of the pandemic and the cases that came on more recently. These are the groups that will have been affected by the reintroduction of the controls that were subject to easements during the pandemic.
Chart I: Overpayment rates in Universal Credit Covid cohorts, defined by when the claim started.
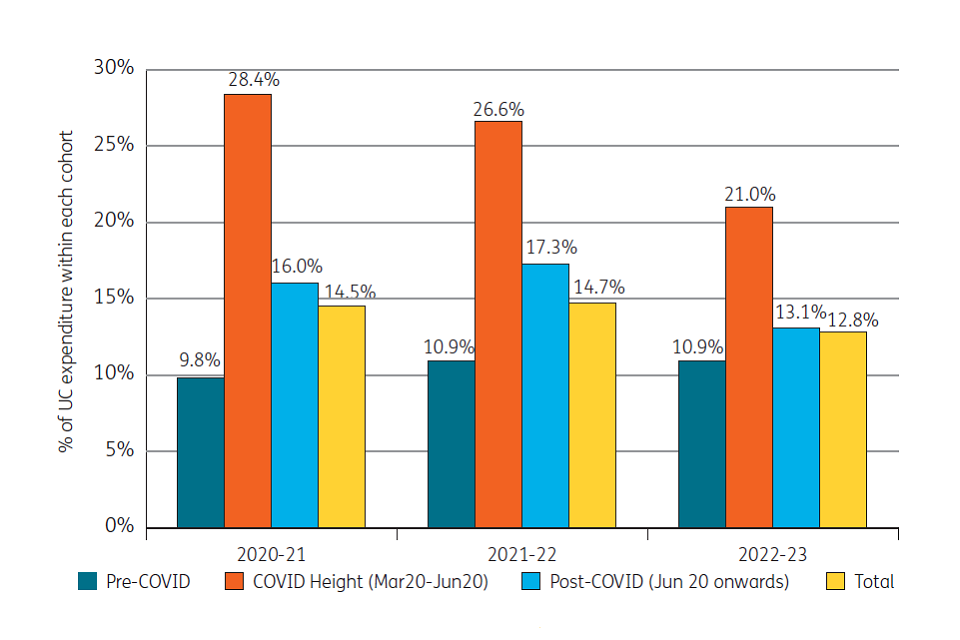
Further detail on fraud and error can be found in the Incorrect Payment Note or in our annual statistical publication ‘Fraud and error in the benefit system (2022-23)’[footnote 32].
Monetary Savings and Setting a Target
The next section will cover two areas:
1. The overall savings the department achieved through all of its controls and dedicated counter-fraud and error activities and how this relates to the level of overpayments that was paid out.
2. Our intention to set a target for the savings we aspire to achieve in 2023-24 from our dedicated counter-fraud and error activities.
Monetary savings from our counter-fraud and error activities and controls
Our work tackling loss, allied to the preventative measures we have taken, have generated wider savings which we can express in monetary terms.
The Department is committed to ensuring that only those entitled to welfare receive the right amount of money at the right time. Last year we explained that we were developing a methodology to estimate the savings that are attributable to all of our activities that help keep losses to fraud and error to a minimum. We predicted then that the savings would most likely exceed £10 billion per year.
This year we have developed that experimental methodology further. It produces an estimate for how much higher our current benefit spend would be against a counterfactual scenario where we paid out benefit on demand, without any of the attention that we currently give to verifying information provided by our claimants or to ensuring that entitlement remains correct by being adjusted to reflect subsequent changes in claimants’ circumstances.
The activities and controls that protect the benefit system from overpayments include up-front checks which prevent incorrectness from getting into the system at the claim start, such as verification of claimant-provided information and of basic conditions of entitlement such as identity, and functional assessments which confirm entitlement to disability benefits. They also include savings from the processing of changes of circumstances reported by our claimants, whether reported on-time or late, or identified through the automated use of real time earnings information from HM Revenue and Customs, and the savings from pro-active counter-fraud-and-error activities, including Targeted Case Reviews.
Our estimate is that the Department prevented nearly £18 billion of losses due to these activities and controls in 2022-23. This compares to £16 billion last year. The table below breaks down those savings by function.
The additional savings observed this year were mainly a consequence of the rising number of upfront checks of entitlement to disability benefits, in line with the steady increase in demand.
The savings from our Counter-Fraud and Compliance Directorate were lower than those seen in 2021-22 which had been inflated by the large-scale fraudulent attacks that we had thwarted during the pandemic. The higher levels of fraud and error present in the system during the previous two years, as reported in the published fraud and error statistics for 2020-21 and 2021-22, meant that our dedicated resources for detecting and preventing overpayments generated larger than normal levels of savings in those years compared to this year. In particular, 1 very large-scale attack involving hijacked identities that they thwarted in 2020-21 prevented an estimated £2 billion of losses in total, of which around £0.5 billion was saved from 2021-22 expenditure.
Chart J: Amount of potential expenditure loss from overpayments saved – broken down by function
| Item | Function | 2021-22 | 2022-23 |
|---|---|---|---|
| Dedicated counter-fraud and error resource |
Counter-Fraud & Compliance Directorate | £1.59bn | £1.06bn |
| Dedicated counter-fraud and error resource |
Investigations | £0.02bn | £0.02bn |
| Dedicated counter-fraud and error resource |
Compliance | £0.19bn | £0.17bn |
| Dedicated counter-fraud and error resource |
Interventions | £0.12bn | £0.22bn[footnote 34] |
| Dedicated counter-fraud and error resource |
Enhanced Review Team | 1.25bn | £0.65bn |
| Dedicated counter-fraud and error resource |
Economic Serious Organised Crime team | £0.01bn | £0.01bn |
| Dedicated counter-fraud and error resource |
Verify Earnings and Pensions (VEPs) | £0.07bn | £0.07bn |
| Dedicated counter-fraud and error resource |
Targeted Case Reviews | - | £0.01bn |
| Dedicated counter-fraud and error resource |
Total savings from dedicated counter-F&E resource | £1.7bn[footnote 33] | £1.1bn |
| Other downward adjustments to current or past entitlement |
Where a past period of overpayment was identified | £2.4bn | £1.8bn |
| Other downward adjustments to current or past entitlement |
In advance of an overpayment occurring[footnote 35] | £6.1bn | £6.1bn |
| Other downward adjustments to current or past entitlement |
Total savings from other downward adjustments | £8.4bn | £7.9bn |
| Upfront checks | Upfront checks on claimant entitlement[footnote 36] | £6.3bn | £8.6bn |
| Total expenditure saved[footnote 37] | £16.4bn | £17.7bn |
Notes:
1. Measuring the savings associated with all these processes requires a variety of estimation methodologies and analysis of different data, meaning some elements of the overall estimate are more robust than others. The estimated savings from our dedicated fraud and error resource (Counter-Fraud Compliance and Debt Directorate; Targeted Case Reviews; Verify Earnings & Pensions programme) are based on established methodologies which we consider more robust than those used to evaluate savings from our front-line controls.
2. The nature of the assumptions that we have used means that all the figures are more likely to be an underestimate than an overestimate.
3. We are not currently able to measure savings achieved from the verification of claimant-provided information such as amount of capital and household composition. We will look to introduce these in future reports, if possible.
4. We have also not attempted to estimate the additional savings that arise from deterring claimants from committing fraud and making mistakes in the first place, as a consequence of the things that we have done and the messages we have promoted.
How this relates to the level of Overpayments paid out
The published level of overpayments paid out this year was 3.6% of benefit expenditure (£8.3billion). We estimate that we prevented a further 7.3% of expenditure from being overpaid, as a result of our activities and controls – without our efforts, overpayments would have been at least 10.8% (£25.4bn). The charts below show how that compares to last year.
Chart K: Percentage of expenditure overpaid and prevented from being overpaid
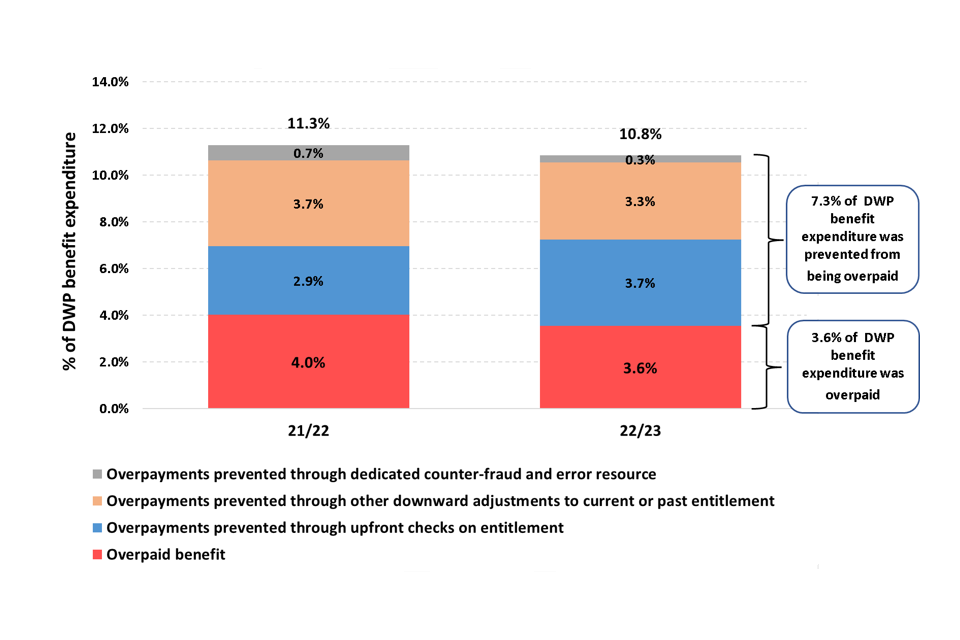
Chart L: Amount of expenditure overpaid and prevented from being overpaid[footnote 38]
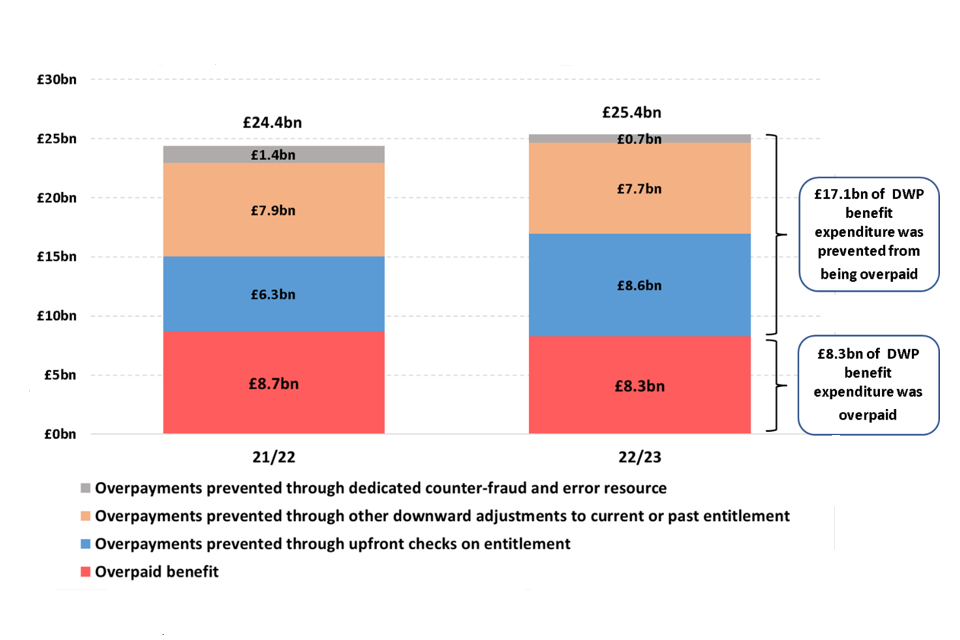
Setting a Fraud and Error target
DWP has committed to publishing a target showing how we are tackling fraud and error across the welfare system.
Our ambition has been to set a long-term target for the level of overpayments which would describe our continued determination to reduce fraud and error. Last year we concluded that we were unable to set such a target due to the significant uncertainty in our overpayment forecasts, following the instability in fraud and error levels caused by the Covid pandemic.
The rate of fraud and error published in our national statistics in May 2023 is still showing a large amount of volatility[footnote 39], leading to a wide degree of uncertainty in our long-term baseline projection. Our uncertainty is further exacerbated by indications that the underlying propensity towards fraud in society in general appears to be increasing.
This uncertainty in our forecasts means we are again not in a position to set a meaningful long-term target this year. We continue to look to understand better the underlying drivers of the volatility in the statistics and our forecasts. We will re-visit this next year, with a view to setting a meaningful long-term target from financial year 2024-25.
Nevertheless, we are mindful of the desire of the Public Accounts Committee to see a public fraud and error target. Although we remain confident that the rate of overpayments paid out remains the best measure of our performance with regards fraud and error in the benefit system, the volatility in the statistics means we cannot currently use that as the basis for setting a target and so, in the short term, we will be switching to a different metric.
As set out in the previous section, we are challenging ourselves to measure the overall amount of savings the Department has achieved through all our activities that reduce loss from overpayments. Much of the methodology is experimental, so is not a strong basis for setting a target, but the contribution to the estimate that comes from our dedicated fraud and error activities uses an established methodology which has previously been the basis of policy costing notes agreed by the Office of Budget Responsibility.
We therefore propose to set a target to achieve savings in 2023-24 of at least £1.3 billion from our dedicated counter-fraud and error resource, which includes our Counter-Fraud and Compliance Directorate, the newly developed Targeted Case Reviews and the Verify Earnings and Pensions programme. The target represents a significant increase on the savings achieved by these activities in 2022-23 (£1.1 billion) and reflect the Department’s determination to continue to drive down fraud and error.
Challenging ourselves to do even better
Our legislative bid
New legislation will modernise our fraud powers and help us do even more.
As we set out last year, we want to go even further when it comes to tackling fraud. Our Fraud Plan, ‘Fighting Fraud in the Welfare State’, explained why we wanted to consider new powers through legislation, when Parliamentary time allows.
Fraud represents over 40% of crime in England and Wales, with 1 in 15 adults the victim of fraud. In the public sector, fraud costs at least £33 billion. Moreover, the nature of fraud has changed. Updating DWP’s powers to fight fraud will help modernise and future proof the legislative framework under which we operate. It will also provide parity with other government departments, such as HM Revenue and Customs and the Gangmasters Labour and Abuse Authority.
Chart M: Potential new powers
As announced in our Fraud Plan, we have been developing a cross-government Bill. DWP’s existing legislative framework is largely over 20 years old, based in the Social Security/Administration (1992) and Fraud (2001) Acts. The DWP elements of the Bill consist of:
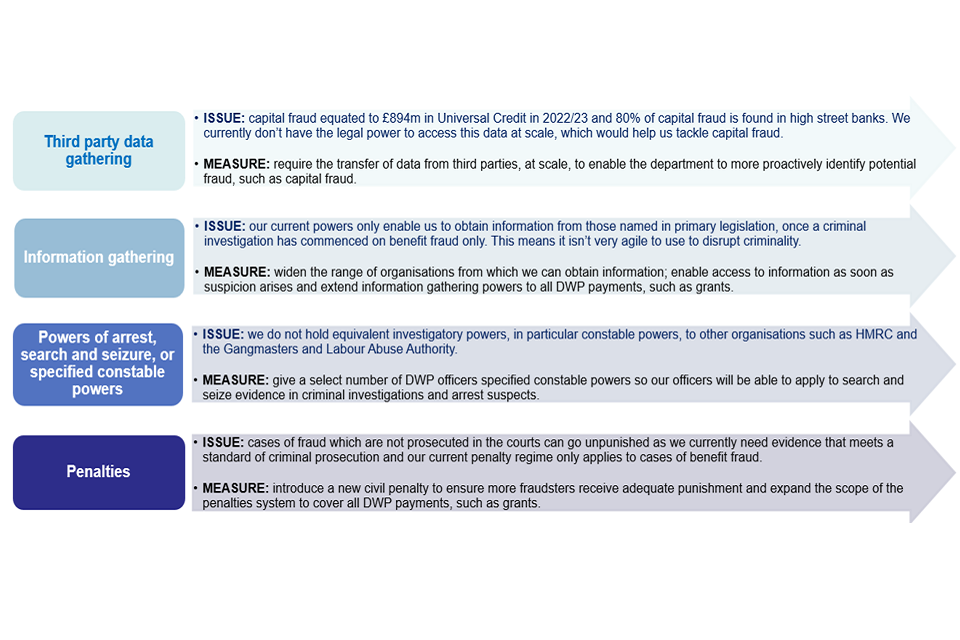
We have worked across Government with various agencies, looking particularly at how Departments such as HM Revenue and Customs and the Home Office use some of the powers we are seeking, which has helped shape our thinking as we look to take this work forward.
Part 2: Underpayments
Overview
The Department understands the importance of paying people their correct entitlement and the need to reimburse people where this doesn’t happen.
The overall rate of underpayments increased in 2022-23, accounting for 1.4% (£3.3 billion) of benefit expenditure as opposed to 1.2% (£2.6 billion) in 2021-22. For Universal Credit, the rise in Housing Costs underpayments was primarily due to an increase in the number of cases that are eligible for the housing element but were not receiving it. This is potentially due to the requirement to now provide verification before housing costs can be paid, whereas during the pandemic this was waived.
However, we are aware that some Universal Credit claimants fail to declare underlying benefits, which would entitle them to additional premia. We are taking steps to correct this where we find evidence of it happening. For example, we are about to release a feature which will identify Universal Credit claimants who receive Carers Allowance but do not currently receive the Carers’ element of Universal Credit.
We plan to continue to make improvements to our Universal Credit service, associated policies and processes, using insight gained from a better understanding of causes of underpayment via our TCR initiative. This will help ensure we pay people their full entitlement, firstly as we review their claim, and secondly as we learn more widely where we can introduce improvements.
For PIP, underpayments have increased to 5.1% (£900 million) from 3.8% (£470 million) in 2019-20 due to a large increase in Claimant Error. Note that this comparison is between pre and post-pandemic figures, and while some Award Reviews were delayed, reported changes of circumstances continued to be processed. Gradual changes in functional needs can be difficult for claimants to identify, making it difficult for them to request a change of circumstance review.
We treat underpayments seriously and always look to ensure individuals receive the correct level of payment. Claimants have a duty to report their circumstances correctly, and DWP emphasises on GOV.UK and in key correspondence with people in receipt of PIP the requirement on claimants to tell us about any change in circumstance. Regular reviews are a key feature of the benefit and ensures that payments accurately match the current needs of claimants and are paid at the correct rate. Claimants awaiting a review can notify DWP of a change of circumstances at any time and we will prioritise their assessment to ensure the correct payment.
As a Department, we always look to address any underpayments at the earliest opportunity. This section (Part 2) of the report describes how we are doing this for a number of Legal Entitlements Administrative Practice (LEAP) exercises.
We also cover in more detail the work we are doing to correct State Pension awards where underpayments have occurred.
Legal Entitlements Administrative Practice (LEAP)
Background
A LEAP exercise is relevant when there is a systemic error on the part of a government Department, and the error could have deprived individuals of legal rights.
From time to time the Department becomes aware of situations where we have not paid our customers the right amount of money or where we have not followed our statutory processes. This situation may occur when:
- the Upper Tribunal or a court makes a ruling which widens access to benefits for groups of our customers
- there is an error in the implementation of guidance or procedures which has resulted in groups of customers being underpaid
The Department is required to correct these issues, as soon as is reasonably possible, and the cross Government process for doing so is called LEAP.
Why is this important to DWP?
Our customers are not being paid what they are entitled to. It is vital that we minimise the number of LEAP exercises that occur.
When we need to undertake a LEAP exercise, we manage it by:
- changing our approach going forward so that we are compliant
- agreeing procedures and instructions for carrying out the LEAP exercise
- conducting an exercise to ensure those who have been underpaid get the money they are due
- contacting customers who may be owed any arrears
Progress continues to be made against each of the LEAPs outlined below and we have ongoing activity aimed at finding and correcting cases where there may be errors that result in the Department underpaying customers. Up to 31 March 2023, we have paid arrears of £762.24 million with administrative costs of £78.1 million since the commencement of the exercises listed below.
Corrective action to address the underpayment of State Pension has progressed during 2022-23 and costs are outlined in the table below.
Chart N: Live LEAP Exercises
| Name of LEAP Exercise | Nature of the Error | No. of Customer Records to be Reviewed | Total Arrears of Benefit Paid to 31/3/23 |
|---|---|---|---|
| PIP: Daily Living Activity 3 (LB) | Whether medication and monitoring could constitute ‘therapy’ and whether claimants who need additional help with a prescribed diet are eligible for the higher scoring ‘therapy’ descriptors | 203,722 | £0.16m |
| PIP Daily Living Activity 9 (MM) | Concerns the definition of ‘social support’ in activity 9 of the PIP regulations, and how far in advance that social support can be provided. | 633,076 | £32.06m |
| State Pension Underpayments | Some married women, widows and people who have reached age 80 are being underpaid State Pension because their current payment does not include additional entitlement | 678,000 | £324.00m |
| Disallowed export of non-contributory cash sickness benefits | Whether customers whose benefits were stopped solely because they were moving / had moved their residence to the EEA/Switzerland. | 700 | £0.60m |
| JSA: Remedial Order | A remedial order is proposed to resolve the Court of Appeal’s declaration that the Jobseekers (Back to Work Schemes) Act 2013 (2013 Act) was incompatible with the right to a fair hearing (Article 6) of the European Convention on Human Rights (Reilly No. 2). | 5845 | £0.76m |
| Legacy ESA SDP Premia | Errors identified through national statistics in both under and overpayment of Severe Disability Premia payments for ESA claimants. | 230,592 | £350.00m |
Note
The names of LEAP exercises arise from the benefit in question or where the issue has arisen through a judicial review the initials of the individual that brought about the judicial review are also included.
Chart O: Completed LEAP Exercises
| Name of LEAP Exercise | Issue | Customer Records Reviewed | Total Arrears of Benefit Paid |
|---|---|---|---|
| PIP: Safety/Supervision (RJ) Whether the severity of potential harm in deciding whether harm is “likely” when claimants are carrying out activities. | 1,100,000 | £21.33m | |
| PIP: Mobility Activity 1 (MH) | Whether the effect of overwhelming psychological distress when planning or following the route of a journey. | 990,000 | £22.43m |
| PIP: Safety/Supervision (KT & SH) | Whether deaf claimants who cannot shower safely without supervision because they had to remove their hearing aids whilst in the shower and therefore could not hear a standard fire alarm. | 4139 | £10.87m |
State Pension
Background
State Pension makes up 47% of benefit expenditure. The vast majority of payments are correct, but some people have received less than they should.
The State Pension underpayments we most often identify fall into the following broad categories:
- cases covered by the State Pension Underpayments (LEAP) exercise
- home Responsibilities Protection (HRP) cases where HRP has not been recorded accurately on National Insurance records
- cases where National Insurance credits need to be updated for Universal Credit customers
We explain here how we are addressing historic State Pension underpayments, before going on to talk more about HRP and National Insurance credits. More generally, the Department is considering how it can introduce a mechanism for utilising data available to it to identify potential errors within the State Pension system, assess the associated risk and take appropriate corrective action. The result of this work should be available by Summer 2023.
State Pension Underpayments LEAP exercise
The State Pension LEAP is our largest underpayment correction exercise in progress.
The State Pension LEAP exercise has been established to identify where State Pension underpayments may have occurred in respect of the following customer groups:
- Category BL (Cat BL) – People who are married or in a civil partnership who reached State Pension age before 6 April 2016 and should be entitled to a Category BL uplift based on their partner’s National Insurance contributions.
- Missed conversions – People who have been widowed and their State Pension was not increased to include any amounts they are entitled to inherit from their late husband, wife or civil partner.
- Category D (Cat D) – People who reach age 80 and who are getting some basic State Pension but less than the £85.00 (in 2022-23) and may therefore, subject to satisfying the appropriate residency conditions, be entitled to Cat D State Pension of £85.00 a week.
The department’s 2020-21 and 2021-22 Annual Report and Accounts contain details on the scope of the exercise, progress to date and plans to address outstanding work. The Department published management information on the exercise in October 2021, March 2022, November 2022 and March 2023, all around the time of fiscal events.
Progress
We have made significant progress in correcting these cases and in paying arrears.
Between 11 January 2021 and the end of March 2023 the checking process has identified 50,569 underpayments, owed a total of £324 million. The table below shows our progress by category.
Chart P: State Pension LEAP – progress to date
| Category | Cases reviewed (note 1 and 2) | Underpayments identified (note 3) | Average arrears payment (note 4) | Total amount repaid |
|---|---|---|---|---|
| Married (Cat BL) | 89,291 | 24,533 | £6,552 | £161 million |
| Widowed | 124,756 | 10,612 | £11,658 | £122 million |
| Over 80 (Cat D) | 49,303 | 15,424 | £2,644 | £41 million |
Notes to table
1. Cases may be checked for more than 1 potential cause of error; therefore, an individual State Pension claim may be counted in more than 1 category.
2. Cases reviewed includes cases which have been deemed out of scope of the LEAP exercise through an automated process.
3. These are cases for which a current or historical underpayment of State Pension has been identified. This may include cases for which a corresponding overpayment of another benefit (for example, Pension Credit) has occurred as a result, meaning that there was no net underpayment to the individual as well as some cases where the customer is deceased and the Department has so far been unable to identify an estate to which to pay the arrears due.
4. This average includes cases where the arrears amount owed is £0 due to offset of overpaid benefit.
The Department’s current estimate of the arrears due is £835 million. The final total value of the underpayments will only be confirmed by the completion of the exercise.
Progress and timescale for completing the review of all the remaining cases
The pace at which we are correcting these cases is increasing.
The planned end date for State Pension LEAP exercise remains the end of 2024. As stated in last year’s Annual Report and Accounts, we are on track to complete the exercise for the customer groups Cat BL and Cat D by the end of 2023.
The chart below shows the department’s progress, quarter by quarter, in terms of case clearances. This reflects the increasing level of resource deployed on the exercise throughout 2022 from 160 Full Time Equivalent staff in Autumn 2021 to 1,300 by the end of March 2023, as well as our use of automation for less complex cases where no arrears are due.
We expect to see a continued increase in clearance rates in 2023-24, as additional resources join the exercise and complete their training and additional rounds of automation are completed in Summer 2023.
Chart Q: State Pension LEAP – case clearance by quarter
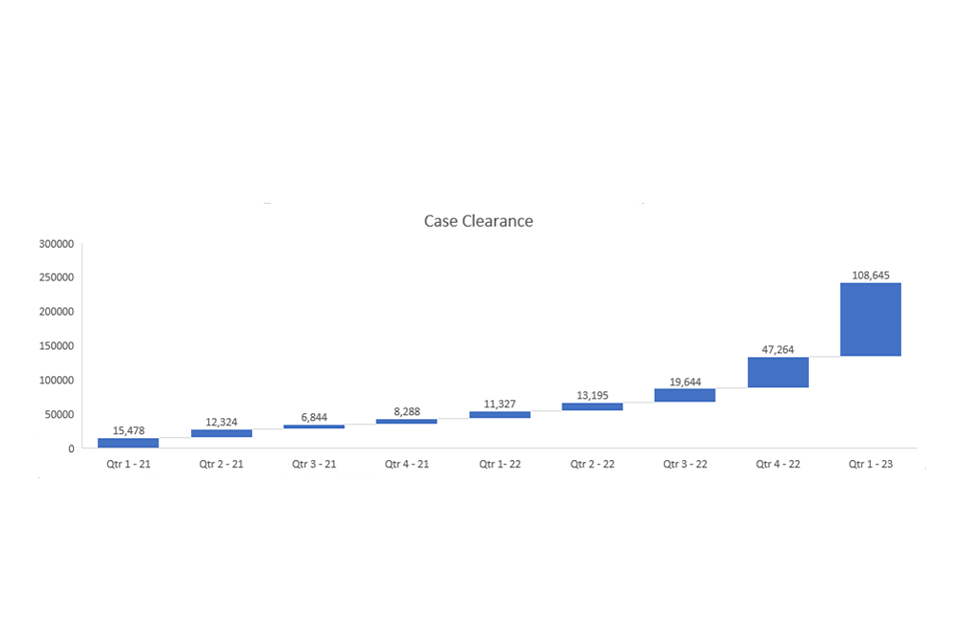
Business improvements
We are improving our processes to minimise the risk of future State Pension underpayments.
The Department has continued to make improvements to our business processes to ensure we are making payments to customers as quickly as possible and reducing potential error in the State Pension caseload. A summary of these improvements is outlined in the table below.
Chart R: State Pension process improvements
| Initiative | Details |
|---|---|
| State Pension online | As part of Business as Usual processes, customers can claim their State Pension online via the Get Your State Pension (GySP) service. This online processing within the GySP service reduces the likelihood of error in the State Pension award. |
| Digital Automation | This allows the State Pension LEAP exercise to focus resource on more complex cases, by using digital automation techniques to identify and review cases where an underpayment cannot occur. |
| General Matching Service (GMS) | GMS matches occur when discrepancies are found across benefit systems; the matches alert that benefits have commenced, ceased, increased or decreased. Action is taken to correct the State Pension award where there is an overpayment or underpayment because of the discrepancy. |
| Learning and Development | A Knowledge Developer is used in the State Pension LEAP Exercise to check processors’ understanding of instructions. The outcomes inform capability improvement activity. Across the State Pension service, training material has been reviewed and further training delivered (to meet gaps) within teams. |
| Standard Working Instructions | Bereavement and State Pension teams have reviewed their Standard Work Instructions to ensure consistency and compliance with guidance. |
| Quality Assurance | The State Pensions LEAP Quality Strategy is embedded. Tier 1 quality assurance activity in Bereavement is focused on Conversion Cases. In State Pension Teams the quality assurance activity is ‘end to end’ to ensure all elements are correct. Random sampling is also undertaken in State Pension New Claims to ensure the award is correct from the outset. |
| Deceased Case Processing | To support the identification of a customer’s next of kin, data sharing arrangements with the General Register’s Office and National Records for Scotland have been implemented. |
| Next of Kin (NoK) online | A NoK portal is available on GOV.UK. It enables relatives or executors of an estate to request information about underpaid State Pension for someone who has died. The service also provides guidance for the NoK or executor for someone who has died who may have been underpaid State Pension. |
| Spouse Information Tracing | A process to contact customers to trace spouse details for International and Great Britain State Pension awards has been implemented. This is the final stage, as the Department has already attempted to identify the missing information through an extensive search of its systems. |
State Pension – Home Responsibilities Protection (HRP)
Our 2021-22 statistics identified a category of State Pension underpayments where some people should have had additional qualifying years of National Insurance which would count towards their State Pension.
Home Responsibilities Protection (HRP) was available between 1978 and 2010 for people in receipt of Child Benefit and those caring for sick and disabled people. For people reaching State Pension age before 6 April 2010, HRP reduced the number of Qualifying Years needed for a basic State Pension.
Since 2010, HRP has been replaced by National Insurance Credits for Parents and Carers. For people reaching State Pension age after 6th April 2010, all previous years of HRP have been converted into years of National Insurance credits.
The Department identified some administrative discrepancies in the recording of some women’s HRP on their National Insurance records, which resulted in State Pension errors. A previous correction exercise between 2009 and 2011 had rectified some errors in this area, however further errors were identified in 2021-22. Most people received HRP automatically where there was a claim for Child Benefit, however, in some cases this has not happened. State Pension eligibility is calculated based on National Insurance records, so this issue has led to underpayments of State Pension.
As HM Revenue and Customs currently administers National Insurance records, DWP has been working closely with HM Revenue and Customs to investigate this. The work includes investigating the root cause, identifying individuals affected and planning the approach to correcting records. The root cause has been identified as National Insurance numbers not being recorded when customers applied for Child Benefit before 2000. For data protection reasons, Child Benefit records from this period are no longer held, meaning it is not possible to identify those affected easily. Additionally, as time has passed, names, addresses and family makeups have changed. These factors have brought complexity and are key to determining the approach to correction.
In the last year, work has been underway to determine the approach, volumes and resources required for HM Revenue and Customs to first correct the National Insurance records and then for DWP to correct State Pension entitlement. As it is not possible to identify individuals affected or to correct their records automatically, people who may be affected will be invited to make an application to HM Revenue and Customs for any missing HRP years. Alongside this, government will run a communications campaign to reach people who we may be unable to identify.
Because customers need to apply for missing periods of HRP to be investigated, there is significant uncertainty in the forecasting of the corrections exercise. This includes how long it will take, as customers may choose not to apply, for example, because they are satisfied with their current position or did not have child benefit for a period. As the exercise progresses and more information is gathered, the Department will be able to test our assumptions and refine them accordingly. The final value of underpayments will only be confirmed once the exercise has been completed.
The Department estimates that it underpaid between £300 million and £1.5 billion of State Pension because of errors with the recording of HRP.
Correction
Work on correcting missing HRP claims is due to start Autumn 2023.
We expect HM Revenue and Customs to commence correction activity from Autumn 2023. Once HRP is awarded by HM Revenue and Customs, DWP will be notified and will recalculate State Pension entitlement. The amount of time it will take to correct records is uncertain. We will take a proactive approach to correct records and pay any arrears as quickly as possible, taking into account the vulnerability of the customers impacted.
Alongside investigation work, we have been working to redesign products in order to aid correction activity. HM Revenue and Customs, supported by DWP, has taken additional steps to improve the existing customer journey including making the application process (via the CF411 form) clearer and introducing revised GOV.UK guidance to aid with self-identification.
State Pension National Insurance Credits
Some people who received Universal Credit may not have had their National Insurance Credits correctly attributed to their National Insurance record held by HM Revenue and Customs which could affect their State Pension.
National Insurance records are maintained by HM Revenue and Customs based on information from employers through PAYE, self-assessment tax returns from the self-employed and information provided by DWP on benefit receipt where that creates a National Insurance credit. Between 2017-18 and 2022-23 information about Universal Credit entitlements could not be processed by the National Insurance Recording System.
National Insurance credits can affect the value of a State Pension award, so there was a risk that some people who had claimed Universal Credit and subsequently reached State Pension age (SPa) may have been underpaid. During this period the Department put in place a manual system with HM Revenue and Customs to update an individual’s National Insurance record where they felt they qualified for National Insurance credits in respect of time on Universal Credit.
With the issues now resolved between the DWP and HM Revenue and Customs systems, claims data relating to the affected years can now be successfully processed by HM Revenue and Customs. When these records are updated information will be sent to the Department who will then correct any State Pension awards that are affected as part of our business as usual processes.
Part 3: Debt recovery
Overview
When overpayments occur, we need to recover them. This section looks at how the Department’s Debt Management unit recovers money owed to DWP and government.
DWP’s Debt Management has a good track record in recovering debt when it is identified, including benefit overpayments, Tax Credit debt and Social Fund loans. Debt Management also continues to recover money from insurance companies (where people have received compensation for an accident, injury or disease having already claimed benefits) and on behalf of the NHS (where ambulance or hospital costs have been incurred in connection with an accident).
Recovery totals
DWP recovers significant sums of money for the taxpayer responsibly and sustainably.
Debt Management’s total recovery 2022-23 amounted to £2.68 billion (excluding Housing Benefit recovered by Local Authorities but including £44 million Housing Benefit debt recovered by DWP).
This figure is up from £2.28 billion in 2020-21 but down from £2.74 billion in 2021-22, which reflects our reduced forecast for 2022-23 and the challenges arising from the increased cost of living and the economic climate.
Our overall approach to recovery demonstrates a real commitment to balance the need to protect public funds by maintaining recovery levels, whilst providing a compassionate service during times of economic uncertainty.
Our 2022-23 recovery
The table below sets out total recoveries for 2022-23 and shows the breakdown between benefit overpayments and other debt types.
Chart S: Debt Management Recovery 2022-23
| Debt Type | Definition | Value (£m) 2019-20 | Value (£m) 2020-21 | Value (£m) 2021-22 | Value (£m) 2022-23 |
|---|---|---|---|---|---|
| Advances | Recovery of Universal Credit Advances - including Budgeting Advances, New Claim Advances and Benefit Transfer Advances | 668 | 1,092 | 882 | 851 |
| Overpayments | DWP benefit overpayments including Universal Credit and non-Universal Credit | 444 | 308 | 610 | 692 |
| Tax Credit | Recovery of Tax Credit debt that has migrated from HM Revenue and Customs | 225 | 229 | 520 | 428 |
| Social Fund | Recovery of Crisis and Budgeting Loans, including Funeral Payments | 477 | 290 | 367 | 342 |
| Compensation Recovery | Recoveries from insurance companies for compensation claims made by benefit recipients | 323 | 326 | 295 | 303 |
| Housing Benefit | Housing Benefit Overpayments | 35 | 28 | 48 | 44 |
| Recoverable Hardship Payments Repayment of loans associated with sanction activity | 9 | 10 | 6 | 18 | |
| Other | Includes administrative and civil penalties. Also includes sums held in suspense awaiting allocation at the time the data was collected | 8 | 4 | 7 | 6 |
| Total | 2,191 | 2,288 | 2,736 | 2,683 |
Note:
Numbers are rounded and do not necessarily add up exactly to the overall total.
Supporting customers with outstanding debts
DWP recognises the importance of safeguarding the welfare of those who have incurred debt and remains committed to supporting customers who may be in hardship and struggling with repayments.
DWP strives to set repayment plans that are affordable and sustainable, taking a compassionate approach and encouraging customers to contact us if they are unable to afford the proposed repayment rate, whilst enforcing the obligation to repay where it is appropriate to do so.
Regulations protect customers from excessive deductions, which could lead to financial difficulty. Since its introduction the cap on the maximum amount deducted (from Universal Credit) has changed, from 40% of the standard allowance originally, to 25% in April 2021. This better strikes a balance in ensuring priority debts and other debts are repaid, whilst enabling customers with significant debts to retain more of their monthly award for their day-to-day needs, such as paying off their utility bills or housing costs.
When a customer makes contact because they are experiencing financial hardship, the rate of repayment can be reduced, or a temporary suspension of repayment can be agreed depending on the customer’s financial circumstances. Our agents will always look to negotiate affordable and sustainable repayment plans; this includes working with individuals to review their financial circumstances. There is no minimum amount a customer is required to pay, although in fraud cases repayments can only be reduced in exceptional circumstances, or where there are children in the household. In exceptional circumstances, and in line with legislation and policy, consideration can be given to waiving a debt – with each case considered on its individual merits.
Since June 2022 we have extended the review period for customers with a negotiated affordable repayment rate from 6 months to two years, however customers may contact us at any time to re-negotiate affordable repayment terms. This year we have supported 11% of our 3.6 million customers by working with them to agree lower and affordable repayment terms.
Supporting the most vulnerable
We have safeguards in place to help protect vulnerable customers.
DWP has a network of Advanced Customer Support Senior Leaders who work with our Debt Management Advanced Customer Support team to provide additional support to our most vulnerable customers, together with a process by which agents can refer customers directly through the Severe Financial Hardship routeway.
In addition, Debt Management works in partnership with the Money Advisor Network, who offer free professional independent and impartial money and debt advice. Indebted customers are routinely offered a referral to this service and 78.3% of those who meet the criteria take up the offer.
We also remain committed to His Majesty’s Treasury’s Breathing Space policy. The numbers of customers engaging with this support in 2022-23 remain consistent with the numbers reported in 2021-22.
Means of recovery
Recovery from benefit is the most efficient means of recovery.
Last year, 75% of total recoveries were made through deductions from benefit, down from 78% in 2021-22. The overall amount we can recover by deduction from benefit is set by regulations, and priority is given to a number of other deductions above those for overpayment recovery. More customers are seeking a reduction in their repayment terms, especially those paying by deductions from benefit. Whilst deductions from benefit remains our main source of recovery, off-benefit recovery increased by 11%.
Out of a total of 4.9 million accounts held by Debt Management, the number of customers currently in active recovery is 3.691 million (75.36%) compared to 3.472 million (70.34%) last year.
Chart T: Recovery breakdown
| Recoveries by Method | Value (£m) 2021-22 | Value (£m) 2022-23 |
|---|---|---|
| Deductions From Universal Credit | 1,492 | 1,385 |
| Deductions from Other Benefits | 173 | 185 |
| Direct Earnings Attachments (deduction from earnings) | 116 | 137 |
| Private Sector Suppliers | 3 | 15 |
| Voluntary Repayments | 357 | 378 |
| Social Fund repayments (primarily deductions from legacy benefits) | 301 | 279 |
| Recovery from awards of Compensation | 295 | 303 |
| Total | 2,736 | 2,683 |
Note
Numbers are rounded and do not necessarily add up exactly to the overall total.
Debt stock
DWP’s debt stock will increase as a result of our continued focus on high-risk Fraud and Error, Targeted Case Review initiative and an increase in Tax Credit debt transferred across as people claim Universal Credit.
During 2022-23 our total debt stock has increased by £0.8 billion. (Note that this is actual money recorded as outstanding for collection, as opposed to the estimated figures itemised in our fraud and error publication). The amounts recorded by Debt Management differs significantly from the estimated overpayment figures we publish. This is because recovery can only be attempted where a specific overpayment is detected and referred to DWP Debt Management, and DWP does not detect all overpayments. We have added £1.8 billion of detected overpayments to the debt stock in 2022-23.
We have increased investment in work to allow us to uncover more fraud and error. Over the next 6 years, we will be reviewing millions of Universal Credirt claims though Targeted Case Reviews which will help us close the gap between our estimates and what is currently referred to Debt Management for recovery.
The debt stock currently includes £2.5 billion of Tax Credit debt as at the end of 2022-23, a decrease from £2.7 billion at the end of 2021-22.
Under an agreement with HM Revenue and Customs, any outstanding debt held by an individual is transferred to DWP should that person claim Universal Credit. From April 2016 to March 2023, £3.6 billion of Universal Credit-related Tax Credit Debt has been transferred to DWP for recovery. In 2022-23 we recovered £428 million of Tax Credit debt, down from £520 million in 2021-22.
This was largely due to a return to normal levels of referrals from HM Revenue and Customs following the inflated number received during 2021-22 as a result of the pandemic. Also, the formal agreement announced by the Secretary of State in February 2017 to refer debtors who are not in receipt of Universal Credit to DWP for recovery through Direct Earnings Attachment ended in May 2022.
Current forecasts indicate that by the time Universal Credit rollout ends approximately £6.2 billion of Tax Credit debt will have transferred to DWP for recovery.
At the end of the 2022-23 there were 4.9 million accounts held by Debt Management with a balance totalling £8.9 billion (this includes outstanding Universal Credit Advances of £1.5 billion) and 0.3 million accounts on the Social Fund system with a balance of £0.1 billion.
Chart U: Summary of debts referred to Debt Management
New Debts Referred
| Debt type | Debts 2019-20 | Values 2019-20 | Debts 2020-21 | Values 2020-21 | Debts 2021-22 | Values 2021-22 | Debts 2022-23 | Values 2022-23 |
|---|---|---|---|---|---|---|---|---|
| Debt Mgt. Core Recovery | 5.3m | £3.2bn | 5.1m | £2.7bn | 5.5m | £3.8bn | 4.7m | £3.2bn |
| Social Fund | 0.7m | £0.1bn | 0.5m | £0.08bn | 0.2m | £0.03bn | 0.1m | £0.02bn |
| Total | 6.0m | £3.3bn | 5.6m | £2.8bn | 5.7m | £3.8bn | 4.8m | £3.2bn |
Note
The figures have been derived from debts when they are referred to Debt Management and will not match with the debt figures shown in the Statement of Financial Position, which include data not captured in the table above, such as certain types of write offs, small overpayments and other non-recoverable debts which are written off at source.
Chart V: Summary of debt stock
Debt Stock Actuals
| Debt type | Debtors 2019-20 | Values 2019-20 | Debtors 2020-21 | Values 2020-21 | Debtors 2021-22 | Values 2021-22 | Debtors 2022-23 | Values 2022-23 |
|---|---|---|---|---|---|---|---|---|
| Debt Mgt. Core Recovery | 3.6m | £5.9bn | 4.7m | £6.8bn | 4.9m | £8.1bn | 4.9m | £8.9bn |
| Social Fund | 0.5m | £0.2bn | 0.4m | £0.1bn | 0.4m | £0.1bn | 0.3m | £0.1bn |
| Total | 4.1m | £6.0bn | 5.1m | £6.9bn | 5.3m | £8.2bn | 5.2m | £9.0bn |
Chart W: Debt stock breakdown at financial year ending
Debt Stock Breakdown
| Debt Type | Value (£bn) | Value (£bn) 2019-20 | Value (£bn) 2020-21 | Value (£bn) 2021-22 | Value (£bn) 2022-23 |
|---|---|---|---|---|---|
| Overpayments | £2.6bn | £2.8bn | £3.6bn | £4.4bn | |
| Advances and Hardship | £1.0bn | £1.2bn | £1.3bn | £1.5bn | |
| Tax Credit | £1.8bn | £2.3bn | £2.7bn | £2.5bn | |
| Housing Benefit | £0.2bn | £0.3bn | £0.3bn | £0.3bn | |
| Social Funds (DM) | £0.3bn | £0.2bn | £0.2bn | £0.1bn | |
| Social Fund (SFCS) | £0.2bn | £0.1bn | £0.1bn | £0.1bn | |
| Total | £6.0bn | £6.9bn | £8.2bn | £9.0bn |
Notes:
Figures rounded to 1 decimal point – and do not necessarily add up exactly to the overall total as a result.
Figures for 2020-21 impacted by a 3-month suspension in debt collection (Apr-Jun) as a result of the Covid-19 pandemic, with a similar pause in overpayment referrals.
Data Source: AID BO Reports and SF Dashboard Excludes DfC/N Ireland Data is up to the end of March 2022. Individuals may be on both Debt Management and Social Fund systems, meaning that the total number of debtors is an over-estimate.
Efficiency and transformation
We continue to transform our Debt Management services, which will help us manage debt stock and support customers who need our help.
We utilise various sources of insight to identify areas for improvement, proactively reviewing and adapting our policies and processes to ensure we continue to meet the changing needs of our customers.
We continue to build on the successful implementation of a secure self-service portal allowing customers to complete transactions online and communicate with us digitally regarding repayment and affordability support. To date, over 1.763 million customers have been given the opportunity to access the service and over 232,000 plans have been set with recoveries worth £94 million.
We are seeking to carefully expand functionality and capacity of this service, trialling changes on small numbers of accounts.
In November 2022 a service was launched for on-benefit customers who, when invited, can view their outstanding debts online using the self-service portal.
In April 2023 we also commenced initial trials of functionality to enable on-benefit customers to set a more affordable repayment rate via the online service.
Our strategic IT solution also includes an agent facing debt management system operating alongside the online self-service channel. This multi-channel approach will transform our services, creating greater opportunities for customers to self-serve where they are able. This is further complemented by plans to use data to segment customers, enabling our approach to customers with different circumstances to be more tailored.
Developing a better understanding of the effectiveness of our debt recovery processes, policies and legislative powers led to the development of a Debt Enforcement Function. This targets debtors who are not in receipt of benefit, and not making repayments, who can repay but decline all requests to do so. The service was set up in February 2022; to date 14,865 customers have been contacted and 3,641 plans have subsequently been set up with recoveries worth £465,901.
Debt Management has been independently Customer Service Accredited since 2010 demonstrating our commitment to delivering an excellent customer service in a fair and compassionate manner. The feedback from the 2022 evaluation commends our customer service centric culture and the way we put our customers at the heart of everything we do. In the future our focus will continue to be on developing our people, modernising our services, and continuing to deliver quality outcomes for customers.
Sustainability report
Sustainability remains central to the way we make policy, run our buildings and purchase goods and services. Our activities are wide ranging and cover the whole of the country. A summary of the actions undertaken this year to support DWP’s ambition to become a more sustainable Department and meet the government’s commitment to reduce its impact on the environment is presented below.
| Initiative | Activity in 2022-23 |
|---|---|
| Embedding Sustainability | We developed our Build a Sustainable Culture objective to increase awareness, understanding and action on sustainability. Activities included: * The development of a new Sustainability intranet site * Working with our volunteer Sustainability Champions network to raise awareness on key issues We continued to embed strategy via our Sustainability Leadership Forum and its Working Group. Our Net Zero Carbon roadmaps project will help inform our thinking. |
| Net Zero Carbon |
DWP Estates has delivered or started delivery of a range of decarbonisation and energy efficiency projects over the year, including: * LED lighting replacement at 12 sites * Centralisation and optimisation of building controls at 112 sites to ensure more efficient settings to improve comfort and reduce energy use * Low Carbon Surveys at 50 sites to prepare for decarbonisation grant funding bids and to identify projects for incorporation into DWP’s lifecycle works programme * Enabling works at 14 sites for solar panel installation in the next financial year * Heat decarbonisation projects started across 14 sites as part of the grant-funded Public Sector Decarbonisation Scheme. * Collaboration with the Government Property Agency (GPA) on a range of energy efficiency measures across 11 DWP sites as part of their Net Zero Programme. |
| Ultra Low Emission Vehicles | DWP’s vehicle fleet supports the business, especially Visiting Officers and specialist Fraud teams. At the end of December 2022 33% of our fleet was either an Ultra Low Emission Vehicle or was in the process of being replaced with one. |
| Workplace Transformation | 2022-23 was a critical year for the Workplace Transformation strategy, which will help reshape how we deliver our services as we transition to an estate that is smaller, greener, and better. Initiatives delivered this year include: * Investment in 17 office sites, improving the environment including the installation of LED lighting * Feasibility study on a further 28 sites to determine improvements required * Installation of 73 Electric Vehicle Charging Points at 10 pilot sites, and a commercial contract signed to deliver a further 160 in circa 80 locations * Divestment and consolidation of a range of different sites. |
| Reducing Our Water Use | We have installed 83 water loggers on our sites to provide automatic meter readings and improve our water usage data. This will enable better monitoring for leak detection and inform targeted water reduction projects in future. |
| Waste Management | We have undertaken several initiatives to minimise waste and promote resource efficiency this year, including: * Replacement of paper hand towels with hand dryers in washrooms at 21 sites * A waste awareness campaign including running waste roadshow events and publishing national news articles on recycling * A waste management review to identify further ways to improve performance against our waste targets. |
| Consumer Single Use Plastics | We have significantly reduced the number of single use plastic items from ~5.2 million in 2021-22 to ~ 1.4 million in 2022-23. Initiatives implemented this year include: * Replacement of all water bottles for sale with 100% recycled and recyclable water bottles * Trial of reusable coffee cups in place of single use disposable cups at 1 of our sites, with the view to roll out to all catered sites in 2023-24 * Our internal ‘DWP Swap Shop’ scheme continues to be used to share surplus equipment (primarily stationary) between staff to avoid waste and unnecessary cost. |
| Sustainable Procurement | In 2022 we published our SME Action Plan, which focuses on key enablers including: * Improved data accuracy and deep dive review of spend – ensuring existing contracts with SMEs are captured in DWP’s eProcurement system and analysis of spend[footnote 40] * Engagement and Accountability - including relaunching Commercial Directorate SME champions working group, to share and implement best practice * Supply Chain prompt payment compliance - ensuring suppliers pay their supply chain invoices promptly. SME spend data is ratified by Cabinet Office but early indications show that DWP SME spend increased again in 2021-22. (Important to note that 2022-23 data will not be available until 2023-24) DWP embed compliance with Government procurement policy evidenced by compliance with Commercial Functional Standard (GovS 008) using the Commercial Continuous Improvement Assessment Framework (CCIAF) and engagement with Cabinet Office and cross-government policy groups[footnote 41]. Commercial Directorate continue to apply the measure introduced in PPN06/21 to new procurements of over £5 million value[footnote 42]. This means that any suppliers without Net Zero 2050 Carbon Reduction Plans will be excluded from bidding in the procurement. The Social Value (SV) policy note, PPN06/20, went live in January 2021 with new procurements required to include 10% Social Value criteria[footnote 43]. As commercial and market understanding is maturing, a proposal to apply SV policy has been developed to support DWP delivery objectives including providing new jobs and training. A follow up to our first Modern Slavery Statement was approved in autumn 2022, with a summary version to be included in a forthcoming cross-government compendium statement. |
| Nature Recovery | We undertook a biodiversity review of DWP’s estate, which included calculation of a baseline Biodiversity Unit value for our land, identification of priority sites, and recommended actions/interventions. |
| Climate Change Adaptation |
DWP Estates has continued to implement the actions highlighted in its climate change action plan and flood risk review. Examples include: * The development of 38 comprehensive Flood Plans at the sites most at risk of flooding * Engagement with the central Business Continuity and Resilience team, ensuring DWP are signed up to the relevant warning systems available for flooding, overheating and cold snaps. DWP Estates attends Defra’s Climate Change Integrated Review Implementation Group (IRIG) - Adaptation Subgroup. This support’s the response of government departments to the climate change risks identified within the UK’s 3rd Climate Change Risk Assessment (CCRA3). |
| Digital | We worked with Defra to: * Enhance the measurement of greenhouse gas emissions from DWP IT infrastructure Start the process of incorporating the technology Code of Practise into the Digital governance process via cross-government work with NHS. We also: Created a Social Value format for our Digital contracts, which has been successfully trialled on two specific Digital projects * Committed research by DWP’s Innovation Lab to produce a data model for emissions from cloud services, facilitating identification of high emissions from applications * Worked across government, supporting the first Government Climate and Environment Conference and introducing the opportunity for cost and emissions reduction created by Digital Sustainability * Engaged with the IPA project review team on emission criteria to ensure project compliance. |
| Policy | We have been working closely with Defra and other government departments to develop implementation plans for the introduction of a new environmental legal duty, which will require ministers and policy makers to have due regard to 5 environmental principles when making policy. We have also continued to embed sustainability into policy making. For example, world-leading regulations, which require pension schemes to both meet climate change governance requirements and to report on how they have done so, were extended to smaller schemes (£1 billion+) from 1st October 2022. We also extended reporting requirements to include a pension scheme’s portfolio alignment with the Paris Agreement goal of limiting global warming to 1.5°C. These reporting requirements ensure that large pension schemes consider the environmental risks to their members. We have established support for claimants to apply for as well as identify green job opportunities. Examples of work completed in 22-23 include: * Playing a key role on the cross-government and industry Green Jobs Delivery Group with the aim of identifying where we can adapt and enhance our support for jobseekers, workers and employers to remove barriers to a green jobs transition * Work Coach intervention and targeted provision including Sector based Work Academy Programmes * The creation of digital resources for Work Coaches and employer advisors with the help of the National Employer and Partnership Team * NEPT also launched a Green Jobs Single Point of Contact (SPOC) network in early 2022, with the aim of championing green jobs and training opportunities in districts across the UK * A pilot in Wales aimed at upskilling jobcentre staff on green jobs and skills and local opportunities, to improve their capability in supporting jobseekers into these types of roles. |
| Rural Proofing | Local jobcentres have the flexibility to work alongside national or local organisations to help meet the needs of their communities. The employer and partnership teams work closely with customers, employers, and partners to help fill vacancies for large scale employers and micro businesses in our rural areas. Poor transport links are a major contribution that affects employment. To combat this, DWP have worked closely with local councils and teams to identify and provide local minibus services to customers living in rural areas, as well as launching outreach services to young individuals affected by poor transport links. |
Case Study
Green Jobs Pilot Study
Building awareness and understanding of sustainability is also giving a huge boost to jobseekers looking to work in the growing green economy. “We’re so much more aware of the green agenda now,” says Kimberley Ferris, employer advisor and green champion at Milford Haven jobcentre in Wales, who helped to deliver a green jobs pilot last year.
The pilot involved providing teach-ins to staff to develop their knowledge, and allocating time and resource to better identify and engage with employers in green sectors, building a better understanding of their needs and the barriers stopping customers from taking up green jobs. “It’s made me much more aware of the green sector here in Wales and means I can have much richer conversations with employers and customers, to make sure job outcomes are more likely to succeed” says Jeremy Jenkins, employer adviser and green champion at Llanelli jobcentre.
The pilot has resulted in Wales districts engaging with over 125 new employers working in the green economy, and 79% of employer and partnership staff reporting that green jobs training had provided them with the confidence required to effectively deliver on the green agenda. Next steps from the pilot are currently being considered.
Procurement of Food and Catering
In 2022-23 DWP Estates undertook a review of catering provision across DWP and have reduced the number of catered sites to just 10.
All Food and Catering services are provided through our facilities Management contract and comply with the Government Buying Standards for Food and Catering. Our catering supplier is a signatory of the ‘Step up to the Plate’ pledge, UK Food Waste Roadmap and WRAP Courtauld Commitment 2025.
UN Sustainable Development Goals
Please see the Priority Outcomes and Strategic Enablers tables within the Performance Summary.
Greening Government Commitments
We continue to support the government’s commitment to reduce its impact on the environment. The table below gives a summary of our progress since 2017-18 and reports against the new government targets published in 2021. Note that this data excludes ALBs and is for DWP only. Our full GGC return to Defra includes both DWP and ALBs.
Reduce overall greenhouse gas emissions by 45% and direct greenhouse gas emissions from estate and operations by 17% from a 2017 to 2018 baseline by 2024-25
| Emissions | 2017-18 baseline | 2021-22 performance | 2022-23 performance | Reduction against baseline year | |
|---|---|---|---|---|---|
| Total Greenhouse Gas Emissions | TCO2e | 108,167 | 78,543 | 74,852 | (31%) |
| Scope 1 carbon emissions – direct emissions from owned or controlled sources TCO2e |
41,345 | 44,631 | 40,072 | (3%) | |
| Gas consumption kWh | 196,603,589 | 239,458,080 | 210,262,556 | ||
| Oil consumption kWh | 4,579,998 | 2,542,519 | 2,617,387 | ||
| Scope 2 carbon emissions – indirect emissions from the generation of purchased electricity consumed TCO2e |
50,839 | 29,757 | 28,154 | ||
| Electricity consumption kWh | 144,511,209 | 139,594,282 | 145,586,579 | ||
| Purchased heat via District Heat Networks kWh |
246,141 | 3,224,085 | 5,405,999 | ||
| Scope 3 carbon emissions – other indirect emissions that occur in DWP’s value chain TCO2e GGCs cover Scope 3 business travel + electricity transmission & distribution only |
15,983 | 4,156 | 6,627 | ||
| Distance travelled by domestic flights |
2,142,833 | 164,998 | 803,050 | ||
| Emissions from domestic flights (tonnes) |
303 | 21 | 104 | ||
| Distance travelled by international flights |
817,234 | 44,861 | 716,558 | ||
| Distance travelled by international business flights (short haul) |
265,159 | 22,598 | 100,684 | ||
| Distance travelled by international business flights (long haul) |
552,075 | 22,263 | 615,874 |
Meet the Government Fleet Commitment for 25% of the government car fleet to be ultra-low emission vehicles (ULEV) by 31/12/22, and for 100% of the government car and van fleet to be fully zero emissions at the tailpipe by 31/12/27.
| Emissions | 2017-18 baseline | 2021-22 performance | 2022-23 performance | Reduction against baseline year |
|---|---|---|---|---|
| Fleet percentage categorised as Ultra-Low Emission Vehicle (includes vehicles on order) |
0% | 0% | 33% This data is as at 31/12/2022 |
|
| Fleet percentage categorised as Zero Emission vehicle (includes vehicles on order) | 0% | 0% | 9% This data is as at 31/12/2022 |
Reduce the amount of waste we generate by 15% from a 2017-18 baseline by 2024-25.
| Waste | 2017-18 baseline | 2021-22 performance | 2022-23 performance | Reduction against baseline year |
|---|---|---|---|---|
| Total waste arising (tonnes) | 10,121 | 5,872 | 6,995 | -31% |
| Total waste recycled (tonnes) | 6,774 | 3,300 | 4,310 | |
| Total ICT waste recycled, reused and recovered externally (tonnes) | No data | No data | 64 | |
| Total waste composted/food waste (tonnes) | No data | 12 | 10 | |
| Total waste incinerated for energy recovery (tonnes) | No data | 2,505 | 2,417 | |
| Total waste incinerated without energy recovery (tonnes) | No data | 0 | 0 | |
| Total waste to landfill (tonnes) | 3,347 | 67 | 268 | |
| Percentage of total waste recycled | 67% | 56% | 62% |
Reduce water consumption by at least 8% from a 2017-18 baseline by 2024-25.
| Water | 2017-18 baseline | 2021-22 performance | 2022-23 performance | Reduction against baseline year |
|---|---|---|---|---|
| Total water consumption | 676,727 | 562,911 | 550,323 | -19% |
Reduce the amount of paper used by 50% from a 2017-18 baseline by 2024-25
| Paper | 2017-18 baseline | 2021-22 performance | 2022-23 performance | Reduction against baseline year |
|---|---|---|---|---|
| A4 (Reams) | 600,101 | 89,876 | 35,725 | -94% |
| A3 (Reams) | 2,165 | 179 | 249 | -88% |
Financial information
| Expenditure | 2017-18 Baseline | 2021-22 performance | 2022-23 performance | Reduction against baseline year |
|---|---|---|---|---|
| Gross expenditure on the purchase of energy | £28,804,079 | £40,800,265 | ||
| Reported Areas of Energy Gas | £6,869,380 | £13,243,435 | ||
| Reported Areas of Energy Oil | £195,982 | £291,568 | ||
| Reported Areas of Energy Electricity | £21,464,200 | £26,954,889 | ||
| Reported Areas of Energy Heat | £274,517 | £310,373 | ||
| Expenditure on accredited offset purchases | £0 | £0 | ||
| Total expenditure on official business travel | £6,233,777 | £13,111,999 | ||
| Total Expenditure on Waste | £1,697,080 | £1,885,630 | ||
| Total Expenditure on Waste Recycled | £1,000,751 | £986,934 | ||
| Total Expenditure on Waste Sent to Landfill | £78,111 | £69,628 | ||
| Total Expenditure on Composted / Food Waste | No data | £3,573 | ||
| Total expenditure on Waste Incinerated | £614,561 | £807,581 | ||
| Total expenditure on ICT waste recycled, reused and recovered (externally) | No data | £912,869.00 | ||
| Paper Costs (Inc Vat) | £362,429 | £543,376 | ||
| Total Water Cost (Inc Water and Sewerage Costs) | £2,750,275 | £2,375,458 |
*Waste expenditure figures include waste disposal contracts, specialist waste arising and the purchase of licenses for waste
Accountability report
Accountability report 2022-23
The Accountability report sets out how we meet the key requirements to Parliament. It is broken down into 3 areas:
- the corporate governance report which provides an overview of the Department’s leadership and our risk management approach
- remuneration and staff report which details remuneration and staff expenses and policies
- Parliamentary accountability which contains the Statement of Outturn against Parliamentary Supply, associated notes, and audit certificate
Corporate governance report
The purpose of the Corporate governance report is to explain the composition and organisation of the Department’s governance structures and show they support the achievement of the Department’s objectives.
Lead non-executive member’s report
I am immensely grateful to Chloe Smith for asking me to step into the role of Lead non-executive Director for DWP when my predecessor Nick Markham moved to the Lords as a minister for health, and it therefore falls to me to write this year’s Lead non-executive report.
The role of the non-executive director (NED) in government would not normally be at the forefront of people’s thinking, but for a variety of reasons it has had more attention in this 1 year than in the whole of the time since the role was first codified in 2005. From press coverage to a Public Administration and Constitutional Affairs Committee, people have asked what the role of a NED is in government and how they add value.
I thought that it would be helpful to address those questions here as they relate to DWP in the 2022-23 financial year just completed.
DWP’s day-to-day operations are of a scale that dwarfs most FTSE organisations. It is a huge department, employing nearly 80,000 staff, and touching almost every citizen of the UK at some point in their lives, often at moments of immense stress and distress for them. The importance of its work cannot be overstated, and the challenge of running something this large and complicated whilst ensuring our customers get the care and support that they need should not be underestimated.
There are two huge jobs to be done leading the Department. The first is the Secretary of State, the elected politician with the added requirements of attending Parliament, Cabinet meetings and of course representing their constituency. The second is the Permanent Secretary, the Civil Servant with responsibility for implementing the ambition of the Secretary of State and Government. The overall effectiveness of the Department is heavily dependent on the quality of decisions that each of these two people make individually (and with their respective ministerial and civil service teams) and collectively, and on the quality of the relationship between them. A core element of the NEDs’ role therefore is helping the Secretary of State and the Permanent Secretary to each be as personally effective as possible, and also helping them to work together as a team as effectively as possible. The NEDs also work more broadly across the Department with ministers and the Executive Team to contribute where needed to the successful operation of the department, in many instances focussing on matters that they, the NEDs, either solely or collectively believe need more attention.
I and my fellow non-executive colleagues provide this support through a combination of formal governance meetings and informal interactions with politicians and civil servants. The effectiveness of these activities depends in part on the commitment of all parties to its success, and I am pleased to report that this commitment is very clear across the whole Department.
Turning first to our informal engagement with ministers. We have had 3 Secretaries of State over the course of this financial year: Therese Coffey; Chloe Smith; and the current office holder Mel Stride. All 3 have shown huge commitment to the role of the NEDs with Therese meeting regularly with my predecessor Nick Markham, and Chloe Smith and the current office holder Mel Stride meeting regularly with myself and my fellow non-executives. Over the year I’ve seen each Secretary of State seek out the opinions, guidance and challenge of NEDs on issues facing the Department and incorporate that feedback into their thinking.
Informal engagement with civil servants takes a variety of forms, with the Permanent Secretary, Directors General and with other staff across the organisation. I’ve seen my civil service colleagues engage with NEDs where their experience and skills enable them to add value to the issues being dealt with. Some of these engagements are more structured and regular (for example I meet every fortnight with the Permanent Secretary and other non-executives have similar arrangements with directors general), other interactions are more ad-hoc depending on what issues any director general is facing.
The second form of NED support to the department is via the formal governance meetings in the Department:
- the Departmental Board which brings together ministers and civil servants, meeting at least quarterly to agree the Outcome Delivery Plan for the year with a particular focus on do-ability, to review performance against plan and to agree corrective action where needed
The Department is further supported by the following two critically important formal committees chaired by a NED:
- the Departmental Audit and Risk Committee provides oversight of the Department’s financial and risk management processes and procedures and is now chaired by Charlie Steel who replaced David Holt during this financial year
- the Non-executive Directors and Executive Team Board brings the NEDs and the DWP Executive Team together to review, challenge and shape responses to key issues that the team is working on
In addition, NEDs chair a number of other committees which exist to provide oversight and/or guidance on critical projects or areas of functional specialism:
1. The Health Transformation Board formerly chaired by David Holt is now chaired by Gina Radford, and oversees the re-design and re-organisation of our support for citizens with health challenges.
2. The Serious Case Panel is chaired by David Bennett and undertakes the hugely important role within the Department of ensuring that we review and learn from instances where we may have failed our customers.
- The Transformation Advisory Committee which supports the operational and Digital transformation of the Department and is chaired on my behalf by Arabel Bailey whilst I am acting Lead NED.
4. The Nominations committee chaired by Valerie Hughes-D’aeth which is responsible for challenging and supporting the Department’s HR plans and succession
In addition, Valerie and other NED colleagues continue to provide support to the Permanent Secretary on a number of people issues, including recruitment. It is important to the health of any business that its leaders continue to develop, learn and flourish, and I am thrilled by the number of our Executive Team who continue to move on from the Department into new roles across government. In this financial year we have seen Nick Joicey, Kate Davies and Jonathan Mills leave the Executive Team for new roles at the Cabinet Office and the Department for Energy Security and Net Zero respectively. Equally important however is attracting new talent, and as in previous years we continue to see excellent new directors general join us from across government and the private sector ensuring the leadership team goes from strength to strength.
Likewise, among the NEDs we continue to see change, as I mentioned above Nick Markham left us this year and I and my NED colleagues are immensely grateful to him for the significant time that he put into supporting the Secretary of State and the Department, but so also did David Holt who has chaired the Departmental Audit and Risk Assurance Committee and the Health Transformation Board for several years. In his time with DWP David made a demonstrable difference to the quality of our risk management and oversight and we wish him and Nick well in the future. As with the Executive Team however we continue to attract strong new talent to our NED team and I have been delighted to welcome two new NEDs this year, Charlie Steel, a current FTSE Finance Director and an existing non-executive Member of the Transformation Advisory Committee, and Gina Radford who has a long career in Health having been a former Deputy Chief Medical Officer amongst many other roles in the health sector.
In summary I would circle back to my introduction, and the critical focus of the NEDs on helping the Secretary of State and the Permanent Secretary to be as effective as possible, both individually and collectively in running the Department. As you will read in both their reports, the Department has delivered a huge range of services and initiatives this year although we clearly also have challenges to overcome. They and their teams have both sought to leverage the skills of the NEDs wherever they felt they were needed, and the NEDs have responded when called upon and their feedback, and, where needed, challenge has been acted on. I am confident that we have a strong and effective leadership at the head of this critical Department, good governance supporting it, and a well-used and effective team of NEDs supporting it.
Ashley Machin
Lead non-executive
Directors’ report
Our ministers
Ministers at 31 March 2023
Rt. Hon Mel Stride MP
Secretary of State for Work and Pensions
(from 25 October 2022)
Portfolio:
- overall responsibility for the business of the Department
- direct responsibility for departmental expenditure and departmental management
- departmental planning and performance management, and other reporting and governance requirements
Guy Opperman MP
Minister of State for Employment
(from 27 October 2022)
Portfolio:
- responsible for departmental strategy on the labour market, including addressing inactivity to improve labour supply and economic growth
- in-work progression
- skills
- conditionality and sanctions
- uprating and the Benefit Cap
- overall management and delivery of Universal Credit and legacy benefits
- Jobcentre Plus
- international
- National Insurance Numbers
Tom Pursglove MP
Minister of State for Disabled People, Health and Work
(from 27 October 2022)
Portfolio:
- disability policy and cross-government responsibility for disabled people
- oversight of the Disability Unit, and convenor of disability champions
- work and Health strategy, including sponsorship of the joint DWP/Department for Health and Social Care Work and Health Unit
- disability benefit reform
- disability Employment, and disability employment programmes
- financial support for those at risk of falling out of work, and disabled claimants
- Serious Case Panel – considers serious issues that affect the customer experience
- devolution framework
- fraud, error and debt
Laura Trott MP
Parliamentary Under Secretary of State (Minister for Pensions)
(from 27 October 2022)
Portfolio:
- pensioner benefits, including new State Pension, Winter Fuel Payments, Pension Credit and Attendance Allowance
- private and occupational pensions, including regulatory powers and the National Employment Savings Trust (NEST)
- Social Fund (Cold Weather Payments, Sure Start Maternity grants and Funeral Expenses Payment Scheme)
- methods of payment, including Post Office Card Account
- Net Zero (supporting a greener and a more sustainable future)
Public body responsibility: The Pensions Regulator, Pension Protection Fund, Financial Assistance Scheme, The Pensions Ombudsman and Office for Nuclear Regulation.
Mims Davies MP
Parliamentary Under Secretary of State (Minister for Social Mobility, Youth and Progression)
(from 27 October 2022)
Portfolio:
- support for disadvantaged groups
- Youth Offer
- childcare
- government Equalities Office, Women and the Menopause
- Military Covenant
- poverty and cost of living
- Housing Benefit Strategy and Delivery, including Support for Mortgage Interest and supported accommodation
- Shadow Lords Minister
Public body responsibility: Health and Safety Executive
Viscount Younger of Leckie
Parliamentary Under Secretary of State
Minister for Work and Pensions (Lords)
(from 01 January 2023)
Portfolio:
- spokesperson for DWP business in the House of Lords
- child maintenance and family test
- parental conflict
- Bereavement Benefits
- Maternity Benefit
- coordination of departmental legislation
-
departmental business, including oversight of:
- departmental capability in commercial and digital affairs
- commercial contracting policy
- resourcing and estates
- transparency and data-sharing issues
- research and trialing
Public body responsibility: Social Security Advisory Committee
Our executives
Executives at 31 March 2023.
Peter Schofield CB
Permanent Secretary and Principal Accounting Officer
Appointment: January 2018
- Departmental Board
- Non-executive Directors and Executive Team Board
- Executive Team (chair)
- Nominations Committee
Debbie Alder CB
Director General, People, Capability and Place Group
Appointment: January 2014
- Departmental Board
- Non-executive Directors and Executive Team Board
- Executive Team
- Nominations Committee
Neil Couling CBE
Director General, Change and Resilience Group
Appointment: October 2014
- Non-executive Directors and Executive Team Board
- Executive Team
Simon McKinnon CBE[footnote 44]
Director General
Chief Digital and Information Officer Digital Group
Appointment: March 2020
- Non-executive Directors and Executive Team Board
- Executive Team
- Transformation Advisory Committee
Amanda Reynolds
Director General, Service Excellence Group
Appointment: February 2021
- Non-executive Directors and Executive Team Board
- Executive Team
- Transformation Advisory Committee
Katie Farrington
Director General, Disability, Health and Pensions
Appointment: March 2021
- Non-executive Directors and Executive Team Board
- Executive Team
Mel Nebhrajani
Director General, Employment with Economic Recovery and UK Governance Directorate
Government Legal Department
Appointment: October 2021
- Executive Team
Barbara Bradley
Director General, Work and Health Services Group
Appointment: June 2022
- Non-executive Directors and Executive Team Board
- Executive Team
Catherine Vaughan
Director General, Finance Group
Appointment: November 2022
- Departmental Board
- Non-executive Directors and Executive Team Board
- Departmental Audit and Risk Assurance Committee
- Executive Team
Sophie Dean and Katherine Green (job sharing)
Director General, Labour Market Policy and Implementation
Appointment: December 2022
- Non-executive Directors and Executive Team Board
- Executive Team
Our non-executive board members
Non-executives at 31 March 2023
Ashley Machin
Interim Lead non-executive (as of September 2022)
Reappointment: November 2020
- Departmental Board
- Non-executive Directors and Executive Team Board (chair)
- Departmental Audit and Risk Assurance Committee member
- Transformation Advisory Committee member
- Nominations Committee member
Valerie Hughes-D’Aeth
Appointment: February 2021
- Departmental Board
- Non-executive Directors and Executive Team Board
- Nominations Committee (chair)
- Portfolio Board
David Bennett
Appointment: February 2021
- Departmental Board
- Non-executive Directors and Executive Team Board
- Serious Case Panel (chair)
Charlie Steel
Appointment: September 2021
- Departmental Board Departmental Audit and Risk Assurance Committee (interim chair as of 30 March 2023)
- Transformation Advisory Committee member
Reverend Professor Gina Radford
Appointment: March 2023
- Departmental Board
Other non-executives at 31 March 2023
| Name | Committee | Appointed |
|---|---|---|
| Sally Cheshire CBE | Departmental Audit and Risk Assurance Committee | August 2020 |
| Ian Wilson | Departmental Audit and Risk Assurance Committee | August 2020 |
| Arabel Bailey | Transformation Advisory Committee (interim chair) | September 2021 |
| Simon Sear | Transformation Advisory Committee | September 2021 |
Direct appointment at 31 March 2023
| Name | Committee | Reappointed |
|---|---|---|
| John McGlynn | Universal Credit Programme Board (chair) | February 2023 |
Changes to our senior decision-making forums in 2022-23
The following changes took place between 1 April 2022 and 31 March 2023:
| Role: Ministerial changes | Name | Change |
|---|---|---|
| Secretary of State for Department for Work and Pensions | Rt Hon Thérèse Coffey MP | Left the Department 5 September 2022 |
| Parliamentary Under Secretary of State (Minister for Pensions and Financial Inclusion) | Guy Opperman MP | Resigned 7 July 2022. Reappointed to same role 8 July 2022. Left the Department 8 September 2022 |
| Parliamentary Under Secretary of State (Minister for Employment) | Julie Marson MP | Appointed 8 July 2022. Left the Department 19 September 2022 |
| Parliamentary Under Secretary of State (Minister for Welfare Delivery) | David Rutley MP | Left the Department 19 September 2022 |
| Minister of State for Disabled People, Health and Work | Chloe Smith MP | Appointment ended 6 September 2022 |
| Secretary of State for Department for Work and Pensions | Rt Hon Chloe Smith MP | Appointed on 6 September 2022. Left the Department 24 October 2022 |
| Secretary of State for Department for Work and Pensions | Rt Hon Mel Stride MP | Appointed 25 October 2022 |
| Minister of State (Minister for Work and Welfare) | Victoria Prentis MP | Appointed 7 September 2022. Left the Department 24 October 2022 |
| Parliamentary Under Secretary of State (Minister for Pensions and Growth) | Alex Burghart MP | Appointed 20 September 2022. Left the Department 26 October 2022 |
| Parliamentary Under Secretary of State (Minister for Disabled People, Health and Work) | Claire Coutinho MP | Appointed 21 September 2022. Left the Department 26 October 2022 |
| Minister of State (Minister for Disabled People, Health and Work) | Tom Pursglove MP | Appointed 27 October 2022 |
| Parliamentary Under Secretary of State (Minister for Pensions) | Laura Trott MBE MP | Appointed 27 October 2022 |
| Parliamentary Under Secretary of State (Minister for Social Mobility, Youth and Progression | Mims Davies MP | Appointed 27 October 2022 |
| Minister of State (Minister for Employment) | Guy Opperman MP | Appointed 27 October 2022 |
| Parliamentary Under Secretary of State (in the Lords) | Baroness Stedman-Scott OBE | Left the Department 31 December 2022 |
| Parliamentary Under Secretary of State (in the Lords) | Viscount Younger | Appointed 1 January 2023 |
| Role: Non-executive level changes | Name | Change |
|---|---|---|
| Non-executive director | Eleanor Shawcross | Resigned 31 May 2022 |
| Non-executive member | Tim Nolan | term ended 30 June 2022 |
| Lead non-executive | Nick Markham | Resigned 25 September 2022 |
| Non-executive director | David Holt | Resigned 13 March 2023 |
| Non-executive director | Reverend Professor Gina Radford | Appointed 30 March 2023 |
| Role: Executive level changes | Name | Change |
|---|---|---|
| Director General, Labour Market Policy and Implementation | Jonathan Mills | Left the Department 5 June 2022 |
| Director General, Work and Health Services Group | Barbara Bradley | Appointed 20 June 2022 |
| Interim Director General, Work and Health Services Group | Karen Gosden | Left the Department 30 June 2022 |
| Director General, Finance | Nick Joicey | Left the Department 31 August 2022 |
| Director General, Finance | Catherine Vaughan | Appointed 1 November 2022 |
| Director General, Labour Market Policy and Implementation | Sophie Dean and Katherine Green (jobshare) | Appointed 5 December 2022 |
| Interim Director General, Labour Market Policy and Implementation | Kate Davies | Appointed 20 June 2022 and stepped down 11 December 2022 |
Management of interests
All of our employees are bound by the Civil Service Code – the framework on which the Department’s standards of behaviour are built. The consequences of failing to comply are serious and attract penalties up to and including dismissal. The Department’s Standards of Behaviour Policy and Procedures apply to employees at all grades.
It is mandated in the Department’s Standards of Behaviour Procedures that employees’ interests and activities outside of work must not create conflict of interest or potential for perceived conflict of interest with their official role and they must not bring the Department into disrepute. Our employees are specifically instructed in the Standards of Behaviour Procedures never to request special treatment from any client of the Department that would benefit their outside interests. Our employees are also specifically required to consult their line manager and seek permission if they are proposing to take up a second occupation or any position with a non-political organisation (political activity is controlled under separate rules) if it could create a conflict of interests or appear to create a conflict of interests. Further, our employees must seek their manager’s written permission to take up any non-executive directorship during their employment with the Department.
In addition to the Department’s standing requirement for all staff to discuss potential conflicts with their manager before taking up an external appointment, our Senior Civil Servants and non-executive members are required to declare any interests which they hold to the Permanent Secretary on an annual basis. The information has been gathered during the year and has been reviewed by the Permanent Secretary. The returns were also scrutinised by our Departmental Audit and Risk Assurance Committee.
See a comprehensive list of Senior Civil Servants outside paid remuneration as of 31 March 2023
At the beginning of every Departmental Board meeting, all members are asked to declare any new potential conflicts of interest. These are noted in the minutes along with the appropriate action taken to manage them. Where a board member declares a potential conflict at a meeting, it is recorded in the minutes and the board member takes no part in any discussions relating to that matter. There were no conflicts of interests registered during board meetings in 2022-23.
We managed Nick Markham’s interests up until his resignation on 25 September 2022 with a legal agreement that defined the protocols to be followed to prevent, identify and remedy any conflict of interest or unfair advantage (whether actual, potential or perceived) that may arise from the Housing support initiative.
None of our ministers held directorships that conflicted with their management responsibilities in 2022-23.
In addition, in line with the current Declaration of Interest policy for special advisers, all special advisers have declared any relevant interest or confirmed they do not consider they have any relevant interests. The Permanent Secretary has considered these returns and relevant interests are set out in public.
See a comprehensive list of directors and non-executive board members’ interests as of 31 March 2023
Management of business appointments
Under the Government’s Business Appointment Rules, published internally and on GOV.UK, permission is required if any employee wishes to leave the Department to accept a job offer made by a person, company or firm with whom the employee formed a relationship during the course of their official duties and this applies for up to two years after an employee has left our employment. Applications under these rules are considered by someone in a position to understand the potential issues arising from the applicant’s proposed outside appointment and judge the possible public perceptions should the appointment be taken up as proposed. This would normally be someone in the applicant’s line management chain.
Our People, Capability and Place Group scrutinise countersigned applications for assessment and action, and to ensure consistent application, ahead of approval either unconditionally or with conditions, or rejection. The Department’s measures in each instance are proportionate to the grade and previous role(s) of the applicant.
In compliance with Government’s Business Appointment Rules, the Department is transparent in the advice given to individual applications from senior staff, including special advisers. Advice given to Senior Civil Servants at SCS1 and SCS2 regarding specific business appointments is published on www.gov.uk
During 2022-23 the number of requests made is contained in the table below.
| Request | Number |
|---|---|
| number of exits where Business Appointment Rules applications were required | 4 |
| number of exits where Business Appointment Rules conditions were set | 3 |
| number of enforcement actions taken for breaches of the Business Appointment Rules | 0 |
The Advisory Committee on Business Appointments (ACOBA) considers applications from the most senior levels:
- ministers
- permanent secretaries (and their equivalents)
- directors general (and their equivalents)
Advice given by ACOBA regarding specific business appointments is published on www.gov.uk
The departmental group
Our departmental group includes the core department (DWP), 11 public bodies and 1 pension scheme (Remploy Pension Scheme Trustees Limited). A public body is an organisation that delivers a public service but is not a ministerial government department. Our public bodies consist of non-departmental public bodies, tribunal or advisory bodies and public corporations. They operate independently but are accountable to the Department. Collectively our public bodies employ around 4,300 people (full-time equivalent) with a net expenditure of around £427.6 million in a year[footnote 45].
We manage our relationships with our public bodies in accordance with the Cabinet Office’s Arm’s length body sponsorship code of good practice[footnote 46] - which ensures a consistent approach.
The table below sets out our public bodies:
| Classification | Pension bodies | Other bodies |
|---|---|---|
| Public corporations | Pension Protection Fund National Employment Savings Trust Corporation |
Office for Nuclear Regulation |
| Executive non-departmental public bodies | The Pensions Regulator | Health and Safety Executive Disabled People’s Employment Corporation (GB) Ltd[footnote 47] Money and Pensions Service BPDTS Ltd[footnote 48] |
| Tribunal or advisory non-departmental public bodies | The Pensions Ombudsman[footnote 49] Pension Protection Fund Ombudsman |
Industrial Injuries Advisory Council Social Security Advisory Committee |
| Other | Remploy Pension Scheme Trustees Limited |
Data Incidents
During 2022-23, we notified 13 Personal Data related incidents to the Information Commissioner’s Office (ICO). The table below sets out the detail.
Number of breaches reported to the ICO
| Category | 2020-2021 | 2021-2022 | 2022-2023 |
|---|---|---|---|
| Alteration of personal data | 2 | 2 | 1 |
| Failure to use blind carbon copy (Bcc) to hide email addresses | 0 | 0 | 0 |
| Failure to redact | 0 | 1 | 0 |
| Loss/theft of paperwork or data left in insecure location | 0 | 1 1 | |
| Verbal/written disclosure (including Postal Security Incidents) | 4 | 3 | 4 |
| Processing of wrong citizen’s personal data | 9 | 1 | 2 |
| Unauthorised access (staff member) | 0 | 0 | 2 |
| Other | 6 | 6 | 3 |
| Total | 21 | 14 | 13 |
Statement of Accounting Officer’s responsibilities
Under the Government Resources and Accounts Act 2000 (the GRAA), HM Treasury has directed me, Peter Schofield, as Principal Accounting Officer, to prepare, for each financial year, consolidated resource accounts detailing the resources acquired, held or disposed of, and the use of resources, during the year by the Department and its sponsored public bodies designated by order made under the GRAA by Statutory Instrument 2022 No.1319, together known as the ‘departmental group’, consisting of the Department and sponsored bodies.
The accounts are prepared on an accruals basis and give a true and fair view of the state of affairs of the Department and the departmental group and of the income and expenditure, Statement of Financial Position and cash flows of the departmental group for the financial year. The accounts also include the departmental group’s net resource outturn, application of resources and changes in taxpayers’ equity for the financial year.
In preparing the accounts I have complied with the requirements of the Government Financial Reporting Manual (FReM). In particular, I have:
- observed the Accounting Direction issued by HM Treasury, including the relevant accounting and disclosure requirements, and applied suitable accounting policies on a consistent basis
- ensured that I have in place appropriate and reliable systems and procedures to carry out the consolidation process
- made judgements and estimates on a reasonable basis, including those judgements involved in consolidating the accounting information provided by our public bodies
- stated whether applicable accounts standards, as set out in the FReM, have been followed, and disclosed and explained any material departures in the accounts
- prepared the accounts on a going-concern basis
HM Treasury appointed me as the Principal Accounting Officer of the Department for Work and Pensions. I have appointed the chief executive or equivalent as the Accounting Officer for each arm’s length body. The chief executives of each DWP public corporation, whilst not accounting officers, have similar responsibilities. I remain responsible for ensuring that appropriate and reliable systems and controls are in place to ensure that monies paid to our public bodies are used for the purposes intended and that such expenditure and the other income and expenditure of the sponsored bodies are properly accounted for, for the purposes of consolidation within the resource accounts. Under their terms of appointment, the Accounting Officers of the sponsored bodies are accountable for the use, including the regularity and propriety, of the grants received and the other income and expenditure of the sponsored bodies.
I confirm that this Annual Report and Accounts 2022-23 as a whole is fair, balanced and easy to understand. I take personal responsibility for the annual report and accounts and the judgements required for the determining that it is fair, balanced and understandable.
As the Accounting Officer, I have taken all the appropriate steps that I ought to have taken to make myself aware of any relevant audit information and to establish that the auditors are aware of that information. So far as I am aware, there is no relevant audit information of which the auditors are unaware.
The responsibilities of an Accounting Officer, including responsibility for the propriety and regularity of the public finances for which the Accounting Officer is answerable, keeping proper records and safeguarding the assets of the Department for Work and Pensions, are set out in Managing Public Money published by HM Treasury.
Peter Schofield CB
Permanent Secretary
Governance statement
Our Accounting Officer System Statement (AOSS), available on GOV.UK, sets out how the Permanent Secretary, as the Principal Accounting Officer, fulfils his responsibilities. It describes the accountability system in place for all the expenditure of public money through the Department’s Estimate. This includes money made available to certain locally governed organisations, all public money raised as income, major contracts and outsourced services. It also sets out how the Department gains assurance about the satisfactory use of the money.
This governance statement sets out the Department’s governance structure, risk management framework and internal control procedures. It reflects current arrangements and outlines the significant changes made to increase the robustness and efficacy of governance throughout 2022-23. Additionally, it provides assurance which the Permanent Secretary has received from his executive directors, risk management and internal audit colleagues on how the system of control described in the AOSS has operated during the period covered by this statement. It concludes with his assessment of the effectiveness of the system of control and the significant challenges facing the Department.
The system of control
The Department is governed by:
- the Secretary of State’s overall responsibility for the Department and its public bodies
- the Permanent Secretary’s responsibility, both to the Secretary of State and directly to Parliament, as the Accounting Officer for the Department’s expenditure and management, and
- the Departmental Board’s collective responsibility for advice on strategic and operational issues, and for scrutinising and challenging policies and performance
The system of control also includes the Departmental Board sub-committees, the Executive Team and its sub-committees, along with our control framework which is supported by internal and external assurance processes.
There were no Ministerial Directions during 2022-23.
Senior governance boards’ structure
The chart below sets out the structure of our senior boards as at 31 March 2023 and the lines of communication so that issues are escalated to the right audience. This structure and board/sub-committee terms of reference and membership are kept under regular review.
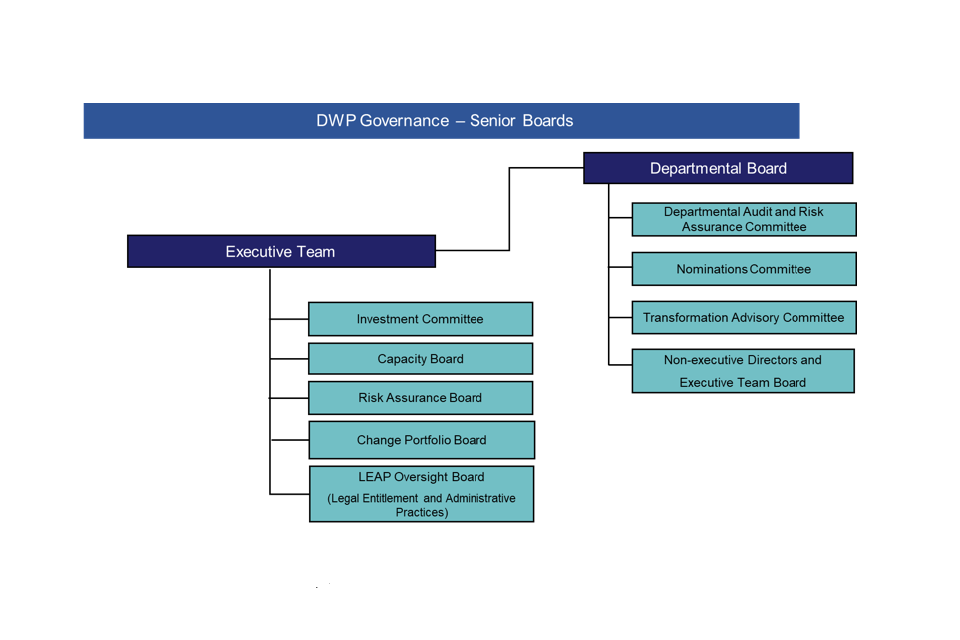
This chart does not include the additional boards that carry out management and assurance functions within the Department but report into the main boards above.
The Departmental Board
The Departmental Board, chaired by the Secretary of State, forms the collective strategic and operational leadership of the Department and brings together the Ministerial Team, the Executive Team and senior non-executive members from outside of government. The board met 3 times during 2022-23 (June and November 2022, and March 2023). The successive ministerial changes between July and October meant that finding suitable diary time for a quarter two board meeting was not possible. However, informal engagement with non-executive members continued, along with the Non-executive Directors and Executive Team Board meetings (see further below). A Board effectiveness evaluation was not conducted during 2022-23. Given the various changes to the Ministerial Team that occurred in 2022-23, an evaluation was not felt to be worthwhile until the current team had attended at least two meetings. An evaluation will take place during the summer of 2023.
The board supports and advises ministers and the Department on strategic issues linked to the development and implementation of the government’s objectives including appropriate oversight of sponsored bodies. It also horizon scans for emerging issues, monitoring performance and overseeing the management of risks, setting the overall strategic direction for the Department in light of ministerial priorities and our Departmental Plan. The board receives a series of regular updates from across departmental business including, for example, updates on the discussions occurring at all senior boards (as per the governance diagram above), reports on the people and resources position and updates on the Department’s risk profile and appetite. The board does not exist to provide policy advice but focuses on getting policy translated into results, giving advice on the overall running of the Department and the operational implications and effectiveness of policy proposals.
The Departmental Board acts in compliance with the Protocol for Enhanced Departmental Boards.
The board agenda supports focussed discussions on key issues, compliant with the principles in ‘Corporate governance in central government departments: code of good practice’. Board members sponsor agenda items and ensure the paperwork meets agreed standards; management information on areas such as performance is cleared by the relevant Senior Civil Servant in advance of meetings. This ensures paperwork is of a similar quality and supports focused discussions on key issues. Following last year’s Board Effectiveness Evaluation, the agenda has tended to feature fewer items, which are shorter and focused on key topical issues such as fiscal planning, departmental risks and key areas of focus for the non-executives.
The Departmental Board has several sub-committees, most of which are chaired by a non-executive board member:
- the Departmental Audit and Risk Assurance Committee provides support to the Accounting Officer on the comprehensiveness and integrity of assurances in the areas of corporate governance, risk management, audit, security, accounting and reporting. During 2022-23, the committee has continued its focus on fraud and error. It has also looked into the ongoing State Pension underpayment challenge including the Home Responsibilities Protection issue.
- the Nominations Committee provides advice on how to identify colleagues with high potential, develop leadership, our incentive scheme and succession planning. During 2022-23 the committee focused on: the Executive Team development and performance, pay remit, workforce planning and deliverability, the People Survey and the cost of living impact on employees.
- the Transformation Advisory Committee provides advice to help optimise customer experience and efficiency in service delivery transformation and through digitisation (mostly within the Service Modernisation Programme). During 2022–23 the committee has worked with colleagues in the programme, Service Excellence, Digital Group and Policy Group to identify key risks and suitable mitigations for transformation delivery. Child Maintenance Group is further along their transformation journey and lessons learned have been discussed by the committee ensuring what has gone well is emulated in other parts of the programme.
- the Non-executive Directors and Executive Team Board is chaired by our Lead non-executive director, with the aim to support strategic, business and financial planning and our business strategy. Along with the Chair, the directors general and other non-executive directors review departmental performance, providing challenge and input to high priority work streams. During 2022-23, the board discussed a wide range of topics, including: the impact of inflation, demand pressures, performance and measures to increase workforce participation. Additionally, the board identified areas of work where the non-executives can provide most value through support and challenge .
In addition, the Serious Case Panel is chaired by a non-executive director. Its purpose is to consider serious systemic issues arising from cases and other insight, impacting on the DWP customer experience and make recommendations to address these issues, in order to reduce the incidence of such cases in future. The panel met quarterly throughout 2022-23.
Department board and committee attendance 2022-23, by member, of meetings eligible to attend
| Ministers | Departmental Board | Departmental Audit and Risk Assurance Committee | Nominations Committee | Transformation Advisory Committee | Non-executive Directors and Executive Team Board |
|---|---|---|---|---|---|
| Number of meetings held | 3 | 5 | 4 | 7 | 3 |
| Rt Hon Mel Stride (MP) | 2/2 | - | - | - | - |
| Tom Pursglove MP | 2/2 | - | - | - | - |
| Laura Trott MP | 2/2 | - | - | - | - |
| Mims Davies MP | 3/3 | - | - | - | - |
| Guy Opperman MP | 3/3 | - | - | - | - |
| Viscount Younger | 1/1 | - | - | - | - |
| Rt Hon Dr Thérèse Coffey MP | 1/1 | - | - | - | - |
| Baroness Stedman-Scott OBE | 2/2 | - | - | - | - |
| Alex Burghart MP | - | - | - | - | - |
| Claire Coutinho MP | - | - | - | - | - |
| Julie Marson MP | - | - | - | - | - |
| Julie Prentis MP | - | - | - | - | - |
| David Rutley MP | 1/1 | - | - | - | - |
| Chloe Smith MP | 1/1 | - | - | - | - |
| Non-executive members | Departmental Board | Departmental Audit and Risk Assurance Committee | Nominations Committee | Transformation Advisory Committee | Non-executive Directors and Executive Team Board |
|---|---|---|---|---|---|
| Nick Markham | 1/1 | - | - | - | 1/1 |
| Ashley Machin | 3/3 | 3/5 | 6/7 | 2/3 | |
| David Holt | 3/3 | 5/5 | 3/3 | ||
| Valerie Hughes-D’Aeth | 3/3 | - | 2/2 | - | 3/3 |
| David Bennett | 2/3 | - | - | - | 3/3 |
| Sally Cheshire | - | 5/5 | - | - | - |
| Ian Wilson | - | 5/5 | - | - | - |
| Keith Burgess | - | - | - | - | - |
| John Clarke | - | - | - | - | - |
| Arabel Bailey | - | - | - | 7/7 | - |
| Simon Sear | - | - | - | 7/7 | - |
| Charlie Steel | 1/1 | - | - | 7/7 | - |
| Tim Nolan | - | 1/2 | - | - | - |
| Revd Prof Gina Radford | 1/1 | - | - | - | - |
| Eleanor Shawcross | - | - | - | - | 1/1 |
| Executives | Departmental Board | Departmental Audit and Risk Assurance Committee | Nominations Committee | Transformation Advisory Committee | Non-executive Directors and Executive Team Board |
|---|---|---|---|---|---|
| Peter Schofield CB | 3/3 | 1/1 | 2/2 | - | 3/3 |
| Debbie Alder CB | 3/3 | - | 2/2 | - | 3/3 |
| Neil Couling CBE | - | - | - | - | 3/3 |
| Simon McKinnon CBE | - | - | - | 6/7 | 3/3 |
| Amanda Reynolds | - | - | - | 6/7 | 3/3 |
| Katie Farrington | - | - | - | - | 2/3 |
| Barbara Bradley | - | - | - | - | 2/2 |
| Catherine Vaughan | 2/2 | 2/2 | - | - | 1/1 |
| Sophie Dean and Katherine Green (jobshare) | - | - | - | - | 1/1 |
| Jonathan Mills | - | - | - | - | 0/1 |
| Karen Gosden | - | - | - | - | 1/1 |
| Kate Davies | - | - | - | - | 1/1 |
| Nick Joicey CB | 1/1 | 2/2 | - | - | 1/1 |
The Executive Team
The Executive Team is the senior decision-making body for departmental management and corporate leadership, ensuring that the Department is fully aligned with the government’s priorities and oversees the delivery of its outcomes.
2022-23 brought numerous challenges, particularly regarding the delivery of the Departmental Plan. The economic outlook worsened, and inflationary pressures significantly increased which, along with a changing labour market, meant the demand for some of our services rose significantly. Our Ministerial Team also underwent a number of changes between July and October 2022.
The Executive Team steered the Department’s response to the cost of living challenges, ensuring timely financial support was delivered to our customers (which will continue into the next year), along with additional support for our people. It also reviewed and provided steers on the Department’s risks and mitigations against potentially disruptive events such as industrial action and compromised winter energy security.
Furthermore, the Executive Team has driven forward the Department’s contribution to major initiatives and ministerial priorities: in particular, delivering on our Autumn Statement commitments to increase labour market participation and (under the Efficiency and Savings Review) set priorities over the current Spending Review period to maximise overall deliverability whilst living within our means. Much of the Executive Team’s time during the latter part of 2022-23 was spent considering the deliverability of the package ahead of the Spring Budget.
The Executive Team also continued to look to the future, steering the work on the Department’s business strategy to 2025 and then to 2030. This articulates the overall vision and approach for the Department’s transformation activities to help inform investment, design and delivery decisions - focusing on the need to protect service transformation and emphasising that investment in service modernisation is key to delivering a sustainable service for the benefit of customers and taxpayers.
There are several sub-committees of the Executive Team:
- the Investment Committee (IC) provides a senior line of assurance on the Department’s key projects and programmes and oversight of the Department’s in-year financial position and multi-year plans. It is chaired by the Director General, Finance and supported by senior representatives from all areas of our business. The committee reviews and scrutinises business cases against the government’s framework and guidance on options appraisal, the Green Book (available on GOV.UK). This year IC has considered business cases which support the transformation of our organisation such as Service Modernisation and the Synergy Programme, as well as programmes that support the delivery of the Department’s policy priorities such as Help to Claim and the Household Support Fund. In addition, IC has also provided scrutiny on programmes focusing on reducing fraud, error and debt, and labour market initiatives such as Additional Work Coach Time to support Healthy Journeys and In Work Progression. In 2022-23, to strengthen our investment appraisal process, IC implemented a new Business Case Early Advice Panel, which provides support and guidance to projects, ahead of their business case being scrutinised by IC, on the underpinning analysis, methodological approach and evaluation.
- the Capacity Board is chaired by the Director General, People, Capability and Place and is held on a monthly basis. It provides governance around people resourcing decisions, outsourcing and engagement on the affordability and management of departmental supply and demand to help improve the Department’s forecasting for existing and future workforce. Throughout 2022-23, the board provided oversight on the process for recruitment and training, considering the Department’s overall strategic objective to consolidate, right-size and improve its estate, while also remaining informed on the possible implications on the Department’s benefit delivery services. This was particularly the case for longer term permanent recruitment plans for fixed term appointments. Over the year, the board continued to review the workforce plans for service delivery and functions, monitoring any changes in the levels of turnover, attrition and supply. The board also monitors monthly progress against apprenticeship targets and is rigorous in ensuring the Department continues to place apprenticeships at the heart of long-term capability build, while also galvanising support for apprenticeships across the organisation. Furthermore, the board provided support for the work on diversity and inclusion and sought to raise the profile of this work across the Department.
- the Risk Assurance Board (RAB) is a formal sub-committee of the Executive Team and is chaired by the Chief Risk Officer. During 2022-23, RAB has reviewed and monitored the Department’s significant risk themes, assessing the impact of new and emerging challenges and seeking assurance on the effectiveness of risk management plans to deliver the reductions in risks that we expect. Senior responsible risk owners have attended RAB meetings to assist with the assessment of these risks and the robustness of plans to manage them. Through regular scrutiny during the year, RAB has provided assurance to the Executive Team and the Departmental Audit and Risk Assurance Committee that risks are being effectively and proportionately managed within each director general area and across the whole organisation.
- the Change Portfolio Board (CPB) is chaired by the Director General, Change and Resilience and has oversight of all change activity within the Department. CPB provides assurance to the Executive Team about the deliverability of the overall departmental change portfolio and confirming that the planned changes are meeting financial parameters and are successfully progressing. The board has close links with the Investment Committee by supporting the evaluation of the deliverability of proposed new programmes prior to them being accepted and moving over to the Change Portfolio. During 2022-2023, CPB continued to have a strong focus on delivery, deliverability and stability of plans. A number of quarterly scrutiny sessions have been completed to monitor and respond to performance and risk across the portfolio. CPB also received an update on a review of all in-year and whole-life financial variances of tolerance. CPB was assured that plans are in place to address in year variances and recognised variances against whole life numbers are being addressed through business case updates.
- the LEAP Oversight Board (Legal Entitlement Administrative Practice) is chaired by the Director General, Finance and has oversight of all LEAP and corrective activity within the Department, via well-established data sets. A board-approved comprehensive LEAP document and senior responsible owner (SRO) guide help ensure strengthened governance in this area, ensuring lessons learned are acted upon. The board has appointed an SRO for each LEAP exercise who has overall responsibility for ensuring the delivery of their LEAP exercise to meet the Department’s responsibilities. The board provides advice and assurance, often referring to lessons learned, to SROs, policy colleagues working on new LEAPs and strategic finance colleagues with ownership of the HM Treasury engagement. For further detail please refer to the Performance report LEAP section.
Outside formal governance, the Executive Team has a Shadow Board, consisting of staff from all grades below the Senior Civil Service currently working within the Department. This is a forum for colleagues to lend diverse voices and thinking to challenge, scrutinise and inform the Executive Team’s decision making on some of the biggest issues facing the Department. The Shadow Board is a commitment by the Executive Team to listen and act upon feedback from different colleagues when making decisions. The board members meet at least monthly to discuss items that will be going to the Executive Team. Representatives from the board then join the relevant Executive Team meeting to offer their feedback. During 2022-23, Shadow Board members made notable contributions to the Executive Team’s discussions, bringing their first-hand experience to bear on topics such as service delivery pressures, ensuring safer customer interactions, diversity and inclusion, and provided additional insight on the People Survey results. The Shadow Board also plays an important role in communicating its work, and that of the Executive Team, across the Department.
Annually managed expenditure
The Department jointly manages its annually managed expenditure (AME) with HM Treasury. HM Treasury is involved in all decisions involving DWP AME spend as the Department, while being responsible for the spend, has no delegated authority and we also meet regularly throughout the year to monitor AME spend and its trajectory against the welfare cap.
The welfare cap, assessed by the Office for Budget Responsibility, is designed to ensure that AME expenditure on designated aspects of spending is contained within a predetermined cap and margin. The current cap, reset at Autumn Budget 2021, applies in 2024-25 with the next formal assessment being based on the forecast at the first fiscal event of the next Parliament. At Spring Budget 2023, we saw that expenditure subject to the welfare cap is forecast to be £4.1 billion above the cap plus margin in 2024-25.
Within the Department:
- the Director General, Finance holds executive level accountability for AME controls, including that the Department secures the necessary HM Treasury spending approvals outside of fiscal events
- the Director General, Labour Market Policy and Implementation holds executive level accountability around the welfare cap, monitoring longer term risks to AME spend and overseeing fiscal event processes
They are supported in this role by the internal AME Board, and by the Senior Welfare AME Group, which has membership from within the Department and HM Treasury. Both boards are chaired by the Director General, Labour Market Policy and Implementation. The groups oversee all departmental activity related to management of AME spend, including the monitoring of all risk to AME spend. We recognise liabilities in relation to benefit expenditure for reasons such as judicial reviews, legal cases and appeals as provisions.
Change governance
Prospective new programmes and projects are routed through a single gateway. We assess and classify these initiatives using key characteristics such as value, risk and complexity. This helps to provide a pipeline view of change across the Department as well as ensure a proportionate level of scrutiny and approvals is applied. A comprehensive consultation process for more significant changes, involving colleagues from across the Department, also ensures initiatives are accurately assessed for deliverability and alignment with the department’s strategic plans and priorities.
Significant projects or programmes on the Department’s Change Portfolio will have a formal senior responsible owner appointed who is supported by a formal programme board. Each programme board member has clear accountabilities with appropriate authority. They provide assurance to the Investment Committee, Change Portfolio Board and their own director general on compliance with departmental guidance and deliverability of the project. The Change Portfolio Board also oversees the Department’s single view of change and assures progress and deliverability of the portfolio, on behalf of the Executive Team. We’ve also been able to draw on colleagues across the Department, who assess how deliverable new proposals are and are skilled in providing an assessment from a variety of different lenses, to inform decision-making.
The accountabilities of senior responsible owners are formally delegated through appointment letters issued by the Permanent Secretary. If the project or programme is part of the Government’s Major Projects Portfolio (GMPP) the formal appointment letter is jointly issued by the Permanent Secretary and the Chief Executive of the Infrastructure and Projects Authority (published on www.gov.uk. We currently have 6 programmes on the GMPP: Universal Credit, Health Transformation, Service Modernisation, Workplace Transformation, Pensions Dashboard (delivered by Money and Pensions Service), and the Building Safety Regulator (delivered by Health and Safety Executive programmes). In addition, the Permanent Secretary provides Accounting Officer oversight for Synergy – a GMPP programme that sits outside the Department but serves 4 government departments.
We continue to work closely with the Infrastructure and Projects Authority and HM Treasury who provide independent assurance of our GMPP projects and programmes, including potential new programmes.
Functional Standards
Functional standards exist to create a coherent, effective and mutually understood way of doing business within government organisations. These standards are mandated for use across central government and provide a stable basis for assurance, risk management and capability improvement, supporting value for money for the taxpayer.
A function is a grouping aligned across government to manage functional work such as human resources, commercial or finance. The Department has 12 functions that operate in accordance with the functional standards. We continue to work closely with the Cabinet Office to review standards whilst we work towards a level of compliance that fits with the purpose of the organisation. The head of each function is responsible for assessing the function against the standards and to have maturity action plans in place to ensure continuous improvement, providing assurance to the Department’s Accounting Officer. During 2022-23 we’ve undertaken a coordinated delivery functional round table with our heads of function and their counterparts at the centre of government, including a discussion focused on standards for each of our functions.
Risk management
Our risk management strategy and framework set out the Executive Team’s risk appetite and tolerance to inform all decision-making and investment choices. The strategy and framework ensure that our people follow a single process for identifying and managing risks that may threaten delivery of services and achievement of objectives. The risk management strategy and framework align with the overarching principles of HM Treasury’s Orange Book, ISO 31000 Risk Management Principles and Guidelines and the UK Corporate Governance Code.
Our system of internal control is based on the ‘Three Lines Model’ (see below) which illustrates the structures and processes that assist the achievement of objectives and facilitate effective governance and risk management.
Three Lines Model
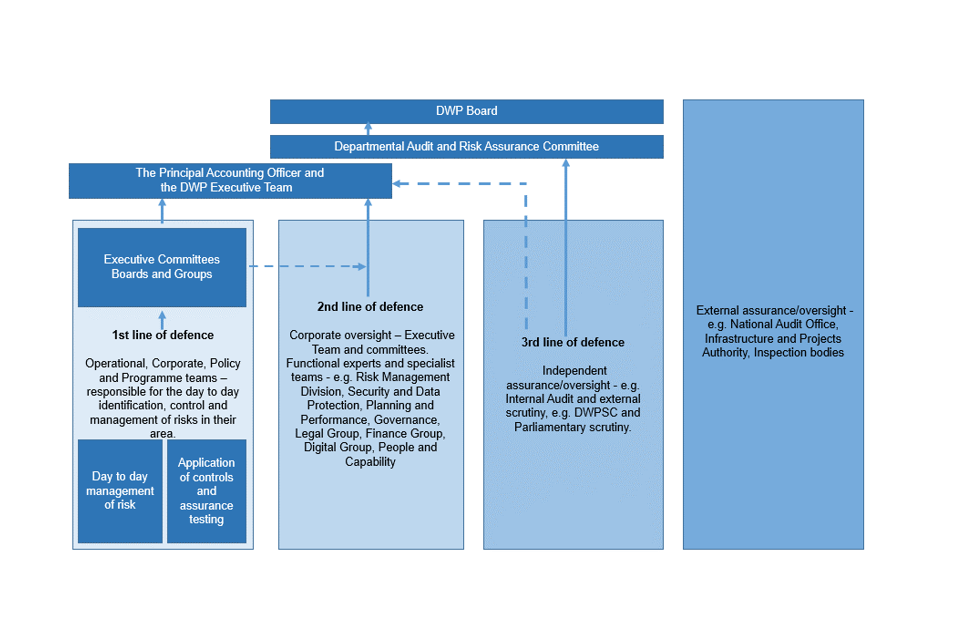
The Principal Accounting Officer has overall responsibility for our risk management strategy and framework with Executive Team owners assigned to and accountable for each of the Department’s principal risks to the delivery of its objectives.
The Chief Risk Officer supports the Accounting Officer and the Executive Team to ensure senior sponsorship for effective risk management at the executive level and across departmental forums including the Risk Assurance Board and the Departmental Audit and Risk Assurance Committee. We routinely report principal risks to these forums to verify, review and challenge the way that we’re managing significant risks that could have the greatest impact on the work of the Department.
We hold regular risk sessions with the Executive Team to specifically focus on setting the principal risks for the coming year. This ensures that the risk profile continues to reflect the priorities set out in the Outcome Delivery Plan, strategic changes and challenges in the operating environment. The progress and effectiveness of plans to manage these risks are routinely subject to scrutiny and review by the Executive Team throughout the year.
During 2022-23 the risk sessions have focused on identifying the aggregate, dependent nature of risks and the significant impacts of external, global developments. We’ve focused on maturing our approach to risk management including introducing new ways of presenting risk information to support ongoing improvements.
Focusing on continuous improvement throughout the year, the Chief Risk Officer has led the corporate risk management function to provide expertise, support, monitoring and assurance on the management of risk. This has included the development, implementation and continuous improvement of effective risk management practices and behaviours. During 2022-23 we’ve completed a maturity assessment and established a baseline that illustrates improvements in the Department’s risk management capability.
Our public bodies are responsible for their own risk management, with internal board oversight. Work is ongoing to ensure that escalation routes from public bodies to the Department are working effectively to enable the Executive Team to have visibility of cross-cutting risks. Our arm’s length bodies partnership division manages assurance assessments for these organisations using a tailored, risk-based approach which is proportionate and flexible enough to react to external factors. We’re reviewing these arrangements and will refer to central guidance on risk control frameworks which we will seek to deploy.
In 2023-24 we will continue to support the embedding of an effective risk management culture across the Department, sharing good practice and verifying identification and management of new and existing risks. Continued uncertainty driven by external factors at home and abroad, means we continue to operate in a rapidly changing environment. A shared understanding and early consideration of risks will be essential to ensure we understand the levels of risk we need to manage and their combined, dependent impacts.
Security and information management
Departmental security is managed and overseen by the Chief Security Officer (CSO), who reports to the Director General, Finance and is a standing member of the Departmental Audit and Risk Assurance Committee.
The CSO also attends the Executive Team discussions on a quarterly basis, to provide progress updates on our agreed set of security priorities. We’ve focussed on 5 key areas, which have been endorsed by our Executive Team, to improve our departmental security further.
The 5 priority areas are:
- security operating model: we’re developing the security operating model to outline how the security outcomes support the Department’s strategic objectives. It will reduce duplication of security activities and help focus security on the most impactful work
- cyber visibility and control: we’re driving activity to automate, where appropriate, our cyber response to better utilise cyber security controls
- malware protections: we’re improving security controls for threat protection, monitoring and tracking using relevant workshops and tailored exercises to support malware detection and protection activity
- improved personnel control: we’re improving internal processes to initiate applications for national security vetting and make case decisions through new technologies and training. We’re driving ongoing work to evaluate and strengthen security access controls through capabilities, guidance, upskilling and alignment of processes and policies
- Physical Security: we’re moving to a risk driven approach to protect our estate and people, recognising the convergence of physical and cyber security. A major programme of work is underway to enhance our security controls to mitigate threats and reduce risk. Enhanced access control, CCTV and intrusion detection will complement existing controls in preventing both security and health and safety incidents
The CSO continues to support and drive forward a rolling security education and awareness programme for all our people and contractors providing an education and awareness centre of excellence to the rest of government. All of our security education and awareness activity focuses on areas where the greatest risks have been identified.
We have introduced an impartial DWP Security Assurance function that provides certainty through evidence and brings confidence that risks are effectively managed, systems are working as designed and security controls are meeting their target outcomes in support of departmental objectives.
During 2022-23, the Data Protection Officer reported 13 incidents to the Information Commissioner’s Office (ICO).
In April 2022, the ICO completed and published details of its audit into the Child Maintenance Service, concluding that there was a reasonable level of assurance that processes and procedures were in place and delivering data protection compliance. In addition, the Department participated in the ICO’s investigation into the use of Artificial Intelligence and Algorithms in the Welfare System. The ICO found that there was no evidence to suggest that people in the benefits and welfare system are subjected to any undue harm or financial detriment as a result of the algorithms used. In addition, the ICO found that there was sufficient and meaningful human involvement in the processes examined.
In 2022-23 the Department’s performance in completing and returning Subject Access Requests (SARs) to customers fell below the levels of previous years. On average only around 75% of SARs were completed on time across the year and performance fluctuated significantly month on month. Greater consistency and an overall improvement have been demonstrated in recent months. This now needs to be sustained through process improvements. The ICO continue to monitor the issue.
In March 2023 the ICO issued a practice recommendation in relation to Freedom of Information (FOI) practices as a result of what it described as ‘a consistently poor level of performance in terms of its request handling’. The Department has been directed by the Practice recommendation to address a number of areas including staff training and the conduct of internal reviews by 23 June 2023. A consensual audit by the ICO of the Department’s FOI practices is likely to follow.
The Department’s security has again continued to increase as measured through the Departmental Security Health Check and compliance with minimum government security standards. While most of those standards are met, there is still work to do to meet all of them. The Security Assessment Framework also reflects assessment of improved governance, policies, processes and technology.
In March 2023, the CSO provided the Departmental Audit and Risk Assurance Committee non-executive directors (NEDs) and non-executive members (NEMs) an in-depth session on the Department’s security.
Commercial and contract management
Our Commercial Directorate benefits from a clearly articulated Commercial Strategy providing a roadmap for the delivery of its strategic objective workstreams for the period up to 2025. It outlines how Commercial Directorate will operate as a Commercial function, enabling the Department to meet its priorities as well as delivery against the Government Commercial Function (GCF) standards and Commercial Directorate’s Government Commercial Organisation framework.
During 2022-23, we introduced a new operating model which is better aligned to key departmental functions, thereby helping stronger collaborative working relationships. The operating model has been designed to help increase its influence earlier in departmental decision making and support our commercial colleagues in focusing on new priorities where it expects to deliver best value within the Department and across government. The operating model will continue to deliver end-to-end category management, providing clear lines of ownership and accountability through the full commercial lifecycle. The implementation of this operating model structure has been a significant step in our journey and continues to be a key enabler for delivery of our most important workstreams.
Commercial controls
We’ve used our internal assurance programme and the improved policy compliance this brings to secure a more proportionate external controls regime.
We’ve increased our ratings assessed against the GCF Commercial Continuous Improvement Assessment Framework (CCIAF), with cross-government peers endorsing our improved ratings.
We’ve robust assurance mechanisms that span the full commercial lifecycle, challenging and approving all procurements more than £100,000 at multiple points. We have additional internal and external controls in place depending on the value and risk. During 2022-23, we had no contract approvals rejected.
The new Cabinet Office spend controls introduced with effect from 1 February 2023, have given the Department additional ‘earned autonomy’ with a further delegated authority up to £50 million.
During 2022-23, we secured a proposal to increase the Department’s ministerial contract approval thresholds from £5 million to £10 million (Minister for Lords) and £5 million to £50 million (Secretary of State). This reflects our historically high level of compliance with controls and past performance.
All revised thresholds are predicated on the Department providing full transparency of any commercial transactions over £10 million to the Cabinet Office and ministers, providing opportunity to control any spend above this threshold should they wish to do so. We will conduct a series of independent second line assurance reviews throughout 2023-24 to ensure our continued compliance and to ensure we continue to benefit from this additional earned autonomy.
Key to continued effective management of our supply chain are our Contract Management Capability Programme (CMCP) and Supplier Relationship Management (SRM) programmes:
- this year’s Commercial Blueprint discussed the need for further support for the CMCP, to ensure that all contract managers achieved their accreditation by March 2023. We not only achieved accreditation but exceeded our civil service targets
- we’ve strengthened our SRM capability, improving proactive oversight of supply chain risk at commercial senior leadership team and beyond and are including cross category supplier views in new director general conversations, further strengthening commercial and operational relationships using SRM techniques
Assurance covering grants
The Director General, Finance, has overall responsibility for providing assurance that financial controls are sufficient to mitigate financial risks in all areas including grants. A senior functional lead assures on all aspects of grants, including ensuring compliance with the Government Functional Standard for Grants and the Global Design Principles.
We award grants to a range of organisations across different sectors, to help achieve delivery of departmental objectives. Examples include Help to Claim, Household Support Fund and Flexible Support Fund schemes.
We have a comprehensive grants framework that provides guidance on the end-to-end process for grants. This content has been enhanced by incorporating links to the Cabinet Office’s Government Functional Standard for Grants. For schemes that are high-risk, novel, contentious or repercussive, we use the Cabinet Office’s Complex Grants Advice Panel (CGAP).
The Department’s Grants Approval Board, chaired by the Department’s Senior Functional Lead for grants, is well established. The board has responsibility for ensuring that new schemes and grant extensions, equal to or above £100,000, reflect best practice and are compliant with the Government Functional Standard for Grants and the 4 accounting officer standards of regularity, propriety, value for money and feasibility. The board ensures that grant owners demonstrate how all aspects of the functional standard are met before a scheme is approved.
To underpin the Functional Standard for Grants, the Cabinet Office has produced a maturity matrix which includes 258 compliance indicators. The indicators are rated as “Good”, “Better” and “Best” practice. Departments are required to self-assess their compliance with all indicators. The last self-assessment validated by the Government Internal Audit Agency was completed in February 2022 and concluded that the Department had improved year-on-year from 53% to 64%.
Supplementing this, in May 2022 the Cabinet Office undertook a current state assessment against the Functional Standards for Grants and reported that there were high levels of confidence in the existing grants expert domain, particularly in the areas of leadership and governance. Areas identified for further improvement mirrored the self-assessment, with risk management and ensuring appropriate training for all grant administrators, is being undertaken.
Following both reviews, we implemented a comprehensive continuous improvement plan. To ensure continuous improvement, a further self-assessment is planned later in 2023.
Assurance about the operation of the system of control
Assurance from executives
The Accounting Officer issues a formal letter to each director general setting out their delegated accountabilities and authority. The Executive Team has responsibility for delivery of their shared team objectives, supporting the delivery of departmental strategic objectives and they review their collective delivery of these on a quarterly basis.
During 2022-23, each director general provided the Accounting Officer with a letter of assurance covering the full reporting year. Letters of assurance provide an assessment of the effectiveness of the internal controls that support delivery of business objectives and departmental policies. To support this process, we continue to embed a second line of defence risk and control assessment process to evidence the effectiveness of risk management and controls within each group. See our 3 lines model.
The Accounting Officer is satisfied that, collectively, his directors general effectively manage the governance and internal control structures within the businesses they lead and that he can rely on them to manage risks within their business. The directors general have identified several challenges this year which they are managing effectively within their teams. These include but are not restricted to:
- our people: industrial relations, recruitment, and capability
- funding pressures: delivering more for less
- quality: including State Pension underpayment and arrears of work in Pension Credit and Attendance Allowance new claims
Assurances covering our public bodies
For 2022-23 the Director General, Disability, Health and Pensions provided assurance on the governance and control arrangements for the public bodies which deliver outcomes on our behalf. Our arm’s length bodies partnership division is responsible for holding our public bodies to account and ensuring that they work to the high standards expected of them. We have a range of oversight activity in place to provide assurance that each body is working effectively through robust governance arrangements. These include a range of standard financial control measures including a quarterly performance dashboard, which reports on delivery, finance, risks and change.
The annual assurance assessment of our public bodies complements our ongoing engagement and assurance activity, including our quarterly accountability reviews with the bodies, our attendance at the bodies’ audit and risk committees and ongoing senior day to day engagement with the bodies. This ensures that we have proportionate oversight and understanding of the risks and opportunities that our bodies present to the Department. We also bring together relevant leads from all our bodies to share their experience and challenges through senior leadership, risk committee chairs, HR, digital, security and data, communication, commercial and finance forums. We’re arranging our first project delivery and remuneration committee chairs forums for summer 2023.
Our risk management approach is written into the framework documents that govern our relationship with our bodies. Each of the public bodies is responsible for identifying their own risks and risk management is overseen by their audit and risk assurance committees. Our Arm’s Length Bodies Partnership Division reviews risks as part of the quarterly accountability review process. Our oversight arrangements support the performance of each body, enhance the protection given to the Permanent Secretary as Principal Accounting Officer and assure the Departmental Board, the Executive Team and the Departmental Audit and Risk Assurance Committee that we have a good overview of our public bodies and meet HM Treasury and Cabinet Office expectations of assurance. Our financial assurance control team undertake a finance health check, which is another method we can use for reviewing the way our public bodies operate against the Government Functional Standard for Finance.
The latest Cabinet Office guidance on conducting reviews of non-departmental public bodies stipulates that attention should be focused on the 4 quadrants of efficacy, efficiency, governance and accountability. The reviews for the Pension Protection Fund and the Health and Safety Executive were completed with this focus during 2022-23. The latter is awaiting clearance, but publication is anticipated to happen in May. The post implementation review of the Office for Nuclear Regulation, undertaken jointly with the then Department for Business, Energy and Industrial Strategy, was published in May 2022.
Our centralised public appointments team, within the Arm’s Length Bodies Partnership Division, conducts all our recruitment for our bodies’ public appointments exercises (typically chairs and non-executive directors). The team collates statistics and information from each recruitment campaign to enable the Permanent Secretary to provide formal annual assurance to the Commissioner for Public Appointments that all public appointments made by our ministers are fully compliant with the Cabinet Office governance code on public appointments. All public body appointments activity for 2022-23 is listed below.
| Public body | New appointment (up to 5 years) | Reappointment (up to 5 years) | Extension (up to 12 months) |
|---|---|---|---|
| Health and Safety Executive | Non-executive director Chyrel Brown David Coats |
||
| Money and Pensions Service | Chair Sara Weller Non-executive director Simon Hamilton Monica Kalia Marlene Shiels Sara Weller |
Non-executive director Ann Harris |
|
| Industrial Injuries Advisory Council | Member Dr Richard Heron Dr Sharon Stevelink Dr Sally Hemming Dr Steve Mitchell |
Chair Dr Lesley Rushton |
|
| Social Security Advisory Committee | Member Philip Jones |
Member Oluseyi Obakin |
|
| The Pensions Ombudsman | Ombudsman Dominic Harris Deputy Pensions Ombudsman Anthony Arter |
||
| The Pensions Regulator | Non-executive director Mandy Clarke George Walker Alison Hatcher |
Non-executive director Kirstin Baker |
|
| The Office for Nuclear Regulation | Non-executive director Dame Sue Gray |
Assurance from other sources
The National Audit Office (NAO) undertook value for money (VFM) studies and cross-government investigations during the year. Specific to the Department they undertook two VFM studies: The Restart scheme for long-term unemployed people and The Health and Transformation Programme. Examples of cross-government reports include Government Shared Services and Developing Workforce Skills for a Stronger Economy.
NAO’s reports are presented to Parliament. The Public Accounts Committee (PAC) may hold an inquiry on the NAO reports and invite the Department to answer questions on it. PAC will produce its own report with recommendations and the Department responds to these through a Treasury Minute. During 2022-23, the Department attended 4 PAC oral evidence sessions. NAO reports on the Department are available at: www.nao.org.uk
To support the Department’s portfolio of change, the Infrastructure and Projects Authority (IPA) undertook 6 independent reviews of our Government Major Programmes Portfolio (GMPP) programmes during 2022-23. These reviews provided assurance and recommendations for improvements to support government objectives and in the case of the Money and Pensions Service, contributed to a ministerial reset of the pensions dashboards programme. These programmes have ongoing engagement with the IPA, systematically providing updates against their delivery confidence recommendations. Information on the IPA assessment of our GMPP programmes can be found in the IPA transparency report at www.gov.uk
Assurance opinion of the DWP Group Chief Internal Auditor
Our Group Chief Internal Auditor (GCIA) provides independent assurance to our Permanent Secretary and the Departmental Board (via the Departmental Audit and Risk Assurance Committee – DARAC). The assurance opinion is derived from a risk-based plan of work which has been agreed with the Executive Team and approved by DARAC, together with the GCIA’s wider knowledge of the business and other assurance provision. As with prior years, there were some changes to the planned programme of work during the year to ensure that it remained aligned to the changing risk landscape.
The GCIA has provided “moderate” assurance on the Department’s governance, risk management and control framework in 2022-23. During the year, the Department maintained a broadly effective control environment, building on improvements in recent years. A similar proportion of assurance reviews concluded with a substantial, moderate, or limited audit opinion in both 2022-23 and 2021-22. We found both areas of good practice and areas for improvement.
Service Delivery
The Department has continued to return to business-as-usual activities, increasing face-to-face interventions in jobcentres and addressing arrears of work resulting from COVID-19 impacts. This has been a challenging time for service delivery areas as they try to address capacity issues, balancing the increasing demand for DWP services with capacity and capability pressures. Building capability of new staff is also an area of focus for many product lines and we made a number of recommendations for product lines to continue to develop and embed processes to consolidate learning and further develop skills and experience of staff.
Our work confirmed that the labour market regime is working effectively in jobcentres for Universal Credit Intensive Work Search claimants which make up most claimants. We highlighted that there is a need to review guidance and procedures to enhance navigation for Work Coaches who support working age claimants. Resources and resilience of staff also need to be reviewed to ensure service continuity to customers.
Fraud and Error
Our audit approach recognises the significant risk from fraud and error. The Departments strategy to implement “Fighting Fraud in the Welfare System” has the central theme of moving from a detect and correct approach, to a prevent control framework. The Department is also in the process of setting targets for the reduction in fraud and error for benefits.
As at March 2023, there are 9 live Legal Entitlements and Administrative Practices (LEAP) exercises active across the Department, with a further 11 confirmed exercises in the planning stage. Our review of lessons learned from previous LEAP exercises confirmed that all major LEAP exercises that have concluded post-November 2021 have undertaken and shared formal lessons learned.
For State Pensions, the current LEAP exercise has led to improvements in controls to mitigate the causes of error (for example, on spouse’s, widow’s and widower’s entitlements). The evidence we have seen would suggest the risk of significant error persisting within the wider caseload is low, but that effective controls will need to be built into Get Your State Pension to provide greater assurance.
Transformation
The size and complexity of the DWP Change Portfolio remains a significant challenge in terms of delivery for the Department and the impact of addressing new measures announced in the Autumn and Spring Budget statements will add further Projects/Programmes that will need to be delivered.
Overall, we have seen significant improvements in the embedding, and maturity, of portfolio management controls, and culture throughout 2022-23, including more collective discussions on a portfolio rather than individual programmes.
Work to identify the totality of change that needs to be absorbed across operational delivery areas has highlighted that more change is planned to be delivered than can be absorbed by operational staff. The Department needs to develop a prioritisation mechanism to support the continued management of Portfolio and Programme outcomes and enable more flexibility in managing additions to the Change Portfolio. Greater visibility of benefits at the portfolio level would also support prioritisation discussions based on the relative level of benefits.
Digital
The Department is focused on building upon improvements and strengthening the control framework in digital functions. This includes ongoing strategic programmes and regular internal audit and DWP reviews to enhance the Department’s cyber security. The approach recognises the need for alignment of digital with business strategy and more effective management of programmes and initiatives.
On data management and exploitation, efforts have been made to improve data quality, develop a data strategy and establish a governance structure. However, challenges related to data analysis, leadership and skills exist, indicating room for further improvement, some of which are being considered by the Strategic Data Board.
Audits covering Data Management and Artificial Intelligence (AI) showed both good practice and development needs. We found that whilst the development of the Data Strategy and the associated governance structure and processes are progressing well, opportunity remains for further improvement. There is a draft AI strategy, which includes the opportunities the Department want to explore with AI, but the Department should communicate a definition of AI and indicative characteristics internally which are sufficiently detailed to avoid ambiguity for what falls into scope. Cross-government Government Internal Audit Agency reports in these two areas show collaboration efforts across departments to address common challenges and improve practices.
Security
We found that work is well underway to develop the Security Strategy and Security Operating Model (SOM), and our review of documentation and interviews with the SOM management team demonstrated good progress so far for defining and delivering the SOM. There are still some areas that require further consideration before the SOM can be fully implemented - the governance structures outlined in the SOM documentation have not yet been formally agreed and it is not clear how the SOM fully maps to the Security Strategic objectives.
Core Controls
On financial forecasting, the Department has worked hard to strengthen governance structures and processes introducing guidance covering key roles and responsibilities and a working day timetable for sign-off of the forecast. We recommended further improvements, considering that the Department still experiences significant changes in forecasts throughout the financial year. We identified the need for significant control improvements in the following areas:
- on Purchase to Pay – Two Way Exception policy – non-compliance with the policy in some areas.
- on the Digital Specialist and Programmes Framework – roles and responsibilities not defined adequately to balance operational needs and the effective use of the framework.
- on the Joiners, Movers and Leavers Transformation Project – gaps in project governance and the deferment of Movers and Leavers to the new shared services (Synergy) Programme.
- on special customer records – progress to identify the control gaps we identified in 2021-22 had been slower than expected, including on clarifying accountabilities and the need to undertake a comprehensive risk assessment.
Analytical Models Management
We continue to use a quality assurance framework that is embedded in our processes which covers our business-critical analytical models. Our lead analysts are accountable for the quality of the models and forecasts in their area, and we continue to develop and provide best practice guidance and training to all staff developing models. The Department has a list of analytical business critical models (BCMs) which are owned by the analytical community and includes information on quality assurance, ownership and impact. The Department is currently expanding this BCM list to include models owned by the Finance Group, in line with NAO recommendations.
Our Policy Costings Scrutiny Committee and DEL Scrutiny Committee, scrutinise the different aspects of costings for each fiscal event. The Office for Budget Responsibility (OBR) examine our forecasts and costings for all benefits. We work closely with the OBR, liaising with them throughout the year on the key changes and issues ahead of the next fiscal event. This ensures their views on the economy and/or best practice are accurately and fully reflected in these models. After each fiscal event we conduct lessons learned exercises to identify what works, and areas we can improve on in the future. We also continue to oversee a programme of development activity to the process of producing resource forecasts, including the development of new modelling capability to provide enhanced scenario functionality.
Shared Services Connected Ltd
Shared Services Connected Ltd (SSCL) was created as a joint venture in 2013 to provide shared finance, HR and procurement services to the public sector, including DWP. To facilitate service delivery, SSCL is also responsible for the management of the Department’s Single Operating Platform System, including its data, hosting, infrastructure management support, application management support, service management and performance management.
The current contract is due to expire in October 2023. Pending implementation of the Shared Services Strategy for Government, the Department has extended the contract for two years in accordance with Public Contracts Regulations 2015 Regulation 72(1)(e). A Prior Information Notice to commence pre-market engagement for a replacement business process service was issued on 5 May 2023.
Cabinet Office Government Business Services (GBS) is responsible for the Memorandum of Agreement for shared services between the Cabinet Office, which is the Framework Authority, and the departments. They provide an annual letter of assurance to all customers based upon the overall SSCL audit and assurance programme.
The letter of assurance covers SSCL shared service provision to the Department and incorporates content from various sources in relation to the 2022-23 Annual Audit Plan. GBS has summarised the findings in the 2022-23 letter of assurance dated 24 May 2023 as follows:
- the Government Internal Audit Agency completed 5 thematic audits across Framework Authority clients and has provided a limited opinion. The opinion is largely influenced by 1 theme that is not relevant to the Department, and by a view of co-ordination at framework level rather than within departments. The remaining findings provide the Department with sufficient assurance of the effectiveness of the controls employed by SSCL that were examined in the year.
- Pricewaterhouse Coopers LLP (PwC) completed eight reviews in SSCL and has provided limited assurance for the areas reviewed. Three reviews did not relate to the Department and there are no DWP specific findings in the remainder. In addition, PwC conducted an annual International Standard on Assurance Engagement (ISAE) 3402 audit of 237 control activities and found an overall reduction in control exceptions. The findings on each of the control objectives tested enables the Department to be assured that there is no material impact on our operations.
There were no rectification plans required during the 2022-23 audit period.
Whistleblowing
The Department and the Government Internal Audit Agency (GIAA) regard whistleblowing as a high priority and will continue to collaborate to raise standards to prevent misconduct and rigorously investigate and take prompt action when alleged wrongdoing is reported. The GIAA has continued, and will continue, to act as a trusted, independent recipient of whistleblowing concerns in the Department, but it is important that our employees have a choice over where to take their concerns, including externally to the Civil Service Commission or the Comptroller and Auditor General at the National Audit Office.
In 2022-23, further efforts were made to ensure all our employees were aware of the behavioural standards expected of them and encourage them to speak up if they experienced, witnessed or heard about any alleged wrongdoing. We communicated with employees about this individually by email and ran a dedicated ‘Speak Up Week’ from 7-11 November 2022.
As a result, awareness of whistleblowing in the Department is high. Results from DWP’s People Survey 2022 showed 91% of our employees understand the standards set out in the Civil Service Code, 76% understand how to raise a concern and 72% are confident that if they raised a concern, it would be thoroughly investigated.
The number of whistleblowing cases registered as at 31 March 2023 was 51, which was consistent with the previous year. Once outstanding investigations have been completed and, where necessary, consequences decided, anonymous details of these cases will be reported to the Cabinet Office at a time to be appointed in the summer.
Permanent Secretary’s assessment of the system of control and the significant challenges for 2023-24
Following in-year discussions with my Executive Team, Chief Risk Officer, Group Chief Internal Auditor, and assurances I have received, I share the Group Chief Internal Auditor’s view that the controls provide moderate assurance.
The Department continues to focus on providing and transforming the essential services that improve people’s quality of life now and in the future, supporting people to become financially resilient. We do this by helping people to move into and progress at work, thereby enhancing overall workforce participation, providing a safety net for those who need it, and supporting people to save and plan for later life. We aim to deliver effective and efficient services to our millions of customers every day, including the most vulnerable in society, improving their experience of using our services, whilst maximising value for money for the taxpayer.
The operating environment remains uncertain, and I anticipate this will continue throughout 2023-24 as global, domestic and economic developments unfold. I am increasingly focused on the many dependencies and complex interactions in our principal risks. Many risk drivers are outside our control so our decision-making focuses on what we can influence. Continued pressure on budget allocations will require ever tighter financial management, reduced flexibility and on-going prioritisation. The demands on our people will continue, with potentially significant recruitment requirements, pressure on productivity and industrial relations, all of which will need robust, carefully tested plans to ensure that delivery remains on-track. This has been exacerbated by increased demand for our services across the year.
The departmental approach to risk and assumption management has continued to strengthen over the last year. Risk and assumptions will continue to be monitored and revised as we assess progress through the year. We anticipate that significant risks may emerge as priorities change in response to wider environmental changes and economic uncertainty with particular emphasis on:
Tackling fraud, error and debt
We are committed to tackling fraud and error in the benefits system. We will develop and implement approaches, technology and use our skilled employees to prevent fraud and error upfront, using the law to act against those who commit fraud against the Department.
We are implementing our Fraud Plan, investing in frontline counter fraud professionals, enhanced data analytics, programmes and technology to identify fraud and error before it enters the system. We will also seek new legal powers to investigate potential fraud and punish fraudsters, subject to parliamentary time. We will work with the public and private sectors to tackle fraud in a holistic way.
Building capacity in the labour market (tackling economic inactivity and improving workforce participation)
We want everyone to be able to find a job, progress in work and thrive in the labour market. Through the successful delivery of our Plan for Jobs and the Way to Work campaign, we have supported thousands of people to find a job and start their careers.
Nonetheless, the level of economic inactivity continues to remain high and the Department is working to tackle this issue and increase workforce participation. We are also focused on supporting people to progress in work; supporting those on the health journey and providing targeted support to young people and those who are long term unemployed. The Department will also need to respond to any economic changes and wider unemployment issues as we continue to assess the risk of recession. We will continue building our close working relationships across all government departments, including those responsible for sectors critical to achieving our objectives.
Resource capacity, delivering high quality services and driving efficiencies
The Department plans to expand rapidly over the coming year to meet demand for our services and enable us to deliver our Departmental Plan. The risk of rapid recruitment and expansion will be managed throughout the year, including how we induct and train large volumes of new recruits.
We want to ensure that our work offers value for money to the UK taxpayer. We are implementing an ambitious transformation agenda to simplify our processes, update our IT systems, and modernise our workplaces to improve how we support our citizens more efficiently and sustainably, while delivering savings. By 2025, customers will have access to simplified services that make it easier to manage updates to their circumstances and have more options for how they interact with the Department, through channels that most suit their needs. This will be underpinned by more efficient use of data and, where appropriate, greater automation, which will help our colleagues make better decisions and spend less time on repetitive tasks, allowing them to focus on customers that need the most support. This is a challenging programme with multiple interdependencies.
Remuneration and staff report
Remuneration policy
The pay of most Senior Civil Servants is set by the Prime Minister, following independent advice from the Senior Salaries Review Body. Details are available on GOV.UK. This body also advises the Prime Minister on peers’ allowances; the pay, pensions and allowances of MPs; and others whose pay is determined by the Ministerial and Other Salaries Act 1975.
Salaries are solely for the period in the year when an individual served as a member of our Executive Team.
Appointment of directors
Civil service appointments are made in accordance with the Civil Service Commissioner’s Recruitment Principles. These principles require appointments to be made on merit and on the basis of fair and open competition. However, there may be exceptions to this principle.
Unless stated otherwise, all appointments are open-ended. Early termination, other than for misconduct, would result in the individual receiving compensation as set out in the Civil Service Compensation Scheme.
Further information about the work of the Civil Service Commission can be found at www.civilservicecommission.org.uk
Salary
Salary includes gross salary, overtime, reserved rights to London weighting or London allowances, recruitment and retention allowance, private office allowances and any other allowance to the extent that they are subject to UK taxation. This report is based on accrued payments made by the Department and thus recorded in these accounts. In respect of ministers in the House of Commons, departments bear only the cost of the additional ministerial remuneration; the salary for their services as an MP £84,144 (from 1 April 2022)[footnote 50] and various allowances to which they are entitled are borne centrally. However, the arrangement for ministers in the House of Lords is different in that they do not receive a salary but rather an additional remuneration, which cannot be quantified separately from their ministerial salaries. This total remuneration, as well as the allowances to which they are entitled, is paid by the Department and is therefore shown in full in the ‘Remuneration and pension entitlements for ministers and executive directors’ section.
Bonuses
Bonuses are non-consolidated variable performance related payments awarded to our civil servants below SCS grade at the end of the year. In order to be eligible, staff need to be in post on 31 March and 1 July and must not be undergoing formal poor performance action. Bonus payments are normally paid in July for performance in the preceding financial year, therefore payments made in 2022-23 relate to performance between 1 April 2021 and 31 March 2022.
In addition, SCS bonus payments are based on performance assessments against the framework for SCS Performance Management and Pay prescribed by Cabinet Office. Those that are assessed as top are eligible for a non-consolidated performance related payment.
Benefits in kind
The monetary value of benefits in kind covers any benefits provided by the Department and treated by HM Revenue and Customs as a taxable emolument.
Conflict of interest
We keep a register of our directors’ interests. This contains details of company directorships and other significant interests held by those members. None of our directors or minister held directorships that conflicted with their management responsibilities in 2022-23.
See a list of ministerial board members’ interests
Remuneration and pension entitlements for ministers and executive directors
Ministers’ pay
(This information is subject to audit)
| Ministers | 2022-23: salary £ | 2022-23: Full year equivalent | ||||||||
| 2022-23: Severance payments £ | 2022-23: Pension benefits to nearest £1,000[footnote 51] | 2022-23: Total to nearest £1,000[footnote 54] | 2021-22: Salary £ | 2021-22: Full year equivalent £ | 2021-22: Severance payments £ | 2021-22: Pension benefits to nearest £1,000[footnote 52] | 2012-22: Total to nearest £1,000[footnote 16] | |||
| Rt Hon Thérèse Coffey MP from 8 September 2019 Left 5 September 2022 | 33,753 | 67,505 | – | 3,000 | 37,000 | 67,505 | 67,505 | – | 8,000 | 76,000 |
| Guy Opperman MP from 14 June 2017 Left 8 September 2022 | 9,820 | 22,375 | – | 2,000 | 12,000 | 22,375 | 22,375 | – | 6,000 | 28,000 |
| Guy Opperman MP from 27 October 2022 | 13,626 | 31,680 | – | 3,000 | 17,000 | – | – | – | – | – |
| Mims Davies MP from 26 July 2019 Left 6 July 2022 | 5,955 | 22,375 | – | 1,000 | 7,000 | 22,375 | 22,375 | – | 6,000 | 28,000 |
| Mims Davies MP from 27 October 2022 | 9,323 | 22,375 | – | 2,000 12,000 | – | – | – | – | – | |
| Baroness Stedman-Scott OBE DL from 30 July 2019 Resigned 31 December 2022 | 80,501 | 107,335 | 17,442 | – | 98,000 | 107,335 | 107,335 | – | 4,000 | 112,000 |
| Rt Hon Chloe Smith MP from 16 September 2021 Left 24 October 2022 | 23,953 | 67,505 | 16,876 | 6,000 | 47,000 | 15,840 | 31,680 | – | 4,000 | 20,000 |
| David Rutley MP from 17 September 2021 Left 19 September 2022 | 11,187 | 22,375 | – | – | 11,000 | 11,360 | 22,375 | – | – | 11,000 |
| Julie Marson MP from 8 July 2022 Left 19 September 2022 | – | – | – | – | – | – | – | – | – | – |
| Victoria Prentis MP from 7 September 2022 Left 24 October 2022 | 2,640 | 31,680 | – | 1,000 | 4,000 | – | – | – | – | – |
| Alex Burghart MP from 20 September 2022 Left 26 October 2022 | 2,548 | 22,375 | – | – | 3,000 | – | – | – | – | – |
| Claire Coutinho MP from 21 September 2022 Left 26 October 2022 | 2,486 | 22,375 | – | – | 3,000 | – | – | – | – | – |
| Rt Hon Mel Stride MP from 25 October 2022 | 29,397 | 67,505 | – | 7,000 | 37,000 | – | – | – | – | – |
| Tom Pursglove MP from 27 October 2022 | 13,200 | 31,680 | – | 3,000 | 17,000 | – | – | – | – | – |
| Laura Trott MP from 27 October 2022 | 9,624 | 22,375 | – | 2,000 | 12,000 | – | – | – | – | – |
| Viscount James Younger from 1 January 2023 | 26,834 | 107,335 | – | 4,000 | 31,000 | – | – | – | – | – |
| Justin Tomlinson MP from 4 April 2019 Left 15 September 2021 | – | – | – | – | – | 14,520 | 31,680 | 7,920 | 3,000 | 26,000 |
| Will Quince MP from 26 July 2019 Left 15 September 2021 | – | – | – | – | – | 11,185 | 22,375 | – | 3,000 | 14,000 |
Baroness Stedman-Scott opted out of the Parliamentary Contributory Pension Fund (PCPF) on 30 June 2021 the disclosed amount relates to the period while she was in the scheme. Her salary disclosed above includes Lord Office-holders Allowance of £27,275 for 2022-23 (£36,366 for 2021-22) until her resignation on 31 December 2022.
David Rutley has been opted out of the PCPF throughout his appointment.
Julie Marson MP was an unpaid minister by the Department. A severance payment of £4,479 was paid by HM Treasury.
Mims Davies MP received a severance payment of £5,593 in July 2022 which was repaid in full in January 2023. Guy Opperman MP received a severance payment of £5,593 in September 2022 which was repaid in full in November 2022. David Rutley MP received a severance payment of £5,593 in October 2022 which was repaid in full in November 2022.
The Prime Minister has determined that government ministers in the Commons should receive salaries set at the same rate as that claimed by equivalent ministers under the government from 2015 to 2017. This rate is less than what the Ministerial and Other Salaries Act 1975 entitles ministers to. The table above shows salaries actually received and not salaries entitled to.
No minister received any benefit in kind.
Executive directors’ pay
(This information is subject to audit)
| Executive directors | Salary £000 (2022/23) | Bonus payments £000 (2022/23) | Pension benefits to nearest £1,000 (2022/23) | Benefit in kind £000 (2022/23) | Total to nearest £1,000 (2022/23) | Salary £000 (2021-22) | Bonus payments £000 (2021-22) | Pension benefits to nearest £1,000[footnote 53] [footnote 55] (2021-22) | Benefit in kind £000 (2021-22) | Total to nearest £1,000[footnote 54] [footnote 56] (2021-22) |
|---|---|---|---|---|---|---|---|---|---|---|
| Peter Schofield CB from 18 July 2016 | 190-195 | – | 16 | – | 205-210 | 185-190 | 15-20 | 33 | – | 235-240 |
| Debbie Alder CB from 1 January 2014 | 155-160 | 10-15 | 59 | – | 230-235 | 145-150 | 10-15 | 57 | – | 210-215 |
| Neil Couling CBE from 1 October 2014 | 165-170 | 0-5 | -52 | – | 115-120 | 165-170 | 10-15 | 16 | – | 195-200 |
| Jonathan Mills from 29 August 2017 Left 5 June 2022 | 25-30 (FYE 135-140) | 0-5 | 2 | – | 30-35 | 135-140 | 0-5 | 35 | – | 175-180 |
| Nick Joicey CB from 30 July 2018 Left 31 August 2022 | 75-80 (FYE 155-160) | – | 0 | – | 75-80 | 150-155 | 0-5 | 36 | – | 190-195 |
| Simon McKinnon CBE from 1 January 2019 | 160-165 | 10-15 | 62 | – | 235-240 | 155-160 | – | 60 | – | 215-220 |
| Amanda Reynolds from 1 February 2021 | 155-160 | 10-15 | 61 | – | 235-240 | 145-150 | – | 58 | – | 205-210 |
| Katie Farrington from 15 March 2021 | 130-135 | – | 44 | – | 170-175 | 120-125 | 5-10 | 87 | – | 210-215 |
| Karen Gosden from 4 January 2022 retired 30 June 2022 | 35-40 (FYE 110-115) | – | 17 | 0.8 | 50-55 | 25-30 (FYE 120-125) | – | 30 | 0.4 | 60-65 |
| Kate Davies from 20 June 2022 Left 11 December 2022 | 70-75 (FYE 120-125) | 5-10 | 43 | – | 120-125 | – | – | – | – | – |
| Barbara Bradley from 20 June 2022 | 130-135 (FYE 165-170) | – | 51 | – | 180-185 | – | – | – | – | – |
| Catherine Vaughan from 1 November 2022 | 60-65 (FYE 145-150) | – | 24 | – | 85-90 | – | – | – | – | – |
| Sophie Dean from 5 December 2022 | 25-30 (FYE 80-85)[footnote 57] | 0-5 | -1 | – | 25-30 | – | – | – | – | – |
| Katherine Green from 5 December 2022 | 25-30 (FYE 80-85)46 | 0-5 | 11 | – | 35-40 | – | – | – | – | – |
| John-Paul Marks from 12 March 2018 left 31 December 2021 | – | – | – | – | – | 105-110 (FYE 145-150) | 10-15 | 31 | – | 150-155 |
All pension benefits are quoted gross and do not take account of any actual or potential reduction to amounts received resulting from taxation which may be due when pension benefits exceed the annual allowance or are taken in excess of the lifetime allowance.
Karen Gosden was the only director to receive benefit in kind during 2022-23 and 2021-22. This related to use of a vehicle.
Mel Nebhrajani (appointed 04 October 2021) holds the role of Director General, Legal Services and is our senior legal advisor. Our legal services are provided by the Government Legal Department (GLD) and as such, their remuneration is disclosed in GLD’s Annual Report and Accounts 2022-23.
Fair pay disclosure
(This information is subject to audit)
Reporting bodies are required to disclose the relationship between the remuneration of the highest-paid director in their organisation and the lower, median and upper quartile remuneration of the organisation’s workforce.
Total remuneration includes salary, non-consolidated performance related pay and benefits-in-kind. It does not include severance payments, employer pension contributions and the cash equivalent transfer value of pensions.
The banded remuneration of the highest-paid director in the DWP in the financial year 2022-23 was £190,000 to £195,000 (2021-22: £205,000 to £210,000). This was 6.81 times (2021-22: 7.49) the median remuneration of the workforce, which was £28,262 (2021-22: £27,710).
The table below shows further analysis of the DWP remuneration pay ratios across the workforce.
| Year | 25th Percentile Pay Ratio | Median Pay Ratio | 75th Percentile Pay Ratio |
|---|---|---|---|
| 2022-23 | 8.23:1 | 6.81:1 | 5.89:1 |
| 2021-22 | 9.40:1 | 7.49:1 | 6.68:1 |
There has been a reduction in the ratios across all percentiles. The main reason for this is due to a decrease in the remuneration of the highest-paid director as no bonus was paid in accordance with Permanent Secretary Remuneration Committee (PSRC) guidance.
Additionally, the Department made changes to the workforce structure. The number of employees at lower grades reduced due to many of the COVID-19 fixed term appointment contracts ending during the year. There has also been an increase in the percentage of staff employed at higher grades.
Pay and benefits of employees
The table below shows the total remuneration and the salary element of total remuneration for each of the quartiles.
| Year | 25th Percentile total remuneration: Total pay and benefits |
25th Percentile total remuneration: Salary component |
Median total remuneration: Total pay and benefits |
Median total remuneration: Salary component | 75th Percentile total remuneration: Total pay and benefits |
75th Percentile total remuneration: Salary component |
|---|---|---|---|---|---|---|
| 2022-23 | £23,389 | £23,244 | £28,262 | £28,117 | £32,660 | £32,515 |
| 2021-22 | £22,085 | £21,940 | £27,710 | £27,565 | £31,061 | £31,061 |
In 2022-23 and 2021-22 no employees received remuneration in excess of the highest-paid director. Banded remuneration ranged from £18,000 - £18,500 to £190,000 - £195,000 (2021-22: £19,500 - £20,000 to £205,000 - £210,000).
Percentage change in remuneration from 2021-22
The table below shows the overall percentage change in total remuneration across DWP workforce
| Percentage change from prior year | Salary and allowances | Performance pay and bonuses payable | Total remuneration |
|---|---|---|---|
| Highest paid director | 2% | -100% | -7% |
| Employees | 5% | 15% | 5% |
On average, employees, including the highest paid director, had a pay and benefits increase of 2% in accordance with Civil Service Pay Remit 2022-23, Senior Civil Service Pay Award 2022-23 and PSRC guidance. The highest paid director had a reduction in total remuneration between the 2 years due to no bonus being awarded.
The remaining increase in average remuneration is due to a decrease in staff numbers of approximately of 7,100 (7.6%), at the lowest grades which has resulted in an increase in the average remuneration of the total remaining paid employees as at 31 March 2023.
Non-executive directors’ fees
(This information is subject to audit)
| Non-executive directors |
Board | Fees 2022-23 to the nearest £000 |
Benefit in kind 2022-23 to the nearest £000 |
Fees 2021-22 to the nearest £000 |
Benefit in kind 2021-22 to the nearest £000 |
|
|---|---|---|---|---|---|---|
| David Holt from 03 May 2019 to 13 March 2023 | Departmental Board, DARAC chair, Health Transformation board chair and Delivery Board | 19,000 | – | 20,000 | – | |
| Tim Nolan from 01 July 2019 to 30 June 2022 | DARAC | 4,000 | – | 15,000 | – | |
| Ashley Machin from 13 November 2020 to 12 November 2023 | Departmental Board, DARAC, Non-executive Directors and Executive Team Board, Transformational Advisory Committee and NOMS | 20,000 | – | 20,000 | – | |
| Eleanor Shawcross from 10 June 2020 to 31 May 2022 | Departmental Board and Delivery Board | 3,000 | – | 15,000 | – | |
| Nick Markham from 07 July 2020 to 25 September 2022 | Lead non-executive, Departmental Board, Delivery Board and NOMS | 10,000 | – | 20,000 | – | |
| Sally Cheshire from 10 August 2020 to 09 August 2023 | DARAC | 15,000 | – | 15,000 | – | |
| Ian Wilson from 10 August 2020 to 09 August 2023 | DARAC | 15,000 | – | 15,000 | – | |
| Valerie Hughes-D’Aeth from 09 February 2021 to 08 February 2024 | Departmental Board, Non-executive Directors and Executive Team Board, NOMS (chair) and Portfolio Board | 20,000 | – | 20,000 | – | |
| David Bennett from 23 February 2021 to 22 February 2024 | Departmental Board, Non-executive Directors and Executive Team Board and Serious Case Panel chair | 20,000 | – | 20,000 | – | |
| John McGlynn from 05 August 2021 to 04 August 2024 | UC Programme Board Chair | Fee waived | – | Fee waived | – | |
| Charlie Steel from 03 September 2021 to 02 September 2024 | DARAC (interim chair), Departmental Board – Transformation Advisory Committee | 15,000 | – | 9,000 | – | |
| Simon Sear from 03 September 2021 to 02 September 2024 | Non-executive Board Member – transformation Advisory Committee | 15,000 | – | 9,000 | – | |
| Arabel Bailey from 03 September 2021 to 02 September 2024 | Non-executive Board Member – Transformation Advisory Committee (interim chair) | 18,000 | – | 9,000 | – | |
| Reverend Professor Gina Radford from 30 March 2023 to 29 March 2026 | Departmental Board | – | – | – | – | |
| John Clarke from 13 November 2020 to 31 May 2021 | Digital Advisory Committee | No longer on the board | – | 2,500 | – | |
| Keith Burgess from 13 November 2020 to 31 May 2021 | Digital Advisory Committee | No | longer on the board | – | 2,500 | – |
| Total | – | 174,000 | – | 192,000 | – |
Totals may not sum due to rounding of individual figures.
Ministers’ and executive directors’ pensions
(This information is subject to audit)
| Ministers | Total accrued pension at age 65 as at 31 March 2023 |
£000 | Real increase in pension at age 65 £000 |
Cash equivalent transfer value at 31 March 2023 £000 |
Cash equivalent transfer value at 31 March 2022 £000 |
Real increase in cash equivalent transfer value £000 |
|---|---|---|---|---|---|---|
| Rt Hon Thérèse Coffey MP | 0-5 | 0-2.5 | 56 | 51 | 2 | |
| Guy Opperman MP 1 Apr-22 to 8 Sep-22 | 0-5 | 0-2.5 | 46 | 40 | 1 | |
| Guy Opperman MP 27 Oct-22 to 31 Mar-23 | 0-5 | 0-2.5 | 52 | 46 | 2 | |
| Mims Davies MP 1 Apr-22 to 6 Jul-22 | 0-5 | 0-2.5 | 22 | 20 | 1 | |
| Mims Davies MP 27 Oct-22 to 31 Mar-23 | 0-5 | 0-2.5 | 26 | 23 | 1 | |
| Baroness Stedman-Scott OBE DL | – | – | – | 46 | – | |
| Rt Hon Chloe Smith MP | 5-10 | 0-2.5 | 61 | 53 | 2 | |
| David Rutley MP | – | – | – | – | – | |
| Victoria Prentis MP | 0-5 | 0-2.5 | 18 | 16 | 1 | |
| Alex Burghart MP | 0-5 | 0-2.5 | 4 | 4 | – | |
| Claire Coutinho MP | 0-5 | 0-2.5 | – | – | – | |
| Rt Hon Mel Stride MP | 0-5 | 0-2.5 | 49 | 39 | 5 | |
| Tom Pursglove MP | 0-5 | 0-2.5 | 14 | 11 | 1 | |
| Laura Trott MBE MP | 0-5 | 0-2.5 | 2 | – | 1 | |
| Viscount James Younger | 15-20 | 0-2.5 | 284 | 272 | 3 | |
| Justin Tomlinson MP | – | – | – | 25 | – | |
| Will Quince MP | – | – | – | 9 | – |
Where a minister joined or left our department part way through the year, the ‘cash equivalent transfer value’ column refers to those dates and not 31 March.
| Executive directors | Accrued pension at pension age as at 31 March 2023 £000 |
Real increase in pension and related lump-sum at pension age £000 |
Cash equivalent transfer value at 31 March 2023 £000 |
Cash equivalent transfer value at 31 March 2022 £000 |
Real increase in cash equivalent transfer value £000 |
|---|---|---|---|---|---|
| Peter Schofield CB | 75-80 plus a lump-sum of 160-165 | 0-2.5 plus a lump-sum of 0 | 1,441 | 1,293 | -11[1] |
| Debbie Alder CB | 40-45 | 2.5-5 | 623 | 543 | 38 |
| Neil Couling CBE | 80-85 plus a lump-sum of 190-195 | -2.5-0 plus a lump-sum of 0 | 1,784 | 1,654 | -77 |
| Jonathan Mills | 45-50 plus a lump-sum of 80-85 | 0-2.5 plus a lump-sum of 0 | 701 | 690 | -2 |
| Nick Joicey CB | 60-65 plus a lump-sum of 95-100 | 0-2.5 plus a lump-sum of 0 | 1,026 | 967 | -8 |
| Simon McKinnon CBE | 50-55 | 2.5-5 | 931 | 820 | 52 |
| Amanda Reynolds | 5-10 | 2.5-5 | 93 | 47 | 31 |
| Katie Farrington | 35-40 plus a lump-sum of 60-65 | 2.5-5 plus a lump-sum of 0 | 640 | 554 | 21 |
| Karen Gosden | 55-60 plus a lump-sum of 120-125 | 0-2.5 plus a lump-sum of 0-2.5 | 1,143 | 1,076 | 12 |
| Barbara Bradley | 0-5 | 2.5-5 | 35 | 0 | 24 |
| Kate Davies | 30-35 | 0-2.5 | 353 | 310 | 22 |
| Sophie Dean | 20-25 | 0-2.5 | 365 | 349 | -5 |
| Katherine Green | 30-35 plus a lump-sum of 60-65 | 0-2.5 plus a lump-sum of 0-2.5 | 520 | 487 | 6 |
| Catherine Vaughan | 25-30 | 0-2.5 | 323 | 294 | 12 |
| John-Paul Marks | – | – | – | 532 | – |
[1]. Taking account of inflation, the CETV funded by the employer has decreased in real terms
All pension benefits are quoted gross and do not take account of any actual or potential reduction to amounts received resulting from taxation which may be due when pension benefits are taken in excess of the lifetime allowance.
Where an executive director leaves or joins our department part way through the year, the ‘cash equivalent transfer value’ column refers to the value at the date of joining or leaving.
Ministerial pensions
Pension benefits for ministers are provided by the Parliamentary Contributory Pension Fund (PCPF). The scheme is made under statute and the rules are set out in the ministers’ etc. Pension Scheme 2015, available at: www.mypcpfpension.co.uk
Ministers who are Members of Parliament (MP) may also accrue an MP’s pension under the PCPF (details of which are not included in this report). A new MP’s pension scheme was introduced from May 2015, although members who were aged 55 or older on 1 April 2013 have transitional protection to remain in the previous final salary pension scheme.
Benefits for ministers are payable from State Pension age under the 2015 scheme. Pensions are revalued annually in line with Pensions Increase legislation both before and after retirement. The contribution rate from May 2015 is 11.1% and the accrual rate is 1.775% of pensionable earnings. The figure shown for pension value includes the total pension payable to the member under both the pre and post 2015 ministerial pension schemes.
Further details of the scheme are available at: www.mypcpfpension.co.uk
Executive directors’ pensions
Pension benefits are provided through the civil service pension arrangements. From 1 April 2015 a new pension scheme for civil servants was introduced – the Civil Servants and Others Pension Scheme, or alpha, which provides benefits on a career average basis with a normal pension age equal to the member’s State Pension age (or 65 if higher). From that date, all newly appointed civil servants and the majority of those already in service joined alpha. Prior to that date, civil servants participated in the Principal Civil Service Pension Scheme (PCSPS). The PCSPS has 4 sections: 3 providing benefits on a final salary basis (classic, premium or classic plus) with a normal pension age of 60; and 1 providing benefits on a whole career basis (nuvos) with a normal pension age of 65.
These statutory arrangements are unfunded with the cost of benefits met by monies voted by Parliament each year. Pensions payable under classic, premium, classic plus, nuvos and alpha are increased annually in line with Pensions Increase legislation. Existing members of the PCSPS who were within 10 years of their normal pension age on 1 April 2012, remained in the PCSPS after 1 April 2015. Those who were between 10 years and 13 years and 5 months from their normal pension age on 1 April 2012 will switch into alpha sometime between 1 June 2015 and 1 February 2022. Because the government plans to remove discrimination identified by the courts in the way that the 2015 pension reforms were introduced for some members, it is expected that, in due course, eligible members with relevant service between 1 April 2015 and 31 March 2022 may be entitled to different pension benefits in relation to that period (and this may affect the Cash Equivalent Transfer Values shown in this report – see below). All members who switch to alpha have their PCSPS benefits ‘banked’, with those with earlier benefits in 1 of the final salary sections of the PCSPS having those benefits based on their final salary when they leave alpha. (The pension figures quoted for officials show pension earned in PCSPS or alpha – as appropriate. Where the official has benefits in both the PCSPS and alpha, the figure quoted is the combined value of their benefits in the two schemes). Members joining from October 2002 may opt for either the appropriate defined benefit arrangement or a ‘money purchase’ stakeholder pension with an employer contribution (partnership pension account).
Employee contributions are salary-related and range between 4.6% and 8.05% for members of classic, premium, classic plus, nuvos and alpha. Benefits in classic accrue at the rate of 1/80th of final pensionable earnings for each year of service. In addition, a lump-sum equivalent to 3 years’ initial pension is payable on retirement. For premium, benefits accrue at the rate of 1/60th of final pensionable earnings for each year of service. Unlike classic, there is no automatic lump-sum. Classic plus is essentially a hybrid with benefits for service before 1 October 2002 calculated broadly as per classic and benefits for service from October 2002 worked out as in premium. In nuvos, a member builds up a pension based on their pensionable earnings during their period of scheme membership. At the end of the scheme year (31 March) the member’s earned pension account is credited with 2.3% of their pensionable earnings in that scheme year and the accrued pension is uprated in line with Pensions Increase legislation. Benefits in alpha build up in a similar way to nuvos, except that the accrual rate is 2.32%. In all cases members may opt to give up (commute) pension for a lump-sum up to the limits set by the Finance Act 2004.
The partnership pension account is a stakeholder pension arrangement. The employer makes a basic contribution of between 8% and 14.75% (depending on the age of the member) into a stakeholder pension product chosen by the employee from a panel of providers. The employee does not have to contribute, but where they do make contributions, the employer will match these up to a limit of 3% of pensionable salary (in addition to the employer’s basic contribution). Employers also contribute a further 0.5% of pensionable salary to cover the cost of centrally provided risk benefit cover (death in service and ill health retirement).
The accrued pension quoted is the pension the member is entitled to receive when they reach pension age, or immediately on ceasing to be an active member of the scheme if they are already at or over pension age. Pension age is 60 for members of classic, premium and classic plus, 65 for members of nuvos, and the higher of 65 or State Pension age for members of alpha. (The pension figures quoted for officials show pension earned in PCSPS or alpha – as appropriate. Where the official has benefits in both the PCSPS and alpha the figure quoted is the combined value of their benefits in the two schemes, but note that part of that pension may be payable from different ages).
Further details about the civil service pension arrangements can be found at the website: www.civilservicepensionscheme.org.uk
Cash equivalent transfer value (CETV) – ministers and executive directors
(This information is subject to audit)
This is the actuarially assessed capitalised value of the pension scheme benefits accrued by a member at a particular point in time. The benefits valued are the member’s accrued benefits and any contingent spouse’s pension payable from the scheme.
A CETV is a payment made by a pension scheme or arrangement to secure pension benefits in another pension scheme or arrangement when the member leaves a scheme and chooses to transfer the benefits accrued in their former scheme.
The pension figures shown relate to the benefits the individual has accrued from their total service. For ministers that is all their time as a minister, not just their current employment. For executive directors, that is all the time they’ve been a member of that pension scheme, not just the time they were in a senior role.
The figures include the value of any pension benefit in another scheme or arrangement, which the member has transferred to the civil service pension arrangements. They also include any additional pension benefit accrued to the member as a result of their buying additional pension benefits at their own cost.
CETVs are calculated in accordance with the Occupational Pension Schemes (Transfer Values) (Amendment) Regulations 2008. They don’t take account of any actual or potential reduction to benefits resulting from lifetime allowance tax that may be due when pension benefits are taken.
CETV figures are calculated using the guidance on discount rates for calculating unfunded public pension contribution rates that was extant at 31 March 2023. HM Treasury published updated guidance on 27 April 2023; this guidance will be used in the calculation of 2023-24 CETV figures.
Real increase in the value of the CETV
This is the element of the increase in accrued pension funded by the Exchequer for ministers and by the employer for executive directors. It excludes increases in accrued pension due to inflation and contributions paid by the minister or employee. It is worked out using common market valuation factors for the start and end of the period.
Average staff numbers and composition[footnote 58]
(This information is subject to audit)
The average number of whole-time equivalent people employed during the year is shown in the table below.
| Staff | Permanent staff | Others | Ministers | Special Advisers | 2022-23 Total | 2021-22 Total |
|---|---|---|---|---|---|---|
| Number of staff | 77,511 | 6,019 | 5 | 2 | 83,537 | 89,306 |
| Staff engaged on capital projects |
235 | 1 | – | – | 236 | 183 |
| Total | 77,746 | 6,020 | 5 | 2 | 83,773 | 89,489 |
| Core department | 73,753 | 5,677 | 5 | 2 | 79,437 | 85,453 |
| Arm’s length bodies | 3,993 | 343 | – | – | 4,336 | 4,036 |
| Total | 77,746 | 6,020 | 5 | 2 | 83,773 | 89,489 |
Senior Civil Servants
Our executive directors are all Senior Civil Servants. In total there were 286 individual Senior Civil Servants, totalling 277 whole-time equivalents, as at 31 March 2023. This is an increase on last year.
| Grade | Headcount by pay band |
March 2018 | March 2019 | March 2020 | March 2021 | March 2022 | March 2023 |
|---|---|---|---|---|---|---|---|
| Permanent Secretary | £150,000- £200,000 |
1 | 1 | 1 | 1 | 1 | 1 |
| SCS3 | £111,500- £208,100 |
6 | 5 | 5 | 7 | 7 | 9 |
| SCS2 | £93,000- £162,500 |
38 | 43 | 46 | 46 | 55 | 61 |
| SCS1 | £71,000- £117,800 |
157 | 168 | 165 | 186 | 205 | 215 |
| Total | 202 | 217 | 217 | 240 | 268 | 286 |
Staff expenditure
(This information is subject to audit)
| Expense | Permanently employed staff £000 |
Others £000 | Ministers £000 | 2022-23 total £000 | 2021-22 total £000 |
|---|---|---|---|---|---|
| Wages and salaries | 2,615,810 | 200,147 | 309 | 2,816,266 | 2,912,022 |
| Employers’ National Insurance | 269,269 | 1,454 | 32 | 270,755 | 263,562 |
| Superannuation and pension costs | 673,352 | – | – | 673,352 | 689,968 |
| Total | 3,558,431 | 201,601 | 341 | 3,760,373 | 3,865,552 |
| Less recoveries in respect of outward secondments |
(494) | – | – | (494) | (439) |
| Total net costs | 3,557,937 | 201,601 | 341 | 3,759,879 | 3,865,113 |
| Dept | Charged to staff budgets £000 |
Charged to Capital budgets £000 |
Total £000 |
|---|---|---|---|
| Core department | 3,470,620 | 15,335 | 3,485,955 |
| ALBs | 289,753 | 549 | 290,302 |
| Total | 3,760,373 | 15,884 | 3,776,257 |
The Principal Civil Service Pension Scheme (PCSPS) and the Civil Servant and Other Pension Scheme (CSOPS) – known as ‘alpha’, are unfunded multi-employer defined benefit schemes. However, it is not possible to identify our share of the underlying assets and liabilities. A full actuarial valuation was carried out as at 31 March 2016. Details can be found in the resource accounts of the Cabinet Office: www.civilservicepensionscheme.org.uk
For 2022-23, we paid employer contributions of £667 million to the PCSPS and the CSOPS (2021-22: £685 million). These were at 1 of 4 rates in the range 26.6% to 30.3% (2021-22: 26.6% to 30.3%) of pensionable pay, based on salary bands. The scheme actuary reviews employer contributions usually every 4 years following a full scheme valuation. The contribution rates are set to meet the cost of the benefits accruing during 2022-23 to be paid when the member retires and not the benefits paid during this period to existing pensioners.
Outstanding contributions of £67 million (2021-22: £68 million) were payable to the Civil Superannuation Vote at 31 March 2023 and are included in trade payables and other liabilities (see note 14).
Employees can opt to open a partnership pension account, a stakeholder pension with an employer contribution. In total we paid employers contributions of £3.1 million (2021-22: £3.0 million) to 3 appointed stakeholder pension providers. Employer contributions are age-related and ranged from 8% to 14.75%. We also match employee contributions up to 3% of pensionable pay. In addition, employer contributions of £0.1 million were payable to the PCSPS to cover the cost of the future provision of lump-sum benefits on death in service or ill health retirement of these employees.
Contributions due to the partnership pension providers at the reporting period date were £0.3 million. There were no prepaid contributions at that date.
In 2022-23, 77 people (2021-22: 62 people) retired early on ill-health grounds. The total additional accrued pension liabilities in the year were £373,052 (2021-22: £250,493).
Reporting of Civil Service and other compensation schemes - exit packages
(This information is subject to audit)
Table 1: 2022-23
Core department
| Exit package cost band |
Number of compulsory redundancies[footnote 59] |
Number of other departures agreed |
Total number of exit packages by cost band |
|---|---|---|---|
| < £10,000 | 42 | 40 | 82 |
| £10,001-£25,000 | 30 | 123 | 153 |
| £25,001-£50,000 | 35 | 543 | 578 |
| £50,001-£100,000 | 17 | 22 | 39 |
| £100,001-£150,000 | – | – | – |
| £150,001-£200,000 | – | – | – |
| Total number of exit packages |
124 | 728 | 852 |
| Total cost £000 | 2,955 | 23,068 | 26,023 |
Departmental group
| Exit package cost band |
Number of compulsory redundancies |
Number of other departures agreed |
Total number of exit packages by cost band |
|---|---|---|---|
| < £10,000 | 43 | 41 | 84 |
| £10,001-£25,000 | 30 | 126 | 156 |
| £25,001-£50,000 | 38 | 545 | 583 |
| £50,001-£100,000 | 18 | 26 | 44 |
| £100,001-£150,000 | – | – | – |
| £150,001-£200,000 | – | – | – |
| Total number of exit packages | 129 | 738 | 867 |
| Total cost £000 | 3,189 | 23,508 | 26,697 |
Table 2: 2021-22
Core department
| Exit package cost band |
Number of compulsory redundancies |
Number of other departures agreed |
Total number of exit packages by cost band |
|---|---|---|---|
| < £10,000 | 28 | 2 | 30 |
| £10,001-£25,000 | 15 | 10 | 25 |
| £25,001-£50,000 | 32 | 50 | 82 |
| £50,001-£100,000 | 16 | 1 | 17 |
| £100,001-£150,000 | – | – | – |
| £150,001-£200,000 | – | – | – |
| Total number of exit packages |
91 | 63 | 154 |
| Total cost £000 | 2,511 | 1,928 | 4,439 |
Departmental group
| Exit package cost band |
Number of compulsory redundancies |
Number of other departures agreed |
Total number of exit packages by cost band |
|---|---|---|---|
| < £10,000 | 28 | 8 | 36 |
| £10,001-£25,000 | 15 | 11 | 26 |
| £25,001-£50,000 | 33 | 51 | 84 |
| £50,001-£100,000 | 16 | 1 | 17 |
| £100,001-£150,000 | – | 1 | 1 |
| £150,001-£200,000 | – | – | – |
| Total number of exit packages | 92 | 72 | 164 |
| Total cost £000 | 2,538 | 2,137 | 4,675 |
We’ve paid redundancy and other departure costs in accordance with the provisions of the Civil Service Compensation Scheme, a statutory scheme made under the Superannuation Act 1972. The table above shows the total cost of exit packages agreed and accounted for in 2022-23 (2021-22 comparative figures are also given). £26.7 million exit costs were paid in 2022-23, the year of departure (£4.7 million in 2021-22). We account for exit costs in full when the early retirement programme becomes binding but actual dates of departure may fall in the following reporting period. Where we’ve agreed early retirements we, not the Civil Service Pension Scheme, meet the additional costs. Ill-health retirement costs are met by the pension scheme and are not included in the table.
From 22 December 2010, new civil service compensation terms were introduced for Early Release schemes. All voluntary exit costs payable by us are now made in the form of lump-sum payments. Payments made in respect of schemes prior to this date were made as both lump-sum payments and annual compensation payments. The liability in respect of these annual payments is included in other provisions in note 16.
Reporting the tax arrangements of public sector appointees
All government departments and their arm’s length bodies (ALBs) which employ appointees off-payroll have to report to HM Treasury about the financial arrangement to make sure it is transparent and that the appointee in question is paying the right amount of tax and National Insurance. Off-payroll engagements include any appointee who is not on the Department’s payroll.
We continuously review the way we employ appointees to ensure our processes are robust. We have the right to request assurances, and do so, from the appointees. We can terminate the individual’s contract if these assurances are not provided. The tables below outline the off-payroll arrangements for 2022-23.
Off-payroll
Table 1: Highly paid off-payroll worker engagements as at 31 March 2023, that were paid £245 per day or greater
| Engagement | Core department | ALBs | Departmental group |
|---|---|---|---|
| No. of existing engagements as of 31 March 2023 |
2,036 | 145 | 2,181 |
| No. that existed < 1 year at time of reporting |
888 | 133 | 1,021 |
| No. that have existed for between 1 and 2 years at time of reporting |
653 | 7 | 660 |
| No. that have existed for between 2 and 3 years at time of reporting |
271 | 4 | 275 |
| No. that have existed for between 3 and 4 years at time of reporting |
83 | 1 | 84 |
| No. that have existed for 4 or more years at time of reporting |
141 | – | 141 |
Table 2: All highly paid off-payroll workers engagements engaged at any point during the year ended 31 March 2023, earning £245 per day or greater
| Engagement | Core department | ALBs | Departmental group |
|---|---|---|---|
| No. of new engagements between 1 April 2022 and 31 March 2023 |
3,016 | 273 | 3,289 |
| No. of appointments to which the off-payroll legislation does not apply |
2,965 | 110 | 3,075 |
| No. assessed as caught by IR35 (In scope) |
47 | 161 | 208 |
| No. assessed as not caught by IR35 (Out of scope) |
4 | 2 | 6 |
| No. of engagements reassessed for consistency/assurance purposes during the year |
– | 31 | 31 |
| No. of engagements that saw a change to IR35 status following consistency review |
– | – | – |
- IR35 legislation from 6 April 2017 required public sector bodies, where they engage off-payroll workers, to ensure they correctly assess their “employment status” i.e. correct tax treatment
- to do this, DWP utilised HM Revenue and Customs’ CEST (Check Employment Status Tool)
- all engagements of highly paid workers, which are not on the Department’s payroll, are included in the off-payroll tables
- highly paid engagements includes payments to individuals of at least £245 per day
Table 3: For any off-payroll engagements of board members, and/or, senior officials with significant financial responsibility, between 1 April 2022 and 31 March 2023
| Engagement | Core department | Arm’s length bodies | Departmental group |
|---|---|---|---|
| No. of off-payroll engagements of board members, and/or, senior officials with significant financial responsibility, during the financial year. | – | – | – |
| Total no. of individuals on payroll and off-payroll that have been deemed “board members, and/or, senior officials with significant financial responsibility”, during the financial year. This figure should include both on payroll and off-payroll engagements. | 68 | 14 | 82 |
These are our most senior officials who hold the highest levels of delegated financial authority.
Consultancy and temporary staff
We occasionally use professional service providers to help with specialist work – including consultancy and contingent labour where it is necessary and prudent to do so.
| Consultancy (£m) | 2022-23 | 2021-22 |
|---|---|---|
| Core department | 4.3 | 5.3 |
| Arm’s length bodies | 6.2 | 10.7 |
| Departmental group | 10.5 | 16.0 |
| Temporary (off-payroll) staff (£m) |
2022-23 | 2021-22 |
|---|---|---|
| Core department | 144.1 | 197.6 |
| Arm’s length bodies | 19.1 | 23.3 |
| Departmental group | 163.2 | 220.9 |
| Departmental group whole time equivalent off-payroll staffing as at 31 March[footnote 60] |
March 2023 | March 2022 |
|---|---|---|
| Core department | 854.0 | 684.0 |
| Arm’s length bodies | 195.0 | 262.3 |
| Departmental group | 1,049.0 | 946.3 |
The departmental group whole time equivalent off-payroll staff numbers relate to the position at the end of the year.
Staff absence and sickness
We recognise the costs associated with high levels of employee absence. Our wellbeing approach to sick absence is focused on health promotion and absence prevention, while supporting employees who are absent to return to work.
On average in March 2023 there were 5,518 open absences in DWP (including all sickness and non-sickness categories). This represents 6.4% of the DWP workforce which is the same as the figure for March 2022.
For sickness absence only, on average in March 2023 there were 3,255 absences representing 3.8% of the workforce. This has reduced from 4.6% in March 2022.
Staff Engagement Score
Throughout 2022-23 we saw a year in which we achieved so much in the face of increasing pressures, both inside and outside the workplace. With an increase in the demand for our services, our colleagues and customers faced several challenges, including the effects of the increased cost of living.
The annual Civil Service People Survey, our regular pulse surveys, along with other insight activities, continued to play important parts of our listening programme across the employee journey.
Our 2022 People Survey scores remained largely stable and overall achieved a 65% response rate with 56,500 colleagues having their say. The engagement score for DWP was 60%, a fall of 2 percentage points from last year, but still above the level we were at before the pandemic in 2019. Across the survey themes we were stronger in those areas where we had the most control, such as My Team, My Work, Learning and Development, Resources and Workload, and Organisational Objectives, while in pay and benefits, we saw a decline of 9 percentage points.
| Year | 2013 | 2014 | 2015 | 2016 | 2017 | 2018 | 2019 | 2020 | 2021 | 2022 |
| Percentage | 54% | 55% | 56% | 61% | 60% | 59% | 59% | 63% | 62% | 60% |
For the year ahead we must retain our focus on what we do well, seek to improve those areas we can and take action on our People Survey findings, and ensure that all colleagues are engaged, feel supported and valued. Our priorities align to last year’s which are Line Management, Change Management and Disability. For 2023 we’ll also focus on Bullying, Harassment and Discrimination, whilst doing what we can around Pay and Benefits and maintain our commitment to wellbeing to make DWP a better place to work.
In terms of our wellbeing offer, our PROXY and PERMA scores remained unchanged at 29% and 74% respectively from last year. We maintained our priority supporting colleagues’ mental and physical health and those with other specific needs, including cost of living support, and we continue to encourage regular feedback.
We continued to offer comprehensive wellbeing support and resources including our Employee Assistance Programme. Our established network of Mental Health First Aiders and our Ambassadors for Fair Treatment played key roles supporting ongoing activities to ensure colleagues feel able to report instances of inappropriate behaviour and where to access support.
The cost of living is a significant concern to the department, and in late 2022 early 2023 we introduced several initiatives which sought to improve the offer for our people, including increasing the retail discounts received through our supplier Edenred and an annual leave exercise for colleagues with an excess of annual leave.
Staff Turnover scores
The all-staff turnover rate for DWP at March 2023 is currently 9.62%.
It has been historically high over the last two years because, during the COVID-19 pandemic, the proportion of DWP employees on fixed term/temporary contracts increased significantly and these members of staff tend to have much higher turnover rates than permanent staff. The proportion of the DWP workforce on fixed term/temporary contracts has now significantly reduced again from 16.2% of the workforce in March 2022 to 0.4% in March 2023 hence the decrease in turnover over the past year.
Note that there was a methodological change from April 2021; the methodology was changed to better align with the turnover definition used by Cabinet Office.
All-staff Annual Turnover Rate

Trade union facility time
| DWP Facility Time | Number | |
| – | – | |
| Number of trade union representatives | 1,023 | |
| Number of representatives with trade union facility time 0 % | – | |
| Number of representatives with trade union facility time (between 1% and 50% of contracted hours) | 1,023 | |
| Number of representatives with trade union facility time (between 51% and 99% of contracted hours) | – | |
| Number of representatives with trade union facility time (100 %) | – | |
| Total tine spent (hours) | 70,216 | |
| Cost of facility time | £0.654 million | |
| Total paybill | £3.276 billion | |
| Facility time as a percentage of the Department’s annual pay bill | 0.02% |
| HSE Facility Time | Number | |
| – | – | |
| Number of trade union representatives | 74 | |
| Number of representatives with trade union facility time 0 % | – | |
| Number of representatives with trade union facility time (between 1% and 50% of contracted hours) | 74 | |
| Number of representatives with trade union facility time (between 51% and 99% of contracted hours) | – | |
| Number of representatives with trade union facility time (100 %) | – | |
| Cost of facility time | £0.222 million | |
| Total paybill | £162 million | |
| Facility time as a percentage of the Department’s annual pay bill | 0.14% |
The number of trade union representatives (1,023) is the total headcount of representatives in DWP from the PCS, FDA and Prospect trade unions. This equates to 940 FTE.
In addition some representatives hold multiple roles, so included in the total figure of 1,023 are 398 Health and Safety Representatives and 63 Union Learning Representatives (ULR).
Staff seconded and loaned by grade
The Department made a small number of secondments and loans of members of staff to other government departments during 2022-23.
| Outward Secondments (from DWP to outside the Civil Service) |
AO | EO | HEO | SEO | G7 | G6 | SCS1 | SCS2 | NK | Total |
|---|---|---|---|---|---|---|---|---|---|---|
| Number on Secondment since 1 April 2022 |
0 | 2 | 2 | 0 | 0 | 1 | 1 | 2 | 1 | 9 |
| Number already on Secondment prior to 1 April 2022 and are expected to be beyond 31 March 2023 |
0 | 0 | 0 | 0 | 0 | 0 | 0 | 0 | 0 | 0 |
| Number already on Secondments prior to 1 April 2022 and have or are expected to end up to 31 March 2023 |
0 | 3 | 0 | 0 | 2 | 0 | 0 | 0 | 0 | 5 |
| Grand Total of All Outward Secondments |
0 | 5 | 2 | 0 | 2 | 1 | 1 | 2 | 1 | 14 |
| Inward Secondments (from Outside the Civil Service to DWP) |
AO | EO | HEO | SEO | G7 | G6 | SCS1 | SCS2 | NK | Total |
|---|---|---|---|---|---|---|---|---|---|---|
| Number on Secondment to DWP since 1 April 2022 |
0 | 0 | 0 | 0 | 0 | 0 | 0 | 0 | 1 | 1 |
| Number already on Secondment to DWP prior to 1 April 2022 and are expected to be beyond 31 March 2023 |
0 | 0 | 0 | 0 | 0 | 0 | 0 | 0 | 0 | 0 |
| Number already on Secondments to DWP prior to 1 April 2022 and have or are expected to end up to 31 March 2023 |
0 | 0 | 0 | 0 | 0 | 0 | 0 | 0 | 0 | 0 |
| Grand Total of All Inward Secondments |
0 | 0 | 0 | 0 | 0 | 0 | 0 | 0 | 1 | 1 |
| Outward Loans (from DWP to OGD/NDPB) |
AO | EO | HEO | SEO | G7 | G6 | SCS1 | SCS2 | NK | Total |
|---|---|---|---|---|---|---|---|---|---|---|
| Number on loan since 1 April 2022 | 1 | 3 | 1 | 2 | 0 | 0 | 0 | 0 | 14 | 21 |
| Number already on loan prior to 1 April 2022 and are expected to be beyond 31 March 2023 |
0 | 2 | 1 | 0 | 0 | 1 | 0 | 0 | 1 | 5 |
| Number already on loan prior to 1 April 2022 and have or are expected to end up to 31 March 2023 |
0 | 12 | 9 | 5 | 6 | 2 | 1 | 0 | 4 | 39 |
| Grand Total of All Outward Loans |
1 | 17 | 11 | 7 | 6 | 3 | 1 | 0 | 19 | 65 |
| Inward Loans (from OGD/NDPB to DWP) |
AO | EO | HEO | SEO | G7 | G6 | SCS1 | SCS2 | NK | Total |
|---|---|---|---|---|---|---|---|---|---|---|
| Number on loan to DWP since 1 April 2022 |
0 | 1 | 0 | 0 | 0 | 1 | 0 | 0 | 3 | 5 |
| Number already on loan to DWP prior to 1 April 2022 and are |
||||||||||
| expected to be beyond 31 March 2023 |
0 | 0 | 0 | 0 | 0 | 0 | 0 | 0 | 0 | 0 |
| Number already on loan to DWP prior to 1 April 2022 and have or are expected to end up to 31 March 2023 |
1 | 99 | 1 | 0 | 0 | 1 | 0 | 0 | 4 | 106 |
| Grand Total of All Inward Loans |
1 | 100 | 1 | 0 | 0 | 2 | 0 | 0 | 7 | 111 |
Diversity and inclusion
DWP is committed to being representative of the society we serve and continues to take actions to ensure this happens. As a government Department whose mission is to maximise employment outcomes, improve people’s quality of life and deliver excellent customer service, our D&I ambition continues to be to:
- increase the representation of currently under-represented groups to make DWP more reflective of the citizens and communities we serve
- build an inclusive environment, where our colleagues are able to be their authentic selves at work, feel they have a voice and belong, see their reflection in senior leaders across the organisation, feel supported, empowered, valued, respected and fairly treated
Our priorities support the commitments set out in the Civil Service Diversity and Inclusion Strategy 2022-25, “Promoting Fairness and Performance” which are to:
- attract talent from all backgrounds
- invest in our people capabilities and
- drive a performance culture that delivers improved outcomes for our citizens
The Department has made significant progress in attracting a more diverse range of talent and laying the foundations of a strong ethos for inclusion. For example, to ensure a greater understanding of our Public Sector Equality Duty and personal responsibilities in relation to both our staff and customers, we have developed and rolled-out mandatory e-learning to all our employees. As of 31 March 2023, 97% of employees have completed the learning.
We have also seen improvements in many areas of representation where we are beginning to look and feel much more like an organisation that mirrors the communities we serve.
Representation Data
We continue to encourage individuals to voluntarily share their personal diversity information and promote the benefits of gathering this through communications and new starter induction. However, not every member of staff is willing to share their details and the tables below only include colleagues who have done so.
Disability representation has increased from 17.6% in March 2020 to 21.7% as of 31 March 2023, above the economically active population in Great Britain representation (of 18.4%). We are fully committed to increasing representation of disabled people in HEO-G6 levels ensuring a stable talent pipeline to the SCS.
Ethnic minority representation has risen from 15.6% on 31 March 2020 to 17.6% as of 31 March 2023 (against the economically active population of 15.4%) with increases across all grades, particularly at the C/EO grade which most of the Department’s recruitment activity has been focused this year.
We continue to make progress in the percentage of staff who have shared details of their sexual orientation and religious beliefs information (information on marriage and civil partnership is also captured via a central recording system, but no information on gender re-assignment is currently captured).
Representation of female staff, ethnic minority staff and disabled staff
| Year (March) | Total Number of Staff | Female | Ethnic Minority | Disabled |
|---|---|---|---|---|
| Economically Active Population in Great Britain (2022)* |
48% | 15.4% | 18.4% | |
| 2023 | 84,944 | 64.3% | 17.6% | 21.7% |
| 2022 | 91,452 | 64.6% | 17.6% | 18.5% |
| 2021 | 92,690 | 65.2% | 17.2% | 18.3% |
| 2020 | 75,590 | 65.9% | 15.6% | 17.6% |
| 2019 | 68,742 | 66.3% | 13.0% | 11.0% |
Source Annual Population Survey December 2022
However, there is still much more work to do and we will launch a new DWP DEI Strategy and implementation of a new DEI Programme Board.
Our key priorities for 2022-23 were:
Inclusion
- embedding a culture of inclusive and accountable leadership, promoted by senior role models
- updating/promoting mandatory SCS Wellbeing and Inclusion Performance objective guidance
- conducting 1-2-1 Inclusion Engagement Sessions, collecting insights on lived experiences of a diverse range of colleagues to understand more about feelings of Inclusion and Belonging
- delivering guidance on Inclusive Ways of Working and the organisational benefits of being ‘Inclusive by Design’
- engaging with over 5,000 colleagues across National Inclusion Week
Ethnicity
We have continued to make progress with our overall ethnic minority representation level and since 2020, we have seen overall ethnic minority representation increase to 17.6% (over 4PP higher than the current internal 13.2% success measure). From June 2020, representation has been consistently above 13.2% for grades AO to EO, with highest representation in the Department at EO grade (20.5%).
We have seen good improvement in HEO representation (14.6% +4.6PP since June 2020), and some improvement at SEO and Grade 7, although SEO and Grade 7 representation is still below 13.2% (SEO at 12.2%, and Grade 7 at 10.6%).
Progress at Grade 6 and SCS is slower compared to other grades, consistently remaining below 13.2% with little fluctuation over the last 2 years (currently 6.2% for Grade 6, and 7.3% for SCS).
To address this, we have implemented and resourced a dedicated Race Programme Board to strengthen governance and levels of accountability as well as Race leads in each Director General group to drive local action.
Disability
In the Department it is essential we ‘walk the walk’ and demonstrate the same levels of disability confidence we expect of other organisations. As such, we are committed to increasing trust, encouraging proactive support and empowering disabled colleagues. In 2022-23 we did this by:
- developing a new disability action plan with 4 strategic priorities, ensuring colleagues with long term health conditions are not disproportionately or adversely impacted through design or attitude
- making sure our recruitment is accessible to all, providing a process that ensures all candidates have equal opportunity to share their skills through the whole process and we are leading government in testing new processes
- optimising our people policies and processes to ensure the Social Model of Disability is embedded, normalising workplace adjustments throughout
- a Workplace Adjustments Governance Board leading on solution focused priorities
- developing disability confident leadership to provide people at all levels with the skills and confidence to support disabled colleagues and promote a disability-inclusive culture
- developing & delivering a colleague led video series entitled “Understanding Disability” to understand the barriers and enablers from lived experience
- the establishment of a monthly Disability Working Group
- gathering rich insight and challenge from THRIVE – the DWP disability colleague network for diverse ability, who also collaborate closely with networks for colleagues who are deaf or have hearing loss, blind and visually impaired and neurodivergent
Faith and Belief
Faith and belief are important aspects of colleagues’ identity. We have introduced a DWP Faith and Belief Network bringing together representatives from individual faiths and beliefs, to work collectively to deliver against the following priorities:
- foster an inclusive and safe environment that provides colleagues of faith and belief to have a sense of belonging, allows them to be authentic and ensures they have a voice in their team and organisation
- understand the composition and work experiences of our colleagues; and
- ensure that any potential impacts from a Faith and Belief perspective are considered and inform our HR policies and decision-making
Gender/Sex
Since March 2021 we’ve seen a rise from 50% of senior civil servants being female to 54%, the overall percentage of the Department has remained over 60% female.
We have progressed a number of actions this year to support our employees which have included:
- introduction of a DWP Men’s Network
- implementation of Menopause and Miscarriage policies
- free sanitary provision in all of our offices
- listening circles on women’s safety to better understand our employees’ lived experiences and how we can better support them
- ongoing promotion and provision of coaching, mentoring, sponsorship and progression opportunities. This has included DWP Gender Champion Sponsorship initiatives where a total of 106 women across the Department were sponsored and funded to attend either the Crossing Thresholds Programme or Women into Leadership
Representation by Gender (Sex)
| Staff Diversity – % Women | March 2021 | March 2022 | March 2023 |
|---|---|---|---|
| Workforce | 65.5% | 64.6% | 64.3% |
| Senior Civil Servants | 50.0% | 53.2% | 54.0% |
| Ministers | 50.0% | 66.7% | 33.0% |
| Non-executive Members | 33.3% | 30.8% | 40.0% |
| Executive Team | 33.3% | 37.5% | 63.7% |
Age
To support the Fuller Working Lives agenda and to help with career planning, future learning and wellbeing for our colleagues, we have developed a mid-life MOT that includes useful hints, tips, support and guidance to help our employees thrive in both DWP and their personal life. The principles and area of focus are the same as promoted externally but the supportive products are bespoke to us.
To demonstrate our commitment to exemplary practice in recruitment, retention and support of workers and to ensure all age groups have equitable access to opportunities within our organisation we have signed the Centre for Ageing Better Age-friendly Employer Pledge and are the first Government Department to have done so.
Representation by Age
| Percentage of DWP Workforce by age range |
March 2021 | March 2022 | March 2023 |
|---|---|---|---|
| 16 – 24 | 4% | 5% | 3% |
| 25 – 34 | 14% | 15% | 15% |
| 35 – 44 | 20% | 20% | 19% |
| 45 – 54 | 31% | 28% | 28% |
| 55 - 64 | 28% | 29% | 31% |
| 65 + | 3% | 3% | 4% |
Caring
Latest workforce data tells us that 36.1% of employees reported they had caring responsibilities. This is made up of 24.7% with childcare responsibilities, 9.2% with adult care responsibilities and 2.2% told us they are ‘sandwich carers’ and care for both children and family, friends or neighbours.
We have recently made enhancements to our reporting systems to enable those with caring responsibilities to confirm whether they have a Carers’ Passport and sharing of information continues to be promoted and encouraged.
The Department is extremely proud of its Level 3 Carer Confident Ambassador accreditation which is the highest level of recognition by Employer for Carers. This accreditation recognised the excellent work undertaken across the Department to promote our commitment to offering all employees a range of supportive measures to enable them to meet their personal caring responsibilities whilst still achieving a fulfilling career in the Department.
Examples of measures we have put in place include:
- ongoing promotion of our Carers’ Charter; Carers’ Passport; Line Manager Toolkit and facilitated learning sessions
- celebration and promotion of Carers’ Rights Day and Carers’ Week
- introduction of a departmental supportive peer to peer community which currently stands at approx. 1600 members and
- active participation in the cross-Government Carers Network
Carers Data
| Substantive Grade | Caring Responsibilities | % of all Caring responsibility group |
|---|---|---|
| Total | Adult Care Responsibilities | 9.2% |
| Total | Both child and adult care responsibilities | 2.2% |
| Total | Childcare responsibilities | 24.7% |
| Total | No | 61.7% |
| Total | Not recorded | 2.2% |
LGBT+
We continue to support our LGBT+ colleagues to ensure that they are included and fairly represented. Through our active LGBT+ staff network we have delivered several successful Sexual Orientation and Transgender/Gender Identity activities, events and communications celebrating, raising awareness and the visibility of our LGBT+ employees.
Social Mobility
Social Mobility forms a key part of our Diversity and Levelling Up agenda. This year:
- the Social Mobility Network has been instrumental in organising and delivering events across the Department and supporting a growing community of allies which currently stands at approx. 1200
- we have continued to promote several initiatives to support development and progression including participation in cross-government mentoring programmes, success profile application support and confidence building, including addressing self-limiting beliefs
- in recognition of our work, we were ranked 22nd in the Social Mobility 2022 Employer Index
- we continuously monitor workforce data relating to socio-economic background to highlight areas which require targeted support
Gender pay gap
The gender pay gap (GPG) figures for all large UK employers were published for the first time in December 2017. These publications provide unprecedented transparency of the difference between men’s and women’s average earnings, generate debate and encourage employers to take action to close the pay gap. We have mechanisms in place to ensure that men and women are paid equally for the same jobs, but a mean GPG exists which is largely attributed to the structure of our workforce.
We’ve made positive progress in increasing female representation at the most senior grades. Our 2025 target was to achieve gender parity of 50% in our SCS roles, we met that target in March 2021 and had exceeded this at March 2022. At SCS1 and SCS3, as of March 2022 we had over 50% of roles filled by females. However, at our feeder grades (Grades SEO, 6 and 7), there is further work to be done in reaching proportionate representation of genders, and this, in part, is what contributes to our gender pay gap.
Statement of Outturn against Parliamentary Supply (SOPS)
Introduction
In addition to the primary statements prepared under International Financial Reporting Standards (IFRS), the government Financial Reporting Manual (FReM) requires us to prepare a statement of Outturn against Parliamentary Supply (SOPS) and supporting notes.
The SOPS and related notes are subject to audit, as detailed in the Certificate and Report of the Comptroller and Auditor General to the House of Commons.
The SOPS is a key accountability statement that shows, in detail, how an entity has spent against their Supply Estimate. Supply is the monetary provision (for resource and capital purposes) and cash (drawn primarily from the Consolidated Fund), that Parliament gives statutory authority for entities to utilise. The Estimate details supply and is voted on by Parliament at the start of the financial year.
Should an entity exceed the limits set by their Supply Estimate, called control limits, their accounts will receive a qualified opinion.
The format of the SOPS mirrors the Supply Estimates, published on GOV.UK, to enable comparability between what Parliament approves and the final outturn.
The SOPS contain a summary table, detailing performance against the control limits that Parliament have voted on, cash spent (budgets are compiled on an accruals basis and so outturn won’t exactly tie to cash spent) and administration.
The supporting notes detail the following:
- outturn by Estimate line, providing a more detailed breakdown (note 1)
- a reconciliation of outturn to net operating expenditure in the SoCNE, to tie the SOPS to the financial statements (note 2)
- a reconciliation of outturn to net cash requirement (note 3) and
- an analysis of income payable to the Consolidated Fund (note 4)
The SOPS and Estimates are compiled against the budgeting framework, which is similar to, but different from, IFRS. Further information on the Public Spending Framework and the reasons why budgeting rules are different to IFRS can also be found in chapter 1 of the Consolidated Budgeting Guidance, available on GOV.UK.
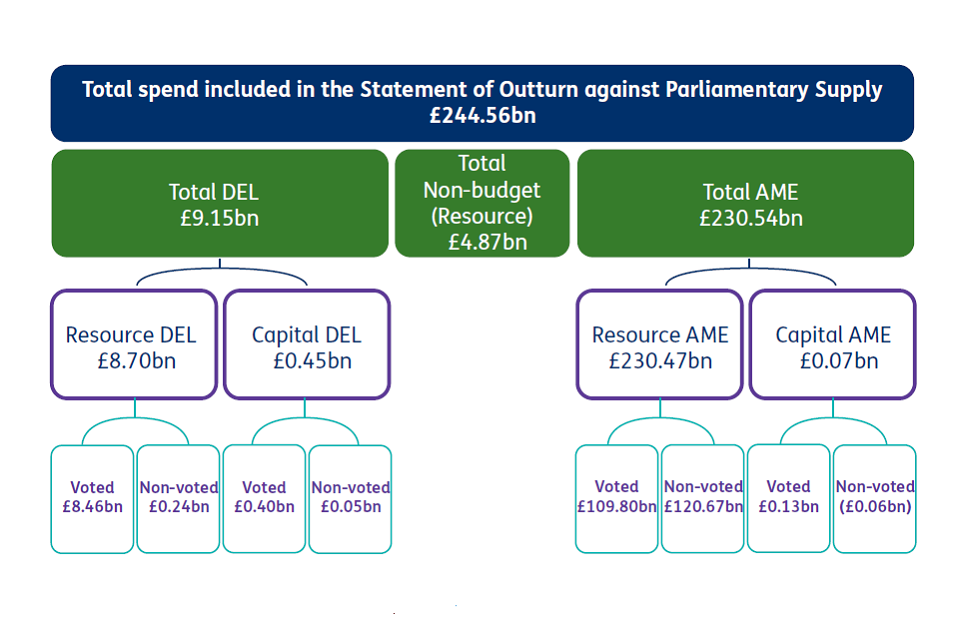
- voted expenditure of £123.66 billion is funded by Parliament from the Consolidated Fund
- voted expenditure funded from the Consolidated Fund includes £4.87 billion cash for the Social Fund administered by DWP which, for budgeting purposes, is classified as non-budget
- expenditure from the Social Fund is classified as non-voted budget DEL and AME. Therefore, SOPS includes both the cash paid into the Social Fund and the spend incurred by the Social Fund
- other non-voted expenditure of £116.13 billion is funded by the National Insurance Fund
- values may not sum due to roundings
The SOPS provides a detailed view of financial performance, in a form that is voted on and recognised by Parliament. The financial review in the Performance Report, provides a summarised discussion of outturn against Estimate, and functions as an introduction to the SOPS disclosures.
Statement of Outturn against Parliamentary Supply
| Expenditure | Note | Outturn: voted 2022/23 £000 | Outturn: non-voted 2022/23 £000 | Outturn: total | 2022/23 £000 | Estimate: voted 2022/23 £000 | Estimate: non-voted 2022/23 £000 | Estimate: total 2022/23 £000 | Outturn vs Estimate Saving/(excess): voted 2022/23 £000 |
Outturn vs Estimate Saving/(excess): total 2022/23 £000 |
Prior Year outturn: total £000 |
|---|---|---|---|---|---|---|---|---|---|---|---|
| Departmental Expenditure Limit: resource |
1.1 | 8,459,214 | 236,941 | 8,696,155 | 8,525,281 | 241,257 | 8,766,538 | 66,067 | 70,383 | 8,971,833 | |
| Departmental Expenditure Limit: Capital |
1.2 | 403,979 | 45,585 | 449,564 | 530,054 | 46,091 | 576,145 | 126,075 | 126,581 | 626,130 | |
| Total DEL | 8,863,193 | 282,526 | 9,145,719 | 9,055,335 | 287,348 | 9,342,683 | 192,142 | 196,964 | 9,597,963 | ||
| Annually Managed Expenditure: resource | 1.1 | 109,796,510 | 120,674,472 | 230,470,982 | 114,431,143 | 122,605,805 | 237,036,948 | 4,634,633 | 6,565,966 | 216,029,683 | |
| Annually Managed Expenditure: Capital | 1.2 | 133,307 | (63,362) | 69,945 | 155,728 | – | 155,728 | 22,421 | 85,783 | 30,264 | |
| Total AME | 109,929,817 | 120,611,110 | 230,540,927 | 114,586,871 | 122,605,805 | 237,192,676 | 4,657,054 | 6,651,749 | 216,059,947 | ||
| Total Budget: resource | 118,255,724 | 120,911,413 | 239,167,137 | 122,956,424 | 122,847,062 | 245,803,486 | 4,700,700 | 6,636,349 | 225,001,516 | ||
| Total Budget: capital | 537,286 | (17,777) | 519,509 | 685,782 | 46,091 | 731,873 | 148,496 | 212,364 | 656,394 | ||
| Total Budget Expenditure | 118,793,010 | 120,893,636 | 239,686,646 | 123,642,206 | 122,893,153 | 246,535,359 | 4,849,196 | 6,848,713 | 225,657,910 | ||
| Non-Budget: resource | 1.1 | 4,869,429 | – | 4,869,429 | 5,106,388 | – | 5,106,388 | 236,959 | 236,959 | 2,049,113 | |
| Total Budget and Non-budget | 123,662,439 | 120,893,636 | 244,556,075 | 128,748,594 | 122,893,153 | 251,641,747 | 5,086,155 | 7,085,672 | 227,707,023 |
Figures in the columns shaded cover the voted control limits voted by Parliament. Refer to the Supply Estimates guidance manual, available on GOV.UK, for detail on the control limits voted by Parliament.
Net Cash Requirement 2022-23
| SOPS Note | 2022-23 Outturn £000 | 2022-23 Estimate £000 | Outturn vs Estimate: saving/(excess) £000 | 2021-22 Outturn £000 |
|---|---|---|---|---|
| 3 | 126,011,587 | 130,924,110 | 4,912,523 | 113,066,829 |
Administration Costs 2022-23
| SOPS Note | 2022-23 Outturn £000 | 2022-23 Estimate £000 | Outturn vs Estimate: saving/(excess) £000 | 2021-22 Outturn £000 |
|---|---|---|---|---|
| 1.1 | 874,326 | 969,823 | 95,497 | 919,852 |
Although not a separate voted limit, any breach of the administration budget will also result in an excess vote.
Notes to the Statement of Outturn against Parliamentary Supply
SOPS 1. Outturn Detail by Estimate Line
Resource Outturn 2022-23
| Spending in Departmental Expenditure Limit | Administration Gross £000 |
Administration Income £000 |
Administration Net £000 |
Programme Gross £000 |
Programme Income £000 |
Programme Net £000 |
Total | Outturn total 2021-22 £000 |
|---|---|---|---|---|---|---|---|---|
| Voted: A Core Department | 833,837 | (33,782) | 800,055 | 6,022,045 | (778,226) | 5,243,819 | 6,043,874 | 5,989,591 |
| Voted: B Health and Safety Executive (Net) | 57,401 | – | 57,401 | 99,610 | – | 99,610 | 157,011 | 162,337 |
| Voted: C Money and Pensions Service (Net) | – | – | – | 155,646 | – | 155,646 | 155,646 | 150,387 |
| Voted: D Other Arm’s Length Bodies (Net) | 16,870 | – | 16,870 | 91,024 | – | 91,024 | 107,894 | 105,024 |
| Voted: E Employment Programmes | – | – | – | 817,030 | (2,122) | 814,908 | 814,908 | 790,274 |
| Voted: F Support for Local Authorities | – | – | – | 211,657 | – | 211,657 | 211,657 | 214,300 |
| Voted: G Funding for Public Corporations | – | – | – | 32,112 | (41,432) | (9,320) | (9,320) | (1.104) |
| Voted: H Other Benefits | – | – | – | 1,025,151 | (47,607) | 977,544 | 977,544 | 813,305 |
| Total Voted DEL | 908,108 | (33,782) | 874,326 | 8,454,275 | (869,387) | 7,584,888 | 8,459,214 | 8,224,114 |
| Non-voted: I National Insurance Fund - Core Department | – | – | – | 214,84 | (3,500) | 211,347 | 211,347 | 713,735 |
| Non-voted: J Social fund | – | – | – | 25,594 | – | 25,594 | 25,594 | 33,984 |
| Total Non-Voted DEL | – | – | – | 240,441 | (3,500) | 236,941 | 236,941 | 747,719 |
| Total spending in DEL | 908,108 | (33,782) | 874,326 | 8,694,716 | (872,887) | 7,821,829 | 8,696,155 | 8,971,833 |
Estimate 2022-23
| Spending in Departmental Expenditure Limit | Total £000 | Virements £000 | Total including virements £000 | Outturn vs Estimate saving/(excess) | Outturn total 2021-22 £000 |
|---|---|---|---|---|---|
| Voted: A Core Department | 6,182,530 | (80,671) | 6,101,859 | 57,985 | 5,989,591 |
| Voted: B Health and Safety Executive (Net) | 161,172 | – | 161,172 | 4,161 | 162,337 |
| Voted: C Money and Pensions Service (Net) | 154,699 | 947 | 155,646 | – | 150,387 |
| Voted: D Other Arm’s Length Bodies (Net) | 111,126 | – | 111,126 | 3,232 | 105,024 |
| Voted: E Employment Programmes | 748,956 | 65,952 | 814,908 | – | 790,274 |
| Voted: F Support for Local Authorities | 211,621 | 36 | 211,657 | – | 214,300 |
| Voted: G Funding for Public Corporations | (8,631) | – | (8,631) | 689 | (1.104) |
| Voted: H Other Benefits | 963,808 | 13,736 | 977,544 | – | 813,305 |
| Total Voted DEL | 8,525,281 | - | 8,525,281 | 66,067 | 8,224,114 |
| Non-voted: I National Insurance Fund - Core Department | 211,347 | – | 211,347 | – | 713,735 |
| Non-voted: J Social fund | 29,910 | – | 29,910 | 4,316 | 33,984 |
| Total Non-Voted DEL | 241,257 | – | 241,257 | 4,316 | 747,719 |
| Total spending in DEL | 8,766,538 | – | 8,766,538 | 70,383 | 8,971,833 |
Resource Outturn 2022-23
| Spending in Annually Managed Expenditure | Administration Gross £000 |
Administration Income £000 |
Administration Net £000 |
Programme Gross £000 |
Programme Income £000 |
Programme Net £000 |
Total | Outturn total 2021-22 £000 |
|---|---|---|---|---|---|---|---|---|
| Voted: K Severe Disablement Benefit | – | – | – | 58,390 | – | 58,390 | ||
| Voted: L Industrial Injuries Benefits Scheme | – | – | – | 695,401 | – | 695,401 | 695,401 | |
| Voted: M Universal Credit | – | – | – | 41,169,896 | – | 41,169,896 | 41,169,896 | |
| Voted: N Employment and Support Allowance (Non-Contributory) |
- | - | - | 7,561,029 | - | 7,561,029 | 7,561,029 | |
| Voted: O Income Support | – | – | – | 865,887 | (328) | 865,559 | 865,559 | |
| Voted: P Pension Credit | – | – | – | 4,935,310 | – | 4,935,310 | 4,935,310 | |
| Voted: Q Financial Assistance Scheme | – | – | – | (1,663,907) | – | (1,663,907) | (1,663,907) | |
| Voted: R Attendance Allowance | – | – | – | 5,668,053 | – | 5,668,053 | 5,668,053 | |
| Voted: S Personal Independence Payment | – | – | – | 17,636,766 | – | 17,636,766 | 17,636,766 | |
| Voted: T Disability Living Allowance | – | – | – | 5,974,758 | – | 5,974,758 | 5,974,758 | |
| Voted: U Carer’s Allowance | – | – | – | 3,249,815 | – | 3,249,815 | 3,249,815 | |
| Voted: V Housing Benefit | – | – | – | 14,875,704 | – | 14,875,704 | 14,875,704 | |
| Voted: W Statutory Maternity Pay | – | – | – | 2,628,923 | – | 2,628,923 | 2,628,923 | |
| Voted: X Christmas Bonus (Non-Contributory) | – | – | – | 40,747 | – | 40,747 | 40,747 | |
| Voted: Y Jobseekers Allowance (Non-Contributory) | – | – | – | 225,151 | (4) | 225,147 | 225,147 | |
| Voted: Z State Pension (Non-Contributory) | – | – | – | 179,185 | – | 179,185 | 179,185 | |
| Voted: AA Support for Mortgage Interest | – | – | – | 3,346 | (1,576) | 1,770 | 1,770 | |
| Voted: AB Cost of Living support payments | – | – | – | 5,665,489 | – | 5,665,489 | 5,665,489 | |
| Voted: AC Other Expenditure | – | – | – | 28,818 | – | 28,818 | 28,818 | |
| Voted: Other Expenditure EALBs (Net) | – | – | – | (343) | – | (343) | (343) | |
| Total Voted AME | – | – | – | 109,798,418 | (1,908) | 109,796,510 | 109,796,510 | |
| Non-voted: Non-voted: AD Incapacity Benefit | – | – | – | 11,759 | – | 11,759 | 11,759 | |
| Non-voted: AE Employment and Support Allowance (Contributory) | – | – | – | 4,527,025 | – | 4,527,025 | 4,527,025 | |
| Non-voted: AF Social Fund: Winter Fuel | – | – | – | 4,565,822 | – | 4,565,822 | 4,565,822 | |
| Non-voted: AG Social Fund: Other | – | – | – | 191,742 | – | 191,742 | 191,742 | |
| Non-voted: AH Maternity Allowance | – | – | – | 389,603 | – | 389,603 | 389,603 | |
| Non-voted: AI Bereavement Benefits | – | – | – | 398,832 | – | 398,832 | 398,832 | |
| Non-voted: AJ Christmas Bonus (Contributory) | – | – | – | 125,876 | – | 125,876 | 125,876 | |
| Non-voted: AK Jobseekers Allowance (Contributory) | – | – | – | 108,356 | (3) | 108,353 | 108,353 | |
| Non-voted: AL State Pension (Contributory) | – | – | – | 110,355,460 | (0) | 110,355,460 | 110,355,460 | |
| Total AME Non-voted | – | – | – | 120,674,475 | (3) | 120,674,472 | 120,674,472 | |
| Total spending in AME | – | – | – | 230,472,893 | (1,911) | 230,470,982 | 230,470,982 | |
| Non-budget resource: Voted: AM Cash paid in to the Social Fund | – | – | – | 4,869,429 | – | 4,869,429 | 4,869,429 | |
| Total spending in Non-budget | – | – | – | 4,869,429 | – | 4,869,429 | 4,869,429 | |
| Total Resource | 908,108 | (33,782) | 874,326 | 244,037,038 | (874,798) | 243,162,240 | 244,036,566 |
Estimate 2022-23
| Spending in Annually Managed Expenditure | Total £000 | Virements £000 | Total including virements £000 | Outturn vs Estimate saving/(excess) | Outturn total 2021-22 £000 |
|---|---|---|---|---|---|
| Voted: K Severe Disablement Benefit | 59,452 | – | 59,452 | 1,062 | 62,393 |
| Voted: L Industrial Injuries Benefits Scheme | 711,206 | – | 15,805 | 704,847 | |
| Voted: M Universal Credit | 44,096,462 | (313,162) | 43,783,300 | 2,613,404 | 40,592,115 |
| Voted: N Employment and Support Allowance (Non-Contributory) |
8,162,579 | – | 8,162,579 | 601,550 | 8,181,765 |
| Voted: O Income Support | 720,879 | 144,680 | 865,559 | – | 767,663 |
| Voted: P Pension Credit | 5,070,637 | – | 5,070,637 | 135,327 | 4,834,399 |
| Voted: Q Financial Assistance Scheme | (1,611,820) | – | (1,611,820) | 52,087 | 944,689 |
| Voted: R Attendance Allowance | 5,794,677 | – | 5,794,677 | 126,624 | 5,307,254 |
| Voted: S Personal Independence Payment | 18,315,284 | – | 18,315,284 | 678,518 | 15,208,996 |
| Voted: T Disability Living Allowance | 6,122,914 | – | 6,122,914 | 148,156 | 5,695,785 |
| Voted: U Carer’s Allowance | 3,378,905 | – | 3,378,905 | 129,090 | 3,074,765 |
| Voted: V Housing Benefit | 14,746,782 | 128,922 | 14,875,704 | – | 15,544,951 |
| Voted: W Statutory Maternity Pay | 2,652,614 | – | 2,652,614 | 23,691 | 2,569,293 |
| Voted: X Christmas Bonus (Non-Contributory) | 38,790 | 1,957 | 40,747 | – | 37,098 |
| Voted: Y Jobseekers Allowance (Non-Contributory) | 203,362 | 21,785 | 225,147 | – | 300,022 |
| Voted: Z State Pension (Non-Contributory) | 211,419 | – | 211,419 | 32,234 | 159,676 |
| Voted: AA Support for Mortgage Interest | (7,546) | 9,316 | 1,770 | – | 3,163 |
| Voted: AB Cost of Living support payments | 5,742,231 | – | 5,742,231 | 76,742 | – |
| Voted: AC Other Expenditure | 22,316 | 6,502 | 28,818 | – | 6,386 |
| Voted: Other Expenditure EALBs (Net) | – | – | – | 343 | 457 |
| Total Voted AME | 114,431,143 | – | 114,431,143 | 4,634,633 | 103,995,717 |
| Non-voted: Non-voted: AD Incapacity Benefit | 752 | – | 752 | (11,007) | (8,644) |
| Non-voted: AE Employment and Support Allowance (Contributory) | 4,680,113 | – | 4,680,113 | 153,088 | 4,506,760 |
| Non-voted: AF Social Fund: Winter Fuel | 4,587,388 | – | 4,587,388 | 21,566 | 1,974,149 |
| Non-voted: AG Social Fund: Other | 498,500 | – | 498,500 | 306,758 | 10,382 |
| Non-voted: AH Maternity Allowance | 390,377 | – | 390,377 | 774 | 362,396 |
| Non-voted: AI Bereavement Benefits | 489,920 | – | 489,920 | 91,088 | 341,422 |
| Non-voted: AJ Christmas Bonus (Contributory) | 126,216 | – | 126,216 | 340 | 124,104 |
| Non-voted: AK Jobseekers Allowance (Contributory) | 91,126 | – | 91,126 | (17,227) | 190,139 |
| Non-voted: AL State Pension (Contributory) | 111,741,413 | - | 111,741,413 | 1,385,953 | 104,533,256 |
| Total AME Non-voted | 122,605,805 | – | 122,605,805 | 1,931,333 | 112,033,965 |
| Total spending in AME | 237,036,948 | – | 237,036,948 | 6,565,966 | 216,029,683 |
| Non-budget resource: Voted: AM Cash paid in to the Social Fund | 5,106,388 | – | 5,106,388 | 236,959 | 2,049,113 |
| Total spending in Non-budget | 5,106,388 | – | 5,106,388 | 236,959 | 2,049,113 |
| Total Resource | 250,909,874 | – | 250,909,874 | 6,873,308 | 227,050,629 |
1.2 Analysis of Capital Outturn by Estimate Line
Capital Outturn 2022-23
| Spending in Departmental Expenditure Limit | Programme Gross £000 |
Programme Income £000 |
Programme Net £000 |
Outturn total 2021-22 £000 |
|---|---|---|---|---|
| Voted: A Core Department | 266,356 | (35,667) | 230,689 | 442,146 |
| Voted: B Health and Safety Executive (Net) | 13,729 | – | 13,729 | 16,738 |
| Voted: C Money and Pensions Service (Net) | 11,957 | – | 11,957 | 180 |
| Voted: D Other Arm’s Length Bodies (Net) | 8,104 | – | 8,104 | 5,948 |
| Voted: G Funding for Public Corporations | 139,500 | – | 139,500 | 112,604 |
| Total Voted DEL | 439,646 | (35,667) | 403,979 | 577,616 |
| Non-voted: J Social fund | 46,177 | (592) | 45,585 | 48,514 |
| Total Non-Voted DEL | 46,177 | (592) | 45,585 | 48,514 |
| Total spending in DEL | 485,823 | (36,259) | 449,564 | 626,130 |
Estimate 2022-23
| Spending in Departmental Expenditure Limit | Total £000 | Virements £000 | Total including virements £000 | Outturn vs Estimate saving/(excess) | Outturn total 2021-22 £000 |
|---|---|---|---|---|---|
| Voted: A Core Department | 352,197 | – | 352,197 | 121,508 | 442,146 |
| Voted: B Health and Safety Executive (Net) | 15,115 | – | 15,115 | 1,386 | |
| Voted: C Money and Pensions Service (Net) | 12,581 | – | 12,581 | 624 | 180 |
| Voted: D Other Arm’s Length Bodies (Net) | 10,661 | – | 10,661 | 2,557 | 5,948 |
| Voted: G Funding for Public Corporations | 139,500 | – | 139,500 | – | 112,604 |
| Total Voted DEL | 530,054 | – | 530,054 | 126,075 | 577,616 |
| Non-voted: J Social fund | 46,091 | – | 46,091 | 506 | 48,514 |
| Total Non-Voted DEL | 46,091 | – | 46,091 | 506 | 48,514 |
| Total spending in DEL | 576,145 | – | 576,145 | 126,581 | 626,130 |
Capital Outturn 2022-23
| Spending in Annually Managed Expenditure | Programme Gross £000 |
Programme Income £000 |
Programme Net £000 |
Outturn total 2021-22 £000 |
|---|---|---|---|---|
| Voted: M Universal Credit | 244,063 | (134,178) | 109,885 | |
| Voted: AA Support for Mortgage Interest | 23,684 | (7,515) | 16,169 | |
| Voted: AB Other Expenditure | 7,253 | – | 7,253 | |
| Total Voted AME | 275,000 | (141,693) | 133,307 | |
| Non-voted: AG Social Fund: Other | (63,362) | 0 | (63,362) | |
| Total AME Non-voted | (63,362) | – | (63,362) | |
| Total spending in AME | 211,638 | (141,693) | 69,945 | |
| Total Capital | 697,461 | (177,952) | 519,509 |
Estimate 2022-23
| Spending in Annually Managed Expenditure | Total £000 | Virements £000 | Total including virements £000 | Outturn vs Estimate saving/(excess) | Outturn total 2021-22 £000 |
|---|---|---|---|---|---|
| Voted: M Universal Credit | 129,470 | (7,253) | 122,217 | 12,332 | 69,864 |
| Voted: AA Support for Mortgage Interest | 26,258 | – | 26,258 | 10,089 | 18,399 |
| Voted: AB Other Expenditure | – | 7,253 | 7,253 | – | – |
| Total Voted AME | 155,728 | – | 155,728 | 22,421 | 88,263 |
| Non-voted: AG Social Fund: Other | – | – | – | 63,362 | (57,999) |
| Total AME Non-voted | – | – | – | 63,362 | (57,999) |
| Total spending in AME | 155,728 | – | 155,728 | 85,783 | 30,264 |
| Total Capital | 731,873 | – | 731,873 | 212,364 | 656,394 |
The total Estimate columns include virements. Virements are the reallocation of provision in the Estimates that do not require parliamentary authority (because Parliament does not vote to that level of detail and delegates to HM Treasury). Further information on virements is provided in the Supply Estimates Manual, available on GOV.UK
The outturn vs Estimate column is based on the total including virements. The Estimate total before virements have been made is included so that users can tie the Estimate back to the Estimates laid before Parliament.
SOPS 2. Reconciliation of Outturn to Net Operating Expenditure
| Description | Expenditure | Note | 2022-23 Outturn £000 | 2021-22 Outturn £000 |
|---|---|---|---|---|
| Budget | 1.1 | 239,167,137 | 225,001,516 | |
| Total resource outturn in Statement of Parliamentary Supply |
Non-budget | 1.1 | 4,869,429 | 2,049,113 |
| Total resource outturn in Statement of Parliamentary Supply |
Total resource outturn | 244,036,566 | 227,050,629 | |
| Add: | Capital Grants | (131,692) | (448,722) | |
| Add: | Capital Research and Development | 12,575 | 17,363 | |
| Add: | Service Concession Adjustments | (1,287) | (513) | |
| Total | (120,404) | (431,872) | ||
| Less: | Income payable to the Consolidated Fund | 4 | (18,013) | (34,149) |
| Less: | Cash paid to the Social Fund – Voted Non-budget | (4,869,429) | (2,049,113) | |
| Total | 4,887,442) | (2,083,262) | ||
| Net Operating Costs in Consolidated Statement of Comprehensive Net Expenditure | 239,028,720 | 224,535,495 |
As noted in the introduction to the SOPS, the outturn and the Estimate are compiled against the budgeting framework, which is similar to, but different from, IFRS. Therefore, this reconciliation bridges the resource outturn to net operating expenditure, linking the SOPS to the financial statements.
Reconciling items
Provided below is an explanation of the reconciling items between resource outturn and net operating costs.
Capital grants (whether received or issued) and capital research and development are budgeted for as capital, but accounted for as resource spend in the SoCNE.
Service concession contracts are accounted for as operating leases in SOPS (in line with National Accounts) and as finance leases in the SoCNE (in line with IFRS16). The different treatment can lead to time and value differences in the recognition of spend that require a reconciling adjustment.
Income payable to the Consolidated Fund is excluded from the SOPS because Parliament did not authorise the Department to retain the income and the income will be returned to the Consolidated Fund. However, in line with IFRS, income earned by the Department is recognised in the SoCNE.
Cash paid to the Social Fund from the Consolidated Fund is included in SOPS as non-budget but is excluded from the SoCNE. The SoCNE only includes the expenditure incurred by the Social Fund (also included in SOPS as spend within Budget).
SOPS 3. Reconciliation of Net Resource Outturn to Net Cash Requirement
| Description | Note | 2022-23 Outturn £000 | 2022-23 Estimate £000 | Outturn v Estimate: saving/Excess £000 |
|---|---|---|---|---|
| Total Resource outturn | SOPS 1.1 | 244,036,566 | 250,909,874 | 6,873,308 |
| Total Capital outturn | SOPS 1.2 | 519,509 | 731,873 | 212,364 |
| Adjustments for ALBs: Remove voted resource and capital | (453,998) | (465,354) | (11,356) | |
| Adjustments for ALBs: Add cash grant-in-aid | 440,422 | 397,027 | (43,395) | |
| Adjustments to remove non-cash items: Non-cash items | 1,803,557 | 721,032 | (1,082,525) | |
| Adjustments to reflect movements in working balances: Changes in working capital other than cash | 55,358 | 1,000,000 | 944,642 | |
| Adjustments to reflect movements in working balances: Use of provisions | 503,809 | 522,811 | 19,002 | |
| Adjustments to reflect movements in working balances: Non-Voted Budget | (120,893,636) | (122,893,153) | (1,999,517) | |
| Adjustments to reflect movements in working balances: | Net Cash Requirement | 126,011,587 | 130,924,110 | 4,912,523 |
As noted in the introduction to the SOPS, outturn and the Estimate are compiled against the budgeting framework, not on a cash basis. Therefore, this reconciliation bridges the resource and capital outturn to the net cash requirement.
SOPS 4. Analysis of income payable to the Consolidated Fund
In addition to income retained by the Department, the following income is payable to the Consolidated Fund.
| Income description | Outturn 2022-23: Income £000 | Outturn 2022-23: Receipts £000 | Outturn 2021-22: Income £000 | Outturn 2021-22: Receipts £000 |
|---|---|---|---|---|
| Income outside of the ambit of the Estimate | 18,013 | 18,730 | 34,149 | 33,980 |
| Excess cash surrenderable to the Consolidated Fund | 1,659 | 1,659 | 1,639 | 1,639 |
| Total | 19,672 | 20,389 | 35,788 | 35,619 |
Income payable to the Consolidated Fund is excluded from our Estimate because Parliament did not authorise the Department to retain the income, it will be returned to the Consolidated Fund. However, in line with IFRS, income earned by the Department is recognised in the SoCNE.
Included in the above Consolidated Fund income for 2022-23 of £19.7 million are costs recovered from the automatic enrolment fines collected by The Pensions Regulator (£8.5 million), income received in respect debt recoveries (£3.5 million) and collection of civil penalties (£3.4 million).
Consolidated Fund income shown above does not include any amounts we collect from the Financial Assistance Scheme (FAS) while acting as agent of the Consolidated Fund rather than as principal. Details of income collected as agent for the Consolidated Fund were in previous years disclosed in a FAS Trust Statement, but as the revenue is no longer material to DWP the need to produce a Trust Statement no longer exists.
FAS does, however, still hold several illiquid assets, mainly annuity policies, transferred from FAS qualifying pension schemes, and continues to collect the income arising from those assets and pay the resulting cash over to the Consolidated Fund. In the year to 31 March 2023, FAS collected income totalling £8.7 million, consisting of annuity and other income, scheme transfer income was £nil (2021-22: £8.6 million, consisting of annuity and other income of £8.4 million and scheme transfer income of £0.2 million). £8.6 million was paid over to the Consolidated Fund during the year (2021-22: £8.7 million). At 31 March 2023, FAS illiquid assets were valued at £103.1 million (2021-22: £127.9 million) and FAS held cash awaiting transfer to the Consolidated Fund of £0.4 million (2021-22: £0.3 million).
Variances
The disclosed variances are those which meet the following criteria:
- variance of at least £10 million and 10%
- variances material by nature
The variances are stated in the order they appear in the Statement of Outturn against Parliamentary Supply and are calculated by comparing the total net figure from the Supplementary Estimate 2022-23 with the final net outturn figure for 2022-23. These variances are calculated prior to virements.
Voted Expenditure – DEL
A – Core Department – Resource and Capital
Resource outturn was £138.66 million lower than Estimate. The variance is due to reduced spend in change transformation programmes:
- health transformation; including reductions due to changes and uncertainty around costs for PIP end to end, and changes to the management of lease terms.
- workplace transformation; including impacts of IFRS16 accounting adjustments and reductions in some building costs.
Capital outturn reduced by £121.51 million due to reductions in workplace transformation expenditure.
E – Employment Programmes – Resource
Outturn was £65.95 million higher than Estimate due to additional spending in Access to Work caused by increased volumes of claims and the increased cost of fuel, which has increased the value per claim.
AME
The Office for Budget Responsibility forecasts of benefit expenditure, on which our Estimate are based, are central estimates. Each year we apply a margin to reflect the inherent uncertainty that these forecasts are equally likely to go up or down.
Voted Expenditure – AME
M – Universal Credit – Resource and Capital
Resource outturn is £2.93 billion less than Estimate largely due to the margin added at Supplementary Estimate not being utilised. This margin was added to mitigate against uncertainty around:
- cost of Living
- health journey caseload
- impact that changes in the labour market may have on demand
Capital outturn relates to UC advances and this is £19.59 million less than was forecasted at Supplementary Estimate.
N – Employment and Support Allowance (Non-contributory)
Outturn was £601.55 million lower than Estimate. This is in part due to arrears activity starting later than anticipated, leading to expenditure being lower than forecast. A 2% margin was also added at Supplementary Estimate which is part of the difference.
O – Income Support – Resource
Outturn was £144.68 million higher than Estimate as a result of a change to the impairment model.
Y- Jobseekers Allowance (Non-contributory) – Resource
Outturn was £21.79 million higher than Estimate as a result of a change to the impairment model.
Z – State Pension (Non-contributory) – Resource
Outturn was £32.23 million lower than Estimate. This is partially due to the State Pension LEAP underpayments correction exercise being lower than forecast. Our delivery is backloaded, with case reviews expected to significantly increase in 2023.
AA – Support for Mortgage Interest – Capital
Outturn was £10.09 million lower than Estimate due to the Standard Interest Rate, which is used for SMI, being lower than Office for Budget Responsibility’s forecasted interest rate.
Non-voted Expenditure – AME
AD – Incapacity Benefit – Resource
Outturn was £11 million higher than Estimate as a result of a change to the impairment model.
AG – Social Fund: Other – Resource and Capital
Resource outturn was £306.76 million lower than Estimate due to large margins included for the unpredictable nature of Cold Weather Payment at Supplementary Estimate.
Capital outturn has reduced by £63.4 million as recoveries for budgeting and crisis loans exceeded expectations. These loans are self funding and were therefore at a net nil position at Supplementary Estimate.
AI – Bereavement Benefit – Resource
Outturn was £91.09 million lower than Estimate. Bereavement benefits are driven by entitlement and therefore can fluctuate from the Estimate.
AK – Jobseekers Allowance (Contributory) - Resource
Outturn was £17.23 million higher than Estimate due to a higher number of claims than forecast in the latter half of 2022-23.
AL – State Pension (Contributory) – Resource
Outturn was £1.39 billion lower than Estimate. The difference between P12 and the Supplementary Estimate is largely attributable to a combination of margin and changes in provisions.
Core Tables
(This information is not subject to audit)
Table 1: Public spending for the Department for Work and Pensions
| Resource DEL[2] | 2018-19 Outturn £m | 2019-20 Outturn £m | 2020-21 Outturn £m | 2021-22 Outturn £m | 2022-23 Outturn £m | 2023-24 Plans £m | 2024-25 Plans £m | |
|---|---|---|---|---|---|---|---|---|
| Section A: Core Department | 4,475 | 4,495 | 4,667 | 5,990 | 6,044 | 6,304 | 5,946 | |
| Section B: Health and Safety Executive (Net) | 124 | 128 | 165 | 162 | 157 | 172 | 135 | |
| Section C: Money and Pensions Service (Net) | 94 | 107 | 139 | 150 | 156 | 161 | 177 | |
| Section D: Other Arm’s Length Bodies (Net) | 96 | 101 | 106 | 105 | 108 | 125 | 115 | |
| Section E: Employment Programmes | 285 | 246 | 293 | 790 | 815 | 771 | 816 | |
| Section F: Support for Local Authorities | 238 | 217 | 237 | 214 | 212 | 222 | 212 | |
| Section G: Funding for Public Corporations | (10) | (9) | (13) | (1) | (9) | 6 | 7 | |
| Section H: Other Benefits | 148 | 136 | 344 | 813 | 978 | 1,005 | 125 | |
| Section I: National Insurance Fund - Core Department | 491 | 432 | 687 | 714 | 211 | 235 | 544 | |
| Section J: Social Fund | 25 | 30 | 36 | 34 | 26 | 23 | 23 | |
| Total Resource DEL | 5,966 | 5,883 | 6,661 | 8,972 | 8,8696 | 9,024 | 8,102 | |
| Staff costs | 2,975 | 3,044 | 3,499 | 3,865 | 3,756 | 3,754 | 4,015 | |
| Purchase of goods and services | 2,092 | 1,952 | 2,237 | 2,504 | 2,324 | 3,529 | 3,369 | |
| Income from sales of goods and services | (245) | (274) | (294) | (229) | (222) | (259) | (222) | |
| Current grants to local government (Net) | 508 | 431 | 640 | 1,106 | 1,236 | 1,178 | 312 | |
| Current grants to persons and non-profit bodies (Net) | 873 | 574 | 464 | 1,672 | 1,520 | 321 | 246 | |
| Current grants abroad (Net) | (602) | (280) | (186) | (283) | (556) | (16) | (1) | |
| Subsidies to public corporations | 47 | 49 | 48 | 48 | 39 | 33 | 31 | |
| Rentals | 170 | 169 | 54 | 18 | 34 | (5) | (5) | |
| Depreciation | 3 | 206 | 188 | 185 | 264 | 565 | 612 | 488 |
| Take up of provisions | – | 3 | 8 | 8 | – | – | – | |
| Change in pension scheme liabilities | 23 | 32 | 27 | – | – | – | – | |
| Other resource | (82) | (5) | (23) | (1) | 1 | (123) | (131) |
| Resource AME[4] | 2018-19 Outturn £m | 2019-20 Outturn £m | 2020-21 Outturn £m | 2021-22 Outturn £m | 2022-23 Outturn £m | 2023-24 Plans £m | 2024-25 Plans £m |
|---|---|---|---|---|---|---|---|
| Section K: Severe Disablement Benefit | 97 | 89 | 72 | 62 | 58 | 57 | 53 |
| Section L: Industrial Injuries Benefits Scheme | 838 | 831 | 723 | 705 | 695 | 737 | 742 |
| Section M: Universal Credit | 8,131 | 18,377 | 38,082 | 40,592 | 41,170 | 50,819 | 61,160 |
| Section N: Employment and Support Allowance (Non-contributory) | 10,535 | 9,339 | 8,817 | 8,182 | 7,561 | 8,244 | 7,543 |
| Section O: Income Support | 1,839 | 1,376 | 1,074 | 768 | 866 | 618 | 506 |
| Section P: Pension Credit | 5,140 | 5,061 | 5,071 | 4,834 | 4,935 | 5,437 | 5,722 |
| Section Q: Financial Assistance Scheme | (1,636) | (15) | 281 | 945 | (1,664) | 239 | 244 |
| Section R: Attendance Allowance | 5,676 | 5,908 | 5,345 | 5,307 | 5,668 | 6,686 | 7,428 |
| Section S: Personal Independence Payment | 10,635 | 12,513 | 13,692 | 15,209 | 17,637 | 21,855 | 24,934 |
| Section T: Disability Living Allowance | 8,126 | 7,233 | 5,808 | 5,696 | 5,975 | 6,732 | 7,367 |
| Section U: Carer’s Allowance | 2,884 | 2,941 | 3,039 | 3,075 | 3,250 | 3,879 | 4,290 |
| Section V: Housing Benefit | 20,178 | 17,813 | 17,027 | 15,545 | 14,876 | 14,297 | 13,951 |
| Section W: Statutory Maternity Pay | 2,587 | 2,169 | 2,594 | 2,569 | 2,629 | 2,843 | 2,976 |
| Section X: Christmas Bonus (Non-contributory) | 32 | 35 | 36 | 37 | 41 | 41 | 43 |
| Section Y: Jobseeker’s Allowance (Non-contributory) | 1,145 | 603 | 435 | 300 | 225 | 142 | 98 |
| Section Z: State Pension (Non-contributory) | 116 | 122 | 135 | 160 | 179 | 240 | 192 |
| Section AA: Support for Mortgage Interest | 6 | 6 | 6 | 3 | 2 | (7) | (11) |
| Section AB: Cost of Living Support Payments | – | – | – | – | 5,665 | 7,734 | 2 |
| Section AC: Other Expenditure | 466 | 238 | (49) | 6 | 29 | (4) | 0 |
| Section : Other Expenditure EALBs (Net) | (0) | (1) | (1) | – | (0) | – | – |
| Section AD: Incapacity Benefit | (1) | 5 | 5 | (9) | 12 | 2 | 3 |
| Section AE: Employment and Support Allowance (Contributory) | 4,563 | 4,512 | 4,567 | 4,507 | 4,527 | 4,955 | 5,027 |
| Section AF: Social Fund: Winter Fuel | 1,995 | 1,974 | 1,957 | 1,974 | 4,566 | 4,624 | 2,066 |
| Section AG: Social Fund: Other | 59 | 59 | 145 | 10 | 192 | 80 | 80 |
| Section AH: Maternity Allowance | 428 | 419 | 384 | 362 | 390 | 435 | 456 |
| Section AI: Bereavement Benefits | 463 | 506 | 498 | 341 | 399 | 433 | 362 |
| Section AJ: Christmas Bonus (Contributory) | (209) | (131) | 123 | 124 | 126 | 128 | 130 |
| Section AK: Jobseeker’s Allowance (Contributory) | 155 | 111 | 611 | 190 | 108 | 100 | 111 |
| Section AL: State Pension (Contributory) | 96,630 | 98,689 | 101,901 | 104,533 | 110,355 | 124,114 | 134,468 |
| Consolidated Fund Extra Receipts | – | – | – | – | – | – | – |
| Total Resource AME | 180,877 | 190,782 | 212,378 | 216,030 | 230,471 | 265,464 | 279,945 |
| Purchase of goods and services | 6 | 1 | – | – | – | – | – |
| Current grants to local government (Net) | 20,178 | 17,813 | 17,027 | 15,545 | 14,876 | 14,297 | 13,951 |
| Current grants to persons and non-profit bodies (Net) | 161,590 | 173,021 | 194,051 | 198,889 | 217,830 | 250,892 | 265,713 |
| Depreciation[3] | (118) | (24) | (107) | 224 | (1,476) | – | – |
| Take up of provisions | (923) | 48 | 1,555 | 1,504 | (399) | 235 | 244 |
| Release of provision | (703) | (610) | (394) | (498) | (750) | – | – |
| Change in pension scheme liabilities | (16) | (31) | (26) | 2 | 2 | – | – |
| Other resource | 862 | 565 | 271 | 364 | 389 | 40 | 36 |
| Total Resource Budget | 186,843 | 196,665 | 219,039 | 225,002 | 239,167 | 274,488 | 288,046 |
| Depreciation[3] | 88 | 164 | 78 | 488 | (911) | 612 | 488 |
| Capital DEL[5] | 2018-19 Outturn £m | 2019-20 Outturn £m | 2020-21 Outturn £m | 2021-22 Outturn £m | 2022-23 Outturn £m | 2023-24 Plans £m | 2024-25 Plans £m |
|---|---|---|---|---|---|---|---|
| Section A: Core Department | 189 | (35) | 279 | 442 | 231 | 649 | 501 |
| Section B: Health and Safety Executive (Net) | 7 | 8 | 11 | 17 | 14 | 25 | 9 |
| Section C: Money and Pensions Service (Net) | 1 | 2 | 1 | 0 | 12 | 9 | 6 |
| Section D: Other Arm’s Length Bodies (Net) | 0 | 0 | 8 | 6 | 8 | 0 | 0 |
| Section G: Funding for Public Corporations | 93 | 72 | 108 | 113 | 140 | 64 | 1 |
| Section J: Social Fund | 44 | 34 | 62 | 49 | 46 | 53 | 57 |
| Total Capital DEL | 334 | 81 | 468 | 626 | 450 | 800 | 574 |
| Staff costs | 2 | 1 | 2 | 3 | 3 | 0 | 0 |
| Purchase of goods and services | 1 | 0 | 3 | 14 | 8 | 16 | 16 |
| Capital grants to private sector companies (Net) | 1 | (1) | 0 | 0 | 3 | 0 | 0 |
| Capital support for public corporations | 93 | 72 | 108 | 110 | 138 | 64 | 1 |
| Purchase of assets | 197 | 111 | 319 | 457 | 286 | 612 | 415 |
| Income from sales of assets | (4) | (137) | (25) | (2) | (34) | (22) | (0) |
| Net lending to the private sector and abroad | 44 | 34 | 62 | 49 | 46 | 130 | 143 |
| Other capital | 0 | 0 | 0 | (4) | (0) | 0 | 0 |
| Capital AME | 2018-19 Outturn £m | 2019-20 Outturn £m | 2020-21 Outturn £m | 2021-22 Outturn £m | 2022-23 Outturn £m | 2023-24 Plans £m | 2024-25 Plans £m |
|---|---|---|---|---|---|---|---|
| Section M: Universal Credit | 186 | 356 | 168 | 70 | 110 | 217 | 261 |
| Section AA: Support for Mortgage Interest | 29 | 35 | 29 | 18 | 16 | 81 | 95 |
| Section AB: Other Expenditure | 0 | 0 | 0 | 0 | 7 | 35 | 16 |
| Section AC: Other Expenditure EALBs (Net) | 0 | 0 | 0 | 0 | 0 | 0 | 0 |
| Section AG: Social Fund: Other | (81) | (81) | (51) | (58) | (63) | 0 | 0 |
| Total Capital AME | 135 | 309 | 146 | 30 | 70 | 333 | 372 |
| Net lending to the private sector and abroad | 299 | 831 | 443 | 475 | 197 | 298 | 355 |
| Other Capital | (164) | (522) | (298) | (445) | (134) | 0 | 0 |
| Take up of provisions | 0 | 0 | 0 | 0 | 7 | 35 | 16 |
| Total Capital Budget | 469 | 390 | 614 | 656 | *520 | 1,133 | 946 |
| Total departmental spending | 187,224 | 196,891 | 219,574 | 225,170 | 240,598 | 275,010 | 288,504 |
| Total DEL | 6,094 | 5,776 | 6,944 | 9,334 | 8,581 | 9,213 | 8,188 |
| Total AME | 181,131 | 191,116 | 212,630 | 215,836 | 232,017 | 265,797 | 280,316 |
1. These tables are not reported on the same basis as the financial statements disclosures, with differing categories and headings.
2. DEL resource and capital is set for each year in the spending review process (amended to incorporate transfers of functions to and from other government departments as they have arisen).
3. Depreciation includes impairments.
4. AME limits are set as part of the Spring Statement and Autumn Budget process.
5. Expenditure on tangible and intangible fixed assets net of sales.
6. Total departmental spending is the sum of the resource budget and the capital budget less depreciation. Similarly total DEL is the sum of the resource budget DEL and capital budget DEL less depreciation in DEL.
7. Table 1 is aligned to the HM Treasury System (Online System for Central Accounting and Reporting (OSCAR)) which is used by all central government departments to record their spending and plans. At 31 March 2023, OSCAR reflects the position agreed at Main Estimate 2023, with plan years reflecting Spending Review 2021 and updates from the Spring Statement. In the event of structural changes or Machinery of government transfers this may not match the outturn in previous years’ financial statements and some spending may also appear on different lines.
8. Expenditure is stated net of income from sales of goods and services.
9. Totals may not sum due to rounding.
10. The impacts of the adoption of IFRS 16 are shown from 2022-23 onwards, and cause higher DEL capital and depreciation figures than in other years.
Table 2: Administration budget for the Department for Work and Pensions
DWP: Administration budget, 2018-19 to 2024-25
| Resource DEL | 2018-19 Outturn £m | 2019-20 Outturn £m | 2020-21 Outturn £m | 2021-22 Outturn £m | 2022-23 Outturn £m | 2023-24 Plans £m | 2024-25 Plans £m |
|---|---|---|---|---|---|---|---|
| Core Department | 712 | 731 | 832 | 841 | 800 | 948 | 865 |
| Health and Safety Executive (Net) | 53 | 50 | 61 | 60 | 57 | 57 | 56 |
| Other Executive Arm’s Length Bodies (Net) | 14 | 16 | 17 | 19 | 17 | 22 | 18 |
| Total administration budget | 779 | 797 | 911 | 920 | 874 | 1,027 | 938 |
| Staff costs | 421 | 460 | 524 | 519 | 554 | 583 | 430 |
| Purchase of goods and services | 367 | 360 | 436 | 392 | 297 | 414 | 479 |
| Income from sales of goods and services | (90) | (112) | (114) | (38) | (41) | (31) | (32) |
| Current grants to local government (net) | 1 | 0 | 0 | 0 | 0 | 0 | 0 |
| Rentals | 46 | 48 | 15 | (7) | 9 | (1) | (1) |
| Depreciation | 28 | 30 | 34 | 41 | 43 | 62 | 62 |
| Other resource | 5 | 11 | 15 | 13 | 13 | 1 | 1 |
| Current grants to persons and non-profit bodies (net) | 0 | 0 | 0 | (0) | 0 | 0 | 0 |
| Net public service pensions | 0 | 0 | 0 | 0 | 0 | 0 | 0 |
| Take up of provisions | 0 | 0 | 0 | 0 | 0 | 0 | 0 |
1. These tables are not reported on the same basis as the financial statements disclosures, with differing categories and headings.
2. This table represents DEL administration expenditure, set for each year in the spending review process (amended to incorporate transfers of functions to and from other government departments as they have arisen).
3. Depreciation includes impairments.
4. Table 2 is aligned to the HM Treasury System (Online System for Central Accounting and Reporting (OSCAR)) which is used by all central government departments to record their spending and plans. At 31 March 2023, OSCAR reflects the position agreed at Main Estimate 2023, with plan years reflecting Spending Review 2021 and updates from the Spring Statement. In the event of structural changes or Machinery of government transfers this may not match the outturn in previous years’ financial statements and some spending may also appear on different lines. 5. Totals may not sum due to rounding.
6. Section letters may not match the SOPS section letters due to additional line items appearing in the SOPS. A review of the section titles has been performed since last year’s Annual Report and Accounts to improve transparency and usability, therefore these do not align exactly with previous years.
7. The impacts of the adoption of IFRS 16 are shown from 2022-23 onwards, and cause higher depreciation than in other years.
Regularity of expenditure
(This information is subject to audit)
We’re custodian of taxpayers’ funds and have a duty to Parliament to ensure the regularity and propriety of our activities and expenditure. We manage public funds in line with HM Treasury’s Managing Public Money[footnote 61].
The importance of operating with regularity and the need for efficiency, economy, effectiveness and prudence in the administration of public resources to secure value for public money, is the responsibility of our Accounting Officer whose responsibilities are also set out in Managing Public Money. They include responsibility for the propriety and regularity of the public finances for which the Accounting Officer is answerable.
To discharge this responsibility and ensure our control totals are not breached the following activities are in place:
- formal delegation of budgets
- detailed monitoring of expenditure
- monthly management reporting against control totals
In addition, we operate the 3 lines of defence model, which is included in our risk management framework. We’ve provided details of this in our governance statement.
In 2022-23, we did not breach any of our control totals, details are provided in the Statement of Outturn Against Parliamentary Supply. Our accounts have been qualified this year, as has been the case since 1988-89, due to a material level of irregular benefit expenditure, arising from fraud and error. More details on this control issue can be found in our Accounting Officer’s assessment of the system of control and the significant control challenges.
Parliamentary accountability disclosures
Losses and Special Payments[footnote 62]
(This information is subject to audit)
| Losses and special payments |
Core Department 2022-23 £000 | Departmental group 2022-23 £000 | Core Department Cases 2022-23 £000 | Departmental group Cases £000 | Core Department 2021-22 £000 | Departmental group 2021-22 | Core Department Cases 2021-22 | Departmental group Cases 2021-22 £000 |
|---|---|---|---|---|---|---|---|---|
| Losses | 393,816 | 395,937 | 1,075,126 | 1,076,395 | 368,819 | 370,070 | 1,033,129 | 1,034,486 |
| Special Payments | 112,224 | 112,299 | 355,705 | 355,708 | 149,869 | 149,896 | 406,295 | 406,300 |
Overpayments due to fraud and error are not considered losses until recovery options have been exhausted, for more information please see note 1.12.
(i) Losses arising from benefit overpayments, grants and subsidies
| Losses from benefit overpayments, grants and subsidies | 2022-23 £000 |
|---|---|
| Non-recoverable Benefit Overpayments: During the year we write off non-recoverable overpayments of benefit. These are where we can’t legally enforce repayment or it’s not in the public interest to do so. | 324,963 |
| Customer Fraud: We write off overpayments resulting from customer fraud once we’ve exhausted our debt recovery processes. | 7,787 |
|
Social Fund: We make low-cost funeral expense payments to people who receive (or whose partners receive) a qualifying benefit or tax credits. These are recoverable from the estate of the deceased but we write them off when there are not enough assets in the estate. This year we wrote off 24,429 number of funeral expense payments with a total value of £45.8 million. Budgeting and crisis loans which can’t be recovered are written off subject to strict criteria. This year we wrote off 33,007 of these loans with a total value of £2.8 million. We also wrote off 11,312 irrecoverable overpayments amounting to £3.07 million, of which £2.56 million relate to Winter Fuel Payments. This year we also wrote off non recoverable Cold Weather Payment overpayments amounting to £0.227 million. |
51,633 |
(ii) Cash Losses
| Cash losses | 2022-23 £000 |
|---|---|
| Flexible Support Fund Losses: Under the Flexible Support Fund, we give funds to some claimants to buy items to help them to start work. If, after a number of reminders, claimants don’t provide receipts, or give us incomplete or incorrect receipts, we treat the funding as a loss. | 832 |
| Bad debts - Staff Costs: Bad debts written off in respect of staff costs where value is less than DWP threshold (£500) or age of debt is greater than 6 months | 388 |
(iii) Realised Exchange Rate Fluctuation
| Exchange Rate Loss | 2022-23 £000 |
|---|---|
| European Social Fund (ESF) Exchange Rate Loss: We carry a risk (and opportunity) on ESF transactions due to exchange rate fluctuations between payment application submission to the European Commission and payment to DWP, and between receiving pre-financing and repaying it to the European Commission. In 2022-23, a net loss on foreign exchange of £4.065 million materialised, consisting of £9.332 million in losses partially offset by £5.267 million in gains. | 4,065 |
(iv) Special Payments
| Special Payments | 2022-23 £000 |
|---|---|
| Consolatory Payments: These are Ex Gratia Consolatory payments to claimants in receipt of non contributory benefits that are not funded by the National Insurance Fund in order to restore confidence and relieve anxiety as a result of Departmental failure or delay | 794 |
| Special Severance: These are payments to employees, contractors and others, outside of normal statutory or contractual requirements when leaving employment in public service whether they resign, are dismissed or reach an agreed termination of contract. 26 Special Severance Payments were made in the previous financial year. The total amount paid out this year was £461k. The maximum payment was £60k, minimum was £50 and median value of all Payments made was £15k. | 461 |
| Legal Settlements: These are payments for ex gratia out of court legal settlements. | 599 |
| Personal Injury Legal costs staff/contractors: These are legal costs arising from personal injury payments suffered by Civil Servants or Contractors. | 496 |
| Personal Injury Legal costs staff: Legal cost arising from a personal injury payment made due to an injury suffered by a member of staff. | 2,375 |
| Loss of Statutory Entitlement Payments: These are special payments for financial redress to cover loss of statutory entitlement (LOSE) payments. They are paid if maladministration has caused a claimant to lose entitlement to statutory benefit payments. | 568 |
| European Union Settled Status Ex-statutory Payments: Continuation of benefit payments to EEA nationals and their family members beyond the grace period (1 January 2021 to 30 June 2021) to signpost them to make a late application to the EU Settlement Scheme. | 23,216 |
| Student Income Apportionment: Regulation 71 of the Universal Credit Regulations 2013 did not provide for correct application of policy intent for students who make a claim to Universal Credit part way through their academic year. DWP has now received retrospective HM Treasury approval for making ex-statutory payments to students on UC between October 2019 and March 2023 in line with the original policy intent, rather than as drafted. | 82,574 |
| European Citizens in the European Union: These are ex-statutory payments made to a small cohort of EU citizens resident in the EU and in receipt of a UK benefit, who are not expressly covered by Title III of Part 2 of the Withdrawal Agreement. | 510 |
(v) Constructive Losses
| Constructive Losses | 2022-23 £000 |
|---|---|
| Constructive Losses 2021-22 Financial loss due to early termination: The QAT project was set up to replace the disparate, unsupported and ageing databases that support the Quality Assurance Tier work within DWP which identifies and reports on error levels within DWP product and service lines. To deliver this project a number of digital contingent labour contractors and a digital service delivery contract were utilised. Delays to project delivery and the evolving solution becoming much more expensive than planned; coupled with a fundamental change in the future strategy for Quality Assurance meant the solution being developed was no longer appropriate. The early termination of the project means that the spend on the contingent labour resource and the service delivery contract will not contribute to the intended asset or savings. No immediate benefit to DWP was derived from the spend, but the output from the Discovery and Alpha phases will provide consequential input into any future project to support the evolving strategy for Quality Assurance. | 2,420 |
| Contact Centre Modernisation (CCMP) asset: Loss due to the withdrawal of a ‘Multi-Cloud Solution’ which relied upon Contact Centre Modernisation (CCMP) assets, as provided to the department by the supplier (Genysis). The decision to remove this option was outside of the department’s control. As the supplier is now revisiting their strategy and is planning to introduce an alternative solution, some of the associated CCMP assets will no longer be usable, and therefore must be written-off. The total value of assets to be written off is £2.3m. | 2,263 |
(vi) Claims waived or abandoned
| Admin Penalties & Court Costs | 2022-23 £000 |
|---|---|
| Admin Penalties & Court Costs: Claims for admin penalties and court costs which the department intended to make, but which could not be enforced, or were never presented | 373 |
(vii) Other Accountability Issues
| Accountability Issues | 2022-23 £000 |
|---|---|
|
Counter Fraud and Investigation – DWP Other Accountability Fraud Data – 1 April 2021 to 31 March 2022 1 April 2022 to 31 March 2023: The Government Internal Audit Agency’s Counter Fraud and Investigation team provides counter fraud services to DWP. This includes the investigation of internal fraud and/or other serious breaches of the Department’s Standards of Behaviour by DWP employees, contractors and providers. Recovery action is taken at a local level and recoveries are not recorded separately for disclosure. Internal Fraud: Salary, expenses and other non-benefit losses: 12 investigations were completed, resulting in proven losses of £543,618.16. Benefit related losses e.g. employee benefit fraud or diversion of payments: 19 investigations were completed, resulting in proven losses of £347,208.39. |
891 |
Remote contingent liabilities
(This information is subject to audit)
These are remotely possible obligations that arise from past events whose existence will be confirmed only by the occurrence of 1 or more uncertain future events not wholly within our control. They are incorporated under parliamentary reporting requirements and not under IAS 37.
National Employment Savings Trust (NEST)
The Pension Schemes Act 2017 introduced the definition of a Master Trust and signalled the start of a robust new authorisation and supervision regime, administered by the Pensions Regulator to ensure that Master Trusts being used for automatic enrolment are safe for the many millions of people now saving in these schemes. To be able to operate as a Master Trust (MT), of which NEST is one, schemes are required to meet 5 authorisation criteria prescribed in the 2017 Act.
One of the criteria is that the scheme must be financially sustainable. This means that in the event of a triggering event, an event that would put the scheme at risk of needing to wind up, the scheme must hold sufficient financial reserves to cover its gradual closure, without putting these additional costs onto scheme members.
Due to the nature of its financial arrangements with government NEST, which has been an authorised MT scheme since 2019, is unable to build up the financial reserves needed to meet the financial sustainability criteria. Specifically, this is to hold sufficient funds to meet running costs for 24 months and any one-off costs associated with scheme closure. Using figures produced by NEST for The Pensions Regulator If a triggering event was to occur, then the maximum size of the contingent liability required to be made available to NEST would be £329 million. This was the amount estimated by NEST in 2019, subsequently restated and accepted by The Pension Regulator. Since then and prior to entering the supervisory process the amount of the liability is reviewed annually.
The Department has estimated that the risk of full crystallisation as remote (at £16.45 million (5%). The contingent liability is underwritten through a ‘Letter of Comfort’ in order that NEST can comply with the Master Trust supervisory regime which came into effect in October 2020.
Reconciliation of contingent liabilities included in the Supply Estimate to the accounts
(This information is not subject to audit)
Quantifiable contingent liabilities
| Description of contingent liability | Supply Estimate £000 | Amount disclosed in ARA £000 | Variance (Estimate – Amount disclosed in ARA) £000 |
|---|---|---|---|
| Legal Cases | 1,927 | 2,261 | (334) |
| Compensation Recovery[footnote 63] | – | 11,163 | (11,163) |
| Independent Assessment[footnote 64] Services | 13,000 | – | 13,000 |
Unquantifiable contingent liabilities
| Description of contingent liability | Included in Supply Estimate (Yes/No) | Disclosed in the ARA (Yes/No) | Explanation of difference |
|---|---|---|---|
| European Social Fund (ESF) repayments | Yes | Yes | N/A |
| Compensation claims | Yes | Yes | N/A |
| Scottish Devolution Programme Disputed IT Costs | Yes | No | Liability resolved after Supply Estimate submission |
| Document and Data Management Services 2nd Year Extension | No | Yes | Contingent liability identified after the submission of the Supply Estimate |
| The Rent Service employee pensions | Yes | Yes | N/A |
| Annual Leave Allowance | No | Yes | Contingent liability identified after the submission of the Supply Estimate |
| Benefit Underpayments | Yes | Yes | N/A |
| Dilapidation liabilities for leased property | No | Yes | Contingent liability identified after the submission of the Supply Estimate |
| National Insurance Credits | No | Yes | Contingent liability identified after the submission of the Supply Estimate |
Peter Schofield CB
Permanent Secretary
29 June 2023
4 July 2023
The Certificate of the Comptroller and Auditor General to the House of Commons
The Certificate of the Comptroller and Auditor General to the House of Commons and Report by the Comptroller and Audit General are produced by National Audit Office. The Department is unable to publish these in HTML format. The Report by the Comptroller and Audit General can be view in PDF direct on National Audit Office’s website.
The Certificate of the Comptroller and Auditor General to the House of Commons can be viewed in the PDF.
Financial report: Financial statements
Introduction to the financial statements
These financial statements present the operating costs, financial position and cash flows of the Department for Work and Pensions for the year ended 31 March 2023. In addition to our functions of paying benefits for welfare and pensions, our accounts include the following areas of spending:
National Insurance Fund (NIF)
HM Revenue and Customs is responsible for the NIF. We administer the benefits funded from the NIF (see note 5b) on HM Revenue and Custom’s behalf. We include these in our Statement of Comprehensive Net Expenditure (SoCNE) and recover this expenditure, together with the associated cost of administration, from the NIF. Financing from the NIF is included in our Statement of Cash Flows.
Social Fund
We’re responsible for the Social Fund, which is used to make grants and repayable loans to individuals. It makes regulated payments of Funeral Expenses Payments, Sure Start Maternity Grants, Winter Fuel Payments and Cold Weather Payments plus discretionary payments for Budgeting Loans. Where appropriate, we include these in our SoCNE and any related receivables in the SoFP.
Child Maintenance Group (CMG)
We have responsibility for the management of client funds relating to the statutory child maintenance schemes operated through the Child Maintenance Group (CMG). Ongoing Child Maintenance and Legacy Child Support Agency (CSA) Arrears only cases are managed through the Child Maintenance Service (CMS) launched in 2012, following the closure of the CSA systems in August 2020. Although all managed through the CMS, cases are administered according to the rules of the particular scheme that was in effect when the arrears arose. The running costs of CMG are charged to the Department however the funds they collect are not departmental assets and are not included in these accounts. CMG acts purely as custodian and the Department is required, by HM Treasury, to publish Client Funds Accounts separately.
European Social Fund (ESF)
The European Social Fund is 1 of the European Union structural funds designed to strengthen economic and social cohesion. It helps unemployed and socially excluded people find work or become more employable. It can also be used to help prevent people in work from becoming unemployed. We record the expenditure and income related to ESF programmes in our SoCNE. Despite withdrawal from the EU, the ESF 2014-2020 programme will continue through to closure in 2024-25. It will then be replaced by the UK Shared Prosperity Fund.
Other expenditure
This includes other expenditure that is voted to us by Parliament including the costs of running the Department and subsidies paid by grants to local authorities that administer and pay Housing Benefit. Grant in aid and grant payments to our arm’s length bodies are recorded as expenditure.
Arm’s length bodies
They are administered separately from the Department and they produce their own Annual Reports and Accounts. Excluding public corporations which fall outside of our accounting boundary, the arm’s length bodies are consolidated to inform the group accounts.
Consolidated Statement of Comprehensive Net Expenditure
for the year to 31 March 2023
The ‘Notes to the accounts’ section form part of these accounts.
| Expenditure | Note | 31 March 2023: Core department £000 | 31 March 2023: Departmental group £000 | 31 March 2022: Core department £000 | 31 March 2022: Departmental group £000 |
|---|---|---|---|---|---|
| Staff expenditure | 3 | 3,470,620 | 3,760,373 | 3,594,140 | 3,865,552 |
| Purchase of goods and services | 4 | 3,118,078 | 2,871,327 | 2,845,678 | 2,648,451 |
| Benefit and Social Fund expenditure | 5 | 234,824,830 | 234,824,830 | 217,205,965 | 217,205,965 |
| Depreciation and impairment charges | 6 | (926,320) | (910,565) | 482,253 | 495,734 |
| Provision expense | 6 | (395,681) | (396,024) | 1,503,402 | 1,503,617 |
| Total operating expenditure | 240,091,527 | 240,149,941 | 225,631,438 | 225,719,319 | |
| Operating income | 7 | (901,020) | (990,608) | (642,782) | (731,060) |
| Total operating income | (901,020) | (990,608) | (642,782) | (731,060) | |
| Finance income | 7 | (26,754) | (27,117) | (30,331) | (30,337) |
| Finance expense | 4 | 11,987 | 30,680 | 4,865 | 22,411 |
| Net expenditure for the year | 239,175,740 | 239,162,896 | 224,963,190 | 224,980,333 | |
| Donated assets | 8 | (134,177) | (134,177) | (444,838) | (444,838) |
| Net operating costs for the year | 239,041,563 | 239,028,719 | 224,518,352 | 224,535,495 |
Other comprehensive net expenditure
Items that will not be reclassified to net operating expenditure
| Net loss/(gain) | 31 March 2023: Core department £000 | 31 March 2023: Departmental group £000 | 31 March 2022: Core department £000 | 31 March 2022: Departmental group £000 |
|---|---|---|---|---|
| Revaluation of property, plant and equipment | – | 3,057 | – | (29) |
| Revaluation of intangibles | (24,060) | (24,462) | (18,420) | (18,420) |
| Revaluation of pension fund | (2,787) | (2,787) | (10,749) | (10,749) |
| Total comprehensive net expenditure for the year ended 31 March 2022 | 239,014,716 | 239,004,527 | 224,489,183 | 224,506,297 |
All income and expenditure is derived from continuing operations.
Consolidated Statement of Financial Position
as at 31 March 2023
The ‘Notes to the accounts’ section form part of these accounts.
| Assets and liabilities | Note | 31 March 2023: Core department £000 | 31 March 2023: Departmental group £000 | 31 March 2022: Core department £000 | 31 March 2022: Departmental group £000 |
|---|---|---|---|---|---|
| Non-current assets: Property, plant and equipment |
9 | 1,283,011 | 1,417,086 | 648,265 | 760,982 |
| Non-current assets: Intangible assets |
10 | 463,753 | 483,305 | 421,135 | 430,749 |
| Non-current assets: Trade receivables, financial and other assets |
13 | 6,387,633 | 6,389,797 | 4,521,860 | 4,524,429 |
| Total non-current assets | 8,134,397 | 8,290,188 | 5,591,260 | 5,716,160 | |
| Current assets: Trade receivables, financial and other assets |
13 | 4,135,971 | 4,188,250 | 3,822,101 | 3,871,049 |
| Current assets: Cash and cash equivalents |
12 | 982,565 | 991,742 | 1,433,889 | 1,435,027 |
| Total current assets | 5,118,536 | 5,179,992 | 5,255,990 | 5,306,076 | |
| Total assets | 13,252,933 | 13,470,180 | 10,847,250 | 11,022,236 | |
| Current liabilities: Trade payables and other liabilities |
14 | (9,879,452) | (9,971,892) | (10,027,716) | (10,104,570) |
| Current liabilities: Provisions for liabilities and charges |
16 | (1,764,831) | (1,765,527) | (1,171,937) | (1,171,937) |
| Total current liabilities | (11,644,283) | (11,737,419) | (11,199,653) | (11,276,507) | |
| Total assets less current liabilities | 1,608,650 | 1,732,761 | (352,403) | (254,271) | |
| Non-current liabilities: Provisions for liabilities and charges | 16 | (5,682,431) | (5,682,941) | (7,413,793) | (7,414,888) |
| Non-current liabilities: Other payables | 14 | (1,044,754) | (1,137,708) | (170,352) | (246,735) |
| Non-current liabilities: Pension liability | 17 | – | (989) | (1,040) | (2,225) |
| Total non-current liabilities | (6,727,185) | (6,821,638) | (7,585,185) | (7,663,848) | |
| Assets less liabilities | (5,118,535) | (5,088,877) | (7,937,588) | (7,918,119) | |
| Taxpayers’ equity and other reserves: General fund |
(5,167,815) | (5,175,748) | (7,974,970) | (7,995,747) | |
| Revaluation reserve | 49,280 | 86,871 | 37,382 | 77,628 | |
| Total equity | (5,118,535) | (5,088,877) | (7,937,588) | (7,918,119) |
Peter Schofield
Permanent Secretary
29 June 2023
Consolidated Statement of Cash Flows
for the year ended 31 March 2023
| Cash flow | Note | 31 March 2023: Core department £000 | 31 March 2023: Departmental group £000 | 31 March 2022: Core department £000 | 31 March 2022: Departmental group £000 |
|---|---|---|---|---|---|
| Cash flows from operating activities: Net cost for the year |
(239,041,563) | (239,028,719) | (224,518,352) | (224,535,495) | |
| Cash flows from operating activities: Adjustments for non-cash transactions |
6,7 | (1,307,156) | (1,291,737) | 1,989,899 | 2,004,230 |
| Cash flows from operating activities: Adjustments for Capital Grant in Kind transfers |
8 | (134,177) | (134,177) | (444,838) | (444,838) |
| Cash flows from operating activities: Decrease/(increase) in trade and other receivables |
13 | (2,179,643) | (2,182,569) | 307,509 | 297,970 |
| Cash flows from operating activities: Movements in receivables relating to items not passing through the Statement of Comprehensive Net Expenditure |
794,586 | 771,121 | (412,653) | (412,653) | |
| Cash flows from operating activities: Increase/(decrease) in trade and other payables |
14 | 1,059,172 | 1,091,255 | 1,901,682 | 1,908,530 |
| Cash flows from operating activities: Movements in payables relating to items not passing through the Statement of Comprehensive Net Expenditure |
873,485 | 876,688 | (630,516) | (627,048) | |
| Cash flows from operating activities: Utilisation of provisions |
16 | (750,040) | (750,040) | (497,745) | (497,745) |
| Net cash outflow from operating activities | (240,685,336) | (240,648,178) | (222,305,014) | (222,307,049) | |
| Cash flows from investing activities: Purchase of property, plant and equipment |
9b | (96,792) | (104,783) | (373,359) | (377,493) |
| Cash flows from investing activities: Purchase of intangible assets |
10a | (108,633) | (123,031) | (78,620) | (85,270) |
| Cash flows from investing activities: Proceeds of disposal of property, plant and equipment and intangible assets |
– | 175 | – | 453 | |
| Cash flows from investing activities: Proceeds of disposal of assets held for sale |
– | – | 1,212 | 1,212 | |
| Cash flows from investing activities: Loans to other bodies – repayments |
8,800 | 8,800 | 8,855 | 8,855 | |
| Cash flows from investing activities: Loans to other bodies |
(163,184) | (163,184) | (137,031) | (137,031) | |
| Net cash outflow from investing activities | (359,809) | (382,023) | (578,943) | (589,274) | |
| Cash flows from financing activities: From the Consolidated Fund (supply) current year |
125,383,096 | 125,383,096 | 113,728,747 | 113,728,747 | |
| Cash flows from financing activities: From the Consolidated Fund (supply) prior year |
– | – | 749,256 | 749,256 | |
| Cash flows from financing activities: Net financing from the National Insurance Fund |
115,841,347 | 115,841,347 | 110,181,636 | 110,181,636 | |
| Cash flows from financing activities: Advances from the contingencies fund |
2,477,600 | 2,477,600 | – | – | |
| Cash flows from financing activities: Repayments to the contingencies fund |
(2,477,600) | (2,477,600) | – | – | |
| Cash flows from financing activities: Capital element of payments in respect of leases and on-Statement of Financial Position PFI contracts |
(261,288) | (268,267) | (11,236) | (14,164) | |
| Net financing | 240,963,155 | 240,956,176 | 224,648,403 | 224,645,475 | |
| Net increase/(decrease) in cash and cash equivalents in the period before adjustment for receipts and payments to the Consolidated Fund |
(81,990) | (74,025) | 1,764,446 | 1,749,152 | |
| Payments of amounts due to the Consolidated Fund | (36,300) | (36,300) | (51,093) | (51,093) | |
| Net (decrease)/increase in cash and cash equivalents in the period after adjustment for receipts and payments to the Consolidated Fund |
12 | (118,290) | (110,325) | 1,713,353 | 1,698,059 |
| Cash and cash equivalents at the beginning of the period |
12 | (1,093,666) | (1,092,564) | (2,807,019) | (2,790,623) |
| Cash and cash equivalents at the end of the period |
12 | (1,211,956) | (1,202,889) | (1,093,666) | (1,092,564) |
The ‘Notes to the accounts’ section form part of these accounts.
Consolidated Statement of Changes in Taxpayers’ Equity
for the year ended 31 March 2023
The ‘Notes to the accounts’ section form part of these accounts.
| Taxpayers’ equity | Note | General Fund: Core department £000 | General Fund: Departmental group £000 | Revaluation Reserve: Core department £000 | Revaluation Reserve: Departmental group £000 | Total Reserves: Core department | Total Reserves: Departmental group £000 |
|---|---|---|---|---|---|---|---|
| Balance at 31 March 2021 | (6,691,273) | (6,694,909) | 28,927 | 69,144 | (6,662,346) | (6,625,765) | |
| Net parliamentary funding drawn down (current year) | 113,728,747 | 113,728,747 | – | – | 113,728,747 | 113,728,747 | |
| Repayments to the Consolidated Fund | SOPS 4 | (1,639) | (1,639) | – | – | (1,639) | (1,639) |
| Net parliamentary funding – drawn down (prior year) | 13 | 749,256 | 749,256 | – | – | 749,256 | 749,256 |
| Funding from National Insurance Fund | 110,181,636 | 110,181,636 | – | – | 110,181,636 | 110,181,636 | |
| Supply payable adjustment | 14 | (661,918) | (661,918) | – | – | (661,918) | (661,918) |
| Supply receivable previous year clearance | 13 | (749,256) | (749,256) | – | – | (749,256) | (749,256) |
| CFERS payable to the Consolidated Fund | SOPS 4 | (34,149) | (34,149) | – | – | (34,149) | (34,149) |
| General fund - other | (179) | (177) | – | – | (179) | (177) | |
| Net costs for the year | (224,518,352) | (224,535,495) | – | – | (224,518,352) | (224,535,495) | |
| Non-cash adjustments: Non-cash charges – Auditor’s remuneration | 6 | 1,443 | 1,443 | – | – | 1,443 | 1,443 |
| Actuarial revaluation on pension | 10,749 | 10,749 | – | – | 10,749 | 10,749 | |
| Movements in reserves: Recognised in Statement of Comprehensive Net Expenditure |
– | – | 18,420 | 18,449 | 18,420 | 18,449 | |
| Movements in reserves: Transfers between reserves |
9,965 | 9,965 | (9,965) | (9,965) | – | – | |
| Balance at 31 March 2022 | (7,974,970) | (7,995,747) | 37,382 | 77,628 | (7,937,588) | (7,918,119) | |
| Balance at 31 March 2022 | (7,974,970) | (7,995,747) | 37,382 | 77,628 | (7,937,588) | (7,918,119) | |
| Net parliamentary funding drawn down (current year) | 125,383,096 | 125,383,096 | – | – | 125,383,096 | 125,383,096 | |
| Repayments to the Consolidated Fund | SOPS 4 | (1,659) | (1,659) | – | – | (1,659) | (1,659) |
| Net parliamentary funding – deemed | 661,918 | 661,918 | – | – | 661,918 | 661,918 | |
| Funding from National Insurance Fund | 115,841,347 | 115,841,347 | – | – | 115,841,347 | 115,841,347 | |
| Advances from the contingencies fund | 2,477,600 | 2,477,600 | – | – | 2,477,600 | 2,477,600 | |
| Repayments to the contingencies fund | (2,477,600) | (2,477,600) | – | – | (2,477,600) | (2,477,600) | |
| Supply payable adjustment | 14 | (33,427) | (33,427) | – | – | (33,427) | (33,427) |
| CFERS payable to the Consolidated Fund | SOPS 4 | (18,013) | (18,013) | – | – | (18,013) | (18,013) |
| General fund – other | (1,080) | (1,080) | - | - | (1,080) | (1,080) | |
| Net costs for the year | (239,041,563) | (239,028,719) | – | – | (239,041,563) | (239,028,719) | |
| Non-cash adjustments: Non-cash charges – Auditor’s remuneration | 6 | 1,587 | 1,587 | – | – | 1,587 | 1,587 |
| Non-cash adjustments: Actuarial revaluation on pension | 2,787 | 2,787 | – | – | 2,787 | 2,787 | |
| Movements in reserves: Recognised in Statement of Comprehensive Net Expenditure | – | – | 24,060 | 21,405 | 24,060 | 21,405 | |
| Movements in reserves: Transfers between reserves | 12,162 | 12,162 | (12,162) | (12,162) | – | – | |
| Balance at 31 Mar 2023 | (5,167,815) | (5,175,748) | 49,280 | 86,871 | (5,118,535) | (5,088,877) |
a. The general fund represents the total assets less liabilities of the entities within the accounting boundary, to the extent that the total is not represented by other reserves and financing items.
b. The revaluation reserve reflects the unrealised element of the cumulative balance of indexation and revaluation adjustments.
Notes to the accounts
1. Statement of accounting policies
1.1. Basis of preparation and statement of compliance
These financial statements have been prepared in accordance with the 2022-23 government Financial Reporting Manual (FReM) issued by HM Treasury. The accounting policies in the FReM apply International Financial Reporting Standards (IFRS) as adapted or interpreted for the public sector.
Where the FReM lets us choose an accounting policy, we’ve selected the 1 that we think is the most appropriate to our circumstances and which gives a true and fair view. The policies we’ve adopted are set out below. We’ve applied them consistently in dealing with items that we consider are material to the accounts.
As well as preparing the primary statements under IFRS, we’re required under the FReM to prepare the Statement of Outturn against Parliamentary Supply. This statement shows outturn against estimate in terms of our net resource requirement and net cash requirement.
1.2. Accounting standards, interpretations and amendments
We’ve adopted all IFRS, International Accounting Standards (IAS), International Financial Reporting Interpretations Committee (IFRIC) interpretations and amendments to published standards that were effective at 31 March 2023. We’ve also taken into account the specific interpretations and adaptations included in the FReM.
IFRS 17 (Insurance Contracts) effective from 1 April 2023
The International Accounting Standards Board (IASB) has issued IFRS 17 (Insurance Contracts), which replaces IFRS 4 (Insurance Contracts). It is expected to be effective for accounting periods beginning on or after (date TBC), following IASB decisions to defer the effective date.
An insurance contract is a contract under which 1 party (the issuer) accepts significant insurance risk from another party (the policyholder) by agreeing to compensate the policyholder if a specified uncertain future event (the insured event) adversely affects the policyholder.
Insurance risk is the risk the entity accepts from the policyholder. This means the entity must accept, from the policyholder, a risk to which the policyholder was already exposed. Any new risk created by a contract for the entity or the policyholder is not insurance risk. On this basis we expect there to be no impact as the Department does not have insurance contracts where we accept risk to which the policyholder was already exposed.
1.3. Accounting convention
We’ve prepared these financial statements on an accruals basis under the historical cost convention modified to account for the revaluation of property, plant and equipment, intangible assets, inventories and some financial assets and liabilities.
These financial statements are prepared in £ sterling, which is our functional currency.
1.4. Basis of consolidation
These statements cover the whole departmental group. By this, we mean the core department, which is supply financed, plus all of our arm’s length bodies that fall within the departmental boundary. We’ve eliminated all material transactions between entities included in this consolidation.
1.5. Critical accounting judgements and key sources of estimation uncertainty
Critical judgements
In preparing the financial statements, we have to make critical judgements, apart from those involving estimations (which are presented separately below), that affect the application of policies and have impacts on the reported amounts of our assets and liabilities, income and expenditure.
Incorrect payments
We’re responsible for paying claimants the right benefit at the right time. However, administrating over 25 different benefits is a complex business which may introduce a risk of fraud and error leading to some incorrect payments.
Incorrect payment estimates are produced to the standards of the UK Statistics Authority national statistics protocols. Further information on our estimation strategy can be found at GOV.UK (within the latest National Statistics publication, and the accompanying background information and methodology document).
We estimate the level of overpayment and underpayments in benefit expenditure each year based on a sample of benefit records and these are reported in our incorrect payments note (note 18). It is estimated that 95% of £234 billion of benefit payments were made correctly in this reporting year.
The overpayment debt and underpayment liabilities, along with the related movements in the SoCNE, implied by these estimates are not recognised in these financial statements because the specific rights of and obligations to individual claimants of potential overpayment and underpayments haven’t been identified. We correct all individual cases sampled where we identify overpayment or underpayments.
Benefit expenditure
As there are no specific IFRS or FReM regulations regarding benefit expenditure, the Department has determined an appropriate policy to pay benefit claimants under relevant legislation.
The Department’s judgement is that expenditure in respect of social benefit payments is recognised at the point at which the claimant is deemed to be eligible to the social benefit or activity that gives rise to a liability (defined as the period of entitlement or in the case of new claims, the date of the first payment being made). Only the expenditure for the period of entitlement that falls within the accounting year should be recognised. Further details contained in 1.7.
Expected credit loss
As the Department does not assess credit risk, the lifetime expected credit loss approach is adopted for benefit related receivables, further details on our approach is outlined in section 1.12.
We have updated our measurement approach in 2022-23. We consider this a change in accounting estimate under IAS 8. We have explained the reasons for the change and its impact in Note 13.
Key sources of estimation uncertainty
The key assumptions concerning the future, and other key sources of estimation uncertainty at the reporting period may have a significant risk of causing a material adjustment to the carrying amounts of assets and liabilities within the next financial year, are discussed below.
Financial Assistance Scheme (FAS)
For the FAS provision (note 16), we estimate the net present value of the likely assistance payments. Our estimate is based on an actuarial model of likely caseload provided by the Pension Protection Fund who manage the scheme. Cash flows are discounted to give their present value at 31 March 2023. The rates used take account of the latest economic conditions and are updated annually.
The FAS assets, which are not recognised in the DWP balance sheet, are mostly held as annuities. The income streams from these are generally not affected by any market volatility, although the present value placed on them will depend on the discount rate, which could be impacted. The income streams, and therefore the present value, will also be impacted by the mortality experienced by the members the annuities relate to.
Due to the long-term nature of the liabilities and the assumptions on which the estimate of the provision is based, some uncertainty about the value of the liability remains. All key assumptions requiring some level of judgement are detailed in note 16 along with a sensitivity analysis table to demonstrate the impact on the estimate when key assumptions are adjusted.
Impairment of financial instruments
To calculate our impairment for benefit overpayments, we continue to review historic rates of debt recovery and write-off to give basis of future expected credit loss. Benefit overpayment debts are assumed to have an asset life of 20 years from the reporting date. We group debts by benefit and age then forecast recoveries and write-offs in a model which considers historical data. We’ve provided more detail in note 1.12.
Benefit provisions and underpayments
Benefit provisions and underpayments arise from ongoing Legal Cases against the Department or are identified as a result of internal procedures such as Legal Entitlements and Administrative Practice (LEAP) exercises. These provisions are estimated using data provided by analysts which is based on sampling and other analytical data. The estimates are reviewed and updated regularly based on the latest data. We don’t provide for benefit provisions or underpayments that are below a set de minimus limit (see note 1.12).
The Department does not include an estimate within its accounts of general underpayments caused by official error. This is because the amount cannot be reliably measured. Instead, we disclose a contingent liability in accordance with IAS 37 (Provisions, Contingent Liabilities and Contingent Assets) (see note 19).
State Pension underpayments
We disclose a provision for a liability in relation to 2 State Pension exercises to correct historic underpayment: State Pension Underpayment (SPU) and Home Responsibilities Protection (HRP). For both exercises the provision is calculated using analytical estimates of the number of people affected and the level of arrears. A description of the methodologies and further detail, including the impact of sensitivity analysis on the key assumptions, is in Note 16.
1.6. Revenue recognition (income)
We comply with IFRS 15 (Revenue from Contracts with Customers) for income streams and recognise revenue when earned. For the European Social Fund, where we act as an agent, we recognise income in the accounting periods in which the EU sponsored projects are funded.
1.7. Benefit Expenditure
Expenditure in respect of social benefit payments is recognised in the financial statements when the payment is due to the customer.
Payments made are structured into periods of entitlement. Customers are eligible for payment if they meet qualifying criteria throughout the entitlement period.
The majority of payments are made in arrears, by which time the entitlement period will have been fully completed. There are however certain options to receive payment in advance relating to specific circumstances predominately on the initial claim to people of pension age or to terminally ill customers.
The frequency of benefit payments can be seen online at How and when your benefits are paid - GOV.UK (www.gov.uk). Due to the frequency of the majority of payments being fortnightly or longer, it is common that an entitlement period will cross 2 financial years. In such a situation, accounting adjustments are made to ensure only the amount relating to each financial year is recognised within it. For example, when a payment made in April 2023 where an element of the entitlement period falls in March 2023, we’ve accrued expenditure relating to 2022-23 to ensure it is recognised in the correct financial year.
Universal Credit is assessed and paid in arrears, on a monthly basis and in a single payment. State Pension is usually paid every 4 weeks in arrears. Universal Credit and State Pension equate to circa 80% of all arrears payments made. Other working-age benefits are paid a minimum of fortnightly in arrears and have a common payday.
Benefit advances are classed as financial assets rather than expenditure (see note 1.12.1). As such they are recognised in the SoFP at the time of payment. Repayments of the advance are deducted from future benefit payments.
1.8. Property, plant and equipment
Property, plant and equipment are stated at fair value. However, as permitted by the FReM, we’ve adopted a depreciated historical cost basis as a proxy for fair value where non-property assets have a short useful life or are of relatively low value. This applies to most IT hardware, motor vehicles, plant and machinery and furniture and fittings.
Assets are capitalised where they have an expected useful life of more than 1 year and where the original cost of the item exceeds the capitalisation threshold. Where appropriate, intangible assets are pooled. Current departmental policy does not allow for pooling of tangible assets. The following thresholds apply:
- leasehold improvements £100,000
- other tangible assets £5,000
- Information technology £5,000
All expenditure on repairs and maintenance is charged to the SoCNE during the financial year in which it’s incurred.
1.9. Land and buildings
We measure land and buildings initially at cost, restated to current value using external professional valuations. This is in accordance with IAS 16 (Property, Plant and Equipment), as interpreted by the FReM. Inspections of each property are performed at least every 5 years. In the intervening years, the valuers use an indexation model developed to be appropriate to the property location to value the land and building asset.
We value most land and buildings on an existing-use basis (the exception is the specialist laboratory site owned by the Health and Safety Executive, which we’ve included at depreciated replacement cost) as provided under IAS 16, adapted and interpreted for the public sector to limit the circumstances in which a valuation is prepared under IFRS 13 (Fair Value Measurement).
Spending on major refurbishment and improvement of properties is capitalised and reported as land and buildings or leasehold improvements, depending on its nature. This is appropriate because the expenditure provides a long-term continuing benefit.
Independent valuations have been performed on our land and buildings. In each case, the valuations were performed on a fair-value basis by members of the Royal Institution of Chartered Surveyors, in accordance with their Appraisal and Valuation Standards.
The following independent valuations have been performed on land and buildings:
| Building | Valuations performed by | Date of last full valuation |
|---|---|---|
| DWP Estate (Newcastle Estates Development (NED)) | Marc Seabrook (DVS Valuation Agency) | March 2019 |
| HSE Redgrave Court, Bootle | Cushman and Wakefield | 31 January 2020 |
| HSE Health and Safety Laboratory, Buxton | Jones Lang LaSalle Ltd | 31 January 2020 |
| HSE Priestly House, Basingstoke | Carter Jonas | 31 January 2021 |
1.10. Intangible assets
Whether we acquire intangible assets externally or generate them internally, we measure them initially at cost, with subsequent measurement at fair value. Where an active market exists for the asset, it is carried at a revalued amount based on market value at the end of the reporting period. Where no active market exists, we revalue assets using appropriate indices to indicate depreciated replacement cost as an alternative for fair value.
We revalue internally developed software and software licences using the most recent Office for National Statistics published indices.
Purchased software licences
We capitalise software licences and applications at cost as intangible assets if they are in use for more than 1 year and cost more than £5,000. Multi-year software as a service agreement, comprising software licence and service elements paid for on a subscription basis, are reviewed individually to determine the extent of the service provision. Any licencing component in the agreement is assessed against IAS 38 (Intangible Assets) to determine whether it meets the criteria for recognition as an intangible asset and where it does; a threshold of £1 million is applied.
We later revalue these using appropriate indices as a proxy for fair value. As we own so many software licences, we account for them on a pooled basis.
IP addresses are held as a specific sub-category until the point they satisfy the criteria to be reclassified as assets held for sale. They are held at market value, based on an estimate of the income they would currently return in the emerging IP address market.
Spending on annual software licences is charged to the SoCNE when incurred.
Internally developed software
We capitalise internally developed software if it meets the criteria in IAS 38 (Intangible Assets). We classify development costs as assets under the course of construction until the asset is available for use. At that point, we transfer it to the relevant asset class.
Website development costs
We capitalise website development costs in line with the requirements of SIC 32 (Intangible Assets - Web Site Costs).
1.11. Depreciation and amortisation
We charge depreciation on property, plant and equipment and calculate amortisation on intangible assets with a finite life using the straight-line method to reflect the consumption of economic benefits. Depreciation and amortisation is charged to either administration or programme costs in accordance with how the associated assets are being used.
Depreciation
No depreciation is charged on freehold land. Estimated useful asset lives are within these ranges:
| Useful asset | Lifespan |
|---|---|
| Freehold buildings | The shorter of 50 years or remaining life as assessed by valuers |
| Leasehold land and buildings | Period remaining on lease or to next rent review |
| Health and Safety Executive/Health and Safety Laboratory Private Finance Initiative (PFI) leasehold buildings | 60 years designated life |
| Leasehold improvements | Period remaining on lease (up to 20 years) |
| Information technology | 2 to 11 years |
| Plant and machinery | 5 to 10 years (5 to 20 years for HSE’s Science Division) |
| Furniture and fittings | >1 to 15 years (>1 to 30 years for HSE’s Science Division) |
| Motor vehicles | 3 to 10 years |
Amortisation
| Useful asset | Lifespan |
|---|---|
| Purchased software licences | The shorter of the licence period or a period from >1 to 15 years as aligned to the useful economic life (UEL) of the application/developed software the licence provides access to |
| Internally developed software | >1 to 20 years |
| Websites | 5 to 7 years |
1.12. Financial Instruments
In line with the government Financial Reporting Manual adaptation of IAS 32 (Financial Instruments: Presentation) and IFRS 9 (Financial Instruments), we recognise financial assets and liabilities when we become party to the contracts or legislation that give rise to them. For financial assets, this includes benefit overpayments, benefit advances and Tax Credits receivables.
1.12.1. Financial Assets
Financial assets include cash and cash equivalents, trade and other receivables, loans, benefit advances, benefit overpayments and Tax Credits receivables. The Department determines the classification of its financial assets at initial recognition. Our policy is not to trade in financial instruments. The Department holds all assets in order to collect cash flows, there is no intention to sell the debt asset. The contractual cash flows are solely repayments of principal debt and therefore the debt is measured at amortised cost.
Financial assets are recognised initially at fair value, normally being the transaction price plus, in the case of financial assets not at fair value through profit and loss (FTVPL), directly attributable costs. Further details on the recognition and measurement of specific classes of financial assets are included below.
Trade and other receivables, and loans
Trade and other receivables have fixed or determinable payments that are not quoted on an active market and they do not carry interest. The initial recognition of trade and other receivables is usually the original invoiced amount.
Subsequent recognition of the trade and other receivables is at amortised cost using the effective interest method. The appropriate impairment allowance is detailed below.
Benefit overpayments
As part of assessing and paying benefits, people can be paid more than they are legally entitled to under the relevant benefit legislation either due to fraud or error. Where overpayments to individuals are identified, and the Department has a legal right to recover the excess amount paid, the amount owed is recognised as a benefit overpayment receivable.
We hold all benefit overpayments to collect the cash flows due. Benefit overpayments are not quoted on any active market and do not carry interest. Cash flows consist of the repayment of principal only. They are therefore measured at amortised cost, less recoveries to date, and subject to impairment for expected credit losses.
The Secretary of State has an obligation to protect public funds and to ensure that, wherever possible, overpayments are recovered. We seek to recover all benefit overpayments where we have the legal basis to do so unless it would cause financial hardship or would not be cost-effective. Where recovery isn’t cost-effective, we write off overpayments, with the exception of fraud cases which are exhausted as far as possible. Our write-off policy has been agreed with HM Treasury. Debts are normally recovered through deductions of voluntary agreements with debtors or deductions from earnings.
We do not recognise certain categories of identified benefit overpayment as receivables, including:
- those due to official error where there is no statutory right of recovery
- cases satisfying Secretary of State waiver policies
- where the claimant has died, and the estate isn’t large enough to recover the overpayment
These losses are included in the Losses and Special Payments note.
In addition to the above, the balance of gross benefit overpayments does not include all of the estimated overpayments reported in note 18, Incorrect Payments, based on the estimates arising from the annual Fraud and Error measurement exercise in this year (or prior years) because a receivable cannot be recognised if:
- the overpayment has not been identified by the Department
- an identified overpayment has not been properly referred for collection
- the referred overpayment has not been processed and communicated to the claimant
These overpayments are excluded from the financial statements because the relevant process - required under benefit legislation to establish the underlying rights for the receivable - is incomplete and an asset cannot be recognised (see note 1.5).
Benefit advances
Benefit advances mainly relate to Universal Credit and are, in effect, an advancement of a claimant’s first indicative award. They are intended to provide support for individuals in the period between a benefit claim and the first benefit payment. The cash advance paid is recognised as a benefit advance receivable.
We hold all benefit advances to collect the cash flows due. Benefit advances are not quoted on any active market and do not carry interest. Cash flows consist of the repayment of principal only. They are therefore measured at amortised cost, less recoveries to date, and subject to impairment for expected credit losses.
Benefit advances are subject to the same recovery and write-off policies as for benefit overpayments.
Tax Credits
In April 2016, we started to take on the receivables associated with HM Revenue and Customs Personal Tax Credits for customers who have made a claim to Universal Credit (UC) and have existing Tax Credits debt or have migrated from Tax Credits to UC. The transfer of receivables is planned to continue over the coming years as more customers move to UC. HM Revenue and Customs have also transferred additional Tax Credit receivables not related to UC claimants to make use of DWP’s recovery powers.
In line with the government Financial Reporting Manual adaptation of IAS 20 (Accounting for Government Grants and Disclosure of Government Assistance) this transfer has been treated as a donated asset capital grant in kind and disclosed as such throughout the Financial Statements. The receivables have been transferred to us at the carrying value which was calculated at the point of transfer by HM Revenue and Customs using their impairment rate applied to the gross debt.
We hold all Tax Credit receivables to collect the cash flows due. Tax Credit receivables are not quoted on any active market and do not carry interest. Cash flows consist of the repayment of principal only. They are therefore measured at amortised cost, less recoveries to date, and subject to impairment for expected credit losses.
Following the transfer, Tax Credit receivables are subject to the same policies as those set out for benefit overpayments.
Impairment of Financial Assets
Trade and other receivables
All departmental assets are impaired using the IFRS 9 simplified approach, whereby a historical recovery rate is calculated and applied to the debts according to age profile. These have been detailed within Note 13. Within the Trade and other receivables category we have debts relating to, Support for Mortgage Interest, other government departments, payroll overpayments, recovery of admin penalties and Independent Living Fund.
Benefit related financial assets
Unlike commercial credit arrangements, the assessment and payment of benefits occurs under specific legislation, without reference to credit risk and frequently without agreed contractual cash flows for repayment. Consequently, when these assets are assessed for impairment under IFRS 9, changes in credit risk cannot be used to assess whether lifetime expected credit losses should be recognised and contractual cash flows cannot be used as an indicator of credit risk or default. We’ve therefore chosen to provide for lifetime expected credit losses for the following categories of benefit related financial assets:
- benefit overpayments
- benefit advances
- tax Credit receivables
- Social Fund loans
Receivables are grouped by the benefit they relate to, with impairments calculated on a collective basis for each group. This approach reflects the different demographics and socio-economic backgrounds of claimants to different benefits.
Our impairment calculation considers the expected recoveries over the lifetime of the debt and impairs the debt balance. We further discount using the HM Treasury provided discount rate. The Departments Impairment calculation:
1. Uses historic performance to assess future recoveries
2. Assumes recovery rates are linked to the age of the debt
3. Assumes that debts have a lifespan of 20 years
Further details are explained in Note 13a.
Cash and cash equivalents
Cash and cash equivalents comprise cash in hand, short term deposits with an initial maturity of 3 months or less and current balances with banks and similar institutions. For the purpose of the Consolidated Statement of Cash Flows, cash and cash equivalents are net of outstanding bank overdrafts. We include bank overdrafts in current liabilities in the Statement of Financial Position.
Derecognition of Financial assets
Financial assets are derecognised when the rights to receive future cash flows have expired or are transferred and the risks and rewards of ownership have been substantially transferred.
1.12.2. Financial Liabilities
Financial liabilities are measured at amortised cost. Financial liabilities include trade and other payables and loans. The Department does not currently have financial liabilities measured at fair value through profit or loss and neither does it have complex derivative financial instruments.
Trade and other payables
Trade and other payables excluding accruals, are generally not interest bearing and are stated at their invoice value on initial recognition. Subsequently they are measured at amortised cost.
Accruals
Accruals are generally not interest bearing and are stated at their invoice value on initial recognition. They represent benefit payments paid in April 2023 relating to entitlement weeks within 2022-23 and are, therefore, recognised as accrued expenditure in these financial statements. These will fluctuate year-on-year depending on the specific benefit payday that the last working day falls.
Derecognition of financial liabilities
Financial liabilities are derecognised when the obligation is discharged, cancelled or expires.
1.13. Provisions
We recognise provisions in accordance with IAS 37 (Provisions, Contingent Liabilities and Contingent Assets). They are valued using the best estimate of the expenditure required to settle the obligation. Where the effect of the time value of money is significant, we discount the estimated risk-adjusted cash flows using the real rate set by HM Treasury.
Financial Assistance Scheme (FAS) and other provisions
The de minimis threshold used for Benefit provisions does not apply to FAS and our other provisions (note 16a and 16e) although clearly immaterial items will not be provided for.
Benefit provisions and underpayments
Benefit provisions are in relation to ongoing legal cases against the Department or have been identified as a result of internal procedures such as Legal Entitlements and Administrative Practice (LEAP) exercises. These provisions are estimated using data provided by analysts which is based on sampling and other analytical data. The estimates are reviewed and updated regularly based on the latest data.
We apply a de minimis threshold for provisions and contingent liabilities associated with the social security benefits the Department administers.
The threshold of the de minimis is £10 million for individual liabilities and a £90 million de minimis is applied in aggregate. The thresholds will be reviewed annually to ensure they remain appropriate.
Distinct from legal cases, the Department acknowledges that official error by its staff will sometimes result in the underpayment of benefit. At present there is no mechanism by which we can calculate the value of historic official error corrected in year, to support an overall quantification of the outstanding liability. We therefore disclose a contingent liability, see note 19.
State Pension underpayment provisions
These are specific liabilities relating to underpayment of benefit. As such, we adopt the same policy as set out for Benefit provisions. These items however merit separate disclosure in Note 16 (Provisions for liabilities and charges) due to their materiality and likely interest to readers of the accounts.
1.14. Pensions
The provisions of the Principal Civil Service Pension Scheme (PCSPS) cover past and present employees. The defined benefit schemes are unfunded and are contributory public service occupational pension schemes made under the Superannuation Act 1972. In accordance with the FReM paragraph 8.2 adaptation of IAS 19, the Department accounts for these as defined contribution schemes and recognised contributions it pays as an expense in the year in which they are incurred. Liability for payment of future benefits is a charge on the Civil Service Pension arrangements.
In respect of the defined contribution schemes, we recognise the contributions payable for the year.
Full information about Civil Service Pension arrangements can be found at www.civilservicepensionscheme.org.uk
For information regarding our Remploy pension scheme, please see note 17.
1.15. Leases
IFRS 16 - Leases has been implemented since 1 April 2022; this amended the accounting for lessees, removing the distinction between recognising an operating lease (off balance sheet) and a finance lease (on balance sheet). The new standard requires recognition of all qualifying leases on balance sheet.
The result is the recognition of a right to use asset, measured at the present value of future lease payments, with a matching lease liability.
IFRS 16 defines a lease as a contract that ‘conveys the right to control the use of an identified asset for a period of time in exchange for consideration.’ This definition applies both to lessees and lessors.
Therefore, in order to contain a lease, a contract must:
- depend on the use of an identified asset and
- provide the customer with the right to control the use of that identified asset
IFRS 16 defines the lease term as the non-cancellable period for which a lessee has the right to use an underlying asset, together with both i) periods covered by an option to extend the lease if the lessee is reasonably certain to exercise that option; and ii) periods covered by an option to terminate the lease if the lessee is reasonably certain not to exercise that option.
Lease liability
The lease liability is initially measured at the present value of the lease payments that are not paid at the commencement date, discounted using the interest rate implicit in the lease, or if that cannot be readily determined, the rate provided by HM Treasury. The HM Treasury discount rates were 0.95% for leases entered into prior to 31 December 2022, or 3.51% after 1 January 2023.
The lease liability is measured at amortised cost using the effective interest method. It is re-measured when there is a change in future lease payments arising from a change in the index or rate, if there is a change in the Department’s estimates of the amount expected to be payable under a residual value guarantee, or if the Department changes its assessment of whether it will exercise a purchase, extension, or termination option.
Lease payments included in the measurement of the lease liability comprise the following:
- fixed payments, including in-substance fixed payments
- variable lease payments that depend on an index or a rate, initially measured using the index rate as at the commencement date
- amounts expected to be payable under a residual value guarantee
- the exercise price under a purchase option that the Department is reasonably certain to exercise, lease payments in an optional renewal period if the Department is reasonably certain to exercise an extension option, and penalties for early termination of a lease unless the Department is reasonably certain not to terminate early
When the lease liability is re-measured, a corresponding adjustment is made to the right of use asset or recorded in the SoCNE if the carrying amount of the right of use asset is zero.
DWP presents right of use assets that do not meet the definition of investment properties per IAS 40 as right of use assets on the SoFP. The lease liabilities are included within Lease liabilities within current and non-current liabilities on the SoFP.
Right of use asset
The right of use asset is initially measured at cost, which comprises the initial amount of the lease liability adjusted for initial direct costs, prepayments or incentives, and costs related to restoration at the end of a lease.
The right of use assets are subsequently measured at either fair value or current value in existing use in line with property, plant, and equipment assets. The cost measurement model in IFRS 16 is used as an appropriate proxy for current value in existing use or fair value for the majority of leases (consistent with the principles for subsequent measurement of property, plant, and equipment) except for those which meet 1 of the following:
- a longer-term lease that has no provisions to update lease payments for market conditions or if there is a significant period of time between those updates
- the fair value or current value in existing use of the underlying asset is likely to fluctuate significantly due to changes in market prices
The right of use asset is depreciated using the straight-line method from the commencement date to the earlier of the end of the useful life of the right of use asset or the end of the lease term. The estimated useful lives of the right of use assets are determined on the same basis of those of property, plant, and equipment assets.
DWP include an estimate of known costs to be incurred in dismantling and removing the underlying asset, restoring the site on which it is located or restoring the underlying asset to the condition required by the terms and conditions of the lease, unless those costs are incurred to produce inventories. The obligations for such costs are recognised and measured applying IAS 37 Provisions, Contingent Liabilities and Contingent Assets.
Subleases
At the commencement of a lease where a sub-leasing arrangement is present and DWP is the intermediate lessor, DWP recognises a lease receivable at an amount equal to the net investment in the lease (IFRS 16.67). The net investment in the lease is the sum of the following (discounted using HM Treasury discount rates as default):
- the lease payments receivable by DWP; and
- any unguaranteed residual value
Transition
On transition to IFRS 16, it is mandated that all FReM bodies retrospectively apply the standard with the cumulative effect recognised as an adjustment to opening balances (cumulative catch-up). No budget entries were made for the cumulative catch-up adjustment to accounts. Instead, for budgeting, the cumulative catch-up was ignored and no Prior Period Adjustment (PPA) was required.
DWP did not reassess whether a contract is, or contains, a lease at the date of initial application as per the IFRS 16 practical expedient.
The rental expense on operating leases previously recognised within the SoCNE has been replaced by a depreciation charge and a finance charge. As DWP applied IFRS 16 using the modified retrospective approach the comparative information has not been restated.
DWP use hindsight in determining the lease term if the contract contains options to extend or terminate the lease.
DWP have elected not to recognise right of use assets and lease liabilities for the following leases:
- intangible assets
- leases for which the underlying asset is of low value
- leases for which the lease term ends within 12 months of initial application
Impact on financial statements
On transition to IFRS 16 DWP recognised £1.0 billion of right of use assets and £1.4 billion of lease liabilities, recognising the difference (taking into account subletting de-recognition and lease incentives) in the general fund account.
When measuring lease liabilities, DWP elected to discount lease payments using the HM Treasury discount rates (0.95% 2022, 3.51% 2023)
| Lease liability | Core Dept £000 | Dept Group £000 |
|---|---|---|
| Operating lease commitment at 31 March 2022 | 1,978,409 | 1,996,023 |
| Discounted using discount rates | (84,255) | (84,255) |
| Finance Lease liabilities at 31 March 2022 | 38,558 | 39,950 |
| – Exemptions | (566,953) | (566,953) |
| Lease Liabilities recognised at 1 April 2022 | 1,365,759 | 1,384,765 |
*Exemptions include:
- short term leases (leases where the term is less than 12 months)
- low value assets (leases where the underlying asset value is less than £5000)
- intangible assets
- extension and termination options reasonably certain to be exercised
- variable lease payments based on an index or rate
- residual value guarantees (a guarantee made to a lessor that the value [or part of the value] of an underlying asset at the end of a lease will be at least a specified amount)
- advance payments
- previously included non-lease/service components (where possible DWP have separated lease and service components [maintenance, security etc.] and have only capitalised amounts relating to lease components)
1.16. Contingent liabilities
We disclose contingent liabilities in accordance with IAS 37 (Provisions, Contingent Liabilities and Contingent Assets). They are valued using the best estimate of the expenditure required to settle the obligation where it is possible to do so.
We apply the same de minimis threshold for recognition of contingent liabilities associated with the social security benefits the Department administers as a provision, see note 1.13.
For some statutory and non-statutory contingent liabilities, the likelihood of transfer of economic benefits is remote. However, we disclose these for Parliamentary reporting and accountability purposes in the Remote Contingent Liabilities section within the accountability report.
1.17. Grant in aid
Grants in aid to our arm’s length bodies are treated as expenditure in our SoCNE. In the accounts of the arm’s length bodies, these grants are treated as financing, and are credited to their reserves. Grants in aid are accounted for on a cash basis. ###2. Statement of operating costs by operating segment
Our operating segments are reported to their respective decision-making committees based on the expenditure type.
Statement of Outturn Against Parliamentary Supply (SOPS) and supporting notes reflect the net resource and capital outturn in line with the control totals voted by Parliament. The totals in our operating segments align with the SOPS.
We have 2 types of expenditure - Departmental Expenditure Limit (DEL) and Annually Managed Expenditure (AME).
DEL: spending which is generally within our control and managed in fixed multi-year limits. Some elements may be demand led.
Our Investment Committee is the chief decision making body within the Department for DEL expenditure and receives updates on our monthly management accounts. The monthly management accounts are based on our DEL operating segments and detail our spending and any financial issues they need to be aware of.
This year we’ve disclosed our DEL segments as:
- Service Excellence – Counter Fraud Compliance and Debt, Retirement Services, Child Maintenance, Customer Experience, Service Transformation and Service Planning and Delivery
- Work and Health Services – this brings together Disability Services, Working Age and Universal Credit Operations in the Department
-
corporate functions as follows:
- Finance Group – our core finance: Strategy; Payment Systems; Partnering; Planning; Security and Risk Management and Commercial and Contract Management. Also, included are health and employment programmes (excluding Kickstart) and grants, and our DEL spend for local authorities.
- Digital Group – our IT Contracts and digital services for colleagues and customers.
- Policy Group – our policy functions support our Ministers and DWP ET. Policy group also supports ALB’s including Health and Safety Executive, the Money and Pensions Service, the Pension’s Regulator and the Pension Protection Fund.
- People, Capability and Place – our core HR functions and Estates contract management.
- other corporate functions (Communications; Central Analysis, Science, Ministers, Governance and Strategy).
- change – our investment programmes and projects. In 2022-23 the largest programmes reflected the Department’s response to supporting the labour market, specifically the Kickstart programme.
- arm’s length bodies – the expenditure incurred by the bodies within our accounting boundary.
| Expenditure | 2022-23 £000 | 2021-22 £000 |
|---|---|---|
| Service Excellence | 1,105,877 | 900,552 |
| Work and Health Services | 2,036,563 | 2,268,776 |
| Corporate: Finance Group (excluding CMPD) | 132,350 | 168,903 |
| Contract Management and Partner Delivery (CMPD) | 2,261,785 | 2,046,819 |
| Digital Group | 924,195 | 969,094 |
| Policy Group | 232,667 | 211,874 |
| People, Capability and Place | 1,353,199 | 1,011,975 |
| Other corporate (Communications; Central Analysis, Science, Ministers, Governance and Strategy) | 45,977 | 38,600 |
| Change | 598,958 | 1,540,773 |
| Arm’s length bodies | 454,147 | 440,616 |
| Total resource and capital DEL | 9,145,719 | 9,597,982 |
AME: spending which is generally less predictable and controllable than spending in DEL. This covers expenditure on benefits for welfare, pensions and Social Fund.
Our AME expenditure is managed jointly by the Department for Work and Pensions and HM Treasury and reported to the AME Board which is instrumental in the AME decision making process. Additionally, AME expenditure is subject to review within the monthly departmental management accounts review meeting chaired by the Finance Director General. This forum was used in 2022-23 to review and approve the Department’s AME strategy for Supply Estimates and subsequently reviewed AME forecasts versus the funding granted by Parliament.
| Expenditure | 2022-23 £000 | 2021-22 £000 |
|---|---|---|
| Total resource and capital AME | 230,540,927 | 216,059,947 |
| Total resource and capital DEL and AME | 239,686,646 | 225,657,929 |
SOPS notes 1.1 and 1.2 provide details of resource and capital.
SOPS 2 reconciles SOPS resource to the Statement of Consolidated Net Expenditure.
This note does not include assets and liabilities, as they are not included in the management information that is provided to the Department’s boards.
The reconciling difference between the total of reportable segments’ net outturn (£239.8bn, representing total resource and capital DEL and AME) to net expenditure shown in the SoCNE (£239.2bn) is made up of:
(i) Total Capital Outturn (£0.5bn); and
(ii) Other immaterial reconciling items (£0.1bn). Cash paid to the Social Fund – Voted Non-budget (£4.9bn) is shown as a reconciling item in SOPS note 2, but does not represent a reconciling difference between operating segments outturn and the SoCNE, as Non-Budget expenditure is included within total resource outturn in SOPS 2 but is not included in operating segments’ outturn.
3. Staff expenditure
| Staff expenditure | 2022-23: Core department £000 | 2022-23: Departmental group £000 | 2021-22: Core department £000 | 2021-22: Departmental group £000 |
| Wages and salaries | 2,597,988 | 2,816,266 | 2,706,279 | 2,912,022 |
| Employers’ National Insurance | 247,209 | 270,755 | 242,772 | 263,562 |
| Superannuation and pension costs | 625,423 | 673,352 | 645,089 | 689,968 |
| Total staff costs | 3,470,620 | 3,760,373 | 3,594,140 | 3,865,552 |
We’ve presented the full staff and related expenditure disclosure in the remuneration and staff report.
4. Expenditure
| Expenditure | Note | 2022-23: Core department £000 | 2022-23: Departmental group £000 | 2021-22: Core department £000 | 2021-22: Departmental group £000 |
|---|---|---|---|---|---|
| Goods and services | 868,113 | 928,930 | 826,862 | 905,429 | |
| Accommodation expenditure | 626,040 | 639,201 | 748,826 | 763,601 | |
| IT services | 513,523 | 540,499 | 483,478 | 501,495 | |
| Grant in aid | 440,422 | – | 413,460 | – | |
| Other costs | 93,299 | 185,727 | 82,735 | 182,402 | |
| Non-cash goods and services | 6 | 14,845 | 14,852 | 4,546 | 5,181 |
| Rentals costs | 4,791 | 4,812 | 2,209 | 6,548 | |
| Agency payments on behalf of EU to third-parties | 556,958 | 556,958 | 283,402 | 283,402 | |
| Audit fee | – | 261 | 60 | 293 | |
| Non-audit services fee | 87 | 87 | 100 | 100 | |
| Purchase of goods and services total | 3,118,078 | 2,871,327 | 2,845,678 | 2,648,451 | |
| PFI service charges | – | 12,869 | – | 11,677 | |
| Lease charges | 11,987 | 17,811 | 4,865 | 10,734 | |
| Total finance expense | 11,987 | 30,680 | 4,865 | 22,411 |
During the year, the Department purchased £0.087 million for non-audit services from its auditor, National Audit Office, to provide a non-statutory audit opinion to the Department on benefit expenditure recharged to Social Security Scotland in relation to devolved benefits administered by the Department under Agency Agreements. This opinion will be shared with Social Security Scotland.
The audit fee for the Department and its agencies of £1.59 million in non-cash expenditure, see note 6.
5. Benefit and Social Fund expenditure
| Expenditure | Note | 2022-23: Core department £000 | 2022-23: Departmental group £000 | 2021-22: Core department £000 | 2021-22: Departmental group £000 |
|---|---|---|---|---|---|
| Voted expenditure | 5a | 114,614,086 | 114,614,086 | 105,214,370 | 105,214,370 |
| Non-voted expenditure | 5b | 115,097,546 | 115,097,546 | 109,629,476 | 109,629,476 |
| Social Fund expenditure[footnote 65] | 4,728,411 | 4,728,411 | 1,996,518 | 1,996,518 | |
| Programme balances written off | 384,787 | 384,787 | 365,601 | 365,601 | |
| Total | 234,824,830 | 234,824,830 | 217,205,965 | 217,205,965 |
5a. Voted expenditure
| Voted expenditure | 2022-23: Core department £000 | 2022-23: Departmental group £000 | 2021-22: Core department £000 | 2021-22: Departmental group £000 |
|---|---|---|---|---|
| Universal Credit | 42,556,701 | 42,556,701 | 40,277,925 | 40,277,925 |
| Personal Independence Payment | 17,430,389 | 17,430,389 | 15,043,521 | 15,043,521 |
| Amounts paid to local authorities | 16,111,245 | 16,111,245 | 16,650,653 | 16,650,653 |
| Employment and Support Allowance | 7,408,425 | 7,408,425 | 7,973,321 | 7,973,321 |
| Disability Living Allowance | 5,967,372 | 5,967,372 | 5,699,485 | 5,699,485 |
| Cost of Living Payment[footnote 66] | 5,665,483 | 5,665,483 | – | – |
| Attendance Allowance | 5,630,352 | 5,630,352 | 5,264,787 | 5,264,787 |
| Pension Credit | 4,858,644 | 4,858,644 | 4,781,848 | 4,781,848 |
| Carer’s Allowance | 3,264,970 | 3,264,970 | 3,058,819 | 3,058,819 |
| Statutory Sick Pay and Statutory Maternity Pay | 2,628,923 | 2,628,923 | 2,569,293 | 2,569,293 |
| Income Support | 698,078 | 698,078 | 850,448 | 850,448 |
| Industrial Injuries Benefits Scheme | 694,164 | 694,164 | 705,200 | 705,200 |
| Jobseeker’s Allowance | 199,982 | 199,982 | 306,287 | 306,287 |
| Employment Programmes – Kick Start | 222,430 | 222,430 | 744,840 | 744,840 |
| Employment Programmes – Restart | 435,053 | 435,053 | 335,825 | 335,825 |
| Employment Programmes – Other | 392,698 | 392,698 | 491,137 | 491,137 |
| Severe Disablement Allowance | 57,642 | 57,642 | 63,284 | 63,284 |
| TV licenses for over 75s | – | – | 299 | 299 |
| Other expenditure | 391,535 | 391,535 | 397,398 | 397,398 |
| Total | 114,614,086 | 114,614,086 | 105,214,370 | 105,214,370 |
5b. Non-voted expenditure (financed by the National Insurance Fund)
| Non-voted expenditure | 2022-23: Core department £000 | 2022-23: Departmental group £000 | 2021-22: Core department £000 | 2021-22: Departmental group £000 |
|---|---|---|---|---|
| State Pension | 109,570,914 | 109,570,914 | 104,060,658 | 104,060,658 |
| Employment and Support Allowance | 4,535,219 | 4,535,219 | 4,506,166 | 4,506,166 |
| Bereavement benefits | 363,430 | 363,430 | 391,358 | 391,358 |
| Maternity Allowance | 389,691 | 389,691 | 361,983 | 361,983 |
| Christmas Bonus | 125,836 | 125,836 | 124,060 | 124,060 |
| Jobseeker’s Allowance | 111,876 | 111,876 | 183,793 | 183,793 |
| Incapacity Benefit | 580 | 580 | 1,458 | 1,458 |
| Total | 115,097,546 | 115,097,546 | 109,629,476 | 109,629,476 |
6. Non-cash expenditure
| Non-cash expenditure | Note | 2022-23: Core department £000 | 2022-23: Departmental group £000 | 2021-22: Core department £000 | 2021-22: Departmental group |
|---|---|---|---|---|---|
| Auditor’s remuneration | 1,587 | 1,587 | 1,443 | 1,443 | |
| Loss on disposal of assets | 6,955 | 6,962 | 568 | 541 | |
| Revaluation (gain)/loss | (163) | (163) | 621 | 1,283 | |
| Movements on pension liability | 1,747 | 1,747 | 1,914 | 1,914 | |
| ESF Foreign Exchange Loss | 4,719 | 4,719 | – | – | |
| Total | 14,845 | 14,852 | 4,546 | 5,181 | |
| Depreciation and amortisation of non-current assets |
9 and 10 | 546,617 | 562,244 | 244,839 | 256,246 |
| Impairment of non-current assets | 12,027 | 12,027 | 1,003 | 3,077 | |
| Movement in impairment of receivables | 13 | (1,484,964) | (1,484,836) | 236,411 | 236,411 |
| Total | (926,320) | (910,565) | 482,253 | 495,734 | |
| Movement in provisions | 16 | (458,399) | (458,742) | 1,398,055 | 1,398,270 |
| Borrowing costs of provisions | 16 | 62,718 | 62,718 | 105,347 | 105,347 |
| Provision expense total | (395,681) | (396,024) | 1,503,402 | 1,503,617 | |
| Total | (1,307,156) | (1,291,737) | 1,990,201 | 2,004,532 |
ESF foreign exchange losses relate to European Social Fund (ESF) 2014-20 programmes. In 2021-22, the ESF programme had a net unrealised net gain shown in note 7 income.
7. Income
| Income | 2022-23: Core department £000 | 2022-23: Departmental group £000 | 2021-22: Core department £000 | 2021-22: Departmental group £000 |
|---|---|---|---|---|
| HSE income | – | 89,347 | – | 87,602 |
| Pension levy receipts | 108,006 | 108,006 | 91,400 | 91,400 |
| EU income | 556,118 | 556,118 | 283,375 | 283,375 |
| Other income | 65,948 | 66,189 | 87,712 | 88,388 |
| Mesothelioma recoveries | 47,607 | 47,607 | 49,084 | 49,084 |
| Income from other government departments |
105,328 | 105,328 | 97,062 | 97,062 |
| CFER income | 18,013 | 18,013 | 34,149 | 34,149 |
| Total operating income | 901,020 | 990,608 | 642,782 | 731,060 |
| Investment income | 26,754 | 27,117 | 30,029 | 30,035 |
| ESF foreign exchange gain | – | – | 302 | 302 |
| Total financial income | 26,754 | 27,117 | 30,331 | 30,337 |
| Total income | 927,774 | 1,017,725 | 673,113 | 761,397 |
EU income relates to the European Social Fund (ESF) 2014-20 programme which funds projects across the UK. The Department’s income from the EU is included within other income.
ESF foreign exchange gains relate to the European Social Fund (ESF) 2014-20. The ESF programme has a net unrealised loss in 2022-23 shown in note 6 non-cash expenditure.
8. Donated assets
| Donated asset | 2022-23: Core department £000 | 2022-23: Departmental group £000 | 2021-22: Core department £000 | 2021-22: Departmental group £000 |
|---|---|---|---|---|
| Gross Tax Credits transfer | (285,971) | (285,971) | (964,732) | (964,732) |
| Tax Credits transfer impairment | 151,794 | 151,794 | 519,894 | 519,894 |
| Total | (134,177) | (134,177) | (444,838) | (444,838) |
In April 2016 the Department started to take on the debt associated with HM Revenue and Customs personal Tax Credits for customers who have made a claim to Universal Credit and have existing Tax Credits debt or have migrated from Tax Credits to Universal Credit. This was planned to continue to transfer over the coming years, as more customers move to Universal Credit.
Whilst we regularly agree Tax Credits debt to transfer with HM Revenue and Customs, the amounts that are disclosed in our respective accounts may not agree due to timing differences. See note 1.12 for more information on Tax Credits receivables.
9. Property, plant and equipment
Consolidated property, plant and equipment
| Item | Land and buildings £000 | Leasehold improvements £000 | Information Technology £000 | Plant and machinery £000 | Furniture and fittings £000 | Motor vehicles £000 | Payments on account and assets under construction £000 | Total £000 |
|---|---|---|---|---|---|---|---|---|
| Cost or valuation: At 1 April 2022 |
151,186 | 502,296 | 445,654 | 27,355 | 66,734 | 1,510 | 87,119 | 1,281,854 |
| Cost or valuation: IFRS 16 Adjustments |
999,903 | – | – | 2,373 | – | – | – | 1,002,276 |
| Cost or valuation: Additions |
59,439 | 7 | 16,685 | 2,150 | 495 | – | 92,244 | 171,020 |
| Cost or valuation: Disposals |
(33,718) | – | (49,414) | (637) | (324) | (625) | – | (84,718) |
| Cost or valuation: Impairment |
(7,325) | – | (106) | – | – | – | – | (7,431) |
| Cost or valuation: Reclassifications |
20 | 19,478 | (231) | 1,960 | – | – | (23,545) | (2,318) |
| Cost or valuation: Revaluations |
(3,128) | – | – | – | – | – | – | (3,128) |
| At 31 March 2023 | 1,166,377 | 521,781 | 412,588 | 33,201 | 66,905 | 885 | 155,818 | 2,357,555 |
| Depreciation: At 1 April 2022 |
13,055 | 128,817 | 332,123 | 19,419 | 26,455 | 1,003 | – | 520,872 |
| Depreciation: Charged in year |
208,819 | 196,164 | 57,243 | 3,463 | 6,482 | 98 | – | 472,269 |
| Depreciation: Disposals |
(2,540) | – | (49,233) | (65) | (324) | (510) | – | (52,672) |
| At 31 March 2023 | 219,334 | 324,981 | 340,133 | 22,817 | 32,613 | 591 | – | 940,469 |
| Carrying amount at 31 March 2022 | 138,131 | 373,479 | 113,531 | 7,936 | 40,279 | 507 | 87,119 | 760,982 |
| Carrying amount at 31 March 2023 | 947,043 | 196,800 | 72,455 | 10,384 | 34,292 | 294 | 155,818 | 1,417,086 |
| Asset financing: Owned |
9,257 | 196,800 | 64,288 | 9,046 | 33,133 | 294 | 155,818 | 468,636 |
| Asset financing: Leased |
862,777 | – | 8,167 | 1,338 | 1,159 | – | – | 873,441 |
| Asset financing: PFI contracts |
75,009 | – | – | – | – | – | – | 75,009 |
| Carrying amount at 31 March 2023 | 947,043 | 196,800 | 72,455 | 10,384 | 34,292 | 294 | 155,818 | 1,417,086 |
| Of the total: Department |
836,974 | 194,064 | 63,585 | 5,888 | 30,719 | 6 | 151,775 | 1,283,011 |
| Of the total: Arm’s length bodies |
110,069 | 2,736 | 8,870 | 4,496 | 3,573 | 288 | 4,043 | 134,075 |
| Carrying amount at 31 March 2023 | 947,043 | 196,800 | 72,455 | 10,384 | 34,292 | 294 | 155,818 | 1,417,086 |
| Cost or valuation: At 1 April 2021 |
152,420 | 114,828 | 471,349 | 26,132 | 65,032 | 2,155 | 144,718 | 976,634 |
| Cost or valuation: Additions |
32,931 | 21 | 8,842 | 260 | 907 | 87 | 336,192 | 379,240 |
| Cost or valuation: Disposals |
– | (1,367) | (32,446) | (9) | (305) | (743) | – | (34,870) |
| Cost or valuation: Impairment |
– | – | (1,153) | – | – | – | – | (1,153) |
| Cost or valuation: Reclassifications |
173 | 388,814 | (938) | 972 | 1,100 | 11 | (393,791) | (3,659) |
| Cost or valuation: Revaluations |
(34,338) | – | – | – | – | – | – | (34,338) |
| At 31 March 2022 | 151,186 | 502,296 | 445,654 | 27,355 | 66,734 | 1,510 | 87,119 | 1,281,854 |
| Depreciation: At 1 April 2021 |
38,179 | 49,743 | 288,884 | 17,706 | 20,200 | 1,276 | – | 415,988 |
| Depreciation: Charged in year |
8,822 | 80,180 | 75,477 | 1,723 | 6,533 | 156 | – | 172,891 |
| Depreciation: Disposals |
– | (1,106) | (32,238) | (9) | (278) | (430) | – | (34,061) |
| Depreciation: Reclassifications |
– | – | – | (1) | – | 1 | – | – |
| Depreciation: Revaluations |
(33,946) | – | – | – | – | – | – | (33,946) |
| At 31 March 2022 | 13,055 | 128,817 | 332,123 | 19,419 | 26,455 | 1,003 | – | 520,872 |
| Carrying amount at 31 March 2021 | 114,241 | 65,085 | 182,465 | 8,426 | 44,832 | 879 | 144,718 | 560,646 |
| Carrying amount at 31 March 2022 | 138,131 | 373,479 | 113,531 | 7,936 | 40,279 | 507 | 87,119 | 760,982 |
| Asset financing: Owned |
9,542 | 373,479 | 109,384 | 7,936 | 39,020 | 507 | 87,119 | 626,987 |
| Asset financing: Finance leased |
48,648 | – | 4,147 | – | 1,259 | – | – | 54,054 |
| Asset financing: PFI contracts |
79,941 | – | – | – | – | – | – | 79,941 |
| Carrying amount at 31 March 2022 |
138,131 | 373,479 | 113,531 | 7,936 | 40,279 | 507 | 87,119 | 760,982 |
| Of the total: Department |
47,532 | 369,701 | 107,180 | 4,066 | 36,125 | 22 | 83,639 | 648,265 |
| Of the total: Arm’s length bodies |
90,599 | 3,778 | 6,351 | 3,870 | 4,154 | 485 | 3,480 | 112,717 |
| Carrying amount at 31 March 2022 | 138,131 | 373,479 | 113,531 | 7,936 | 40,279 | 507 | 87,119 | 760,982 |
a. Right of use assets
The figures in the table below are included within the consolidated property, plant and equipment note above.
| Item | Land and buildings £000 | Information Technology £000 | Plant and machinery £000 | Total £000 |
|---|---|---|---|---|
| Cost or valuation: At 1 April 2022 |
999,903 | – | 2,373 | 1,002,276 |
| Cost or valuation: Additions |
56,828 | 8,826 | 278 | 65,932 |
| Cost or valuation: Disposals |
(6,486) | – | (627) | (7,113) |
| Cost or valuation: Modifications |
(27,232) | – | – | (27,232) |
| Cost or valuation: Impairment |
(7,325) | – | – | (7,325) |
| Cost or valuation: Reclassifications |
55,544 | – | – | 55,544 |
| At 31 March 2023 | 1,071,232 | 8,826 | 2,024 | 1,082,082 |
| Depreciation: At 1 April 2022 |
– | – | – | – |
| Depreciation: Charged in year |
206,396 | 982 | 553 | 207,931 |
| Depreciation: Disposals |
(2,540) | – | (57) | (2,597) |
| Depreciation: Reclassifications |
11,471 | – | – | 11,471 |
| At 31 March 2023 | 215,327 | 982 | 496 | 216,805 |
| Carrying amount at 31 March 2022 | 999,903 | – | 2,373 | 1,002,276 |
| Carrying amount at 31 March 2023 | 855,905 | 7,844 | 1,528 | 865,277 |
b. Cash flow reconciliation
| Cash flow reconciliation | 2022-23 £000 | 2021-22 £000 |
|---|---|---|
| Capital payables and accruals at 1 April |
12,576 | 45,118 |
| Capital additions | 171,020 | 379,240 |
| Less: leased capital additions | (68,558) | (34,289) |
| Capital payables and accruals at 31 March |
(10,255) | (12,576) |
| Purchases of property, plant and equipment as per Statement of Cash Flows |
104,783 | 377,493 |
| Department | 96,792 | 373,359 |
| Arm’s length bodies | 7,991 | 4,134 |
| Total | 104,783 | 377,493 |
10. Intangible assets
| Intangible asset | Websites £000 | Purchased software licences £000 | Internally developed software £000 | Payments on assets under construction £000 | Total £000 |
|---|---|---|---|---|---|
| Cost or valuation: At 1 April 2022 |
39,516 | 162,479 | 780,047 | 59,669 | 1,041,711 |
| Cost or valuation: Additions |
89 | 20,367 | 2,616 | 99,364 | 122,436 |
| Cost or valuation: Disposals |
– | (10,182) | (54,735) | (2,263) | (67,180) |
| Cost or valuation: Impairments |
– | – | – | (4,596) | (4,596) |
| Cost or valuation: Reclassifications |
– | 227 | 50,585 | (48,494) | 2,318 |
| Cost or valuation: Revaluations |
2,391 | 3,903 | 48,549 | – | 54,843 |
| At 31 March 2023 | 41,996 | 176,794 | 827,062 | 103,680 | 1,149,532 |
| Amortisation: At 1 April 2022 |
39,363 | 115,733 | 455,866 | – | 610,962 |
| Amortisation: Charged in year |
124 | 28,346 | 61,505 | – | 89,975 |
| Amortisation: Disposals |
– | (10,182) | (54,675) | – | (64,857) |
| Amortisation: Revaluations |
2,390 | 2,605 | 25,152 | – | 30,147 |
| At 31 March 2023 | 41,877 | 136,502 | 487,848 | – | 666,227 |
| Carrying amount at 31 March 2023 | 119 | 40,292 | 339,214 | 103,680 | 483,305 |
| Carrying amount at 31 March 2022 | 153 | 46,746 | 324,181 | 59,669 | 430,749 |
| Department | – | 39,643 | 333,315 | 90,795 | 463,753 |
| Arm’s length bodies | 119 | 649 | 5,899 | 12,885 | 19,552 |
| Carrying amount at 31 March 2023 | 119 | 40,292 | 339,214 | 103,680 | 483,305 |
| Cost or valuation: At 1 April 2021 |
37,771 | 220,135 | 718,959 | 53,193 | 1,030,058 |
| Cost or valuation: Additions |
– | 15,305 | 371 | 62,262 | 77,938 |
| Cost or valuation: Disposals |
– | (72,969) | (29,412) | (121) | (102,502) |
| Cost or valuation: Impairments |
– | (107) | – | (1,817) | (1,924) |
| Cost or valuation: Reclassifications |
– | 3,268 | 52,739 | (53,848) | 2,159 |
| Cost or valuation: Revaluations |
1,745 | (3,153) | 37,390 | – | 35,982 |
| At 31 March 2022 | 39,516 | 162,479 | 780,047 | 59,669 | 1,041,711 |
| Amortisation: At 1 April 2021 |
37,448 | 164,982 | 409,600 | – | 612,030 |
| Amortisation: Charged in year |
170 | 26,274 | 56,911 | – | 83,355 |
| Amortisation: Disposals |
– | (72,952) | (29,365) | – | (102,317) |
| Amortisation: Reclassifications |
– | (288) | – | – | (288) |
| Amortisation: Revaluations |
1,745 | (2,283) | 18,720 | – | 18,182 |
| At 31 March 2022 | 39,363 | 115,733 | 455,866 | – | 610,962 |
| Carrying amount at 31 March 2022 | 153 | 46,746 | 324,181 | 59,669 | 430,749 |
| Carrying amount at 31 March 2021 | 323 | 55,153 | 309,359 | 53,193 | 418,028 |
| Department | – | 44,004 | 317,735 | 59,396 | 421,135 |
| Arm’s length bodies | 153 | 2,742 | 6,446 | 273 | 9,614 |
| Carrying amount at 31 March 2022 | 153 | 46,746 | 324,181 | 59,669 | 430,749 |
a. Intangible asset cash flow reconciliation
| Item | 2022-23 £000 | 2021-22 £000 |
|---|---|---|
| Capital payables and accruals at 1 April |
10,281 | 17,613 |
| Capital additions | 122,436 | 77,938 |
| Capital payables and accruals at 31 March |
(9,686) | (10,281) |
| Purchases of intangible assets as per Statement of Cash Flows |
123,031 | 85,270 |
| Department | 108,633 | 78,620 |
| Arm’s length bodies | 14,398 | 6,650 |
| Total | 123,031 | 85,270 |
11. Commitments under non-PFI leases
Leases
Total future minimum lease payments are given in the table below for each of the following periods.
| Obligations under lease | 31 March 2023: Core department £000 | 31 March 2023: Departmental group £000 | 31 March 2022: Core department £000 | 31 March 2022: Departmental group £000 |
|---|---|---|---|---|
| Buildings: Not later than 1 year |
193,168 | 199,269 | 7,965 | 8,112 |
| Buildings: Later than 1 year and not later than 5 years |
582,387 | 595,241 | 22,168 | 22,755 |
| Buildings: Later than 5 years |
334,371 | 348,896 | 16,397 | 22,010 |
| Total | 1,109,926 | 1,143,406 | 46,530 | 52,877 |
| Less interest element | (70,146) | (76,809) | (12,118) | (17,073) |
| Present value of obligations | 1,039,780 | 1,066,597 | 34,412 | 35,804 |
| Other: Not later than 1 year |
4,442 | 4,442 | 3,010 | 3,010 |
| Other: Later than 1 year and not later than 5 years |
6,770 | 6,770 | 1,337 | 1,337 |
| Other: Later than 5 years | – | – | – | – |
| Total | 11,212 | 11,212 | 4,347 | 4,347 |
| Less interest element | (72) | (72) | (201) | (201) |
| Present value of obligations | 11,140 | 11,140 | 4,146 | 4,146 |
The increase in the year is due to the implementation of IFRS 16 which has brought all leases on to the Statement of Financial Position. The prior year figures relate only to finance leases pre implementation of IFRS 16.
12. Cash and cash equivalents
| Cash and cash equivalents |
31 March 2023: Core department £000 | 31 March 2023: Departmental group £000 | 31 March 2022: Core department £000 | 31 March 2022: Departmental group £000 |
|---|---|---|---|---|
| Balances at 1 April | (1,093,666) | (1,092,564) | (2,807,019) | (2,790,623) |
| Net change in cash and cash equivalent balances |
(118,290) | (110,325) | 1,713,353 | 1,698,059 |
| Balances at 31 March | (1,211,956) | (1,202,889) | (1,093,666) | (1,092,564) |
| Cash and cash equivalents |
982,565 | 991,742 | 1,433,889 | 1,435,027 |
| Bank overdraft | (2,194,521) | (2,194,631) | (2,527,555) | (2,527,591) |
| Total | (1,211,956) | (1,202,889) | (1,093,666) | (1,092,564) |
The following balances were held at:
| Balances held | 31 March 2023: Core department £000 | 31 March 2023: Departmental group £000 | 31 March 2022: Core department £000 | 31 March 2022: Departmental group £000 | |
|---|---|---|---|---|---|
| Government Banking Services |
(1,211,991) | (1,212,101) | (1,093,842) | (1,093,010) | |
| Commercial banks and cash in hand |
35 | 9,212 | 176 | 446 | |
| Total | (1,211,956) | (1,202,889) | (1,093,666) | (1,092,564) |
The bank overdraft relates to cash-in-transit due to a timing difference between the payment being processed and the date that our customers are paid.
13. Trade receivables, financial and other assets
| Amounts falling due within 1 year |
Note | 31 March 2023: Core department £000 | 31 March 2023: Departmental group £000 | 31 March 2022: Core department £000 | 31 March 2022: Departmental group £000 | |
|---|---|---|---|---|---|---|
| Trade receivables | 276,056 | 302,694 | 204,524 | 233,594 | ||
| Benefit overpayments | 987,936 | 987,936 | 525,468 | 525,468 | ||
| Benefit advances | 654,291 | 654,291 | 635,189 | 635,189 | ||
| Housing Benefit subsidy | 385,184 | 385,184 | 576,717 | 576,717 | ||
| Prepayments and accrued income | 1,073,829 | 1,104,761 | 1,139,421 | 1,164,593 | ||
| Social Fund loans | 120,267 | 120,267 | 186,219 | 186,219 | ||
| Tax Credits | 367,487 | 367,487 | 650,551 | 650,551 | ||
| European Social Fund | 368,456 | 368,456 | 387,019 | 387,019 | ||
| Value Added Tax | 59,832 | 64,211 | 52,276 | 55,980 | ||
| CFERS receivable | 2,867 | 2,867 | 3,585 | 3,585 | ||
| Other receivables | 25,506 | 26,225 | 23,464 | 24,727 | ||
| Gross receivables | 4,321,711 | 4,384,379 | 4,384,433 | 4,443,642 | ||
| Less: impairment of receivables |
13a | (185,740) | (196,129) | (562,332) | (572,593) | |
| Net receivables | 4,135,971 | 4,188,250 | 3,822,101 | 3,871,049 |
| Amounts falling due after more than 1 year |
Note | 31 March 2023: Core department £000 | 31 March 2023: Departmental group £000 | 31 March 2022: Core department £000 | 31 March 2022: Departmental group £000 |
|---|---|---|---|---|---|
| Benefit overpayments | 3,434,171 | 3,434,171 | 3,067,505 | 3,067,505 | |
| Benefit advances | 815,425 | 815,425 | 684,653 | 684,653 | |
| Financial assets | 13b | 1,270,073 | 1,270,073 | 1,115,818 | 1,115,818 |
| Social Fund loans | 124,542 | 124,542 | 126,315 | 126,315 | |
| Tax Credits | 2,145,475 | 2,145,475 | 2,017,336 | 2,017,336 | |
| Prepayments and accrued income | – | 657 | – | 653 | |
| Other receivables | 135,329 | 136,836 5,103 7,019 | |||
| Gross receivables | 7,925,015 | 7,927,179 | 7,016,730 | 7,019,299 | |
| Less: impairment of receivables |
13a | (1,537,382) | (1,537,382) | (2,494,870) | (2,494,870) |
| Net receivables | 6,387,633 | 6,389,797 | 4,521,860 | 4,524,429 | |
| Total net receivables | 10,523,604 | 10,578,047 | 8,343,961 | 8,395,478 |
a. Impairment of receivables
| Impairment of receivables <1 year |
31 March 2023: Core department £000 | 31 March 2023: Departmental group £000 | 31 March 2022: Core department £000 | 31 March 2022: Departmental group £000 |
|---|---|---|---|---|
| Benefit overpayments | (130,365) | (130,365) | (153,228) | (153,228) |
| Tax Credits | (26,406) | (26,406) | (250,498) | (250,498) |
| Benefit advances | (4,084) | (4,084) | (104,888) | (104,888) |
| Social Fund | (8,712) | (8,712) | (33,665) | (33,665) |
| Other | (16,173) | (26,562) | (20,053) | (30,314) |
| Total | (185,740) | (196,129) | (562,332) | (572,593) |
| Impairment of receivables >1 year | 31 March 2023: Core department £000 | 31 March 2023: Departmental group £000 | 31 March 2022: Core department £000 | 31 March 2022: Departmental group £000 |
|---|---|---|---|---|
| Benefit overpayments | (870,974) | (870,974) | (1,388,051) | (1,388,051) |
| Tax Credits | (490,023) | (490,023) | (894,309) | (894,309) |
| Benefit advances | (104,971) | (104,971) | (172,279) | (172,279) |
| Social Fund | (44,967) | (44,967) | (16,843) | (16,843) |
| Other | (26,447) | (26,447) | (23,388) | (23,388) |
| Total | (1,537,382) | (1,537,382) | (2,494,870) | (2,494,870) |
Following a detailed review of the Department’s debt collection performance, including the development of additional data sources to understand trends in debts and recoveries, the approach to calculate debt impairment has been updated. We consider this a change in accounting estimate under IAS 8 as we have updated our measurement approach to reflect our experience recovering a developing portfolio of debts, using the newly developed information sources. There has been a reduction in our impairment of receivables since last year as a result of this more detailed modelling.
For the most significant benefit related financial instruments (Benefit overpayments, Benefit advances and Tax Credits) the following table provides a reconciliation of the movements in the impairment balance in the period.
Movement in impairment caused by:
| Movement in impairment cause | Benefit overpayments (excluding Universal Credit) £000 |
Benefit overpayment – Universal Credit £000 | Benefit advances £000 | Tax Credit £000 | Total Benefit Overpayments, Advances and Tax Credit £000 |
|---|---|---|---|---|---|
| Impairment at 31 March 2022 | (826,554) | (714,724) | (277,167) | (1,144,808) | (2,963,253) |
| Impairment of debts recognised in 2022-23 |
(167,072) | (674,602) | (203,513) | (109,514) | (1,154,701) |
| Debts written off in 2022-23, no longer requiring impairment |
96,094 | 4,897 | 876 | 4,785 | 106,652 |
| Reduction in the gross balance requiring impairment from debt recoveries and other movements in 2022-23 |
106,090 | 180,109 | 172,872 | 164,058 | 623,129 |
| Changes in the impairment methodology* |
7,771 | 1,073,650 | 236,244 | 636,730 | 1,954,395 |
| Change in the Discount Rate | (15,383) | (71,615) | (38,367) | (67,680) | (193,045) |
| Impairment at 31 March 2023 | (799,054) | (202,285) | (109,055) | (516,429) | (1,626,823) |
*Impact of changes made further explained below.
The model to calculate impairment has been updated to improve estimates which relate to Tax Credits migrated from HM Revenue and Customs and new style benefits such as Universal Credit and Benefit advances for which the historical data is limited. To support continuing compliance with IFRS 9 in the context of rising gross debt balances, the Department has developed new sources of data to inform a more detailed modelling approach to expected credit losses.
The Department continues to:
- review historic rates of debt recovery and write-off to estimate future Expected Credit Loss
- apply a discount rate provided by HM Treasury to future recoveries
- group debts by benefit and age within the model
- annually consider forward-looking events in determining Expected Credit Loss
The potential impact of wider economic and social factors on future recoveries is assessed by exploring the relationship between recoveries and the following indicators: inflation, interest rates, unemployment rate, and mortality rate. Analysis undertaken in March 2023 found no statistically significant relationships. Based on the latest analysis, we are satisfied that historic rates provide the most reliable estimate for future impairment.
The revised methodology includes a number of changes, we’ve assessed the impact of the 3 most significant changes in the table below:
| Change | Previous Methodology | New Methodology | Reason for change | Impact on Impairment calculation |
|---|---|---|---|---|
| Inclusion of UC Overpayments within the updated approach. |
In 2021-22 we identified UC overpayments were being over-impaired, as available data only included 8 years of recoveries. To address this in 2021-22 we calculated impairment based on average recoveries from debtor level records, assumed to be constant for the 15-year asset life and applied this to the gross balance. | Uses all information available to identify: * the period of reliable historic data for each benefit and fully incorporates this into the forecast * makes evidenced assumptions to identify appropriate rates where information is not available to cover the assumed asset life |
The Department’s new methodology ensures that all relevant and reliable data available is used to provide a longer time series of data. | £956m lower impairment |
| Inclusion of Tax Credit Overpayments within the updated approach. | A weighted average impairment rate for our existing voted benefit overpayment stock was used as only 5 years data was available on the performance of Tax Credit debts transferred from HM Revenue and Customs. | Uses all information available to identify: * the period of reliable historic data for each benefit and fully incorporates this into the forecast * makes evidenced assumptions to identify appropriate rates where information is not available to cover the assumed asset life |
The Department’s new methodology ensures that all relevant and reliable data available is used to provide a longer time series of data. | £426m lower impairment |
| Inclusion of Benefit Advances within the updated approach. | As for UC Overpayments the impairment of Benefit Advances was calculated based on average recoveries from debtor level records, assumed to be constant for the 15-year asset life and applied to the gross balance. | Uses all information available to identify: * the period of reliable historic data for each benefit and fully incorporates this into the forecast * makes evidenced assumptions to identify appropriate rates where information is not available to cover the assumed asset life |
The Department’s new methodology ensures that all relevant and reliable data available is used to provide a longer time series of data. | £179m lower impairment |
| Increase in the period of data reviewed in the model. | The previous 12 months only | 5 years | Increasing the time-series of data allows the Department to approximate a percentage recovery rate rather than assuming recovery will be consistent to previous 12 months performance, this reduces volatility and uncertainty. | £234m lower impairment |
| Increase in the length of the assumed asset life. | 15 years | 20 years | Analytical evidence based on historic debt performance suggests 20 years to be a reasonable time period where the balance of a debt is assumed to have no credit value. | £169m lower impairment |
As explained in the table £1.6bn of the changes relate to updating the methodology to better predict impairment for benefits with a limited time-series of data available. Whilst the new methodology does provide further clarity, an element of uncertainty still exists due to the age of the benefits as we have between 5 and 9 years of data out of a forecast asset life of 20 years, and the future performance of these debts remains ambiguous. We expect this uncertainty to reduce over time as more data on debt trends is available.
b) Financial assets
Our financial assets of £1.2 billion consist of loans to organisations within our departmental family and Support for Mortgage Interest loans.
National Employment Savings Trust Corporation (NEST).
This loan provides ongoing funding to NEST Corporation for the administration and operation of the NEST pension scheme. The scheme’s income and assets under management continue to grow, as scheme membership increases, and will eventually be sufficient to fund NEST Corporation’s ongoing costs and repay the loan. We loaned a further £138 million to NEST during the year (2021-22: £110 million), bringing the total loan balance to £1.132 billion (2021-22: £994 million). The loan is expected to be fully repaid by January 2038.
Office for Nuclear Regulation (ONR)
We’ve provided the ONR with a working capital loan and a short-term loan facility to provide them with adequate working capital to discharge their statutory obligations. The amount outstanding is £11.4 million (2021-22: £11.2 million).
Support for Mortgage Interest (SMI)
The value of SMI loans now stands at £126.6 million (2021-22: £110.6 million).
14. Trade payables and other liabilities
| Amounts falling due within 1 year | Note | 31 March 2023: Core department £000 | 31 March 2023: Departmental group £000 | 31 March 2022: Core department £000 | 31 March 2022: Departmental group £000 |
|---|---|---|---|---|---|
| Taxation and social security | 55,851 | 61,308 | 59,162 | 63,590 | |
| Superannuation | 61,665 | 66,814 | 63,690 | 68,010 | |
| Trade payables | 205,181 | 224,108 | 209,019 | 218,037 | |
| Accruals and deferred income | 6,925,181 | 6,976,720 | 6,178,666 | 6,230,370 | |
| Capital payables and accruals | 9,10 | 12,851 | 15,181 | 18,306 | 22,209 |
| Bank overdrafts | 12 | 2,194,521 | 2,194,631 | 2,527,555 | 2,527,591 |
| Imputed finance lease element of on-Statement of Financial Position PFI contracts |
– | 3,685 | – | 3,386 | |
| Lease obligations | 185,040 | 189,961 | 8,280 | 8,282 | |
| CFERs due to be paid to the Consolidated Fund – Received |
6,013 | 6,013 | 21,923 | 21,923 | |
| CFERs due to be paid to the Consolidated Fund – Receivable | 2,867 | 2,867 | 3,585 | 3,585 | |
| Amounts issued from the Consolidated Fund for supply but not spent at year end |
33,427 | 33,427 | 661,918 | 661,918 | |
| Third-party payments | 43,202 | 43,202 | 47,976 | 47,976 | |
| European Social Fund | 61,307 | 61,307 | 139,347 | 139,347 | |
| Other payables | 92,346 | 92,668 | 88,289 | 88,346 | |
| Total | 9,879,452 | 9,971,892 | 10,027,716 | 10,104,570 |
| Amounts falling due after more than 1 year | Note | 31 March 2023: Core department £000 | 31 March 2023: Departmental group £000 | 31 March 2022: Core department £000 | 31 March 2022: Departmental group £000 |
|---|---|---|---|---|---|
| Imputed finance lease element of on-Statement of Financial Position PFI contracts |
– | 71,058 | – | 74,743 | |
| Lease obligations | 865,880 | 887,776 | 62,565 | 63,955 | |
| European Social Fund | 172,269 | 172,269 | 89,335 | 89,335 | |
| Accruals and Deferred Income | 1,845 | 1,845 | 18,054 | 18,054 | |
| Capital Accruals | 9,10 | 4,760 | 4,760 | 398 | 648 |
| Total | 1,044,754 | 1,137,708 | 170,352 | 246,735 | |
| Total payables | 10,924,206 | 11,109,600 | 10,198,068 | 10,351,305 |
15. Financial instruments
Our financial instruments include loans and receivables.
| Financial assets | Note | 31 March 2023: Core department £000 | 31 March 2023: Departmental group £000 | 31 March 2022: Core department £000 | 31 March 2022: Departmental group £000 |
|---|---|---|---|---|---|
| Loans and investments | 1,270,073 | 1,270,073 | 1,115,818 | 1,115,818 | |
| Benefit advances | 13 | 1,469,716 | 1,469,716 | 1,319,842 | 1,319,842 |
| Other receivables | 296,568 | 323,668 | 223,764 | 253,308 | |
| Cash and cash equivalents | 12 | 982,565 | 991,742 | 1,433,889 | 1,435,027 |
| Housing Benefit subsidy | 13 | 385,184 | 385,184 | 576,717 | 576,717 |
| Benefit overpayments | 13 | 4,422,107 | 4,422,107 | 3,592,973 | 3,592,973 |
| Tax Credits | 13 | 2,512,962 | 2,512,962 | 2,667,887 | 2,667,887 |
| Social Fund loans | 13 | 244,809 | 244,809 | 312,534 | 312,534 |
| European Social Fund | 13 | 368,456 | 368,456 | 387,019 | 387,019 |
| Total | 11,952,440 | 11,988,717 | 11,630,443 | 11,661,125 | |
| Less: impairment of financial instruments | (1,723,122) | (1,733,511) | (3,057,202) | (3,067,463) | |
| Total | 10,229,318 | 10,255,206 | 8,573,241 | 8,593,662 |
| Financial liabilities | Note | 31 March 2023: Core department £000 | 31 March 2023: Departmental group £000 | 31 March 2022: Core department £000 | 31 March 2022: Departmental group £000 |
|---|---|---|---|---|---|
| Other payables | 8,194,133 | 8,293,747 | 6,450,869 | 6,516,886 | |
| Bank overdraft | 12 | 2,194,521 | 2,194,631 | 2,527,555 | 2,527,591 |
| European Social Fund | 14 | 233,576 | 233,576 | 228,682 | 228,682 |
| Total | 10,622,230 | 10,721,954 | 9,207,106 | 9,273,159 |
Fair value
The carrying value of trade receivables and payables less impairment is assumed to approximate their fair value. The book values of our financial assets and liabilities at 31 March 2023 aren’t materially different from their fair values, so we haven’t shown them separately.
Exposure to risks
There are no material liquidity, market and credit risks associated with our financial instruments.
16. Provisions for liabilities and charges
| Provision | Note | 31 March 2023: Core department £000 | 31 March 2023: Departmental group £000 | 31 March 2022: Core department £000 | 31 March 2022: Departmental group £000 |
|---|---|---|---|---|---|
| Financial Assistance Scheme (FAS) provision |
16a | 4,349,512 | 4,349,512 | 6,254,247 | 6,254,247 |
| Benefit provisions | 16b | 1,163,536 | 1,163,536 | 952,298 | 952,298 |
| State Pension | 16c | 835,039 | 835,039 | 1,349,073 | 1,349,073 |
| Home Responsibilities Protection (HRP) | 16d | 1,043,245 | 1,043,245 | – | – |
| Other provisions | 16e | 55,930 | 57,136 | 30,112 | 31,207 |
| Total | 7,447,262 | 7,448,468 | 8,585,730 | 8,586,825 |
Analysis by type
a. FAS provision
| FAS provision (a) | 31 March 2023: Core department £000 | 31 March 2023: Departmental group £000 | 31 March 2022: Core department £000 | 31 March 2022: Departmental group £000 |
|---|---|---|---|---|
| Balance at 1 April | 6,254,247 | 6,254,247 | 5,552,226 | 5,552,226 |
| Provided in year | 44,477 | 44,477 | 157,996 | 157,996 |
| Provisions not required written back |
– | – | (6,149) | (6,149) |
| Change in discount rate | (1,764,581) | (1,764,581) | 687,030 | 687,030 |
| Utilised in year | (240,740) | (240,740) | (242,510) | (242,510) |
| Borrowing costs (unwinding of discount) |
56,109 | 56,109 | 105,654 | 105,654 |
| Balance at 31 March | 4,349,512 | 4,349,512 | 6,254,247 | 6,254,247 |
Financial Assistance Scheme (FAS) provides assistance to members of defined benefit occupational pension schemes that were wound up under-funded when their employers became insolvent during the period 1 January 1997 to 5 April 2005.
The FAS provision is to provide for the liabilities arising from any qualifying schemes once the assets from such schemes have transferred to government. The provision is an estimate of the current value of the liability to make payments to pensioners under the FAS scheme.
The provision is calculated by using a long-term cash forecast model provided by Pension Protection Fund (PPF) who manage the administration of FAS. The cash flows are then discounted, at rates provided by HM Treasury, to give their present value at the year end.
The FAS assets, which are not recognised in the DWP balance sheet, are mostly held as annuities. The income streams from these are generally not affected by any market volatility arising as a result of COVID-19, although the present value placed on them will depend on the discount rate, which could be impacted. The income streams, and therefore the present value, will also be impacted by the mortality experienced by the members the annuities relate to, which may be impacted by COVID-19. However, the total value of the assets is small compared to the FAS liability, and any fluctuation in asset value smaller still, and so the impact of COVID-19 on the assets is expected to be immaterial.
Due to the long-term nature of the liabilities and the assumptions on which the estimate of the provision is based, which could potentially be impacted by the wider economic effects of COVID-19, some uncertainty about the value of the liability remains. Some illustrative narrative indicating the nature of such potential impacts is included below in the sensitivities section.
Movement in provision from prior year (2021-22)
Movement from prior year of £1.8 billion (reduction) due to increased discount rates as issued by HM Treasury. The discount rates for 2022 were 0.47% (short term), 0.70% (medium term), 0.95% (long term) and 0.66% (very long term), whereas the discount rates for 2023 are 3.27% (short term), 3.20% (medium term), 3.51% (long term) and 3.00% (very long term).
Sensitivities for 2022-23
The FAS provision is long-term and is therefore more sensitive to changes in economic and demographic conditions.
The table below sets out a sensitivity analysis for the most significant assumptions used to estimate the FAS provision. It illustrates the potential impact of changes in assumptions on the value of the provision.
| FAS provision | Original £bn | Discount rate £bn | Mortality rate £bn | Pension payments £bn | Deferred pension revaluation rate £bn |
|---|---|---|---|---|---|
| Assumption | – | 0.5% decrease | 10% increase p.a. | 0.5% increase p.a. | 0.5% increase p.a. |
| Provision as at 31 March 2023 | 4,350 | 4,626 | 4,227 | 4,427 | 4,408 |
| Increase/(decrease) in provision | 276 | (122) | 77 | 59 | |
| Percentage change | 6.35% | (2.80%) | 1.77% | 1.36% |
Original – this is the actual FAS provision which has been posted into our accounts and is used as the “baseline” position for the other scenarios. Discount rate decrease – the assumption in this scenario is that assuming the cash flows remain the same and only the discount rates (as advised by HM Treasury) decreased by 0.5%, then the impact would create an increase in the provision of £276 million (6%).
Mortality increase – the assumption in this scenario is that there is a 10% increase to the mortality of pensioners after allowing for projected mortality improvements, rather than applying the 10% increase to the current mortality rate. This has the impact of reducing the amount of cash flows as pensioner numbers reduce – the 10% reduction having a £122 million (3%) reduction in the provision.
Pension increase – the assumption is the pensions will increase by 0.5% per annum for all future years where the actual rates are not yet known. Where the actual rates are known then these actual rates have been used. This has the impact of increasing the amount of cash flows – having a £77 million (2%) increase in the provision.
Deferred revaluation increase – the assumption is that there is a change to the revaluation rate in deferment of people’s pensions and this will increase by 0.5% per annum for all future years where the actual rates are not yet known. Where the actual rates are known then these actual rates have been used. This has the impact of increasing the amount of cash flows – having a £59 million (1%) increase in the provision.
There are other assumptions included in the cash flows which are not considered to be significant. These include the age difference between male and female survivors, the proportion that are married and ill health decrements.
Legal Cases – there have been a number of legal challenges to pension entitlements in recent years. Where relevant to the FAS, these are reflected in the assumptions which underpin the cash flow. This includes allowances for judgements made in the ‘Hampshire’, ‘Hughes’ and ‘Bauer’ cases.
In September 2018 the Court of Justice of the European Union (CJEU) ruled in the case of Hampshire v PPF that, in the event of employer insolvency, individual members should receive at least 50% of the value of their accrued old age pension in their former scheme (the ‘Hampshire judgement’). Work has been carried out in recent years to implement this judgement, including uplifting FAS assistance amounts for some of the affected FAS members.
In June 2020 the Administrative Court ruled in the case of Hughes v PPF that in calculating the minimum 50% value the PPF needs to make sure that over the course of their lifetime each member, and separately each survivor, receives at least 50% on a cumulative basis of the actual value of the benefits that their scheme would have provided (the ‘Hughes judgement’).
The PPF appealed several aspects of the Hughes judgement. The appeal hearing took place in May 2021, and the result of the appeal was announced in July 2021. The Court of Appeal supported PPF’s approach for increasing payments to members following the 2018 European Court of Justice judgement in the Hampshire case. Therefore, we’ve allowed for the expected impact of the Hampshire judgement (without the additional requirements from the Hughes judgement) which reflects our understanding of the conclusions of the judgements.
For the purposes of this Annual Report and Accounts, the FAS liabilities shown here include a loading (i.e. an addition to the liabilities) of 0.1% for in-payment members, and a loading of 0.3% for not yet in payment members, which reflect a very approximate aggregate allowance for the impact of the Hampshire judgement. This allowance will be refined in future, as members’ assistance is assessed and, where required, increased for the impact of the Hampshire judgement. For some members this has already taken place and for the remainder this is expected to be carried out in 2023 and 2024. Arrears may also be payable to members who are entitled to an increase to their assistance in respect of the Hampshire judgment. Around £11 million of arrears were paid in the year to 31 March 2022. A further £5 million of arrears was paid in the year to 31 March 2023 and there may be further arrears payable in 2023 and 2024. These are not included in the projected cashflows.
As part of the Hughes judgement, it was also judged that the PPF compensation cap, in its current form, is age discriminatory and should be removed. DWP appealed this element of the judgement, but the appeal was unsuccessful and the PPF compensation cap now must be removed. Our understanding is that the judgement does not directly relate to the FAS cap, so the FAS cap remains in force. However, this should be kept under review for future exercises.
In December 2019 the CJEU ruled in the case of Bauer that a reduction in the amount of occupational old age pension benefits paid to a member on account of his or her employer’s insolvency is manifestly disproportionate where, as a result of the reduction, the member is living below the at-risk-of-poverty threshold determined by Eurostat.
DWP is in the process of assessing the various options for implementation of this judgement. For the purposes of this Annual Report and Accounts, the FAS liabilities shown here include a loading of 0.8% for in-payment members, and a loading of 1.7% for not yet in payment members, which reflect a very approximate allowance for the Bauer judgement. It is not possible to calculate an accurate allowance at this time.
‘Shape’ of the additional liabilities for Hampshire and Bauer judgements
For simplicity, it is assumed that the loadings for Hampshire and Bauer (for in-payment and not-in-payment members) apply evenly each year. This is as intended in terms of the approximate impact on the overall liability. However, this is a simplification in terms of the ‘shape’ of the individual cashflows. In reality, the impact would be larger in some years than others. We would not expect this limitation to have a material impact on the final liability figures, but it may mean the later years cashflow projections are understated, with earlier year projections overstated. This may also be particularly marked for the 2023-24 year, as implementation will take time while PPF cash flow projections assume they are applied immediately.
Assessment of COVID-19 Impact
Whilst there are a number of assumptions that underpin the estimate of the liability, we’ve considered the 3 most significant of these assumptions, and how they could be impacted by COVID-19.
Discount rate – a change to the discount rate would have an impact on the liability value. Discount rates are linked to long-term future interest rates, a change to the discount rate would have an impact on the liability value. Discount rates are linked to long-term future interest rates. As required by the FReM, we use interest rates set by HM Treasury to discount the liability. The discount rates for general provisions increased for 2023.
Inflation rate – the inflation rate assumptions used are in line with those recommended by the Government Actuary’s Department (GAD) as agreed in January 2023 with PPF and DWP. This includes changes to RPI (Retail Price Index) which will now be aligned to CPIH (Consumer Prices Index Including Owner Occupiers’ Housing Costs) from 2030 onward. This should not have a material impact on the FAS liabilities as we set CPI (Consumer Price Inflation) linked increases based on market implied CPI forecasts and these won’t change but will affect the assumption for the indexation of annuities. The long-term assumption for CPIH, and therefore RPI from 2030, is set at 0.1% per annum above the long-term CPI assumption. A change to future inflation rate assumptions would have an impact on future compensation increases and therefore on the value of liabilities, but it is too early at this stage to quantify this. Changes in inflation rates do not have a uniform impact on the liability as some payments are flat-rate and others are capped. With reference to the sensitivity analysis above, we do not consider it likely that inflation rates will move to such an extent that it would have a material impact on the valuation of the provision.
Mortality rate – it is not expected that mortality arising from COVID-19 in the short-term will have a significant impact on the valuation of the liability. Updated membership data has been used for this year’s valuation, taken as at 30 November 2022 - this will directly take into account actual mortality over the pandemic period to that date.
Of far greater material significance are the assumptions used for future mortality as these will have a far larger impact on the liabilities, given the long-term nature of the liabilities.
There is currently insufficient mortality experience from FAS pensioners to analyse with any credibility. Therefore, GAD have continued to advise to use “baseline” mortality assumptions, whilst continuing to monitor the situation for sufficient mortality experience. GAD further advise that the COVID-19 pandemic has drawn focus on short-term impacts to life expectancy, excess deaths and mortality in general. The longevity assumption is a long-term assumption, and therefore it would not be appropriate to adjust the assumption at this time before the full impact of the pandemic on mortality is clearer. It is however possible that a material adjustment may be required in the future.
b. Benefit provisions
| Benefit provisions (b) | 31 March 2023: Core department £000 | 31 March 2023: Departmental group £000 | 31 March 2022: Core department £000 | 31 March 2022: Departmental group £000 |
|---|---|---|---|---|
| Balance at 1 April | 952,298 | 952,298 | 968,388 | 968,388 |
| Provided in year | 498,933 | 498,933 | 655,157 | 655,157 |
| Provisions not required written back | (560) | (560) | (506,299) | (506,299) |
| Utilised in year | (289,114) | (289,114) | (164,886) | (164,886) |
| Borrowing costs (unwinding of discount) |
1,979 | 1,979 | (62) | (62) |
| Balance at 31 March | 1,163,536 | 1,163,536 | 952,298 | 952,298 |
These provisions arise from liabilities relating to benefit payments. These liabilities are in respect of:
Legal cases
In the course of administering a complex benefit system across Great Britain it is inevitable that the Department will face legal challenge, which may result in liabilities. Where future economic outflow is probable, but the final verdict has not been heard, we’ve estimated a provision. In order to avoid prejudicing continuing legal matters, separate disclosure is not provided. In aggregate we consider £157 million to be our best estimate.
Legal Entitlement and Administrative Practice (LEAP) Exercises
We’re continuously learning and improving but from time to time, the Department becomes aware of situations where we’ve not paid our customers the right amount of money. This could be because of an official error or as a result of a court ruling which widens benefit entitlement. In these circumstances it is necessary to conduct a LEAP exercise to correct customer underpayments. To avoid legal prejudice, we’ve not disclosed further details. In aggregate we consider £1,007 million to be our best estimate.
Benefit provisions are estimated using detailed forecasting data and established methodology.
This section excludes our provision for State Pension underpayments which, although a benefit provision, merits separate disclosures in Note 16c and Note 16d due to its materiality and likely interest to readers of the accounts.
c. State Pension Underpayment provision
| State Pension Underpayment provision (c) |
31 March 2023: Core department £000 | 31 March 2023: Departmental group £000 | 31 March 2022: Core department £000 | 31 March 2022: Departmental group £000 |
|---|---|---|---|---|
| Balance at 1 April | 1,349,073 | 1,349,073 | 1,033,632 | 1,033,632 |
| Provided in year | 138,767 | 138,767 | 495,138 | 495,138 |
| Provisions not required written back | (439,106) | (439,106) | (89,635) | (89,635) |
| Utilised in year | (218,230) | (218,230) | (89,917) | (89,917) |
| Borrowing costs (unwinding of discount) |
4,535 | 4,535 | (145) | (145) |
| Balance at 31 March | 835,039 | 835,039 | 1,349,073 | 1,349,073 |
Background
The Department commenced a formal Legal Entitlement and Administrative Practice (LEAP) exercise in January 2021 to address State Pension cases where people were being underpaid – specifically some people married or in a civil partnership (Category BL), widows (Missed Conversions) and people aged 80 years and over (Category D). Correcting these underpayments remains a key priority for the Department.
As with any LEAP exercise, the estimates contain significant uncertainty and will continue to be refined as further information becomes available, with the final value of underpayments only being confirmed once the LEAP exercise has been completed.
Value and volume estimate
We expect to review around 680,000 cases of which we estimate 170,000 cases have been underpaid. This reduction in our estimate from 237,000 last year, is the net effect of a combination of factors:
1. The lower Missed Conversion rate of underpayment from the structured sampling exercise reducing the estimate of cases underpaid.
2. The decision to conduct further spouse tracing for CAT BL and Missed Conversion increasing the estimate of cases we will correct In the last year, the Department has paid out £218 million in arrears.
Table 1 - Value and volume estimates for each underpayment group
| Underpayment group | Value of Provision of Unpaid Arrears as at 31 March 2023 £m |
Remaining volume of customers affected as at 31 March 2023 000’s |
Value of Provision of Unpaid Arrears as at 31 March 2022 £m |
Remaining volume of customers affected as at 31 March 2022 000’s |
|---|---|---|---|---|
| Cat BL | 303 | 40 | 275 | 51 |
| Missed Conversions | 505 | 54 | 1,024 | 137 |
| Cat D | 27 | 21 | 50 | 34 |
| Total | 835 | 115 | 1,349 | 221 |
Totals may not sum due to rounding
In total the Department estimates it underpaid £1.17 billion to 170,000 pensioners. Last year the Department estimated it underpaid £1.46 billion to 237,000 pensioners.
Arrears values reported are net of any abatement of overpaid benefits.
Methodology and data
The Department now has a complete set of Pension Strategy Computer System (PSCS) scans and samples for each of the 3 categories. The methodological approaches are similar for each of the estimates, these are explained throughout this note and includes details where significant levels of uncertainty exist.
The extrapolation of a sample to a whole population is subject to statistical uncertainty, with a confidence interval around the central estimate. Where a cohort is close to completion, the sample data has been supplemented with actual data from the cases being worked through the ongoing LEAP exercise.
The arrears value is adjusted for the expected timing of clearances, so that the final value accounts for any additional arrears which may accrue up to the point of correction.
CAT BL
The Department has started a tracing exercise to try and identify the spouse records for approximately 160,000 cases where insufficient spouse information was available on our systems to determine if there was an underpayment.
The provision has been updated to assume a central estimate that 45% of customers will respond to the tracing letter with the required information. This assumption is based on a literature review of findings from over 400 social research studies[footnote 67] . Due to the complexity of international cases, we expect the response rate is likely to be lower at a rate half that of GB, 22.25%.
The estimate assumes that the Department will continue the further spouse tracing for the remaining cases. The success of this spouse tracing exercise remains a significant uncertainty.
Missed Conversions
The Department has conducted a sample of 1,500 cases from the Missed Conversions PSCS scan. Only those cases determined to be in-scope of review are used as inputs to the provision. It was run between April 2022 and September 2022. This has resulted in a reduced provision due to a lower rate of underpayment observed in the sample compared to estimates last year.
Rate of underpayment
The Missed Conversion sample showed an underpayment rate of 13.4% for GB customers and 2.8% for international (IG) customers. Last year the underpayment rate was based on the limited outcomes from the exercise to date (up to the end of March 22), in which 33% of GB cases were underpaid and 42% of IG cases.
Spouse tracing success
As part of the sample, in 96% of cases the Department was able to reach a conclusion on entitlement using data available from internal systems. This is higher than the CAT BL success rate of 63%, assumed last year. The provision for MC assumes the same response rate to the further spouse tracing exercise as CAT BL, described above.
No liability is included for customers where the Department does not hold sufficient information after attempting to trace the spouse.
CAT D
The estimate for CAT D has not changed significantly since last year. The experience and outputs from the live running of the exercise has been included in the estimates.
Uncertainties and Sensitivity Analysis
To conduct the sensitivity analysis, we have developed a Monte Carlo simulation to estimate the range of possible arrears due. The outputs of the Monte Carlo are sensitive to the chosen low and high assumptions.
Our central assumptions are based on the best available evidence. As well as spouse tracing and the rate of underpayment the key assumptions are the Traceability of Next of Kin and the Mortality rate.
Traceability of Next of Kin: Where an underpaid customer is deceased, we will seek to pay arrears to the deceased’s next of kin. We cannot always locate a next of kin, so we have used information from 2 previous LEAP correction exercises to estimate the percentage of deceased cases where we expect to be able to trace next of kin.
Mortality: Our mortality estimates are primarily from analysis of the State Pension admin data. The key assumptions used within that simulation are shown in Table 2 and the results in Table 3.
Table 2: Sensitivity analysis assumptions
| Provision | Uncertainty | Low | Central | High |
|---|---|---|---|---|
| CAT BL | Traceability of Next of Kin | 60% | 75% | 90% |
| MC | 23% | 57% | 92% | |
| CAT D | 23% | 57% | 92% | |
| All | Mortality | 67% | 100% | 133% |
| All | Rate of underpayment | 85% | 100% | 115% |
| All | Average arrears | 85% | 100% | 115% |
| MC | Spouse tracing | 61% | 96% | 100% |
| GB: BL & MC | Spouse letter response | 9% | 45% | 86% |
| IG: BL & MC | Spouse letter response | 4.5% | 23% | 43% |
The assumptions that have the greatest impact on the forecast are the rate of underpayment, average arrears and the further spouse tracing letter response rate.
The department estimates that for Missed Conversions 192,000 customers will be reviewed that need spouse information to be traced. If the Department were to be as successful as the high estimate for the initial spouse tracing activity, we estimate 200,000 customers would be reviewed, for the low that is 122,000.
If the rate of underpayment for all 3 categories were to be the high estimate, we estimate 187,000 customers were underpaid. If the low estimate were true, 145,000 customers were underpaid.
Results
Table 3: Sensitivity analysis results – estimate of total arrears
| Sensitivity Analysis | Low | Central | High | Min | Max |
|---|---|---|---|---|---|
| CAT BL | £376m | £468m | £551m | £256m | £678m |
| MC | £526m | £634m | £714m | £404m | £810m |
| CAT D | £55m | £67m | £81m | £51m | £95m |
The low and high estimates show the range within which we can be 95% confident the final value will fall between, given the assumptions we have made about reasonable low and high outturns.
The min and max estimates are if all the assumptions are equal to their minimum and maximum value at the same time, respectively.
Accumulating these figures across categories does not provide a statistically accurate sensitivity range for the entire exercise.
d. Home Responsibilities Protection provision
| Home Responsibilities Protection (d) |
31 March 2023: Core department £000 | 31 March 2023: Departmental group £000 | 31 March 2022: Core Department £000 | 31 March 2022: Departmental group £000 | |
| – | – | – | – | – | |
| Balance at 1 April | – | – | – | – | |
| Provided in year | 1,043,245 | 1,043,245 | – | – | |
| Provisions not required written back | – | – | – | – | |
| Utilised in year | – | – | – | – | |
| Borrowing costs (unwinding of discount) | – | – | – | – | |
| Balance at 31 March | 1,043,245 | 1,043,245 | – | – |
Missing Home Responsibilities Protection (HRP) Provision
Home Responsibilities Protection (HRP) was available between 1978 and 2010 for people in receipt of Child Benefit and those caring for sick and disabled people.
The value of the provision reflects our current estimate of the amount that will be paid out to correct State Pension underpayments due to missing HRP. The HRP underpayment exercise is complex, requiring first HM Revenue and Customs to correct the National Insurance records and then DWP to correct State Pension entitlement. This estimate is subject to significant uncertainty which will continue to be refined as further information becomes available, with the final value of underpayments only being confirmed once the exercise has been completed.
Table 2 below sets out the impact of the key sensitivities to the estimated value of the provision. The final value of the missing HRP provision could range from £310 million to £1,530 million. This range is driven by uncertainty surrounding the value of underpayments and the volume of cases that will be corrected.
Value and Volume Estimates
Our current central estimate of underpayments is £1,043 million, with around 187,000 cases who may have an underpayment of State Pension and for whom we expect to correct. Table 1 below shows the split of the overall provision relating to each group and our estimate of the number of individuals at 31 March 2023 who may be affected and which may result in an underpayment being identified.
Table 1 – Volume and value estimates for each underpayment group 31 March 2023
| Underpayment group | Number of State Pension customers affected 000’s |
Value of provision of unpaid arrears £m |
|---|---|---|
| Alive | 144 | 914 |
| Deceased | 43 | 129 |
| Total | 187 | 1,043 |
Totals may not sum due to rounding.
When calculating arrears owed in State Pension, the case is reviewed to identify where an individual may have been overpaid any other benefit. Arrears values reported are therefore net of overpaid Pension Credit.
Methodology and Data
To estimate the provision, different groups potentially affected by missing HRP were identified, and the impact for each group was separately assessed. The methodological approaches used to calculate provision values for each group are explained in detail in the next sections. This includes details of where significant levels of uncertainty exist. We are still working to identify gaps in our estimates; however, we would expect any revisions due to additional groups[footnote 68] being affected to be small.
We have estimated the value of this provision using the best available data[footnote 69] held by the Department and HM Revenue and Customs. The arrears value is adjusted to account for any additional arrears which may accrue up to the point of correction. We have used evidence gathered during the investigation stage[footnote 70] and while clearing actual cases identified during the investigation. Where limited or no evidence is available, we have used logic-based assumptions agreed via an expert governance group.
Live Cases
To estimate the liability, we have calculated the potential volumes of people impacted who are alive above State Pension age using the error rate identified by the 2021-22 DWP Fraud & Error exercise[footnote 71]. Applying this error rate to the State Pension population at the start of the 2022-23 financial year gives a central estimate of volume for live cases above State Pension age of 150,000. The 95% confidence interval around this central estimate gives us a large range of 90,000 to 240,000 potentially affected cases.
Child Benefit records would be the most direct way of identifying individuals missing HRP. There are however no records of Child Benefit claims for this period, so individuals affected will need to apply to HM Revenue and Customs for corrections to be made to their National Insurance record. We do not currently have any evidence to estimate the success rate in identifying and contacting those impacted and obtaining the necessary application. Evidence will become available throughout the correction activity. At this stage we have assumed we will be successful in paying arrears due to 90% of customers who are alive. Applying this take up assumption to the central estimate of scale volume of 150,000 gives an estimate of 136,000 live individuals to be paid arrears. The lack of evidence surrounding the take up assumption is a significant driver of uncertainty in the estimates; the sensitivity analysis section explores how applying different take up assumptions affects the arrears estimate.
We also include an estimate of people affected reaching State Pension age in the 2022-23 financial year, an additional 8,000, giving a total estimate of 144,000 live customers due arrears.
HM Revenue and Customs carried out a targeted scan to identify individuals who did not have HRP on their National Insurance record. Around 1,000 cases were reviewed by HM Revenue and Customs to determine if HRP was likely to be missing and if so, for how many years. The relevant cases were then reviewed by DWP to estimate whether and how much arrears of State Pension may be due if the missing HRP was accounted for. Based on these reviews of a sample of cases, the average arrears amount due to those potentially impacted who were alive above State Pension age at the beginning of the 2022-23 financial year has been estimated as £5,000. Those reaching State Pension age in the 2022-23 financial year were estimated on average to be due £1,000 arrears[footnote 72]. These reviews were conducted with no information from the customer and therefore these cases may not be impacted, and the outcomes may not be accurate or representative of all those affected. Therefore, there is considerable uncertainty in the assumed average arrears amount.
Deceased Cases
To estimate the liability in 2022-23, we have calculated the potential volumes of people impacted between 1978-79 to 2022-23 who are deceased above State Pension age by calculating the average mortality rate for the impacted population from HM Revenue and Customs targeted scan[footnote 73] data. This average mortality rate was calculated by weighting the mortality rates in the scan data by age. This gives a central estimate of scale volume for deceased cases above State Pension age of 60,000. The 95% confidence interval around this central estimate is 30,000 to 90,000.
Where a customer is deceased, State Pension arrears may be owed to deceased estates. We do not currently have any evidence to estimate the success rate in contacting the Next of Kin of those impacted and obtaining the necessary information. Therefore, in the absence of this, we assume – as per the State Pension LEAP exercise assumption for deceased CAT BL cases[footnote 74] – that the Next of Kin will be traceable for, and we will pay arrears to, 75% of these cases. Applying this take up assumption to the central estimate of scale volume above gives an estimate of 43,000 Next of Kin to be paid arrears. As with live cases, the lack of evidence surrounding the take up assumption among the Next of Kin for deceased cases is a significant driver of uncertainty in the estimates; the sensitivity analysis section explores how applying different take up assumptions affects the arrears estimate.
From analysis of the HM Revenue and Customs targeted scan, the assumed average arrears amount due to those impacted in this group has been estimated as £3,000 from these reviews of a sample of cases. For the same reasons outlined above, there is considerable uncertainty in the assumed average arrears amount.
Delivery Timetable
Work is underway to determine and agree an appropriate delivery plan that takes into account the initial action by HM Revenue and Customs to identify and contact customers and the vulnerability of customers impacted, to ensure we can address underpayments as quickly as possible. Until that work is complete, we have based our modelling on an assumption which could see correction activity up to tax year 2027-28. Several factors could impact this modelling assumption, such as resourcing, staff productivity and complexity of cases – these will become clearer once the exercise begins. The ambition to correct records more quickly is reflected in the sensitivity analysis with a potential completion date of tax year 2025-26 in the low scenario.
Sensitivity Analysis
Where limited or no evidence is available, we have based assumptions on what we know of the HRP exercise and the impact on individuals in scope. These assumptions were agreed by an expert DWP and HM Revenue and Customs Governance Group and are intended to reflect the uncertainty in the estimates. The following table shows how changing key modelling assumptions impacts the overall liability.
Table 2[footnote 75]
| Group | Uncertainty | Changes to Assumption[footnote 76]: Low Scenario | Changes to Assumption: Central Assumption[footnote 77] | Changes to Assumption: High Scenario | (Decrease)/Increase on Arrears Valuation £m: Estimated Low | (Decrease)/Increase on Arrears Valuation £m: Estimated High |
|---|---|---|---|---|---|---|
| Above State Pension age | Volumes | 90,000 | 150,000 | 240,000 | (364) | 519 |
| Above State Pension age | Average Arrears | £3,000 | £5,000 | £7,000 | (262) | 262 |
| Above State Pension age | Take Up | 40% | 90% | 100% | (537) | 107 |
| Above State Pension age | Delivery Completion[footnote 78] | 2 Years Faster | 2027-28 | 1 Year Slower | (86) | 43 |
| Deceased | Volumes | 30,000 | 60,000 | 90,000 | (58) | 83 |
| Deceased | Average Arrears | £1,000 | £3,000 | £5,000 | (89) | 89 |
| Deceased | Take Up | 25% | 75% | 85% | (96) | 19 |
Ahead of the exercise commencing the central assumptions that are most uncertain are the average arrears due and the volume of cases that will be corrected. The consistency of the results from the latest Fraud and Error data provides some assurance over the underlying volume of cases affected. The Department therefore considers that overall uncertainty is best represented by varying the average arrears and take up variables between their low and high values.
| Value type | Estimated Minimum | Central Estimate | Estimated Maximum |
|---|---|---|---|
| Present Value (£m)[footnote 79] | 310 | 1,040 | 1,530 |
Volumes
The sensitivity ranges for volumes comes from the 95% confidence intervals set around the central estimates obtained from the Fraud and Error 2021-22 sample.
Average Arrears
The range for average arrears for both the live and deceased cases is obtained by setting a 95% confidence interval around the central average arrears estimate derived from the HM Revenue and Customs targeted scan.
Take Up
In the absence of any robust data on take up we have modelled a large range for both live and deceased cases; recognising deceased cases is likely to be lower. Agreement on these ranges was reached through consultation with a DWP and HM Revenue and Customs expert governance group.
Delivery completion
While an appropriate delivery plan is in the process of being finalised, we assume a 4-year delivery plan (completion in 2027-28), but also model the possibility of correction activity concluding earlier in 2025-26 or in 2028-29.
e. Other provisions
| Other provisions (e) | 31 March 2023: Core department £000 | 31 March 2023: Departmental group £000 | 31 March 2022: Core department £000 | 31 March 2022: Departmental group £000 |
|---|---|---|---|---|
| Balance at 1 April | 30,112 | 31,207 | 25,827 | 26,913 |
| Provided in year | 42,307 | 42,772 | 12,900 | 12,924 |
| Provisions not required written back |
(11,977) | (12,331) | (8,083) | (8,098) |
| Change in discount rate | (2,651) | (2,651) | – | – |
| Utilised in year | (1,956) | (1,956) | (432) | (432) |
| Borrowing costs (unwinding of discount) |
95 | 95 | (100) | (100) |
| Balance at 31 March | 55,930 | 57,136 | 30,112 | 31,207 |
The remaining other provisions comprise:
- onerous contracts and refurbishment work required on vacation of leased properties
- expected future costs of Industrial Injuries Benefits permanent allowance payments to our employees who are injured at work and cannot perform their job as a result
Analysis of expected timing of discounted flows
| Timing of discounted flows |
FAS provisions: Core department £000 |
FAS provisions: Departmental group £000 |
Benefit provisions: Core department £000 |
Benefit provisions: Departmental group £000 |
State Pension underpayment provisions: Core department £000 |
State Pension underpayment provisions: Departmental group £000 |
|---|---|---|---|---|---|---|
| Not later than 1 year | 237,261 | 237,261 | 794,335 | 794,335 | 645,369 | 645,369 |
| Later than 1 year and not later than 5 years |
920,544 | 920,544 | 369,201 | 369,201 | 189,670 | 189,670 |
| Later than 5 years | 3,191,707 | 3,191,707 | – | – | – | – |
| Balance at 31 March 2023 | 4,349,512 | 4,349,512 | 1,163,536 | 1,163,536 | 835,039 | 835,039 |
| Timing of discounted flows |
HRP: Core department £000 |
HRP: Departmental group £000 |
Other provisions: Core department £000 |
Other provisions: Departmental group £000 |
Total: Core department £000 |
Total: Departmental group £000 |
|---|---|---|---|---|---|---|
| Not later than 1 year | 38,783 | 38,783 | 49,083 | 49,779 | 1,764,831 | 1,765,527 |
| Later than 1 year and not later than 5 years |
1,004,462 | 1,004,462 | 2,545 | 2,545 | 2,486,422 | 2,486,422 |
| Later than 5 years | – | – | 4,302 | 4,812 | 3,196,009 | 3,196,519 |
| Balance at 31 March 2023 | 1,043,245 | 1,043,245 | 55,930 | 57,136 | 7,447,262 | 7,448,468 |
17. Remploy Pension Scheme
The Secretary of State for the Department of Work and Pensions (the Sponsor) operates a defined benefit pension arrangement called the Remploy Limited Pension and Assurance Scheme (the Scheme). The Scheme provides benefits based on final salary and length of service on retirement, leaving service or death.
The Scheme is subject to the Statutory Funding Objective under the Pensions Act 2004. A valuation of the Scheme is carried out at least once every 3 years to determine whether the Statutory Funding Objective is met. As part of the process the Sponsor must agree with the Trustees of the Scheme the contributions to be paid to meet the Statutory Funding Objective. The Sponsor considers that it does not have an unconditional right to a future refund of any surplus built up in the Scheme and the present value future contributions required to meet the Statutory Funding Objective is recognised as an additional liability in these disclosures.
The Scheme is managed by a corporate Trustee appointed in part by the Sponsor and in part from elections by members of the Scheme. The Trustee has responsibility for obtaining valuations of the fund, administering benefit payments and investing the Scheme’s assets. The Trustees delegate some of these functions to their professional advisers where appropriate. The Scheme exposes the Sponsor to a number of risks:
- investment risk. The Scheme holds investments in asset classes, such as equities, which have volatile market values and, while these assets are expected to provide real returns over the long-term, the short-term volatility can cause additional funding to be required if deficits emerge.
- interest rate risk. The Scheme’s liabilities are assessed using market yields on high quality corporate bonds to discount the liabilities. As the Scheme holds assets that are different to corporate bonds, the value of the assets and liabilities may not move in the same way. The interest rate risk is hedged to a certain extent via the Scheme’s Liability Driven Investment (LDI) strategy.
- inflation risk. A significant proportion of the benefits under the Scheme are linked to inflation. Although the Scheme’s assets are expected to provide a good hedge against inflation over the long-term, movements over the short-term could lead to deficits emerging. The inflation risk is hedged to a certain extent via the Scheme’s LDI strategy.
- mortality risk. In the event that members live longer than assumed deficits may emerge in the Scheme. There were no plan amendments, curtailments or settlements during the period
- liquidity risk. The Scheme is holding significant portions of illiquid assets such as property, direct lending, and semi-illiquid credit in addition to leveraged LDI funds. The Scheme monitors liquidity requirements to ensure any collateral calls and benefit payments can be met when required.
Risk mitigation strategies
The Trustee, in conjunction with the Sponsor, has reviewed the investment strategy of the Scheme. This process entailed reviewing the liability profile of the Scheme and the Scheme’s investments. The Trustee has previously undertaken such a review which has resulted in the investment managers being instructed as to permissible ranges for asset allocations as set out in the Scheme’s current Statement of Investment Principles. The Scheme has no other asset-liability strategies in place.
Effect of the Scheme on Sponsor’s future cashflows
The Sponsor must agree a Schedule of Contributions with the Trustee of the Scheme following a valuation which must be carried out at least once every 3 years.
The most recent comprehensive actuarial valuation of the Scheme was carried out as at 31 March 2022 and the next valuation of the Scheme is due as at 31 March 2025. The Trustees and Sponsor agreed no further contributions were required as the funding level would reach 100% via investment returns alone. In the event that the 2025 valuation reveals a larger deficit than expected the Sponsor may be required to recommence contributions.
The Scheme currently has a surplus on the IAS 19 Employee Benefits basis. The Sponsor does not consider that it has an unconditional right to a future refund of this surplus, so an asset ceiling applies under IFRIC14 and the balance sheet asset is restricted to be nil. As no further contributions are due under the current Schedule of Contributions the Sponsor is not required to recognise any additional liabilities under IFRIC14.
The Sponsor expects to pay no contributions in the year to 31 March 2024. The weighted average duration of the defined benefit obligation is 13 years.
Guaranteed Minimum Pension (GMP) equalisation
Previous disclosures have included an allowance for GMP equalisation for the liabilities of the current members of the Scheme. This allowance was equivalent to around 1.0% of the value of the liabilities. The same allowance has been made this year.
In addition, an allowance for top-ups to previous transfers, has been included in the liabilities, of £235,000 at the Review Date.
International Financial Reporting Interpretations Committee 14 (IFRIC 14) and asset ceiling
As per the FReM, disclosures are required to comply with IFRIC14 - the limit on a defined benefit asset, Minimum Funding Requirements and their Interaction, as well as IAS 19.
IFRIC14 potentially requires a surplus to be restricted and/or an additional liability to be recognised if the contributions agreed as part of the Scheme’s funding plan are expected to lead to an IAS 19 surplus. However, this would not apply if the Sponsor had an “unconditional right” to any surplus arising in the pension scheme.
An “unconditional right” in this context means that the Sponsor would be able to benefit from the surplus in the form of a future refund from the Scheme in any 1 of the 3 following scenarios. This cannot be conditional on the occurrence or non-occurrence of any future event:
- by payment to the sponsor while the Scheme is ongoing - not applicable as would require the Scheme to be fully funded on a buy-out basis (among other requirements).
- by payment to the Sponsor if it were to trigger immediate wind-up – again not applicable as would require the Scheme to be fully funded on a buy-out basis.
- by payment to the Sponsor at the end of the life of the Scheme once all liabilities have been settled – this relies on the Sponsor being able to gradually settle the liabilities over an extended period and receive a refund once no further beneficiaries remain. This is the only possible scenario under which an unconditional right could potentially be justified.
The Trust Deed and Rules of the Scheme do not contain provision for a payment of surplus assets to be made to the Sponsor (either during the lifetime of the Scheme or as part of a wind-up process), although this may be subject to legal review. On this basis, there is currently no prospect of the Sponsor being able to benefit from a future refund, so the surplus should be restricted to nil.
No further contributions are due from the Sponsor after the balance sheet date so (unlike the previous year end) no additional liability needs to be recognised under IFRIC14.
Scheme surplus
At the Review Date there was a surplus in the Scheme of £43,253,000. This compares to a surplus of £12,147,000 at the previous review date. Although the surplus at the Review Date is £43,253,000, the final figure to be disclosed in the accounts is a net liability of £0. This is due to the effect of an asset ceiling.
The main reasons for the change in the surplus over the period are:
- an increase in the discount rate and decrease in future inflation assumptions has reduced the liabilities by £295 million.
- this has been partially offset by asset returns being lower than interest on the assets by £231 million.
- changes to the Scheme’s mortality improvement assumptions and the Scheme’s cash commutation factors has reduced the liabilities by £21 million.
- actual inflation since 31 March 2022 up to September 2023 is expected to be higher than assumed, increasing the liabilities by £62 million.
- other changes in the member data incorporated in the 31 March 2022 actuarial valuation has increased the liabilities by £9 million.
Disclosures for IAS 19 (Employee Benefits) Table of assumptions used in calculations
Figures for disclosure in accounts for period ending 31 March 2023 under IAS 19. Results are shown in pounds, rounded to the nearest £1,000.
| Principal actuarial assumptions | At 31 Mar 2023 | At 31 Mar 2022 |
|---|---|---|
| Discount rate | 4.80% p.a. | 2.60% p.a. |
| Inflation (RPI) | 3.20% p.a. | 3.50% p.a. |
| Inflation (CPI) | 2.85% p.a. | 3.10% p.a. |
| Pension increase (Pre 1 April 1997 excess – CPI uncapped) |
2.85% p.a. | 3.10% p.a. |
| Pension increase (1 April 1997 – 1 April 2005 – CPI (capped at 5%)) |
2.85% p.a. | 3.00% p.a. |
| Pension increase (Post 1 April 2005 – RPI (capped at 5%)) |
3.10% p.a. | 3.40% p.a. |
| Principal actuarial assumptions | At 31 Mar 2023 | At 31 Mar 2022 |
|---|---|---|
| Post-retirement mortality | Remploy-specific table based on remploy experience between 2007 and 2012. With allowance for improvements in life expectancy in line with CMI 2021 |
Remploy-specific table based on remploy experience between 2007 and 2012. With allowance for improvements in life expectancy in line with CMI 2018 |
| Commutation | 75% of members are assumed to take the maximum tax free cash possible | 75% of members are assumed to take the maximum tax free cash possible |
| Early Retirement | Non-pensioners over age 50 at 31 March 2016 retire at age 63, under age 50 retire at age 65 | Non-pensioners over age 50 at 31 March 2016 retire at age 63, under age 50 retire at age 65 |
| Ill health retirements | 0.25% loading (non-pensioners) | 1% loading (non-pensioners) |
| Allowance for GMP equalisation | Uplift to liabilities of approx. 1% | Uplift to liabilities of approx. 1% |
| Life expectancy at age 65 of male aged 45 | 20.0 | 20.4 |
| Life expectancy at age 65 of male aged 65 | 18.2 | 18.5 |
| Life expectancy at age 65 of female aged 45 | 23.1 | 23.3 |
| Life expectancy at age 65 of female aged 65 | 21.2 | 21.3 |
| The current asset split is as follows: | Asset allocation at 31 March 2023 £ |
|---|---|
| Property | 80,872,000 |
| LDI | 311,424,000 |
| Absolute return bonds | 143,528,000 |
| Direct Lending | 44,615,000 |
| Semi-liquid credit | 133,867,000 |
| Cash | 23,077,000 |
| Insured assets | 2,646,000 |
| Defined benefit assets | 740,029,000 |
| Money purchase assets | 7,898,000 |
| Total assets | 747,927,000 |
Note that the Assets labelled ‘LDI’ actually include a number of different asset types, including derivatives.
| SoFP | At 31 March 2023 £ | At 31 March 2022 £ |
|---|---|---|
| Fair value of assets | 747,927,000 | 989,000,000 |
| Present value of funded obligations | (704,674,000) | (976,853,000) |
| Surplus/(deficit)* in scheme | 43,253,000 | 12,147,000 |
| Effect of asset ceiling | (43,253,000) | (13,187,000) |
| Net defined benefit asset/(liability) | – | (1,040,000) |
*Surplus/(deficit) shown prior to deferred taxation
| Amount recognised in Profit and Loss |
At 31 March 2023 £ | At 31 March 2022 £ |
|---|---|---|
| Current service cost | – | – |
| Administration costs | 1,698,000 | 1,700,000 |
| Interest on liabilities | 24,767,000 | 19,461,000 |
| Interest on assets | (25,061,000) | (19,247,000) |
| Past service costs | – | – |
| Settlement and curtailment cost | – | – |
| Interest on effect of asset ceiling |
343,000 | – |
| Total charge to Profit and Loss |
1,747,000 | 1,914,000 |
| Re-measurements over the period |
Period to 31 March 2023 £ | Period to 31 March 2022 £ |
|---|---|---|
| Loss/(gain) on assets in excess of interest |
231,433,000 | (16,914,000) |
| Experience losses/(gains) on liabilities |
52,685,269 | 10,833,000 |
| Losses/(gains) from changes to demographic assumptions |
(21,335,000) | – |
| Losses/(gains) from changes to financial assumptions |
(295,293,269) | (17,855,072) |
| Losses/(gains) from change in effect of asset ceiling |
29,723,000 | 13,187,000 |
| Total re-measurements | (2,787,000) | (10,749,000) |
| Change in value of assets | Period to 31 March 2023 £ | Period to 31 March 2022 £ |
|---|---|---|
| Fair value of assets at start |
989,000,000 | 987,974,000 |
| Money Purchase assets at start | (7,997,000) | (8,422,000) |
| Interest on assets | 25,061,000 | 19,247,000 |
| Company contributions | – | – |
| Contributions by Scheme participants |
– | – |
| Benefits paid | (32,904,000) | (33,010,000) |
| Administration costs | (1,698,000) | (1,700,000) |
| Change due to settlements and curtailments |
– | – |
| Return on assets less interest |
(231,433,000) | 16,914,000 |
| Money Purchase assets at end |
7,898,000 | 7,997,000 |
| Fair value of assets at end |
747,927,000 | 989,000,000 |
| Actual return on assets | (206,372,000) | – |
| Change in value of the DB liabilities |
Period to 31 March 2023 £ | Period to 31 March 2022 £ |
|---|---|---|
| Defined benefit obligation at start |
976,853,000 | 997,849,000 |
| Money Purchase liabilities at start |
(7,997,000) | (8,422,000) |
| Current service cost | – | – |
| Contributions by Scheme Participants |
– | – |
| Past service costs | – | – |
| Interest on liabilities | 24,767,000 | 19,461,000 |
| Benefits paid | (32,904,000) | (33,010,000) |
| Change due to settlements and curtailments |
– | – |
| Experience (gain)/loss on liabilities |
52,685,269 | 10,833,072 |
| Changes to demographic assumptions |
(21,335,000) | – |
| Changes to financial assumptions |
(295,293,269) | (17,855,072) |
| Money Purchase liabilities at end |
7,898,000 | 7,997,000 |
| Defined benefit obligation at end |
704,674,000 | 976,853,000 |
| Reconciliation of effect of asset ceiling |
Period to 31 March 2023 £ | Period to 31 March 2022 £ |
|---|---|---|
| Effect of asset ceiling at start | 13,187,000 | – |
| Interest on effect of asset ceiling | 343,000 | – |
| Actuarial losses/(gains) | 29,723,000 | 13,187,000 |
| Effect of asset ceiling at end | 43,253,000 | 13,187,000 |
| Reconciliation of net defined benefit liability (asset) |
Period to 31 March 2023 £ | Period to 31 March 2022 £ |
|---|---|---|
| Net defined benefit liability (asset) at start |
1,040,000 | 9,875,000 |
| Current service cost | – | – |
| Past service cost and settlement and curtailment cost |
– | – |
| Net interest expense (income) | 49,000 | 214,000 |
| Remeasurements | (2,787,000) | (10,749,000) |
| Administration costs | 1,698,000 | 1,700,000 |
| Employer contributions | – | – |
| Net defined benefit liability (asset) at end |
– | 1,040,000 |
| Sensitivity of the value placed on the liabilities |
Approximate effect on liability £ |
|---|---|
| Discount rate +0.50% | (41,795,000) |
| Discount rate -0.50% | 46,543,000 |
| Inflation +0.50% | 32,049,000 |
| Inflation -0.50% | (31,567,000) |
| Decrease mortality rates by a factor of 10% |
26,254,000 |
| Increase mortality rates by a factor of 10% |
(23,544,000) |
Pension accounting assumptions as at 31 March 2023 Discount rate
Under IAS 19 the discount rate should be based upon the yield available on long-dated high quality corporate bonds (usually taken as AA rated in the UK) of appropriate term and currency. The same approach was used for the derivation of the discount rate in last year’s disclosures.
Using this approach results in a proposed discount rate of 4.8% per annum after rounding.
This is higher than the discount rate used last year of 2.6% per annum reflecting the increases to the yields on corporate bonds over this period.
Inflation
As actual inflation over the period since the Scheme Funding valuation has been significantly higher than assumed, the values have been updated for actual deferred revaluations and pension increases in the projection period. Apart from the allowance for actual inflation, this approach is consistent with the approach adopted in previous years.
18. Incorrect payments
Overview
We are responsible for paying claimants the right benefit at the right time. Social Security legislation sets out the basis on which we calculate and pay benefits. The purpose of this legislation is to provide a regulatory framework within which we operate to support those in need.
In many instances Parliament has targeted specific benefits to claimants’ needs and circumstances to ensure an efficient use of overall resources. However, this can introduce complexity and an attendant risk of fraud and error, leading to some incorrect payments. We administer over 25 benefits, ensuring that the very different conditions of entitlement are met in each individual instance. We take tackling incorrect payments seriously and pay around 95% of our £234[footnote 80] billion benefit expenditure correctly.
Rate of fraud and error in 2022-23
For this financial year we have carried out full reviews on Universal Credit, Pension Credit, Housing Benefit (non passported working age client group), Employment and Support Allowance and State Pension. We have also carried out a full review of Personal Independence Payments for the first time since 2019-20. For benefits not measured this year we either roll forward rates from when the benefit was last measured or apply a proxy rate to the 2022-23 expenditure. For more information, please see the Benefit fraud and error estimation uncertainty and assumptions section.
The 2022-23 statistics (published in May 2023) indicate that fraud and error overpayments decreased to 3.6% from 4.0%. This amounts to a monetary value of £8.3 billion overpaid from a total expenditure of £234 billion this year. Fraud accounts for overpayments of 2.7% (£6.4 billion) of expenditure, whilst claimant error is 0.6% (£1.4 billion) and official error is 0.3% (£0.6 billion)[footnote 81].
We have an obligation to ensure that any overpaid benefit is recovered from the debtor in accordance with the appropriate social security legislation. We estimate nearly £1 billion was recovered in 2022-23[footnote 82]. An additional measure to the estimated overpayments takes away actual recoveries from estimated overpayments, to give an estimate of the net loss to the system[footnote 83].
The 2022-23 statistics estimate that the proportion of benefit underpaid increased to 1.4% from 1.2% of total expenditure in comparison to the previous year, which equates to a monetary value of £3.3 billion. Claimant error accounts for underpayments of 0.9% (£2.1 billion) whilst official error is 0.5% (£1.2 billion) of total expenditure.
Where we’ve been notified about an underpayment, and where there is a legal obligation, we will pay any arrears due. Where underpayments are identified because of official error, we will pay arrears in full at the earliest opportunity, subject to any legal considerations. Our fraud, error and debt strategy requires us to minimise underpayments and ensure that we pay claimants their full entitlement. In 2020-21 the department became aware of a systemic underpayment issue affecting State Pension. The types of errors leading to these underpayments had been identified in cases reviewed to estimate MVFE, therefore in-year underpayments are included in the MVFE estimate. More information on this State Pension provision can be found in Note 16c.
Last year, whilst contacting claimants as part of the full review of State Pension we identified an area of Official Error that we were not capturing in previous years. We have continued to find errors of this nature in 2022-23. This related to Home Responsibilities Protection (HRP). For people reaching State Pension age before 6 April 2010, HRP reduced the number of qualifying years needed for a basic State Pension where someone stayed at home to care for children for whom they received Child Benefit or a person who was sick or disabled. For people reaching State Pension age since 6 April 2010, previously recorded periods of HRP were converted into National Insurance credits. Errors occurred where periods when HRP was due were not accurately recorded on their National Insurance record.
Further details on our fraud and error strategy are included in the performance report.
Statistics
Table 1. Overall 2022-23 fraud and error estimates
| Expenditure | Fraud | Claimant Error | Official Error | Total |
|---|---|---|---|---|
| Overpayments | 2.7% (£6.4bn) | 0.6% (£1.4bn) | 0.3% (£0.6bn) | 3.6% (£8.3bn) |
| Underpayments | 0.0% (£0.0bn) | 0.9% (£2.1bn) | 0.5% (£1.2bn) | 1.4% (£3.3bn) |
| Total Expenditure | – | – | – | £233.8bn |
Table 2. Estimates for benefits reviewed in 2022-23
| Benefit | Overpayment: fraud | Overpayment: Claimant Error |
Overpayment: Official Error |
Overpayment: Total |
Underpayment: Claimant Error |
Underpayment: Official Error |
Underpayment: Total |
Total Expenditure |
|---|---|---|---|---|---|---|---|---|
| Universal Credit | 11.5% (£5.0bn) |
*0.6% (£0.3bn) |
0.6% (£0.3bn) |
*12.8% (£5.5bn) |
*1.0% (£0.4bn) |
0.6% (£0.2bn) |
*1.6% (£0.7bn) |
– £43.4bn |
| State Pension | 0.0% (£0.0bn) |
0.1% (£0.1bn) |
0.0% (£0.0bn) |
0.1% (£0.1bn) |
*0.1% (£0.1bn) |
0.5% (£0.6bn) |
0.6 (£0.7bn) |
– £109.7bn |
| Personal Independence Payments |
0.2% (£0.0bn) |
0.8% (£0.1bn) |
0.1% (£0.0bn) |
1.1% (£0.2bn) |
*4.8% (£0.8bn) |
0.3% (£0.1bn) |
*5.1% (£0.9bn) |
– £17.7bn |
| Housing Benefit | 3.5% (£0.5bn) |
1.6% (£0.2bn) |
0.4% (£0.1bn) |
5.5% (£0.8bn) |
0.7% (£0.1bn) |
0.4% (£0.1bn) |
1.1% (£0.2bn) |
– £15.0bn |
| Employment and Support Allowance |
1.5% (£0.2bn) |
1.5% (£0.2bn) |
0.4% (£0.0bn) |
3.4% (£0.4bn) |
1.3% (£0.2bn) |
1.1% (£0.1bn) |
2.4% (£0.3bn) |
– £12.1bn |
| Pension Credit | 2.5% (£0.1bn) |
3.2% (£0.2bn) |
1.1% (£0.1bn) |
6.7% (£0.3bn) |
1.0% (£0.1bn) |
1.0% (£0.1bn) |
2.0% (£0.1bn) |
– £4.9bn |
Table 3. Estimates for benefits reviewed in previous years
| Benefit | Overpayment: fraud | Overpayment: Claimant Error |
Overpayment: Official Error |
Overpayment: Total |
Underpayment: Claimant Error |
Underpayment: Official Error |
Underpayment: Total |
Total Expenditure |
|---|---|---|---|---|---|---|---|---|
| Attendance Allowance |
0.0% (£0.0bn) |
1.9% (£0.1bn) |
0.3% (£0.0bn) |
2.2% (£0.1bn) |
4.2% (£0.2bn) |
0.1% (£0.0bn) |
4.3% (£0.3bn) |
– £5.7bn |
| Carer’s Allowance | 3.0% (£0.1bn) |
2.0% (£0.1bn) |
0.1% (£0.0bn) |
5.2% (£0.2bn) |
0.0% (£0.0bn) |
0.0% (£0.0bn) |
0.0% (£0.0bn) |
– £3.3bn |
| Jobseeker’s Allowance |
3.1% (£0.0bn) |
0.3% (£0.0bn) |
1.2% (£0.0bn) |
4.6% (£0.0bn) |
0.3% (£0.0bn) |
1.2% (£0.0bn) |
1.5% (£0.0bn) |
– £0.3bn |
| Disability Living Allowance |
0.5% (£0.0bn) |
0.6% (£0.0bn) |
0.8% (£0.1bn) |
1.9% (£0.1bn) |
2.4% (£0.1bn) |
0.1% (£0.0bn) |
2.5% (£0.1bn) |
– £6.0bn |
| Income Support | 2.4% (£0.0bn) |
1.0% (£0.0bn) |
0.4% (£0.0bn) |
3.9% (£0.0bn) |
0.4% (£0.0bn) |
0.3% (£0.0bn) |
0.8% (£0.0bn) |
– £0.6bn |
| Incapacity Benefit | 0.3% (£0.0bn) |
0.9% (£0.0bn) |
1.2% (£0.0bn) |
2.4% (£0.0bn) |
0.0% (£0.0bn) |
0.7% (£0.0bn) |
0.7% (£0.0bn) |
– £0.0bn |
Table 4. Estimates for benefits never reviewed and interdependencies
| Unreviewed\interdependencies | Overpayment: fraud | Overpayment: Claimant Error |
Overpayment: Official Error |
Overpayment: Total |
Underpayment: Claimant Error |
Underpayment: Official Error |
Underpayment: Total |
Total Expenditure |
|---|---|---|---|---|---|---|---|---|
| Unreviewed benefits | 2.2% (£0.3bn) |
0.5% (£0.1bn) |
0.4% (£0.1bn) |
3.0% (£0.5bn) |
0.2% (£0.0bn) |
0.2% (£0.0bn) |
0.4% (£0.1bn) |
– £15.0bn |
| Interdependencies | z (£0.0bn) |
z (£0.0bn) |
z (£0.0bn) |
z (£0.1bn) |
z | z | z | – z |
Notes to tables 1-4:
1. The 2022-23 data comes from DWP National Statistics: Fraud and Error in the Benefit System: financial year 2022 to 2023 Estimates. Fraud and error rates for Universal Credit are based on cases sampled in the period November 2021 to October 2022. State Pension and Pension Credit rates are based on cases sampled in the period September 2021 to September 2022. Employment and Support Allowance rates are based on cases sampled in the period September 2021 to August 2022. Housing Benefit rates are based on cases sampled in the period November 2021 to September 2022. Personal Independence Payments rates are based on cases sampled in the period November 2021 to July 2022.
2. Estimates for all benefits are based on estimated benefit expenditure for 2022-23. These are consistent with Spring Budget 2023 and were the latest available for the financial year at the time of producing the fraud and error estimate.
3. All expenditure values in the table are rounded to the nearest £100 million and monetary estimates are rounded to the nearest £10 million.
4. Figures expressed as percentages (%) give the overpayments and underpayments as a % of the benefit paid out in the year (expenditure).
5. Rows and columns may not equal the totals due to rounding.
6. Carer’s Allowance underpayment estimates are zero as no underpayment cases were found in the sample.
7. The overpayment and underpayment figures above are central estimates and therefore there is a degree of uncertainty around them. The full statistical tables are available at GOV.UK on the “Fraud and Error in the Benefit System financial year 2022 to 2023” page and show the 95% confidence intervals for all the figures above. These confidence intervals allow for statistical uncertainty caused by the sampling approach. Further uncertainties arise from imperfections in the review process. Where possible we’ve quantified these and incorporated them into the 95% confidence intervals.
8. Any figure marked with a * means that it has a statistically significant difference (at a 95% level of confidence) when comparing to the last time it was measured. Where changes are not statistically significant, differences are likely to be due to sampling variation. This suggests that these estimates are stable over time with little change year-on-year. For Personal Independence Payments this comparison is to the last time it was measured in the 2019-20 statistics. All other benefits are compared to the 2021-22 statistics. For the previous year figures please see the “Fraud and Error in the Benefit System financial year 2022 to 2023” page on GOV.UK.
9. We review a selection of benefits for fraud and error each year. Estimates for other benefits come from previous review exercises, or proxies. Please refer to the latest National Statistics publication for further details. (See “Benefit fraud and error estimation and uncertainty assumptions” section below for details).
10. ‘Interdependencies’ is an estimate of the knock-on effects of DLA/PIP overpayments on caring and disability premiums on income-related benefits, which depend on the rate of DLA/PIP in payment.
11. Cost of Living Payments were paid by the Department for the first time in Financial Year End 2023. These payments were not directly measured however an estimate for the fraud and error associated with these payments is included within the unreviewed benefits line of the table above.
12. A “z” indicates not applicable.
How each benefit contributes to the overall level of overpayments and underpayments
Individual benefits make varying contributions to the overall fraud and error rate, and changes in the rates for each benefit from year to year have different impacts on the overall rate of fraud and error. The table below illustrates how each of the benefits contribute to the overall overpayment amount and overall underpayment amount. The table also shows how changes to the overpayment and underpayment rates for the individual benefits could affect the overall figures.
Table of the proportion each benefit contributes to the overall overpayment rate
| Reviewed in 2022-23 | UC | SP | HB | ESA | PC | PIP |
|---|---|---|---|---|---|---|
| Expenditure (£bn) | £43.4 | £109.7 | £15.0 | £12.1 | £4.9 | £17.7 |
| Overpayment rate | 12.8% | 0.1% | 5.5% | 3.4% | 6.7% | 1.1% |
| Overpayment value (£m) | £5,540 | £100 | £820 | £410 | £330 | £200 |
| Contribution to overall OP | 66% | 1% | 10% | 5% | 4% | 2% |
| Impact of a 10% change in monetary value of overpayment on the overall overpayment rate |
0.24% | 0.00% | 0.04% | 0.02% | 0.01% | 0.01% |
| Previously reviewed | AA | CA | JSA | IS | IB | DLA | Unreviewed |
|---|---|---|---|---|---|---|---|
| Expenditure (£bn) | £5.7 | £3.3 | £0.3 | £0.6 | £0.0 | £6.0 | £15.0 |
| Overpayment rate | 2.2% | 5.2% | 4.6% | 3.9% | 2.4% | 1.9% | 3.0% |
| Overpayment value (£m) | £130 | £170 | £10 | £30 | £0 | £110 | £460 |
| Contribution to overall OPs | 1% | 2% | 0% | 0% | 0% | OPs | 1% |
| Impact of a 10% change in monetary value of overpayment on the overall overpayment rate |
0.01% | 0.01% | 0.00% | 0.00% | 0.00% | 0.00% | 0.02% |
For example, Universal Credit currently contributes 66% of the overall overpayment value, the highest of all individual benefits. If the monetary value of overpayment on Universal Credit (currently £5,540 million) changed by 10%, this would lead to the overall overpayment rate of 3.6% changing by 0.24 percentage points (equating to around £550 million).
Table of the proportion each benefit contributes to the overall underpayment rate
| Reviewed in 2022-23 | UC | SP | HB | ESA | PC | PIP | AA | CA | JSA | IS | IB | DLA | Unreviewed |
|---|---|---|---|---|---|---|---|---|---|---|---|---|---|
| Expenditure (£bn) | £43.4 | £109.7 | £15.0 | £12.1 | £4.9 | £17.7 | £5.7 | £3.3 | £0.3 | £0.6 | £0.0 | £6.0 | £15.0 |
| Underpayment rate | 1.6% | 0.6% | 1.1% | 2.4% | 2.0% | 5.1% | 4.3% | 0.0% | 1.5% | 0.9% | 0.7% | 2.5% | 0.4% |
| Underpayment value (£m) | £680 | £670 | £170 | £290 | £100 | £900 | £250 | £0 | £10 | £10 | £0 | £150 | £60 |
| Contribution to overall UP | 21% | 20% | 5% | 9% | 3% | 28% | 8% | 0% | 0% | 0% | 0% | 5% | 2% |
| Impact of a 10% change in monetary value of underpayment on the overall underpayment rate |
0.03% | 0.03% | 0.01% | 0.01% | 0.00% | 0.04% | 0.01% | 0.00% | 0.00% | 0.00% | 0.00% | 0.01% | 0.00% |
For example, Personal Independence Payments currently contributes 28% of the overall underpayment value, the highest of all individual benefits measured this year. If the monetary value of underpayment on Personal Independence Payments (currently £900 million) changed by 10%, this would lead to the overall underpayment rate of 1.4% changing by 0.04 percentage points (equating to around £90 million).
Benefit fraud and error estimation uncertainty and assumptions
We are rigorous in estimating levels of fraud and error. Our estimates are produced to the exacting standards of the UK Statistics Authority protocols for National Statistics, ensuring their production is independent of departmental and ministerial influence.
Our strategy for estimating the level of incorrect payments considers the value of the benefit, its risk profile and previous experience of measuring the benefit. Our estimates are based on around 13,600 reviews of a random sample[footnote 84] of claimants on certain benefits.
Table of the number of reviews and percentage of the population that equates to, split by benefit
| Benefit | Sample size | Percentage of claimant population reviewed |
|---|---|---|
| Universal Credit | 3,569 | 0.08% |
| State Pension | 1,646 | 0.02% |
| Housing Benefit | 2,978 | 0.11% |
| Pension Credit | 1,987 | 0.14% |
| Employment and Support Allowance |
1,997 | 0.12% |
| Personal Independence Payment |
1,431 | 0.07% |
| Total | 13,608 | 0.06% |
Further information on our estimation strategy can be found at GOV.UK (within the latest Fraud and Error in the benefit system National Statistics publication, and the Background Information document).
When interpreting the statistics, please bear in mind that we only sample cases that are in receipt of benefit. The figures do therefore not include, for example, people who are entitled to benefit but don’t apply, those whose applications are incorrectly rejected, or benefit advances. One of the largest of these omissions is advances relating to Universal Credit. Analysis carried out by the Department, estimates that the monetary value of fraud and error on Universal Credit advances is between £10 million and £80 million.
Sampling uncertainty and confidence intervals
The above tables contain estimates based on a sample of benefit claims and are therefore subject to a degree of statistical uncertainty. They are prepared to within a stated range of accuracy, described as confidence intervals. The estimates are provided to a 95% confidence level. For 2022-23, the rates of total overpayment lie in the range from 3.3% to 3.9% (monetary value £7.7 billion to £9.0 billion), whilst the corresponding range for underpayments is 1.3% to 1.6% (£2.9 billion to £3.7 billion).
When rolling forward historic rates of Fraud and Error, the level of uncertainty associated with those estimates increases. To reflect this rise in uncertainty, for any benefit that has rolled forward rates due to not being measured in the current year, the confidence intervals from the rates found when it was last measured are widened by a factor of 2. Due to the benefits measured this year making up around 77% of all expenditure, the impact this has had on the All Benefits Confidence Intervals is minimal.
Further information on these figures can be found at GOV.UK (within the latest Fraud and Error in the benefit system National Statistics publication, and the Background Information document
‘Cannot Review’ assumption
‘Cannot Review’ cases are those that do not engage with the Performance Measurement review of their benefit award, resulting in their benefit being suspended. Prior to 2019-20 we classified all these cases as fraud. We now look at each of these cases individually and classify them as follows:
- benefit correct – if they come back on to benefit within 4 months with the same circumstances
- fraud – if there is a suspicion of fraud raised following initial data gathering prior to review
- inconclusive – where there is no information to suggest a suspicion of fraud or that the claimant has reclaimed benefit
Inconclusive cases are removed from the main fraud and error estimate and footnoted separately in the fraud and error statistical publication.
Inconclusive cases accounted for £960 million of expenditure in 2022-23. Had all of these cases been instead classed as fraud, then the total monetary value of overpayments would rise from £8.3 billion to £9.3 billion, and the overall overpayment rate would rise from 3.6% to 4.0%. The proportion of expenditure that is excluded in Financial Year End 2023 under this assumption is the same as Financial Year End 2022, with 0.4 percentage points added to the overall overpayment rate, for both years if the inconclusive cases had been classed as fraud.
Further information on this assumption and the impact can be found at GOV.UK (within the latest Fraud and Error in the benefit system National Statistics publication, and the Background Information document
Move to telephony
From 2021-22, we review all benefits via telephone. This is the first time that PIP reviews have been carried out via telephone, in previous years they were carried out by home visits. We are making the assumption that this change to the review process has no impact on the Fraud and Error rate.
State Pension
As the reviews for State Pension only cover cases from Great Britain, we also include an additional amount of Claimant Error to estimate the impact of non-notification of death on State Pension cases who live overseas. Last year we carried out a full review of State Pension cases for the first time since Financial Year End 2006. As part of that we updated the methodology used to generate this additional amount. This estimate was based on the life certificate and death exchange data. For more information on these please see section 2 of the Background Information document that accompanies the latest National Statistics. Last year this estimate accounted for around 40% of the total State Pension expenditure overpaid.
This year, whilst looking to update and refine the new methodology developed last year, we found inconsistencies and gaps in the underlying data which led us to question its robustness. If this had been identified last year, we would not have made the methodology change that we did. Therefore, whilst we work to develop an updated estimate, we have returned to using the rate we had been using before 2021-22 for this additional amount. This rate relates to a measurement exercise carried out in 2004. Applying this rate to last year’s figures added another £10 million onto the State Pension Claimant Error Overpayment MVFE in 2021-22. For more information on how this rate was calculated please see the 2005/06 State Pension publication
No cases were selected in the 2022-23 State Pension sample from the new Get Your State Pension (GySP) system. At the end of 2022-23 the proportion of the State Pension caseload on GySP was 7%. The assumption was made that the rate of fraud and error present on these cases is the same as those on the legacy system. This will be the last year that an assumption on GySP will be needed as from 2023-24 GySP will be included within the measurement process.
Changes to proxy measures
For benefits which we have never reviewed we use a similar benefit’s rate as a proxy.
Over the last year we have carried out a review of the benefits which we use as a proxy. Previously we would use the whole benefit’s rates as proxies. For example, we used the Employment and Support Allowance rate as proxy rate for Maternity Allowance. However, we are now taking a more refined approach and only taking the elements of a benefit that relate to that particular benefit. For example, for Maternity Allowance we are continuing to use Employment and Support Allowance as it has similar eligibility requirements regarding work and National Insurance contributions, as well as covering the target working age population. However, going forward we will only take the error rates found on Employment and Support Allowance relating to Abroad, Conditions of Entitlement, Earnings and Contributions as they are the only error types that could occur on Maternity Allowance.
If this change was made to last year’s figures it would have reduced the unreviewed overpayment MVFE from £160 million to £40 million and the unreviewed underpayment MVFE from £80m to £50 million. For more information on this and for a full list of the new proxies that are used, please see the background information document that accompanies the statistics.
Cost of Living Payments
For the first time this year the department made extra payments, called Cost of Living Payments to claimants on certain benefits. This was to give claimants extra support during the current cost of living.
Cost of Living Payments have not been measured directly for fraud and error, so a proxy measure has been derived to estimate the amount of the benefit that was incorrectly paid.
The main reason that Cost of Living Payments would be incorrectly paid would be because the claimant was ineligible to receive the qualifying benefit. Therefore, the proxy measure for the fraud and error rate on Cost of Living Payments is based on the rates of entitlement loss from the last time we measured the benefits that qualify claimants for a Cost of Living Payment.
Table showing the qualifying benefits for Cost of Living Payments, their loss of entitlement rate used and where/when the rate came from.
| Qualifying Benefit | Loss of Entitlement Rate |
Rate used |
|---|---|---|
| Universal Credit | 11.4% | From 2022-23 work programme |
| Income-Related Employment and Support Allowance |
1.7% | From 2022-23 work programme |
| Pension Credit | 3.5% | From 2022-23 work programme |
| Personal Independence Payments | 1.9% | From 2022-23 work programme |
| Winter Fuel Payments | 0.5% | From 2021-22 service centre measurement |
| Attendance Allowance | 2.3% | From 2021-22 work programme |
| Income-based Jobseeker’s Allowance |
3.3% | From 2018-19 work programme |
| Disability Living Allowance | 1.9% | Proxy – PIP rate from 2022-23 work programme |
| Armed Forces Independence Payments |
1.9% | Proxy – PIP rate from 2022-23 work programme |
| Constant Attendance Allowance | 2.3% | Proxy – AA rate from 2021-22 work programme |
| Income Support | 3.3% | Proxy –JSA rate from 2018-19 work programme |
These loss of entitlement rates are then applied to the Cost of Living Payment expenditure related to the relevant qualifying benefit, to generate an amount of Cost of Living Payments overpaid for each of the benefits above. The MVFE related to each benefit is summed and then divided by the total Cost of Living Payment to generate the rates.
Within our estimates we have not taken account of Official Error overpayments and underpayments that happened directly on Cost of Living Payments (Fraud and Claimant Error cannot happen directly on Cost of Living Payments). These include:
- unsuccessfully delivered payments
- a small number of Cost of Living Payments paid in error to the wrong person
However, we estimate that the impact of this on our estimates is minimal. For more information, please see the background information document that accompanies the statistics.
Cost of Living Payments are included in the unreviewed benefits line and account for 91% (£0.4 billion) of the total unreviewed overpayments this year. Due to Cost of Living Payments being included for the first time this year, and the change to benefit proxies, direct comparisons of the unreviewed category should not be made between this year and previous years.
Revisions to Housing Benefit 2021-22 statistics
Last year we revised our estimates for 2020-21 and 2019-20 due to a change made to the Housing Benefit (HB) expenditure data. The HB expenditure data used in the calculations previously included Universal Credit as a non-passporting benefit. We adjusted the expenditure data to categorise UC as a passporting benefit because people in receipt of UC who are in supported, sheltered or temporary housing are treated similarly to those claimants in receipt of other income-related benefits. We used the best information available to us at the time to estimate the expenditure splits.
Over the past year work has been carried out to formalise a methodology for correctly apportioning HB expenditure. We will be using this data for 2022-23 and going forward. In order to allow consistent comparisons with the previous year we are revising our figures for 2021-22.
19. Contingent liabilities
Benefit underpayments
Distinct from legal cases, the Department acknowledges that administrative errors (termed official error) by its staff will sometimes result in the underpayment of benefit. Where underpayments relating to official error are identified, we pay arrears in full at the earliest opportunity.
Through annual review of Fraud and Error statistics, the Department has an estimate of official error both for the current year (see note 18), and prior years from equivalent exercises. These estimates are based on statistical samples; as a result the Department does not hold a full list of underpaid benefits cases that it can correct. The Department cannot quantify the cumulative historic liability which may exist due to limitations in data. Therefore, a contingent liability exists for underpayments not yet found and corrected.
The measures reported in the Incorrect Payments notes show an estimate of underpayments made in the reporting year. At present there is no mechanism by which we can calculate the value of historic official error corrected in year, to support an overall quantification of the outstanding liability. The Department will review processes and data sources available with a view to quantify this liability in future.
Legal cases
The ongoing legal cases, (judicial reviews and appeals) may lead to possible obligations where the Department is facing legal challenge to the policy behind the legislation through the courts and the outcomes depend on the court rulings. In some early stage cases the legal challenges include numerous arguments that require a decision to be made by the courts. In these cases, until further rulings are received, a reliable estimate is not always possible. However, there will be underpinning analysis done by the Department to support a number of estimates based on a range of different scenarios. However, further disclosure of the details of the cases or the ranges is not provided as, in accordance with IAS 37 (Provisions, Contingent Liabilities and Contingent Assets), the Department considers that the disclosure of values for any legal contingent liabilities could be expected to seriously prejudice ongoing litigation. As at 31 March 2023 the Department is aware of 5 cases estimated at £2,261 million.
Compensation recovery
We recognise recoveries from insurance companies for compensation claims made by benefit recipients. Once the recovery is made the insurance company has the right to mandatory reconsideration or appeal within a set time period. If the reconsideration or appeal is successful recoveries are refunded to the insurance company. Analysis of existing data suggests that it is reasonable to recognise a contingent liability of £11.163 million for successful mandatory reconsideration or appeals. This is all expected to be settled within the following financial year.
European Social Fund (ESF) repayments
The ESF Audit Authority is required to provide opinions on the 2014-20 ESF programme. This is largely based on the level of errors identified during the audit of claims submitted by projects to the Managing Authority of the ESF England programme (on behalf of DWP). If this exceeds the EU-defined 2% tolerance error rate, the audit opinion is defined as ‘qualified’ by the ESF Audit Authority, with the risk that the EU can impose a financial correction. The 2021-22 rate was 0.3%, (0.6% for 2020-21, whilst the rate was 3.2% for 2019-20, which triggered a financial correction of £3.7 million for the variance between the actual error rate and the tolerance rate of 2.0%). Therefore, a risk remains that the 2% error tolerance level may be breached in future years.
The Rent Service employee pensions
The Rent Service transferred from us to the Valuation Office Agency on 1 April 2009. The Rent Service employed around 400 staff, who were members of the Local Government Pension Scheme, following the transfer they could continue to participate in the scheme. Whilst the scheme is currently balanced, if there is a pension deficit we’ll be liable to meet the shortfall, it is not practical to disclose an estimate of the financial effect or the timing of any outflow.
Compensation claims
Compensation payments may become due because of claims against us by staff and members of the public. Claims relate to employment tribunal, personal injury and Civil Service Appeals Board cases. There is significant uncertainty around the estimated liability and the timing of payments. This uncertainty can fluctuate based on factors such as medical evidence received, witness statements and whether claims proceed to trial or are settled early. Therefore, it is not practical to disclose an estimate of the financial effect or the timing of any outflow.
Document and Data Management Services 2nd Year Extension
The Document and Data Management Services Contract delivers a business critical service delivering post opening scanning and indexing. The Department are in the process of extending the contract to allow the Department time to procure a new service. The supplier raised concerns in relation to the risk of redundancy liabilities should TUPE not apply at the end of the contract. To mitigate this risk, secure the contract extension and ensure the Department has continued provision, a redundancy liability indemnity of £1.88 million will be put in place. The likelihood of needing to utilise the full amount of the indemnity for this contract is low, this is because we expect that TUPE will apply and the staff will transfer to the new contract in 2024-25.
Annual leave allowance for part year workers
The Supreme Court issued a judgement in July 2022 (Harpur Trust v Brazel) that there was no legal provision for statutory annual leave entitlement to be pro-rated for part-year workers, and part-year workers are therefore entitled to the full 5.6 weeks leave conferred by Working Time Regulations 1998. This judgement applies across all employment sectors. We’re developing a solution to this issue, which will be implemented at the earliest opportunity within 2023-24. A number of complex considerations are being worked through meaning it is not possible to provide a robust estimate of the financial impact at this point.
Dilapidation liabilities for leased property
The Department is obligated to reimburse some Landlords for any dilapidations incurred during DWP’s tenure on property leased from them. The timing and amount of these liabilities is presently unquantifiable. Where it has been established that an outflow of resources will be required to settle an obligation and a reliable estimate can be made of the amount of the obligation, the amount is recognised in the dilapidations provision.
National Insurance Credits
There are a number of Universal Credit claimants who, since 2017, have had their associated National Insurance Credits incorrectly recorded on their National Insurance record. HM Revenue and Customs and DWP are in the process of correcting those National Insurance records, including any incorrect State Pension payments that have arisen as a result. Due to the limited number of potential people impacted, we anticipate this affects limited number of payments. No reliable estimate is currently available as the Department continues to gather the appropriate data.
20. Related party transactions
We sponsor the arm’s length bodies listed in this report. These include 3 public corporations: Pension Protection Fund, National Employment Savings Trust and Office for Nuclear Regulation.
In addition, we’ve had a significant number of transactions with other government departments. Most of these transactions have been with HM Revenue and Customs, Cabinet Office, Northern Ireland’s Department for Communities, Ministry of Justice, Department of Health and Social Care, His Majesty’s Courts and Tribunals Service, Home Office, the Scottish Government, HM Treasury and Office of National Statistics. We also have transactions with other public bodies such as local authorities.
No minister, board member or other related parties has undertaken any material transactions with the Department during the year. A register of interests for our board members and a list of ministerial board members’ interests are published on GOV.UK Details of remuneration for key management personnel can be found in the remuneration and staff report within the Accountability report.
21. Events after the reporting period
There have been no events after the reporting period.
This Annual Report and Accounts was authorised by the Accounting Officer for issue on the date of the Comptroller and Auditor General’s audit certificate.
Annex 1
(This information is not subject to audit)
Disaggregated information on arm’s length bodies
Our departmental family is shown within the Accountability report, the following bodies are those within our accounting boundary for 2022-23 that contribute to the Departmental group.
| Bodies | Total operating income £000 |
Total operating expenditure £000 |
Net expenditure for the year (including finance) £000 |
Permanently employed staff: Number of employees |
Permanently employed staff: Staff costs |
Other staff: Number of employees |
Other staff: Staff costs |
|---|---|---|---|---|---|---|---|
| Health and Safety Executive | (89,588) | 235,197 | 164,254 | 2,619 | 161,517 | 145 | 8,483 |
| The Pensions Ombudsman | – | 10,843 | 10,864 | 147 | 8,728 | 1 | 96 |
| The Pensions Regulator | – | 97,119 | 96,775 | 785 | 64,959 | 167 | 8,600 |
| The Money and Pensions Service | – | 155,676 | 155,685 | 442 | 33,461 | 30 | 3,910 |
Also included within the Departmental family are:
- Industrial Injuries Advisory Council (staff and costs are included in our core department figures)
- Social Security Advisory Committee (staff and costs are included in our core department figures)
- Disabled People’s Employment Corporation (GB) Ltd (entered voluntary liquidation in 2017, this is still in the process of being carried out and so remains on our designation order)
- Remploy Pension Scheme Trustees Ltd is registered on Companies House as a dormant company. The pension liability belongs to DWP and is shown in Note 17
The following are arm’s length bodies of DWP outside our accounting boundary:
- Office for Nuclear Regulation
- Pension Protection Fund
- National Employment Savings Trust Corporation
-
See X01 Regional labour market: estimates of employment by age ↩
-
See A06 SA: Educational status and labour market status for people aged from 16 to 24 seasonally adjusted ↩
-
See Government hits goal to see a million more disabled people in work ↩
-
See Economic inactivity ↩
-
See A guide to labour market statistics, section 6. Economic inactivity ↩
-
See the Disability confident campaign ↩
-
See Thriving at Work: a review of mental health and employers ↩
-
See Evaluation of the Mental Health and Productivity Pilot ↩
-
See From harm to hope: A 10-year drugs plan to cut crime and save lives ↩
-
See Completing the move to Universal Credit: Learning from the Discovery Phase ↩
-
See Transforming Support: The Health and Disability White Paper ↩
-
See Exploring practical ways to support self-employed people to save for retirement ↩ ↩2
-
See A06 SA: Educational status and labour market status for people aged from 16 to 24 (seasonally adjusted) ↩
-
See Households below average income: for financial years ending 1995 to 2022 ↩
-
See the Parliamentary and Health Service Ombudsman website ↩
-
See Families supported by £33 million to drive down parental conflict ↩
-
See Crime in England and Wales – Office for National Statistics (ons.gov.uk) ↩
-
Stopping overpayments from occurring results in savings not only to the year in which that activity took place but also to subsequent years as well, as the overpayment may otherwise have remained in the system for some time. We have therefore mapped all estimated savings against the year when the overpaid benefit would otherwise have been paid out, rather than to the year in which the activity that generated those savings took place, as that better aligns with our reported departmental expenditure. ↩
-
See Tackling fraud and corruption against government (nao.org.uk) ↩
-
See A full explanation can be found on page 59 et seq. in last year’s Annual Report and Accounts ↩
-
Gainful self-employment is where a claimant’s trade, profession or business from which they get self-employed earnings is their main employment, and where this work is organised, developed, regular and carried out in expectation of profit. Whether a self-employed claimant is gainfully selfemployed is determined at their Gateway Interview, where DWP will conduct a ‘gainful selfemployment test’. ↩
-
There have been several changes in the methodology used to measure fraud and error over the period shown in the chart. This means that it is not always accurate to compare the precise level in later years to that of earlier years. Nevertheless, the figures are based on published statistics which were the government’s best estimate at the time. ↩
-
See Fraud and error in the benefit system: financial year 2022-23 estimates – GOV.UK (www.gov.uk) ↩
-
Interventions also identify some underpayments, but this table only describes savings from stopping overpayments. The ‘interventions’ figure shown here is therefore slightly higher than the £0.21bn described in the “Counter Fraud and Compliance” section above which is the net effect on expenditure of stopping both overpayments and underpayments. ↩
-
Around £0.5bn was due to a large-scale attack involving hijacked identities that was thwarted in 2020-21 which generated total savings of around £2bn, a quarter of which would otherwise have been lost to 2021-22 expenditure. ↩
-
This includes savings from the automated use of real time earnings information from HM Revenue and Customs in Universal Credit. ↩
-
These are checks done on conditions of entitlement at the start of a claim. ↩
-
Our Annual Report and Accounts last year reported £2bn of “savings from correction and prevention of fraud and error” in 2021-22. That covered the savings from our dedicated counter-fraud and error resource and the savings from other downward adjustments to current or past entitlement where a past period of overpayment had been identified. That figure was a description of the savings achieved from 2021-22 activity; whereas this table shows the savings to 2021-22 expenditure that was achieved by activities undertaken in 2021-22 and earlier years. ↩
-
Some of the expenditure savings described in the previous section are a result of identifying overpayments that have already been paid out, which can now be recovered. Although that results in reduced losses due to fraud and error, those recoveries do not reduce the amount of benefit that was considered as overpaid and so the amounts shown here are slightly lower than those reported above. ↩
-
As an example: prior to the publication of the fraud and error statistics for 2022-23 which showed a level of 12.8% of expenditure overpaid in Universal Credit, our forecast based on internal management information and agreed by the Office of Budget Responsibility had predicted a lower level of 12.1%. ↩
-
See DWP action plan for Small Medium Enterprises, 2022 to 2023 ↩
-
See Commercial Continuous Improvement Assessment Framework ↩
-
See Taking account of Carbon Reduction Plans in the procurement of major governmentcontracts ↩
-
See Taking account of social value in the award of central government contracts ↩
-
Simon McKinnon stepped down in April 2023. Richard Corbridge, was appointed Director General, Chief Digital and Information Officer Digital Group on 11 April 2023. ↩
-
Excluding public corporations which fall outside our accounting boundary. ↩
-
Disabled People’s Employment Corporation (GB) Ltd entered members’ voluntary liquidation on 7 October 2017. The company is expected to be formally struck off in 2023-24. ↩
-
The functions and staff of BPDTS Ltd have transferred to DWP. The company is expected to be formally struck off in 2023-24. ↩
-
The role of The Pensions Ombudsman and Pension Protection Fund Ombudsman are legally separate but, in practice, are delivered by the same person supported by a single organisation. ↩
-
To calculate the pension benefits accrued during the year, we first take the real increase in pension and multiply it by 20. Then we subtract the contributions made by the individual. The real increase excludes increases due to inflation or any increase or decrease due to a transfer of pension rights ↩
-
Totals may not sum due to rounding on pension and totals columns ↩ ↩2
-
Totals may not sum due to rounding on pension and totals column ↩
-
To calculate the pension benefits accrued during the year, we first take the real increase in pension and multiply it by 20. Then we subtract the contributions made by the individual. The real increase excludes increases due to inflation or any increase or decrease due to a transfer of pension rights ↩
-
Totals may not sum due to rounding on pension and totals columns ↩
-
Sophie Dean and Katherine Green job share, working 0.6 FTE each ↩
-
The figures in the table above show the average number of whole time equivalent people employed during the year, in the Performance report and the Accountability report we disclose both the number of whole time equivalent people employed at the end of the year (as at the 31 March) and the number of actual people (rather than whole time equivalents). ↩
-
All of the compulsory redundancies relate to Inefficiency Dismissal With Compensation (IDWCs) cases. ↩
-
The WTE staff reported are for those under Public Sector Resourcing (PSR) contracts. The Department holds other contracts that provide external resourcing. ↩
-
See HM Treasury’s Managing Public Money (with annexes) ↩
-
Compensation Recovery -Omitted by error ↩
-
Independent Assessment Services - Liability resolved after Supply Estimate submission ↩
-
Social Fund Expenditure includes £2.6 billion relating to Pensioner Cost of Living Payments paid alongside their winter fuel payment. In total the Department made £8.4 billion Cost of Living Payments. ↩
-
Social Fund Expenditure includes £2.6 billion relating to Pensioner Cost of Living Payments paid alongside their winter fuel payment. In total the Department made £8.3 billion Cost of Living Payments. ↩
-
Baruch, Y. and Holtom, B, C. (2008) ‘Survey response rate levels and trends in organizational research’, Human Relations, 61 (8), 1139-1160. ↩
-
Additional groups include those who become newly eligible to the State Pension – either due to an HRP adjustment to attain minimum qualification status, or those who inherit State Pension. ↩
-
DWP holds details of State Pension entitlement, HM Revenue and Customs holds details of National Insurance contributions. ↩
-
From the DWP Fraud and Error Exercise from 2021-22. For more information on the exercise, please see Fraud and Error 2021-22. ↩
-
The HRP estimates were produced prior to the publication of the 2022-23 Fraud and Error data. The results from this more recent data show a very similar error rate and do not materially impact the estimate. ↩
-
This was estimated using HM Revenue and Customs targeted scan data and assuming that individuals reach State Pension age at different times of the financial year such that on average, a case will reach State Pension age halfway through the financial year. ↩
-
A scan of the HM Revenue and Customs National Insurance (NPS) system was developed with criteria that filtered the scan to identify potential cases missing HRP from their National Insurance records. ↩
-
Then expected to be most similar to CAT BL cases from the State Pension LEAP exercise. ↩
-
Monetary estimates in Table 2 are shown in pre-discounted values. ↩
-
Figures rounded to the nearest 10,000 (volumes) or £1,000 (amounts). ↩
-
The central assumption represents how each element has been treated in the provision posted in our accounts for missing HRP. The low and high scenarios explore the effect on the arrears value when these elements are set to their lower and upper bounds respectively. ↩
-
The effect of the delivery completion on arrears for deceased cases has not been modelled as deceased cases cannot accrue further arrears, and therefore, the timeline for the clearance of cases will not affect the arrears value for deceased cases. ↩
-
Figures are rounded to the nearest ten million. ↩
-
Benefit expenditure stated within this note is based on the latest available forecast expenditure for 2022-23, at the time the estimate was prepared. For this reason, it does not agree to that seen in the Statement of Comprehensive Net Expenditure (SOCNE) of £234.8 billion, or the Statement of Parliamentary Supply (SOPS) of £230.5 billion. The difference between these values is due to disaggregation in the SOPS between DEL and AME, resource and capital expenditure. ↩
-
We define fraud as where claimants deliberately claim money they aren’t entitled to. We split error into 2 categories: claimant error, which occurs when claimants provide inaccurate information, and official error, which occurs when we process information incorrectly or fail to apply rules. ↩
-
Benefit recovery is through the Department’s debt management function and local authorities. ↩
-
This method deducts money recovered this year (regardless of when the period overpaid relates to) from the money estimated to have been overpaid this year. Money recovered this year comprises in-year 2022-23 figures for directly administered benefits plus figures for Housing Benefit for the period October 2021 to September 2022. Further information can be found at GOV.UK by searching for Fraud and Error in the Benefit System 2022-23. ↩
-
Housing Benefit is a random sample stratified by Local Authority ↩