Background information: Fraud and error in the benefit system statistics, 2022 to 2023 estimates
Published 11 May 2023
Applies to England, Scotland and Wales

© Crown copyright 2023
This publication is licensed under the terms of the Open Government Licence v3.0 except where otherwise stated. To view this licence, visit nationalarchives.gov.uk/doc/open-government-licence/version/3 or write to the Information Policy Team, The National Archives, Kew, London TW9 4DU, or email: psi@nationalarchives.gov.uk.
Where we have identified any third party copyright information you will need to obtain permission from the copyright holders concerned.
This publication is available at https://www.gov.uk/government/statistics/fraud-and-error-in-the-benefit-system-financial-year-2022-to-2023-estimates/background-information-fraud-and-error-in-the-benefit-system-statistics-2022-to-2023-estimates
Purpose of the statistics
Context and purpose of the statistics
This document supports our main publication which contains estimates of the level of fraud and error in the benefit system in Financial Year Ending (FYE) 2023.
We measure fraud and error so we can understand the levels, trends and reasons behind it. This understanding supports decision making on what actions DWP can take to reduce the level of fraud and error in the benefit system. The National Audit Office takes account of the amount of fraud and error when they audit DWP’s accounts each year.
Within DWP these statistics are used to evaluate, develop and support fraud and error policy, strategy and operational decisions, initiatives, options and business plans through understanding the causes of fraud and error.
The fraud and error statistics published in May each year feed into the DWP accounts. The FYE 2023 estimates published in May 2023 feed into the FYE 2023 DWP annual report and accounts.
The statistics are also used within the annual HM Revenue and Customs National Insurance Fund accounts. These are available in the National Insurance Fund Accounts section of the HMRC reports page.
The fraud and error estimates are also used to answer Parliamentary Questions and Freedom of Information requests, and to inform DWP Press Office statements on fraud and error.
Limitations of the statistics
The estimates do not include reviews of every benefit each year. After a pause in reviews for most benefits in FYE 2021 due to the coronavirus (COVID-19) pandemic, we reviewed a range of benefits for FYE 2022, although we were unable to measure Personal Independence Payment. For FYE 2023 Personal Independence Payment has been measured for the first time since FYE 2020, meaning we have now returned to reviewing the range of benefits that we did before the pandemic.
This document includes further information on limitations – for example, on benefits reviewed and changes this year (sections 1 and 2), omissions to the estimates (section 3), and our sampling approach (section 4).
Longer time series comparisons may not be possible for some levels of reporting due to methodology changes. Our main publication and reference tables indicate when comparisons should not be made.
We are unable to provide sub-national estimates of fraud and error as we are unable to break the statistics down to this level.
Comparisons between the statistics
These statistics relate to the levels of fraud and error in the benefit system in Great Britain.
Social Security Scotland report the levels of fraud and error for benefit expenditure devolved to the Scottish Government within their annual report and accounts.
Northern Ireland fraud and error statistics are comparable to the Great Britain statistics within this report as their approach to collecting the measurement survey data, and calculating the estimates and confidence intervals, is very similar. Northern Ireland fraud and error in the benefit system high level statistics are published within the Department for Communities annual reports.
HM Revenue and Customs produce statistics on error and fraud in Tax Credits.
When comparing different time periods within our publication, we recommend comparing percentage rates of fraud and error rather than monetary amounts. This is because the amount of fraud and error in pounds could go up, even if the percentage rate of fraud and error stays the same or goes down, if the amount of benefit we pay out in total goes up compared to the previous year.
Source of the statistics
We take a sample of benefit claims from our administrative systems. DWP’s Performance Measurement (PM) team contact the benefit claimants to arrange a review. The outcomes of these reviews are recorded on a bespoke internal database called FREDA. We use data from here to produce our estimates.
We also use other data to inform our estimates – for example:
-
benefit expenditure data (aligning with the Spring Budget published forecasts)
-
benefit recovery data (DWP benefits and Housing Benefit) to allow us to calculate estimates of net loss
-
other DWP data sources and models to improve the robustness of, or categorisations within, our estimates – for example, to allow us to see if claimants who leave benefit as a consequence of the fraud and error review process then return to benefit shortly afterwards, and to understand the knock-on effect of fraud and error on disability benefits on other benefits
Further information on the data we use to produce our estimates is contained within sections 4, 5 and 6 of this report.
Definitions and terminology within the statistics
The main publication presents estimates of Fraud, Claimant Error and Official Error. The definitions for these are as follows:
-
Fraud: This includes all cases where the following three conditions apply:
-
the conditions for receipt of benefit, or the rate of benefit in payment, are not being met
-
the claimant can reasonably be expected to be aware of the effect on entitlement
-
benefit stops or reduces as a result of the review
-
-
Claimant Error: The claimant has provided inaccurate or incomplete information, failed to report a change in their circumstances, or failed to provide requested evidence, but there is no fraudulent intent on the claimant’s part
-
Official Error: Benefit has been paid incorrectly due to inaction, delay or a mistaken assessment by the DWP, a Local Authority or His Majesty’s Revenue and Customs (HMRC) to which no one outside of that department has materially contributed, regardless of whether the business unit has processed the information
We report overpayments (where we have paid people too much money), and underpayments (where we have not paid people enough money).
We present these in percentage terms (of expenditure on a benefit) and in monetary terms, in millions of pounds.
We also report two different measures on the percentage of cases with Fraud or an overpayment Error, and the percentage of cases with an underpayment Error, calculated as follows:
Proportion of claims with an overpayment or underpayment (reference tables 12 and 13)
Proportion of claims with Fraud or an overpayment error = (number of claims in the sample with at least one Fraud or at least one overpayment error) / (number of claims in the sample)
Proportion of claims with an underpayment error = (number of claims in the sample with at least one underpayment error) / (number of claims in the sample)
Since the same claim can be included in both the proportion of claims with an overpayment error or Fraud and the proportion of claims with an underpayment error, these figures cannot be summed together to obtain the total proportion of claims paid incorrectly.
Proportion of claims paid the incorrect amount (reference table 11)
Proportion of claims overpaid = (number of claims in the sample ultimately overpaid) / (number of claims in the sample)
Proportion of claims underpaid = (number of claims in the sample ultimately underpaid) / (number of claims in the sample)
These figures can be summed together to obtain the total proportion of claims paid incorrectly.
Further information about the types of errors we report on, abbreviations commonly used and statistical methodology can be found in the appendices at the end of this document.
Revisions to the statistics
Revisions to our statistics may happen for a number of reasons. When we make methodology changes that impact our estimates, we may revise the estimates for the previous year to allow meaningful comparisons between the two. Where we introduce major changes, we may denote a break in our time series and recommend that comparisons are not made back beyond a certain point.
In our FYE 2023 publication we have revised:
-
the proportion of State Pension (SP) cases with an overpayment or underpayment and the proportion of cases with a de minimis overpayment or underpayment
-
the monetary value and rate of SP overpaid
-
the monetary value and rate of Housing Benefit (HB) over and underpaid
-
error reason values for Universal Credit (UC), Employment and Support Allowance (ESA) and Pension Credit (PC)
For more information and the reason behind the revisions please see section 2
The National Statistics Code of Practice allows for revisions of figures under controlled circumstances: “Statistics are by their nature subject to error and uncertainty. Initial estimates are often systematically amended to reflect more complete information. Improvements in methodologies and systems can help to make revised series more accurate and more useful.”
Unplanned revisions of figures in reports in this series might be necessary from time to time. Under this Code of Practice, the Department has a responsibility to ensure that any revisions to existing statistics are robust and are freely available, with the same level of supporting information as new statistics.
Status of the statistics
National statistics
National Statistics status means that our statistics meet the highest standards of trustworthiness, quality, and public value, and it is our responsibility to maintain compliance with these standards.
The continued designation of these statistics as National Statistics was confirmed in December 2017 following a compliance check by the Office for Statistics Regulation. The statistics last underwent a full assessment against the Code of Practice for Statistics in February 2012. Since the latest review by the Office for Statistics Regulation, we have continued to comply with the Code of Practice for Statistics, and have made the following improvements:
-
we conducted a user consultation on the frequency of the publication, the benefits measured and on the breakdowns used within the publication. This has resulted in us changing from a bi-annual to an annual publication and beginning to measure Fraud and Error on benefits that have not been measured at all or for a long time. We measured Carer’s Allowance in FYE 2020 and Attendance Allowance in FYE 2022
-
we have made some methodological changes, resulting in better understood methodologies and assumptions, improved accuracy of the Fraud and Error statistics, and more consistency across benefits
-
we have made a number of changes to improve the relevance and accessibility of our statistics. For example, we have moved away from using the same wording and charts for all the benefits in our publication to instead focus on the key messages for each benefit, updated the categories of error we report in our publication based on user needs, and made the data from our publication available to analysts within DWP to conduct their own analysis
-
we have produced the documents in HTML format and provided an accessible version of the reference tables
Read further information about National Statistics on the UK Statistics Authority website.
Quality Statement
Quality in statistics is a measure of their ‘fitness for purpose’. The European Statistics System Dimensions of Quality provide a framework in which statisticians can assess the quality of their statistical outputs. These dimensions of quality are relevance, accuracy and reliability, timeliness, accessibility and clarity, and comparability and coherence.
Section 6 gives information on the application of these quality dimensions to our fraud and error statistics.
Feedback
We welcome any feedback on our publication. You can contact us at:
caxtonhouse.femaenquiries@dwp.gov.uk
Lead Statistician: Michael Holland
DWP Press Office: 020 3267 5144
Report Benefit Fraud: 0800 854 4400
Useful links
Landing page for the fraud and error statistics.
FYE 2023 estimates, including reference tables.
1. Introduction to our measurement system
The main statistical release and reference tables and charts provide estimates of fraud and error for benefit expenditure administered by the Department for Work and Pensions (DWP). This includes a range of benefits for which we derive estimates using different methods, as detailed below. For further details on which benefits are included in the total fraud and error estimates please see Appendix 2. More information can be found online about the benefit system and how DWP benefits are administered.
The fraud and error estimates provide estimates for the amount overpaid or underpaid in total and by benefit, broken down into the types of Fraud, Claimant Error and Official Error for benefits reviewed this year.
Estimates of fraud and error for each benefit have been derived using three different methods, depending on the frequency of their review (see section 5 for details):
Benefits reviewed this year
Fraud, Claimant Error and Official Error (see definitions above) have been measured for FYE 2023 for Universal Credit (UC), Housing Benefit (HB), Employment and Support Allowance (ESA), Pension Credit (PC), State Pension (SP) and Personal Independence Payment (PIP).
Expenditure on measured benefits accounted for 80% of all benefit expenditure in FYE 2023.
Estimates are produced by statistical analysis of data collected through annual survey exercises, in which independent specially trained staff from the Department’s Performance Measurement (PM) team review a randomly selected sample of cases for benefits reviewed this year. See section 4 for more information on the sampling process.
The review process involves the following activity:
-
previewing the case by collating information from a variety of DWP or Local Authority (LA) systems to develop an initial picture and to identify any discrepancies between information from different sources
-
interviewing the claimant (or a nominated individual where the claimant lacks capacity) using a structured and detailed set of questions about the basis of their claim. The interview is completed as a telephone review in the majority of cases. However, where this is not appropriate, there is usually also the option for a completed review form to be returned by post
-
the interview aims to identify any discrepancies between the claimant’s current circumstances and the circumstances upon which their benefit claim was based
If a suspicion of Fraud is identified, an investigation is undertaken by a trained Fraud Investigator with the aim of resolving the suspicion.
Benefits were measured with different sample periods, although all were contained within the period October 2021 to November 2022. For more information on the sample period for individual benefits please see Annex 1 of the statistical report.
The following number of benefit claims were sampled and reviewed by the PM team.
| Benefit | Sample size | Percentage of claimant population reviewed | |
|---|---|---|---|
| Universal Credit | 3,569 | 0.08% | |
| State Pension | 1,646 | 0.02% | |
| Housing Benefit | 2,978 | 0.11% | |
| Pension Credit | 1,987 | 0.14% | |
| Employment and Support Allowance | 1,997 | 0.12% | |
| Personal Independence Payment | 1,431 | 0.07% | |
| Total | 13,608 | 0.06% |
Overall, approximately 0.06% of all benefit claims in payment were reviewed by the PM team.
Read information about the Performance Measurement Team.
Benefits reviewed previously
Since 1995, the Department has carried out reviews for various benefits to estimate the level of fraud and error in a particular financial year following the same process outlined above. In FYE 2023 around 14% of total expenditure related to benefits reviewed in previous years. Please see Appendix 2 for details of benefits reviewed previously.
Benefits never reviewed
The remaining benefits, which account for around 6% of total benefit expenditure, have never been subject to a specific review. These benefits tend to have relatively low expenditure which means it is not cost effective to undertake a review. For these benefits the estimates are based on assumptions about the likely level of fraud and error (for more information please see section 5).
2. Changes to the statistics this year
This section provides detail of changes for the FYE 2023 publication. Any historical changes can be found in Appendix 5.
Revisions
Proportion of State Pension (SP) cases with an overpayment or underpayment and the proportion of cases with a de minimis overpayment or underpayment
For FYE 2022 we reported for the first time on a specific error reason in State Pension categorised as Uprating. These were reported as small value errors caused by how the Pension Strategy Computer System (PSCS) uprates the Graduated Retirement Benefit (GRB) component of State Pension.
We have continued to review our categorisation methodology for State Pension against the benefit’s regulations and legislation and we have identified that we had incorrectly recorded errors (the majority of which were 1p or 2p) on some cases. We have revised the estimates for FYE 2022 in order to allow a direct comparison to FYE 2023. The majority of these errors were reported within the Uprating category, which were reported separately from the proportion of cases in error in FYE 2022. For Overpayments the revised number of cases affected by Uprating is 11 in 100, compared to the previously published figure of 17 in 100. For Underpayments the revised number of cases affected by Uprating is 17 in 100 cases, compared to the previously published figure of 23 in 100.
The proportion of cases with an overpayment error and proportion with an underpayment error headline figures were also impacted from this issue. However, they have been revised in line with the 10p de minimis methodology change. Further information on this change is provided in section 2.
Monetary value and rate of SP overpaid
Working for a certain period in the UK means that individuals are entitled to a UK State Pension from State Pension age even if they subsequently move outside of the UK (before or after reaching State Pension age).
Reviews for State Pension only cover cases from Great Britain (GB). We apply the GB rate to the whole of the State Pension expenditure, including those cases living overseas. We also estimate an additional amount of Claimant Error for the impact of non-notification of death on State Pension cases living overseas. We see very low rates of Fraud and Claimant Error on the GB caseload and therefore it is reasonable to assume that, aside from non or late notification of death, we would find equally low rates for claimants of State Pension living overseas.
The International Pension Centre collects information on deaths of overseas State Pension claimants, but do not consistently collect any information on other changes of circumstance on these cases. This means that it is only possible to measure Fraud and Error overpayments relating to non-notification, or late notification, of death.
Two methods are used by DWP to confirm that overseas SP claimants are still alive and entitled to the benefit. These are as follows:
Life Certificates
A life certificate (LC) is a paper-based form that should be completed by the claimant, signed by a witness and then returned by the claimant. If the completed form is not returned after 16 weeks, then the claimant’s benefit is suspended and another LC is sent out, then following a further 16 weeks with no response, the claimant’s benefit is terminated. If the LC is returned by the claimant, then their benefit entitlement continues (subject to any changes in rate due to changes of circumstance reported by the claimant).
Death Exchange
The DWP exchanges death data with Spain, New Zealand, Australia, Germany, Netherlands, Malta, Poland, and the USA. Most of this data is received monthly. COVID had no impact on the DWP receiving death exchange data. The process for death exchanges begins with these countries requesting lists of claimants living in their country and receiving a UK State Pension. Following this, they send the death data for the DWP to process.
Methodology prior to FYE 2022
Prior to FYE 2022 we estimated the additional amount of Claimant Error due to non-notification of death using an estimate calculated in 2006. This was based on data from the January 2004 life certification exercise.
Currently all abroad SP claimants that are not residing in countries covered by the death exchange data are part of the LC exercise. However, in January 2004 the death data exchange was not in place and the LC exercise was conducted by selecting a sample of customers using the last number of their National Insurance number (NINO). Because the last digit of a NINO can be treated as being allocated randomly, the sample was regarded as having been selected randomly.
The LC exercise was treated as a “snapshot” for the week that the life certificates were sent out. All cases where SP had either been stopped because the customer had died prior to the life certificate exercise, or where SP had been suspended, had their amount of benefit they were receiving in that week scaled up to obtain an annual figure. A scaling factor was then applied to bring the number in the LC exercise to the number of SP cases abroad.
The results were then presented as the proportion of expenditure overpaid using expenditure figures for FYE 2004. This rate was then rolled forward and applied to each year’s SP expenditure.
Methodology for FYE 2022
For FYE 2022 we updated our methodology to generate this additional amount using the latest available life certificate and death exchange data. Last year this estimate accounted for around 40% of the total State Pension expenditure overpaid.
Methodology for FYE 2023
Whilst looking to update and refine the methodology used for FYE 2022 for this year we have found inconsistencies and gaps in the underlying data, calling into question the robustness of the data. If this had been identified last year, we would not have made the methodology change for FYE 2022 and would have rolled forward the rate that was estimated when State Pension had previously been measured in FYE 2006. Whilst we work to develop an updated estimate for the Claimant Error due to late notification of death for claimants overseas, we have reverted to using the estimated rate used prior to FYE 2022. The FYE 2022 estimate has been revised using the same methodology. The figure was originally £50m and has now been revised to be £60m.
Monetary value and rate of Housing Benefit (HB) over and underpaid
In last year’s publication, an adjustment was made to the Housing Benefit (HB) expenditure data. The expenditure data was adjusted to categorise Universal Credit (UC) as a passporting benefit because people in receipt of UC who are in supported, sheltered, or temporary housing are treated similarly to those claimants in receipt of other income-related benefits. Over the past year the methodology used to make this adjustment has been refined and an updated methodology will be used from FYE 2023 going forward. To allow consistent comparisons between FYE 2023 and FYE 2022, the FYE 2022 estimates have been revised using this methodology, resulting in some minor changes to the estimates. The total rate of overpayments for HB in FYE 2022 was 5.2% in last year’s publication, and has now been revised to 5.3%. All other changes to the estimates are increases of a similar size.
Changes
Changes to benefits reviewed
Each year we use decision making methodology called multiple-criteria decision analysis (MCDA) to help evaluate which benefits will be reviewed.
The coronavirus outbreak resulted in our normal measurements being suspended or changed in FYE 2021, and although measurements restarted for FYE 2022, PIP was still unable to be measured.
For FYE 2023 we have restarted the measurement of PIP for the first time since FYE 2020.
Proportion of claims with fraud or an error
In this year’s publication we are introducing a “net” measure of the proportion of claims with fraud or an error to supplement existing tables. This measure is consistent with the calculation of the headline Monetary Value of Fraud and Error (MVFE) and is now reported alongside MVFE in the main statistical release.
Un-netted measure of the proportion of claims with fraud or an error
We have previously published figures on the proportion of cases with an overpayment error or fraud and the proportion with an underpayment. These are calculated on the following basis:
A claim with both an overpayment error and an underpayment error is counted twice – it contributes to published table 12 for overpayments and table 13 for underpayments irrespective of its final outcome.
For example, a case is found to have two errors:
-
Error 1: Claimant Error overpayment of £75 per week
-
Error 2: Official Error underpayment of £25 per week
-
Net Error = £75 overpayment - £25 underpayment
= £50 Claimant Error overpayment per week
Error 1 is counted in the overpayment table AND Error 2 is counted in the underpayment table, despite the final outcome being an overpayment – as shown by the net outcome. This multiple counting means the two existing measures cannot be summed to find out how many cases are incorrect.
(Note that in the case of multiple overpayments only one per case is counted, and also for multiple underpayments).
Net measure of the proportion of claims with fraud or an error
In FYE 2023 we have introduced a new net measure. Using the previous example:
-
Error 1 is counted in the net overpayment estimate due to the net outcome for that case being overpayment
-
Error 2 is not counted at all as it is removed in the net calculation
Therefore, the net measure represents the number of cases that are ultimately overpaid OR underpaid. This means the overpayment and underpayment net measures can be summed to find the total proportion of claims paid incorrectly. This is published for the first time in FYE 2023 as reference Table 11.
Reasons for change:
-
to provide a net value consistent with the measure of MVFE statistics (the primary focus of the publication). This allows direct comparison and analysis across the two measures to create a more linked-up story
-
the net measure is easier to explain and understand than the un-netted measure. Supplementing existing tables with a simplified figure relating to whether a case is over OR under paid provides ease of use as well as valuable context
-
the un-netted estimates do not allow calculation of the total proportion of claims that are incorrect. This is readily available from net figures
The reference tables have been updated to report this new information; they now include the new net table (Table 11) and de minimis measures (see section below) for tables 11, 12 and 13. Alongside this, our table ordering has changed to make the table layout more cohesive and user friendly.
De minimis
Last year we took a de minimis approach to the proportion of claims paid incorrectly on State Pension, removing all uprating errors that are 10p or less, and announced we would review whether we should take the same approach across all other error types, across all benefits in future publications. Information on the original reason for this approach is available in section 2 of last year’s Background information document.
Following our review, this approach has been extended to all benefits and reasons for error. Updated figures using this methodology have also been produced for FYE 2022 and can be found in this year’s reference tables. Where the proportion of claims paid incorrectly is discussed in the publication we use headline figures, i.e. those with de minimis errors removed.
The use of a de minimis across all benefits eliminates the inconsistency of applying this approach only to State Pension. It means that when discussing the number of cases with an error, only material overpayments and underpayments are considered.
The proportion of cases with a de minimis error are also published in the reference tables and can be added to the headline figures. In Table 11 this will give the proportion of cases that have a net overpayment or net underpayment of any size. In Table 12 this will give the percentage of all cases with at least one overpayment error of any size, and in Table 13 it will give the percentage of cases with at least one underpayment error of any size. See the section above on net measure of the proportion of claims with fraud or an error for a full explanation of the difference between Table 11 versus Tables 12 and 13.
A back series of the proportion of claims paid incorrectly under the new methodology has not been produced. However, the summed total of headline and de minimis figures is comparable with the figures published in previous publications. The summing described above thus allows the new Table 12 to be compared with the old Table 5, and allows the new Table 13 to.be compared with the old Table 11. The exception is State Pension in the publication for FYE 2022, which is comparable with this year’s headline figures.
Housing Costs Capping on Universal Credit
The value of Housing Costs overpayments will now be limited (capped) to the amount of housing element in payment on a UC claim. This change has been made to more accurately reflect the amount of housing element that is overpaid on UC.
It was previously possible for Housing Costs overpayments to exceed the value of the housing element on a particular UC claim. If a claimant fails to provide the requested evidence after a Performance Measurement review, their benefit is suspended and then subsequently terminated. A whole award error is then recorded relating to the evidence that we failed to receive. If the claimant does not provide evidence of their liability for Housing Costs, then a whole award Housing Costs Fraud is recorded. It is possible that the whole award value exceeds the housing element value. The amount by which the housing element is overpaid is overstated under these circumstances.
The updated methodology caps the Housing Costs Fraud at the housing element value. Any excess (the value by which the Housing Costs Fraud exceeds the housing element) is distributed across any other whole award Fraud errors on the claim or placed in Failure to Provide Evidence/Engage.
This change does not have any impact on the headline UC overpayment rate. It only affects the allocation of Fraud across the error reasons. Housing Costs overpayments reduce since the capping of Housing Costs Fraud can only act to decrease these error values. The reduction in Housing Costs Fraud is redistributed across other error reasons, dependant on which other errors are present on the claim affected.
Making this change to the FYE 2022 estimates removed £82m of Housing Costs Fraud, with £78m moving into Failure to Provide Evidence/Engage, £4m moving into Earnings/Employment and £1m moving into Living Together.
Reclassification of Failure to Provide Evidence Fraud
If a claimant fails to provide requested evidence after a Performance Measurement review, their benefit is suspended and then subsequently terminated. A whole award error is then recorded relating to the evidence that we failed to receive (e.g., if a bank statement which was requested to verify Capital was not received, then a whole award Capital Fraud is recorded). However, if we had no real suspicions about the evidence apart from the claimant not providing it, we reclassify the whole award error into Failure to provide evidence. For more information on this please see section 5: Causal Links.
We have adopted a data driven approach to attempt to reclassify some of the failure to provide evidence errors into known reasons for Fraud. This involves looking at data we have on a case four months after classification, to see if this gives us a clearer picture of why they chose not to provide evidence. If this can be determined, we reclassify the error again from Failure to Provide into the error reason the data suggests.
This change does not affect the total amount of fraud and error we report. Making this change to the FYE 2022 figures had the biggest impact on Universal Credit. It moved £117m of Fraud from Failure to provide evidence/engage, with £93m moving into Self Employed Earnings, £14m moving into Conditions of Entitlement, and £10m moving into Living Together. All other benefits saw a much smaller movement of Fraud from the Failure to provide evidence/engage category to know reasons of Fraud.
Inclusion of an estimate of the fraud and error on Cost of Living Payments
Cost of Living Payments were made by the department for the first time in FYE 2023, see Cost of Living Guidance. These payments were to give claimants extra support during the current cost of living crisis and were paid in addition to any benefit that qualified a claimant for the payment.
Since the statistics give an estimate of fraud and error on all benefit expenditure, we have included an estimate of the amount of fraud and error associated with these payments in our publication.
Benefit reviews on Cost of Living Payments have not been carried out so an estimate has been derived. If a claimant is not eligible to receive benefit, then they would also not be eligible to receive a Cost of Living Payment. Therefore, to derive an estimate for the rate of fraud and error on these payments we have used the rate of cases that lose entitlement on the qualifying benefits (the majority of which have been measured in the current or recent years). The table below shows the benefits which make up Cost of Living Payments, the loss of entitlement rate used and when they were last measured:
| Qualifying Benefit | Loss of Entitlement Rate | Rate used | |
|---|---|---|---|
| Universal Credit | 11.40% | From 2022-23 work programme | |
| Income-related Employment and Support Allowance | 1.70% | From 2022-23 work programme | |
| Pension Credit | 3.50% | From 2022-23 work programme | |
| Personal Independence Payment | 1.90% | From 2022-23 work programme | |
| Winter Fuel Payments | 0.50% | From 2021-22 service centre measurement | |
| Attendance Allowance | 2.30% | From 2021-22 work programme | |
| Income-based Jobseeker’s Allowance | 3.30% | From 2018-19 work programme | |
| Disability Living Allowance | 1.90% | Proxy – PIP rate from 2022-23 work programme | |
| Armed Forces Independence Payments | 1.90% | Proxy – PIP rate from 2022-23 work programme | |
| Constant Attendance Allowance | 2.30% | Proxy – AA rate from the 2021-22 work programme | |
| Income Support | 3.30% | Proxy –JSA rate from 2018-19 work programme |
Cost of Living Payments were made by the department to Adult Disability Payment and Child Disability Payment claimants (which are devolved Scottish benefits). The loss of entitlement rate applied to the Cost of Living Payment expenditure associated with those benefits was the average loss of entitlement across all the benefits above. Cost of Living Payments were also made to Tax Credit claimants (administered by HMRC) and to War Pension Mobility Support claimants (administered by the Ministry of Defence). Since the department is not responsible for those payments they are excluded from our statistics (which focuses on fraud and error relating to Department for Work and Pensions expenditure).
The estimate we have used is robust, but it will omit a small amount of fraud and error which could occur directly on Cost of Living Payments. For more information on this please see the omissions part of section 3.
Since we have not carried out benefit reviews on Cost of Living Payments, the estimate is included within the unreviewed benefits section of the reference tables.
Changes to proxy benefits used for unreviewed benefits
For benefits which we have never measured we use a rate from a similar benefit we are currently measuring or have previously measured as a proxy. Alongside Cost of Living Payments being included for the first time we have carried out a full review of all the proxy benefits used in an effort to more accurately estimate the fraud and error on the unreviewed benefits.
The list below shows, for each unreviewed benefit, the old proxy, the new proxy and the rationale for the change:
Winter Fuel Payments
Old proxy: State Pension.
New proxy: Service Centre Measurement.
Rationale: Winter Fuel Payment was measured for the Social Fund Accounts in FYE 2022. Although this was not a review carried out by Performance Measurement, we are using the rate found in this exercise.
Industrial Disablement Benefit and Armed Forces Independence Payments
Old proxy: Disabled Living Allowance.
New proxy: Personal Independence Payments.
Rationale: All benefits previously using Disabled Living Allowance as a proxy have been changed to use Personal Independence Payments. Disabled Living Allowance hasn’t been reviewed for 15 years and is being phased out and replaced by Personal Independence Payments for Working Age claimants. This brings these benefits up to date, whilst still satisfying similar eligibility requirements.
Maternity Allowance and Severe Disablement Allowance
Old proxy: Employment and Support Allowance.
New proxy: Employment and Support Allowance (but only certain error reasons).
Rationale: Employment and Support Allowance has similar eligibility requirements to both benefits (on Maternity Allowance these are primarily related to recent work/National Insurance contributions). It covers the target population of working age people for Maternity Allowance and Severe Disablement Allowance cases are increasingly transferred to Employment and Support Allowance. As fraud and error on these benefits could only occur due to Abroad, Conditions of Entitlement, Earnings and Contributions, we have only taken the error rate associated with these error reasons from Employment and Support Allowance.
Widow’s Benefit/Bereavement Benefit/Bereavement Support Payments
Old proxy: Jobseeker’s Allowance.
New proxy: Employment and Support Allowance (Contributory element and certain error reasons only).
Rationale: Jobseeker’s Allowance is being replaced by Universal Credit and has not been measured for a number of years. Fraud and error on Widow’s Benefit/Bereavement Benefit/Bereavement Support Payments can only occur within Conditions of Entitlement, lack of National Insurance contributions or incorrect record of contributions. Employment and Support Allowance has these same conditions and thus potential fraud and error reasons, it is a Working Age benefit and is still being measured. Therefore, we have used the error rate associated with these three error reasons on Employment and Support Allowance.
Financial Assistance Scheme
Old proxy: State Pension.
New proxy: State Pension (Official Error rate only).
Rationale: Fraud and Claimant Error aren’t possible on Financial Assistance Scheme. Since the Financial Assistance Scheme is not means tested, we have used the Official Error rate of State Pension.
Industrial Death Benefit
Old proxy: State Pension.
New proxy: Pension Credit (Living Together rate only).
Rationale: This is a legacy benefit which was stopped in 1988. Rates would have been decided long ago, and the only room for change regards the claimant remarrying. There is not much room for error and fraud. Pension Credit fits the target population and so we have used the Living Together rate on that benefit (which would relate to remarriage).
Christmas Bonus
Old proxy: General.
New proxy: Rate of whole award errors found on the last measurement of Attendance Allowance, Carer’s Allowance, Employment and Support Allowance, Pension Credit, Personal Independence Payments and State Pension.
Rationale: The Christmas Bonus is administered at a flat rate to Attendance Allowance, Carer’s Allowance, Employment and Support Allowance, Pension Credit, Personal Independence Payments and State Pension claimants. We have used a proxy measure that looks at the proportion of claims paid incorrectly of those that lose entitlement on each of those benefits mentioned above. These rates are then applied to the expenditure split down by how much each qualifying benefit contributes. These new monetary rates are then totalled, and confidence interval derived.
Note: There are other smaller benefits that also qualify claimants for a Christmas Bonus, but these account for only a very small proportion of the Christmas Bonus expenditure. The average loss of entitlement across the qualifying benefits listed above is applied to that proportion of expenditure associated with those smaller benefits.
Cold Weather Payments
Old proxy: State Pension.
New proxy: Rate of whole award errors found on the last measurement of Employment and Support Allowance, Income Support, Jobseeker’s Allowance, Pension Credit and Universal Credit.
Rationale: Cold Weather Payments are administered at a flat rate to Employment and Support Allowance, Income Support, Jobseeker’s Allowance, Pension Credit and Universal Credit claimants. We have used a proxy measure that looks at the proportion of claims paid incorrectly of those that lose entitlement on each of those benefits. These rates are then applied to the expenditure split down by how much each qualifying benefit contributes. These new monetary rates are then totalled, and confidence interval derived.
Statutory Sick Pay and Statutory Maternity Pay
Old proxy: General.
New proxy: None.
Rationale: This benefit is very straightforward and therefore there is no real way for fraud and error to occur apart from a claimant having a collusive employer. Therefore, we are estimating this as zero.
State Pension Transfers
Old proxy: State Pension.
New proxy: State Pension.
Rationale: There is probably more room for fraud and error when transferring State Pensions overseas, as there is an extra step in the process. However, there is no other proxy suitable to solve this issue, so we have not changed the proxy.
Note: the General proxy was determined by all benefits which have ever been reviewed: In FYE 22 publication this was Income Support, Jobseeker’s Allowance, Pension Credit, Housing Benefit, Disability Living Allowance, State Pension, Carer’s Allowance, Incapacity Benefit, Employment and Support Allowance, Universal Credit, Attendance Allowance and Personal Independence Payment.
We have not revised previous year’s figures as the unreviewed benefit line should not be compared year on year due to the benefits making up this category changing over time.
3. Interpretation of the results
Care is required when interpreting the results presented in the main report:
-
the estimates are based on a random sample of the total benefit caseload and are therefore subject to statistical uncertainties. This uncertainty is quantified by the estimation of 95% confidence intervals surrounding the estimate. These 95% confidence intervals show the range within which we would expect the true value of fraud and error to lie
-
when comparing two estimates, users should take into account the confidence intervals surrounding each of the estimates. The calculation to determine whether the results are significantly different from each other is complicated and takes into account the width of the confidence intervals. We perform this robust calculation in our methodology and state in the report whether any differences between reporting years are significant or not
-
unless specifically stated within the commentary in the publication or in the reference tables, none of the changes for benefits reviewed this year are statistically significant at a 95% level of confidence when compared to the previous measurement
As well as sampling variation, there are many factors that may also impact on the reported levels of fraud and error and the time series presented.
-
these estimates are subject to statistical sampling uncertainties. All estimates are based on reviews of random samples drawn from the benefit caseloads. In any survey sampling exercise, the estimates derived from the sample may differ from what we would see if we examined the whole caseload. Further uncertainties occur due to the assumptions that have had to be made to account for incomplete or imperfect data or using older measurements
-
the sample year and the financial year do not align. This means that a proportion of expenditure for benefits reviewed this year cannot be captured by the sampling process. This is mainly because of the delay between sample selection and the interview of the claimant, and also the time taken to process new benefit claims, which excludes the newest cases from the review. The estimates in the reference tables in this release have been extrapolated to account for the newest benefit claims which are missed in the benefit reviews and cover all expenditure
-
the estimates do not encompass all fraud and error. This is because Fraud is, by its nature, a covert activity, and some suspicions of Fraud on the sample cases cannot be proven. For example, cash in hand earnings are harder to detect than those that get paid via PAYE. Complex official error can also be difficult to identify. More information on omissions can be found later in this section
-
some incorrect payments may be unavoidable. The measurement methodology will treat a case as incorrect, even where the claimant has promptly reported a change and there is only a short processing delay
Omissions from the estimates
The fraud and error estimates do not capture every possible element of fraud and error. Some cases are not reviewed due to the constraints of our sampling or reviewing regimes (or it is impractical to do so from a cost or resource perspective), some cases are out of scope of our measurement process, and some elements are very difficult for us to detect during our benefit reviews. The time period that our reviews relate to means that any operational or policy changes in the last five months of the financial year are usually not covered by our measurements.
For most omissions from our estimates, we make adjustments or apply assumptions to those cases. For some omissions we assume that the levels of fraud and error for those cases are the same as for the cases that we do review, and for other omissions we apply specific assumptions where we expect the levels of fraud and error to be different.
This section details the omissions from the estimates as far as possible. The examples that follow are not an exhaustive list but are an attempt at providing further details on known omissions in the estimates.
There are a number of groups of cases that we are unable to review or which we do not review. Some of the main examples of these are as follows:
New and short-term cases
We are unable to review short duration cases (of just a few weeks in duration) due to the time lags involved in accessing data on the benefit caseloads, drawing the samples and preparing these for reviewing. For these cases, we assume the rates of fraud and error are the same as in the rest of the benefit caseloads. We do, however, also make an adjustment using “new cases factors” to try to ensure that the results are representative across the entire distribution of lengths of benefit claims (see section 5 for further details).
It can take time for new cases to be available for sampling, meaning they are potentially under-represented in the sample. Analysis was undertaken to quantify the impact of these potential exclusions.
New cases make up a small proportion of cases for most benefits. The table below shows the yearly average percentage that are less than three months old at a given time.
| Benefit | Average number of cases less than three months old | Source | |
|---|---|---|---|
| Employment and Support Allowance | 1.70% | Official quarterly data for August 2021 to May 2022 | |
| Pension Credit | 1.50% | Official quarterly data for August 2021 to May 2022 | |
| Personal Independence Payment | 4.40% | Official monthly data for November 2021 to October 2022 | |
| Housing Benefit | 3.4% | Official monthly new case data Sept 2021 to August 2022 | |
| Universal Credit | 8.0% | Official monthly data on cases < 3 months old January 2022 to December 2022 | |
| State Pension | 2.5% | Estimated using pension and population data |
To investigate the impact of this exclusion, a simulation of the sampling process was performed and repeated multiple times with these cases included. Sensitivity analysis was then carried out across all benefits to estimate the impact of excluding new cases if the error rate were doubled, halved or remained the same.
The age of a case when it becomes available for sampling differs by benefit, for example, ESA claims must be at least 6 weeks old and HB claims at least 10 weeks. Based on these timescales, analyses were undertaken using an exclusion period of either 6 weeks or 3 months.
Overall, this analysis showed that, because short term cases make up such a small percentage of total cases at any given time and many are available to be sampled later in the period, the impact on final published figures for all benefits is negligible.
The impact of excluding new cases is no more than 0.1 percentage points difference in the estimated error rate for either underpayment or overpayment across all benefits except UC. For UC overpayments, the scenario of doubling the error rate increases the total overpayment rate by 0.5 percentage points and halving the error rate decreases it by 0.3 percentage points. The higher numbers reflect the fact that UC has a higher proportion of new cases and a higher rate of error than other benefits.
It would be expected that the rate of fraud and error in new cases would typically be lower than the full population of claimants since they have recently been assessed. The outcomes of this analysis fall within the estimated confidence intervals and there is little impact on the published statistics, therefore no adjustment is required.
Unclaimed Benefits
We are only able to sample claimants who are in receipt of a benefit payment. Eligible claimants that have not made a benefit claim are not included in these figures. Statistics on benefit take-up can be found online.
Disallowed claims
Claims which do not receive an award are not included in our sample. These claims may have been disallowed in error, resulting in a possible underpayment.
Using data on the number of disallowed claims and appeal success rates, sensitivity analysis was carried out to investigate the impact of various assumed error rates for disallowed cases.
A summary across benefits for various error rate scenarios is shown below. The worst-case scenario is not plausible and is included to illustrate that even assuming an unrealistic level of error, the adjusted estimate would still fall within or close to the published confidence intervals.
Results show that there is likely to be little to no impact on our estimate of underpayments as a result of not sampling disallowed claims.
Employment and Support Allowance (ESA)
| Level of underpayment in excluded group | Estimated change in underpayment | Impact on ESA underpayment estimate | Impact on global underpayment estimate | |
|---|---|---|---|---|
| Extreme worst case: appeal success rate applied to all disallowed claims | + £46.8m | + 0.4 p.p | + 0.0 p.p | |
| Disallowed cases have the same error rate as measured cases | + £6.7m | + 0.1 p.p | + 0.0 p.p | |
| Twice as many cases are eligible to be awarded on appeal as actually are | + £4.3m | + 0.0 p.p | + 0.0 p.p |
Personal Independence Payment (PIP)
| Level of underpayment in excluded group | Estimated change in underpayment | Impact on PIP underpayment estimate | Impact on global underpayment estimate | |
|---|---|---|---|---|
| Extreme worst case: All disallowed cases are appealed with the same success rate | + £267.1m | + 2.0 p.p | + 0.1 p.p | |
| Disallowed cases have the same error rate as measured cases | + £88.0m | + 0.6 p.p | + 0.0 p.p |
Note: PIP worst case analysis is slightly different due to its high appeal rate.
Pension Credit (PC)
| Level of underpayment in excluded group | Estimated change in underpayment | Impact on PC underpayment estimate | Impact on global underpayment estimate | |
|---|---|---|---|---|
| Extreme worst case: appeal success rate applied to all disallowed claims | + £11.3m | + 0.2 p.p | + 0.0 p.p | |
| Disallowed cases have the same error rate as measured cases | + £7.2 m | + 0.1 p.p | + 0.0 p.p | |
| Twice as many cases are eligible to be awarded on reconsideration as actually are | + £0.2m | 0.0 p.p | + 0.0 p.p |
Universal Credit
Appeals information was not available for UC therefore the sensitivity analysis could not be carried out fully as in the above tables.
Using numbers of disallowed cases, analysis shows that even if the error rate in disallowed cases was double that found in the sample, the total difference in the UC rate would be around £29 million, or 0.1% of expenditure, well within the confidence interval. Assuming the error rate was the same as found in our sample the difference would be 0.0%. Therefore, no adjustment is appropriate.
State Pension
Recent data was not available on the number of disallowed State Pension claims, however, given the data available it is expected to be very low. For the most recent year for which data on appeal rates was available (December 2021 to November 2022), applying sensitivity analysis based on a series of reasonable worst-case assumption again resulted in estimated additional underpayments of between 0.0-0.1%, with the lower being significantly more plausible.
Housing Benefit
Applications for Housing Benefit are processed by local authorities, not centrally by DWP as with the other benefits reviewed, and it was not possible to obtain numbers of disallowed cases.
Since analyses of other benefits has shown negligible impact in excluding disallowed claims, the assumption is made that the impact on Housing Benefit is also negligible.
In conclusion, no adjustments are required to the estimates to account for the exclusion of disallowed cases from the sample.
Nil payment claims
A case is considered to be nil-payment if there is a claim in place but the total award being paid is zero. These cases are not included when the sample is selected. Some benefits do not allow a nil-award, meaning all active claimants are receiving some payment.
| Nil-award allowed | No nil-award allowed |
|---|---|
| ESA | HB |
| PC | SP |
| UC | PIP |
Note: for a very small proportion of the PIP caseload (0.2%), the combination of award rates (daily living and mobility) is reported as nil-nil. Investigations suggest that award rates may be temporarily shown as nil for a short period whilst a claim review is in process, after which the new award rate is set. These cases will be monitored.
Nil-payment claims are a potential source of underpayment that is not included in the sample.
Employment Support Allowance
For the year up until May 2022, the most recent year for which data was available for analysis, the number of nil-payment claims ranged from 5.9% to 6.1%, with 6.0% being the average. Simulating the sampling process shows around 6.0% of claims that would otherwise be sampled are missed due to this. The potential impact of a different error rate in this group is a decrease of 0.1 percentage points if the error rate is half the measured rate, and an increase of 0.1 percentage points if the error rate in this group is double the measured rate.
Pension Credit
Only a very small percentage of Pension Credit claimants are in nil-payment at any given time. For the most recent year of data available this number was always below one fifth of one percent. Simulating the sampling process shows that over 99.8% of cases sampled would be the same even if the nil-payment cases were included in the group available for sampling. The potential impact of a different error rate in this group thus rounds to zero, even in a worst-case scenario of doubling the error rate in the excluded cases.
Universal Credit
For the year up until August 2022, the most recent year for which data was available for analysis, the number of nil-payment claims ranged from 11.4% to 17.0%, with 13.2% being the average. Simulating the sampling process shows around 13.2% of claims that would otherwise be sampled are missed due to this. The potential impact of a different error rate in this group is an decrease of 0.1 percentage points if the error rate is half the measured rate, and an increase of 0.1 percentage points if the error rate in this group is double the measured rate.
Exclusions specific to PIP
The monthly samples are taken from live PIP claims in advance of the scheduling of the benefit reviews. Any benefit record relating to a claimant who meets specific exclusion criteria (e.g. terminally ill, reviewed in the last three months) will not be reviewed. We assume the rates of fraud and error for these cases are the same as the rest of the PIP caseload. The potential impact of each excluded group are summarised below.
Terminally Ill cases
Terminally ill claimants make up a very small percentage of PIP claimants, typically around 1%. Sensitivity analysis was carried out to test the impact of their exclusion if the fraud and error rate on these cases were to differ by as much as double that of the sampled population.
| Level of overpayment in excluded group | Estimated change in overpayment | Impact on PIP overpayment estimate | Impact on global overpayment estimate | |
|---|---|---|---|---|
| Double the published rate | + £2.3m | 0.0 p.p | 0.0 p.p | |
| Half the published rate | - £1.1m | 0.0 p .p | 0.0 p .p |
| Level of underpayment in excluded group | Estimated change in underpayment | Impact on PIP underpayment estimate | Impact on global underpayment estimate | |
|---|---|---|---|---|
| Double the published rate | + £5.7m | 0.0 p.p | 0.0 p.p | |
| Half the published rate | - £2.9m | 0.0 p .p | 0.0 p .p |
The small proportion means the total estimated level of fraud and error would differ by less than 0.05 percentage points in the above scenarios, therefore no adjustment has been made to the statistics because of this exclusion.
Scheduled reviews
PIP awards are reviewed regularly. The period between reviews is set on an individual basis and ranges from 9 months to 10 years, with the majority of claimants having a short-term award of 0-2 years. If a claim has had a planned award review in the last 92 days, has a review ongoing or a review due in the next six weeks then it is not eligible to be sampled.
A simulation of the sampling process was performed and repeated multiple times to investigate the impact of this exclusion.
Cases with an upcoming review would be expected to have a higher propensity for Fraud or Error due to the length of time since their last review. By the same reasoning cases that have had a review completed recently would be expected to have a lower propensity for Fraud or Error.
In our statistics an assumption is made that the excluded cases are similar to those sampled and so no adjustments are made. We investigated the impact of alternative assumptions on our estimates and results are shown in the tables below.
In these scenarios it was assumed that an award that was increased after a planned review would have an underpayment had we reviewed it, and cases that were decreased or reviewed before being disallowed would have an overpayment. These proportions were taken from PIP data published via StatXplore and fed into the results below.
Two assumptions were tested for recently reviewed cases: that they have no errors, and that they have half the error rate as our sample. The tables below shows these assumptions and their impact combined with the published proportions outlined above.
Estimated impact of excluding cases with a review that is due, ongoing, or recently completed using review outcomes to estimate fraud and error rates
Assumption of zero error on excluded recently reviewed cases.
| Estimated difference (£) | Impact on PIP estimate (percentage point change) | Impact on global estimate | ||
|---|---|---|---|---|
| Overpayment | - £51.5 m | - 0.3 p.p. | + 0.0 p.p. | |
| Underpayment | + £52.4 m | + 0.3 p.p. | + 0.0 p.p. |
| Estimated difference (£) | Impact on PIP estimate (percentage point change) | Impact on global estimate | ||
|---|---|---|---|---|
| Overpayment | + £25.7 m | + 0.2 p.p. | + 0.0 p.p. | |
| Underpayment | + £130.5 m | + 0.7 p.p. | + 0.0 p.p. |
The estimated difference in the rates of overpayment or underpayment are fall well within the published confidence intervals. No adjustment has been made to the statistics because of this exclusion.
Move to Pension Credit capital risk-based verification
Due to a large increase in Pension Credit claims following the recent Pension Credit take-up campaign, the department was faced with an unprecedented demand. It was therefore decided that a simplification of procedures whilst adhering to existing legislation was needed. The department therefore changed its approach to verifying capital on Pension Credit. Previously where a claimant declared capital in excess of £10,000, verification of certain types of capital was requested, including money held in bank accounts. The department instead now takes a risk-based approach and will only verify these types of capital in exceptional circumstances.
This change to verification was introduced in August 2022. However, due to the sample year not aligning with the financial year we are potentially undercounting the impact this change would have on Pension Credit Capital fraud and error rates. We have therefore carried out some analysis on volumes of starts to Pension Credit to estimate this impact. The analysis used the number of starts to Pension Credit in each week since the verification came in, the proportion of the sample that had a capital error on Pension Credit in FYE 2022, and the average monetary amount of PC Capital fraud and error in FYE 2022. It used these figures to estimate a range in which the additional fraud and error due to the move to risk-based verifications lies. Results from our analysis showed that the overpayment range is negligible and within the confidence intervals for Pension Credit fraud and error estimates this year. Due to this, we can conclude that the impact of the change to capital verification does not require an adjustment to our estimates.
Get your State Pension
Get Your State Pension (GYSP) is a relatively new system on which claims to State Pension are recorded. It currently only includes claimants who reached state pension age on or after 6th April 2016, referred to as New State Pension (NSP) claims. The proportion of total State Pension claims on this system is approximately 8%.
No cases were selected for review from the GYSP system for FYE 2023 due to an inability to access the system for sampling purposes.
We have analysed the NSP cases included in the sample from the Pension Strategy Computer System (PSCS) to assess whether excluding claims on GYSP impacts on the rate of State Pension expenditure overpaid or underpaid.
The analysis showed that there was likely to be no impact on the rate of State Pension expenditure overpaid. There could potentially be a small difference in the underpayment rate on State Pension, with a potential reduction of 0.1 percentage points to the reported estimates.
Claimants on the GYSP system are being included within the State Pension samples that will feed into the FYE 2024 report. Given this, and the small estimated impact, we have taken the decision not to make an adjustment to the State Pension rate for this year’s release, and have assumed the rate of error found on the GYSP cases is the same as the rate for cases on PSCS for FYE 2023.
Fraud and error occurring directly on Cost of Living Payments
The estimate for Cost of Living Payments only includes fraud and error on the payments where the qualifying benefit was incorrectly paid. This means that we are omitting a small amount of fraud and error that can occur on the payment themselves. These include:
- a small number of Cost of Living Payments which were paid in error to the wrong person
- a number of claims that were incorrectly not paid Cost of Living Payments
The department estimates that the amount overpaid directly on Cost of Living Payments was small and well within the confidence intervals in FYE 2023. The amount underpaid directly on Cost of Living Payments would be negligible. Mop-up exercises are carried out on the cases incorrectly not paid, as soon as they are identified, and these cases are then paid at a later date.
Time Lags
The time lags involved in the fraud and error measurement process mean that further omissions are possible. Any policy or operational changes in the last five months of the financial year will not usually be covered by the reviews feeding into the publication, as the reviews tend to finish in the October of that financial year. In addition, some cases do not have a categorisation by the time the estimates are put together, often due to an ongoing fraud investigation. “Estimated outcomes” are generated for these cases for the purposes of the statistics, made by the review officer estimating the most likely outcome of the case, or based on the results from the reviews of similar cases that have been completed.
For all benefits we carried out additional work to better understand any implications of major policy/operational changes within the financial year. The conclusion was that we felt the sample period was representative of the financial year. See section 5 for further details.
Work Capability Assessment
Measurement of ESA was first included in the FYE 2014 estimates, and followed the existing methodology for JSA, IS and PC, reviewing the financial side of a claimant’s circumstances. However, the measurement of ESA does not include a review of the Work Capability Assessment; this is also the case for the Work Capability Assessment for claimants on UC.
Universal Credit Transitional Protection
Universal Credit (UC) was introduced to replace older (legacy) benefits, including tax credits. Benefit claimants have gradually moved onto UC through:
-
natural migration - when the claimant experiences a change in circumstances, and they need to make a new claim for a benefit that UC has replaced
-
voluntary migration - when the claimant voluntarily moves to UC from their existing benefit
-
managed migration - when the claimant does not choose to migrate voluntarily and has not migrated naturally
Transitional protection can be applied to claimants who are moved onto UC through the managed migration process. A transitional protection element is applied to ensure that eligible households, with a lower calculated award in UC than their legacy benefit awards, will see no difference in their entitlement at the time they are moved to UC, providing that there is no change in their circumstances during the migration process.
The transitional protection element is calculated during the managed migration process. It is based on the circumstances for the eligible household and their legacy benefits in payment that are being replaced by UC.
There is potential for the transitional protection element to be paid incorrectly if the calculation is made incorrectly and/or the legacy benefit awards in payment are incorrect based on the claimant’s circumstances. We are unable to review the transitional protection element calculation or the legacy benefit awards because these can be derived from benefits not administered by DWP. Consequently, fraud and error on this element of UC is omitted from the estimates.
A negligible number of all UC claims in FYE 2023 have been through the managed migration process. The transitional protection element does not apply to all of these claims. When it does apply, it accounts for a fraction of the total UC award in payment. Expenditure on the transitional protection element was therefore low in FYE 2023. The omission was taken to be negligible, and no adjustment was made to the UC fraud and error estimates.
Knock-on impact on other benefits
We only review the benefit that has been selected for a review, and do not assess any consequential impacts on other benefits. However, in certain circumstances, for some benefits, there may be a knock-on impact on other benefits. An example of this is how changes in entitlement to DLA or PIP affects disability and carer premiums on income-related benefits (specifically IS, PC and HB), as well as CA. We account for this in our estimates by using DWP’s Policy Simulation Model to assess the impact. The Policy Simulation Model is the main micro-simulation model used by DWP to analyse policy changes and is based on the annual Family Resources Survey.
Third party deductions
The accuracy of third party deductions is not measured (i.e. whether the deduction is at the correct amount and is still appropriate). Third party deductions can take place to cover arrears for things like housing charges, fuel and water bills, Council Tax and child maintenance. The rate of benefit is not impacted by any third party deductions, and the amount of any Fraud or Error is based on the “gross” amount of benefit in pay.
UC sanctions
For UC, we do not assess whether the Department follows correct “labour market” procedures and takes any necessary follow up action for non-compliance by claimants (i.e. considers whether a sanction should apply if a claimant fails to apply for a job or leaves a job voluntarily). However, if a sanction decision has already been made when we review a case, then we do assess whether the impact this has on the benefit award is correct.
UC surplus self-employed profit/loss
For UC, we only measure income in the assessment period we are checking. Self-employed people must report their income on a monthly basis. If they receive income that removes their entitlement to UC in one month, and this is above the surplus earnings threshold, then any extra income is carried forward into the next month (the surplus earnings threshold is defined as £2,500 above the amount that removes their entitlement to UC in that month). If a self-employed claimant incurs a loss of any amount within an assessment period, this loss is also rolled forward to the next assessment period. When reviewing the benefit, any rolled forward income or loss is assumed to be correct.
Earnings from the hidden economy
These are claimants who are working but are not declaring those earnings to the government. For every means tested benefit, where capital and earnings affect the award, we require bank statements for all the claimant’s accounts that cover the period of the payment we are checking. This means that any earnings which goes through the claimant’s bank are likely to be picked up when those bank statements are checked.
Although we think we capture most of the Fraud related to hidden economy earnings, it is likely that not all of this would end up under the “Earnings/Employment” error reason. If the claimant fails to send in bank statements after multiple prompts, then their benefit is suspended and ultimately terminated. In these circumstances a whole award Fraud would be recorded (see the Causal Link part of section 5 for more information). However, given they were hiding their earnings from the Government it is likely we would not know the underlying reason so the Fraud would be categorised as “Failure to provide evidence/engage”.
This means that the only earnings we would not pick up are those which are only “cash in hand” and those earnings are not depositing into a bank account. We expect the impact of this to be minimal, particularly since COVID-19, many cash only businesses have diversified into accepting bank transfers/card which further reduces this omission.
Cyber-crime
We do find errors relating to this and they would be included within the “Conditions of Entitlement” error reason. The benefit reviews that underpin the statistics are very robust and encompass not only a lengthy interview with the claimant but also evidence to verify all their circumstances. Therefore, it would be very difficult for a fraudulent claimant to meet all these requirements without alerting the suspicions of the reviewing officer.
Similar to hidden economy earnings, we think we capture most of the Fraud related to cyber-crime, but it is likely that not all of this would end up under the “Conditions of Entitlement” error reason. If a claim is fraudulent then they are likely to either not attempt the interview or not provide the requested evidence, in which case a whole award Fraud would be recorded (see Causal Link part of section 5 for more information). However, it is likely that we would have no evidence as to why they did this so the Fraud would be categorised as “Failure to provide evidence/engage”.
Benefit Advances
One of the largest current omissions from our estimates is benefit advances, which are out of scope of our measurement.
UC supports those who are on a low income or out of work. It includes a monthly payment to help with living costs. If a claim is made to UC but the claimant is unable to manage financially until their first payment, they may be able to get a UC Advance, which is then deducted a bit at a time from future payments of the benefit.
The benefit review process for the fraud and error statistics examines cases where benefit is in payment. A benefit advance is not a benefit payment and is not included in the DWP expenditure figures or in our measurement process. Claimants who progress to receive payment of a benefit will be included within the scope of our measurement, but we will only review the existing benefit payment. This will not examine Fraud or Error that may have existed in any prior benefit advance payment. Claimants who only receive a benefit advance, but do not go on to receive a subsequent benefit payment, will not be included within the measurement. Advances are available for a number of benefits but, for FYE 2023, advances for UC constituted the vast majority of expenditure on benefit advances.
We estimate that for FYE 2023 the monetary value of fraud and error on UC advances lies between £10m and £80m.
Rounding policy
In the publication and reference tables, the following rounding conventions have been applied:
-
percentages are rounded to the nearest 0.1%
-
expenditure values are rounded to the nearest £100 million
-
headline monetary estimates are rounded to the nearest £10 million
-
monetary estimates for error reasons are rounded to the nearest £1 million
The proportion of claims paid incorrectly is rounded to the nearest 1% in the publication and expressed in the format “n in 100 cases”. The reference tables present the same values as a percentage rounded to the nearest 0.1%.
Individual figures have been rounded independently, so the sum of component items do not necessarily equal the totals shown.
4. Sampling and Data Collection
The fraud and error statistics are determined using a sample of benefit records, since is it not possible to review every benefit record. The sample of benefit records provide data from which inferences are made about the fraud and error levels in the whole benefit claimant population.
The number of benefit records to be reviewed is determined by a sample size calculation. The sample size calculation is used to ensure that a sufficient number of benefit records are sampled, which allows meaningful changes in the levels of fraud and error to be detected for the whole benefit claimant population.
Benefit records are selected on a monthly basis from data extracts of the administrative systems. The population from which the samples are drawn are the benefit records that are in payment in a particular assessment period, that is where there is evidence of a payment relating to the previous month. This is known as the liveload.
The monthly samples are taken from the liveload in advance of the scheduling of the benefit reviews, to give time for the sample to be checked and for background information to be gathered on each benefit record sampled. Any benefit record relating to a claimant who has been previously sampled in the last 6 months, or meets specific exclusion criteria (for example, terminally ill) will not be reviewed.
We use Simple Random Sampling to select the sample of benefit records for each benefit that is reviewed in the current year. Benefit records are sampled randomly to ensure an equal chance of being selected for the sample.
The sampling methodology is used to attempt to minimise selection bias in the sample and aims to select a sample that is representative of the entire benefit claimant case population.
The benefits sampled for this year and the methodologies applied are as follows:
Simple random sample:
-
Employment and Support Allowance
-
Pension Credit
-
Universal Credit
-
State Pension
-
Personal Independence Payment
Housing benefit methodology was simple random sampling stratified by PSU and four different client groups:
-
Working Age in receipt of IS, JSA, ESA, PC or UC
-
Working Age not in receipt of IS, JSA, ESA, PC or UC
-
Pensioners in receipt of IS, JSA, ESA, PC or UC
-
Pensioners not in receipt of IS, JSA, ESA, PC or UC
Note: For HB only the client group “Working Age not in receipt of IS, JSA, ESA, PC or UC” was reviewed in FYE 2023.
Abandoned Cases
Of the benefit records sampled, there are some that are not eligible for a review according to strictly defined criteria for abandonment. Benefit records that fall into this category could include:
-
the claimant has a change of circumstances that ends their award before the interview can take place
-
the claimant has had a benefit reviewed within the last six months
-
if the claimant or their partner is terminally ill
When such cases occur in the sample, they are replaced by another case from a reserve list. However, for a small number of abandoned cases replacement is not possible for practical reasons. This occurs when cases are abandoned towards the end of the review year, which means that there is not enough time for a replacement case to complete the full process.
Abandoned Cases FYE 2023
It is the decision of the Performance Measurement (PM) team, during the preview stage of a case, if a case should be abandoned.
| Abandonment Reason / Benefit | ESA | HB | PC | PIP | SP | UC | Total | |
|---|---|---|---|---|---|---|---|---|
| Benefit not in payment/ceased or suspended | 65 | 794 | 60 | 22 | - | 378 | 1,319 | |
| Sensitive issues | 59 | 5 | 59 | 14 | 20 | 22 | 179 | |
| Incorrectly sampled | - | 89 | - | 12 | - | - | 101 | |
| Operational Issues | 7 | 75 | 3 | 5 | 4 | 2 | 96 | |
| New activity/Changes after sample has been drawn | - | - | - | 86 | - | - | 86 | |
| Miscellaneous | 41 | 25 | 39 | 53 | 74 | 132 | 364 | |
| Total | 172 | 988 | 161 | 192 | 98 | 534 | 2,145 | |
| Number of completed cases | 1,997 | 2,978 | 1,987 | 1,431 | 1,646 | 3,569 | 13,608 | |
| Abandonment Rate per benefit | 9% | 33% | 8% | 13% | 6% | 15% | 16% | |
| Percentage Point difference to FYE 2022 | 2 | 7 | 0 | - | -1 | 1 | 3 |
For FYE 2023 we have moved an abandonment reason ‘Claimant in Hospital’, which was a main abandonment reason in FYE 2022, into ‘Miscellaneous’ to account for the reason ‘New Activity/Changes after the sample has been drawn’ being included as a result of the reintroduction of the PIP measurement.
The five reasons listed (excluding ‘miscellaneous’) account for around 83% of total abandonment, a similar proportion to FYE 2022. A similar proportion within each benefit was abandoned (excluding PIP) compared to FYE 2022, with HB having the largest difference of 7 percentage points due to more cases not being in payment and a change made last year regarding how to approach claimants on UC and HB.
Below are updated descriptions for each of the five abandonment reasons to reflect these.
-
Benefit not in Payment/ceased or suspended – this remains the largest cause of abandonment, with almost 90% of these abandonments being HB or UC. These are claims no longer in payment either because the claimant is no longer entitled to the benefit or because they are now claiming another benefit. This is primarily related to the time lag of benefit reviews commencing. The time lag for HB is around six weeks, due to DWPs Performance Measurement team needing contact with each Local Authority for further information. This issue accounts for 27% of HB sampled cases being abandoned, up by 4 percentage points from 23% in FYE 2022
-
Sensitive Issues – this is a reason that affects all benefits reviewed. The claimant/partner being terminally ill or having recently became deceased/bereaved are the main causes for the usage of this reason
-
Incorrectly sampled – this is where circumstances have changed or incorrect information is held on cases supplied in the sample. Examples include claimants no longer included in the client group being sampled, including treating those on UC as those on a passported benefit (for HB) or activity on a case 92 days before the sample being drawn (for PIP)
-
Operational Issues – this reason has affected all benefits reviewed. This typically relates to reviews that are difficult or impossible to complete, due to unforeseen circumstances. For example, on HB this reason was used for some early sampled cases where they were also in receipt of UC and treated like a passported case while guidance was being updated
-
New Activity/Changes after the sample has been drawn – this relates to PIP cases. It occurs when an action is identified on a case, such as when appeals, interventions, or reconsiderations are made on claims after the sample is provided but before the review
-
Miscellaneous – this category covers all remaining categories of abandonment used
There are many different categories for abandonment used by PM, with many in this category having fewer than five cases abandoned.
These reasons are within the pre-defined criteria for abandonment. All the reasons here are unavoidable, out of our control or can’t be identified at the sample production stage of the process.
Official Error Checking
For ESA and PC, cases are checked for official errors within a specified sample week. For HB, SP and PIP the week of check is changeable and is decided by either the day the claimant is notified of the review or the date the review takes place. For UC, the check is usually of the last Assessment Period (of one month) prior to the date the review takes place.
Specially trained DWP benefit review officers carry out the checks. The claimant’s case papers and DWP computer systems are checked to determine whether the claimant is receiving the correct amount of benefit according to their presented circumstances. This identifies any errors made by DWP officials in processing the claim and helps prepare for the next stage: a telephone review of circumstances with the claimant.
Claimant Error and Fraud Reviews
For all benefits, benefit review officers normally check for Claimant Error (CE) or Fraud by comparing the evidence obtained from the review to that held by the Department. The claimant may not be interviewed if:
-
the case is already under an ongoing fraud investigation
-
a suspicion of Fraud arises while trying to secure an interview
When such cases occur in the sample, the outcome of the fraud investigation is used to determine the review outcome.
Where, following receipt of a letter informing them of a review, the claimant reports a change of circumstances that results in entitlement to that benefit ending before the review takes place, an outcome of Causal Link would be considered without the claimant being interviewed. See section 5 for information on Causal Link errors.
Types of errors excluded from our estimates
-
some failures by DWP staff to follow procedures are not counted as official errors; where the failure does not have a financial impact on the benefit award or where the office have failed to take action which could have prevented a claimant error from occurring. These are called procedural errors
-
accounting errors are errors where, despite an error in the claimant’s benefit, an overpayment (or underpayment) of the benefit undergoing a check could be offset against any corresponding underpayment (or overpayment) on the same benefit or in the case of State Pension and Pension Credit each other. For State Pension and Pension Credit these errors are excluded from the monetary estimates but are included in estimates of the proportion of claims paid incorrectly. For errors where the offset is on the same benefit they are excluded completely
-
deemed errors are official errors where evidence that was available to the department when the award of benefit was made has been misplaced or is not available. This means that the official error check is not complete. These errors are not counted as official errors, since we cannot be sure whether there would have been a financial impact on the claimant. Any case that has a deemed error raised against it is also excluded from the calculation of the official error rate (but may still be counted in the calculation of Claimant Error and Fraud)
Recording Information
Case details relating to the fraud and error reviews are recorded on internal bespoke ‘fraud and error’ software (the system is known as FREDA), to create a centrally held data source. This can then be matched against our original sample population to produce a complete picture of fraud and error against review cases across our sample.
5. Measurement Calculation Methodology
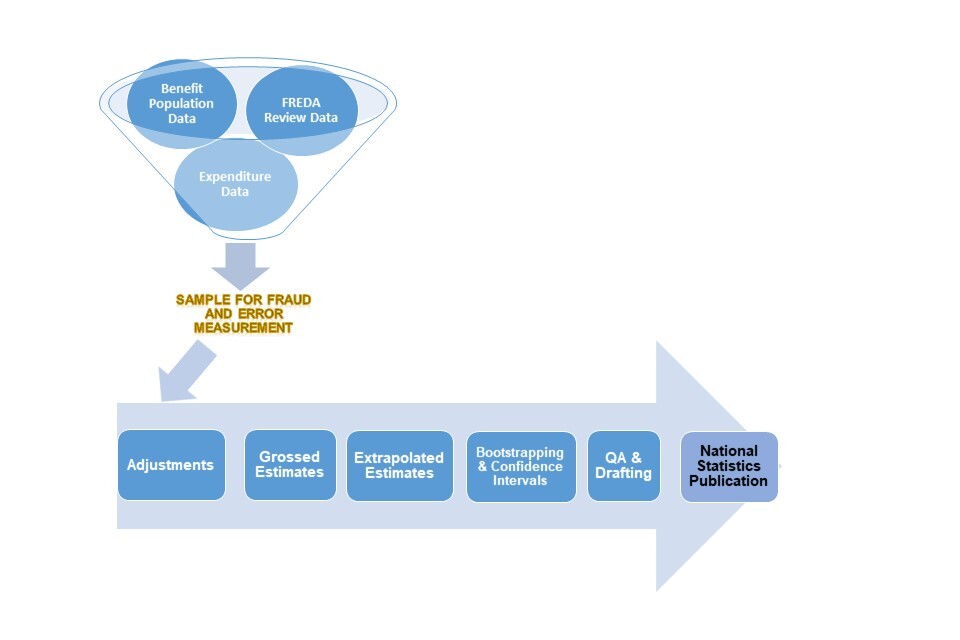
Fraud and error measurement relies on three data sources:
-
Raw Sample held on ‘FREDA’ (the database on which the review outcomes are recorded), is used to identify the Monetary Value of Fraud and Error (MVFE) for individual cases, categorise its cause and quantify it as a proportion of the sample
-
Benefit Population data to estimate the extent of fraud and error across the whole claimant caseload from the sample data
-
Expenditure data to estimate the total MVFE to the Department
Estimates are categorised into overpayments (OP) and underpayments (UP) and one of three incorrectness types: Claimant Fraud (CF), Claimant Error (CE) or Official Error (OE). Further sub-categories of error reasons are used to provide more details about the nature of the Fraud or Error. Details on error classifications can be found in the glossary at Appendix 3.
Detailed below are the main calculation steps that the Fraud & Error Measurement and Analysis (FEMA) team carry out to produce the final Fraud and Error estimates.
Methodology for Benefits reviewed this year
Benefits that have been reviewed this year account for 80% of the total benefit expenditure.
For each of the benefits reviewed this year a random sample of cases was taken. See section 4 for further details.
An Official Error check is carried out; see Official Error Checking part of section 4. The claimant is then contacted and a review carried out with evidence requested to verify their circumstances as outlined in Claimant Error and Fraud Reviews part of section 4.
Finally, a case is categorised as Benefit Correct, Official Error, Claimant Error or Fraud (or a combination of the last three).
There are specific scenarios and adjustments that we then taken into account. These are detailed below:
Causal Link
Cases where there is a change to the claimant’s award as a result of the review activity or, after initial contact, the claimant subsequently fails to engage in the review process, are categorised as Claimant Fraud with causal link. Action is taken to suspend their payment and subsequently terminate their claim.
Examples of behaviours that can trigger cases to be categorised as Causal Link include;
-
the claimant receives notification of the review and subsequently contacts the department to report an immediate change e.g. living with a partner, starting work, self-employment or capital changes. Then supporting evidence needed to verify the change is not provided, resulting in claim suspension and termination
-
the claimant completes the review but subsequently declares that a change has happened shortly following the period of the review
-
the claimant receives notification of the review and does not engage in the review process or contacts the department with a request to withdraw their claim
-
the claimant completes a review and a change is declared, however supporting evidence needed to verify the change is not returned, resulting in claim suspension and termination
For UC there are cases where the claimant fails to engage in the review process, but there is supporting evidence that a change is not due to the review. These are categorised as ‘mitigating circumstances’. For these cases, information is available on our systems to indicate why the person may not have engaged. In most cases, they have moved into paid work following the Assessment Period under review.
For all benefits post-review, every Causal Link error is categorised as either high suspicion or low suspicion. This categorisation is used in the netting and capping procedure (see section Netting and Capping) to help attribute losses to the error reasons we are most confident about. Any losses attributed to low suspicion Causal Link after netting and capping will have their error reason changed to “Failure to provide evidence/fully engage in the process”.
Examples of high suspicion Causal Link errors include:
-
shortly after review the claimant terminates their claim (rather than send in evidence)
-
the claimant told us at the review of a change of circumstances, but we cannot confirm that the change occurred prior to (or in) the assessment period checked
-
post-review, the claimant made a change of circumstances that cannot be confirmed as starting after the assessment period checked
-
when asked to send in more information or to clarify further queries on evidence sent in, the claimant stops engaging
The main reason that we would class a case as low suspicion is where the claimant fails to send in evidence, but we have no prior suspicions of fraudulent intent.
Adjustments
A series of adjustments are made to the sample data, to allow for various characteristics of the benefits and how their data is collected and recorded. The following table highlights which adjustments apply to each of the benefits reviewed in FYE 2023.
Note: Y=Adjustment applies, N=Adjustment does not apply.
| SP | ESA | PC | HB | UC | PIP | |||||||
|---|---|---|---|---|---|---|---|---|---|---|---|---|
| Netting and Capping | Y | Y | Y | Y | Y | Y | ||||||
| Estimated Outcomes | Y | Y | Y | Y | Y | Y | ||||||
| New Cases Factor | N | Y | Y | Y | N | N | ||||||
| Underlying Entitlement | N | N | N | Y | N | N | ||||||
| Cannot Review Cases | Y | Y | Y | Y | Y | Y | ||||||
| Reasonably Expected to know | N | N | N | N | N | Y |
Netting and Capping
Where a case has more than one error, these errors can be “netted off” against one another to produce a total value. For example, if a case is found to have two different OEs, one leading to an UP and one leading to an OP, then these are “netted off” to produce a single OP or UP. This is done to better represent the total monetary loss to the public purse (via OPs) or to the claimant (via UPs).
The monetary loss on each case is the difference between the case award paid at the review/assessment period, and the correct award calculated following the review – the “award difference”.
A case may have OPs of more than one ‘type’ which sum to a total greater than the award difference. To ensure that the total OP does not exceed the total award difference, we ‘cap’ the OP amount using a hierarchy order of actual CF, Causal Link (high suspicion) CF, Causal Link (low suspicion) CF, CE then OE. This capping process means that a small proportion of CE and OE found during the survey is not included in the estimates, and therefore the final estimates may actually be under-reporting CE and OE in the benefit system, but the total amount of fraud and error is correctly reported.
Estimated outcomes
For all benefits reviewed this year for a number of cases the review process had not been completed at the time of the analysis and production of results, often because fraud investigations are still to be completed. Predictions for the final outcomes for these cases have been made in the analysis using either the review officer (RO) estimation of the most likely outcome, or the results from the reviews of similar cases that had been completed.
New Cases Factors
New Cases Factors are an adjustment applied to help ensure that the durations on the sample accurately reflect the duration on benefit within the population.
As a result of the time required to collect the information needed to review a case, as well as other operational considerations, there is an unavoidable delay between sample selection and case review. This delay means that fewer low duration claims will be represented in the sample of cases, which artificially introduces a bias around claim durations at the point of interview.
Cannot Review
Cases that cannot be reviewed, primarily due to the claimant not engaging in the review process resulting in their benefit claim being suspended and later terminated, are initially recorded as Fraud. These cases are referred to as ‘Cannot Review’ and for most cases the Department holds very little evidence of their current circumstances and their reasons for failing to engage.
Not all of these cases will be Fraud so for cases where there is a lack of evidence available, additional checks are conducted at a later date. These checks are to determine if the individuals has reclaimed benefit and if there was a suspicion of Fraud recorded on the case at the initial preview. The outcome of these checks will result in these cases being re-categorised for reporting purposes. 0.9% of sampled cases in FYE 2023 did not have an effective review and we had no evidence as to why.
There are three different categories that are applied to cannot review cases for reporting purposes:
-
Not Fraud – if the individual reclaims benefit within 4 months, with the same circumstances and at a similar rate they were receiving prior to review, then the Fraud is removed
-
Fraud remains – if an individual does not reclaim benefit and there was a suspicion of Fraud raised at the preview stage of the review then the case remains as Fraud
-
Inconclusive – if the individual does not reclaim benefit and there was no suspicion of Fraud at the preview stage of the review then the case is categorised as inconclusive as there is no evidence to suggest the case is Fraud or not
Inconclusive cases are excluded from the estimates and reported separately in footnotes in the publication and reference tables.
Benefit-specific adjustments
This section contains details of any benefit-specific sampling issues, or things that we only do for certain benefits when we calculate our estimates.
Universal Credit
Zero payment cases: Universal Credit cases still live but with zero entitlement are not included in our sample for benefit reviews. However, when calculating the proportion of claims paid incorrectly on Universal Credit we scale the final figure to account for these cases.
State Pension
We do not review overseas cases as part of the SP review. We assume that the rate of Official Error in the overseas cases (which constitute around 4% of total expenditure on SP) is the same as for cases resident in Great Britain. Overseas Fraud and Claimant Error is calculated differently for SP. See section 2 for details.
Personal Independence Payment
For disability benefits, there are some changes which the claimant should report (for example, hospitalisation). However, many changes are gradual improvements or deteriorations in their medical needs, and it is difficult for some claimants to know at what point these needs have changed sufficiently to affect their benefit entitlement.
PIP legislation states that when a case is reassessed and their benefit is reduced, the Department will only seek to recover an overpayment when it is reasonable for the claimant to have known they should have reported the change. In other cases, the benefit will be treated as correct up to the point of reassessment.
It was identified that during PIP reviews there appeared to be variance in the application of “Reasonably expected to know” decisions, resulting in such cases not always having overpayments reported.
In Spring 2017, PM staff completed a joint exercise with PIP Operational staff to reconsider all of the information available to identify improvements to the review process to ensure the measurement of PIP was sufficiently robust.
Accordingly, error cases have been excluded from the headline overpayment estimates where the claimant could not reasonably have been expected to know they should have reported it.
Special Rules Terminally Ill (SRTI)
PIP claimants are considered to be particularly vulnerable, therefore it is not always deemed appropriate to put a claimant through the review process. This is the case for terminally ill PIP claimants.
Instead, an adjustment is made to the PIP estimates to account for their exclusion from the sample. 96% of terminally ill PIP claimants receive the highest award, with many regulations. For this reason, the fraud and error rate in this group is not considered to be the same as for the rest of the PIP population, and an adjustment is made based on this assumption.
The impact of the SRTI adjustment can be found in section 3.
Grossing
Grossing is the term used to describe the creation of population estimates from the sample data; sample results are scaled up to be representative of the whole population.
Example of a simple grossing factor ‘G’, if we were to sample 100 cases from a population of 1,000:
G = N ÷ n
= 1000 ÷ 100
= 10
Where ‘N’ is the population or sampling frame from which the cases are selected and ‘n’ is the sample size taken.
The above grossing factor shows that, in this example (sampling 100 cases from a population of 1,000), then each case would have a grossing factor of 10 (i.e. each sample case represents 10 cases from the population). Hence if a case was shown to be in error, this would represent 10 errors once grossed.
UC is replacing a selection of legacy benefits. As this process continues the UC caseload will increase whilst those other benefit caseloads will decrease. As a result, grossing for all benefits are calculated on a monthly basis. This ensures that an error identified at the start of the year is grossed up by less than an error identified at the end of the year if the caseload is increasing (or vice versa if it is decreasing).
Grossing factors are different for each benefit due to the sample, population and adjustments made. For ESA and PC, there are two different broad grossing factors, one for official error and one for Fraud and Claimant Error. The official error grossing factor is used on the sample which covers all cases where an official error check was done. The Fraud/Claimant Error grossing factor is used on the sample which covers all cases where a full check was done – i.e. Official Error check and claimant review. For all other benefits there is only one grossing factor as every case has had both an Official Error check and a Fraud/Claimant Error check.
Percentage overpaid and underpaid
The grossing factors are then applied to the sample data to calculate values for the grossed awards, the grossed overpayments and grossed underpayments i.e. these are scaled up proportionally to what we would expect to find in the population. In turn, the resulting grossed values are used to calculate the total (global) annual percentage overpaid and underpaid.
Extrapolation
The grossed results provide a core estimate of levels of fraud and error. Extrapolation aligns the monetary amount with the benefit expenditure, which is particularly important given the sample period and the financial year do not fully align.
Monetary Value of Fraud and Error (MVFE)
To then calculate the MVFE across the benefits, we apply the OP or UP percentage rates to the total annual expenditure for each benefit. This means that the MVFE is affected by the increases and decreases in expenditure, even if the OP and UP percentages are stable. We see the impacts of this in our estimates for benefits not reviewed in the current year, where we use the same rate of fraud and error from previous years but apply it to the expenditure on the benefit in the current year (which will have changed from the year before).
Although expressing fraud and error in monetary terms (i.e. MVFE terms) might be helpful for a reader to contextualize the figures, we recommend making comparisons on a year-on-year basis based on the percentage rates of fraud and error. This is particularly important for benefits where the expenditure changes a lot each year, as comparisons of monetary amounts can be misleading. For example, on a benefit with growing expenditure, it can be possible for the monetary amount of fraud and error to increase, even if the percentage rate of fraud and error has actually gone down.
Central Estimates and Confidence Intervals
The central estimates produced following extrapolation are based on reviews of random samples and hence are subject to variability. Therefore, confidence intervals are provided with the central estimates to quantify the uncertainty associated with these estimates.
The central estimates and confidence intervals are incorporated into the Global (overall) Estimates of fraud and error. These combine all separate DWP benefits to calculate an overarching set of Fraud, Claimant Error and Official Error rates for overpayments and underpayments. See Section 6 on Measurement of Total Overpayment and Underpayments for more detail.
Total Overpayment and Underpayments
The fraud and error estimates need to include all expenditure on benefits by DWP. Some benefits have been reviewed for fraud and error in the current year, and some have been reviewed in previous years. We also need to include estimates for benefits which have never been reviewed. A full list of which benefits are in scope for each release of the Fraud and Error in the Benefit system estimates is included within Appendix 2 of this document.
We also have an estimate of Interdependencies, the knock-on effect of Disability Living Allowance (DLA) fraud and error on other benefits, where receipt of DLA or PIP is a qualifying condition. This is only included within the overpayments calculation and not the underpayments.
Methodology for Benefits previously reviewed
Some benefits which were not measured this year were measured in previous years. For these benefits we apply the rate from the last time the benefit was measured to the current year’s expenditure, to get an estimate of the monetary value of fraud and error.
Benefits that have been previously reviewed account for 14% of the total benefit expenditure.
Methodology for Benefits never reviewed
As mentioned in section 2 “Changes”, we use multi criteria decision analysis to choose which benefits we should measure each year. Some benefits have a small amount of expenditure and therefore are unlikely to ever be selected for measurement. For each of the benefits that have never been reviewed, we use a similar benefit’s rate of fraud and error as a proxy. We then apply that to the expenditure on that unreviewed benefit to get an estimate of the monetary value of fraud and error.
Over the last year we have carried out a review of the benefits which we use as proxies. For more information, please see section 2 “Changes to proxy benefits used for unreviewed benefits”.
Benefits that have never been reviewed account for 6% of the total benefit expenditure.
Central Estimate and Confidence Intervals
The percentage estimate (i.e. the overall rate of fraud and error) is the sum of the monetary value of fraud and error for all benefits reviewed this year, those reviewed in previous years, those never reviewed and interdependencies, divided by the overall expenditure. This is done independently for Fraud, Claimant Error, Official Error and the overall fraud and error.
The central estimate is the estimate obtained from the sample data. It provides our best guess of the unknown value that we are trying to measure.
Confidence intervals are calculated for the percentage estimates, to quantify the statistical uncertainty associated with the central estimate. Some adjustments are made to the individual benefits before this is calculated for overall fraud and error:
-
Confidence intervals for benefits reviewed previously are deliberately widened
-
Confidence intervals may be widened further if it is believed that non-sample error could impact the accuracy of the estimates
-
Confidence intervals are widened for the benefits never reviewed, whereby the standard error is assumed to be 40% of the central estimate, to reflect greater uncertainty given the less robust method of estimation for these benefits
The uncertainty surrounding a central estimate is associated with both the variance of the outcome within the sample and the size of the sample from which it is calculated. A 95% confidence interval is used to indicate the level of uncertainty. It shows the range of values within which we would expect the true value of the estimate to lie. A wider range for the confidence interval implies greater uncertainty in the estimate.
Confidence intervals are calculated using a statistical technique called Bootstrapping. It is used to approximate the sampling distribution for the central estimate. The sampling distribution describes the range of possible values, for the central estimate, that could occur if different random samples had been used.
Bootstrapping is a computationally intensive technique that simulates resampling. A computer program is used to take 4,000 resamples with replacement, of equal size, from the initial sample data. The percentage rate of fraud and error is calculated for each of the resamples. These estimates are ordered from smallest to largest and this gives the approximated sampling distribution.
The 95% confidence intervals are obtained from the Bootstrapping results, by taking the 100th estimate (2.5th percentile) and the 3,900th estimate (97.5th percentile). We also check the median estimate (50th percentile) against our actual central estimate to ensure that no bias exists.
Calculation of Net Loss estimate
Recoveries refer to money recovered in the same financial year as the overpayment estimates, regardless of the period the debt is from. They include debt recovered by both the Department and Local Authorities (who administer Housing Benefit payments). The recovery data for Housing Benefit covers the period October 2021 to September 2022, due to a time lag on the data being available.
Net loss is calculated as a monetary amount by subtracting the value of the recoveries from the value of the overpayments. The percentage estimate is then calculated by dividing the monetary net loss by the expenditure. Net loss can only be calculated at the overall fraud and error level because error classification differs between overpayments and recoveries.
As the recoveries are actual values rather than estimates, the calculation of net loss does not affect the uncertainty around the overpayment estimates. The confidence intervals for net loss are calculated by subtracting the value of the recoveries from the upper and lower confidence limits. Percentage confidence intervals are obtained by dividing by the expenditure.
Net loss is calculated overall and individually for benefits reviewed this year and previously reviewed benefits. Net loss is also calculated for the group of benefits never reviewed combined, by subtracting all recoveries relating to these benefits from the total overpayments.
Some recoveries have no associated overpayments for the same period, as these benefits are no longer administered by the Department. This is because the debt relates to expenditure from previous years. In addition, some recoveries the Department makes are not included in our net loss estimate as they do not relate to our fraud and error reporting. For example, recoveries of tax credits and of benefit advances (which are outside the scope of our measurement; see section 3 for more details).
The overall net loss estimate includes the benefits reviewed this year, benefits reviewed in previous years, benefits never reviewed and recoveries for which there is no overpayment.
6. Quality Report
This section of the document assesses the quality of the fraud and error in the benefit system national statistics using the European Statistics System Quality Assurance Framework. This is the method recommended by the Government Statistical Service Quality Strategy. Statistics are of good quality when they are fit for their intended use.
The European Statistics System Quality Assurance Framework measures the quality of statistical outputs against the dimensions of:
-
relevance
-
accuracy and reliability
-
timeliness and punctuality
-
comparability and coherence
-
accessibility and clarity
The Government Statistical Service also recommends assessment against 3 other principles in the European Statistics System Quality Assurance Framework. These are:
-
trade-offs between output quality and components
-
balance between performance, cost and respondent burden
-
confidentiality, transparency and security
These dimensions and principles cross the three pillars of trustworthiness, quality and value in the Code of Practice for Statistics.
Relevance
Relevance is the degree to which statistics meet the current and potential needs of users.
The Department for Work and Pensions (DWP) fraud and error in the benefit system statistics provide estimates of fraud and error for benefits administered by the DWP and local authorities.
The series has been developed to provide information to various users for policy development, monitoring and accountability, as well as providing academics, journalists and the general public, data to aid informed public debate.
The statistics:
-
include DWP benefits and those administered by local authorities
-
are the primary DWP indicator for levels of fraud and error in the benefit system
-
are in the DWP business plan
-
are important for DWP assurance on the impact of anti-fraud and error activity across the business
The publication is essential for providing our stakeholders with:
-
a consistent time series for assessing fraud and error trends over time
-
data to assess current DWP fraud and error policy and evaluate recent changes to these or business processes
-
the evidence base for assessing the potential effect of future fraud and error policy options and programmes
-
robust data to inform future measurement options
-
estimates of fraud and error for the DWP annual report and accounts
-
data to measure government performance relating to objective 5 of the DWP single departmental plan: transform our services and work with the devolved administrations to deliver an effective welfare system for citizens when they need it while reducing costs, and achieving value for money for taxpayers. Read the latest plan (correct at the time of publication of this document, May 2023)
-
estimates that feed into the annual HM Revenue and Customs National Insurance Fund Accounts
We recognise that our users will have different needs and we use a range of different methods to contact them. We frequently meet internal DWP users to discuss their requirements. As for external stakeholders, we often contact the National Audit Office and we occasionally contact HM Revenue and Customs and Cabinet Office
Engagement with other external users is usually through the DWP statistical pages of this website where we:
-
invite users to share their comments or views about our National Statistics, or to simply advise us how they use our statistics
-
advise users of updates and changes to our statistics through the future statistics release calendars and our fraud and error in the benefit system collection page
-
consult with customers on developments and changes to our statistical methodologies, publications or publication processes. We last carried out a consultation in the Summer of 2018
Accuracy and Reliability
Accuracy is the closeness between an estimated result and the unknown true value. Reliability is the closeness of early estimates to subsequent estimated values.
The statistics are calculated from the results of a survey sample, which are recorded on an internal DWP database. The survey combines data collated from DWP administrative systems and local authority owned Housing Benefit systems, with data collected from the claimant during an interview.
The estimates obtained are subject to various sources of error, which can affect their accuracy. Both sampling and non-sampling error are considered in producing the statistics.
Sampling error arises because the statistics are based on a survey sample. The survey data is used to make conclusions about the whole benefit caseload. Sampling error relates to the fact that if a different sample was chosen, it would give different sample estimates. The range of these different sample estimates expresses the sample variability. Confidence intervals are calculated to indicate the variability for each of the estimates. More detail on central estimates and confidence intervals is provided in section 5.
Sources of non-sampling error are difficult to measure. However, where possible, these uncertainties have been quantified and combined with the sampling uncertainties, to produce the final estimates. Quality assurance processes are undertaken to mitigate against particular types of error (for example, data entry error).
Possible sources of non-sampling error that may occur in the production of the fraud and error statistics include:
-
Data entry error – the survey data is recorded on a database by DWP staff. Data may be transcribed incorrectly, be incomplete, or entered in a format that cannot be processed. This is minimised by internal validation checks incorporated into the database, which can prevent entry of incorrect data and warn staff when an unusual value has been input. Analysts undertake further data consistency checks that are not covered by the internal database validations
-
Measurement error – the survey data collected from the benefit reviews are used to categorise an outcome for each case. The correct categorisation is not always obvious and this can be recorded incorrectly, particularly for complex cases. To reduce any inaccuracies, a team of expert checkers reassess a selection of completed cases before any statistical analysis is carried out. This evidence is used as a feedback mechanism for the survey sample staff and also for the statistical analysis
-
Processing error – errors can occur during processing that are caused by a data or programming error. This can be detected by a set of detailed quality assurance steps that are completed at the end of each processing stage. Outputs are compared at each stage to identify any unexpected results, which can then be rectified
-
Non-response error – missing or incomplete data can arise during the survey. Supporting evidence to complete the benefit review may not be provided, or the claimant may not engage in the review process altogether. In other cases, the benefit review may not have been completed in time for the analysis and production of results. An outcome is imputed or estimated in these cases, by different methods that are detailed in this document
-
Coverage error – not all of the benefit caseload can be captured by the sampling process. There is a delay between the sample selection and the claimant interview, and also a delay due to the processing of new benefit claims, which excludes the newest cases from being reviewed. An adjustment is applied to ensure that the duration of benefit claims within the sample accurately reflects the durations within the whole caseload
The list above is not exhaustive and there are further uncertainties that occur due to assumptions made when using older measurements for benefits that have not been reviewed this year. There are also some benefit-specific adjustments that are part of the data processing.
More detailed information about the quality of the statistics can be found in this document. This includes discussion of the limitations of the statistics, possible sources of bias and error, and elements of fraud and error that are omitted from the estimates.
Timeliness and Punctuality
Timeliness refers to the time gap between the publication date and the reference period for the statistics. Punctuality is the time lag between the actual and planned dates of publication for the statistics.
The fraud and error in the benefit system report is usually published around 8 months after the main reference period.
Due to the time taken to undertake the interviews and gather follow up information, final data from the reviews is not made available to analysts until 4-5 months after the start date of the last interviews. The production of the statistics and reference tables, and the associated clearance processes, then takes the analytical team about 2 months to prepare. Improvements over the last few years have reduced this from 3 months.
DWP pre-announce the date of release of the fraud and error in the benefit system report 4 weeks in advance on this website and the UK Statistics Authority publication hub, in accordance with the Code of Practice for Statistics.
The statistics are published at 9.30am on the day that is pre-announced. The release calendar online is updated at the earliest opportunity to inform users of any change to the date of the statistical release and will include a reason for the change. All statistics will be published in compliance with the release policies in the Code of Practice for Statistics.
Comparability and Coherence
Comparability is the degree to which data can be compared over time, region or another domain. Coherence is the degree to which the statistical processes that generate two or more outputs use the same concepts and harmonised methods.
Our publication provides information on the estimates over time. Where breaks in the statistical time series are unavoidable, users are informed within the report by a text explanation, with clear sectioning within the time series reference tables and detailed footnotes.
Any changes made to the DWP or local authority administrative system data are assessed in terms of their impact on fraud, error and debt strategy and policy. These are then impacted against the fraud and error measurement review process and communicated to our internal users and the National Audit Office through our change of methodology log. The same is true for any changes made to business guidance, processes and review methodology, as well as our own calculation methodology.
We agree some methodology changes in advance with internal stakeholders using change request and change notification procedures.
External users are notified of any changes to methodology in the ‘Methodology Changes’ section of the fraud and error in the benefit system report. Substantial changes to the report structure or content will be announced in advance on the fraud and error in the benefit system collection.
The fraud and error in the benefit system statistics form the definitive set of estimates for Great Britain. They are underpinned by reviews of benefit claimants in England, Wales and Scotland.
The benefit expenditure figures used in the publication also include people resident overseas who are receiving United Kingdom benefits, except for Financial Assistance Scheme payments, which also cover Northern Ireland. All other benefit expenditure on residents of Northern Ireland is the responsibility of the Northern Ireland Executive. The benefit expenditure figures do not include amounts devolved to Scottish Government (which totalled £3.3 billion in FYE 2022). Reporting the levels of fraud and error of this benefit expenditure is the responsibility of Social Security Scotland. Their estimates for FYE 2020 (which only related to Carer’s Allowance) were published as part of their annual report.
Northern Ireland fraud and error statistics are comparable to the Great Britain statistics within this report, as their approach to collecting the measurement survey data, and calculating the estimates and confidence intervals is very similar. Northern Ireland fraud and error in the benefit system high level statistics are published within the Department for Communities annual reports.
HM Revenue and Customs produce statistics on error and fraud in Tax Credits. Again, these estimates can be compared to form a whole benefit view.
Accessibility and Clarity
Accessibility is the ease with which users can access the statistics and data. It is also about the format in which data are available and the availability of supporting information. Clarity refers to the quality and sufficiency of the commentary, illustrations, accompanying advice and technical details.
The reports and reference tables can be accessed on the statistics pages on this website and the UK Statistics Authority publication hub.
Fraud and error in the benefit system statistics follow best practice and guidance from the Government Digital Service and Government Statistical Service, in publishing statistics that give equality of access to all users.
For data protection reasons, the underlying datasets are not available outside DWP. However, the reference tables published alongside the report provide detailed estimates, giving a breakdown of overpayments and underpayments into the different types of fraud and error, for the benefits measured in that year. The reference tables are available in both standard and accessible formats.
Technical language is avoided where possible within the report. To help users, the report contains definitions of key terms such as: Fraud, Official Error and Claimant Error. A more extensive glossary of terms and error types is included in Appendix 3.
Contact details are provided for further information on the statistics, guidance on using the statistics, data sources, coverage, data limitations and other necessary relevant information to enable users of the data to interpret and apply the statistics correctly.
Trade-offs Between Output Quality and Components
Trade-offs are the extent to which different dimensions of quality are balanced against each other.
The main trade-off for these statistics is timeliness against accuracy. We always assess the right balance taking into account fitness for purpose, and fully explaining any compromises in accuracy for improved timeliness.
As detailed in the timeliness and punctuality section above, we wait a considerable amount of time for the data to be as complete as possible before our publication process begins, to ensure that the estimates are based on data which is as final and robust as possible. This means that we usually publish data around 8 months after the main reference period.
Balance Between Performance, Cost and Respondent Burden
The DWP fraud and error in the benefit system statistics are produced from survey data which have a high respondent burden. A compulsory interview, lasting between approximately 30 minutes and 2 hours, is required for all cases sampled for claimant error and fraud checking.
The total DWP cost for production of these statistics is approximately 150 staff (full-time equivalent).
DWP are continuously looking at more cost effective and efficient options for sourcing and collecting data, reducing the burden on the respondent and the production of the estimates.
Confidentiality, Transparency and Security
All of our data is handled, stored and accessed in a manner which complies with Government and Departmental standards regarding security and confidentiality, and fully meets the requirements of the Data Protection Act (2018).
Access to this data is controlled by a system of passwords and strict business need access control.
Any revisions to our publications are handled in accordance with the department’s revisions policy.
7. Future Reporting
The future coverage and scope of the national statistics “Fraud and Error in the Benefit System” is kept under review and users are kept informed of our plans via our Publication Strategy document.
Appendix 1: Glossary of abbreviations
| Abbreviation | Definition |
|---|---|
| AA | Attendance Allowance |
| CA | Carer’s Allowance |
| CE | Claimant Error |
| CF | Claimant Fraud |
| DLA | Disability Living Allowance |
| DWP | Department for Work and Pensions |
| ESA | Employment and Support Allowance |
| FEMA | Fraud and Error Measurement and Analysis |
| FYE | Financial Year Ending |
| HB | Housing Benefit |
| HMRC | Her Majesty’s Revenue and Customs |
| IB | Incapacity Benefit |
| IS | Income Support |
| JSA | Jobseeker’s Allowance |
| LA | Local Authority |
| MVFE | Monetary Value of Fraud and Error |
| OE | Official Error |
| OP | Overpayment |
| PC | Pension Credit |
| PIP | Personal Independence Payment |
| PM | Performance Measurement team |
| SP | State Pension |
| UC | Universal Credit |
| UP | Underpayment |
Appendix 2: List of benefits included in fraud and error estimates
Benefits reviewed this year
Universal Credit
State Pension
Housing Benefit
Employment and Support Allowance
Pension Credit
Personal Independence Payment
Benefits reviewed previously
Attendance Allowance (last reviewed FYE 2022)
Carer’s Allowance (last reviewed FYE 2020)
Housing Benefit:
-
passported pension age (last reviewed FYE 2020)
-
passported working age and non-passported pension age (last reviewed FYE 2019)
Jobseeker’s Allowance (last reviewed FYE 2019)
Income Support (last reviewed FYE 2015)
Incapacity Benefit (last reviewed FYE 2011)
Disability Living Allowance (last reviewed FYE 2005)
Benefits never reviewed
Maternity Allowance (proxy measure: Employment and Support Allowance rates relating to Abroad, Conditions of Entitlement, Earnings and Contributions only).
Severe Disablement Allowance (proxy measure: Employment and Support Allowance rates relating to Abroad, Conditions of Entitlement, Earnings and Contributions only).
Financial Assistance Scheme (proxy measure: State Pension Official Error only).
Industrial Death Benefit (proxy measure: Pension Credit Living Together rate only).
Winter Fuel Payments (proxy measure: Service Centre Measurement carried out in FYE 2022).
State Pension Transfers (proxy measure: State Pension).
Cold Weather Payments (proxy measure: Rate of whole award errors found on the last measurement of Employment and Support Allowance, Income Support, Jobseeker’s Allowance, Pension Credit and Universal Credit).
Widow’s Benefit / Bereavement Benefit (proxy measure: Employment and Support Allowance Contributory only element and rates relating to Conditions of Entitlement, lack of National Insurance Contributions or incorrect recording of National Insurance Contributions only).
Industrial Disablement Benefit (proxy measure: Personal Independence Payments).
Armed Forces Independence Payment (proxy measure: Personal Independence Payments).
Christmas Bonus (proxy measure: Rate of whole award errors found on the last measurement of Attendance Allowance, Carer’s Allowance, Employment and Support Allowance, Pension Credit, Personal Independence Payments and State Pension).
Statutory Sick Pay (proxy measure: No fraud and error).
Statutory Maternity Pay (proxy measure: No fraud and error).
Appendix 3: Further information on types of errors reported
The definitions of the key terms of Fraud, Claimant Error and Official Error are included at the start of this document. This section includes additional information on how we classify errors, including a detailed list of the types of errors we report for benefits reviewed in the current year.
Note that our methodology states that all errors (Fraud, Claimant Error and Official Error) found on a case are recorded separately and the full values of each error are recorded in isolation of one another. This can lead to the sum of the error values being higher than the benefit award. In such cases a capping calculation is performed (using a Fraud, Claimant Error, Official Error hierarchy) to ensure that the sum of the errors does not exceed the award, so that the monetary value of fraud and error is not over-reported. This can lead to some of the originally captured Fraud, Claimant Error and Official Error raw sample values being reduced during the calculation of the estimates.
In addition, it should be noted that an error which is initially categorised as claimant error, will instead be categorised as official error where the error has clearly been caused by an official of the Department/LA, and the ESA/CA/HB business unit (or, for PC, the pension centre) is in possession, from whatever source, of the true facts, regardless of whether the information has been processed by the business unit.
A glossary of the current error types for overpayments and underpayments is given below:
-
Abroad – claimant left Great Britain after claim began, did not notify DWP before leaving and is confirmed to be abroad for a period that exceeds any allowable absence limit. State Pension abroad errors are different in that being abroad does not remove their entitlement to the benefit, however the uprating of State Pension differs depending on what country you reside in
-
Award Determination – where a Case Manager from the DWP makes an incorrect award of PIP or AA based on the declared functional needs of the claimant. This includes failing to consider the qualifying period
-
Capital – concealed or incorrect declaration of the amount of savings in bank or building society accounts, cash, ISA/PEPs, premium bonds, other property interests or shares that exceed the minimum value for capital limits (Capital official errors include incorrect calculation by DWP staff of the value of declared savings, money and other financial assets available to the claimant, or failure to correctly adjust tariff levels and amend the benefit entitlement due)
-
Childcare Costs – Childcare costs incorrectly included or excluded or an incorrect declaration of the amount of childcare costs for the childcare element of UC
-
Conditions of entitlement – undeclared changes in the personal circumstances of a claimant or their partner, that would end entitlement to a benefit. Examples are being in full-time education, long-term hospitalisation, imprisonment, death and assuming a false identity
Includes staff failing to act on information received raising doubt on basic entitlement to benefit. For Universal Credit this includes the agent accepting the claimant commitment on behalf of a claimant who has the capacity required to accept their claimant commitment.
-
Contributions – errors where the National Insurance record is incorrect, including where HMRC has failed to record, or incorrectly recorded Child Benefit within the record. Additionally, errors caused by failure by DWP to action a change to the award of State Pension following receipt of information from HMRC
-
Control Activities are not carried out appropriately – failure of staff to conduct actions at the due time which otherwise may have changed the level of benefit payable. For example, failure to review a Pension Credit claim at the end of an Assessed Income Period, not conducting routine interviews where claimant non-participation can result in a benefit sanction or late notification of benefit disallowances
For State Pension these errors generally relate to failure to take action at age related trigger points or failure to action a change in the claimants marital status.
-
Earnings/Employment – concealment or under-declaration of full or part-time work undertaken during the claim by the claimant or their partner. This work can be for an employer or self-employment. Staff failing to correctly calculate the amount of monthly benefit due for claimants who have declared any paid work they or their partner have undertaken during the claim
-
Element/Premium/Components – Elements (UC only) – The award of UC is made up of a number of different Elements. Some of these are treated in this report in a similar way to Premiums in Legacy benefits, for example Carer Element, Disabled Child Element and Work Capability Elements. Child Care Costs and Housing Costs (also Elements in their own right) are recorded separately
Premium: DWP can pay additional amounts in means-tested benefits when other benefits are also being paid, for example Disability or Carers Allowance. This often introduces additional criteria for staff to consider before deciding the qualification for the extra amounts
Components (SP only): The award of SP is made up of a number of different Components (for example Graduated Pension, State Second Pension, Additional Pension etc). This often introduces additional criteria for staff to consider before deciding the qualification for the additional amounts.
-
Failure to provide evidence/Fully engage in the process – where the reason for the error is unclear. We are confident that the case is fraudulent, as the claimant has forgone their right to benefit, but with the evidence we have available, we cannot be certain as to why
-
Functional Needs – where the claimant has failed to declare a change in their ability to carry out any of the activities on which PIP or AA is considered, or misrepresented their abilities when making their claim (whether intentionally or not)
-
Hospital/Registered Care Home – Attendance Allowance (AA) is not normally payable for any period or periods of more than 28 days, during which a customer is being maintained free of charge whilst undergoing treatment as an in-patient in a hospital or similar institution or is resident in a care home where the Local Authority (LA) meets the costs of any of the qualifying services
For UC couple cases, a person who is living away from their partner ceases to be treated as a member of a couple and part of the same benefit unit, where they are absent from the household, or expected to be absent from the household, for 6 months or more.
- Household composition – failing to disclose changes in household composition, for example a non-dependant leaving. Claiming incorrectly for children which increases the value of DWP benefits payable, or claiming for adult partners who leave the household
Includes incorrect action by staff, taken in respect of other people the claimant declared living with them. This includes a partner or dependent children incorrectly omitted or included in the assessment (with due regard to entitlement to any disability premium or benefit reductions due to long-term hospitalisation).
- Housing costs – DWP provides financial assistance with the costs of ground rent and service charges. Claimants fail to disclose payment of changes to housing costs. For example service charges, or fail to declare sale of property, or a change of address which would end the extra amounts payable. For Universal Credit this includes determining the housing cost element that replaces housing benefit, this can include calculation of the rent amount, correctly incorporating rent free weeks and size criteria
DWP can also inaccurately calculate the ground rent or service charges.
- Income – Occupational and Personal Pensions – concealed or incorrect declaration of income received from a non-state pension, obtained through contributions paid in past employment schemes, annuities or personal investments
DWP staff failing to take into account the correct amount of non-state pensions declared by the claimant.
- Income – Other – concealed or under-declaration of income coming into the household, from sources such as sick pay from work, spousal maintenance, partner’s student income, unemployment or similar insurance policy payments
Failure by staff to correctly identify or record other money coming into the household, such as Child Benefit, sick pay from work, spousal maintenance, partner’s student income, unemployment or similar insurance policy payments.
- Income – Other benefits – concealed or under-declaration of income received from another benefit
DWP IT systems or staff have failed to take into account the correct value of other social security benefits currently paid to the claimant or partner, including benefits paid by a foreign state.
-
Living Together – where a claimant declares to be single but has failed to declare they actually live with another person and maintain a joint household
-
Other – this covers a range of different cases not covered in the categories above or below
-
Passporting – relevant to Housing Benefit only. It includes communication failures between different IT systems that notify the termination of a claimant’s means-tested DWP benefit to the Local Authority, impacting the HB award, or LA staff failing to act on the information received
-
Residency – errors relating to Housing Benefit claimants only, where DWP confirms that the claimant no longer lives at the address being paid for. For Universal Credit, where the claimant no longer lives at the address for which they are being paid Housing Costs Element, the error would appear in Housing Costs
-
Tax Credits – errors where the amount or existence of tax credits results in an incorrect award of a DWP benefit
-
Uprating – errors where the IT system that pays State Pension has applied an annual increase to an element of State Pension incorrectly
Appendix 4: Glossary of Statistical terms
Key statistical terms used in this report are explained below.
-
95% Confidence Interval: The range of values within which we can be 95% sure that the true value we are trying to estimate lies. It is used as a measure of the statistical uncertainty in an estimate
-
Estimate: An estimate is an indication of the value of an unknown quantity based on observed data. It provides information about unknown values in the population that we are trying to measure
-
Population: A population is any entire collection of items from which we may collect data. It is the entire group that we are interested in, which we wish to describe or to draw conclusions about (generally benefit claimants or expenditure in the context of this report). There are two different types of population referred to in sampling:
-
The Target Population - consists of the group of population units from whom we would like to collect data (e.g. all people claiming a benefit).
-
The Survey Population - consists of the group of population units from whom we can collect data (for example, all claimants with sufficient case details on our datasets). The Survey Population is sometimes referred to as the ‘Sampling Frame.’
- Sample: A group selected (randomly in the context of this report) from a larger group (known as the ‘population’). Through analysing the sample, we aim to draw valid conclusions about the larger group
Appendix 5: List of historical methodology changes
A list of the historical methodology changes that have been made since FYE 2006.
| Methodology Change | Included in which published report |
|---|---|
| Changes to sampling and calculation methods were aimed primarily at making the estimates better represent overpayments in the whole of IS, JSA and PC expenditure. | Fraud and Error in the Benefit System April 2005 to March 2006 Spending Review 2004 target baseline |
| Definitional changes to what is being measured were introduced primarily to make the estimates better relate to the actual impact of fraud and error on expenditure. | Fraud and Error in the Benefit System: April 2008 – March 2009 – Revised Edition |
| Incapacity Benefit started to be continuously reviewed for fraud and claimant error as well as official error. | Fraud and Error in the Benefit System: April 2008 – March 2009 – Revised Edition |
| There was a change in this report to the calculation of the sample weightings for Income Support, Jobseeker’s Allowance and Pension Credit | Fraud and Error in the Benefit System: April 2009 – March 2010. |
| During 2011 the Fraud and Error Measurement (FEM) team have carried out a series of changes to the calculation processes and methodology in order to simplify and align these across the individual benefits. This work has made our processing quicker, more efficient, robust and transparent and easier to quality assure. This in turn will reduce risk in our calculation processes and will enable our team, in the future, to make changes to the computer programs more easily, especially with the advent of Universal Credit, and be more flexible with resources. The new aligned processing system will also make it easier for our customers to interpret and compare findings across the individual benefits. | Fraud and Error in the Benefit System: FYE 2011 Estimates |
| We have introduced a change to the order in which Income Support, Jobseeker’s Allowance and Pension Credit errors are capped within our calculation methodology. They are now capped for fraud first, then claimant error, then official error. In previous reports they were capped for official error first, then fraud, then claimant error. This change aligns the above benefits with the Housing Benefit capping hierarchy. | Fraud and Error in the Benefit System: FYE 2011 Estimates |
| Since the introduction of Employment and Support Allowance in October 2008 no new claimants have been awarded Incapacity Benefit as they claim Employment and Support Allowance instead. In addition, all current claimants of Incapacity Benefit are being reassessed and will be moved to either Employment and Support Allowance or Jobseeker’s Allowance in the near future. For this reason, we have stopped measuring Incapacity Benefit for fraud and error on a continuous basis and have re-deployed resources to measure Employment and Support Allowance for Official Error instead, which was reported for the first time in May 2013. For this report and after, the preliminary 2010/11 Incapacity Benefit estimates will be used in our publications and applied to the latest expenditure figures to provide the most up-to-date monetary values of fraud and error. | Fraud and Error in the Benefit System: FYE 2011 Estimates |
| A new error code framework was introduced in April 2010 following internal stakeholder consultation and agreement to have more meaningful information on the types of fraud and error. The 2010/11 publication was the first report to include these error code breakdowns. The breakdowns are not comparable to previously published error code breakdowns, i.e. reports before 2010/11 | For this report and after, the preliminary 2010/11 Incapacity Benefit estimates will be used in our publications and applied to the latest expenditure figures to provide the most up-to-date monetary values of fraud and error. |
| A change was made to the way in which the extrapolation adjustment was being calculated for Income Support, Jobseeker’s Allowance and Pension Credit to ensure it was based on up-to-date assumptions for these benefits. This change was introduced from the Preliminary 2011/12 report onwards. | Fraud and Error in the Benefit System: FYE 2012 Estimates |
| Removal of stratifications for Pension Credit by age (over 80 and under 80): This is a sampling change that was implemented from October 2012; therefore, this is the first set of statistics that is partly affected by this change. | Fraud and Error in the Benefit System: FYE 2013 Estimates |
| Change to significance testing for benefits reviewed this year: Improved methodology where we use the bootstrapped values of the estimates of both years. We calculate the difference between each of the bootstrapped values and calculate the 95% confidence interval around the mean. If this confidence interval does not straddle zero, the change is marked as “statistically significant”. | Fraud and Error in the Benefit System: FYE 2013 Estimates |
| Employment and Support Allowance estimates of fraud and claimant error are included in the “Continuously Reviewed” estimates for the first time in the Preliminary 2013/14 results. Full reviews began in October 2012. There is an impact on the Global Estimates as previously fraud and claimant error were estimated using a proxy measure, combining both Incapacity Benefit and Income Support Disabled and Others results. | Fraud and Error in the Benefit System: FYE 2014 Estimates |
| An additional level of stratification was introduced into the Pension Credit single review sampling from April 2013. The new classification is based on characteristics of the claim, as held in our administrative records. This modification will not lead to any systematic change in our central estimates, but was introduced to reduce the width of our confidence intervals, thereby improving the precision of our central estimates. | Fraud and Error in the Benefit System: FYE 2014 Estimates |
| A level of stratification was removed from the Income Support sampling from October 2013. Results can no longer be presented as split by “Lone Parents” and “Disabled/Other”. This modification will not lead to any systematic change in our central estimates, but will increase the width of our confidence intervals, thereby reducing the precision of our central estimates. The reason for the change was the reduction in caseload. | Fraud and Error in the Benefit System: FYE 2014 Estimates |
| Half of the Income Support single review cases were randomly allocated to receive notified visits from October 2013 onwards. This has had no significant effect on the rates of fraud and error reported. | Fraud and Error in the Benefit System: FYE 2014 Estimates |
| Housing Benefit measurement methodology changed for the 2014/15 preliminary results. We have aligned the treatments of cases with both overpayments and underpayments across Housing Benefit and the other continuously reviewed benefits in the May 2015 release. This means that both the overpayments amounts and the underpayments amounts have been reduced for Housing Benefit and hence for the total of all benefits. We have also reduced the amount of Claimant Untraceable fraud and error that we count. | Fraud and Error in the Benefit System: FYE 2015 Estimates |
| Introduced a new ‘Global Net Loss’ measure that takes away the overpayments that the department and Local Authorities recover from the overpayments. Instead of counting all overpayments as a loss to the system, we subtract the amount that the department gets back, giving a more accurate representation of the cash loss to the public purse. | Fraud and Error in the Benefit System: FYE 2015 Estimates |
| From 2014/15, within the measurement system, there was a change in the way some errors were classified as either claimant error or fraud, following a review of the evidence gathering process by the Performance Measurement teams. The outcome from the review emphasised the need for further questioning to establish the facts around any changes in circumstances. The new data appeared from the 2015/16 Preliminary Estimates. The change gives a more accurate classification of the level of fraud and claimant error across benefits, but it does mean that caution should be used in any comparisons between post 2014/15 results and earlier results. The change is thought to be the main reason for the increase in fraud and a corresponding fall in the level of claimant error, and it may have affected the overall level of total overpayments since its introduction after 2014/15. The new process has been applied to all of the continuously reviewed benefits but has had a particularly large effect on the Housing Benefit estimates. | Fraud and Error in the Benefit System: FYE 2016 Estimates |
| Universal Credit estimates of fraud and error are included in the “Continuously Reviewed” estimates for the first time in the Preliminary 2015/16 results. Full reviews began in October 2014. There is an impact on the total overpayments and underpayments as previously fraud and error were estimated using a proxy measure. | Fraud and Error in the Benefit System: FYE 2016 Estimates |
| Universal Credit introduced a methodology change where the statistics have been split into Reviewed and Cannot Review cases. The latter cases are included in the final statistics but calculated using assumptions as opposed to measured data. | Fraud and Error in the Benefit System: FYE 2016 Estimates |
| The composition of the JSA sample has changed within this publication so that we no longer have a separate sample for newer cases. | Fraud and Error in the Benefit System: FYE 2016 Estimates |
| JSA grossing no longer includes PSU or the yearly split in the calculation of the grossing factors; instead these have been calculated based solely on the client group. The grossing factors now mainly depend upon the national population for JSA, with the same grossing factor applied to all of the sample cases. This reduces the possibility of a relatively small number of cases with very high grossing factors within the sample having a large influence on the reported results, and has led to a decrease in the range of the confidence intervals around the central estimates for JSA. | Fraud and Error in the Benefit System: FYE 2017 Estimates |
| PIP estimates for fraud and error were published for the first time within the 2016/17 final results. There is an impact on the total overpayments and underpayments as previously fraud and error on PIP was estimated using DLA as a proxy measure. | Fraud and Error in the Benefit System: FYE 2017 Estimates |
| Rotational sampling has been introduced, for data collection between April 2017 and September 2019, so that a selection of hard to reach areas will only be selected within the sample at least once in a three-year period. This is the first set of published results that incorporate rotational sampling. Analysis completed on published statistics from previous years shows that the impact would be negligible – with changes to fraud and error levels of less than 0.05% for each benefit affected. | Fraud and Error in the Benefit System: FYE 2018 Estimates |
| In the 2017/18 preliminary estimates we changed the way we gross ESA and PC estimates to using National grossing factors, bringing these benefits in line with JSA, as well as UC and PIP. National grossing tends to reduce the scope for individual cases to have a higher influence on the reported estimates and, consequently, leads to a decrease in the range of the confidence intervals. | Fraud and Error in the Benefit System: FYE 2018 Estimates |
| In 2018, we started to simplify and align the methodology for each benefits reviewed that year. The 2017/18 final publication was the first one to use this new, standardised publication process for JSA, ESA, PC, SP (Official Error checks only), HB and UC. For HB, there was a significant change to how grossing and extrapolation were carried out, when bringing it in line with the other benefits. At an overall benefit view, the effect of the change is negligible (less than 0.1%) – however, when viewing at lower levels, such as the working age/pension age split, a bigger difference can be seen. The previous methodology increased the values associated with pension age claimants and decreased the values of the working age claimants more than the new process does. This also has a knock-on effect on published error reason categories at a total HB level, as reasons associated to a greater degree with either working age or pension age claimants will be affected. | Fraud and Error in the Benefit System: FYE 2018 Estimates |
| The measurement processes are subject to a series of validation checks, which aim to check that the measurement methodology is being correctly implemented. A randomly selected sub-sample of cases are used to create an adjustment across the sample population, by assuming that the same rate of incorrectness/change applies to all cases. The movement to a new publication pipeline methodology and introduction of more refined and targeted data cleansing mean that this Data Quality Adjustment (DQA) is no longer required. The changes resulting from data cleansing and DQA checks are used as the final and correct outcome in the data processing and hence are incorporated directly into the calculations. | Fraud and Error in the Benefit System: FYE 2018 Estimates |
| The 2017/18 final publication included UC estimates that were based on a composite measure of Live and Full Service cases. Calculation of these statistics required UC expenditure to be split by Full and Live Service so that the estimates for each service could be calculated separately before combining for the overall composite measure. The split applied was based on awards information from the UC caseloads data that underpins the national statistics. This was a temporary approach introduced for the 2017/18 final estimates, re-applied for 2018/19 estimates, and will not be required post 2018/19 as the estimates will be based on entirely Full Service samples. | Fraud and Error in the Benefit System: FYE 2018 Estimates |
| A new assumption was introduced in the 2017/18 final publication for UC cases that did not have an effective review, primarily due to the claimant not engaging in the review process, resulting in their benefit claim being terminated. These cases are referred to as cannot review cases and are recorded as Fraud. The new assumption involves re-categorising these cases for reporting purposes following the outcome of checks to determine if the individuals had reclaimed benefit. The cases are re-categorised as Fraud, Not Fraud or inconclusive based on whether the individual reclaimed benefit or there was a suspicion of a specific type of fraud recorded on a case (for instance Capital Fraud). Inconclusive cases are not included in the headline statistics and are instead reported separately in a footnote in the publication. | Fraud and Error in the Benefit System: FYE 2018 Estimates |
| For the 2017/18 final publication, changes were made to the Error Code Framework where we aligned the definition of ‘income – other’ and ‘income – other benefits’ across the six benefits reviewed this year, which has resulted in some small changes for Pension Credit and Housing Benefit pension age customers. | Fraud and Error in the Benefit System: FYE 2018 Estimates |
| Following the evaluation of the pilot of desk based reviews, for the working age passported Housing Benefit client group, between April 2017 and September 2018, it has been decided to continue with face to face reviews for this client group; therefore, the 2017/18 final and the 2018/19 publications are based solely on face to face review cases. The consequence is that for these two publications the sample sizes were smaller for this client group, and the confidence intervals may be wider than in previous years. | Fraud and Error in the Benefit System: FYE 2018 Estimates |
| The UC fraud and error estimates in the published national statistics were previously based on Live Service cases only which is the intermediary system in place to administer UC until the full online service is fully rolled out. MVFE estimates were based on the assumption that Full Service fraud and error rates would be similar to those being found in Live Service. The 2018/19 Universal Credit fraud and error estimates are based on Live and Full service cases. In total 1,998 Universal Credit cases were sampled, around 70% of these cases were Full service. The inclusion of Full and Live Service cases required expenditure assumptions to be updated to reflect the latest proportional service splits. The assumption to re-categorise cases that did not have an effective review, introduced in 2017/18, has also been applied to 4% of sample cases in 2018/19. | Fraud and Error in the Benefit System: FYE 2019 Estimates |
| Between the 2017/18 publications in May and December 2018, we started to simplify and align the methodology for each benefits reviewed this year. This new publication pipeline contained Jobseeker’s Allowance, Employment and Support Allowance, Pension Credit, State Pension (Official Error checks only), Housing Benefit, Universal Credit, Personal Independence Payment. | Fraud and Error in the Benefit System: FYE 2019 Estimates |
| Rotational sampling was introduced so that a selection of hard to reach areas are only selected within the sample, at least once in a three-year period. This rotational sampling was introduced for data collection between April 2017 and September 2019. The areas excluded this year are: October 2018 – September 2019: Cornwall, West Devon, South Hams, Teignbridge, Torridge, Highlands, Moray, and Argyll and Bute. | Fraud and Error in the Benefit System: FYE 2020 Estimates |
| We have strengthened the process for how we deal with combination errors on Housing Benefit as new data has become available to us. | Fraud and Error in the Benefit System: FYE 2020 Estimates |
| We have strengthened the process for how we deal with Housing Benefit cases that have a whole award error and an underpayment. Previously the underpayment would have been taken off the whole award within the netting and capping part of the process, as we would not know how much of the underpayment was valid. In the new process we look to see what the end award of Housing Benefit is after the review, to ensure we more accurately reflect what the loss to the department would have been. For example, if the overpayment would have removed entitlement to Housing Benefit altogether, then we would remove the underpayment. | Fraud and Error in the Benefit System: FYE 2020 Estimates |
| Removal of Arrears Advance: This adjustment only affected Housing Benefit. This adjustment was applied to account for cases that were in arrears or advance as these cases could have more/less error at the time the payment relates to. | Fraud and Error in the Benefit System: FYE 2020 Estimates |
| In 2019/20 we have rolled out the Cannot Review assumption from Universal Credit to the other benefits measured in 2019/20 for cases that did not have an effective review, primarily due to the claimant not engaging in the review process, resulting in their benefit claim being terminated. These cases are referred to as cannot review cases and are recorded as Fraud. The new assumption involves re-categorising these cases for reporting purposes following the outcome of checks to determine if the individuals had reclaimed benefit. The cases are re-categorised as Fraud, Not Fraud or inconclusive based on whether the individual reclaimed benefit or there was a suspicion of a specific type of fraud recorded on a case (for instance Capital Fraud). Inconclusive cases are not included in the headline statistics and are instead reported separately in a footnote in the publication. Previously, Official Error was not netted off from Fraud and Claimant Error on Employment and Support Allowance, Jobseeker’s Allowance (when it was last measured in 2018/19), Pension Credit and Housing Benefit, as they are reviewed in two different periods. When a review is carried out for these cases it is noted whether the Official Error continues into the review week. In over 99% of these cases the error was still there in period when the Fraud and Claimant Error was checked, and therefore netting it off would give a more accurate reflection of the true loss to the department. The note on whether the Official Error continued to the point when the Fraud and Claimant Error check is carried out is not on Housing Benefit. However, since the other benefits mentioned above and Housing Benefit have the same time lag between the Official Error checks and the Fraud/Claimant Error checks, we are confident we can apply this to Housing Benefit as well. | Fraud and Error in the Benefit System: FYE 2020 Estimates |
| We have rolled out the Universal Credit approach for dealing with multiple whole award errors to the other measured benefits. | Fraud and Error in the Benefit System: FYE 2020 Estimates |
| Removal of the Net Programme Value adjustment: This adjustment is only made on cases where a Living Together error was found. Previously we would have looked to see if they were still eligible for benefits after the review, and then changed the whole award Living Together error, to the difference between the amount of DWP benefits the claimant and partner were getting before the review and the amount of DWP benefits the claimant and partner were getting after the review. This was done to more accurately reflect the loss to the department. We have decided to remove this adjustment as it only affects a small number of cases (there were less than 10 of these cases in 2018/19). | Fraud and Error in the Benefit System: FYE 2020 Estimates |
| Move to monthly grossing: We have rolled out the Universal Credit approach for grossing to the other benefits. | Fraud and Error in the Benefit System: FYE 2020 Estimates |
| This year we have made a change to how we attribute the amount overpaid or underpaid to error reasons. For cases that have multiple errors, when capping the error values, we will attribute amounts to reasons in order of which we are most certain of. Any Fraud that is Causal Link (Low Suspicion) has been recategorised to a new category of “Failure to provide evidence/fully engage in the process”. This change has no effect on the amount overpaid or underpaid at a total level or an error type level (i.e. Fraud, Official Error, Claimant Error). | Fraud and Error in the Benefit System: FYE 2021 Estimates |
| State Pension changes: Prior to this year we removed some accounting errors from SP, where an overpayment (or underpayment) error on SP was offset by an equivalent underpayment (or overpayment) of the same amount on Pension Credit. However, this was not the correct approach. We have now stopped removing these accounting errors from within SP this year. The impact of making this change is small (adding £1m to overpayments this year and £8m to underpayments). | Fraud and Error in the Benefit System: FYE 2021 Estimates |
| State Pension changes: We have made a change to remove cases that have a deemed error on them from the calculation of the Official Error rate. | Fraud and Error in the Benefit System: FYE 2021 Estimates |
| State Pension changes: We have made a small change to the calculation of our overall estimates for SP to better reflect changes in the split of expenditure each year between claimants resident in GB and those resident overseas. | Fraud and Error in the Benefit System: FYE 2021 Estimates |
| State Pension changes: We have also made changes to remove the proportion of fraud and error relating to Dependency Increases from our SP estimates. This has only affected the estimates for FYE 2021 and not previous years. | Fraud and Error in the Benefit System: FYE 2021 Estimates |
| The pandemic has driven a move to complete almost all reviews by telephone rather than face to face home visits. | Fraud and Error in the Benefit System: FYE 2021 Estimates |
| Housing Benefit coverage: In FYE 2022, only non-passported working age claims were reviewed. This means that in FYE 2022, the non-passported working age estimates relate to reviews undertaken in FYE 2022, while the passported pension age estimates relate to reviews undertaken in FYE 2020, and the estimates for the remaining groups (passported working age and non-passported pension age) relate to reviews undertaken in FYE 2019. The rates of fraud and error found when each group was last reviewed were applied to the FYE 2022 expenditure, to calculate the total HB estimate for FYE 2022. | Fraud and Error in the Benefit System: FYE 2021 Estimates |
| In order to calculate the monetary value of fraud and error and the proportion of expenditure overpaid we use DWP expenditure figures. Within these figures any case that was getting Housing Benefit and Universal Credit was classed as a non-passported Housing Benefit case. Although not strictly a passporting benefit, those getting Universal Credit and Housing Benefit are treated in a similar way to passported cases (if they are entitled to any Universal Credit their Housing Benefit is paid in full). Due to this we have made the change to the expenditure on Housing Benefit to classify these cases as passported and revised the last year’s figures. | Fraud and Error in the Benefit System: FYE 2021 Estimates |
ISBN: 978-1-78659-524-9