Fraud and error in the benefit system Financial Year Ending (FYE) 2022
Published 26 May 2022
Applies to England, Scotland and Wales

© Crown copyright 2022
This publication is licensed under the terms of the Open Government Licence v3.0 except where otherwise stated. To view this licence, visit nationalarchives.gov.uk/doc/open-government-licence/version/3 or write to the Information Policy Team, The National Archives, Kew, London TW9 4DU, or email: psi@nationalarchives.gov.uk.
Where we have identified any third party copyright information you will need to obtain permission from the copyright holders concerned.
This publication is available at https://www.gov.uk/government/statistics/fraud-and-error-in-the-benefit-system-financial-year-2021-to-2022-estimates/fraud-and-error-in-the-benefit-system-financial-year-ending-fye-2022
1. Introduction
The Department for Work and Pensions (DWP) pays welfare benefits to around 23 million people. ‘Fraud and Error in the Benefit System’ estimates how much money the Department incorrectly pays, either by paying people too much benefit – overpayments – or by not paying enough benefit – underpayments. We calculate this as a percentage of the total amount of benefit we pay – expenditure. We also report on the proportion of cases with an overpayment or underpayment error.
Overpayments and underpayments happen as a consequence of Fraud, Claimant Error and Official Error (processing errors or delays by DWP, a Local Authority, or Her Majesty’s Revenue and Customs (HMRC)).
The rates found are then applied to the expenditure for Financial Year Ending (FYE) 2022 to estimate the monetary amount of Fraud and Error. The benefit expenditure figures used are consistent with Spring Budget 2022.
Estimates in this publication relate to cases sampled between October 2020 and November 2021. For specific time periods relating to the review of each benefit, please see Appendix 1 or Appendix 2 for further information.
We carry out analysis to assure ourselves that the sampling period is representative of the financial year, however actions taken by the Department within the financial year may not always be fully reflected within our statistics.
The reviews and expenditure cover a period impacted by the coronavirus (COVID-19) pandemic.
When comparing FYE 2022 estimates to previous estimates, users should be aware that the FYE 2021 and FYE 2022 estimates were impacted by the coronavirus pandemic, whereas previous estimates were not. Within our publication we normally make comparisons with the previous year. However, in FYE 2021 we only fully measured Universal Credit and Official Error on State Pension. Some comparisons within the publication are between FYE 2022 and FYE 2020. Within that two-year period we are unable to infer when changes have occurred. Housing Benefit is an exception to this. For more detailed information, please see section 7
Next Edition: May 2023
2. Main stories
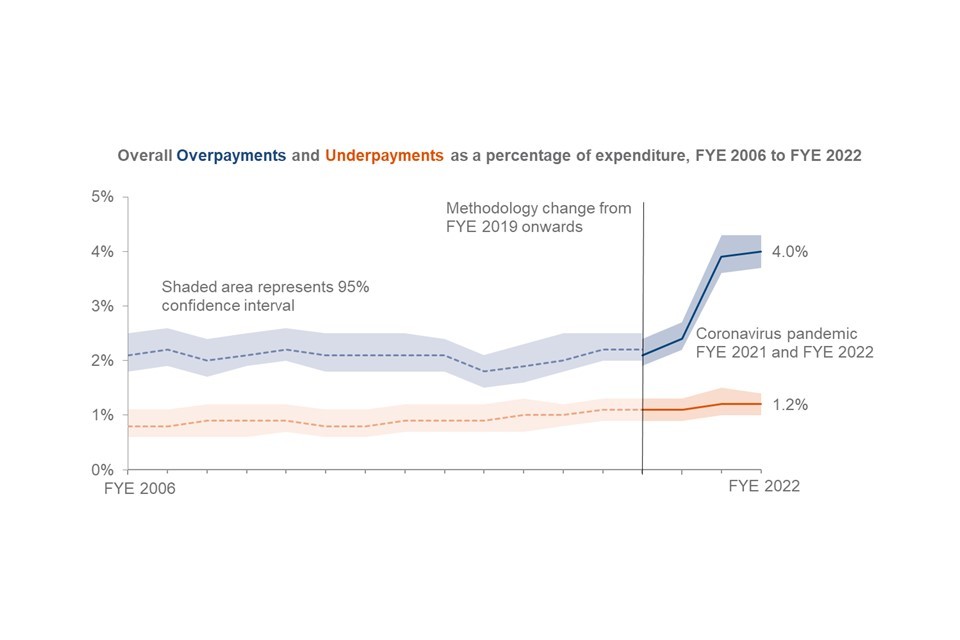
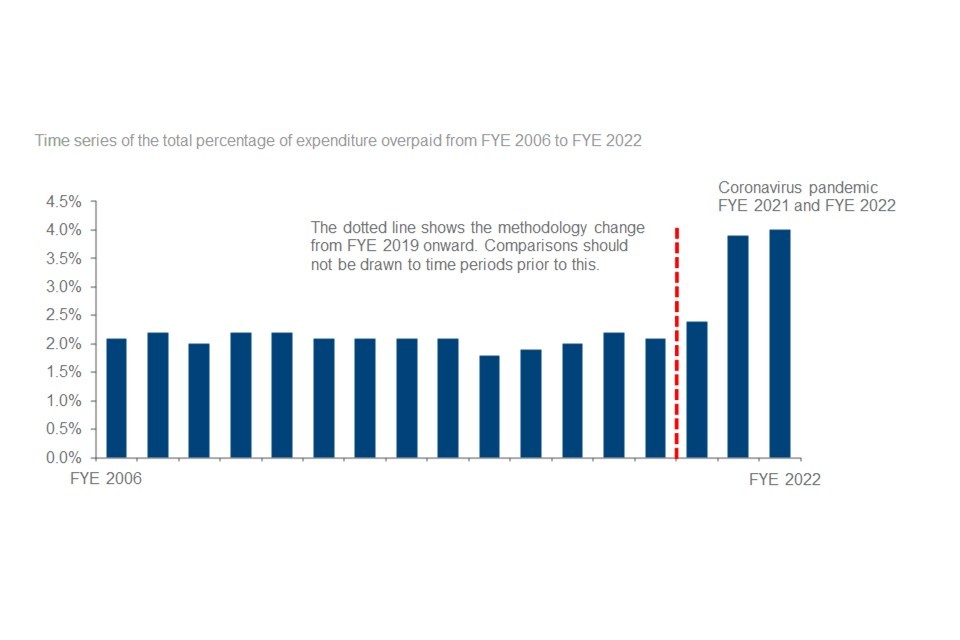
4.0% of benefit expenditure was overpaid in FYE 2022 which is the highest overpayment rate to date:
-
this amounted to £8.6bn of overpayments
-
the overpayment rate has increased from the FYE 2021 rate of 3.9%
1.2% of benefit expenditure was underpaid in FYE 2022:
-
this amounted to £2.6bn of underpayments
-
the underpayment rate has remained the same as the FYE 2021 rate
3. What you need to know
About this document
This document contains estimates of the level of Fraud and Error in the benefit system. The main measure we use is the percentage of benefit expenditure that is overpaid or underpaid. We also show this as an amount in pounds. The amount in pounds could go up, even if the percentage stays the same, if the amount of benefit we pay out in total goes up. The amounts in pounds are not adjusted for inflation. When comparing over time, we recommend comparing percentage rates rather than monetary amounts for these reasons.
We measure Fraud and Error so that we can understand the levels, trends and reasons behind it. This understanding supports decision making on what actions DWP can take to reduce the level of Fraud and Error in the benefit system. The National Audit Office takes account of the amount of Fraud and Error when they audit DWP’s accounts each year.
These estimates relate to the levels of Fraud and Error in the benefit system in Great Britain. They are underpinned by reviews of benefit claimants in England, Wales and Scotland. The benefit expenditure figures used in this publication also include people resident overseas who are receiving United Kingdom benefits, except for Over 75 TV Licences and Financial Assistance Scheme payments which also cover Northern Ireland. All other benefit expenditure on residents of Northern Ireland is the responsibility of the Northern Ireland Executive. The benefit expenditure figures do not include amounts devolved to Scottish Government (which totalled £3.3 billion in FYE 2022).
Published tables and data
The figures in this document are a selection from our reference tables. The tables contain further breakdowns of the results presented in this report by different characteristics, with time series data back to FYE 2006 for some benefits.
How we measure fraud and error
We take a sample of benefit claims from our administrative systems (we sampled around 12,840 for FYE 2022, equating to 0.06% of benefit claimants). DWP’s Performance Measurement team look at the data we hold on the systems and then contact claimants to arrange a review.
As part of the review we ask claimants to provide evidence such as identity, bank account details and other information that could affect their benefit claim (for example, childcare costs). We assess if the claim is correct or not. If the claim is not correct, we look at the amount of money the claim is wrong by and classify it as one of the following:
- Fraud
- Claimant Error
- Official Error
Read more about definitions of Fraud, Claimant Error and Official Error.
Coronavirus (COVID-19) impacts
In previous years we have carried out reviews by both home visit and phone. Due to the coronavirus pandemic all reviews carried out this year and last have been completed by phone. We have assumed that carrying out all reviews by phone has not impacted the total estimates of Fraud and Error across all benefits. We have made the decision to permanently move to phone reviews from now on.
Following a pause in the review of most benefits in FYE 2021 (where only Universal Credit and Official Error for State Pension were reviewed), we have returned to a full programme of benefit reviews for FYE 2022.
Because we did not measure most benefits in FYE 2021, we carried out analysis to assess the impact of operational easements and changes to benefit administration that were introduced as a consequence of the coronavirus pandemic. For the benefits that are still impacted by easements, and that we have not measured this year, we have updated this analysis. See Appendix 3 for further information relating to this.
Comparisons to previous years
For the benefits that we did not review in FYE 2021 we rolled forward the rates from FYE 2020. We did this at benefit and error type level in order to generate a total (global) level of Fraud and Error for all benefits in FYE 2021. We did not publish error reason breakdowns for these benefits in FYE 2021. In order to allow detailed comparisons to be carried out at the error reason level for FYE 2022, which allows us to understand what is driving changes in Fraud and Error, comparisons for benefits that we did not review last year are made to FYE 2020, which was the last time these benefits were measured. Within that two-year period, we are unable to infer when changes have occurred. Housing Benefit is an exception to this. For more detailed information, please see section 7.
Universal Credit was measured in FYE 2021 and so comparisons are made between FYE 2022 and FYE 2021.
State Pension was also measured in FYE 2021 but comparisons to previous years aren’t valid to make. See section 6 for further information relating to this.
Attendance Allowance was measured for the first time this year and so no comparisons to previous financial years are available.
Fraud and Error – rates and monetary values
For benefits measured this year, the monetary value of Fraud and Error is calculated using the percentage of Fraud and Error found in our sample:
(Percentage of Fraud and Error) x (Benefit expenditure)
Even if the rate of Fraud and Error is decreasing, if the benefit expenditure is increasing, we could see a higher monetary value and vice versa.
For example: The total rate of Overpayments on ESA increased from 3.9% to 4.0% between FYE 2020 and FYE 2022, but decreased in monetary value between these two financial years, from £520m to £500m.
Therefore, it is usually better to compare rates of overpayments and underpayments, rather than monetary values, and is why statistically significant changes to monetary values are not highlighted.
Fraud and Error – proportion of cases with Fraud or an Error
The methodology we use to calculate the proportion of cases with Fraud, an overpayment error or an underpayment error is:
Proportion of cases with Fraud or an overpayment error = (number of cases in the sample with Fraud or an overpayment error) / (number of cases in the sample)
Proportion of cases with an underpayment error = (number of cases in the sample with an underpayment error) / (number of cases in the sample)
A case can have both an overpayment error/Fraud and an underpayment error for different error reasons. These cases will be reported in both the proportion of cases with an overpayment error/Fraud and the proportion of cases with an underpayment error. Therefore, these figures cannot be summed together to obtain the total proportion of cases with fraud and/or error.
For more detail please see section 5 of our background information and methodology note.
Methodology changes
A number of methodology changes have been made to this year’s estimates of Fraud and Error in the benefit system. Revised figures for FYE 2020 and FYE 2021 using the new methodology are included in this publication where possible and are used when making comparisons to this year’s figures.
Further details on these changes are available in this publication and in section 2 of our background information and methodology note. Changes to the expenditure splits on Housing Benefit have the largest impacts. More details regarding this can be found in section 7.
Statistical significance and confidence intervals
These estimates are based on a sample of benefit claims receiving a monetary payment. Choosing a different sample might give us a different estimate. The figure we quote is the central estimate. We also show a range around the central estimate, called a Confidence Interval. A simplified view of this is that we are 95% sure that the true value lies within this interval (for a more detailed explanation, see section 6 of our background information and methodology note).
Statistical significance is an expression that says whether an estimated value is likely to have arisen only from variations in the sampling. It is most often used when talking about a change or a difference: a significant change or difference is one that is not likely to be due only to the sampling and is therefore likely to be a real change or difference. In this publication we note when changes between the years being compared are statistically significant.
Definitions of Fraud, Claimant Error and Official Error
In this publication we classify incorrect claims as follows.
Fraud
Cases where all three of the following conditions apply:
-
the conditions for receipt of benefit, or the rate of benefit in payment, are not being met
-
the claimant can reasonably be expected to be aware of the effect on entitlement
-
benefit stops or reduces as a result of the review
Claimant Error
The claimant has provided inaccurate or incomplete information, or failed to report a change in their circumstances, but there is no evidence of fraudulent intent on the claimant’s part.
Official Error
Benefit has been paid incorrectly due to a failure to act, a delay or a mistaken assessment by the DWP, a Local Authority or Her Majesty’s Revenue and Customs to which no one outside of that department has materially contributed, regardless of whether the business unit has processed the information.
4. Total Estimates of Fraud and Error across all benefit expenditure
The total overpayment rate in FYE 2022 was 4.0%, which is broadly the same as FYE 2021. However, this is the highest reported overpayment rate to date. The total underpayment rate remained the same as FYE 2021 at 1.2%. The total overpayment and underpayment rates are estimates of Fraud and Error across all benefit expenditure.
Total benefit expenditure increased by 2.1% (£4.1bn), primarily due to Universal Credit expenditure rising from £38.2bn in FYE 2021 (18.0% of expenditure) to £40.4bn in FYE 2022 (18.7% of expenditure) as a result of an increase in the number of UC claimants and UC Benefit Uprating.
Overpayments
The total rate of overpayments was 4.0% in FYE 2022, an increase of 0.1 percentage points from 3.9% in FYE 2021. This was not a statistically significant increase.
The total monetary value of overpayments increased to £8.6bn in FYE 2022, from £8.2bn in FYE 2021.
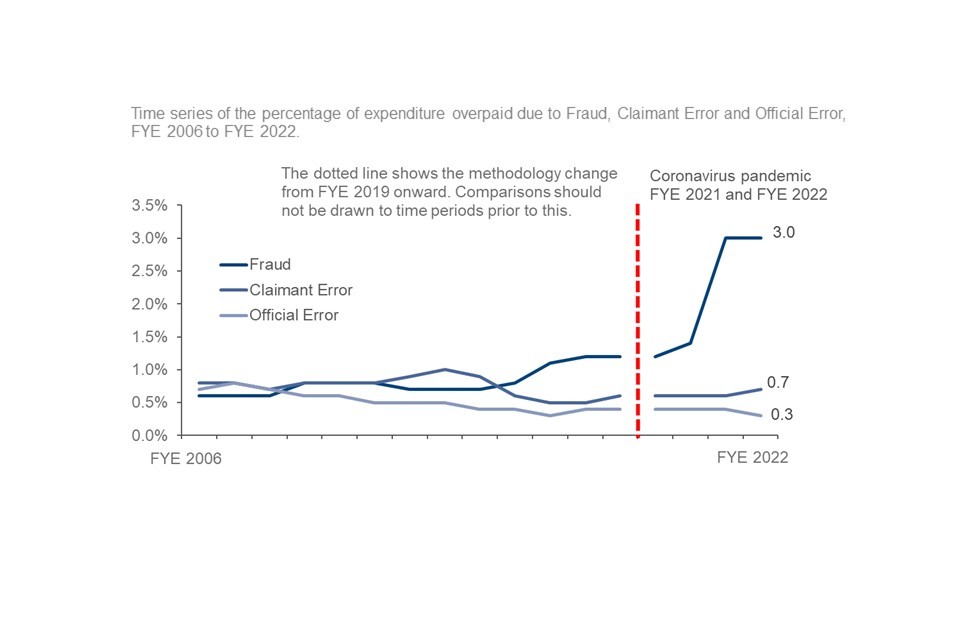
The rate of Fraud overpayments was 3.0%, which is a slight increase from 2.9% in FYE 2021. The monetary value of Fraud overpayments increased from £6.2bn to £6.5bn.
The rate of Claimant Error overpayments was 0.7%, a small increase from 0.6% in FYE 2021 and the monetary value of Claimant Error overpayments increased from £1.3bn to £1.5bn.
The rate of Official Error overpayments was 0.3%, a small decrease from 0.4% in FYE 2021 and the monetary value of Official Error overpayments decreased from £0.8bn to £0.7bn.
None of these increases or decreases were statistically significant.
Underpayments
The total rate of underpayments in FYE 2022 has remained the same as FYE 2021 at 1.2%, and the total monetary value of underpayments increased to £2.6bn, from £2.5bn.
The rise in expenditure accounted for the rise in the total monetary value of underpayments.
The rate of Claimant Error underpayments remained the same as in FYE 2021 at 0.7% and the monetary value of Claimant Error underpayments also remained the same at £1.5bn.
The rate of Official Error underpayments saw a small increase from 0.4% (£0.9bn) in FYE 2021 to 0.5% (£1.1bn) in FYE 2022. The monetary value of Official Error underpayments increased (due to a rise in overall expenditure). This is not a statistically significant increase.
There are 3 categories of error that were recorded for the first time this year on State Pension. If those newly recorded errors were excluded then the global underpayment rate would have fallen to 1.1%.
Net loss from overpayments
DWP can recover overpayments from people – this means not all of the £8.6bn is lost, and we can describe a net loss figure which deducts recoveries from total overpayments. In FYE 2022, we recovered £1.0bn of overpayments (£0.4bn Housing Benefit and £0.6bn other DWP benefits). This was a slight increase from £0.8bn in FYE 2021.
Note that some recoveries made by DWP are not included in our net loss estimate as they do not relate to our Fraud and Error reporting (mainly recoveries of tax credits and of benefit advances).
The net rate of loss from overpayments in FYE 2022 was 3.5% (£7.6bn). This is a small decrease from the FYE 2021 rate of 3.6% (£7.6bn).
5. Universal Credit Overpayments and Underpayments
Universal Credit (UC) is a payment to help with living costs for people who are in work on a low income, or for those who are out of work. Eligibility for UC depends on individual circumstances and location.
Advances for UC are not part of the benefit payment itself. We therefore do not review Fraud and Error on UC advances.
For more information see section 3 of the background information and methodology note.
The expenditure on UC increased from £38.2bn in FYE 2021 to £40.4bn in FYE 2022. This means that the monetary values of Fraud and Error cannot be directly compared between years.
Ongoing coronavirus (COVID-19) pandemic impacts on UC
The coronavirus pandemic continued to have consequences that affected UC in several ways during FYE 2022:
-
the makeup of the caseload continued to differ compared with the pre-pandemic period. Fraud and Error has been impacted due to an increased requirement for support for particular claimant groups, for example self-employed claimants, and this has been sustained into FYE 2022
-
the department is undertaking a programme of work to review UC claims that were made when verification was not required due to COVID-19 easements in order to ensure these cases are correct. This work was ongoing during the sampling period and the effects of the corrective action are unlikely to be fully reflected in these statistics
-
the Minimum Income Floor (MIF) is an assumed level of earnings used in the monthly UC payment calculation. It affects UC claimants whose main source of income is from self-employment. The MIF was temporarily suspended to help UC claimants during the pandemic and has been reinstated in a phased approach that started in August 2021. We estimate that the overpayment rate for FYE 2022 could have been between 13.8% and 13.9% had the MIF not been suspended due to COVID-19
The UC overpayment rate in FYE 2022 was 14.7% (£5.9bn), which is broadly the same as FYE 2021, where it was 14.5% (£5.5bn). However, this is the highest reported UC overpayment rate to date. This was not a statistically significant increase.
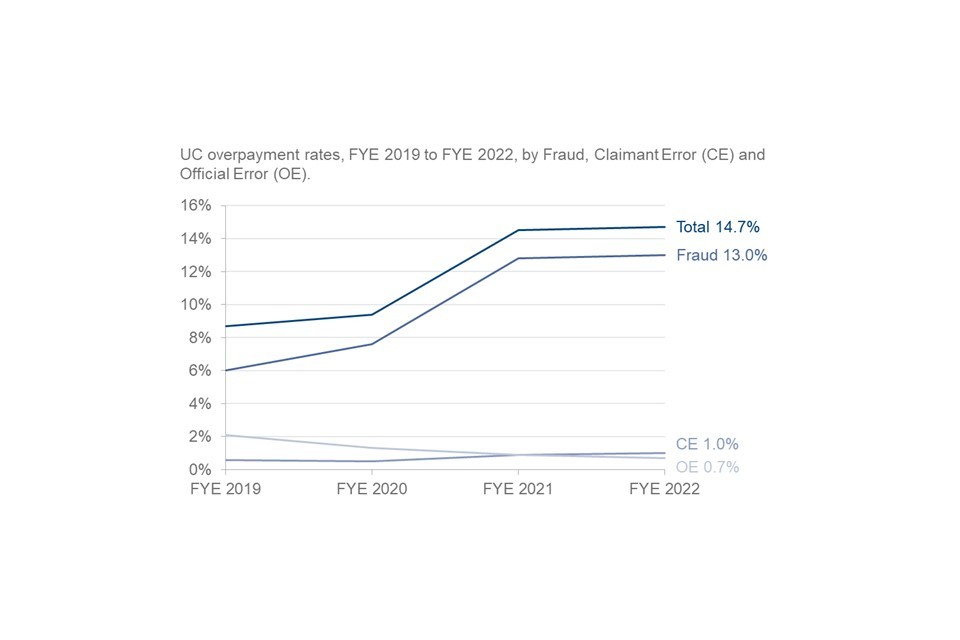
The UC Fraud overpayment rate was at the highest recorded level of 13.0% (£5.3bn) in FYE 2022, compared with 12.8% (£4.9bn) in FYE 2021. This was not a statistically significant increase.
The overpayment rate had increased substantially between FYE 2020 and FYE 2021, due to rising levels of Fraud, and this was sustained into FYE 2022.
The largest increases in Fraud overpayments were due to Failure to Provide Evidence/Engage and Household Composition.
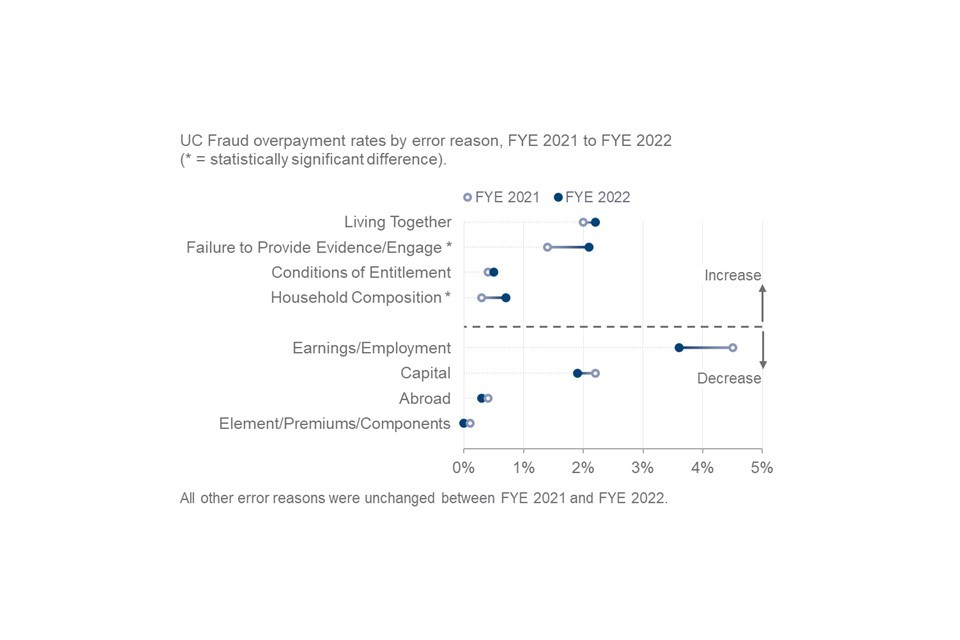
Whilst the rate of Fraud for FYE 2022 remained similar to FYE 2021 overall, there were differences at the individual error reason level as follows:
-
the largest rise in Fraud was due to ‘Failure to Provide Evidence/Engage’, which increased from 1.4% in FYE 2021 to 2.1% in FYE 2022. The increase of 0.7 percentage points was statistically significant and due to a higher number of cases in this category. These are cases where the claimant did not engage in the review process or failed to provide the required evidence after the review and there was no prior suspicion of fraudulent intent. For further information, please see section 2 of the Background Information and Methodology note
-
Household Composition Fraud more than doubled from 0.3% in FYE 2021 to 0.7% in FYE 2022. There was a higher number of claims incorrectly receiving a child element where the child or qualifying young person did not meet the criteria for entitlement. For example, the child is no longer in full time education and thus they are now classed as non-dependents, or the child is no longer living in the household. This was a statistically significant increase
-
Earnings/Employment remained the largest source of Fraud in FYE 2022. This mainly related to Self Employed Earnings, which was 3.3% in FYE 2022 compared with 3.7% in FYE 2021. This was not a statistically significant decrease. Self-Reported Earnings Fraud, relating to employee earnings manually declared by the claimant, decreased from 0.8% to 0.3% between FYE 2021 and FYE 2022. This was a statistically significant decrease
-
Living Together was the second largest source of Fraud at 2.2% in FYE 2022, compared with 2.0% in FYE 2021. This surpassed Capital, which became the third largest known source of Fraud, at 1.9% in FYE 2022, compared with 2.2% in FYE 2021. Neither change was statistically significant
Claimant Error overpayments were at their highest recorded level of 1.0% (£400m) in FYE 2022, compared with 0.9% (£330m) in FYE 2021. This was not a statistically significant increase.
Official Error overpayments were at their lowest recorded level of 0.7% (£270m) in FYE 2022, compared with 0.9% (£330m) in FYE 2021. This was not a statistically significant decrease, although it continued a longer-term trend of decreasing Official Error overpayments.
The proportion of UC cases with Fraud or an overpayment error remained broadly stable. It was 24 in 100 cases in FYE 2021, compared with 25 in 100 cases in FYE 2022. This was not a statistically significant increase.
UC underpayments were at their joint-lowest level of 1.0% (£410m) in FYE 2022, compared with 1.4% (£540m) in FYE 2021. This was a statistically significant decrease.
Underpayments were last at this level in FYE 2018.
The decrease in Universal Credit underpayments was driven by a decrease of 0.4 percentage points in Claimant Error (CE).
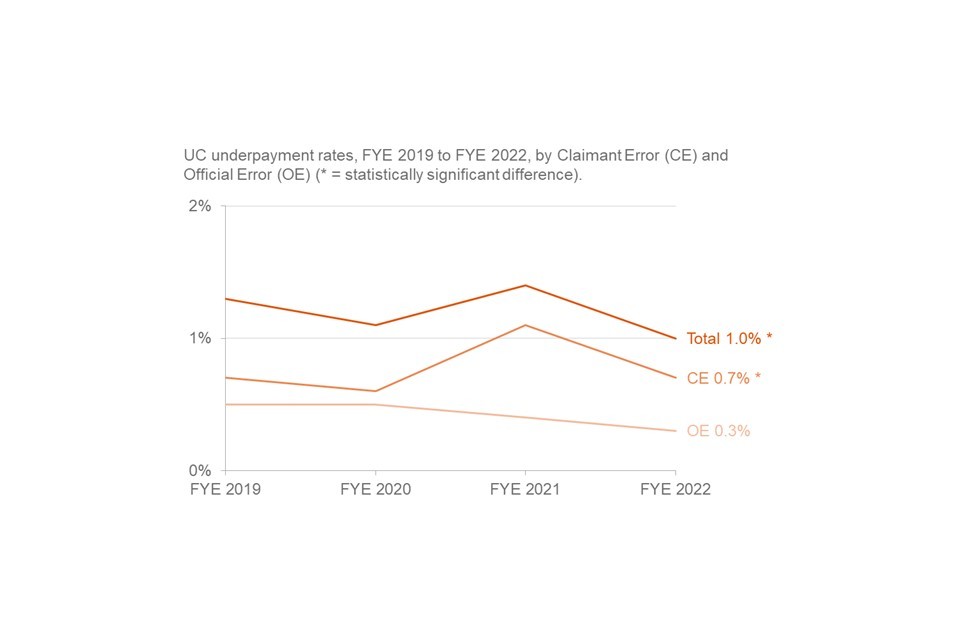
Claimant Error underpayments decreased from 1.1% (£400m) to 0.7% (£270m) between FYE 2021 and FYE 2022. This was a statistically significant decrease.
Claimant Error underpayments had previously increased by 0.5 percentage points, between FYE 2020 and FYE 2021, to their highest recorded level.
The decrease in Claimant Error underpayments was driven by Housing Costs, which reduced from 0.5% in FYE 2021 to 0.2% in FYE 2022. It remained the largest source of Claimant Error underpayments in FYE 2022. The decrease was related to a lower number of claimants having no housing element in payment when they were entitled to it. This was a statistically significant decrease.
Official Error underpayments were at their lowest recorded level of 0.3% (£140m) in FYE 2022, compared with 0.4% (£140m) in FYE 2021. This was not a statistically significant decrease, although it continued a long-term decreasing trend.
The proportion of UC cases with an underpayment error decreased from 12 in 100 cases to 11 in 100 cases between FYE 2021 and FYE 2022. This was a statistically significant decrease.
The proportion of UC cases with a Claimant Error underpayment decreased from 11 in 100 cases to 9 in 100 cases between FYE 2021 and FYE 2022. This was a statistically significant decrease.
6. State Pension Overpayments and Underpayments
We have updated our methodology to estimate the amount of Fraud and Error on overseas cases. This has a very small impact on CE overpayments. Further information, can be seen in section 2 of our background information and methodology note.
State Pension (SP) is the benefit with the highest expenditure. In FYE 2022, State Pension expenditure was £104.5bn, a little under half of total benefit expenditure. This was an increase from £101.2bn in FYE 2021. A full review of State Pension has been undertaken for FYE 2022, which checks for Fraud, Claimant Error and Official Error. This is the first time since FYE 2006 that a full review has been carried out, with only Official Error being measured in the intervening years and rates of Fraud and Claimant Error rolled forward from FYE 2006.
Previously, Official Error only reviews never involved contact with the customer and were carried out by reviewing evidence held by the department. In FYE 2022, as part of the full review of State Pension, the process involved directly contacting customers, and this created the opportunity to ask them questions, and has resulted in some types of Official Error being identified within these statistics for the first time. More information can be found in section 2 of the background information and methodology note.
This means that rates of Official Error and overall rates for the FYE 2022 cannot be directly compared with previous years.
The total overpayment rate for State Pension was 0.1% (£110m).
The Official Error overpayment rate for State Pension was 0.0% (£50m).
The Claimant Error overpayment rate for State Pension was 0.0% (£50m).
The Fraud overpayment rate for State Pension was 0.0% (£20m).
The proportion of SP cases with an overpayment error was 3 in 100.
The total underpayment rate for State Pension in FYE 2022 was 0.5% (£540m).
Control Activities are the main cause of SP Underpayments.
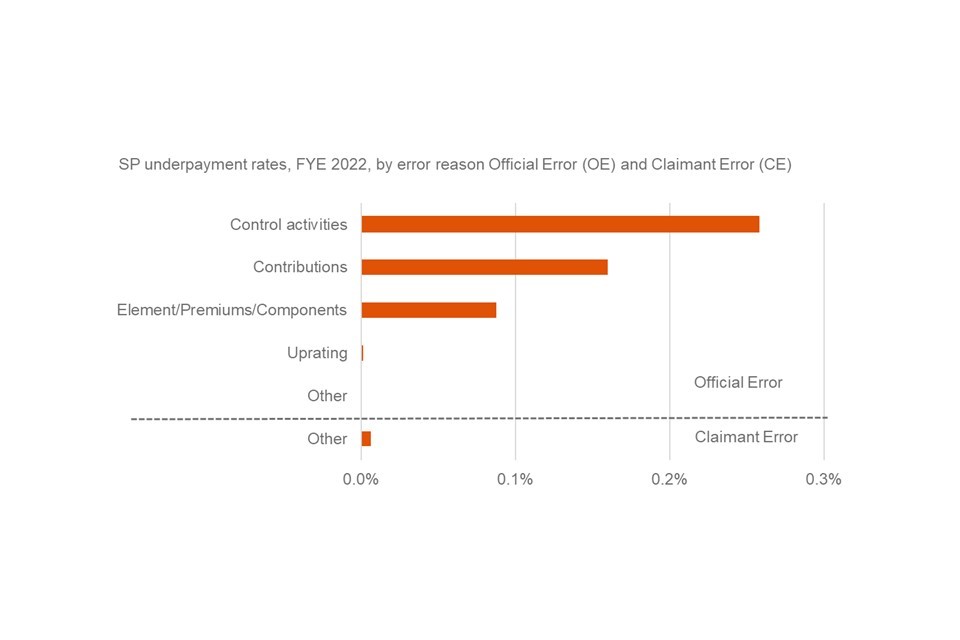
The Official Error underpayment rate was 0.5% (£530m) and is the main cause of State Pension underpayments.
The main reason for Official Error underpayments was Control Activity errors, with a rate of 0.3%. The main types of underpayment within this category are:
-
people who are married or in a civil partnership who reached State Pension age before 6 April 2016 and may be automatically entitled, following a 2008 legislative change, to a Category BL State Pension uplift based on their husband, wife or civil partners National Insurance contributions
-
people who have been widowed and their State Pension was not uplifted to include amounts they are entitled to inherit from their late husband, wife, or civil partner
-
people who have not been paid Category D State Pension uplift as they should have been from age 80
The second largest reason for Official Error underpayments is Contributions, with a rate of 0.2%. The main type of underpayment within this category relates to historic recording of Home Responsibilities Protection (HRP) (administered by HMRC). For people reaching State Pension age before 6 April 2010, Home Responsibilities Protection (HRP) reduced the number of qualifying years needed for a basic State Pension where someone stayed at home to care for children for whom they received Child Benefit or a person who was sick or disabled. For people reaching SP age since 6 April 2010, previously recorded periods of HRP were converted into National Insurance credits. Errors occurred where periods when HRP was due were not accurately recorded on their National Insurance record. These errors have been identified in these statistics for the first time due to the department contacting customers as part of the benefit review process.
The Official Error underpayment rate and total underpayment rate cannot be directly compared with previous years due to the Official Errors being identified for the first time in these statistics due to the department contacting customers as part of the benefit review process.
If the errors recorded for the first time this year were excluded, then this would provide comparable rates to FYE 2021. The Official Error and total underpayment rates would have been 0.3% which would have been the same as FYE 2021.
The Claimant Error underpayment rate was 0.0% and is the same rate as when last reviewed in FYE 2006.
The proportion of SP cases with an underpayment error was 11 in 100.
Exclusion of Uprating Official Errors from the proportion of cases in Error
Many years ago, small value errors caused by how the Pension Strategy Computer System (PSCS) uprates the Graduated Retirement Benefit component of State Pension, with 98% being equal to 1p or 2p per week (and all below 10p) were identified. A decision was made in 2002 not to make changes or corrections given systems complexity and minimal impact on individuals until a new computer system was introduced. For the first time, these have been recorded as part of our reviews this year. We have taken a de minimis approach to these Official Errors (removal of all errors below 10p), which means they have been excluded from our reporting on proportion of cases with an overpayment or underpayment error. This is due to the impact they would have on the estimate of Official Error in relation to the value and level of these errors, and the potential to mislead users of the statistics, including those in receipt of State Pension. For overpayments these errors affected 17 in 100 cases and for underpayments 23 in 100.
A case can have both an uprating error and an error for a different reason. These cases will be reported in both the proportion of cases with an error and the proportion of cases with an uprating error. Therefore, these figures cannot be summed together.
7. Housing Benefit Overpayments and Underpayments
Note that HB estimates for FYE 2022 in this document are compared to HB estimates for FYE 2021, even though HB was last measured in FYE 2020. This is because Fraud and Error on Housing Benefit was affected by changes in the caseload between FYE 2020 and FYE 2021.
Housing Benefit (HB) can help pay rent for people who are unemployed, on a low income, or claiming benefits. How much they get depends on their income and circumstances. For working age people, HB is being replaced by Universal Credit (UC), so they will gradually move onto UC instead. Working age people cannot make new claims for HB unless they are in supported, sheltered or temporary housing. Pension age people can continue to make new claims to HB.
The expenditure on HB for the FYE 2022 was £16.5bn. This has decreased by £0.8bn from the FYE 2021 expenditure of £17.3bn. This was due to HB working age claimants moving onto UC.
The estimates within this publication relate to Housing Benefit as an overall total, but estimates are also published split by age group, for working age and pension age claimants (see reference tables). These two groups are made up of “passported” cases (who get HB because they receive another qualifying income-related benefit) and “non-passported” cases (who get HB without one of these qualifying benefits). This means that HB is made up of four groups: passported working age, non-passported working age, passported pension age and non-passported pension age.
The four groups combine to produce total HB estimates. The four groups have different effects on the total HB estimates depending on how many cases of each type are present within the overall HB caseload. Changes caused by differences in the caseload can be large, because there is a lot of variation in the rates of Fraud and Error between the four groups.
Only non-passported working age claims were reviewed in FYE 2022. The estimates for the other groups relate to reviews undertaken in previous years, and hence the rates of Fraud and Error found when each group was last measured have been applied to the FYE 2022 expenditure.
The estimates for FYE 2021 and FYE 2020 have been revised this year, due to a change made to the Housing Benefit expenditure data. The HB expenditure data used in the calculations included Universal Credit as a non-passporting benefit. The expenditure data has been adjusted to categorise UC as a passporting benefit because people in receipt of UC who are in supported, sheltered or temporary housing are treated similarly to those claimants in receipt of other income-related benefits. There were more claimants receiving HB due to being in receipt of UC in FYE 2021 than in FYE 2020. This means that the expenditure adjustment had more of an effect on the FYE 2021 estimates. For this reason, comparisons are made to FYE 2021 even though HB was last measured in FYE 2020.
For FYE 2021, since none of the groups were measured, the rates of Fraud and Error found in previous years were applied to the FYE 2021 expenditure. Whilst the rate of Fraud and Error has been rolled forward for the four groups, the rates for the HB total, working age and pension age are not the same in FYE 2021 as they were in FYE 2020. This is because the proportion of the caseload that each of the groups makes up has changed.
Between FYE 2020 and FYE 2022, there was a decrease in non-passported working age cases as a proportion of the total HB caseload. Fraud and Error are higher for the non-passported working age group than the other three groups. The decrease in the proportion of these cases meant that Fraud and Error reduced in the total HB estimates. Since the decrease in cases occurred gradually over time, the reduction in Fraud and Error can be seen in the FYE 2021 estimates, with a further reduction in the FYE 2022 estimates.
As a result of the changes in the make-up of the caseload, there were decreases in HB overpayments and underpayments.
The total HB overpayment rate decreased from 5.5% (£950m) in FYE 2021 to 5.2% (£860m) in FYE 2022. This was not a statistically significant decrease.
The decrease in HB overpayments was driven by a decrease in Fraud.
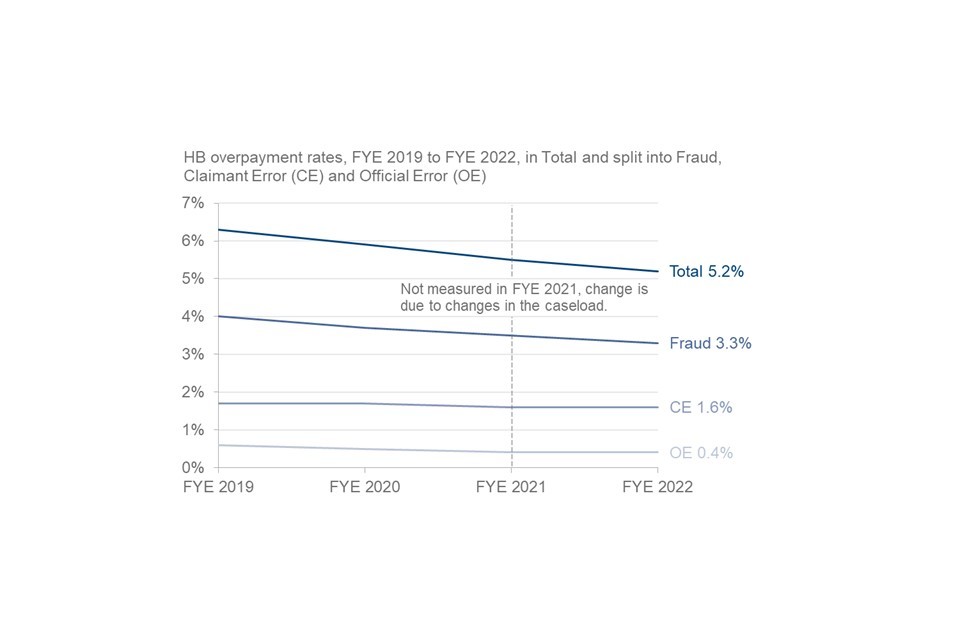
Fraud overpayments decreased from 3.5% (£600m) in FYE 2021 to 3.3% (£540m) in FYE 2022. This was not a statistically significant decrease.
The decrease in Fraud overpayments was due to a statistically significant decrease in Earnings/Employment Fraud.
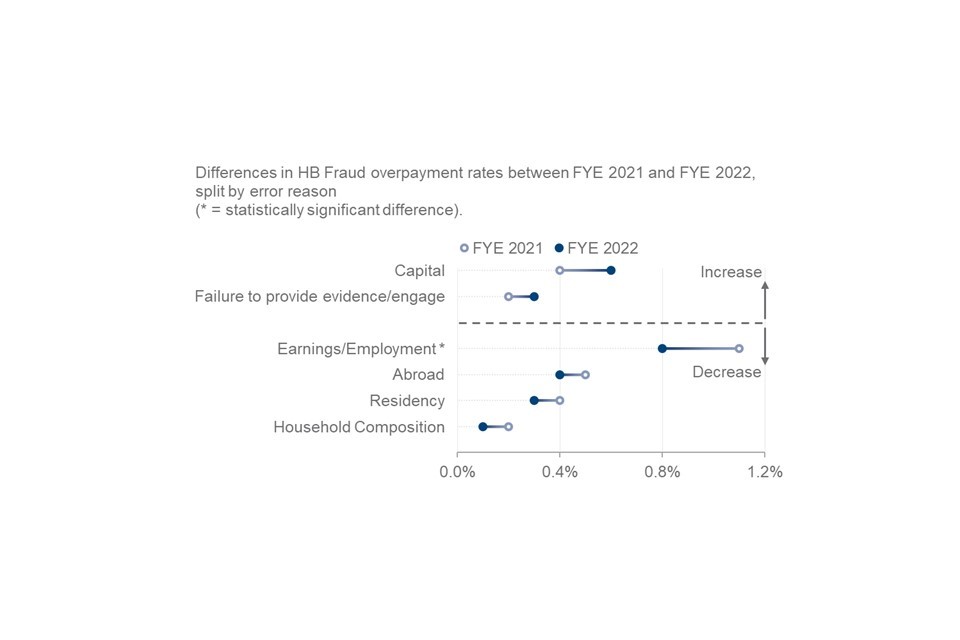
Earnings/Employment Fraud decreased from 1.1% in FYE 2021 to 0.8% in FYE 2022. Earnings/Employment errors for HB are split into two groups: employees and self-employed. The decrease was due to a statistically significant decrease in Employee Earnings Fraud, which fell from 0.9% in FYE 2021 to 0.6% in FYE 2022. This decrease was partially due to a decrease in Employee Earnings Fraud in the non-passported working age group reviewed in FYE 2022, and partially due to the changes in the caseload.
Claimant Error overpayments remained at the FYE 2021 rate of 1.6%. The monetary amount overpaid decreased from £280m in FYE 2021 to £260m in FYE 2022 due to the decrease in HB expenditure.
Official Error overpayments remained at the FYE 2021 rate and monetary value of 0.4% (£70m).
The proportion of HB cases with overpayments decreased from 21 in 100 cases in FYE 2021, to 20 in 100 cases in FYE 2022. This was a statistically significant decrease. It was driven by a statistically significant decrease in the proportion of cases with Fraud overpayments, from 6 in 100 cases in FYE 2021, to 5 in 100 cases in FYE 2022.
The total HB underpayment rate decreased from 1.4% (£250m) in FYE 2021 to 1.3% (£210m) in FYE 2022. This was not a statistically significant decrease.
The decrease in HB underpayments was driven by a statistically significant decrease in Claimant Error.
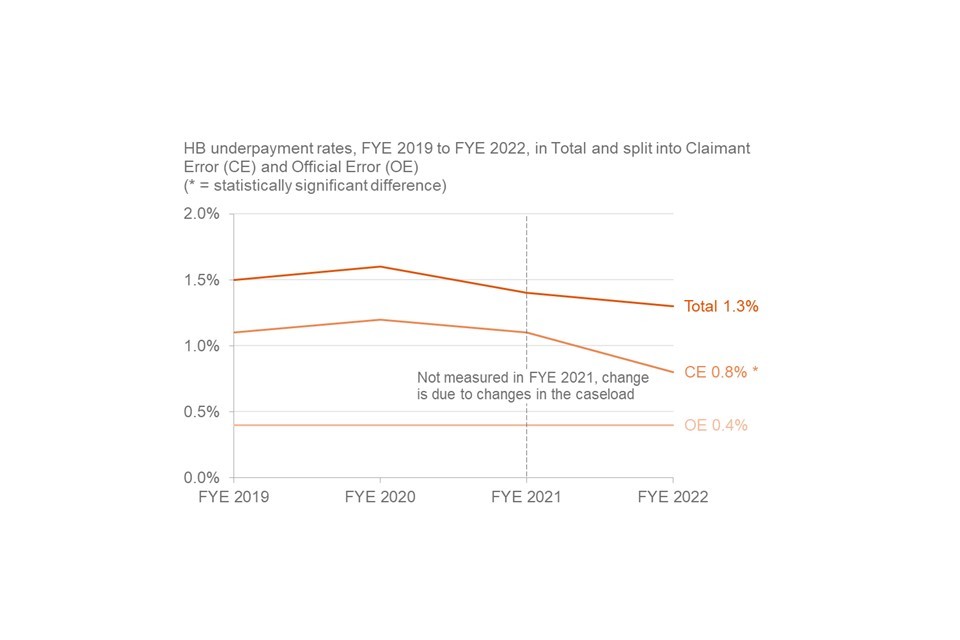
Official Error underpayments remained at the FYE 2021 rate and monetary value of 0.4% (£70m).
Claimant Error underpayments decreased from 1.1% (£180m) in FYE 2021 to 0.8% (£140m) in FYE 2022.
The decrease in Claimant Error underpayments was due to a statistically significant decrease in Earnings/Employment Claimant Error.
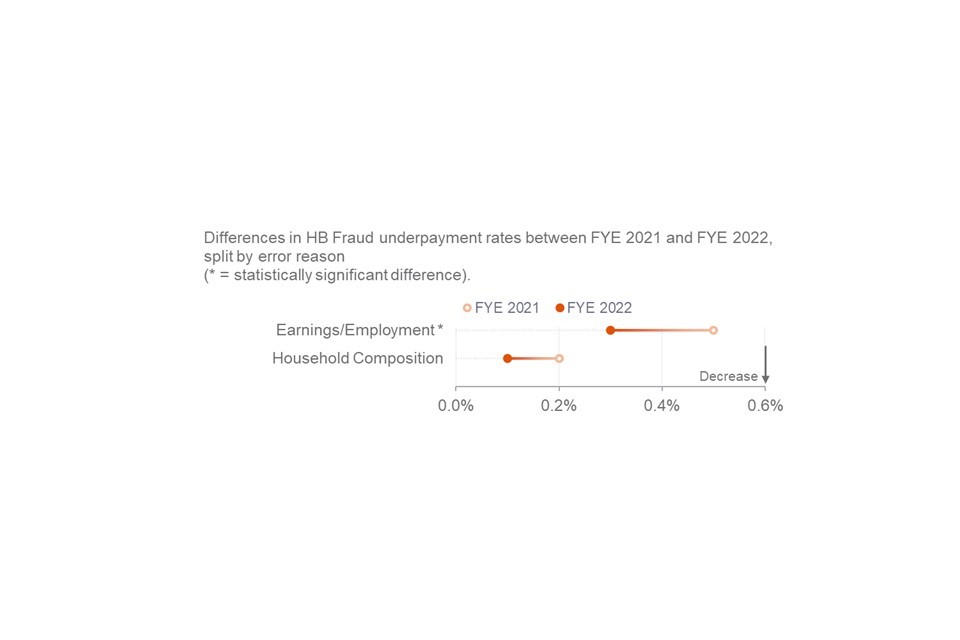
Earnings/Employment Claimant Error decreased from 0.5% in FYE 2021 to 0.3% in FYE 2022. The decrease was due to a statistically significant decrease in Employee Earnings Claimant Error, which fell from 0.4% in FYE 2021 to 0.3% in FYE 2022. This decrease was partially due to a decrease in Employee Earnings Claimant Error in the non-passported working age group reviewed in FYE 2022, and partially due to the changes in the caseload.
The proportion of HB cases with underpayments decreased from 15 in 100 cases in FYE 2021, to 14 in 100 cases in FYE 2022. This was not a statistically significant decrease. It was driven by a statistically significant decrease in the proportion of cases with Claimant Error underpayments, from 10 in 100 cases in FYE 2021, to 9 in 100 cases in FYE 2022.
8. Employment and Support Allowance Overpayments and Underpayments
Note that ESA estimates for FYE 2022 in this document are compared to ESA estimates from FYE 2020, which was the last time ESA was measured. Within the two-year period we are unable to infer when changes have occurred.
Employment and Support Allowance (ESA) is paid in support of people who have limited capability to work due to disability or illness. ESA provides personalised help to return to work for claimants with sufficient capability.
The expenditure on ESA for the FYE 2022 is £12.6bn. This has decreased by £0.8bn from the FYE 2020 expenditure of £13.4bn.
The total ESA overpayment rate has increased from 3.9% (£520m) in FYE 2020 to 4.0% (£500m) in FYE 2022. This was not a statistically significant increase.
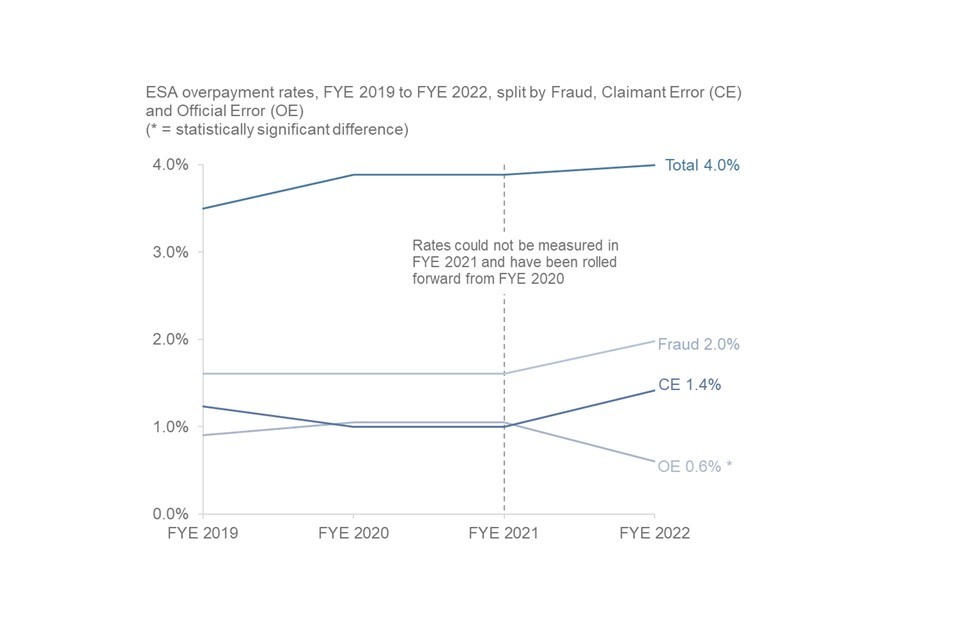
This increase is due to increases in the rates of overpayments for Fraud and Claimant Error, offset partly by a statistically significant decrease in Official Error between FYE 2020 and FYE 2022.
Capital remained the largest error reason for ESA overpayments and has also seen the largest increase, from 0.9% in FYE 2020 to 1.3% in FYE 2022.
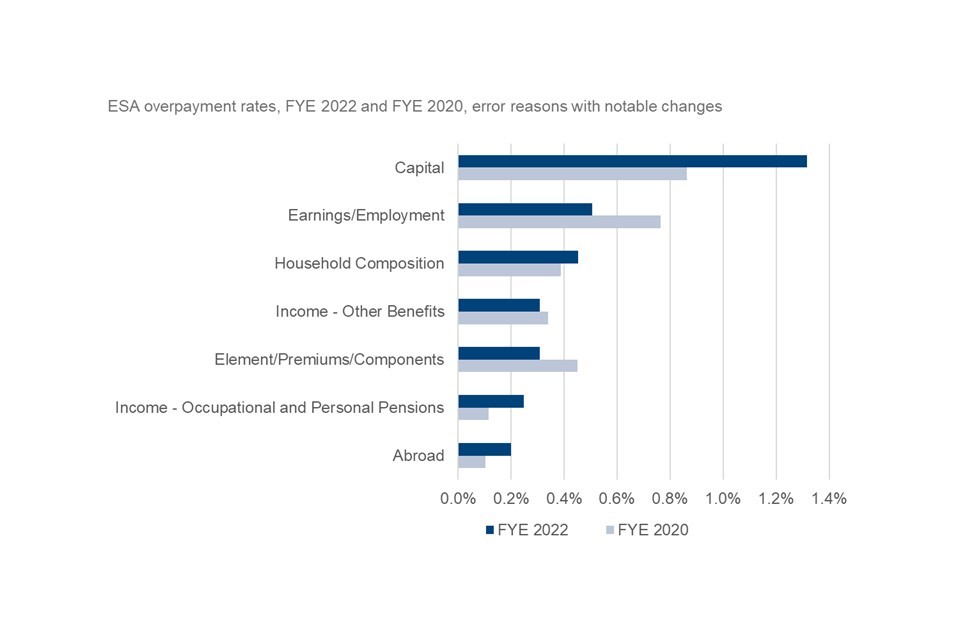
The second largest error reason was Earnings/Employment which decreased from 0.8% in FYE 2020 of expenditure to 0.5% in FYE 2022. This was driven by Employee Earnings which dropped from 0.8% to 0.4%, a change that was slightly offset by Self Employed earnings rising from 0.0% to 0.1%. None of these changes were statistically significant.
The third largest category in FYE 2022 was Household Composition which increased slightly from 0.4% to 0.5%. This was not a statistically significant increase. Of the monetary value of overpayments in this category, 75% related to customers receiving Severe Disability Premium when they did not have entitlement.
The rate of Fraud overpayments increased from 1.6% (£220m) in FYE 2020 to 2.0% (£250m) in FYE 2022 This is not a statistically significant increase. Fraud accounted for half of all ESA expenditure overpaid.
Fraud capital errors were the biggest reason for the rise in the Fraud overpayment rate; this increased from 0.3% to 0.7% but was not a statistically significant increase.
Claimant Error overpayments reached the highest recorded level of 1.4% (£180m) of expenditure in FYE 2022. This is an increase from 1.2% (£170m) in FYE 2020, which was the highest level recorded up to that point. This is not a statistically significant increase.
The increases in Fraud and Claimant Error overpayments are offset partly by a reduction in Official Error overpayments, which has decreased from 1.0% (£140m) in FYE 2020 to 0.6% (£80m) in FYE 2022. This is the lowest level recorded and was a statistically significant decrease.
Income – Occupational and Personal Pensions was the only error reason category that had a statistically significant change for ESA overpayments. This increased from 0.0% to 0.1% in Claimant Error and decreased from 0.1% to 0.0% in Official Error.
Half of Official Error was as a result of Elements/Premiums/Components. Almost 70% of Official Error cases in this category were customers who were incorrectly receiving Severe Disability Premium, with the remainder being customers who were allocated to the incorrect group following a work capability assessment, resulting in a component being awarded in error.
The changes in Claimant Error and Official Error were the cumulative effect of small changes within the error categories. There were no specific error reasons driving the changes in either of these error types.
The proportion of ESA cases with Fraud or an overpayment error increased from 11 in 100 cases to 13 in 100 cases between FYE 2020 and FYE 2022. This was not a statistically significant increase, although it was driven by a statistically significant increase in the proportion of cases with a Claimant Error overpayment, from 5 in 100 to 7 in 100 between FYE 2020 and FYE 2022.
The total ESA underpayment rate has decreased from 2.8% (£380m) in FYE 2020 to 2.5% (£320m) in FYE 2022. This change was not a statistically significant decrease.
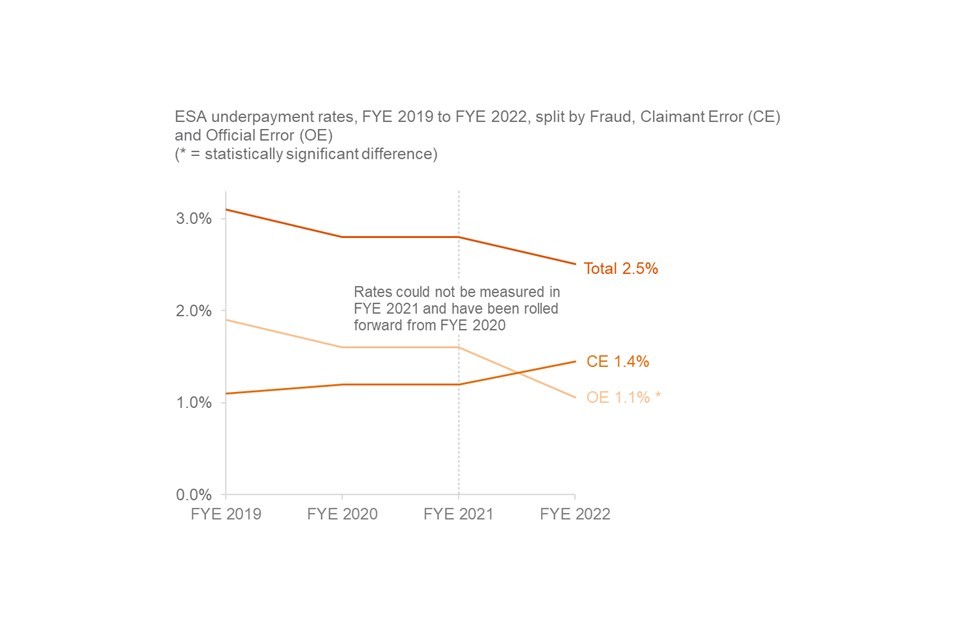
This drop was driven by a decrease in the Official Error underpayment rate from 1.6% (£220m) in FYE 2020 to 1.1% (£130m) in FYE 2022, which is the lowest rate recorded. This was a statistically significant decrease.
Claimant Error increased from 1.2% (£160m) in FYE 2020 to 1.4% (£180m) in FYE 2022. This change was not a statistically significant increase
This is the highest rate of Claimant Error underpayments recorded, meaning it is higher than Official Error underpayments for the first time since FYE 2016. Over 90% of underpayment expenditure was as a result of three error reasons: Income – Other Benefits, Elements/Premiums/Components, and Household Composition.
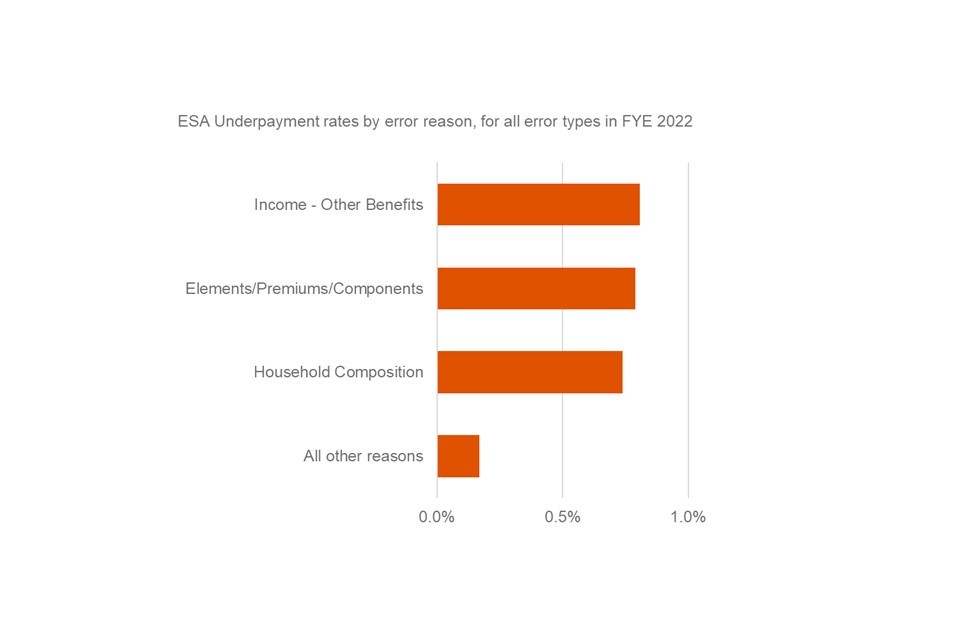
The vast majority of underpayments in these three categories related to entitlement to Severe Disability Premium (SDP), meaning SDP entitlement was responsible for a large majority of all ESA underpayments.
There was a statistically significant increase in the Household Composition underpayment rate within Claimant Error, which rose from 0.3% in FYE 2020 to 0.7% in FYE 2022. Almost all Household Composition and Income – Other Benefits errors were Claimant Error.
All Elements/Premiums/Components errors were Official Error, and this error reason decreased from 1.2% in FYE 2020 to 0.8% in FYE 2022, though this remained one of the largest categories accounting for almost a third of underpayments.
This change was not a statistically significant decrease.
There was a statistically significant decrease in underpayments in the ‘Other’ category within Official Error, which dropped from 0.3% in FYE 2020 to 0.1% in FYE 2022.
The decrease was driven by a decrease in the number of Incapacity Benefit (IB) reassessment errors found, relating to when claimants were transferred to ESA from IB. In both FYE 2019 and FYE 2020, the vast majority of expenditure underpaid in ‘Other’ Official Error related to these errors. The department has been correcting past underpayments of ESA which arose while reassessing IB claims. The number of such errors found in FYE 2022 has decreased by 94% compared to FYE 2020.
The proportion of ESA cases with an underpayment error decreased from 8 in 100 cases to 7 in 100 cases between FYE 2020 and FYE 2022. This was a statistically significant decrease. This was driven by a statistically significant decrease in the proportion of cases with an Official Error underpayment, from 5 in 100 to 3 in 100 between FYE 2020 and FYE 2022.
9. AA Overpayments and Underpayments
When someone reaches State Pension age, they are entitled to claim Attendance Allowance (AA) if they have a severe physical or mental disability and if their disability means they have long term care or supervision needs. They must have needed this support or supervision for at least 6 months unless they are claiming under the special rules for people nearing the end of life
Attendance Allowance (AA) is not normally payable for any period or periods of more than 28 days during which a customer is:
-
being maintained free of charge whilst undergoing treatment as an in-patient in a hospital or similar institution
-
resident in a care home where the Local Authority (LA) meets the costs of any of the qualifying services
The rate of Fraud and Error for Attendance Allowance (AA) has been measured for the first time. The expenditure on Attendance Allowance for FYE 2022 was £5.3bn.
The total overpayment rate for Attendance Allowance for FYE 2022 was 2.2% (£120m).
The main cause of AA overpayments for FYE 2022 was Claimant Error with an overpayment rate of 1.9% (£100m)
The Official Error overpayment rate for AA in FYE 2022 was 0.3% (£20m).
There were no Fraud overpayments found.
Most overpayment errors are due to claimants now residing in a Hospital/Registered Care Home
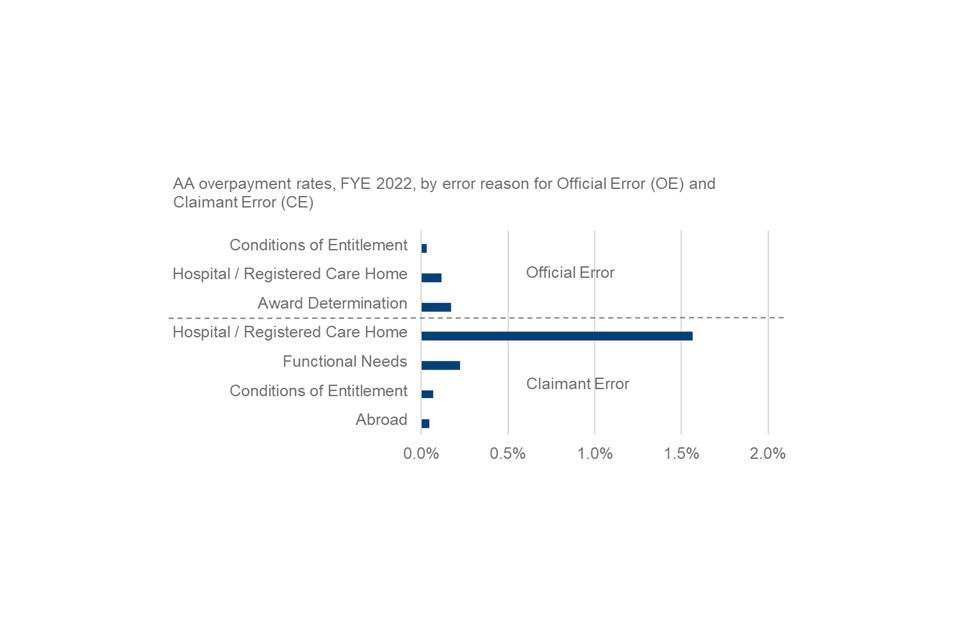
Claimants residing within a hospital or registered Care Home account for over 80% of all Claimant Error overpayments. These errors occur when the department has not been informed that the claimant has been in hospital or a care home for more than 28 days, or the department believed the claimant was fully self-funding their care home stay, but this was not the case. In either circumstance AA should no longer be payable.
There are only three error reasons for AA Official Error overpayments which are:
-
Award Determination (0.2%) (at the time of a claimant being awarded AA, the incorrect rate has been awarded to them)
-
Claimants residing within hospitals or Registered Care homes (0.1%) (errors can occur when the DWP knew claimants were residing in care homes but thought they were fully self-funding)
-
Conditions of Entitlement (0.0%) (at the time of a claimant being awarded AA, the incorrect rate has been awarded to them)
The proportion of AA cases with an overpayment error was 4 in 100 cases
Note: 0.6% of AA expenditure was excluded from Claimant Error overpayment estimates.
These are errors where an improvement to a claimant’s functional needs results in overpayment, but we would not reasonably expect them to know to report the change. This is in line with legislation (see the Background Information and Methodology note for more details).
The total underpayment rate for Attendance Allowance FYE 2022 was 4.3% (£230m) of expenditure
The majority of AA underpayments are because of a deterioration in functional needs
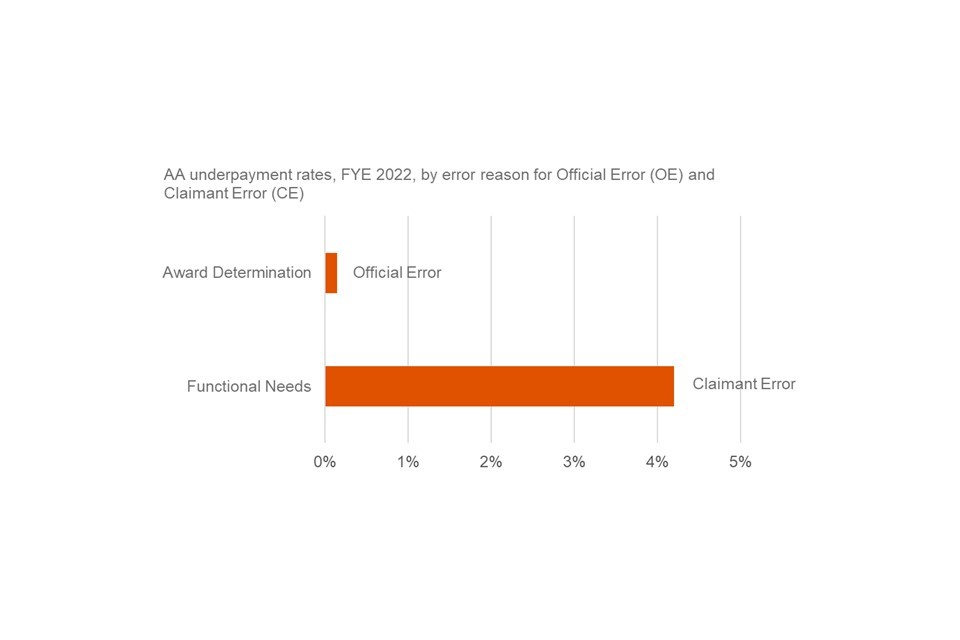
The main cause of AA underpayments for FYE 2022 was Claimant Error with an underpayment rate of 4.2% (£220m).
These were all errors associated with Functional needs and these errors occur when a claimant’s disability has deteriorated and/or their care needs have increased enough to change the rate they are eligible for, but they do not inform the Department and are therefore paid at the lower rate rather than higher rate.
There is also a small amount of Official Error due to Award Determination which accounts for 0.1% of expenditure for FYE 2022 (at the time of a claimant being awarded AA, the incorrect rate has been awarded to them).
The proportion of AA cases with an underpayment error was 11 in 100 cases
10. PC Overpayments and Underpayments
Note that PC estimates for FYE 2022 in this document are compared to PC estimates from FYE 2020, which was the last time PC was measured. Within the two-year period we are unable to infer when changes have occurred.
Pension Credit (PC) provides support to people who have reached State Pension age. Guarantee Credit tops up any other income to a ‘standard minimum guarantee’ amount and additional amounts may be payable in certain circumstances, for example, severe disability. Savings Credit is an extra payment for those who have made some additional provision for their retirement through, for example, an occupational pension or savings. Those reaching State Pension age from 6 April 2016 are not eligible for Savings Credit.
The expenditure on PC for FYE 2022 has decreased to £4.8 billion since FYE 2020 when it was £5.1 billion.
The Pension Credit overpayment rate increased by 2.0 percentage points to its highest recorded rate between FYE 2020 and FYE 2022. This increase from 5.3% (£270m) to 7.3% (£350m) was a statistically significant increase and was mainly driven by a 1.4 percentage point increase in Claimant Error.
It is possible that if we had been able to produce an estimate for FYE 2021 the changes between each year would not have been statistically significant or may have been statistically significant between FYE 2020 and FYE 2021.
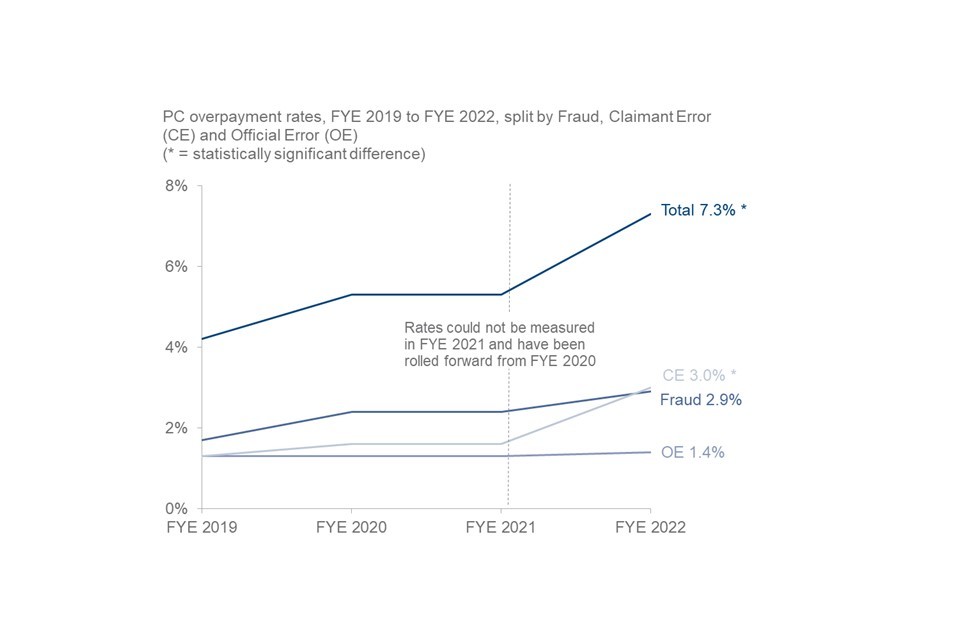
Claimant Error overpayments increased from 1.6% (£80m) in FYE 2020 to 3.0% (£150m) of expenditure in FYE 2022, which is the highest measured rate.
The main reason for the increase in Claimant Error overpayments was a 0.8 percentage point increase in Capital errors, which was a statistically significant increase.
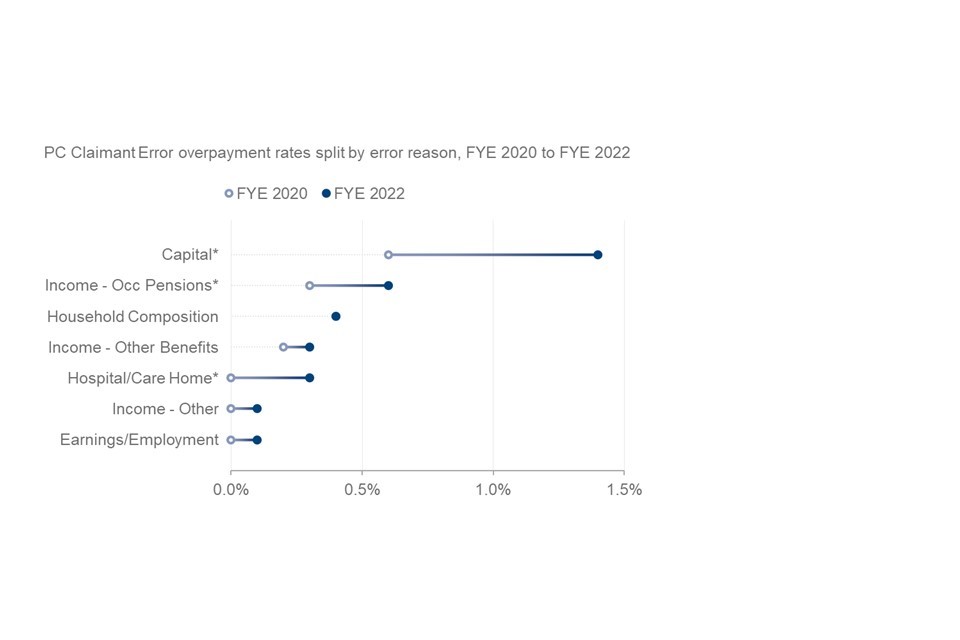
Capital was the largest source of Claimant Error in FYE 2020 at 0.6% and it more than doubled to 1.4% in FYE 2022. Almost half of all Claimant Error was due to Capital.
Income – Occupational and Personal Pensions was the second highest Claimant Error reason with an increase from 0.3% to 0.6%. This was a statistically significant increase.
Within Claimant Error, Hospital/Registered Care Home also had a statistically significant increase, from 0.0% to 0.3%.
Assessed Income Period
-
removal of the Assessed Income Period (AIP) may have had an impact on increased PC Claimant Errors
-
during an Assessed Income Period (AIP) a Pension Credit claimant does not have to advise the Department about changes to their Pension, Savings and Investments. No new AIPs were set from 6 April 2016 and fixed term AIPs were phased out in 2019, resulting in potential changes in the Fraud and Error composition
-
Claimant Error has increased, potentially due to the onus moving from the Department to the customer to report such changes once an AIP is removed, or for claims that started after the AIP removal. Investigations into capital and income related Claimant Errors showed that some of the overpayment rate increase could be attributed to AIP removal
Fraud overpayments increased from 2.4% (£120m) in FYE 2020 to 2.9% (£140m) in FYE 2022. This increase was not statistically significant.
Abroad Fraud increased in FYE 2022 to 1.7% from 0.9% in FYE 2020. This was not a statistically significant increase. Abroad Fraud accounted for almost 60% of expenditure overpaid as Fraud on PC, and for almost a quarter of all expenditure overpaid on PC in FYE 2022.
The Covid-19 pandemic partly impacted on Abroad Fraud due to travel restrictions. However, claimants still had an obligation to report absences, particularly those over 4 weeks that would affect PC payment. For cases where the duration abroad was known, more than 40% were abroad for more than 6 months.
Capital Fraud also increased slightly, from 0.7% to 0.8%. This was not a statistically significant increase.
Earnings/employment Fraud overpayments had a statistically significant decrease from 0.2% to 0.0%.
Official Error had a small increase, from 1.3% (£70m) in FYE 2020 to 1.4% (£70m) in FYE 2022. This was not a statistically significant increase.
Official Error was made up primarily of Elements/Premiums/Components (0.6%) and Income related errors (0.4%). Elements/Premiums/Components increased by 0.3 percentage points to 0.6% and most of these errors occurred where the claimant no longer qualified for Severe Disability Premium. This was not a statistically significant increase.
There was a decrease in Official Error reason Control Activities in FYE 2022, from 0.3% to 0.1%, which was a statistically significant decrease. This could be linked to the AIP removal, where fewer incorrect actions occurred on AIPs since their removal. Similarly, Capital errors categorised as Official Error decreased from 0.3% to 0.1%, which may also be linked to the removal of the AIP, due to the onus moving from the Department to the customer to report changes. This was not a statistically significant decrease.
The proportion of PC cases with an overpayment was 27 in 100 cases in FYE 2022, compared with 24 in 100 cases in FYE 2020. This was a statistically significant increase.
The Pension Credit underpayment rate decreased from 2.3% in FYE 2020 (£120m) to 2.1% (£100m) in FYE 2022. This was not a statistically significant decrease.
The decrease in underpayments was driven by a decrease of 0.4 percentage points in Official Error, which offset a small increase in Claimant Error of 0.2 percentage points. Neither were statistically significant changes.
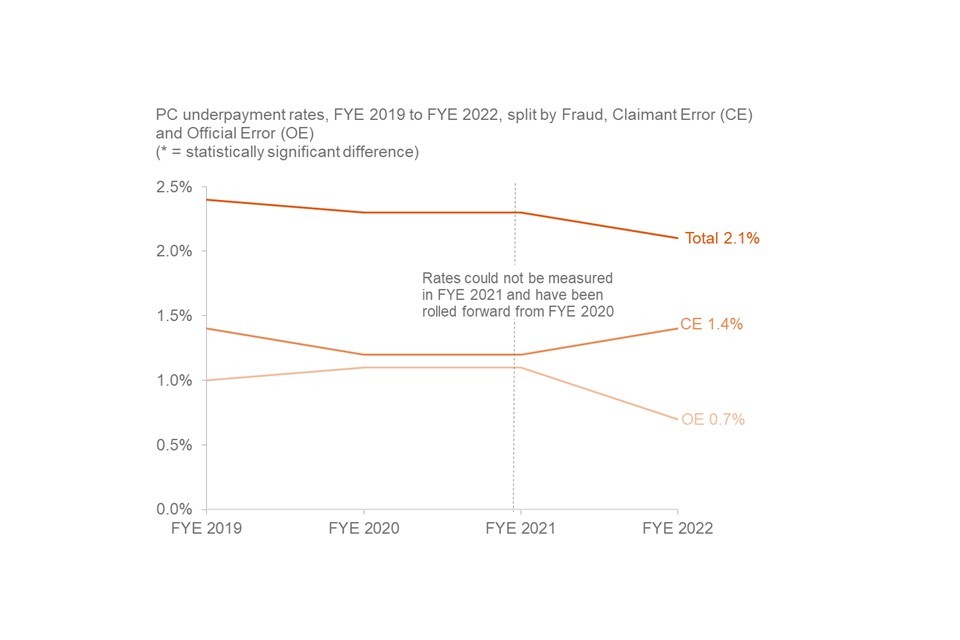
Official Error decreased from 1.1% (£60m) of expenditure in FYE 2020 to 0.7% (£30m) in FYE 2022. This is the lowest Official Error rate recorded for Pension Credit underpayments. This was not a statistically significant decrease.
The decrease in Official Error underpayments was caused by the combined effect of small changes across several error reasons rather than notable changes to specific error reasons.
Elements/Premiums/Components remained the largest source of Official Error for underpayments and decreased from 0.6% to 0.5% between FYE 2020 and FYE 2022. Most of these errors occurred where the claimant was found to qualify for Severe Disability Premium, leading to an underpayment in Pension Credit.
There was a small increase in Claimant Error from 1.2% (£60m) in FYE 2020 to 1.4% (£70m) in FYE 2022.
This was not a statistically significant increase. This increase was offset by the larger Official Error decrease, resulting in an overall Pension Credit underpayment decrease.
Household Composition was the largest source of Claimant Error underpayments at 0.5%. There was a statistically significant increase from 0.2% in FYE 2020 to 0.5% in FYE 2022.
Income – Other Benefits was the second largest Claimant Error reason for underpayments at 0.3%. However, in FYE 2022 the underpayment rate reduced by 0.3 percentage points from 0.6% in FYE 2020. This was not a statistically significant decrease. These errors occurred mainly where the claimant was entitled to PIP daily living element, which would increase their Pension Credit award.
The proportion of PC cases with an underpayment was 10 in 100 cases in FYE 2022, compared with 11 in 100 cases in FYE 2020. This was not a statistically significant decrease.
11. About these statistics
All the information underlying the charts and figures featured in this document is included in the accompanying reference tables.
The tables show the rates and monetary values of overpayments and underpayments for each benefit, split by Fraud, Claimant Error and Official Error. The tables also show the net loss of overpayments measure with a time series and a breakdown by benefit.
For the benefits we have measured this year, we can also show more detail about the cause of the error (for example, incomes, savings and who lives in the house) and the demographics of the claimants. We also estimate the percentage of cases that are incorrect, and the amount of money that is incorrectly paid.
The background information and methodology note provides further information on how we calculate ‘Fraud and Error in the Benefit System’ statistics and gives a glossary of the causes of Fraud and Error used in this document and the reference tables. It also contains further details on any methodological changes which have been introduced.
The background information and methodology note gives more detail about the data manipulation process.
We will continue to review our publication content, and welcome user comments, which should be sent to caxtonhouse.femaenquiries@dwp.gov.uk.
National Statistics status
National Statistics status means that our statistics meet the highest standards of trustworthiness, quality and public value, and it is our responsibility to maintain compliance with these standards.
The continued designation of these statistics as National Statistics was confirmed in December 2017 following a compliance check by the Office for Statistics Regulation. The statistics last underwent a full assessment against the Code of Practice for Statistics in February 2012. Since the latest review by the Office for Statistics Regulation, we have continued to comply with the Code of Practice for Statistics, and have made the following improvements:
-
we conducted a user consultation on the frequency of the publication, the benefits measured, and on the breakdowns used within the publication. This has resulted in us changing from a bi-annual to an annual publication and beginning to measure Fraud and Error on benefits that have not been measured at all or for a long time
-
we have made some methodological changes, resulting in better understood methodologies and assumptions, improved accuracy of the Fraud and Error statistics, and more consistency across benefits
-
we have made several changes to improve the relevance and accessibility of our statistics. For example, we have: moved away from using the same wording and charts for all the benefits in our publication to instead focus on the key messages for each benefit, updated the categories of error we report in our publication based on user needs, and made the data from our publication available to analysts within DWP to conduct their own analysis. We have also created an online tool to allow users to explore our Fraud and Error statistics
-
we have produced the documents in HTML format and provided an accessible version of the reference tables
Other National and Official Statistics
Details of other National and Official Statistics produced by the Department for Work and Pensions can be found on the DWP website via the following links:
-
a list of DWP statistical summaries
-
a schedule of statistical releases over the next 12 months and a list of the most recent releases
-
in addition, users can find links to additional DWP statistical analyses that have not been included in our standard publications
12. Contact information
Lead Statistician: John Bilverstone
Comment? Feedback is welcome at caxtonhouse.femaenquiries@dwp.gov.uk
DWP Press Office: 0115 965 8781
Report Benefit Fraud: 0800 854 4400
Appendix 1: FYE 2022 Overpayment rates and monetary values by benefit
| Expenditure (£m) | Total Rate (%) | Total Value (£m) | Fraud Rate (%) | Fraud Value (£m) | Claimant Error Rate (%) | Claimant Error Value (£m) | Official Error Rate (%) | Official Error Value (£m) | Last measured | |||||||||||
|---|---|---|---|---|---|---|---|---|---|---|---|---|---|---|---|---|---|---|---|---|
| Universal Credit | 40,400 | 14.7 | 5,920 | 13.0 | 5,250 | 1.0 | 400 | 0.7 | 270 | Jan 21 - Nov 21 | ||||||||||
| State Pension | 104,500 | 0.1 | 110 | 0.0 | 20 | 0.0 | 50 | 0.0 | 50 | Feb 21 - Oct 21 | ||||||||||
| Housing Benefit | 16,500 | 5.2 | 860 | 3.3 | 540 | 1.6 | 260 | 0.4 | 70 | Jan 21 - Nov 21 | ||||||||||
| Personal Independence Payment | 15,100 | 1.5 | 230 | 0.3 | 40 | 1.1 | 170 | 0.1 | 20 | Aug 18 - Jul 19 | ||||||||||
| Employment and Support Allowance | 12,600 | 4.0 | 500 | 2.0 | 250 | 1.4 | 180 | 0.6 | 80 | Oct 20 - Ocy 21 | ||||||||||
| Disability Living Allowance | 5,700 | 1.9 | 110 | 0.5 | 30 | 0.6 | 40 | 0.8 | 40 | Apr 04 - Mar 05 | ||||||||||
| Attendance Allowance | 5,300 | 2.2 | 120 | 0.0 | 0 | 1.9 | 100 | 0.3 | 20 | Oct 20 - Aug 21 | ||||||||||
| Pension Credit | 4,800 | 7.3 | 350 | 2.9 | 140 | 3.0 | 150 | 1.4 | 70 | Oct 20 - Oct 21 | ||||||||||
| Carer’s Allowance | 3,100 | 5.2 | 160 | 3.0 | 90 | 2.0 | 60 | 0.1 | 0 | May 19 - Dec 19 | ||||||||||
| Income Support | 900 | 3.9 | 30 | 2.4 | 20 | 1.0 | 10 | 0.4 | 0 | Oct 13 - Sep 14 | ||||||||||
| Jobseeker’s Allowance | 500 | 4.6 | 20 | 3.1 | 10 | 0.3 | 0 | 1.2 | 10 | Oct 17 - Sep 18 | ||||||||||
| Incapacity Benefit | 0 | 2.4 | 0 | 0.3 | 0 | 0.9 | 0 | 1.2 | 0 | Oct 09 - Sep 10 | ||||||||||
| Interdependencies | 40 | 10 | 10 | 20 | ||||||||||||||||
| Never reviewed | 6,600 | 2.4 | 160 | 1.7 | 110 | 0.5 | 30 | 0.3 | 20 | |||||||||||
| Total | 215,800 | 4.0 | 8,600 | 3.0 | 6,500 | 0.7 | 1,500 | 0.3 | 700 | |||||||||||
| Range | (3.7, 4.3) | (8,100, 9,200) | (2.8,3.3) | (6,000, 7,100) | (0.6, 0.8) | (1,200, 1,700) | (0.3, 0.4) | (500, 800) |
Notes:
- Certain cases are removed from the headline overpayments estimates for DLA, PIP and AA. Based on FYE 2022 expenditure:
-
the amount of DLA excluded is estimated to be £410m (£300m, £530m)
-
the amount of PIP excluded is estimated to be £510m (£400m, £630m)
-
the amount of AA excluded is estimated to be £30m (£10m, £70m)
-
Monetary values associated with Incapacity Benefit are displaying zeroes due to rounding.
-
The ‘Never reviewed’ category includes benefits which were not previously reviewed and have not been historically reviewed in a particular year.
-
Rows and columns may not sum to totals due to rounding.
-
A number of cases are removed from the headline overpayment estimates. This is due to a review not being completed and the case being categorised as ‘Inconclusive’. These cases are estimated to have a monetary value of £830m. See Appendix 4 for more information.
-
Approximate 95% confidence interval ranges are given for the totals in the row below them. These also allow for non-sample error in occasionally reviewed benefits and the additional uncertainty that comes from the use of older measurement periods.
Appendix 2: FYE 2022 Underpayment rates and monetary values by benefit
| Expenditure (£m) | Total Rate (%) | Total Value (£m) | Fraud Rate (%) | Fraud Value (£m) | Claimant Error Rate (%) | Claimant Error Value (£m) | Official Error Rate (%) | Official Error Value (£m) | Last measured | |||||||||||
|---|---|---|---|---|---|---|---|---|---|---|---|---|---|---|---|---|---|---|---|---|
| Universal Credit | 40,400 | 1.0 | 410 | 0.0 | 0 | 0.7 | 270 | 0.3 | 140 | Jan 21 - Nov 21 | ||||||||||
| State Pension | 104,500 | 0.5 | 540 | 0.0 | 0 | 0.0 | 10 | 0.5 | 530 | Feb 21 - Oct 21 | ||||||||||
| Housing Benefit | 16,500 | 1.3 | 210 | 0.0 | 0 | 0.8 | 140 | 0.4 | 70 | Jan 21 - Nov 21 | ||||||||||
| Personal Independence Payment | 15,100 | 3.8 | 570 | 0.0 | 0 | 3.1 | 470 | 0.7 | 100 | Aug 18 - Jul 19 | ||||||||||
| Employment and Support Allowance | 12,600 | 2.5 | 320 | 0.0 | 0 | 1.4 | 180 | 1.1 | 130 | Oct 20 - Oct 21 | ||||||||||
| Disability Living Allowance | 5,700 | 2.5 | 140 | 0.0 | 0 | 2.4 | 140 | 0.1 | 10 | Apr 04 - Mar 05 | ||||||||||
| Attendance Allowance | 5,300 | 4.3 | 230 | 0.0 | 0 | 4.2 | 220 | 0.1 | 10 | Oct 20 - Aug 21 | ||||||||||
| Pension Credit | 4,800 | 2.1 | 100 | 0.0 | 0 | 1.4 | 70 | 0.7 | 30 | Oct 20 - Oct 21 | ||||||||||
| Carer’s Allowance | 3,100 | 0.0 | 0 | 0.0 | 0 | 0.0 | 0 | 0.0 | 0 | May 19 - Dec 19 | ||||||||||
| Income Support | 900 | 0.8 | 10 | 0.1 | 0 | 0.4 | 0 | 0.3 | 0 | Oct 13 - Sep 14 | ||||||||||
| Jobseeker’s Allowance | 500 | 1.5 | 10 | 0.1 | 0 | 0.3 | 0 | 1.2 | 10 | Oct 17 - Sep 18 | ||||||||||
| Incapacity Benefit | 0 | 0.7 | 0 | 0.0 | 0 | 0.0 | 0 | 0.7 | 0 | Oct 09 - Sep 10 | ||||||||||
| Never reviewed | 6,600 | 1.2 | 80 | 0.0 | 0 | 0.7 | 40 | 0.5 | 30 | |||||||||||
| Total | 215,800 | 1.2 | 2,600 | 0.0 | 0 | 0.7 | 1,500 | 0.5 | 1,100 | |||||||||||
| Range | (1.1, 1.4) | (2,300, 3,000) | (0, 0) | (0, 0) | (0.6, 0.8) | (1,300, 1,800) | (0.4, 0.6) | (800, 1,300) |
Notes:
- Fraud underpayments can be recorded on Living Together cases, where the claimant commits Fraud because they do not tell DWP that their partner has moved in with them. Although this causes an underpayment for the individual, the circumstances of the partner (for example, their income) cause overpayments for the claim as a whole, which results in an overall overpayment.
- A new legislation ruling for PIP means that some claimants may qualify for higher benefit awards than they were given at their assessment. Cases categorised since August 2018 will include this judgement which means that prior to this date we may be underestimating Official Error underpayments.
- Carer’s Allowance estimates are zero as no underpayment cases were found in the sample.
- Monetary values associated with Incapacity Benefit are displaying zeroes due to rounding.
- The ‘Never reviewed’ category includes benefits which were not previously reviewed and have not been historically reviewed in a particular year.
- Rows and columns may not sum to totals due to rounding.
- Approximate 95% confidence interval ranges are given for the totals in the row below them. These also allow for non-sample error in occasionally reviewed benefits and the additional uncertainty that comes from the use of older measurement periods.
Appendix 3: Operational easements and changes due to the coronavirus pandemic
A number of operational easements and changes to benefit administration were introduced as a consequence of the coronavirus pandemic. Some of these changes were necessary to comply with public health restrictions, and others were introduced to meet departmental aims to protect vulnerable customers and ensure benefit claim processing was as timely as possible.
When we don’t review a given benefit in a year, we would normally roll forward the rate of Fraud and Error from when it was previously measured or apply a proxy rate if that benefit has never been measured. For FYE 2021 we carried out analysis to assess whether it was valid to do this, or whether we needed to make an adjustment due to potential impacts of benefit easements related to the coronavirus pandemic.
From the benefits looked at in the analysis for FYE 2021, only Personal Independence Payment (PIP), Bereavement Support Payment (BSP), Jobseeker’s Allowance (JSA) and Carer’s Allowance (CA) have not been measured in FYE 2022. Coronavirus easements on these benefits have continued into FYE 2022. For BSP, JSA and CA we estimate that the impact is negligible (we estimate that at most £1m of additional MVFE could be added on to each benefit). The impact on PIP is potentially much larger so the rest of Appendix 3 will focus on this.
More detailed information on our methodology can be found in the Background Information and Methodology note.
Personal Independence Payment (PIP)
There was a specific change made as a direct result of the coronavirus pandemic with regard to when PIP claims in payment are reviewed. Some PIP claims are subject to reviews through an ‘Award Review’ (AR), and the change resulted in claims that were due an AR from April 2020 having their AR paused for four months.
We therefore investigated the potential impact on Fraud and Error of this easement, by taking the extension to ARs into consideration. This was estimated using existing published data on PIP and the Stat-Xplore database, using numbers of ARs delayed, the length of the pause, and likely changes in the rate of benefit received after the AR.
PIP Overpayments
The initial estimate of a potential additional overpayment was £130m. However, our normal methodology for estimating overpayments on PIP removes a large proportion of overpayments from our main estimate due to some claimants not being reasonably expected to know to report an improvement in their functional needs (Not RETK). In FYE 2020 (the last time PIP was measured) we reported PIP overpayments of £190m and removed £420m due to Not RETK. (More information on Not RETK can be found in the Background Information and Methodology note).
We would therefore assume that a large proportion of the estimated £130m impact of easements should also be removed due to the ‘Not REKT’ adjustment. As the impact of easements relate to a specific group of cases that have had their AR delayed, rather than the PIP caseload as a whole, there is considerable uncertainty around what proportion should be removed. Some scenarios are presented in the table below.
The impact on the ‘global’ (overall) estimate of Fraud and Error of including the additional overpayment, after rolling forward the FYE 2020 rate, would be minimal. The table below shows the impact on the global estimate of including the entire £130m and of removing different proportions due to Not RETK. All impacts are below 0.1 percentage points (pp.).
The potential impact on the PIP overpayment rate itself is larger. Impacts are shown in the table below. However, inclusion of the additional overpayment would not increase the overpayment rate to above those seen in any previous year in which we have measured PIP for Fraud and Error (between FYE 2017 and FYE 2019).
Another factor affecting the estimates is the outcomes of Mandatory Reconsiderations and appeals. Claimants may ask for the AR outcome to be reviewed (a Mandatory Reconsideration), and they may also appeal the outcome of that. There is no published data on the rates of these in relation to outcomes of ARs, although for PIP initial assessment decisions in FYE 2021 (new claims and DLA to PIP reassessments), more than 10% of all cases had their award changed after either a Mandatory Reconsideration or an appeal. Were it possible to incorporate an adjustment to account for this, then the estimates in the table below would be lower.
Possible impact of Not RETK adjustment and impact on the PIP overpayment rate estimate and global overpayment rate estimate, due to operational easements
| Proportion removed due to Not RETK | Estimated additional overpayment | Impact on PIP overpayment estimate | Impact on Global overpayment estimate |
|---|---|---|---|
| None (0%) | £130m | + 0.9 p.p | + 0.06 p.p |
| Half (50%) - average proportion of previous measurements | £70m | + 0.4 p.p | + 0.03 p.p |
| Same as FYE 2020 (69%) | £40m | + 0.3 p.p | + 0.02 p.p |
PIP Underpayments
We estimated a potential additional underpayment of £60m (note that underpayments are not subject to the RETK rule).
This estimate is within the reported confidence intervals for our main Fraud and Error estimate. Due to this, we can conclude that the impacts are small and do not require adjustments to our estimate. To put this figure into wider context, in FYE 2020 we reported total underpayments on PIP of £470m.
Note that claimants who had their review paused could have notified DWP of a Change of Circumstances during the period of the pause. For those claimants, there would be no underpayments or overpayments.
Conclusion
Given the considerable uncertainty around the additional overpayment estimate, the low impact on the global estimate, and that the additional underpayment estimate is within our confidence interval, we have not adjusted the PIP Fraud and Error estimates or added an adjustment to the global estimates for FYE 2022.
Appendix 4: Cannot Review adjustment
For more information on this adjustment, please see section 5 of the background information and methodology note.
The primary reason for an ineffective review is the claimant not engaging in a review, resulting in their benefit claim being suspended and then later terminated. Additionally, it includes cases where the claimant withdrew their claim to benefit following notification of a review.
These cases are referred to as ‘Cannot Review’ and the Department holds very little evidence of their current circumstances and their reasons for failing to engage.
Given the lack of evidence available for these cases, a set of assumptions are applied to categorise them for reporting purposes as follows:
-
Fraud – where a case has a suspicion of Fraud raised following initial data gathering prior to review, these cases are assumed to be Fraud in the reported estimates
-
Not Fraud – if there is no information to suggest a suspicion of Fraud, where a claimant reclaims benefit at a similar rate within four months of their original award being terminated, these cases are assumed not to be Fraud. Any other errors such as Official Error would remain on the case, so they may not be entirely benefit correct.
-
Inconclusive – where there is no information to suggest a suspicion of Fraud or that the claimant has reclaimed benefit, these are recorded as inconclusive and no assumptions are made on these cases. These cases are taken out of the headline reported estimates, since there is insufficient evidence to categorise as Fraud or not. The expenditure for these cases is estimated and reported separately within the publication and supplementary tables
Cannot Review cases accounted for around £1,480m (1.5% of all expenditure on benefits that have been reviewed since FYE 2020)
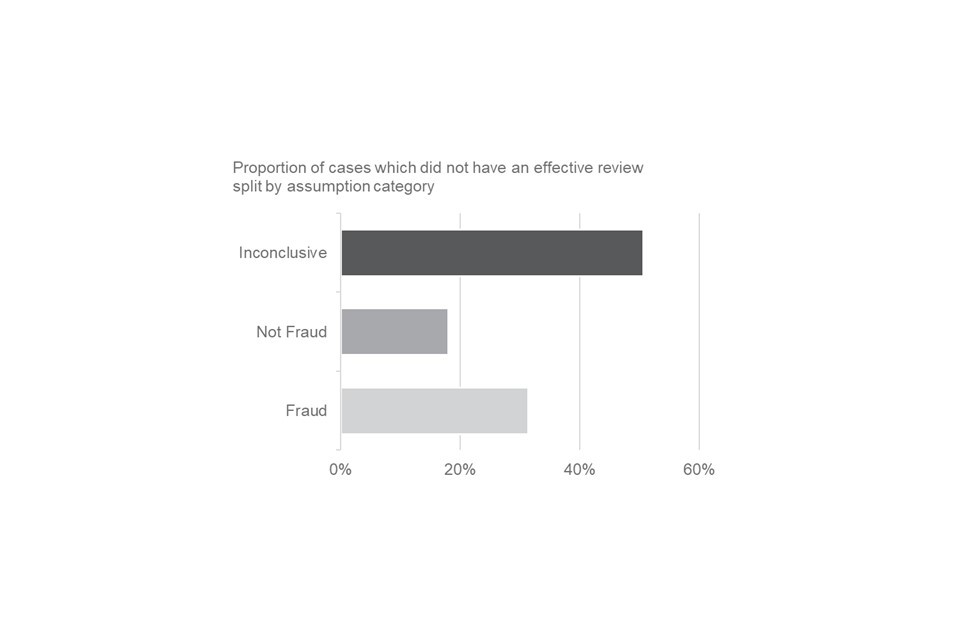
FYE 2022 estimates of the breakdown of cases that did not have an effective review, split by benefit and assumption categorisation
| Benefit | Cannot Review Assumption Category | % of expenditure | Monetary Value | ||||
|---|---|---|---|---|---|---|---|
| AA | Fraud | 0.0% | £0m | ||||
| AA | Not Fraud | 0.1% | £10m | ||||
| AA | Inconclusive | 0.8% | £40m | ||||
| CA | Fraud | 0.5% | £20m | ||||
| CA | Not Fraud | 0.7% | £20m | ||||
| CA | Inconclusive | 1.3% | £40m | ||||
| ESA | Fraud | 0.3% | £30m | ||||
| ESA | Not Fraud | 0.0% | £0m | ||||
| ESA | Inconclusive | 0.8% | £100m | ||||
| HB | Fraud | 0.6% | £100m | ||||
| HB | Not Fraud | 0.3% | £50m | ||||
| HB | Inconclusive | 0.4% | £70m | ||||
| PC | Fraud | 0.1% | £0m | ||||
| PC | Not Fraud | 0.0% | £0m | ||||
| PC | Inconclusive | 1.1% | £50m | ||||
| PIP | Fraud | 0.0% | £0m | ||||
| PIP | Not Fraud | 0.0% | £0m | ||||
| PIP | Inconclusive | 0.3% | £50m | ||||
| UC | Fraud | 0.6% | £230m | ||||
| UC | Not Fraud | 0.5% | £200m | ||||
| UC | Inconclusive | 1.2% | £490m | ||||
| Total | Fraud | 0.4% | £390m | ||||
| Total | Not Fraud | 0.3% | £270m | ||||
| Total | Inconclusive | 0.9% | £830m |
Notes:
1. AA is Attendance Allowance
CA is Carers Allowance
ESA is Employment and Support Allowance
HB is Housing Benefit
PC is Pension Credit
PIP is Personal Independence Payment
2. For CA and PIP, the last measured Cannot Review rates were applied to expenditure for FYE 2022.
Around half of Cannot Review cases were categorised as Inconclusive.
ISBN: 978-1-78659-422-8