Drug misuse declared: findings from the 2011 to 2012 Crime Survey for England and Wales (CSEW) (second edition)
Published 27 September 2012
Applies to England and Wales

© Crown copyright 2012
This publication is licensed under the terms of the Open Government Licence v3.0 except where otherwise stated. To view this licence, visit nationalarchives.gov.uk/doc/open-government-licence/version/3 or write to the Information Policy Team, The National Archives, Kew, London TW9 4DU, or email: psi@nationalarchives.gov.uk.
Where we have identified any third party copyright information you will need to obtain permission from the copyright holders concerned.
This publication is available at https://www.gov.uk/government/statistics/drug-misuse-declared-findings-from-the-2011-to-2012-crime-survey-for-england-and-wales-csew-second-edition/drug-misuse-declared-findings-from-the-2011-to-2012-crime-survey-for-england-and-wales-csew-second-edition
This release is based on results from the 2011 to 2012 Crime survey for England and Wales (CSEW, formerly the British Crime Survey) and includes comparisons with 2010 to 2011 and trends since 1996.
This release is produced to the highest professional standards by statisticians in accordance with the Home Office’s Statement of Compliance with the Code of Practice for Official Statistics.
0.1 Second edition
In September 2012, an additional section was added to this publication covering simultaneous polydrug and polysubstance use. This analysis is based on combined data from the 2010 to 2011 and 2011 to 2012 CSEW. Previously published content remains unchanged.
More detailed information, covering a range of areas, is available within the following topics:
-
Extent and trends in illicit drug use among adults aged 16 to 59 and illicit drug use among 16 to 59s tables
-
Extent and trends in illicit drug use among young people aged 16 to 24 and illicit drug use among 16 to 24s tables
-
New CSEW measures of drug use and new CSEW measures of drug use tables are provided on use of mephedrone, GBL/GHB, BZP, Spice and khat
-
Frequent drug use in the last year and frequent drug use tables
-
Illicit drug use by personal, household and area characteristics and lifestyle factors and illicit drug use by demographics tables
-
Onset and desistance of illicit drug use among adults aged 16 to 59 and onset and desistance tables are provided on the age cannabis, powder cocaine and ecstasy were first and last taken
-
Accessibility of drugs and accessibility of drugs tables are provided on the location the most recent drugs taken in the last year were obtained and their source; as well as the ease, or perceived ease of obtaining illegal drugs
-
Simultaneous polydrug and polysubstance use among adults aged 16 to 59 and simultaneous polydrug and polysubstance use tables are provided on the use of more than one drug at the same time and drugs being used at the same time as alcohol.
Detailed information about the figures included in this release is available in the user guide to drug misuse declared: findings from the Crime Survey for England and Wales.
This release replaces the previous annual Home Office statistical bulletins on drug misuse declared. Despite the change in mode of publication, the text and tables are broadly similar.
During this transition a pdf document is provided which will enable users to print out all HTML pages from one source document (all tables are solely available online at the links above).
Future editions of this annual release will be published on dates announced via the UK Statistics Authority’s Publication Hub: Release Calendar.
While responsibility for the Crime Survey in England and Wales transferred to the Office for National Statistics on 1 April 2012, the Home Office has retained responsibility for analysis and publication of this Drugs Misuse Declared publication.
For further information about illicit drug use measures from the Crime Survey for England and Wales, please email: crimestats@homeoffice.gov.uk or write to:
Home Office Statistics
5th Floor
Peel Building
2 Marsham Street
London, SW1P 4DF
1. Extent and trends in illicit drug use among adults aged 16 to 59
1.1 Introduction
This section covers the extent and trends in illicit drug use among adults aged 16 to 59 measured by the 2011/12 Crime Survey for England and Wales (CSEW, formerly the British Crime Survey). Figures are presented since 1996 when comparable questions were first included on the survey.
The user guide provides further details relating to illicit drug use measures.
1.2 Key facts
In the 2011 to 2012 survey, an estimated 8.9% of adults had used an illicit drug in the last year; this remains around the lowest level since measurement began in 1996 (the last time there was a fall was between 2008/09 (10.1%) and 2009/10 (8.6%)).
Among 16 to 59 year olds, 3.0% had used a Class A drug in the last year, similar to the levels in the 2010/11 (3.0%) and 2009/10 (3.1%) surveys. The long-term trend in Class A drug use shows no statistically significant difference between 1996 (2.7%) and 2011/12 (3.0%); there was a gradual increase overall between 1996 and 2008/09 (from 2.7% to 3.7%) which has been tempered by a decrease between 2008/09 and 2009/10 (3.7% to 3.1%).
As in previous years, the 2011/12 survey showed cannabis was the most commonly used type of drug in the last year (6.9% of adults), followed by powder cocaine (2.2%). Cannabis use remains around the lowest level since measurement began; after a rise between 1996 (9.5%) and 2002/03 (10.9%) there was a gradual decline for several years, but levels have steadied since 2009/10 (6.6%). Powder cocaine use has risen in the long term (0.6% in 1996) and in the 2011/12 survey was at a similar level to that in 2010/11 (2.1%).
1.3 Data tables
Estimates of illicit drug use among adults from the 2011/12 CSEW can be found in the Illicit drug use among 16–59s tables.
1.4 Extent and trends in overall drug use
From the 2011/12 CSEW:
- an estimated one in three adults (36.5%) had ever taken an illicit drug in their lifetime (around 12 million people)
- 8.9% had done so in the last year (nearly three million people)
- 5.2% in the last month (an estimated 1.7 million people)
Between the 1996 and 2011/12 surveys, last year use of any illicit drug fell (from 11.1% to 8.9%), due in large part to a notable decline in cannabis use (from 9.5% to 6.9%). Any last year drug use remains around the lowest level since measurement began; the last fall was seen between 2008/09 (10.1%) and 2009/10 (8.6%).
1.5 Extent and trends in Class A drug use
In the 2011/12 CSEW:
- around 15.6% of adults had ever taken a Class A drug in their lifetime (five million people);
- 3.0% had done so in the last year (nearly one million people); and
- 1.5% in the last month (around half a million people).
The long-term trend in Class A drug use in the last year shows no statistically significant difference between the 1996 (2.7%) and 2011/12 (3.0%) surveys; there was a gradual increase in last year use between 1996 and 2008/09 (from 2.7% to 3.7%) which has been tempered by a decrease between 2008/09 and 2009/10 (3.7% to 3.1%). Last year Class A drug use levels have been similar since then.
The pattern can be explained by:
- a decline in last year use of hallucinogens since 1996 (from 1.3% to 0.5% in 2011/12);
- a decline in ecstasy use between 2000 (1.8%) and 2011/12 (1.4%); and
- an increase in last year powder cocaine use from 1996 (0.6%) to 2008/09 (3.0%) since when it has declined to 2.2% (2011/12).
Trends in last year illicit drug use among adults aged 16 to 59, 1996 to 2011/12 CSEW
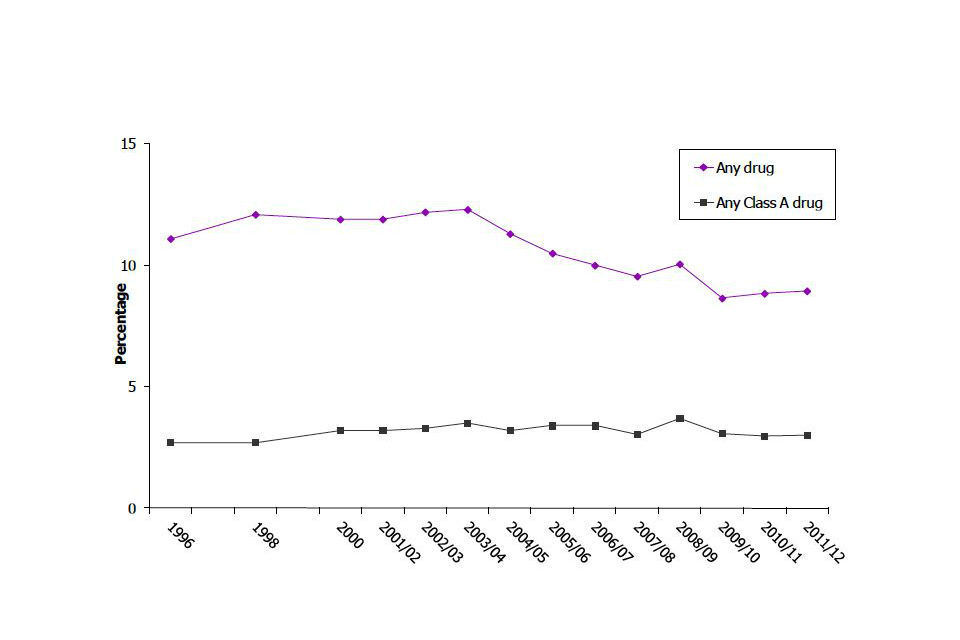
Trends in last year illicit drug use among adults aged 16 to 59, 1996 to 2011/12 Crime Survey for England and Wales
Chart notes
Source: Home Office, Illicit drug use among 16 to 59s tables: Table EA.02
1.6 Extent and trends in individual drug use
As in previous years, in the 2011/12 survey cannabis was the most commonly used type of drug among adults in the last year (6.9%), followed by powder cocaine (2.2%) and ecstasy (1.4%).
At 6.9% the level of last year cannabis use remains around the lowest level since measurement began; the proportion is notably lower than in 1996 (9.5%). After a rise between 1996 (9.5%) and 2002/03 (10.9%) there was a gradual decline for several years, but levels have steadied since 2009/10 (6.6%).
Conversely, levels of last year powder cocaine use have increased since 1996 (0.6%) with the sharpest increase occurring between 1996 and 2000 (2.0%) followed by a more gradual increase to 3.0% in 2008/09. Most recently, levels of powder cocaine use were similar in the 2010/11 (2.1%) and 2011/12 (2.2%) surveys. Although there was a fall in last year powder cocaine usage between 2009/10 (2.4%) and 2010/11, levels in 2011/12 are now similar to those in 2009/10.
Figures for last year use of ecstasy were the same in the 2011/12 and 2010/11 (1.4%) surveys but there has been a statistically significant decline in the long term from 1.8% in 2000 (the comparison with 1996 (1.7%) was not statistically significant).
Extent of last year illicit drug use for most prevalent drugs among adults aged 16 to 59, 2011/12 CSEW
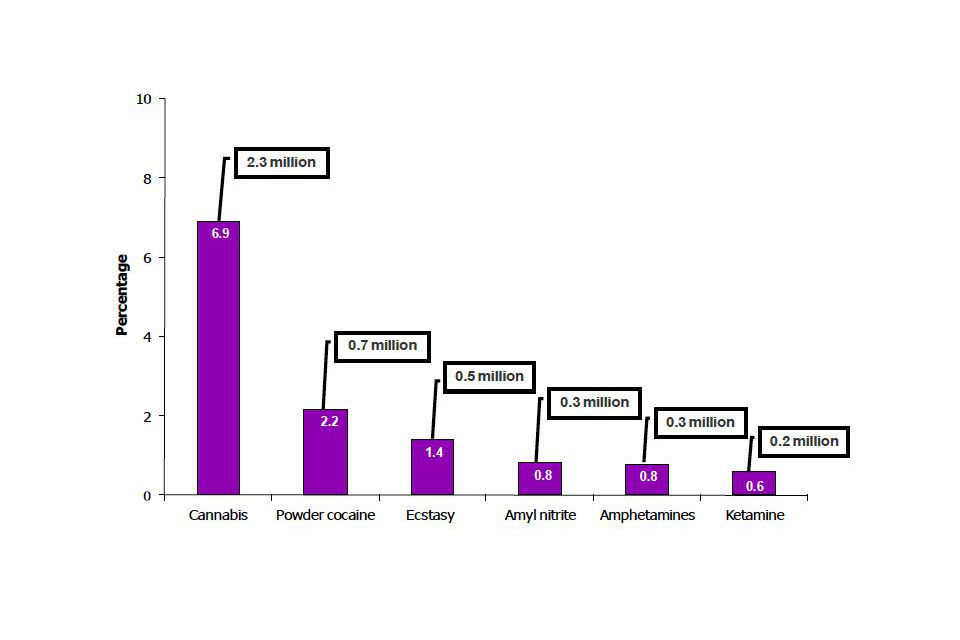
Extent of last year illicit drug use for most prevalent drugs among adults aged 16 to 59, 2011 to 2012 Crime Survey for England and Wales
Chart notes
Source: Home Office, Illicit drug use among 16 to 59s tables: Tables EA.02 and EA.04
The only statistically significant decrease seen between the 2010/11 and 2011/12 surveys was in last year use of amphetamines (from 1.1% to 0.8%). Amphetamine use has fallen markedly over the long term as well (from 3.2% in 1996) with the largest fall taking place between 1998 and 2000 (3.0% and 2.1% respectively).
Although not showing a change in recent years (levels of last year usage remained at similar levels for these remaining drug types in the 2010/11 and 2011/12 surveys), long-term trends for usage of other drug types among adults show that:
- Levels of ketamine use in the last year have shown little change over the last four years (0.6% in 2008/09 and in 2011/12) following an initial increase since measurement began in 2006/07 (0.3%).
- Last year usage of hallucinogens has fallen between the 1996 and 2011/12 surveys due to declines in the use of LSD (from 1.0% to 0.2%) and magic mushrooms (from 0.7% to 0.5%). The fall in LSD came earlier than for magic mushrooms: last year LSD use has been stable since 2001/02 whereas for magic mushrooms levels have been similar since 2006/07.
- The level of amyl nitrite usage has fallen from 1.3% in 1996 to 0.8% in the 2011/12 CSEW with the majority of the decline observed in recent years (falling from 1.1% in 2009/10 to 0.8% in 2011/12).
-
There was no statistically significant change between 1996 and 2011/12 in last year use of tranquillisers (0.4% and 0.5% respectively) or anabolic steroids (0.3% and 0.2% respectively); there has been little variation in levels during that period.
- While levels of opiate use measured by the survey are low (see Data quality and interpreting the figures section below), use in the last year has increased since 1996, driven by an increase in methadone use (from 0.1% to 0.2%) although generally there has been little variation in heroin or methadone use year on year since measurement began.
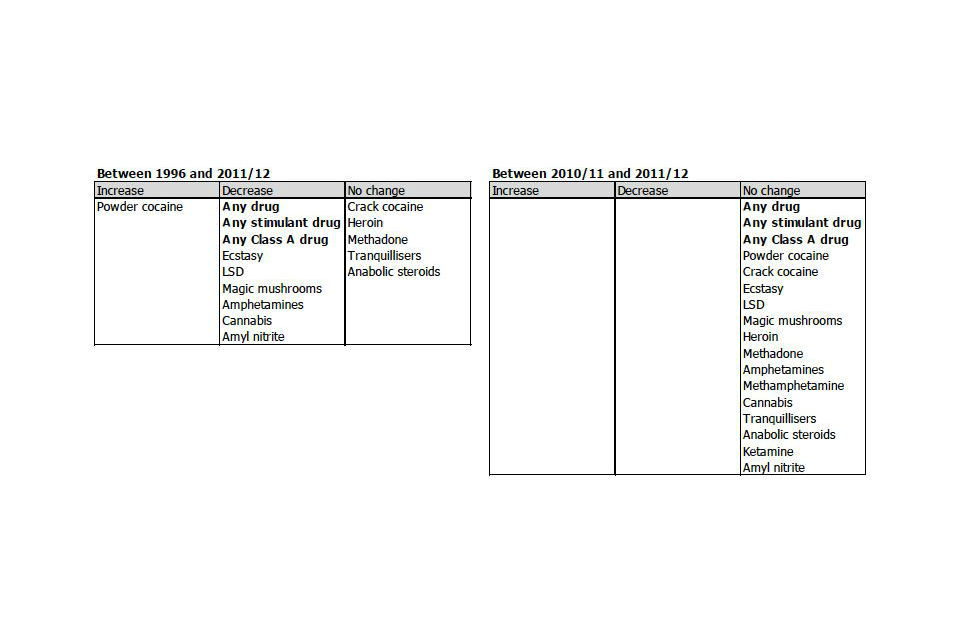
1.7 Summary of trends
Summary of trends in last year drug use among adults aged 16 to 59
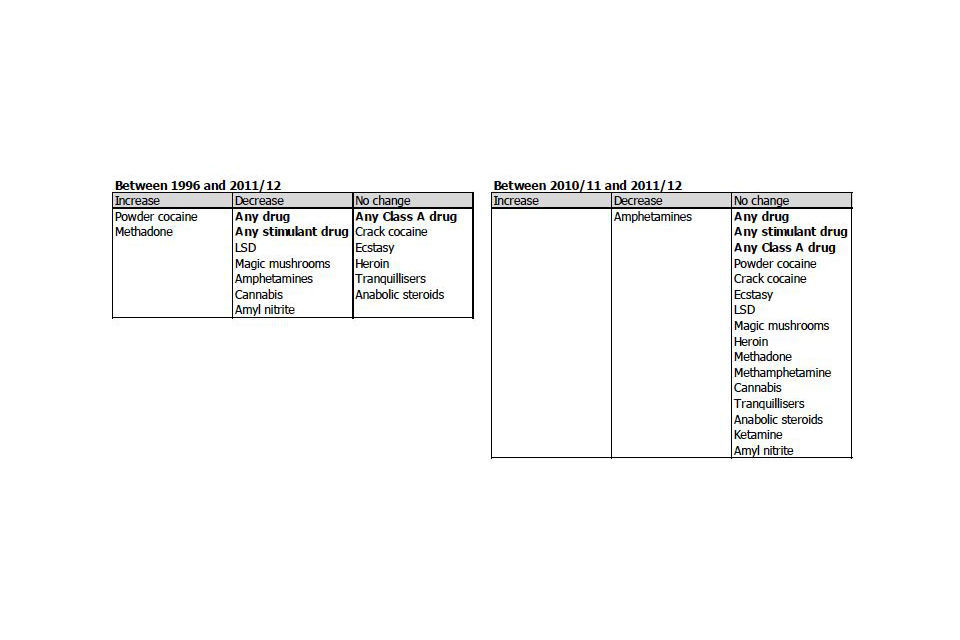
Summary of trends in last year drug use among adults aged 16 to 59
Chart notes
Source: Home Office, Illicit drug use among 16–59s tables: Table EA.02
Where drugs are aggregated into composite groups, these are listed in bold typeface.
Increases or decreases in levels of drug use are determined by statistically significant changes.
1.8 Data quality and interpreting the figures
The CSEW was formerly the British Crime Survey; the name has been changed to better reflect the survey’s geographical coverage.
The CSEW provides estimates of illicit drug use among adults aged 16 to 59 within the general household population of England and Wales. As such, the CSEW provides an effective measure of the more commonly used drugs for which the majority of users are contained within this population. As a household survey, the CSEW does not cover groups such as the homeless, or those living in institutions such as prisons, who have potentially high rates of drug use and problematic drug users who are unable to take part in an interview.
Figures presented from the CSEW are only for adults aged between 16 and 59 as this is the age range of the self-completion module of the CSEW where necessarily these sensitive questions on illicit drug use are asked.
The survey provides estimates of illicit drug use among adults over three time periods: ever in their lifetime, in the last year and in the last month. Information on all these measures is provided for the extent of drug use and is contained in the tables for this section; however, the discussion on trends is based on last year use which is deemed the most reliable measure of recent drug use.
Only increases or decreases that are statistically significant at the 5% level (and are therefore likely to be real) are described as changes within the text; in the tables these changes are identified by asterisks (see the user guide for more information).
1.9 Other data sources
Illicit drug use figures for 16 to 24 year olds are available online in the extent and trends in illicit drug use among young people aged 16 to 24 section.
Discussion of the use of mephedrone and other new measures of illicit drug use among 16 to 59 year olds is available online in the new CSEW measures of drug use section.
The extent and trends in illicit drug use by personal, household and area characteristics and lifestyle factors are available online in the Illicit drug use by personal, household and area characteristics and lifestyle factors section.
National and regional estimates of the prevalence of opiate and/or crack cocaine use 2009/10, the latest figures published by the National Treatment Agency.
2. Extent and trends in illicit drug use among young people aged 16 to 24
2.1 Introduction
This section covers the extent and trends in illicit drug use among young people aged 16 to 24 measured by the 2011/12 CSEW (formerly the British Crime Survey). Figures are presented since 1996 when comparable questions were first included on the survey.
Figures here focus on 16 to 24 year olds as the CSEW has consistently shown that drug usage is higher among young people than for the adult population as a whole.
The user guide provides further details relating to illicit drug use measures.
2.2 Key facts
In the 2011/12 survey, 19.3% of 16 to 24 year olds had used an illicit drug in the last year; this remains around the lowest level since measurement began in 1996 (the last time there was a statistically significant fall was between 2008/09 (22.6%) and 2009/10 (20.0%)).
Last year Class A drug use among 16 to 24 year olds has fallen in the long term from 9.2% in 1996 to 6.3% in 2011/12 (similar to the 6.6% in 2010/11). The gradual decline is partly a result of falls in last year usage of ecstasy (from 6.6% to 3.3%) and hallucinogens (from 5.3% to 1.4%) which have been partially offset by an increase in powder cocaine use (from 1.3% to 4.2%).
As in previous years, the 2011/12 survey showed cannabis was the most commonly used type of drug in the last year (15.7%), followed by powder cocaine (4.2%). In the long term cannabis use has fallen (from 26.0% in 1996 and 28.2% in 1998) and has now been stable at the lowest level since 2009/10. Conversely, levels of last year powder cocaine use have increased since 1996 (1.3%) but between 2009/10 (5.5%) and 2011/12 (4.2%) levels have fallen.
2.3 Data tables
Estimates of illicit drug use among young people from the 2011/12 CSEW can be found in the Illicit drug use among 16–24s tables.
2.4 Extent and trends in overall drug use
In the 2011/12 CSEW:
- 37.7% of 16 to 24 year olds had ever taken an illicit drug in their lifetime (around 2.5 million people);
- 19.3% had done so in the last year (nearly 1.3 million people); and
- 11.1% had in the last month (an estimated 0.7 million people).
Last year use of any illicit drug fell between 1996 and 2011/12 (from 29.7% to 19.3%) due in large part to notable declines in cannabis (from 26.0% to 15.7%) and amphetamine use (from 11.8% to 2.0%). Any last year drug use among 16 to 24 year olds remains at the lowest level since measurement began; the last time there was a statistically significant fall was between the 2008/09 (22.6%) and 2009/10 (20.0%) surveys.
2.5 Extent and trends in CLASS A drug use
In the 2011/12 CSEW:
- around 15.1% of young adults had ever taken a Class A drug in their lifetime (one million people);
- 6.3% had done so in the last year (around 0.4 million people); and
- 3.2% in the last month (around 0.2 million people).
Last year Class A drug use among 16 to 24 year olds has fallen in the long term from 9.2 % in 1996 to 6.3 % in 2011/12 (similar to the 6.6% in 2010/11). The gradual decline is partly a result of falls in last year usage of ecstasy (from 6.6% to 3.3%) and hallucinogens (from 5.3% to 1.4%) which have been partially offset by an increase in powder cocaine use (from 1.3% to 4.2%).
Trends in last year illicit drug use among young people aged 16 to 24, 1996 to 2011/12 CSEW

Trends in last year illicit drug use among young people aged 16 to 24, 1996 to 2011/12 Crime Survey for England and Wales
Chart notes
Source: Home Office, Illicit drug use among 16–24s tables:Table EY.02
2.6 Extent and trends in individual drug use
As in previous years, in 2011/12 cannabis was the most commonly used type of drug among young people in the last year (15.7%), followed by powder cocaine (4.2%) and ecstasy (3.3%). There were no statistically significant changes in levels of last year use of any individual drugs between the 2010/11 and 2011/12 surveys.
In the 2011/12 CSEW the level of last year cannabis use (15.7%) was not statistically significantly different to the 17.1 % estimated in 2010/11 or 16.1 % in 2009/10; thus levels remain at the lowest since measurement began in 1996. The proportion has fallen notably since 1996 (26.0%) but levels have been stable since 2009/10.
Conversely, levels of last year powder cocaine use have increased since 1996 (1.3%) but between 2009/10 (5.5%) and 2011/12 (4.2%) there has been a statistically significant fall.
Although figures for last year use of ecstasy were similar in the 2011/12 (3.3%) and 2010/11 (3.8%) surveys there has been a gradual decline in recent years, with usage being lower in 2011/12 than in 2008/09 (4.4%), continuing the long-term decline since 1996 (6.6%).
Extent of last year illicit drug use for most prevalent drugs among young people aged 16 to 24, 2011/12 CSEW
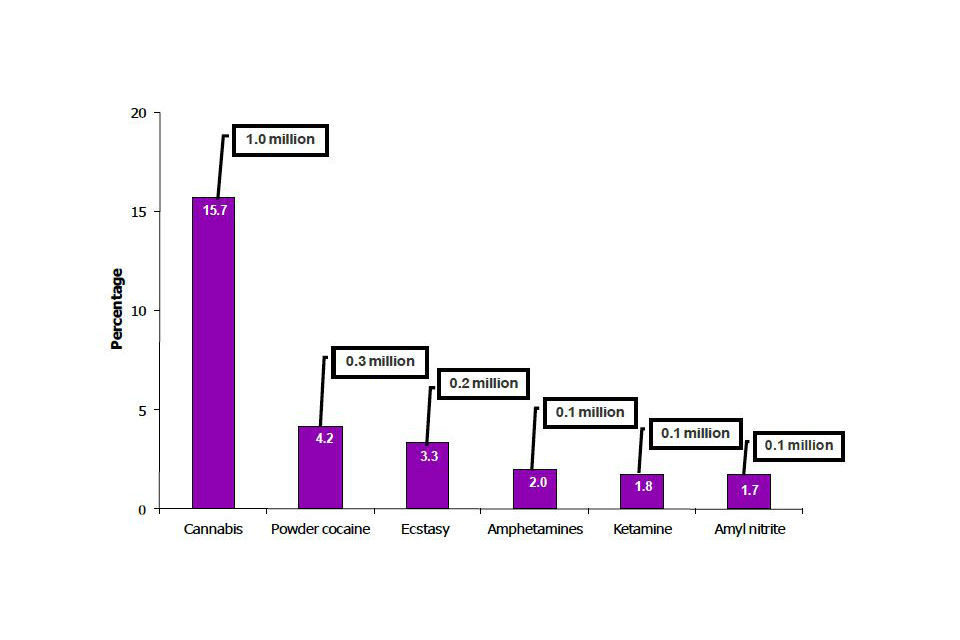
Extent of last year illicit drug use for most prevalent drugs among young people aged 16 to 24, 2011/12 Crime Survey for England and Wales
Chart notes
Source: Home Office, Illicit drug use among 16–24s tables: Tables EY.02 and EY.04
Long-term trends for use of other drug types among young people aged 16 to 24 show that:
- Levels of ketamine use in the last year have been stable for the last four years (1.9% in 2008/09 and 1.8% in 2011/12) following an initial increase since measurement began in 2006/07 (0.8%).
- There is a clear downward trend in last year use of amphetamines since 1996 (11.8%) to 2.0 % in 2011/12 although there have been few statistically significant year-on-year falls.
- Last year use of hallucinogens has fallen based on declines in LSD use (from 4.5% in 1996 to 0.5% in 2011/12) and magic mushrooms (from 2.3% to 1.2%). Last year LSD use has been stable since 2005/06 and for magic mushrooms levels have been similar since 2006/07.
- There has been a long-term fall in amyl nitrite use since 1996 (4.6%) to 1.7 % in 2011/12; the recent notable decline was between 2008/09 (4.4%) and 2011/12 (1.7%).
- There were no statistically significant changes between the 1996 and 2011/12 surveys in the usage of tranquillisers (0.9% to 0.5%), anabolic steroids (0.5% to 0.3%) or opiates (0.4% to 0.5%) in the last year and there has been little variation in levels during that period.
2.7 Summary of trends
Summary of trends in last year drug use among young people aged 16 to 24, 1996 to 2011/12 CSEW
Summary of trends in last year drug use among young people aged 16 to 24, 1996 to 2011/12 Crime Survey for England and Wales
Chart notes
Source: Home Office, Illicit drug use among 16–24s tables: Table EY.02
Where drugs are aggregated into composite groups, these are listed in bold typeface.
Increases or decreases in levels of drug use are determined by statistically significant changes.
2.8 Data quality and interpreting the figures
The CSEW was formerly the British Crime Survey; the name has been changed to better reflect the survey’s geographical coverage.
The CSEW provides estimates of illicit drug use among adults aged 16 to 59 within the general household population of England and Wales. As such, the CSEW provides an effective measure of the more commonly used drugs for which the majority of users are contained within this population. As a household survey, the CSEW does not cover groups such as the homeless, or those living in institutions such as prisons, who have potentially high rates of drug use and problematic drug users who are unable to take part in an interview.
Figures presented from the CSEW are only for adults aged between 16 and 59 as this is the age range of the self-completion module of the CSEW where necessarily these sensitive questions on illicit drug use are asked.
The survey provides estimates of illicit drug use among young people over three time periods: ever in their lifetime, in the last year and in the last month. Information on all these measures is provided for the extent of drug use and is contained in the tables for this section; however, the discussion on trends is based on last year use which is deemed the most reliable measure of recent drug use.
Only increases or decreases that are statistically significant at the 5% level (and are therefore likely to be real) are described as changes within the text; in the tables these changes are identified by asterisks (see the user guide for more information).
2.9 Other data sources
Illicit drug use figures for 16 to 59 year olds are available online in the extent and trends in illicit drug use among adults aged 16 to 59 section.
Discussion of the use of mephedrone and other new measures of illicit drug use among 16 to 24 year olds is available online in the new CSEW measures of drug use section.
The extent of frequent drug use (having taken a drug more than once a month in the last year) among 16 to 24 year olds is available online in the frequent drug use in the last year section.
The extent and trends in illicit drug use by personal, household and area characteristics and lifestyle factors including trends in drug use by age group are available online in the illicit drug use by personal, household and area characteristics and lifestyle factors section.
National and regional estimates of the prevalence of opiate and/or crack cocaine use 2009/10, the latest figures published by the National Treatment Agency.
3. New CSEW measures of drug use
3.1 Introduction
This section investigates levels of use of recently classified drugs (mephedrone, GBL/GHB, BZP, Spice) and khat among adults aged 16 to 59 as measured by the 2011 to 2012 CSEW (CSEW, formerly the British Crime Survey).
The user guide provides further details relating to illicit drug use measures and definitions of characteristics.
3.2 Key facts
Last year use of mephedrone among adults aged 16 to 59 fell to 1.1% in the 2011/12 CSEW from 1.4% in the 2010/11 survey. Mephedrone is the fourth most prevalent drug measured by the CSEW.
Last year use of mephedrone among 16 to 24 year olds (3.3%) was at the same level as ecstasy (3.3%), the third most prevalent drug used within this age group in the 2011/12 CSEW, but use has fallen from 4.4% in 2010/11 to 3.3 % in the 2011/12 survey.
Estimates of use of the other recently classified drugs and khat in the last year were between 0.1 and 0.2% for each type of drug from the 2011/12 CSEW.
3.3 Data tables
Estimates of use of recently classified drugs among adults from the 2011/12 CSEW can be found in the new CSEW measures of drug use tables.
Estimates of last year use of mephedrone by personal, household and area characteristics and lifestyle factors from the 2011/12 CSEW, can be found in the Illicit drug use by demographics tables.
3.4 Extent and trends in new CSEW measures of drug use
Last year use of mephedrone among adults fell to 1.1% in the 2011/12 survey from 1.4% in 2010/11. Mephedrone is the fourth most prevalent drug measured by the CSEW.
Estimates of use of the other recently classified drugs in the last year were between 0.1 and 0.2%. Only GBL/GHB showed an increase between 2010/11 and 2011/12, although use remains low (0.1%).
Last year use of khat among adults remains at 0.2%.
Proportion of 16 to 59 year olds reporting last year use of recently classified drugs and khat, 2010/11 to 2011/12 CSEW
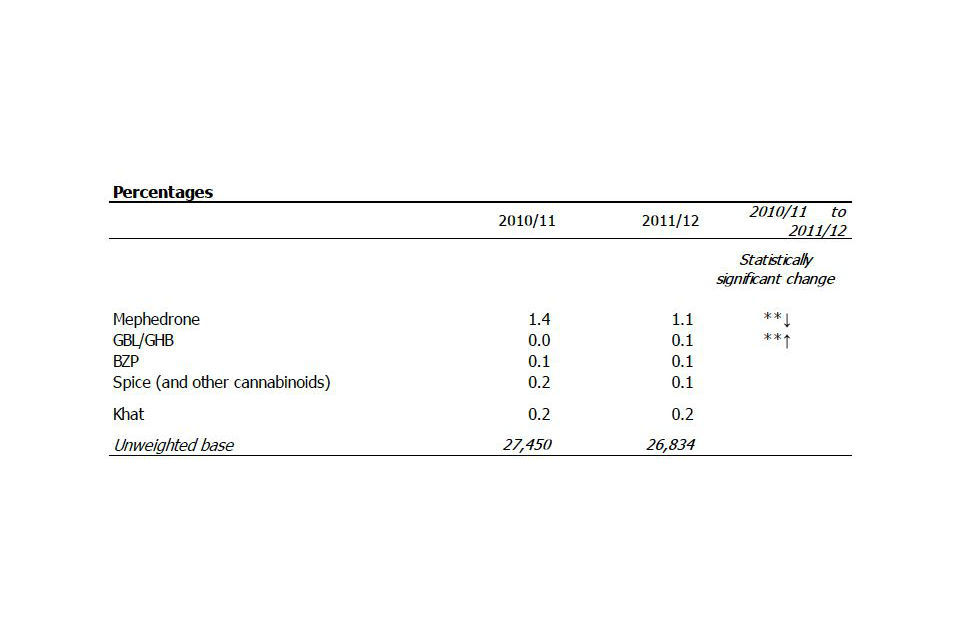
Proportion of 16 to 59 year olds reporting last year use of recently classified drugs and khat, 2010 to 2011 to 2011 to 2012 Crime Survey for England and Wales
Chart notes
Source: Home Office, new CSEW measures of drug use tables: Table N.01
3.5 Extent and trends of mephedrone use by age, sex and lifestyle factors
Last year use of mephedrone among 16 to 24 year olds (3.3%) was at the same level as ecstasy (3.3%), the third most prevalent drug used within this age group in the 2011/12 CSEW but use has fallen from 4.4 % in 2010/11 to 3.3 % in the 2011/12 survey.
In the 2011/12 survey, young people aged 16 to 24 had a higher rate of mephedrone use in the last year (3.3%) than adults aged 25 to 59 (0.5%); levels among adults remain at a similar level as in the 2010/11 survey (0.6%).
As shown for other drug types, levels of last year use of mephedrone varied with personal and household characteristics (see section on Illicit drug use by personal, household and area characteristics and lifestyle factors). For example:
-
Men were twice as likely as women to report last year use of mephedrone (1.5% and 0.7% respectively).
-
The level of mephedrone use was highest among single adults (2.7%) compared with all other marital statuses (for example, divorced adults: 0.5%).
-
Adults living in urban areas were more likely to report that they had used mephedrone in the last year compared with adults living in rural areas (1.2% and 0.6% respectively).
Levels of last year use of mephedrone varied with lifestyle factors such as frequency of nightclub and pub visits and alcohol consumption, which was similar to other drug types (see section on Illicit drug use by personal, household and area characteristics and lifestyle factors). For example:
-
Last year use of mephedrone was highest amongst adults who had visited a nightclub on four or more occasions in the last month (9.7%), compared with those who had been to a nightclub less frequently in the past month (1 to 3 visits: 2.6%; no visits: 0.5%).
-
Last year use of mephedrone was highest among those who consumed alcohol on three or more days a week during the past month (1.9%) compared with those who drank less frequently; for example, those who drank less than a day a week in the past month (0.6%), and those who had not had a drink in the last month (0.2%).
-
Last year use of mephedrone rose with increasing frequency of evening visits to a pub or wine bar in the past month. Adults who visited a pub nine or more times in the past month were most likely to report that they had used mephedrone in the last year (4.7%), more than twice as likely as those who visited a pub four to eight times in the past month (2.0%).
Proportion of adults aged 16 to 59 reporting last year use of mephedrone, by age group, sex and lifestyle factors, 2011/12 CSEW
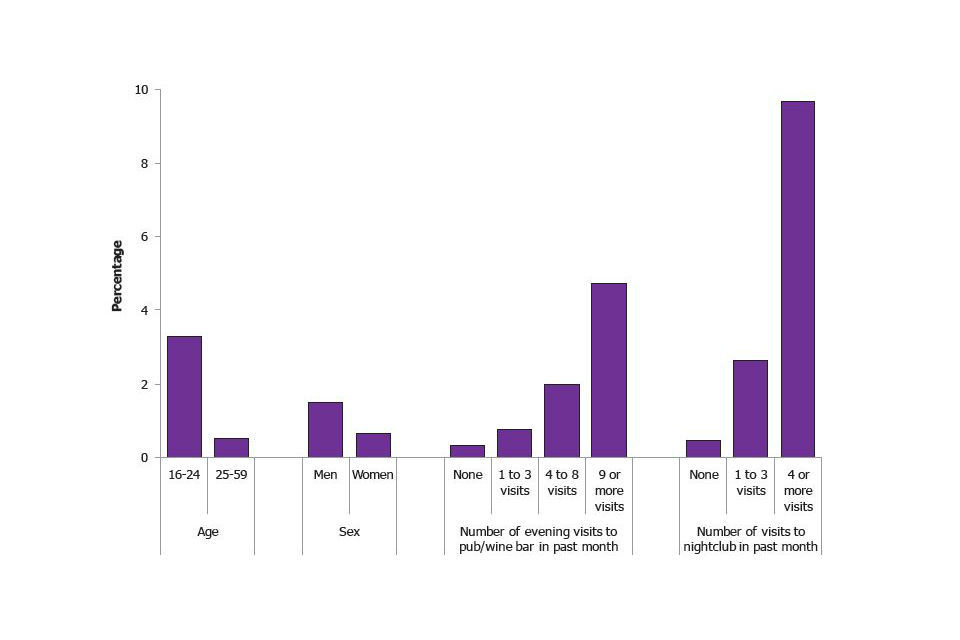
Proportion of adults aged 16 to 59 reporting last year use of mephedrone, by age group, sex and lifestyle factors, 2011 to 12 Crime Survey for England and Wales
Chart notes
Source: Home Office, Illicit drug use by demographics tables: Table D.01
Estimates of mephedrone use by other personal, household and area characteristics are available online in the Illicit drug use by demographics tables.
3.6 Data quality and interpreting the figures
The CSEW was formerly the British Crime Survey; the name has been changed to better reflect the survey’s geographical coverage.
The CSEW provides estimates of illicit drug use among adults aged 16 to 59 within the general household population of England and Wales. As such, the CSEW provides an effective measure of the more commonly used drugs for which the majority of users are contained within this population.
A question on mephedrone use in the last year was added to the 2010/11 CSEW to gather information about the extent of its use in the general population. Legislation was passed on 16 April 2010 under the Misuse of Drugs Act to control mephedrone as a Class B substance.
The CSEW collects a rich set of information on the personal, household and area characteristics as well as lifestyle factors of adults that are used to explore differences in illicit drug use. While these discrete relationships provide useful information, it should be noted that these factors often interact and caution should be taken when drawing conclusions; for example, marital status is strongly age-related and different ethnic groups have different age profiles (eg mixed ethnic groups tend to have younger age profiles than White ethnic groups).
Only increases or decreases that are statistically significant at the 5% level (and are therefore likely to be real) are described as changes within the text; in the tables these changes are identified by asterisks (see the user guide for more information).
3.7 Other data sources
The extent and trends in illicit drug use by personal, household and area characteristics and lifestyle factors are available online in the Illicit drug use by personal, household and area characteristics and lifestyle factors section.
Illicit drug use figures for 16 to 59 year olds are available online in the extent and trends in illicit drug use among adults aged 16 to 59 section.
Illicit drug use figures for 16 to 24 year olds are available online in the extent and trends in illicit drug use among young people aged 16 to 24 section.
Figures from 2010/11 on the location and source of drugs when last taken were published in Drug Misuse Declared: Findings from the 2010/11 British Crime Survey (England and Wales).
4. Frequent drug use in the last year
4.1 Introduction
This section investigates levels of frequent drug use, that is having taken any illicit drug more than once a month on average in the last year, among adults aged 16 to 59 as measured by the 2011/12 CSEW (CSEW, formerly the British Crime Survey).
The user guide provides further details relating to illicit drug use measures.
4.2 Key facts
Estimates from the 2011/12 CSEW show that 3.3% of adults aged 16 to 59 were defined as frequent drug users (having taken any illicit drug more than once a month on average in the last year), equivalent to two in five (40%) adults who reported last year drug use. This was similar to findings in the 2009/10 survey (3.3% and 41% respectively) which was the last time the question was asked.
Frequent drug use among young people aged 16 to 24 is twice as high (7.0%) as for 16 to 59 year olds overall (3.3%). However, among young people who have reported taking any drug in the last year, two in five (41%) were defined as frequent drug users, a similar proportion to that found among adults (40%).
4.3 Data tables
Estimates of frequent drug use in the last year among adults from the 2011/12 CSEW can be found in the frequent drug use tables.
4.4 Extent of frequent drug use
Estimates from the 2011/12 CSEW show that 3.3% of adults aged 16 to 59 were defined as frequent drug users (having taken any illicit drug more than once a month on average in the last year), equivalent to two in five (40%) adults who reported last year drug use. This was similar to findings in 2009/10 (3.3% and 41% respectively) which was the last time the question was asked.
Frequent drug use among young people aged 16 to 24 is twice as high (7.0%) as for 16 to 59 year olds overall (3.3%). However, among young people who have reported taking any drug in the last year, two in five (41%) were defined as frequent drug users, a similar proportion to that found among adults (40%).
Cannabis was the most prevalent drug taken in the last year among adults aged 16 to 59 (6.9%) and among young people aged 16 to 24 (15.7%). Of those reporting last year use of cannabis, two in five users (42%) reported frequent use of this drug for both adults and young people.
4.5 Trends in frequent drug use
There has been a decrease in frequent drug use among 16 to 24 year olds since measurement began in the 2002/03 survey (11.6%). There was a general downward trend between 2003/04 (12.4%) and 2007/08 (7.3%), and since 2007/08 the trend has been broadly flat. Questions on frequency of use in the last year were first completed by all adults aged 16 to 59 in the 2009/10 survey.
Proportion of 16 to 24 year olds classified as frequent drug users, 2002/03 to 2011/12 CSEW
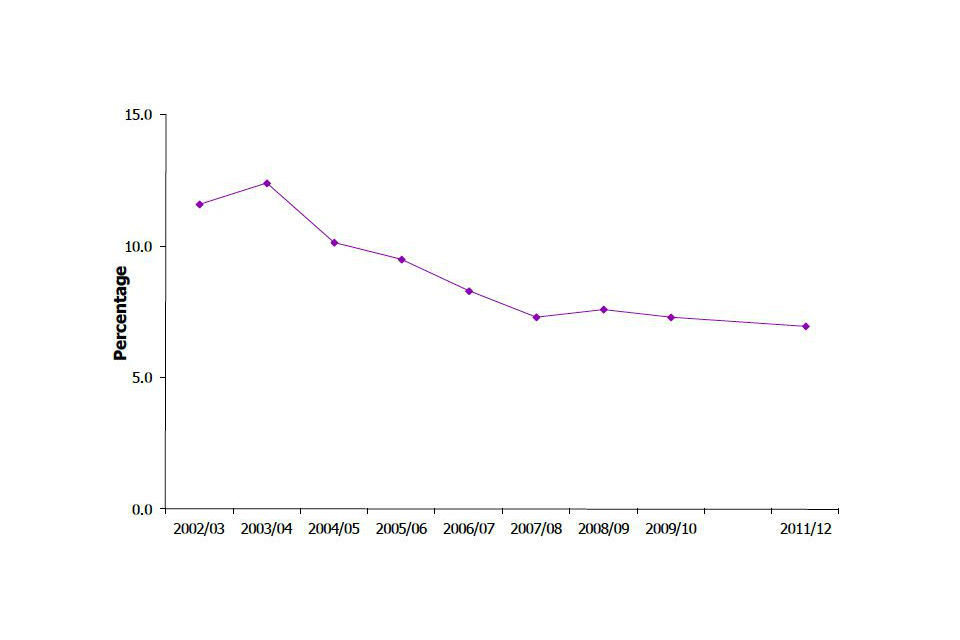
Proportion of 16 to 24 year olds classified as frequent drug users, 2002/03 to 2011/12 Crime Survey for England and Wales
Chart notes
Source: Home Office, Illicit drug use among 16-24s tables: Table EY.02 .
4.6 Data quality and interpreting the figures
The CSEW was formerly the British Crime Survey; the name has been changed to better reflect the survey’s geographical coverage.
The CSEW provides estimates of illicit drug use among adults aged 16 to 59 within the general household population of England and Wales. As such, the CSEW provides an effective measure of the more commonly used drugs for which the majority of users are contained within this population. Figures presented from the CSEW are only for adults aged between 16 and 59 as this is the age range of the self-completion module of the CSEW where necessarily these sensitive questions on illicit drug use are asked.
In the context of this release, frequent drug use is defined as using any illicit drug more than once a month on average during the last year.
Questions on frequency of use in the last year have been asked of 16 to 24 year olds since the 2002/03 CSEW and were first completed by all adults aged 16 to 59 in 2009/10. These questions were rotated out of the 2010/11 questionnaire and added in again to the 2011/12 CSEW.
Only increases or decreases that are statistically significant at the 5% level (and are therefore likely to be real) are described as changes within the text; in the tables these changes are identified by asterisks (see the user guide for more information).
4.7 Other data sources
Illicit drug use figures for 16 to 59 year olds are available online in the extent and trends in illicit drug use among adults aged 16 to 59 section.
Illicit drug use figures for 16 to 24 year olds are available online in the extent and trends in illicit drug use among young people aged 16 to 24 section.
Figures from 2009/10 on frequent drug use in the last year were published in drug misuse declared: findings from the 2009/10 British Crime Survey (England and Wales).
5. Illicit drug use by personal, household and area characteristics and lifestyle factors
5.1 Introduction
This section presents findings from the 2011/12 CSEW (CSEW, formerly the British Crime Survey) on levels of last year illicit drug use by age, sex, frequency of nightclub and pub visits and alcohol consumption. Illicit drug use by household and area characteristics are included in the Illicit drug use by demographics tables but are not commented on here.
Findings relating to mephedrone use by these personal characteristics and lifestyle factors are discussed in the new CSEW measures of illicit drug use section.
The user guide provides further details relating to illicit drug use measures and definitions.
5.2 Key facts
The 2011/12 CSEW showed that levels of any drug use in the last year were highest among the 16 to 19 (19.6%) and 20 to 24 (19.0%) age groups, with cannabis being the most commonly used type of drug (15.7% of both 16 to 19 and 20 to 24 year olds reported cannabis use in the last year). Class A drug use was highest among 20 to 29 year olds (7.2% of 20 to 24 year olds and 5.9% of 25 to 29 year olds). This pattern of higher drug use among younger age groups has been consistently observed since the 1996 survey.
Since 1996, levels of any last year drug use, Class A drug use, and use of individual drugs have been higher for men than women. For example, in 2011/12 men were more than twice as likely as women to have used any drug (12.4% of men and 5.5% of women) and any Class A drug (4.4% of men and 1.6% of women) in the last year.
As shown in previous years, levels of drug use increase with increasing frequency of visits to a nightclub or pub. The 2011/12 survey showed that almost a third (30.7%) of 16 to 59 year olds who visited a nightclub four or more times in the past month had used any drug in the last year compared with 6.5% of those who had not visited a nightclub. Around a quarter (23.9%) of adults who visited a pub nine or more times in the last month had taken any drug in the last year compared with 5.2% of those who had not visited a pub.
5.3 Data tables
Estimates of last year illicit drug use by personal, household and area characteristics and lifestyle factors from the 2011/12 CSEW, alongside long-term trends for certain characteristics, can be found in the illicit drug use by demographics tables
5.4 Extent and trends in illicit drug use by age group
As shown in previous years, the level of any last year illicit drug use was highest among the youngest age groups; 19.6 % of 16 to 19 year olds and 19.0% of 20 to 24 year olds reported any last year drug use. Levels of illicit drug use then decreased with increasing age, from 14.0% of those aged 25 to 29 to 1.8% of 55 to 59 year olds.
Proportion of 16 to 59 year olds reporting use of any drug in the last year by age group, 1996 to 2011/12 CSEW
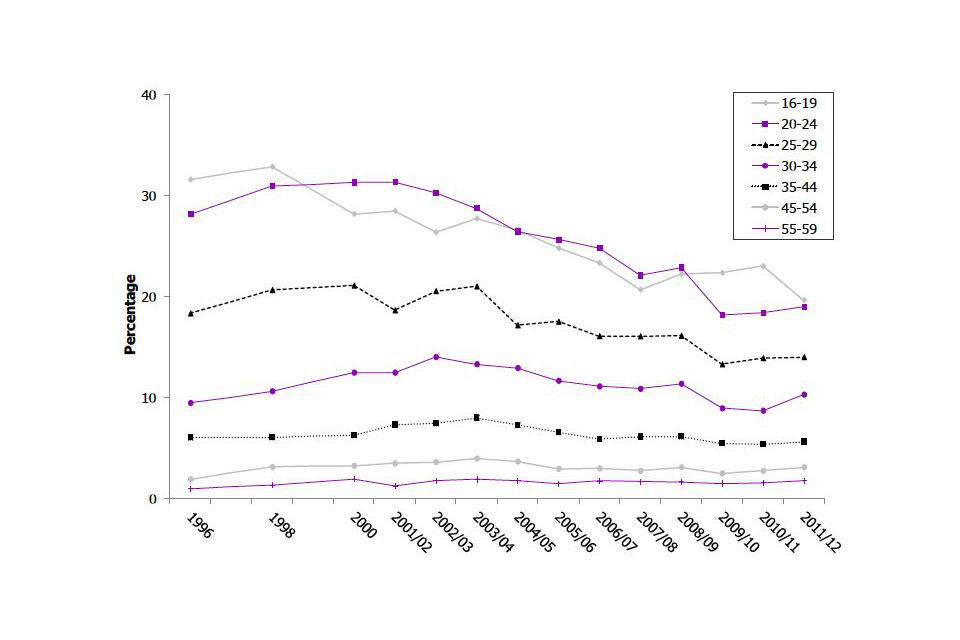
Proportion of 16 to 59 year olds reporting use of any drug in the last year by age group, 1996 to 2011/12 Crime Survey for England and Wales
Chart notes
Source: Home Office, Illicit drug use by demographics tables: Table D.03
Between the 1996 and 2011/12 CSEW last year use of any illicit drug fell, due in large part to the declines in illicit drug use among 16 to 24 year olds for the most prevalent drug types (cannabis, ecstasy, amphetamines and hallucinogens).
Most recently, although last year cannabis use has remained stable overall between 2010/11 and 2011/12, use among 16 to 19 year olds fell (from 20.0% in 2010/11 to 15.7% in 2011/12) and rose among 30 to 34 year olds (from 6.1% to 7.7%).
Class A drug use was highest among 20 to 29 year olds with 7.2 % of 20 to 24 year olds and 5.9 % of 25 to 29 year olds reporting Class A drug use in the last year.
Since the 1996 survey, there have been a number of changes in the last year use of individual Class A drugs among different age groups:
-
Use of powder cocaine has increased among all age groups except those aged 55 to 59 between 1996 and 2011/12.
-
Use of ecstasy and hallucinogens has decreased among those aged 16 to 24, for example use of hallucinogens among 16 to 19 year olds has fallen from 6.5 % in 1996 to 1.2 % in 2011/12.
-
Use of ecstasy has increased among those aged 30 to 44 (from 0.6% to 1.7% among 30 to 34 year olds and from 0.2 % to 0.6 % among 35 to 44 year olds).
5.5 Extent and trends in illicit drug use by sex
Levels of last year use of any illicit drug or Class A drug were higher among men than women in 2011/12, a pattern which has been consistently demonstrated since 1996.
This pattern can also be seen for individual drugs, for example, in the 2011/12 survey men were more than three times as likely as women to report last year use of powder cocaine (3.3% and 1.0% respectively) and more than twice as likely to report last year use of cannabis (9.7% and 4.1% respectively).
The fall in last year use of hallucinogens, amphetamines and cannabis between 1996 and 2011/12 was apparent among both men and women. The rate of decline in cannabis use in the long term is greater for women (from 7.3% to 4.1%) than for men (from 11.5% to 9.7%).
5.6 Extent and trends in illicit drug use by lifestyle factors
Illicit drug use varied by lifestyle factors such as frequency of nightclub and pub visits and alcohol consumption.
As shown in previous years, levels of last year drug use increases with increasing frequency of nightclub and pub visits. For example, in the 2011/12 CSEW:
-
Last year use of ecstasy was around 14 times higher among those who had visited a nightclub four or more times in the past month (9.7%) compared with those who had not visited a nightclub in the past month (0.7%).
-
Last year use of powder cocaine was around 13 times higher among those who had visited a pub nine or more times in the past month (8.2%) compared with those who had not visited a pub in the past month (0.6%).
Proportion of 16 to 59 year olds reporting use of individual drugs in the last year by frequency of nightclub visits in the past month, 2011/12 CSEW
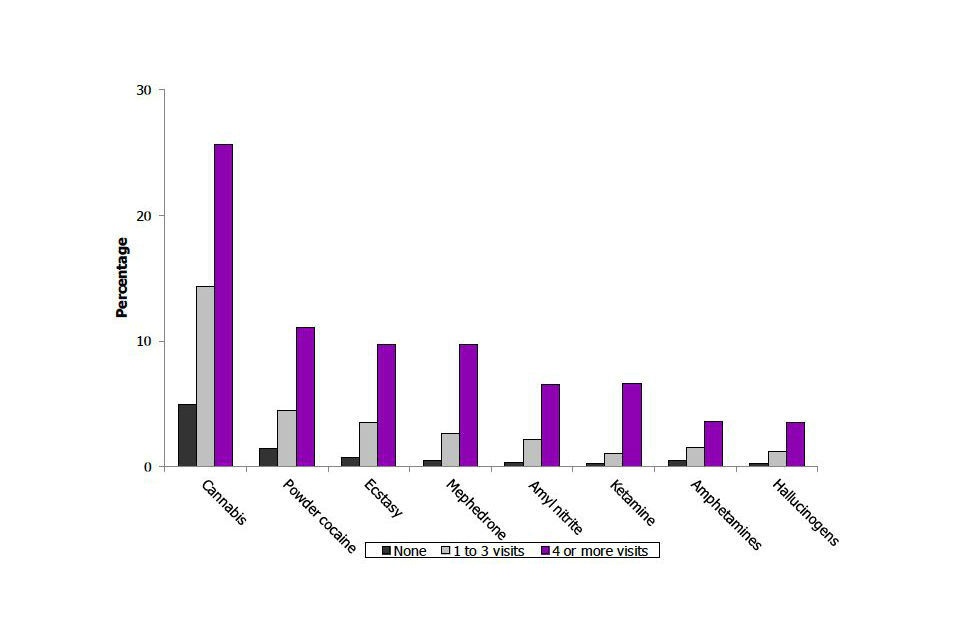
Proportion of 16 to 59 year olds reporting use of individual drugs in the last year by frequency of nightclub visits in the past month, 2011/12 Crime Survey for England and Wales
Chart notes
Source: Home Office, Illicit drug use by demographics tables: Table D.01
In 2011/12, as frequency of alcohol consumption increased, so did last year drug use. Those 16 to 59 year olds who reported drinking alcohol three or more days per week were around three times more likely to have used any illicit drug (12.4%) and around six times more likely to have used a Class A drug (4.9%) in the last year than those who had not drunk any alcohol in the last month (4.4% for any drug and 0.8% for any Class A drug).
Findings from the 2010/11 and 2011/12 CSEW on simultaneous drug and alcohol use are discussed in the simultaneous polydrug and polysubstance use among adults aged 16 to 59 section.
5.7 Data quality and interpreting the figures
The CSEW was formerly the British Crime Survey; the name has been changed to better reflect the survey’s geographical coverage.
The CSEW provides estimates of illicit drug use among adults aged 16 to 59 within the general household population of England and Wales. As such, the CSEW provides an effective measure of the more commonly used drugs for which the majority of users are contained within this population. Figures presented are for adults aged between 16 and 59 as this is the age range of the self-completion module of the CSEW where necessarily these sensitive questions on illicit drug use are asked.
The CSEW collects a rich set of information on the personal, household and area characteristics as well as lifestyle factors of adults that are used to explore differences in illicit drug use. While these discrete relationships provide useful information, it should be noted that these factors often interact and cautions should be taken when drawing conclusions; for example, marital status is strongly age-related and different ethnic groups have different age profiles (eg mixed ethnic groups tend to have younger age profiles than White ethnic groups).
Only increases or decreases that are statistically significant at the 5% level (and are therefore likely to be real) are described as changes within the text; in the tables these changes are identified by asterisks (see the user guide for more information).
5.8 Other data sources
Findings relating to the use of mephedrone by personal characteristics and lifestyle factors are discussed in the new CSEW measures of illicit drug use section.
Due to small sample sizes, limited analysis by ethnicity is provided in this section and breakdowns by self-reported sexual orientation are not possible. More robust analysis of illicit drug use by ethnicity and sexual orientation using a combined three-year dataset can be found in Drug Misuse Declared: Findings from the 2009/10 British Crime Survey (England and Wales).
Multivariate analysis showing the likelihood of last year drug use according to different characteristics and lifestyle factors can be found in Drug Misuse Declared: Findings from the 2009/10 British Crime Survey (England and Wales).
The National Treatment Agency (NTA) publishes information annually on the age, sex and ethnicity of clients aged 18 years and over in drug treatment contact in England in its annual report Statistics from the National Drug Treatment Monitoring System (NDTMS) 31 March 2011.
6. Onset and desistance of illicit drug use among adults aged 16 to 59
6.1 Introduction
This section investigates the age at which illicit drugs were first taken (age of onset) by adults who had ever taken them as measured by the 2011/12 CSEW (CSEW, formerly the British Crime Survey).
Additional analysis is presented on age of desistance (that is, age of last use among those who had ever taken, but not in the last year) to understand more about length of time in, and age of leaving, the drug-taking population.
Figures are presented only for the 3 most prevalent drugs: cannabis, powder cocaine and ecstasy.
The user guide provides further details relating to illicit drug use measures.
6.2 Key facts
The most commonly reported age for first taking cannabis was 16 years and for powder cocaine and ecstasy was 18 years.
Among those who were no longer regular drug users, the most commonly reported age for stopping taking cannabis was 18 and for powder cocaine and ecstasy was 25.
The average length of time that adults had been in the cannabis-taking population was 6.2 years, higher than the estimates for those having desisted from taking powder cocaine (4.4 years) or ecstasy (3.9 years).
6.3 Data tables
Estimates of the age at which drugs were first and last taken among adults aged 16 to 59 from the 2011/12 CSEW can be found in the onset and desistance tables.
6.4 Age of onset
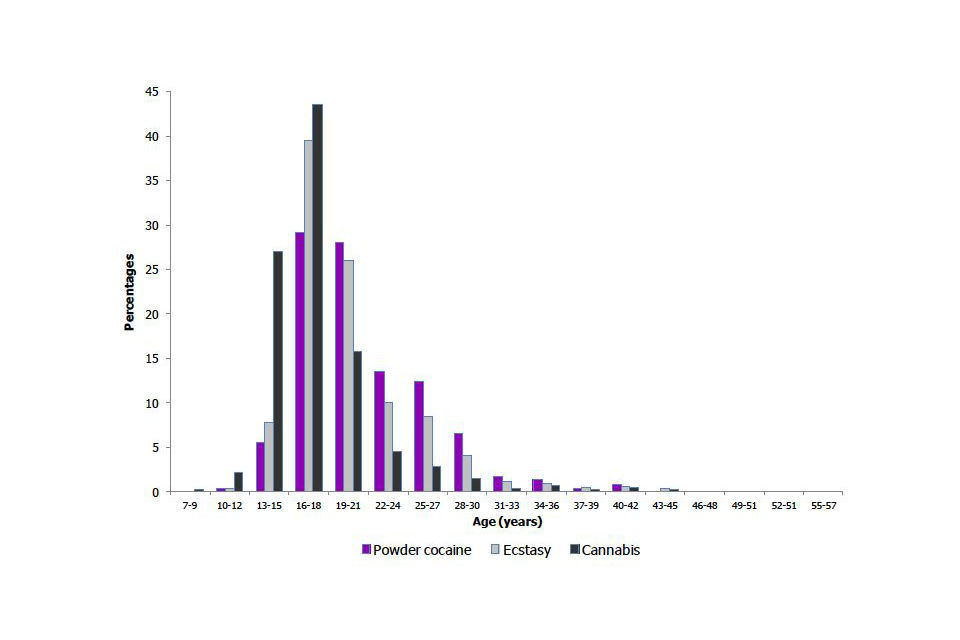
Among adults aged 16 to 59 who had ever taken each type of drug, the most common age at which people first took cannabis (16 years old), powder cocaine (18 years) or ecstasy (18 years) from the 2011/12 CSEW was the same as findings from the 2009/10 survey drug misuse declared 2009/10.
-
The most commonly reported age for first taking cannabis was 16 years. But, as expected, there was a lot of variation among adults in the age cannabis was reported to be first taken, ranging from 8 to 56 years old (with an overall average of around 18 years).
-
Age of onset was most commonly 18 for cocaine powder, but again this was within a wide range of reported ages, from 9 to 57 years old (the average reported age of onset was about 21 years).
-
The most commonly reported age of onset for ecstasy was 18 years. Again, the first age of use reported by adults varied considerably, between 7 and 51 years old (with an average of around 20 years for age of onset).
Age of first use of powder cocaine, ecstasy and cannabis use among adults aged 16 to 59 who had ever taken each drug, 2011/12 CSEW
Age of first use of powder cocaine, ecstasy and cannabis use among adults aged 16 to 59 who had ever taken each drug, 2011/12 Crime Survey for England and Wales
Chart notes
Source: Home Office, Onset and desistance tables: Table C.02
6.5 Age of desistance
Among adults aged 16 to 59, around 3-quarters of those who said they had ever used cannabis or powder cocaine (78% and 77% respectively, data not shown) said they had not done so in the last year; the corresponding proportion was higher for ecstasy (84%, data not shown). Within the survey, this group represents adults who have left the drug-taking population (desistance) although it may be that some adults subsequently re-enter the population.
For those adults who said they had ever taken a drug but not in the last year (and were therefore not currently in the drug-taking population) the age at which they last took each drug type was as follows (2011/12 CSEW).
-
The most commonly reported age for desisting from taking cannabis was 18; however, as for age of onset, there was a wide range in the reported age for the last time drugs were taken, from 8 to 59 years old. The average age for desisting cannabis use was 24 years.
-
For powder cocaine, the most common age that adults had desisted was 25 years old. Again, the ages reported varied widely (nine to 57 years old), but the average was around 26 years old.
-
For ecstasy the most common age that people had desisted was 25 years old. The average age was similar, around 24 years old, with the variation in age of desistence being from 12 to 52 years.
6.6 Duration of illicit drug taking
The average duration that adults were in the drug-taking population for each type of drug can be estimated by calculating the length of time between the age the drug was reported to be first used and the age of desistance. Note that these figures relate only to those who have desisted from taking drugs – they are not estimates of drug-taking careers overall.
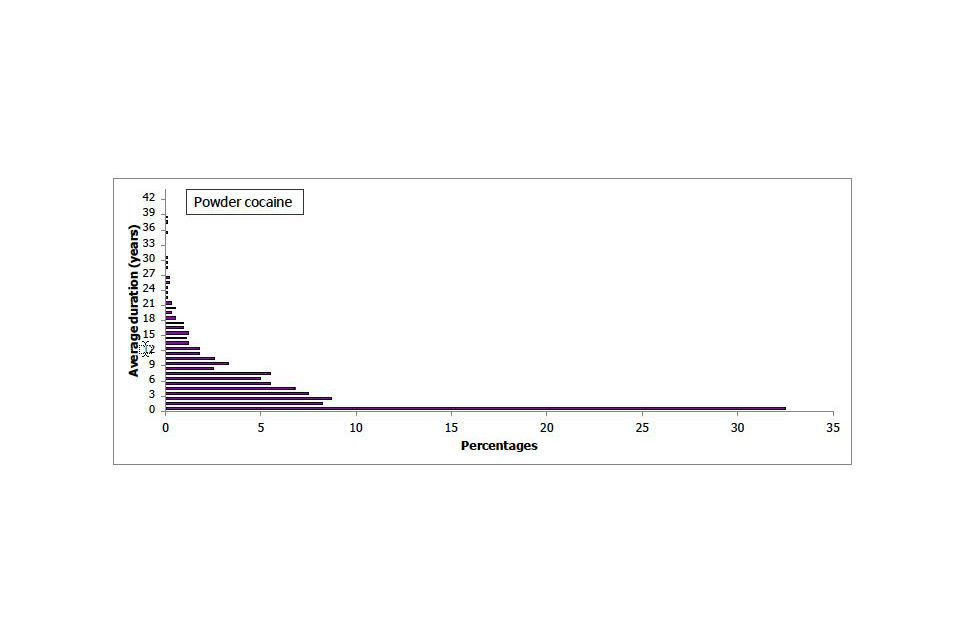
The average length of time that adults had been in the cannabis-taking population was 6.2 years, higher than the estimates for those having desisted from taking powder cocaine (4.4 years) or ecstasy (3.9 years).
The maximum reported duration for cannabis taking (among those who have left the drug-taking population) was 43 years and for powder cocaine and ecstasy it was 38 years. However, very few adults reported the longest durations; the most frequently reported duration was less than one year for all drug types among adults who had reported ever taking the drug but not in the last year:
-
27% were calculated to have taken cannabis for less than a year.
-
Around a third were calculated to have taken powder cocaine or ecstasy for less than a year (33% and 32% respectively).
Average duration of powder cocaine use among adults aged 16 to 59 who had ever taken each drug but not in the last year, 2011/12 CSEW
Average duration of powder cocaine use among adults aged 16 to 59 who had ever taken each drug but not in the last year, 2011/12 Crime Survey for England and Wales
Chart notes
Source: Home Office, Onset and desistance tables: Table C.05
Average duration of ecstasy use among adults aged 16 to 59 who had ever taken each drug but not in the last year, 2011/12 CSEW
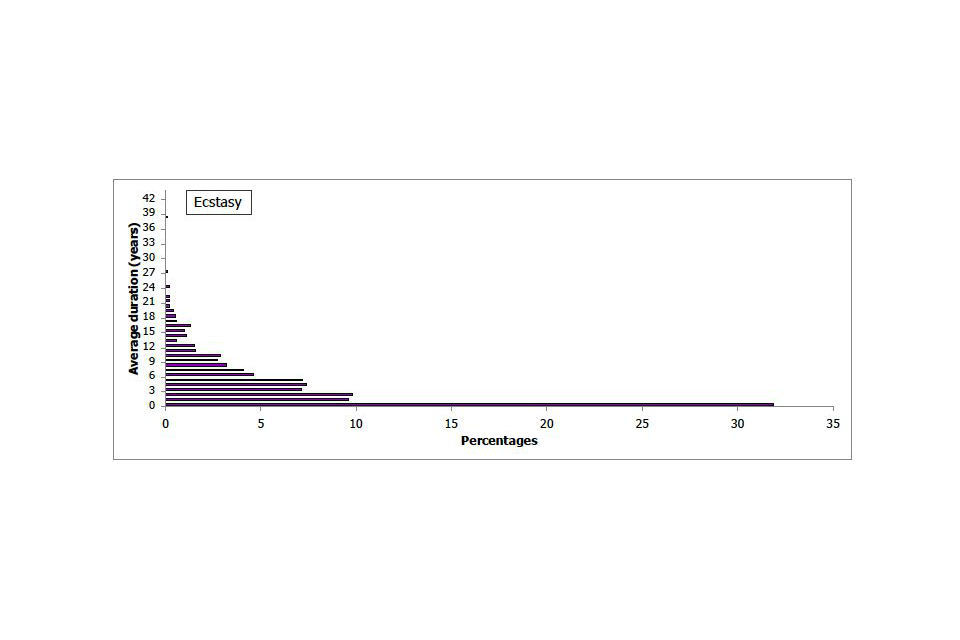
Average duration of ecstasy use among adults aged 16 to 59 who had ever taken each drug but not in the last year, 2011/12 Crime Survey for England and Wales
Chart notes
Source: Home Office, Onset and desistance tables: Table C.05
Average duration of cannabis use among adults aged 16 to 59 who had ever taken each drug but not in the last year, 2011/12 CSEW
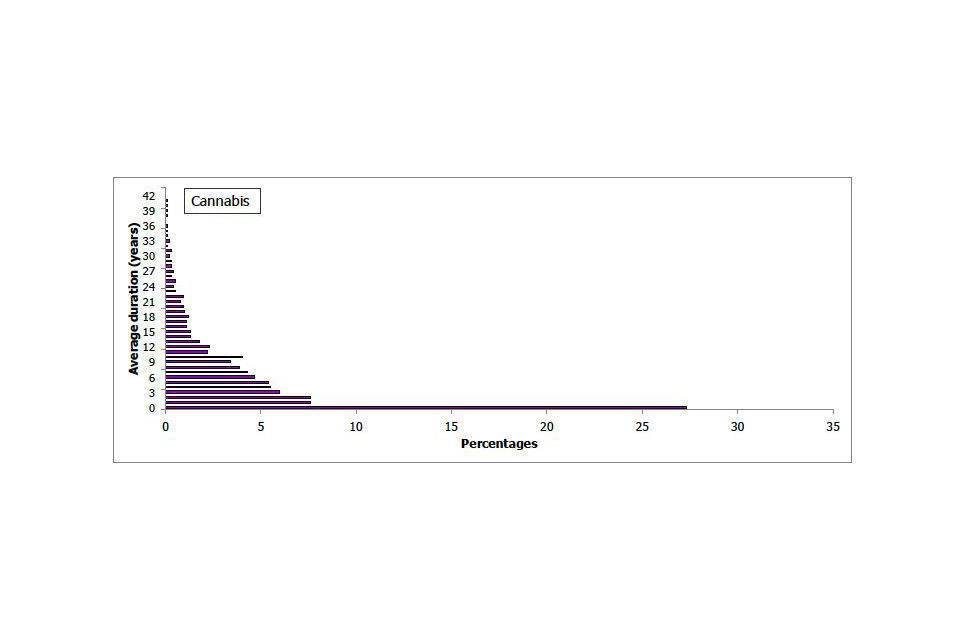
Average duration of cannabis use among adults aged 16 to 59 who had ever taken each drug but not in the last year, 2011/12 Crime Survey for England and Wales
Chart notes
Source: Home Office, Onset and desistance tables: Table C.05
6.7 Data quality and interpreting the figures
The CSEW was formerly the British Crime Survey; the name has been changed to better reflect the survey’s geographical coverage.
The CSEW provides estimates of illicit drug use among adults aged 16 to 59 within the general household population of England and Wales. As such, the CSEW provides an effective measure of the more commonly used drugs for which the majority of users are contained within this population. Figures presented from the CSEW are only for adults aged between 16 and 59 as this is the age range of the self-completion module of the CSEW where necessarily these sensitive questions on illicit drug use are asked.
Questions asked about the age at which adults first took drugs (if ever taken) indicate at which age people enter the population of drug users (age of onset). These data contribute to estimate the incidence of drug use, that is, the rate at which people enter, and the effect on the size of, the drug-taking population.
Questions asked about the age at which adults last took drugs (if ever taken, but not in the last year) contribute to estimating age of desistance and hence the rate at which people leave, and the effect on the size of, the drug-taking population. Questions about age of onset and desistance are only asked for the 3 most prevalent drugs: cannabis, powder cocaine and ecstasy.
The most common age is determined by the ‘mode’ of the distribution by age; that is, the majority age at which adults reported first or last taking drugs. However, the mean is also presented as there is a varied distribution and the average figure provides an alternative description of the figures.
The duration of a drug-taking period is an estimate based on the assumption that there is a whole year period between consecutive ages given. For example, in this analysis, first taking cannabis at 16 years and last taking at 17 years constitutes a one-year duration while first taking and last taking cannabis at 16 constitutes a period of less than one year (these periods could both relate to just a few months). There is no evidence from the data as to continuity or frequency of drug-taking during this period – indeed, drugs may have only been taken on the first and last occasion.
Although there may be recall issues for those that had taken drugs many years previously, the data quality was sufficient that no adults said they last took each drug at an age older than their current age or at an age younger than when they had first taken that drug.
Figures relate to 16 to 59 year olds but these estimates should be interpreted on the basis that younger people simply have not had the opportunity to start taking drugs at older ages and later onset of use may be related to market factors such as lack of availability of drugs at earlier times (cannabis has been available for longer than powder cocaine and ecstasy).
‘Don’t know’ was given as a response in around 10% of cases for each question asked about age first or last taken each drug in 2011/12; these cases were excluded from analysis as were cases where adults reported first or last taking each drug at age 6 or less (consistent with previous analysis on the age of onset from the 2003/04 and 2009/10 CSEW).
6.8 Other data sources
Figures from 2003/04 on the age drugs were first taken were published in drug misuse declared: findings from the 2003/04 British Crime Survey (England and Wales).
Figures from 2009/10 on the age drugs were first taken were published in drug misuse declared: findings from the 2009/10 British Crime Survey (England and Wales
The smoking, drinking and drug use among 11 to 15 year olds in England 2011 report includes extensive information around first drug use for 11 to 15 year olds.
7. Accessibility of drugs
7.1 Introduction
Findings are presented here from the 2011/12 CSEW (CSEW, formerly the British Crime Survey) on the location the most recent drugs taken in the last year were obtained and their source; as well as new analysis about the ease, or perceived ease, of obtaining illegal drugs.
The user guide provides further details relating to illicit drug use measures.
7.2 Key facts
Of those adults who had taken drugs in the last year, the majority obtained the most recently taken illicit drugs under domestic circumstances (58%); that is nearly 2 in five (37%) adults obtained drugs at someone else’s home, and a further one in five (22%) obtained drugs at their own home.
Around 2-thirds of adults (63%) obtained the last drugs they took from someone else well known to them (eg a friend, neighbour, work colleague).
Around 4 in five adults (78%) who had taken any illicit drug in the last year thought it was very or fairly easy for them to personally get illegal drugs when they wanted them. Adults who had not taken any illicit drug in the last year perceived a slightly lower level of ease for obtaining illegal drugs if they wanted them (75% perceived it to be very or fairly easy to do so).
7.3 Data tables
Estimates from the 2011/12 CSEW on the source, location and ease of obtaining drugs can be found in the Accessibility of drugs tables.
7.4 Location where obtained drugs when last taken
Of those adults who had taken drugs in the last year, the majority obtained the most recently taken illicit drugs under domestic circumstances (58%); that is nearly 2 in five (37%) adults obtained drugs at someone else’s home, and a further one in five (22%) obtained drugs at their own home.
Around one in five adults obtained drugs at a bar, pub, club, party or rave (21%) the last time they had taken them; one in ten (10%) obtained them on the street, in a park or some other outside area; and the remaining 11 % obtained them somewhere else.
Unsurprisingly, the location of where drugs were obtained varied between drugs, for example:
-
Adults who had last taken cannabis were more likely (65%) to have obtained the drug at home or at someone else’s home compared with adults who had last taken powder cocaine (42%) and adults who had last taken ecstasy (29%).
-
Adults who had last taken powder cocaine and those who had last taken ecstasy were more likely to have obtained these drugs in a bar, pub, club, party or rave (48% and 55% respectively) than adults who had last taken cannabis (13%).
Location where drugs obtained the last time cannabis, powder cocaine or ecstasy were taken, 2011/12 CSEW
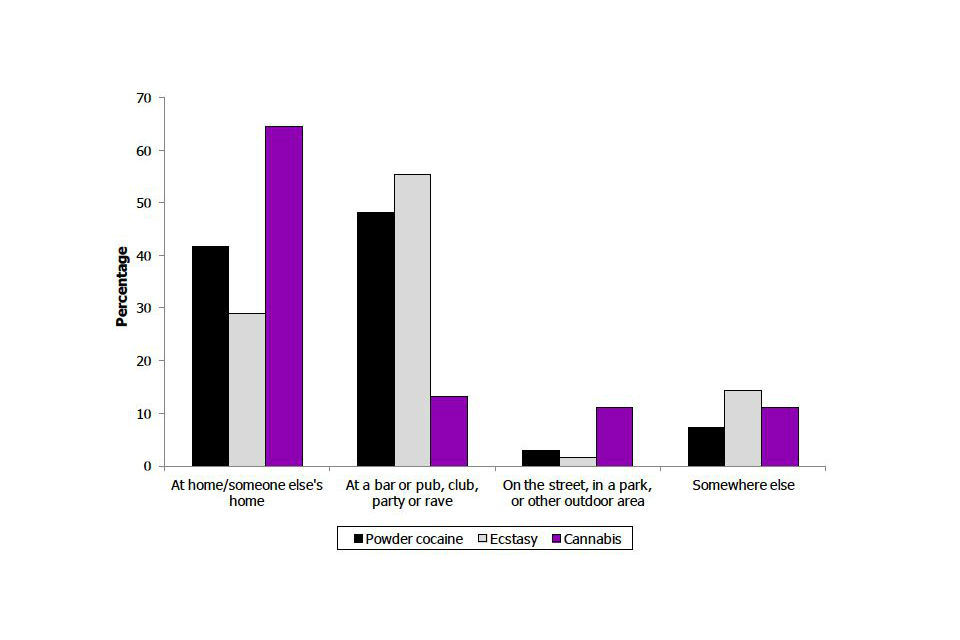
Location where drugs obtained the last time cannabis, powder cocaine or ecstasy were taken, 2011/12 Crime Survey for England and Wales
Chart notes
Source: Home Office, Accessibility of drugs tables: Table A.01
7.5 Source of drugs when last taken
Among adults who had taken any drug in the last year, findings concerning the source of the drugs that were last taken showed that:
-
Around 2-thirds of adults (63%) obtained the drugs last taken from someone else well known to them (eg a friend, neighbour, work colleague).
-
Around one in 6 (16%) adults obtained the drugs (whether bought or given) from a dealer (11% from a known dealer and 5% from a dealer not known to the respondent personally).
-
Around 1% of adults (0.9%) purchased drugs over the internet the last time they had taken drugs, similar to the level found in the 2010/11 survey (0.7% drug misuse declared 2010/11).
Source of drugs last time drugs were taken, 2011/12 CSEW
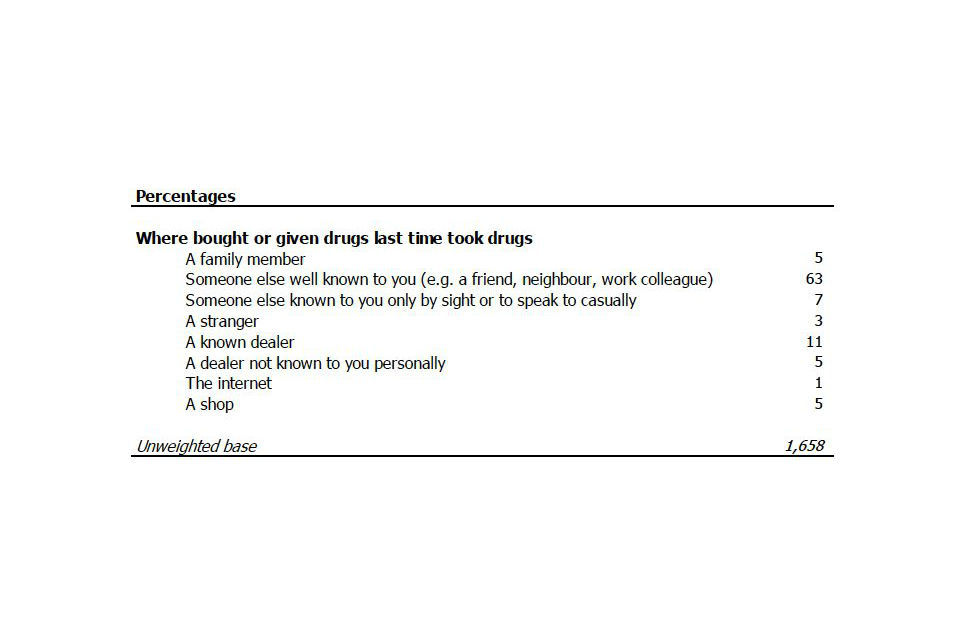
Source of drugs last time drugs were taken, 2011/12 Crime Survey for England and Wales
Chart notes
Source: Home Office, Accessibility of drugs tables: Table A.02
7.6 Ease of obtaining illegal drugs
Around 4 in five adults (78%) who had taken any illicit drug in the last year thought it was very or fairly easy for them to personally get illegal drugs when they wanted them: around a third (34%) thought it was very easy and 44 % thought it fairly easy.
Adults who had not taken any illicit drug in the last year perceived a slightly lower level of ease of obtaining illegal drugs if they wanted them (75% perceived it to be very or fairly easy to obtain drugs compared with 78% of those that had taken drugs in the last year). This was because they were less likely to perceive it to be very easy to get drugs if they wanted to (29% compared with 34% for those that had taken drugs in the last year).
15% of adults who had taken any illicit drug in the last year thought it was fairly difficult and 6 % thought it was very difficult to personally get illegal drugs. Only 1% of respondents thought that it was impossible to do so.
Adults who had obtained drugs the last time they were taken (whether bought or given) from a known dealer were most likely to think that it would be very or fairly easy for them to personally get illegal drugs when they wanted them (89%), higher, for example, than the 77 % of adults who had obtained drugs from someone else well known to them (eg a friend, neighbour, work colleague).
7.7 Data quality and interpreting the figures
The CSEW was formerly the British Crime Survey; the name has been changed to better reflect the survey’s geographical coverage.
The CSEW provides estimates of illicit drug use among adults aged 16 to 59 within the general household population of England and Wales. As such, the CSEW provides an effective measure of the more commonly used drugs for which the majority of users are contained within this population. Figures presented from the CSEW are only for adults aged between 16 and 59 as this is the age range of the self-completion module of the CSEW where necessarily these sensitive questions on illicit drug use are asked.
In the 2010/11 and 2011/12 CSEW, adults who had used any illicit drug in the last year were then asked more detailed questions about the location and source of obtaining drugs the last time they had taken drugs. New questions were added in 2011/12 to ask drug-taking adults how easy they found it to obtain illegal drugs and for non-drug-taking adults, how easy they thought it would be.
Only increases or decreases that are statistically significant at the 5% level (and are therefore likely to be real) are described as changes within the text; in the tables these changes are identified by asterisks (see the user guide for more information).
7.8 Other data sources
Figures from 2010/11 on the location and source of drugs when last taken were published in drug misuse declared: findings from the 2010/11 British Crime Survey (England and Wales).
8. Simultaneous polydrug and polysubstance use among adults aged 16 to 59
8.1 Introduction
This chapter examines the concept of simultaneous polydrug and polysubstance use among adults aged 16 to 59 as measured by the 2010/11 and 2011/12 CSEW (CSEW, previously known as the British Crime Survey). As numbers of polydrug and polysubstance users are small, 2 years of survey data have been combined for this analysis.
Polydrug use is considered to be the use of more than one type of drug being taken either at the same time (simultaneous use) or more than one type of drug being taken within the same period of time, for example, in the last year (concurrent use). The corresponding measure of polysubstance use includes the use of alcohol alongside drugs and is classified in the same way.
Prior to the 2010/11 survey, it was not possible to examine simultaneous polydrug use as appropriate questions were not included in the survey. Previous publications therefore have only covered analysis of concurrent polydrug and polysubstance use. Growing interest in this area has resulted in the addition of a question to explore this phenomenon (see ‘Data Quality and Interpreting the Figures’ below).
Polysubstance use, and particularly simultaneous polysubstance use, is of particular interest due to potential interactions between substances, leading to an increased risk of negative health and social outcomes.
The user guide provides further details relating to illicit drug use measures.
8.2 Key facts
In the 2010/11 and 2011/12 surveys, 7% of respondents who used drugs in the last year said that the last time they used drugs, they used more than one drug at the same time. 6ty 1% of respondents who used drugs in the last year used alcohol at the same time the last time they used drugs.
Almost all (95%) cases of simultaneous polydrug use involved the use of cannabis (73%), powder cocaine (49%), ecstasy (37%) and/or amphetamines (19%).
The highest rates of simultaneous polydrug use were found among those who had used methadone (58%), ecstasy (49%), ketamine (48%) and amphetamines (43%) the last time they had used drugs. The lowest rate of simultaneous polydrug use was found among those who had used cannabis the last time they had used drugs (7%).
8.3 Data tables
Estimates of polydrug and polysubstance use among adults from the 2011/12 CSEW can be found in the simultaneous polydrug and polysubstance use tables.
8.4 Extent of simultaneous polydrug use
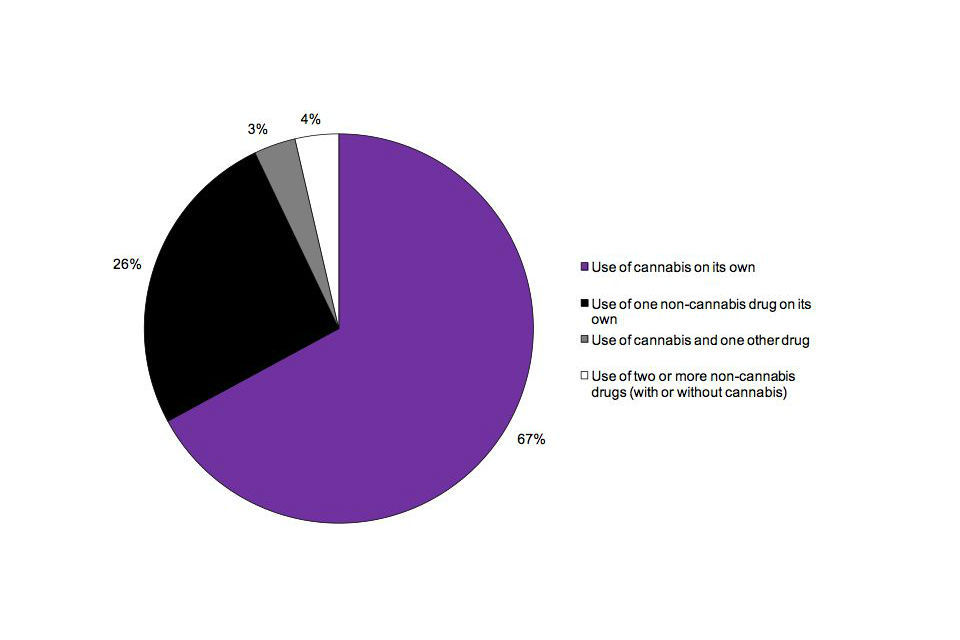
According to the 2010/11 and 2011/12 CSEW, 7 % of respondents who said they had used drugs in the last year used 2 or more drugs at the same time the last time they took drugs. This was made up of 3 % who used cannabis and one other drug and 4 % who used 2 or more non-cannabis drugs (although cannabis may also have been used).
In addition to this, 67 % of the most recent incidents of drug use in the last year consisted of the use of cannabis alone and 26 % the use of a single non-cannabis drug.
Composition of drug use the last time drugs were used among adults aged 16 to 59, 2010/11 and 2011/12 CSEW
The chart shows the proportion of the most recent cases of drug use that were the use of cannabis on its own (67%), the use of one non-cannabis drug on its own (26%), the use of cannabis and one other drug (3%) and the use of 2 or more non-cannabis drugs, with or without cannabis (4%). The data are sourced from Table P.01 and are taken from the 2010/11 and 2011/12 CSEW.
Composition of drug use the last time drugs were used among adults aged 16 to 59, 2010/11 and 2011/12 Crime Survey for England and Wales
Chart notes
Source: Home Office, simultaneous polydrug and polysubstance use tables: Table P.01.
8.5 Composition of simultaneous polydrug use
Cannabis was the most prevalent drug in cases of simultaneous polydrug use, being used in 73 % of the most recent incidents. This reflects its high levels of overall use among those who had taken drugs in the last year. This was followed by powder cocaine (49%), ecstasy (37%) and amphetamines (19%). At least one of these 4 drugs was used in 95 % of all cases of polydrug use.
Patterns of polydrug use for these 4 most prevalent drugs tended to reflect overall prevalence rates, with little variation between them in their frequency of use with specific other drugs.
-
Where cannabis was used simultaneously with other drugs, it was most often used with powder cocaine (42% of cases where cannabis was used simultaneously with another drug), followed by ecstasy (33%) or amphetamines (18%).
-
Where powder cocaine was used simultaneously with other drugs, it was most often used with cannabis (62%), ecstasy (32%) or amphetamines (20%).
-
Where ecstasy was used simultaneously with other drugs, it was most often used with cannabis (64%), powder cocaine (44%) or amphetamines (18%).
-
Where amphetamines were used in combination with other drugs, they were most often used with cannabis (66%), powder cocaine (52%) or ecstasy (34%).
There were only a small number of instances where patterns of use with other drugs varied between these 4 drugs:
-
Cannabis was more likely than ecstasy to have been used with tranquillisers (tranquillisers were used in 8% of cases of simultaneous polydrug use involving cannabis, compared with 2% of cases involving ecstasy).
-
Cannabis was more likely than ecstasy to have been used with heroin (heroin was used in 7% of polydrug cases involving cannabis, compared with 1% of cases involving ecstasy).
-
Although not statistically significant due to small numbers of respondents, survey results showed that mephedrone was only used in a small proportion of cases of ecstasy use (7%), compared with other drugs, particularly amphetamines (mephedrone was used in 17% of cases of amphetamine use).
Overall, the most common pairing of drugs used together was cannabis and powder cocaine, with these 2 drugs being used together in 31 % of all cases of simultaneous polydrug use.
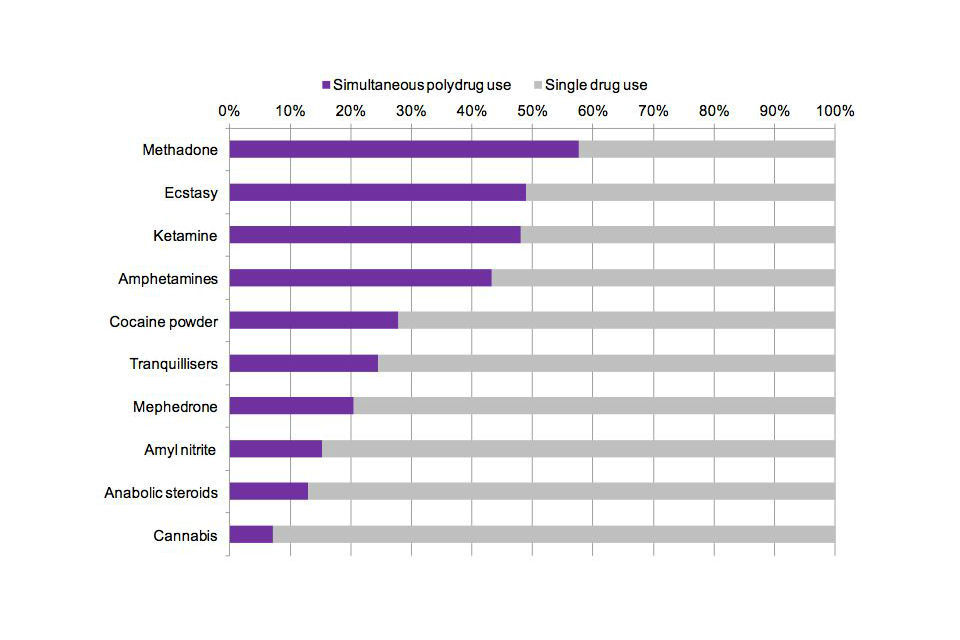
Although cannabis use features heavily in cases of simultaneous polydrug use, this is largely due to its high prevalence overall in cases of drug use. In fact, cannabis was the least likely to be used simultaneously with another drug (only 7% of cases where cannabis was used). Powder cocaine was more likely to be used with another drug, although still had a relatively low level of simultaneous polydrug use (28%). Amphetamines (43%), ketamine (48%), ecstasy (49%) and methadone (58%) were the drugs most likely to be used simultaneously with other drugs.
Composition of drug use the last time drugs were used among adults aged 16 to 59, by drug, 2010/11 and 2011/12 CSEW
The chart shows the proportion of the most recent cases of drug use that were simultaneous polydrug use and the proportion that were single drug use, for each drug. The data are sourced from Table P.04 and are taken from the 2010/11 and 2011/12 CSEW.
Composition of drug use the last time drugs were used among adults aged 16 to 59, by drug, 2010/11 and 2011/12 Crime Survey for England and Wales
Chart notes
Source: Home Office, simultaneous polydrug and polysubstance use tables: Table P.04.
8.6 Simultaneous polydrug use involving two or more non-cannabis drugs
Cluster analysis was carried out on adults who took 2 or more non-cannabis drugs at the same time the last time they took drugs, in order to identify other patterns of drug use. This analysis showed that there were a diverse range of combinations of drugs used in cases of simultaneous polydrug use, most of which were dominated by use of the 4 most prevalent drugs: cannabis, powder cocaine, ecstasy and amphetamines. The only strong alternative grouping that was identified was those using a combination of heroin, methadone, tranquillisers and crack cocaine. However, this group was too small (less than 20 respondents) to carry out more detailed analysis.
8.7 Simultaneous polysubstance use
Simultaneous polysubstance use refers to the use of one or more drugs at the same time as drinking alcohol. Overall, 61 % of the most recent incidents of drug use in the last year also involved drinking alcohol at the same time. Ecstasy and powder cocaine were used with alcohol on almost all the occasions they were used (95% and 91% respectively). Correspondingly, ecstasy was the drug most likely to be used simultaneously with another substance (another drug and/or alcohol), being used with another substance almost every time it was used (98%). Powder cocaine had the next highest rate of polysubstance use (93%).
Anabolic steroids had the lowest level of simultaneous use with alcohol, being used with alcohol on 24 % of occasions when they were used. They are also the drug least likely to be used with any other substance (30%), followed by tranquillisers (50%) and cannabis (57%).
8.8 Simultaneous polydrug users
There were few differences between single and polydrug users in terms of demographic characteristics. The main differences were in behavioural characteristics; particularly those related to how drugs were obtained the last time they were used.
-
Polydrug users were more likely to have obtained drugs from a dealer last time they used drugs (22% compared with 16% of single drug users).
-
Polydrug users were more likely to have obtained drugs at a pub, club, bar, party or rave the last time they used drugs (36% compared with 20% of single drug users).
-
Polydrug users were more likely to have gone to a nightclub in the past month (51% compared with 41% of single drug users).
Many of these differences between single and polydrug users are likely to reflect the mixture of drugs being taken. Cannabis use makes up by far the largest proportion of single drug use (72%). Cannabis also makes up a large proportion of polydrug use (73%); however, powder cocaine (49%), ecstasy (37%) and amphetamines (19%) are far more prevalent in cases of simultaneous polydrug use than in cases of single drug use (10%, 3% and 2% respectively).
8.9 Data quality and interpreting the figures
The CSEW was previously known as the British Crime Survey; the name has been changed to better reflect the survey’s geographical coverage.
The CSEW provides estimates of illicit drug use among adults aged 16 to 59 within the general household population of England and Wales. As such, the CSEW provides an effective measure of the more commonly used drugs for which the majority of users are contained within this population. As a household survey, the CSEW does not cover groups such as the homeless, or those living in institutions such as prisons, who have potentially high rates of drug use and problematic drug users who are unable to take part in an interview.
Figures presented from the CSEW are only for adults aged between 16 and 59 as this is the age range of the self-completion module of the CSEW where necessarily these sensitive questions on illicit drug use are asked.
Adults who said they had taken any of the drugs below in the last 12 months were asked the following question in the 2010/11 and 2011/12 CSEW:
Thinking only about the LAST TIME you took drugs, which of the drugs below did you take on that occasion? If you took more than one different type of drug at the same time, please mention all the drugs you took.
-
Amphetamines
-
Methamphetamine
-
Cannabis/skunk
-
Cocaine powder
-
Crack cocaine
-
Ecstasy
-
Heroin
-
LSD/Acid
-
Magic mushrooms
-
Methadone/physeptone (not prescribed by a doctor)
-
Tranquillisers (not prescribed by a doctor)
-
Amyl nitrite
-
Anabolic steroids
-
Ketamine
-
Liquid ‘E’/‘G’/GBL/GHB
-
Legal ‘E’/BZP
-
Spice (or any other synthetic cannabinoids)
-
Mephedrone
Respondents were only given the option of those drugs they had previously said they had taken in the last 12 months.
Only differences that are statistically significant at the 5% level (and are therefore likely to be real) are described as differences within the text (see the user guide for more information).
8.10 Other data sources
Illicit drug use figures for 16 to 59 year olds are available online in the extent and trends in illicit drug use among adults aged 16 to 59 section.
Illicit drug use figures for 16 to 24 year olds are available online in the extent and trends in illicit drug use among young people aged 16 to 24 section.
Discussion of the use of mephedrone and other new measures of illicit drug use among 16 to 59 year olds is available online in the new CSEW measures of drug use section.
The extent and trends in illicit drug use by personal, household and area characteristics and lifestyle factors are available online in the illicit drug use by personal, household and area characteristics and lifestyle factors section.
Figures on concurrent polydrug use from other survey years and further discussion of polydrug use are available online in drug misuse declared: findings from the 2009/10 British Crime Survey England and Wales and drug misuse declared: findings from the 2008/09 British Crime Survey England and Wales.