Dental contract reform: a report on learnings from the dental contract prototype test between April 2016 and March 2019
Published 26 January 2023
Applies to England

© Crown copyright 2023
This publication is licensed under the terms of the Open Government Licence v3.0 except where otherwise stated. To view this licence, visit nationalarchives.gov.uk/doc/open-government-licence/version/3 or write to the Information Policy Team, The National Archives, Kew, London TW9 4DU, or email: psi@nationalarchives.gov.uk.
Where we have identified any third party copyright information you will need to obtain permission from the copyright holders concerned.
This publication is available at https://www.gov.uk/government/publications/dental-contract-reform-evaluating-the-results-of-the-prototype-scheme/dental-contract-reform-a-report-on-learnings-from-the-dental-contract-prototype-test-between-april-2016-and-march-2019
Executive summary
The purpose of this report is to summarise the learning from the dental contract reform (DCR) programme.
The objective of the DCR programme was to test a potential contract arrangement that would maintain or improve access, quality and appropriateness of care and improve oral health, within the current cost envelope, which was also financially sustainable for dental practices, patients, and commissioners.
This report contains an evaluation of the first 3 years of operation of the prototype contract, which ran from the financial year 2016 to 2017, until the financial year 2021 to 2022, against the objectives identified by the programme’s evaluation reference group (ERG) and national steering group (NSG) and building on the findings from previous reports on the programme (Dental contract reform: evaluation of the first year of prototyping 2016 to 2017).
Background
The DCR programme was established in 2011 as the then government’s response to the publication of NHS Dental services in England – an independent review led by Professor Jimmy Steele, published in 2009.
The DCR programme began with a piloting phase that ran from April 2011 until March 2016. This was followed by a prototype phase that began in April 2016. Prior to this in January 2015 the government published Dental contract reform: prototypes, which set out the learning from the pilots and the proposed prototype arrangements.
The prototypes were based on a blended remuneration system where a practice’s contract value for mandatory services was divided between a capitation element, for which the practice was expected to maintain a minimum number of capitated patients on their list, and an activity element for which the practice was expected to deliver a minimum level of activity. This change to remuneration was aimed at rebalancing the focus of dental care towards improving oral health via prevention, rather than the delivery of restorative care. This was a key principle of the independent review led by Professor Jimmy Steele in 2009.
The clinical aspects of the DCR Programme focused on delivery of an evidence-based clinical pathway, commencing with an oral health risk assessment. The outcome of this then guided delivery of evidence-based prevention and restorative interventions where appropriate, and the setting of risk-based timings for subsequent oral health reviews (OHRs).
The practices in the programme were recruited in 4 waves. Wave 1 (2011, 70 practices) and Wave 2 (2013, 24 practices) practices took part in the piloting process, with some transferring across to be prototype practices. Twenty-one Wave 3 practices joined from the current 2006 general dental services (GDS) contract in April 2016, when prototypes started. Wave 4 practices joined the prototype model from October 2018 (36 in total) and did not have sufficient data by March 2019 to be included in this evaluation.
Results in this report relate to prototype practices in Wave 3 only as these most closely resemble what may happen if the prototype model was implemented in a wider group of practices. Comparisons are also made against providers of the standard GDS contract, referred to as non-prototype contracts.
Summary of findings
Access and availability
The data on access after 3 years of prototyping show that for prototype practices, there was a reduction in patients cared for to 91% of the pre-prototype baselines using a measure of 24-month unique patient access. In contrast, comparable non-prototype contracts showed an increase in the number of unique patients seen over a 24-month period over the same timeframe to 103% of financial year 2014 to 2015 figures.
In prototype practices, access reduced for both fee-paying and charge-exempt adults; in the non-prototype contracts, access increased for fee-paying adults and reduced for charge-exempt adults.
The average waiting time for the third next available appointment for an oral health assessment (OHA) or OHR, a measure of availability, showed neither a significant increase nor decrease over the 3-year period in prototype practices.
Patient experience
The NHS Business Services Authority (NHSBSA) patient questionnaire was used to evaluate the experiences of patients. Around 3,200 responses were returned from patients at prototype practices in financial year 2016 to 2017, and around 4,100 responses in the following financial year, with a response rate of 25% to 28%. It is therefore probable that the overall view of respondents may not generalise the wider population of patients. Patient satisfaction with their NHS dental treatment was generally high. In prototype practices 97% of patients report being ‘quite’ or ‘very’ satisfied with the NHS treatment they received compared with 96% in non-prototype contracts when the survey was carried out in financial years 2016 to 2017 and 2017 to 2018.
There was lower satisfaction with time taken to get an appointment among patients at prototype practices compared to patients from non-prototype contracts.
Delivery of dental treatment
The number of courses of treatment in all treatment bands at prototype practices reduced from the baseline year to 46% of urgent, 82% of band 1, 64% of band 2 and 71% of band 3 courses of treatment. During the same period, non-prototype contracts saw an increase in band 1 courses of treatment to 108% of financial year 2014 to 2015 levels, and a decrease in urgent (to 98%), band 2 (to 94%) and band 3 (to 90%).
We developed a scale of relative estimated time per tooth or treatment item, and this, multiplied by the numbers of teeth treated or items delivered was used as a measure for comparison.
Looking at individual courses of treatment, by financial year 2018 to 2019, prototypes increased the estimated time per course of treatment by 4% while in non-prototype contracts it decreased by 6%. This divergence was statistically significant.
However, when looking at the sum of all courses of treatment, the prototype practices significantly reduced their total time for treatments delivered by 23% from baseline, compared with a decrease of 4% in non-prototype contracts. This was likely due to prototype practices delivering fewer courses of treatment overall by financial year 2018 to 2019.
The clinical pathway
Prototype practices showed closer adherence to planned NICE recall guidelines for children and adults (with longer planned recall intervals), compared with those working under the non-prototype contract model. Both children and adults returned later for a subsequent course of treatment (a longer interval between treatments) in prototype practices, compared with non-prototype contracts.
However, approximately one-quarter of both adults and children did not return to their prototype practice for a subsequent review of their oral health. The proportion of those not returning was higher for patients who were initially assessed as having a red (high) in oral health risk status.
The Delivering Better Oral Health Toolkit outlines best practice standards for the prevention of oral diseases. For prototype practices, there was a significant decrease in the proportion of courses of treatment indicating best practice prevention was provided between financial year 2016 to 2017 and 2018 to 2019 for both children and adults. This contrasts with a significant increase over the same period for both adults and children at non-prototype contracts.
Preventative care as measured by fluoride varnish application in financial year 2018 to 2019 shows low though significantly higher rates for adults at prototype practices than non-prototype contracts but significantly lower rates for children. With the exception of children in financial year 2016 to 2017 (where rates of fluoride varnish were significantly higher in prototype practices), these differences were demonstrated consistently over the 3 years examined.
Assessment of oral health and risk
When looking at a sample of patients from prototype practices followed over time, the proportions of patients within each oral health risk category remain fairly stable for returning patients. This was apparent for both adults and children. The measure used examines patient risk rather than direct oral health, with some risk factors being non-modifiable.
Contract delivery and remuneration
For both prototype and non-prototype contract models, there is financial recovery at year-end reconciliation where performance is less than 96%. There were similar proportions of prototype practices being subject to financial recovery for under achievement to those observed for non-prototype contracts. The proportion of prototype practices achieving their contracted targets (96% on their combined overall performance of capitation and activity targets) did not change significantly between financial year 2016 to 2017 and 2018 to 2019.
Introduction
Background
This is the fourth report produced as part of the DCR Programme and follows the financial year 2016 to 2017 first-year findings Evaluation report 2016 to 2017 published in May 2018.
The DCR programme was established in 2011 as the then government’s response to the publication of NHS Dental Services in England – An independent review led by Professor Jimmy Steele published in 2009, to test potential contract models focused on oral health and preventative care.
Drawing on the Delivering Better Oral Health toolkit, care began with a comprehensive oral assessment and identification of the patient’s risks for oral disease. The clinical care pathway was aligned to the level of oral health risk and practices also worked with patients on a personalised prevention plan.
One of the aims of the DCR Programme was to facilitate and promote adherence to clinical preventative protocols. It was expected that if clinical prevention was followed, then there would be improvement in clinical outcomes (caries or periodontal disease) over time, and a shifting of more patients at a population level from higher to lower risk categories (noting that some risk factors are non-modifiable).
Programme history – timeline of DCR – 10 years
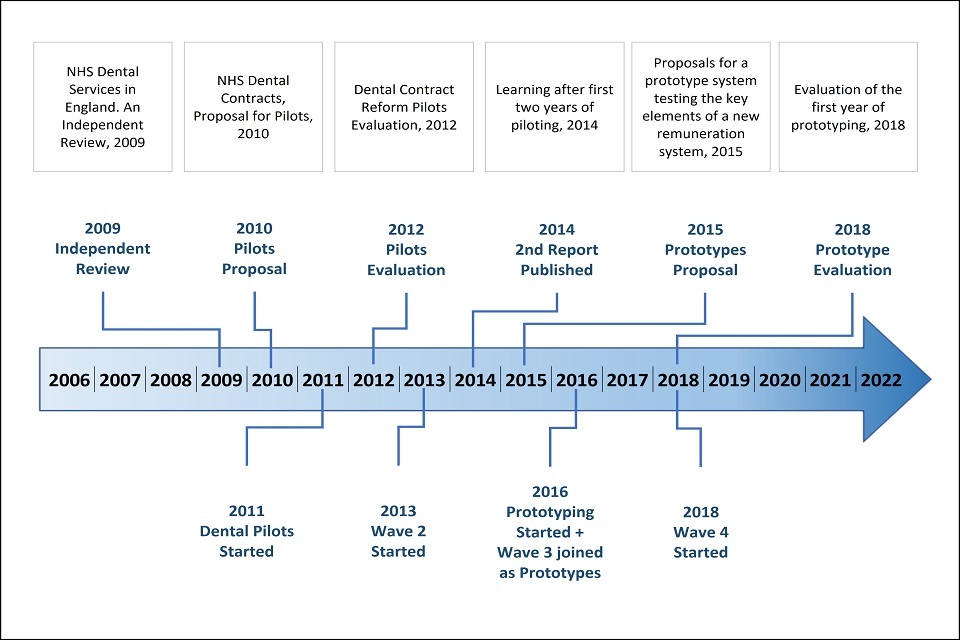
Figure 1 presents a timeline of events relating to the DCR programme. The DCR programme began with a piloting phase that ran from April 2011 until March 2016 and is reviewed in the report NHS Dental Contract Pilots, 2014. During this phase, the NHS dental contract pilots explored how to shift the focus of NHS dentistry towards prevention and oral health rather than focussing primarily on treatment and repair. To achieve this a new clinical pathway based on managing risk, creating a healthy oral environment through providing preventative care and encouraging healthy behaviours was developed along with a new remuneration model. The new model was centred around the number of patients cared for by the practice-based contract and a Dental Quality and Outcomes Framework (DQOF) adjustment that could be made based on performance. However, in practice, DQOF results were never used for payment purposes.
The pilot phase commenced with 70 volunteer practices in 2011. These practices were divided into 3 types of capitation-based remuneration system:
- Type 1 – capitation model (46 practices)
- Type 2 – weighted capitation and quality model (12 practices)
- Type 3 – weighted capitation and quality model with a separate budget for higher cost treatments model (12 practices)
Wave 2 of the programme began in 2013 with 24 further dental practices joining the pilot. The aim of the second wave was to test a refined clinical pathway and balance numbers in the 3 different remuneration options.
Figure 1: dental contract reform timeline over 10 years
The prototype phase
The DCR pilot was followed by a prototype phase that began in April 2016. In the prototype phase, the aim of the DCR programme was to ensure that the prototype model was able to maintain or improve access, quality and appropriateness of care and improve oral health, within the current cost envelope, in a way that was financially sustainable for dental practices, patients and commissioners.
A total of 79 practices initially entered the prototype phase: 41 Wave 1 practices and 17 Wave 2 practices were invited to continue in the programme and transfer to being prototype practices, and an additional 21 volunteer practices were selected to join as Wave 3 prototypes.
The prototype clinical pathway
There has been a shift in modern dentistry towards a preventative model of care delivered in line with a clinical care pathway, with a focus on disease prevention as well as treatment. The DCR clinical pathway was developed and refined during the pilot phase. Changes included adding branches for Urgent risk assessment, prevention and stabilisation and standard risk assessment by OHA. An overview of the clinical care pathway is presented in figure 2. The colours in the third box from the left of this figure illustrate colour assigned in the risk assessment and read from the top to the bottom as red, amber and green.
Figure 2: an overview of the care pathway for patients engaging in continuing care

The NHS dental contract pilots – Care Pathway Review in 2012 identified a number of improvements to both simplify and increase the efficiency of the pathway. This included recognition that while offering and encouraging patients to develop preventative behaviours, it was considered important to accept that some patients may not want to take up this offer and that this view should be accommodated not only with the urgent risk assessment branch but also within the standard OHA pathway by incorporating an additional branch (figure 3), recognising that at any time patients may change their position.
Figure 3: flow of the clinical care pathway used in prototype practices

The pathway started with an OHA assessment of a patients’ risk for oral disease. Patients were assigned a red, amber or green (RAG) rating based on social and medical history factors, along with their clinical examination findings on 4 domains:
- dental decay (caries)
- gum disease (periodontitis)
- tooth surface loss
- oral soft tissue disease (predominantly oral cancer)
The assessment’s purpose was to support the use of the Delivering Better Oral Health prevention guidelines, and the NICE recall guidelines, both of which are risk-based. An OHR followed the initial OHA, at subsequent visits.
The OHA or OHR, delivered as part of a band 1, 2 or 3 course of treatment, aimed to support patients in understanding their own oral health and what they could do to improve it. If required, a self-care plan was produced to provide an informed basis for discussion about the choice for future care and progression towards desired outcomes.
While the OHA or OHR and prevention approach were well-specified in the clinical pathway, treatment decisions were made by individual clinicians after discussion of treatment options with their patients. There were a wide range of clinical conditions diagnosed and corresponding clinical guidelines should then have been used to inform best-practice treatment. Planned treatment followed OHAs or OHRs and formed part of the course of treatment.
Some patients, particularly those in the red or amber risk group may have benefited from further prevention or advice delivered as interim care (IC, submitted as band 1a) between the OHA and OHR course of treatment. IC visits could be delivered by a dental care professional (hygienist, therapist, extended duty dental nurse or oral health educator) or dentist.
Prototype remuneration
While all participating practices were delivering the same clinical pathway and philosophy, there were 2 different types (blends) of payment structure being explored. Both types combined payment for the number of patients on the practice list (capitation) and payment for certain treatments delivered (activity), but the difference was in the blend of these. In both blends capitation formed the majority of the value of the contract: in blend A, around 60% and in blend B, around 83%. The remaining proportion of the contract was dedicated to delivering activity, as measured by modified units of dental activity (UDA).
The main differences between the 2 blended remuneration systems trialled in the prototype phase are as follows (also see table 1):
-
blend A – the capitation element was approximately 60% of contract value and covered the OHA, OHR and preventative care (current band 1 care). The activity element covered routine and more complex treatments (current band 2 and band 3 care). The activity allocation for band 2 was 2 UDAs and for band 3 it was 11 UDAs
-
blend B – the capitation element of the blend was approximately 83% of contract value and covered the OHA, OHR, preventative care, and routine treatment (current band 1 and band 2 care). The activity element payments covered the more complex treatment (current band 3 care), the activity allocation for a band 3 was 9 UDAs
Table 1: contribution of capitation and activity to prototype remuneration by blend
| Capitation as % of contract value | Activity allocation | |
|---|---|---|
| Blend A | 60%, includes current band 1 care | band 2 = 2 UDAs band 3 = 11 UDAs |
| Blend B | 83%, includes current band 1 and band 2 care | band 3 = 9 UDA s |
Percentage delivery against both capitation and activity targets at the end of each financial year, were combined to calculate overall prototype performance.
Each practice’s delivery in the baseline year (financial year 2014 to 2015) was used to determine the proportion of contract value associated with capitation and activity, and also their expected capitation and activity levels in the prototype arrangements. A further, proportionate, adjustment was then made to the capitation target, accounting for any historic under- or over-delivery in the 3 years prior to baseline.
From late 2018 onwards, 36 additional practices joined the fourth wave of the prototype phase. As this report presents data between the baseline in 2014 to 2015 and the 3 financial years 2016 to 2017, 2017 to 2018 and 2018 to 2019, wave 4 was not included in this evaluation.
For further details about the remuneration model see section entitled ‘Contract delivery and remuneration’.
Evaluation methodology
Time periods
This evaluation examines delivery and performance in the first 3 years of the prototype, from financial year 2016 to 2017, to financial year 2018 to 2019. Comparisons are made against the baseline year 2014 to 2015, which was 2 years prior to the start of the prototype phase in financial year 2016 to 2017.
Prototype sample
Results in this report relating to prototype practices are for Wave 3 only; those joining at the start of the prototype phase in 2016. Analysis was limited to the outcomes of these practices as they are more representative of what may have happened if the prototype contract was implemented with a wider group of practices. Wave 4 practices were similar, having not been involved in the pilot phase, however they did not have sufficient data by March 2019 to be included in this evaluation. The eligibility criteria for inclusion in the prototype phase is detailed in Appendix 1.
Comparison sample
A control group was not established at the onset of the prototype phase. This means that there was not a pre-defined, comparable group against which to compare outcomes of the programme. Where possible, a ‘comparable’ group of non-prototype contracts was selected to make comparisons against for this evaluation report (approximately 4,000 contracts). For some analyses, only aggregated data were available. In these instances, all non-prototype contracts were included in comparison analyses (approximately 8,000 contracts). Data on some measures were only available for prototype practices, meaning comparisons with non-prototype contracts was not always possible.
Reporting on statistical significance
Where a comparison is described as ‘statistically significant’, this means that the difference has been tested statistically and the difference between the variables being tested is beyond what would be likely to occur just based on random variation. A level of p less than 0.01 is used in the report. This means that there would be less than 1% probability that the difference found between the variables being compared occurred by chance.
Areas of evaluation
The evaluation of the prototype phase has been separated into 6 broad domains:
- access and availability
- the clinical pathway
- treatment provided
- oral health and risk
- patient experience
- contract delivery and remuneration
Full details of the methodology, comparison sample and analytical approach are provided in Appendix 2.
Findings
Access and availability
Maintaining or improving access to primary dental care was a key objective of the DCR programme.
Patient access
In this report, patient access has been measured in 2 ways:
- The number of patients on the practice capitation list defined as the number of patients seen by the practice in the previous 36 months, who had not moved to another practice during that time. This measure was only available for prototype practices.
- The number of unique patients seen by the practice in the past 24 months. This measure means that a comparison with NHS Digital routinely reported data for non-prototype contracts is possible.
An expected number of capitated patients was specified for each practice, based on their patterns of treatment delivered in the baseline year. See Appendix 2 for a description of how this was calculated.
Figure 4 shows the percentage of patients in capitation each year, relative to the number of patients in capitation in the baseline year (2014 to 2015). The vertical line in financial year 2015 to 2016 shows the beginning of the prototype phase. Capitated patient numbers were not available for non-prototype contracts.
Figure 4: change in 36-month patient capitation by year, relative to the baseline year
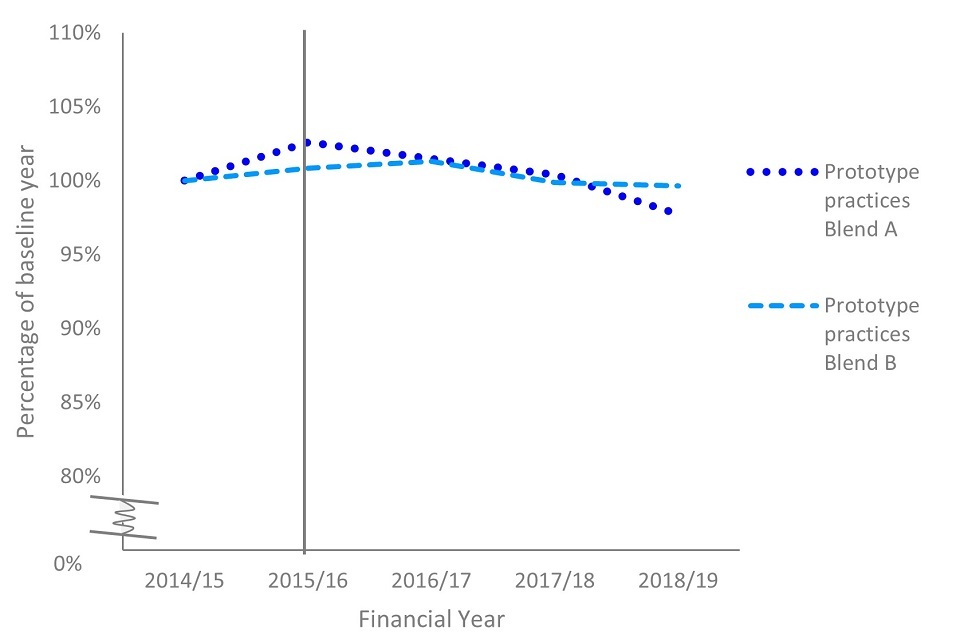
There was a one year gap between the baseline and the point at which these practices started in the prototype in financial year 2015 to 2016, when capitated patient numbers were at 102% of their baseline figure. The proportion of patients in capitation each subsequent year relative to the baseline year was 101% in financial year 2016 to 2017, 100% in 2017 to 2018 and 99% in 2018 to 2019. Relative to the baseline year, prototype practices did not have a statistically significant change in the overall number of patients in capitation.
For comparison of patient access with non-prototype contracts, the 24-month unique patient access measure was used.
Figure 5 shows the percentage of unique patients counted in the 24-month patient access measure each year, relative to the patient access figure in the baseline year (2014 to 2015). The vertical line in financial year 2015 to 2016 shows the beginning of the prototype phase.
Figure 5: change in 24-month unique patient access by year, relative to the baseline year
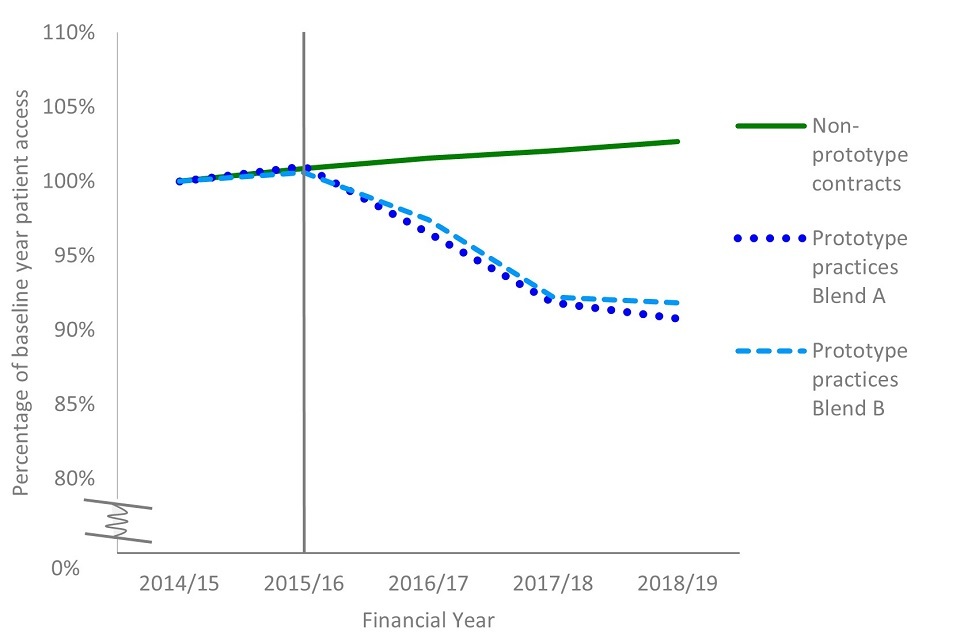
This measure shows a statistically significant reduction in the number of unique patients seen over a 24-month period in financial year 2018 to 2019, compared to the baseline year, for prototype practices. Prototype practices entered the programme in financial year 2015 to 2016 with 101% of their baseline 24-month unique patients and this fell to 91% in financial year 2018 to 2019. The number of unique patients seen reduced significantly in both blends A and B. Conversely, the proportion of 24-month unique patients seen increased relative to the baseline year in non-prototype contracts, from 101% (financial year 2015 to 2016) to 103% in financial year 2018 to 2019. This increase for non-prototype contracts was statistically significant.
Figure 6 shows the change in 24-month patient access for adults at prototype practices and non-prototype contracts, grouped by fee-paying status. This data shows that in relation to the baseline year, the number of charge-paying adult patients increased for non-prototype contracts by 6% and decreased for prototype practices by 4%.
The proportion of patients exempt from patient charges declined in both prototypes and non-prototype contracts. This coincided with national changes to eligibility for exemption from dental fees and enforcement around penalty charges for falsely claiming for exemption. there was not a significant difference between prototypes and non-prototype contracts in the decrease in patients exempt from patient charges.
Figure 6: change in 24-month patient access over time relative to the baseline year, by type of contract and exemption status of adult patients

Appointment availability
Availability defined as the ability of patients to get an appointment within a reasonable period of time, in relation to their clinical need. Appointment availability was measured as part of the monthly practice survey by asking how long the period was until the third available appointment for an OHA or OHR. The third next available appointment is a commonly used indicator of the availability of primary care services, as first or second appointments are sensitive to random effect. It is currently used in the NHS General Practice data collection.
Figure 7 shows practice-level responses for annual average waiting times. The average waiting time for the third next available appointment for an OHA or OHR, showed no significant difference over the 3-year period. Monthly response rates for this question ranged between 48% and 90%. We have analysed and presented the annual average for each of the 16 practices which responded regularly.
Figure 7: annual average waiting time, in days, until third next available appointment for an OHA or OHR for individual practices
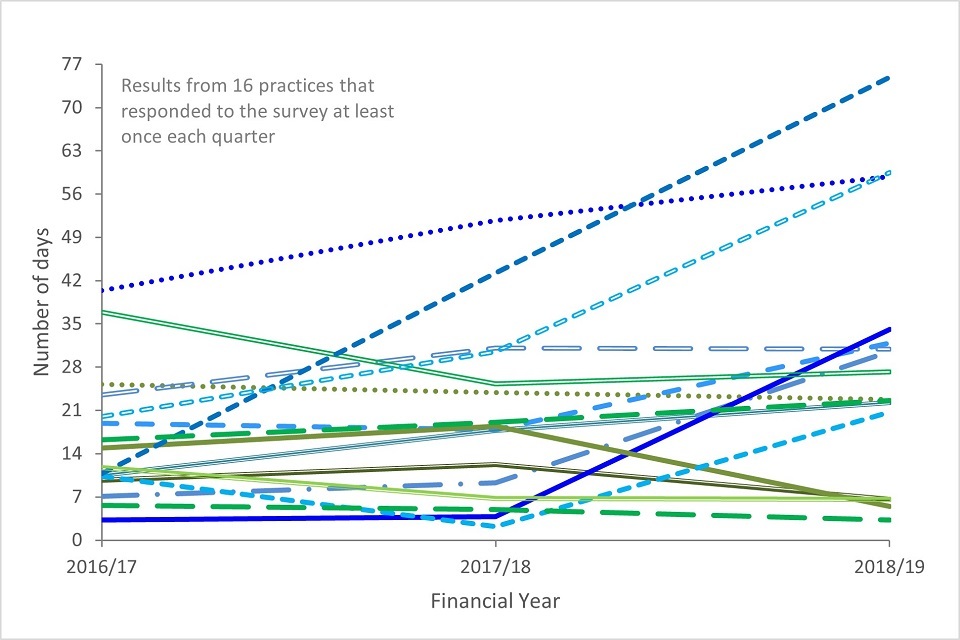
Data on waiting times in non-prototype practices is not available, so no comparisons could be made.
The clinical pathway
This section examines how elements of the clinical pathway have been delivered during the prototype phase, including delivery of OHAs and OHRs, the use of NICE risk-based recall intervals, and the provision of preventative treatments.
Clinical risk assessment
For patients who had a banded course of treatment at a prototype practice, the majority also received an OHA or OHR to assess their clinical risk for oral diseases.
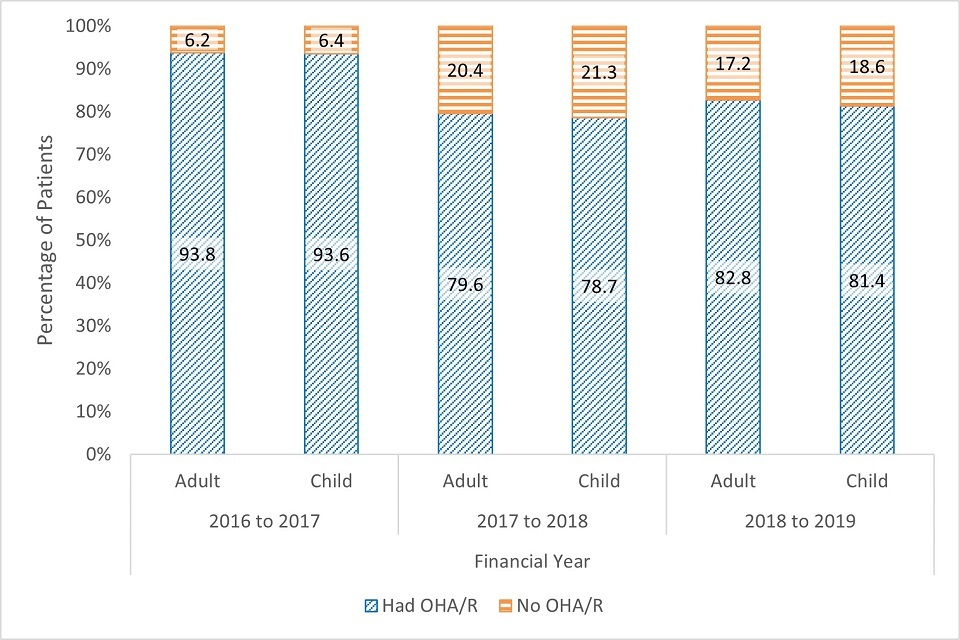
Figure 8 shows the proportions of patients receiving OHAs or OHRs are similar for adults and children within a given year. Between financial years 2016 to 2017 and 2018 to 2019 there was a significant reduction in the proportion of patients receiving OHAs or OHRs, for both adults and children. For patients seen in financial year 2018 to 2019, 83% of adults and 81% of children received an OHA or OHR as part of a band 1, band 2, or band 3 course of treatment. This finding is not explained solely by interim care visits, which are reported as band 1 treatments and do not require an OHA or OHR, as similar rates of OHA or OHR provision were seen across treatment bands.
Figure 8: the percentage of eligible patients receiving an OHA or OHR at prototype practices, by age and year
Assigned recall intervals
Part of the clinical pathway related to planning an appropriate time for a reassessment or review of the patient’s oral health. This interval was determined based on the clinical risk factors of the patient. The clinical pathway had a risk matrix for determining recall periods, which was based on the NICE clinical guideline for dental checks and implemented through the practice software system.
Assigned (or planned) recall intervals and actual return intervals were compared between prototype practices and non-prototype contracts. Assigned recall intervals are presented by overall oral health risk rating for patients in prototype practices to compare against NICE guidelines. This was not available for patients at non-prototype contracts, and treatment band was used as a proxy measure.
Figure 9: assigned recall intervals for adults at prototype practices and non-prototype contracts for treatments starting in financial year 2017 to 2018, by overall risk rating or type of treatment
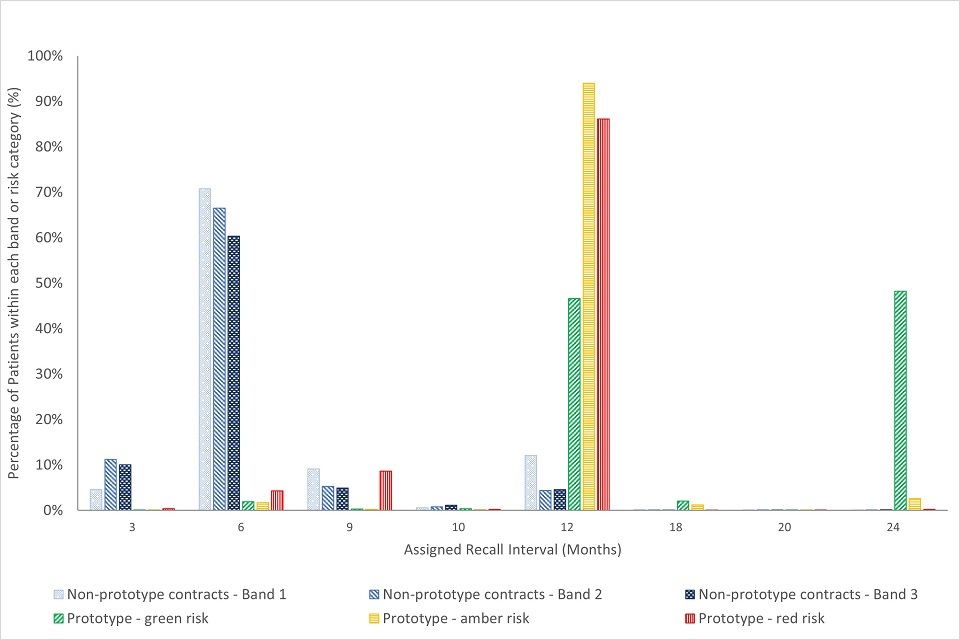
Figure 9 shows that for adults in prototype practices, assigned recall intervals mapped approximately onto NICE guidelines. Twelve-month recall intervals were assigned to 86% of red risk patients, 94% of amber risk patients and 47% of green risk patients. Additionally, 48% of green risk adult patients had a 24-month assigned recall. Note that some patients are offered interim care visits between their OHAs or OHRs. The majority (between 60% and 71% within each treatment band) of adults at non-prototype contracts have a planned recall interval of 6 months, and a minority (4-12% per treatment band) have a recall scheduled for 12 months.
Figure 10: assigned recall intervals for children at prototype practices and non-prototype contracts for treatment starting in financial year 2017 to 2018, by overall risk-rating or type of treatment
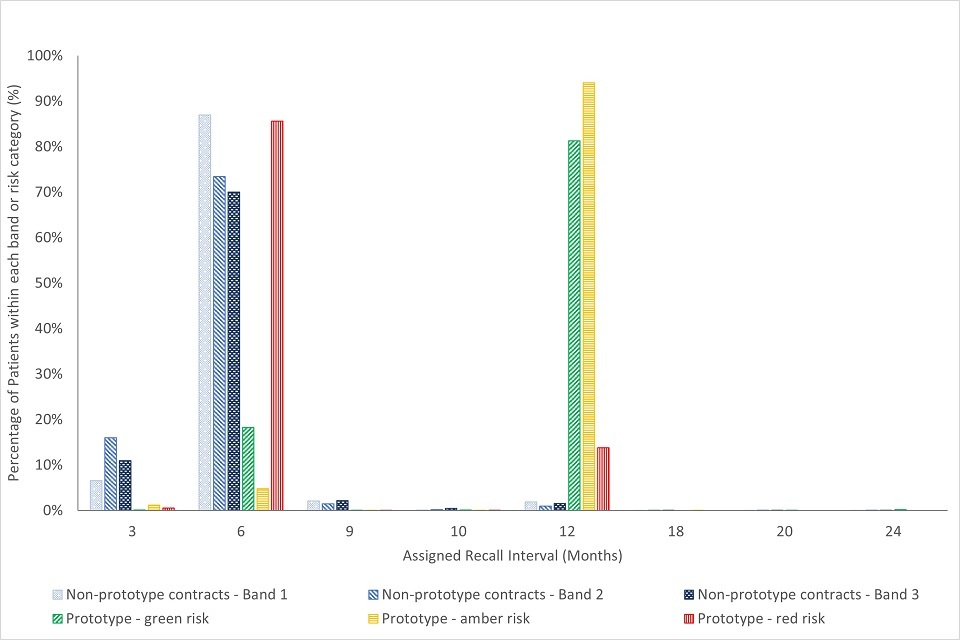
The NICE guidelines for children set a maximum recommended review period of 12 months. Assigned recall times for children at prototype practices show that 86% of red risk patients had a 6-month recall assigned, 94% of amber risk patients had a 12-month recall assigned and that for green risk patients, 81% had a 12-month recall scheduled (see figure 10). When looking at assigned recall intervals for non-prototype contracts, 70 to 87% (depending on the treatment band) of children were assigned a 6-month recall interval.
For prototype practices, assigned recall intervals are generated by the dental software systems based on health and risk information recorded during the OHA or OHR. While it is possible to manually overwrite the automated interval, we have no indication of how often this was done.
Actual return intervals
Actual return intervals were calculated to investigate how actual behaviour compares with planned behaviour, in relation to the duration between 2 courses of treatment.
Figure 11 compares the actual return intervals in months for adults from prototype practices and non-prototype contracts by treatment band. The treatment band relates to the initial (or time 1) course of treatment.
Figure 11: number of months between treatments for adults seen in financial year 2017 to 2018, by treatment and type of contract
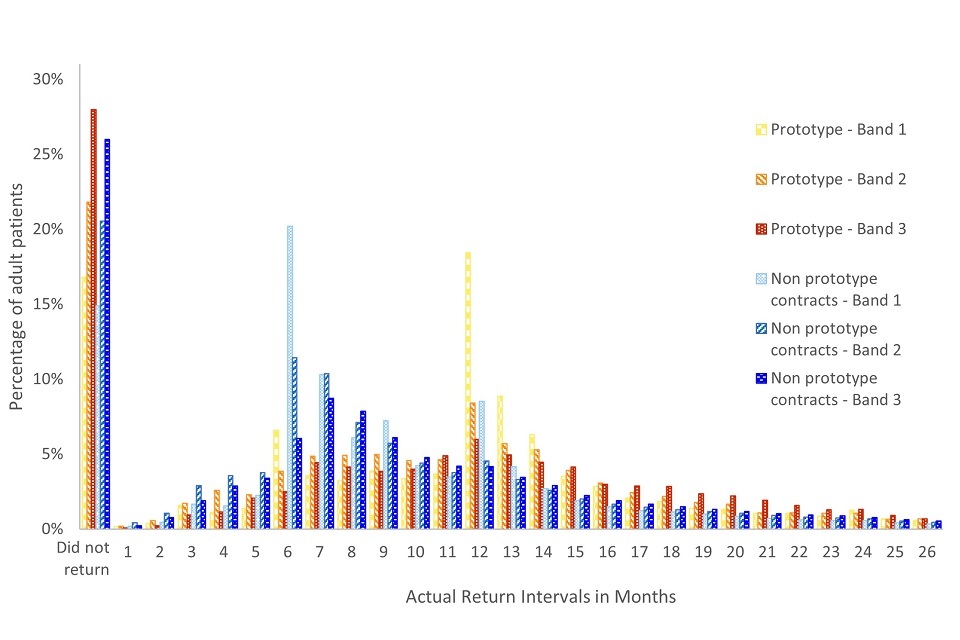
Adult patients returned earlier to non-prototype contracts than they did to prototype practices. Six months after their time 1 treatment, significantly more adults had returned to non-prototype contracts (24%) compared with those returning to prototype practices (11%). By 12 months, again, a significantly higher proportion adults had returned to non-prototype contracts (63%), compared to prototype practices (45%).
The actual return intervals for children are shown in figure 12 and are separated by time 1 treatment band and type of contract.
Figure 12: number of months between assessments or treatments for children seen in financial year 2017 to 2018, by treatment and type of contract
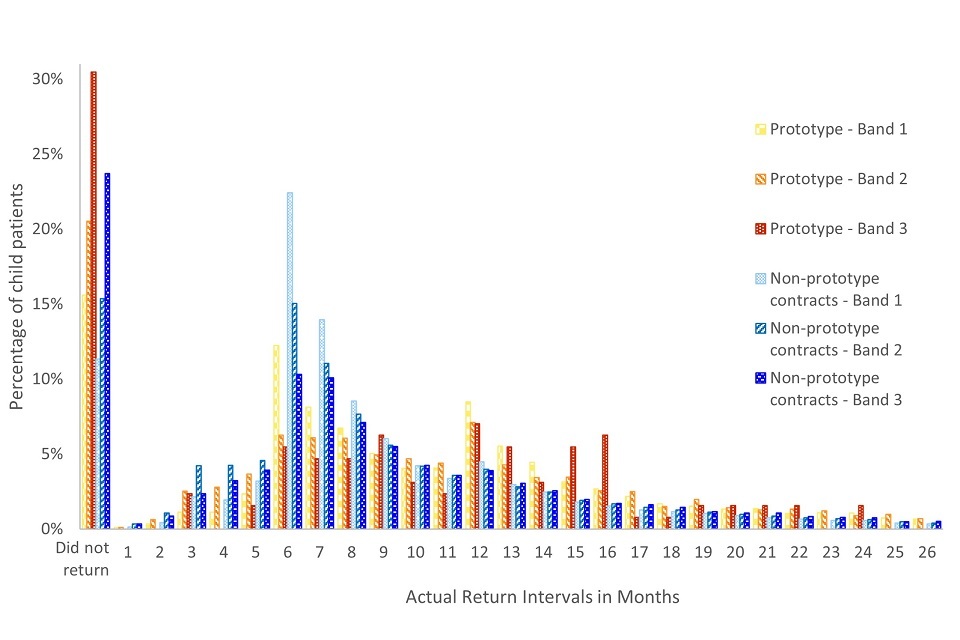
For children (regardless of previous treatment type), significantly fewer had returned to prototype practices after 6 months (17%) and 12 months (53%), compared with non-prototype contracts (30% and 70%, respectively). The maximum recommended recall interval for children is 12 months, though after 15 months a significant difference remained between prototype practices (66% had returned) and non-prototype contracts (77% had returned).
While we saw that patients at prototype practices returned later for follow-up courses of treatment, we also found that patients at these practices were more likely to not return over the 3-year time frame. Tables 2a and 2b summarise data on the percentage of patients that did not return for a subsequent banded course of treatment, using the same sample as seen in figures 11 and 12. Overall, the rate of patients not returning was significantly higher at prototype practices (18%) than non-prototype contracts (16%). The rate of patients not returning also appears to increase the more complex the treatment required.
Table 2a: patients returning for their next treatment, by type of contract, type of treatment, for adult patients
| Did not return (number) | Did not return (%) | Returned (number) | Returned (%) | |
|---|---|---|---|---|
| Prototype practices band 1 | 4,180 | 16.8% | 20,700 | 83.2% |
| Prototype practices band 2 | 2,783 | 21.8% | 9,976 | 78.2% |
| Prototype practices band 3 | 916 | 28.0% | 2,359 | 72.0% |
| Non-prototype practices band 1 | 1,164,759 | 14.9% | 6,650,184 | 85.1% |
| Non-prototype practices band 2 | 822,225 | 20.6% | 3,177,741 | 79.4% |
| Non-prototype practices band 3 | 271,417 | 26.0% | 773,333 | 74.0% |
Table 2b: patients returning for their next treatment, by type of contract, type of treatment, for child patients
| Did not return (number) | Did not return (%) | Returned (number) | Returned (%) | |
|---|---|---|---|---|
| Prototype practices band 1 | 2,208 | 15.6% | 11,958 | 84.4% |
| Prototype practices band 2 | 676 | 20.5% | 2,618 | 79.5% |
| Prototype practices band 3 | 39 | 30.5% | 89 | 69.5% |
| Non-prototype practices band 1 | 477,880 | 11.3% | 3,742,157 | 88.7% |
| Non-prototype practices band 2 | 194,816 | 15.4% | 1,072,999 | 84.6% |
| Non-prototype practices band 3 | 8,737 | 23.7% | 28,138 | 76.3% |
A similar analysis was with carried out just with prototype practices to explore recall intervals by patient oral health risk status.
Figure 13 groups adults at prototype practices by their time 1 overall risk rating to show whether they returned early, on time, or later than their recommended recall interval. Adults with green risk ratings were significantly more likely to return early or on time (plus or minus 3 months – 62%) than adults with red (36%) or amber (54%) risk ratings.
Figure 14 demonstrates a similar pattern of return for children. Those with green risk ratings were significantly more likely to return earlier than their recommended recall interval or on time (50%) than children with red (34%) or amber (44%) risk rating.
Figure 13: timing of actual return for a follow-up OHR for adult patients, grouped by time 1 overall risk rating
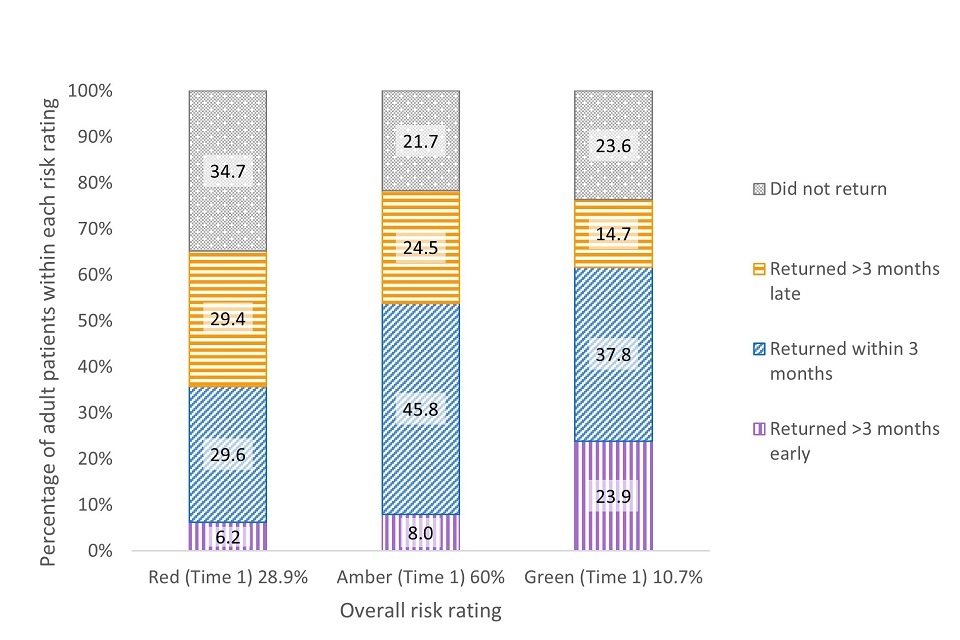
Figure 14: timing of actual return for a follow-up OHR for child patients, grouped by time 1 overall risk rating
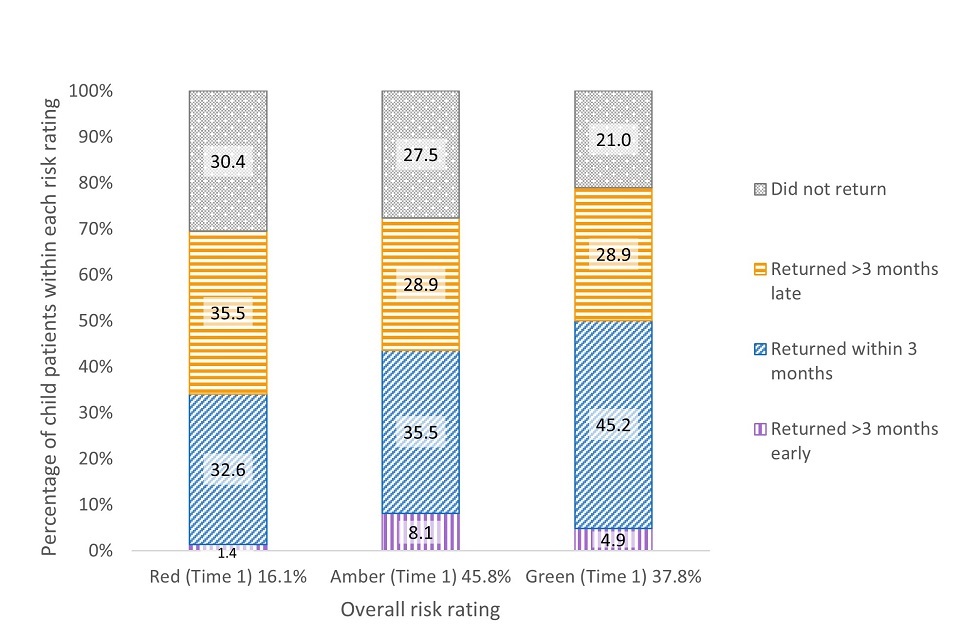
For adult patients at prototype practices with a red risk, 35% did not return to the same practice for an OHR. This was significantly higher than it was for adults with a green (24% did not return) or amber rating (22% did not return). Children with red risk ratings at the initial assessment were also significantly less likely to return to the same practice for a subsequent OHR (30%) in comparison to children with green risk ratings (21%). Thus, for both adults and children, patients with higher risk ratings were less likely to return to the practice for follow-up.
Based on this analysis alone, it is not clear why patients with higher risk were less likely to return. We do not have information on the degree to which patients or practices are driving the timing of return visits (or lack of return).
Prevention
The DBOH toolkit provides evidence-based guidance which recommends the schedule and timing of prevention and care according to patient risk. When submitting a claim for NHS dentistry provided in England (an FP17 form), all performers are asked to indicate whether they provided best practice prevention based on the DBOH toolkit.
Table 3a to 3c: percentage of courses of treatment (FP17s) where best practice prevention in line with Delivering Better Oral Health has been provided, by financial year, age and type of contract
Table 3a: financial year 2016 to 2017
| Type of contract | Adults | Children |
|---|---|---|
| Prototype practices | 59.6% | 62.2% |
| Non-prototype contracts | 56.3% | 58.2% |
Table 3b: financial year 2017 to 2018
| Type of contract | Adults | Children |
|---|---|---|
| Prototype practices | 59.6% | 62.2% |
| Non-prototype contracts | 56.3% | 58.2% |
Table 3c: financial year 2018 to 2019
| Type of contract | Adults | Children |
|---|---|---|
| Prototype practices | 56.2% | 57.1% |
| Non-prototype contracts | 61.0% | 62.8% |
When comparing submitted claims for prototype practices and non-prototype contracts, best practice prevention is recorded for between 56% and 63% of courses of treatment, across contract types, years and age groups (see table 3). For prototype practices, there was a significant decrease in rates of courses of treatment with best practice prevention between financial years 2016 to 2017 and 2018 to 2019 for both children and adults. This contrasts with a significant increase over the same period for both adults and children at non-prototype contracts.
The DBOH toolkit sets out clear evidence and risk-based guidelines for the use of fluoride varnish to prevent dental decay. Presented in table 4 are the rates of fluoride varnish for courses of treatment delivered at prototype practices and non-prototype contracts.
Tables 4a to 4c: percentage of courses of treatment (FP17s) where fluoride varnish has been provided, by financial year, age and type of contract
Table 4a: financial year 2016 to 2017
| Type of contract | Adults | Children |
|---|---|---|
| Prototype practices | 5.5% | 42.2% |
| Non-prototype contracts | 2.6% | 41.4% |
Table 4b: financial year 2017 to 2018
| Type of contract | Adults | Children |
|---|---|---|
| Prototype practices | 4.6% | 46.1% |
| Non-prototype contracts | 2.6% | 48.1% |
Table 4c: financial year 2018 to 2019
| Type of contract | Adults | Children |
|---|---|---|
| Prototype practices | 3.6% | 48.2% |
| Non-prototype contracts | 2.6% | 52.6% |
Preventive care as measured by fluoride varnish applications in financial year 2018 to 2019 shows significantly higher rates for adults at prototype practices than non-prototype contracts and significantly lower rates for children (approximately 48% versus 53% in 2018 to 2019). With the exception of children in financial year 2016 to 2017 (where rates of fluoride varnish were significantly higher in prototype practices), this pattern of results is demonstrated consistently over the 3 years examined.
The lower use of fluoride varnish for children at the prototype practices (compared with non-prototype contracts), was an unexpected finding given the preventative focus of the clinical pathway. This was explored at the prototype engagement events where practices reported that this care was being provided and proposed this may be attributable to issues with the recording software and how fluoride was coded. Further investigation did not support this hypothesis.
Treatment provided
To review possible changes in the types of treatments being delivered each year since the start of the prototype we examined the volume of treatments being delivered each year (separately for band 1, band 2, band 3 and Urgent treatment), relative to the amount of treatment delivered in the baseline year. The proportions were compared between prototype practices and non-prototype contracts between financial years 2014 to 2015 and 2018 to 2019.
Figures 15 to 18 compare the number of courses of treatment delivered by type or band, compared with the number of courses provided in the baseline year prior to entering the prototypes. The vertical green line shows the start of the prototyping period.
Figure 15 shows a fall of urgent courses of treatment delivered over time. In the prototype practices, this fell to 46% of baseline number. This decrease is statistically significant. For blend A practices, this was a drop to around 26% of the baseline year, compared with a drop of 71% for blend B practices. In contrast the number of urgent courses in comparable non-prototype contracts reduced to 98% of the financial year 2014 to 2015 level; however, this difference was not statistically significant.
Figure 15: percentage of urgent courses of treatment over time relative to the baseline year, by type of contract
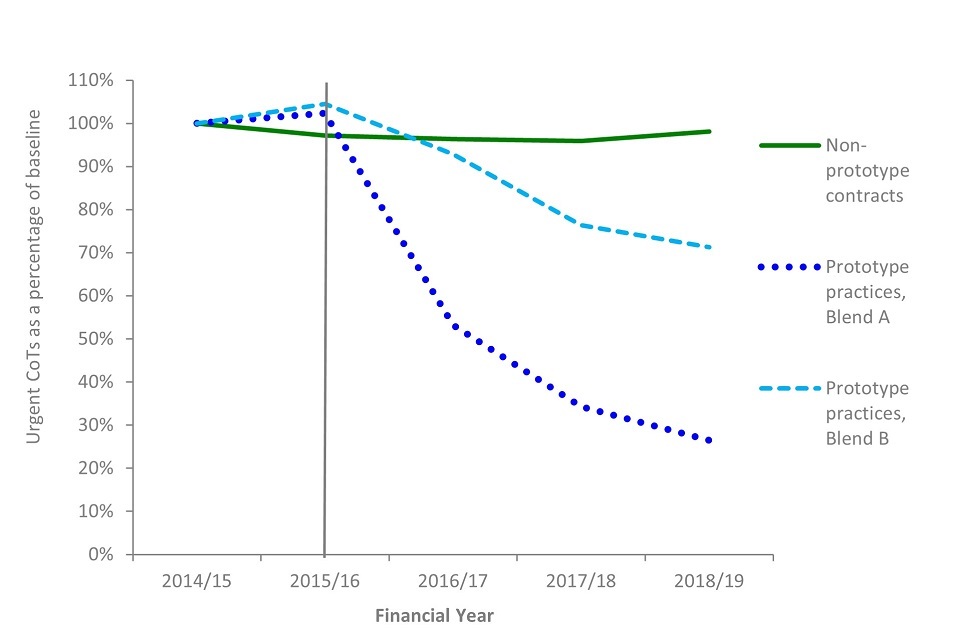
This finding was explored in the engagement events with the prototype practices in November 2020 but no obvious explanation was identified.
Non-urgent care falls into one of 3 treatment bands:
- band 1 includes diagnosis, treatment planning and maintenance
- band 2 includes band 1 plus treatment (for example, fillings and extractions)
- band 3 includes band 1, band 2 and treatment involving the provision of laboratory made appliances (for example, crowns, bridges and dentures)
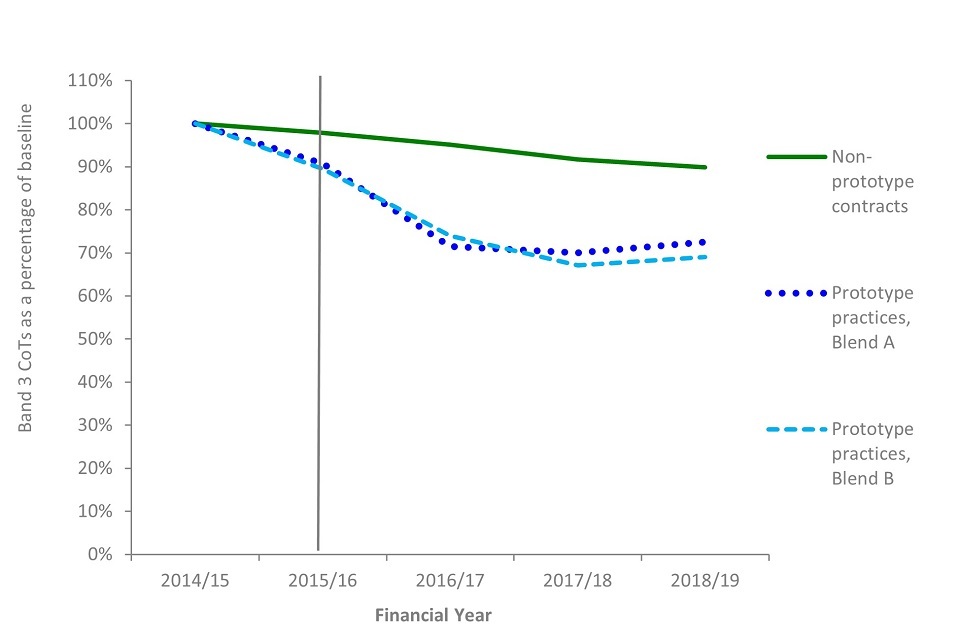
Figures 16, 17 and 18 show how the number of courses of treatment in each band changed on an annual basis from baseline to financial year 2018 to 2019. The data are shown as a percentage of the number of courses of treatment delivered in the baseline year. The vertical green line indicates the beginning of the prototype period.
In prototype practices, each treatment band shows statistically significant decrease since the baseline year. Non-prototype contracts also showed statistically significant decreases in band 2 and band 3 treatments, though to a lesser extent than prototype practices. However, there was a statistically significant increase in band 1 treatments for non-prototype contracts since the baseline year.
Figure 16: percentage of band 1 courses of treatment over time relative to the baseline year, by type of contract
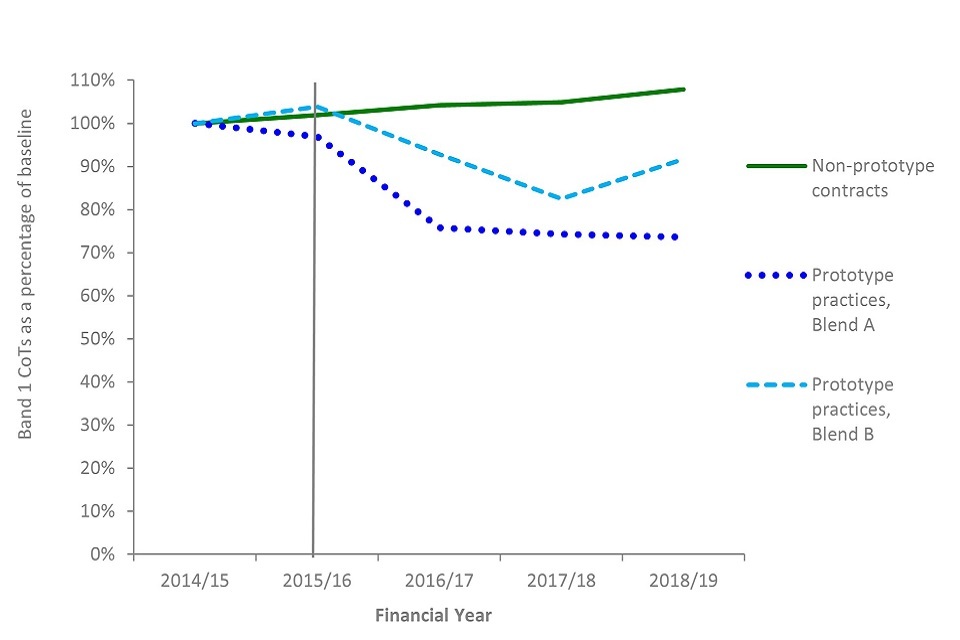
Figure 17: percentage of band 2 courses of treatment over time relative to the baseline year, by type of contract
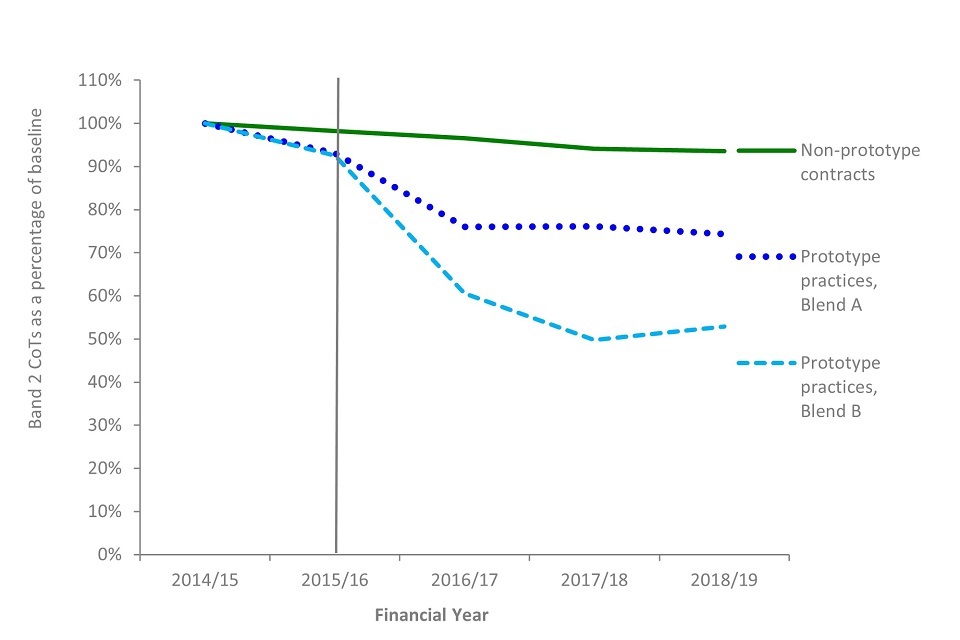
Figure 18: percentage of band 3 courses of treatment over time relative to the baseline year, by type of contract
Volumes and estimated time for treatments delivered
We developed a scale of relative estimated time per tooth or treatment item, and this, multiplied by the numbers of teeth treated or items delivered was used as a measure for comparison. The measure included an estimate of time for OHAs and OHRs carried out in prototype practices, but it did not include details of other unspecified treatments. The measure gives an indication of the estimated time for delivery but does not capture every nuance. For example, it assumes that each treatment takes the same time with every patient. See Appendix 2 for full details of the scale.
Looking at individual courses of treatment, by financial year 2018 to 2019, prototypes increased the estimated time per course of treatment by 4% while in non-prototype contracts it decreased by 6%. This divergence was statistically significant.
However, when looking at the sum of all courses of treatment, the prototype practices significantly reduced their total time for treatments delivered by 23% from baseline, compared with a decrease of 4% in non-prototype contracts. This was likely due to prototype practices delivering fewer courses of treatment overall by financial year 2018 to 2019.
Assessment of oral health and risk
Oral health risk in a group of patients
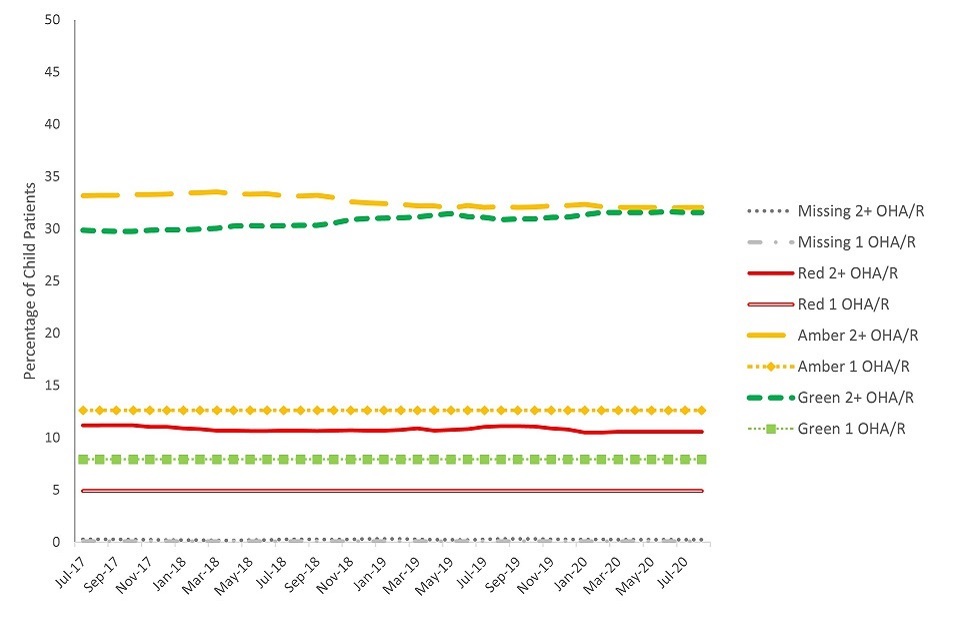
Patients who received an OHA or OHR at a prototype practice between April and July 2017 (the same sample of patients that was used for the return intervals analysis in figures 13 and 14) were followed over time to monitor any change in their overall risk ratings. Aggregated patient risk ratings were carried forward each month from the initial sampling period until the patient returned for a subsequent OHR. At subsequent OHRs, the risk ratings were updated and again carried forward to the next OHR (if there was one). The results show that when examining a set group of patients over time, there is limited change in the proportions of patients within each risk rating.
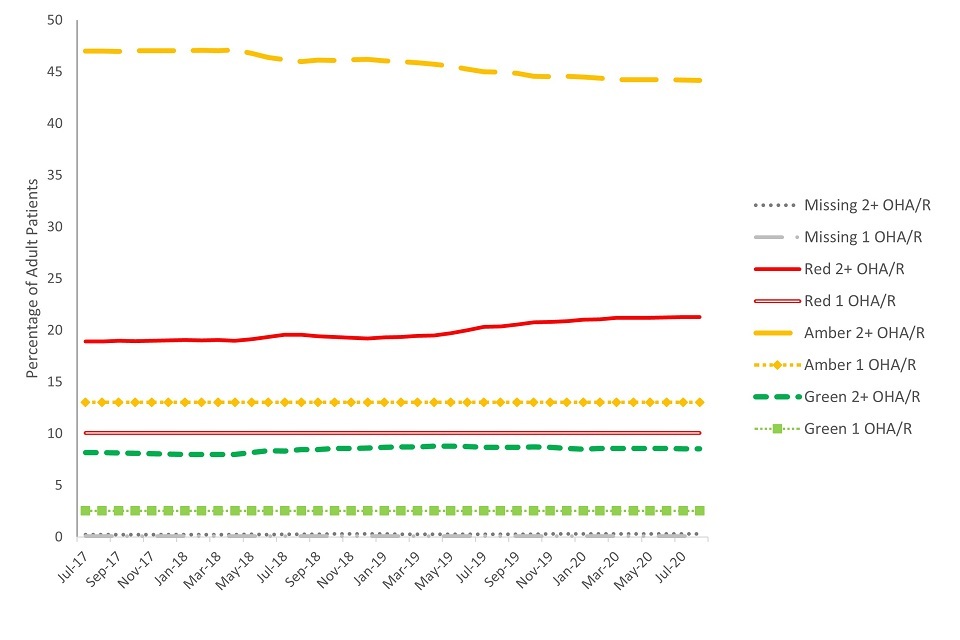
Of the patients within the sample (see figure 19), there was a small but significant increase in the proportion of adults with an overall red risk rating after 3 years and a small but significant decrease in the proportion with an overall amber risk rating. The proportion of adults within the sample with an overall green risk rating remained fairly stable and did not show a significant change between the initial risk rating and the risk ratings of the population after 3 years. Patients who did not return to the practice for a follow-up OHR are displayed on separate lines in the figure.
Figure 19: group-level change in overall oral health risk rating for a sample of adult patients, over time
For the child sample (presented in figure 20), there were no significant changes in the proportions within each overall risk rating when comparing the initial ratings with those at the end of the 3-year period. Children within the sample who did not return to the same practice for an OHR (and therefore had no change recorded for their risk rating) are displayed in separate lines in figure 20.
It should be noted that a sample selected at an alternative point in time may show different proportions of patients within each category of risk. Comparison data were not available for non-prototype contracts.
Figure 20: group-level change in overall oral health risk rating for a sample of child patients, over time
Individual patient risk
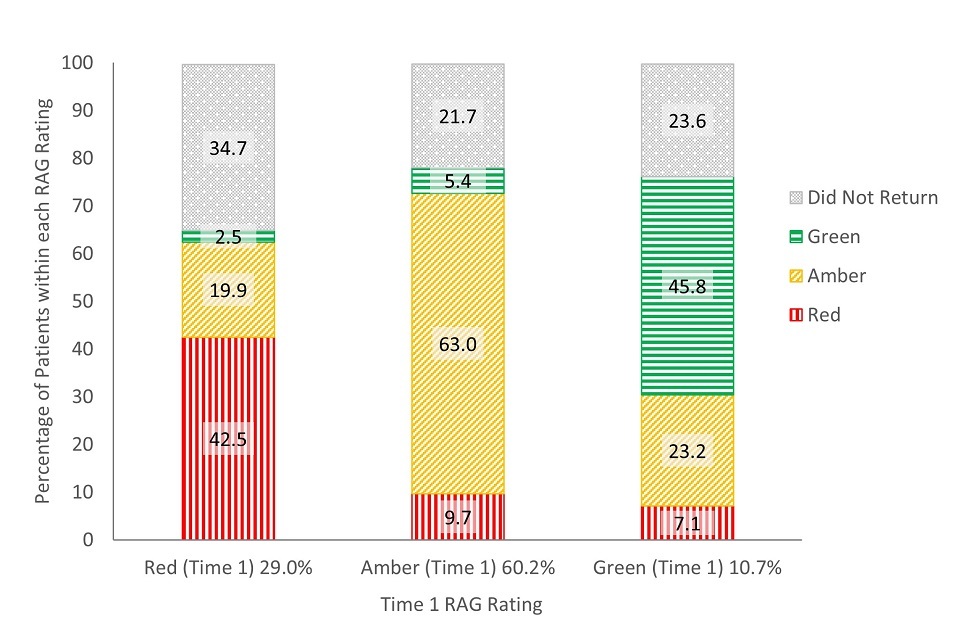
To examine change in overall risk for individual patients, a group of patients was selected and followed over time to observe changes in individual oral health risk between 2 consecutive assessments. Results were examined separately for adults (figure 21) and children (figure 22).
Although there was some movement between risk categories, most patients who returned to the same practice for a follow-up OHR retained their original risk rating. This finding was similar for adults and children.
For adults, of those given a red risk rating at their first assessment, 3% were rated green, 20% amber and 43% remained red risk at the next review (35% had no follow-up OHR). For adults with an amber risk rating at their first assessment, 5% were rated green, 63% remained amber and 10% were rated red at their next review (22% had no follow-up OHR). When adults initially had a green risk rating, 46% retained their green risk status, 23% were rated amber and 7% rated red at their next review (24% had no follow-up OHR).
Figure 21: change in oral health risk for individual adult patients between consecutive OHAs or OHRs
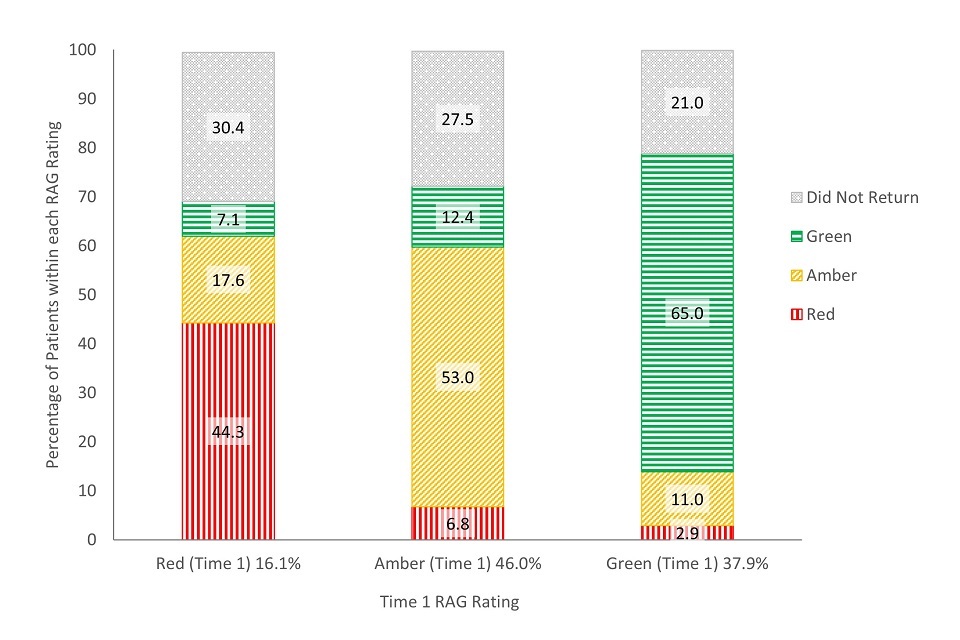
For children, of those given a red risk rating at their first assessment, 7% were rated green, 18% were rated amber and 44% remained red risk at their next review (30% had no follow-up OHR).
When children were assigned an amber risk rating at their first assessment, 12% were rated green, 53% remained amber risk and 7% were rated red at the next review (28% had no follow-up OHR). For the children given a green risk rating at their first assessment, 65% retained their green risk status, 11% were rated amber and 3% were rated red at the next review (21% had no follow-up OHR).
Figure 22: change in oral health risk for individual child patients between consecutive OHAs or OHRs
This analysis looked at change in risk between 2 OHAs or OHRs. The recommended length of time between assessments differs depending on patient risk, meaning that this period of time should have been shorter for patients with red ratings and longer for patients with green ratings. While this may have allowed patients with green ratings more time to ‘change’ (improve or decline), using a standard return interval for all patients (for example, change after 2 years) would be complicated by patients with higher risk ratings receiving more treatment (if following recommended recall intervals) in that time.
Patient experience
The NHSBSA patient questionnaire was used to evaluate the experiences of patients receiving NHS dental care. It was sent out monthly to a random sample of patients at all non-prototype contracts to ask their views on aspects of care such as satisfaction with the services provided and the length of time taken to get an appointment. A similar questionnaire was also distributed to patients at prototype practices.
In this report, we focus on the 2 questions that were comparable between the 2 questionnaires: the percentage of patients responding that they were satisfied with the NHS dental treatment they received, and the percentage responding that the length of time taken to get an appointment was ‘as soon as necessary’. The response rates for the surveys ranged from 25% to 28% (around 3,200 responses for prototype practices in financial year 2016 to 2017 and 4,100 responses in financial year 2017 to 2018) and results are presented with confidence intervals to help in generalising to the wider population. Demographic characteristics were not available to examine any possible biasing of the respondent sample. Patients had no knowledge of the questionnaire prior to receiving it and were offered no incentive for their participation. No reminders were sent for questionnaires that were not returned. See appendices 3 and 4 for the full wording of these questions.
At prototype practices 97% of patients reported being ‘quite’ or ‘very’ satisfied with the NHS treatment they received. For non-prototype contracts, 95.7% of patients reported being ‘fairly’ or ‘completely’ satisfied with the NHS treatment they received (see table 5), a significant difference. Although this difference was statistically significant, minor differences in the wording of the questionnaire response items may contribute to differences in responding between the 2 samples. For the prototype questionnaire, patients were asked if they were ‘quite’ or ‘very’ satisfied with NHS dentistry received. Patients at non-prototype contracts were asked if they were ‘fairly’ or ‘completely’ satisfied with the NHS dentistry received. It is also unknown if the differences in patient satisfaction between the 2 groups existed prior to the beginning of the prototype.
Table 5a and 5b: number and percentage of patients responding they were satisfied with the NHS dental treatment they received by year and type of contract (with confidence interval (CI))
Table 5a: financial year 2016 to 2017
| Type of contract | N | % | 99% CI |
|---|---|---|---|
| Prototype practices | 3,141 | 97.1% | ±0.76 |
| Non-prototype contracts | 53,175 | 95.7% | ±0.23 |
Table 5b: financial year 2017 to 2018
| Type of contract | N | % | 99% CI |
|---|---|---|---|
| Prototype practices | 3,865 | 96.9% | ±0.71 |
| Non-prototype contracts | 33,295 | 95.7% | ±0.29 |
There was lower satisfaction with time taken to get an appointment among patients at prototype practices compared to patients from non-prototype contracts. In the same questionnaire of patients’ views, the majority responded that the length of time taken to get an appointment was ‘as soon as necessary’ (presented in table 6). This percentage was significantly higher for patients at non-prototype contracts (91%, compared with 88% in financial year 2016 to 2017 and 87% in 2017 to 2018 for patients at prototype practices). Without having measures of this prior to the onset of prototyping, it is unclear if the lower satisfaction with time taken to get an appointment among patients at prototype practices was already present at these practices before entering the programme.
Table 6a and 6b: number and percentage of patients responding that the length of time taken to get an appointment was ‘as soon as necessary’, by year and type of contract (with CI)
Table 6a: financial year 2016 to 2017
| Type of contract | N | % | 99% CI |
|---|---|---|---|
| Prototype practices | 2,855 | 87.7% | ±1.57 |
| Non-prototype contracts | 50,891 | 91.3% | ±0.32 |
Table 6b: financial year 2017 to 2018
| Type of contract | N | % | 99% CI |
|---|---|---|---|
| Prototype practices | 3,570 | 86.6% | ±1.45 |
| Non-prototype contracts | 31,920 | 91.2% | ±0.41 |
Contract delivery and remuneration
The prototypes were remunerated on a blended payment system where a practice’s contract value was divided between a capitation element for which the practice is expected to maintain a minimum number of capitated patients on their list and an activity element for which the practice is expected to deliver a minimum level of activity.
There were 2 variations of the blended remuneration system trialled in the prototype phase: blend A and blend B. This did not affect the clinical pathway approach, as the same pathway was followed for both blends.
As the treatment needs of the practice population may change over time there was flexibility within the prototype remuneration system, whereby a practice could compensate for lower activity by increasing the number of patients in capitation. This is referred to as the exchange mechanism (see appendix 2).
Prototype practices were expected to deliver at least 96% of their contract. This was calculated by combining the delivery of the capitation and activity portions of the contract. Practices were paid one twelfth of their contracted value each month. If they delivered less than 96% overall, the NHS recovered money from the practice through an annual reconciliation process to a maximum of 10% of contract value. Where contract delivery was between 100% and 102%, this could be paid to the practice or carried forward into the following year’s calculation.
Contract performance
Practices were able to deliver the prototype contract, with levels of financial recovery for under achievement being similar to those observed for non-prototype contracts.
We compared the percentage of prototype practices and non-prototype contracts that ‘achieved’ their target, defined as 96% or greater of their agreed contractual requirements. This threshold was used as it is the point at which a contract is deemed to have been delivered. The results showed that there was no significant difference in the prototype and non-prototype contract proportions achieving above or below this threshold.
Figure 23 demonstrates that there was no statistically significant difference in overall contract achievement at year-end between prototype practices and non-prototype contracts, nor was there a significant change in prototype performance, over the 3-year-period.
In order to present a complete picture of prototype delivery, all wave 3 prototype practices were included in this analysis (except one which left in August 2017 which the statistical analysis took into account). As a result, the method of sampling used differed from other analyses in the report.
Figure 23: overall contract achievement for financial years 2016 to 2017, 2017 to 2018 and 2018 to 2019

In the first year of prototyping, 76.2% of prototype practices achieved over 96% of their contract at year-end. In the same year, 67.2% of non-prototype contracts achieved over 96%. In the third year, 65% of prototype practices were achieving over 96%. In the same year, 61.7% of non-prototype contracts achieved over 96% of their contract (see table 7).
Tables 7a to 7c: overall contractual achievement for prototype practices and non-prototype contracts by financial year
Table 7a: financial year 2016 to 2017
| Contract achievement | Prototypes | Non-prototype contracts |
|---|---|---|
| Over 102% | 28.6% | 13.9% |
| 100 to 102% | 19.0% | 24.3% |
| 96% to 100% | 28.6% | 29% |
| 90% to 96% | 14.3% | 12.4% |
| Below 90% | 9.5% | 20.3% |
Table 7b: financial year 2017 to 2018
| Contract achievement | Prototypes | Non-prototype contracts |
|---|---|---|
| Over 102% | 20.0% | 10.6% |
| 100 to 102% | 30.0% | 21.4% |
| 96% to 100% | 25.0% | 26.9% |
| 90% to 96% | 10.0% | 14.0% |
| Below 90% | 15.0% | 27.1% |
Table 7c: financial year 2018 to 2019
| Contract achievement | Prototypes | Non-prototype contracts |
|---|---|---|
| Over 102% | 20.0% | 12.9% |
| 100 to 102% | 20.0% | 21.7% |
| 96% to 100% | 25.0% | 27.1% |
| 90% to 96% | 20.0% | 12.2% |
| Below 90% | 15.0% | 26.1% |
Of the 20 prototype practices in financial year 2018 to 2019, 9 achieved their capitation target for the year. In the first year of prototyping, 13 out of the 21 practices, achieved above 100% in capitation, taking advantage of the exchange mechanism. In the second year, 10 out of 20 practices achieved above 100% in capitation, and in the third year, 8 out of 20 practices achieved over 100% in capitation.
Of those practices that achieved greater than 100% capitation in the first year of prototyping, 92.3% (12 practices) had a prototype capitation target that was lower than their patient numbers in the baseline year; this is because the target was based on the 3-year period from April 2012 to March 2015. In other words, their reduced target meant they had to see fewer patients to meet their contractual parameters. In the second year this dropped to 70% of practices (10 practices), and to 37.5% (3 practices) in the third year. Conversely, this meant that a greater number of practices, with higher targets than their baseline patient numbers, were also over-achieving on capitation. This implies that practices were inadvertently incentivised to alter their patient numbers by targets, rather than just by need.
Patient charge revenue
One of the results of the drop of 9% of patients seen, and the 28% drop in courses of treatment, was an associated reduction in patient charge revenue.
In financial year 2018 to 2019, £3.1 million of revenue came from patient charges (see table 8). This represented 26% of the £11.9 million gross cost of dentistry which fell from 30% in the baseline year 2014 to 2015 – effectively increasing the cost to the NHS. For non-prototype contracts the patient charge revenue increased from 30% to 36% of gross cost over the same period.
Table 8a and 8b: patient charge revenue over time, by type of contract
Table 8a: patient charge revenue
| Prototype practices | Non-prototype contracts | |
|---|---|---|
| Baseline year 2014 to 2015 | £3.4 million | £497.5 million |
| Financial year 2016 to 2017 | £2.9 million | £544.0 million |
| Financial year 2017 to 2018 | £2.9 million | £568.2 million |
| Financial year 2018 2019 | £3.1 million | £600.0 million |
Table 8b: patient charge revenue as percentage of gross NHS payments
| Prototype practices | Non-prototype contracts | |
|---|---|---|
| Baseline year 2014 to 2015 | 29.7% | 30.3% |
| Financial year 2016 to 2017 | 25.0% | 32.8% |
| Financial year 2017 to 2018 | 23.9% | 34.1% |
| Financial year 2018 to 2019 | 26.5% | 36.3% |
The drop in patient charge revenue in prototype practices was mainly a result of the drop in number of patients seen and the drop in dental activity as described in the ‘Access’ and ‘Treatment provided’ sections, respectively. We did not find any demographic changes in the prototype practices’ patient population which might have affected the numbers of patients required to pay patient charges.
Conclusions
The prototype contract sought to improve oral health through prevention of caries and periodontal disease and increase access to NHS dental care for patients, as well as address concerns from the dental sector about remuneration. On the available evidence, this contract did not achieve these aims. There was an increased level of activity delivered in individual courses of treatment at prototype practices, but this activity was across a smaller number of patients and fewer courses of treatment.
Appendix 1: eligibility criteria for the prototype phase
The following eligibility criteria for prototyping were published in Dental Contract Reform: Prototypes Overview document in January 2015. These criteria were used to evaluate new applicants joining the programme. Practices transferring from the pilot phase (wave 1 and 2 practices) were not evaluated against these criteria. The criteria are:
- the applicant must hold an NHS dental contract(s) (GDS, PDS or PDS+) and deliver mandatory services
- the value of the NHS contract(s) must be above a threshold of £100,000 per annum
- NHS contract(s) held must have at least 51% contract value attributed to delivery of UDAs
- the NHS contract(s) must account for over 60% of the total earnings at the dental practice
- the practice must have achieved a contract performance of 96% or above in one of the previous 2 years, and above 90% in the other
- the contract(s) may not be restricted (for example, charge exempt and/or children only)
- the practice must be open for NHS care for a minimum of 5 days a week in the main address for that contract
- at least one of the NHS contract(s) must have been in place for 3 years or more
- all contracts must have an end date no earlier than 31 March 2017 and preferably later than 31 March 2018 - contracts which end between 31 March 2017 and 31 March 2018 will not be automatically excluded from selection and will be considered on a case-by-case basis
- a chairside IT system must be in place at the practice(s) which is fully connected for the transmission of electronic data to the NHSBSA
- the applicant needs to commit to self-funding any IT costs that are incurred as a result of participation as a prototype
- the applicant must commit to the prototype principles and requirements
Appendix 2: methodology and analytical approach
Evaluation approach
The DCR programme was carried out as an evaluation and implementation programme, where adjustments were made during the course of the programme. The prototype phase saw some adjustments during the 3 years, and these are described in the main report under the section titled ‘The prototype phase’. This analysis of the prototype phase has had to exclude or adjust for any changes, such as practices exiting the programme, in order to standardise any comparison.
Prototype sample
Results in this report relating to prototype practices are for wave 3 practices only. These are the practices that joined the programme at the start of the prototype phase in 2016. Analysis was limited to the outcomes of these practices as they were more representative of what may happen if the prototype model was implemented with a wider group of practices, currently operating with a GDS contract. Waves 1 and 2 entered the prototype after several years of operating under a slightly different capitation-based model, and many were required to increase their patient numbers upon entry to the programme. Although wave 4 entered the programme from a similar position to wave 3, there was not enough data available from this group at the time of analysis, because they joined the programme from October 2018 onwards and the data analysed in this report cover up to March 2019.
Because we were evaluating the prototype model in general ‘high street’ dentistry, we excluded any prototypes that were community dental service practices. This resulted in wave 3 having 21 practices at the beginning of the prototype phase: 11 practices in blend A and 10 in blend B. Blends were allocated by the programme team.
One practice withdrew from the programme in 2017 but was included in analysis with their last data points carried forward where appropriate. This approach was taken to avoid biasing the results towards ‘successful’ practices in case withdrawal from the programme had been related to performance or meeting the contractual requirements of the new contract. Where it was not possible or sensible to carry the last know observation forward (for example, when looking at paired OHAs or OHRs for individual patients), this practice was excluded from the analysis.
All the prototype practices were volunteers, self-selecting into the programme, and had previously performed well against their contracted activity (see appendix 1 for eligibility criteria). This, combined with the small sample size for prototype practices, means caution should be exercised in generalising these results to the wider population of general dental contracts.
Practice characteristics and comparison sample
The eligibility criteria for inclusion in the prototype phase are set out in the appendix 1. This included limits on the amount of private treatment carried out at the practice, along with the opening hours and the size of the NHS contract.
For some of the analyses, prototype practices were compared with all non-prototype contracts. For these comparisons, the following differences should be considered:
- the comparison group for all non-prototype contracts includes contracts for trusts, community dental services which operate to different contractual requirements and remuneration incentives
- these contracts had slightly higher proportions of adult patients exempt from patient charges, though the prototypes still had proportionately more adult patients exempt from patient charges – the difference was small but statistically significant (30% in prototypes and 29% in all other contracts)
- the distribution of banded treatments was similar to prototype practices in the baseline year (differences were within 1% point)
A control group was not established at the onset of the prototype phase. This meant that there was not a pre-defined, comparable group against which to compare outcomes of the programme. For this evaluation, where possible, a ‘comparable’ group of non-prototype contracts was selected to make comparisons against. Criteria for selection were defined with the aim of reducing the possible influence of confounding factors between non-prototype contracts and prototype practices. Contracts were selected for the comparable group if they:
- were GDS or personal dental services (PDS) contracts and paid by NHSBSA (this excludes trust-led contracts)
- were mixed or orthodontic contracts where at least 30% of their delivered contracted value was for UDAs and contract value per UDA was equivalent to £10 to £40
- were not contracts for specific populations (for example, prison services or specialist nursing home contracts)
- had not been previously in the DCR programme or shared a treatment location with a pilot or prototype practice that had been in the programme (including wave 4)
- were open for at least 2 years prior to the baseline year and still open throughout financial year 2018 to 2019
- did not have any changes in their contract size between financial years 2014 to 2015 and 2018 to 2019 of over 50%, since these were not necessarily comparable to the more stable prototypes
- had approximately 2000 or more commissioned units of dental activity (equivalent to a contract value of £100,000) and at least 100 NHS patients in the baseline year
However, there were some statistically significant differences between the prototype group and comparable contracts worth bearing in mind when making comparisons:
-
The proportion of adult patients seen in the preceding 24 months who were exempt from patient charges was higher in prototypes (30% in prototypes and 28% in non-prototype contracts). Although the proportion of children was statistically significantly higher in non-prototype contracts (26% compared to 25% in prototypes), the difference was less than 1%.
-
The prototype practices had delivered a higher rate of band 2 (30%) and urgent (10%) courses of treatment than the comparison group (29% and 9%, respectively) and had a corresponding lower rate of band 1 courses of treatment (53% compared to 56% in non-prototype contracts).
Statistical analysis
The data used in some analyses were not always available for non-prototype contracts. Only prototype practices transmitted appointment data electronically and completed OHAs or OHRs. For this reason, analysis using this data was limited to the prototype practices.
Results are often presented separately for children and adults due to variation in the clinical guidance for best practice, different treatments typically provided, and different risk profiles. Children were defined as patients aged 17 years or younger at the time of their treatment, and adults were patients aged 18 years or older.
Where a comparison is described as ‘statistically significant’, this means that the difference has been tested statistically and the difference between the variables being tested is beyond what would be likely to occur just based on random variation. A level of p less than 0.01 is used in the report. This means that there would be less than 1% probability that the difference found between the variables being compared occurred by chance.
Data sources and metrics
Patient access and availability.
36-month patient capitation
Data sources:
- FP17 claims
- appointment system
Measure: patients seen in preceding 36 months for OHA or OHR or band 1, 2, or 3
The analysis used data from FP17 claims and appointment transmissions. Each unique patient ID was assigned to the practice at which their most recent band 1, 2 or 3 claim or OHA or OHR appointment was received in a 36-month period, based on treatment acceptance date. It excluded courses of treatment that were on referral, urgent, free of charge (for example, prescription, arrest of bleeding and so on), orthodontic, domiciliary or for sedation. Band 1, 2 or 3 courses of treatment and OHAs or OHRs delivered by foundation dentists, remove the patient from capitation due to an alternative payment system being in place. A correction procedure was used to identify patient IDs which might not be unique.
Because the measure of capitation included OHAs or OHRs, which are held in appointment data, results from this analysis are only available for prototype practices.
Capitation was measured annually as the number of patients seen in the previous 3 years, as at 31 March of a given year. The baseline capitation target was calculated using the same method and reflects the number of patients in capitation at 31 March 2015. Comparisons over time (to demonstrate change in patient access) present the number of patients in capitation as a percentage of the number of patients in capitation in the baseline year (the year from which performance targets were set). This analysis reflected change in actual patient numbers rather than performance against a target.
In this report, patient numbers from all relevant practices were summed before calculating the percentages.
The following additional notes apply to analyses of patient capitation, patient access, courses of treatment and patient charge revenue:
The analyses in this report were for wave 3 practices, which had entered the prototype by April 2016. Practices from wave 4 were not included in any of the analyses.
One wave 3 practice exited the programme in October 2017. This practice was kept in the analysis with its last known programme value used for subsequent years (‘last observation carried forward’). This approach has statistical drawbacks (for example, if there is an upward or downward trend), but those drawbacks were deemed less than the removal of the practice would have been. It was not necessary to use this replacement method for non-prototype contracts, as all selected contracts remained open for the duration of the analysis. For these analyses, the comparable non-prototype contracts (described in appendix 2 under the ‘Practice characteristics and comparison sample’ heading) were used as the comparison sample.
In some prototype and non-programme contracts, contract size (in terms of NHS commitment) changed over the reported period. With a change in contract size we might also expect a change in patient numbers and activity. The analysis corrected observations linearly with changes in contract size relative to baseline year. Since 24-month patient access is a measure that spans 2 years while contract values might span only one, the contract size adjustment was done stepwise over 2 years. Contract size in prototypes was based on inflation-adjusted changes in AAPV (actual annual prototype value) since units of dental activity (UDAs) are no longer commissioned; while for non-prototype contracts, contract size was measured in terms of changes in commissioned UDAs. No modifications for change in contract size were made for analyses of actual 36-month capitation figures.
24-month patient access
Data source: FP17 claims
Measure: all patients seen in preceding 24 months
The data were drawn from FP17s claims, with the most recent course of treatment for each patient counted against that dental contract within a 24-month period (based on the date at the start of treatment – treatment acceptance date). The analysis excluded referred courses of treatment and included courses of treatments delivered by vocational or foundation dentists. This measure was used because it was available for all contracts, allowing comparisons between prototypes and non-prototype contracts. Results cannot be directly compared with capitation analyses because 24-month patient access included claims for urgent courses of treatment and those delivered by foundation dentists while capitation did not, and because of the different time period – 24-month patient access versus 36-month capitation. Figures were presented as a percentage of the baseline position for each year.
Patient access was analysed by patient groups where ‘adults’ were patients aged 18 and over and ‘exempt’ patients were the adult patients exempt from paying charges – this was mostly due to eligibility for means tested benefits but also included prisoners, pregnant women and mothers in the first year after the birth of their child. Children were also exempt from patient charges but were not included in the adult’s exempt category.
See also the additional notes in the 36-month patient capitation section above.
Waiting times for appointments
Data source: monthly survey sent to practices
The survey was sent out to all prototype practices, monthly, between February 2015 and February 2020. Further details of the questions can be found in appendix 5 below. Responses rates varied from month to month, from 48% to 90%, with the sample submitting data, changing each month.
For the analysis of time until the third next available appointment, the answers to question 28 were used. Results for all practices were averaged for each month. We then created a 3-month rolling average to present in this report to make interpretation of the results easier as there was a degree of variability each month.
The survey was only sent to prototype practices, therefore no comparison with non-prototype contracts was possible.
The clinical pathway
Clinical risk assessments
Data sources:
- appointment system
- FP17 claims
Measures: patients with band 1, 2 or 3 who were eligible to receive OHAs or OHRs
A combination of appointment and FP17 data were used to determine whether patients were receiving OHAs or OHRs. Based on the FP17 data, patients were selected if they had a band 1, 2 or 3 course of treatment in any of the years of interest. These patients were selected to represent a population considered potentially eligible for receiving an OHA or OHR. The appointment data were then used to identify whether patients within the sample had an OHA or OHR during the same year as their banded course of treatment. From this, patients were then grouped by whether or not they had received an OHA or OHR in the same year as an eligible course of treatment.
Exited prototype practices that did not have full data for financial years 2016 to 2017, 2017 to 2018 and 2018 to 2019 were excluded from all calculations. Some patients may have had more than one OHA or OHR or banded course of treatment in a single year. Results are presented separately for adults and children. Adults are defined as patients aged 18 years or older at the time of treatment and children are patients younger than 18 years of age. The sample included approximately 61,000 adults and approximately 24,000 children, each year. Data on OHAs or OHRs were not available for non-prototype contracts, therefore no comparisons between these 2 samples were made.
Recall and return intervals
Data sources:
- appointment system
- FP17 claims
Measures:
- recommended and actual time between OHAs or OHRs in prototypes
- band 1, 2 or 3 courses of treatment (COTs) in all contracts
Assigned recalls intervals are the recommended time (in months) between oral examinations and should be based on patient risk. These do not necessarily reflect the actual amount of time between examinations but rather the advised amount of time. Recall intervals were generated by the dental practice management software for prototype practices based on patient risk, however these could be overwritten at the discretion of the dentist. We do not know the extent to which they were overwritten in practice. 2 sources of data were used to examine the recommended recall intervals assigned to patients.
For prototype practices, the appointment data were used to select patients who had an OHA or OHR in financial year 2017 to 2018. Withdrawn practices and those not transmitting appointments, were excluded from the analysis. To examine the appropriateness of the assigned recall interval they were presented alongside the patient’s overall oral health risk rating. Patients with missing overall oral health risk ratings were excluded from the sample. The assigned recall interval was then taken from the OHA or OHR, resulting in 46,653 adults and 18,297 children in financial year 2017 to 2018.
For non-prototype contracts, FP17 submissions where the patient had a band 1, 2 or 3 course of treatment were selected from all dental contracts in England (that were not associated with the DCR Programme) if the treatment acceptance date fell in financial year 2017 to 2018. The sample included around 7,000 dental contracts and recall intervals were available for approximately 12.9 million adults and approximately 5.5 million children. This was from all non-prototype contracts as it was not possible to limit the sample to only the comparable non-prototype contracts.
For both data sources, records were limited to one per patient where the patient had multiple treatments in that year. Adults were patients aged 18 years or older and children were patients aged 17 years or younger. Age was measured at the start of the course of treatment or time of the OHA or OHR (for DCR data).
Actual return intervals were defined as the amount of time (measured in months) between 2 consecutive courses of treatment. Data from FP17 claim forms were used to examine actual return intervals.
FP17 submissions for band 1, 2 or 3 treatments were selected from prototype practices and non-prototype contracts in England where the treatment acceptance date occurred in financial year 2017 to 2018. Practices that had withdrawn from the prototype were excluded from the analysis. The return interval was calculated as the difference in months between the treatment acceptance date of the FP17 selected during the sampling period and the treatment acceptance date of the next FP17 for a band 1, 2 or 3 treatment. The time 2 course of treatment may not necessarily have been at the same contract or practice and could have occurred anytime up to October 2020. Patients returning only for an urgent course of treatment were counted as not having returned, as this was not representative of planned dental care. The sample for non-prototype contracts was the same as the sample used in the assigned recall analysis (described above). For prototype practices there was approximately 41,000 records for adults and approximately 18,000 records for children.
For both data sources, adults were patients aged 18 years or older and children were patients aged 17 years or younger. Age was measured at the start of the first course of treatment.
We were also interested in actual return intervals by patient risk, however these data were only available for prototype practices as it came from the OHA or OHR. We selected any patients who received an OHA or OHR at a prototype practice between April and June 2017. We then calculated the actual return interval (in months) between this initial OHA or OHR and their next OHR at the same practice. Patients were classified as having returned early, on time, late, or not at all (after a period of at least 38 months).
Fluoride varnish and best practice prevention
Data source: FP17 claims
Measure: rates of fluoride varnish and best practice prevention for all FP17 claims
FP17 claim forms were used to measure the rates of fluoride varnish application and the provision of best practice prevention (according to the Delivering Better Oral Health toolkit), from financial year 2016 to 2017, to 2018 to 2019. Data were based on year-end methodology. Year-end methodology includes all FP17 data (including amendments) collected from forms scheduled in any of the fifteen schedule months from April (of the financial year of interest) to June (in the subsequent financial year), where the date of completion was on or between 1 April and 31 March of the financial year of interest. For the purposes of this analysis, activity from foundation dentists was included.
Figures were presented separately for prototype practices and non-prototype contracts. The number of practices/contracts changed each year to reflect those that were open and operating under the respective models. Across the 3 financial years examined, the number of contracts for non-prototype contracts ranged between 7,000 and 8,000, reflecting available data from all, rather than only comparable, non-prototype contracts. For prototype practices, data were presented for the 20 Wave 3 practices that remained in the programme for the 3 reporting years (financial years 2016 to 2017, 2017 to 2018 and 2018 to 2019). Note that a practice could have more than one contract. Results are based on approximately 40 million FP17s for non-prototype contracts and approximately 135,000 FP17s for prototype practices, each year. Adult and child patients are defined based on the patients’ age at the date of acceptance of the course of treatment. An adult was defined as a patient aged 18 years or over and, a child was aged under 18 years.
Treatment provided
Courses of treatment
Data source: FP17 claims
Measure: change in band 1, 2, 3 and urgent course of treatment
The data use the number of FP17s claims for bands 1, 2, 3 and urgent courses of treatment. Figures were presented as a percentage of the baseline position. Details about the practices included and adjustments for leaving practices and contract changes are described in the section above about 36 month patient capitation.
Estimated times for delivering treatments
Data sources:
- FP17 claims
- appointment system
- scale of estimated times
Measures:
- average items per course of treatment
- average estimated time per course of treatment
- total estimated time for delivery
Practices included in this analysis and adjustments for exiting practices are described in the section about patient access above.
Figures were based on band 1 to 3 claims with clinical data – claims with no clinical data were excluded from the calculations and any contracts with high rates of missing clinical data were excluded from comparisons (none of these were prototype practices). Figures were not adjusted for changes in contract size and so are not comparable with the analysis of courses of treatment which was adjusted for contract size.
We developed a scale of estimated time per tooth or item, and this, multiplied by the numbers of teeth treated or items delivered was used as a measure for comparison between prototype and non-prototype contracts. The estimated times were derived from the itemised dentist’s fees in the Scotland statement of dental remuneration, April 2017 (the latest version at the time we first prepared this measure).
Presented below in Table 9 are the estimated times assigned to each treatment item. The shaded areas of the table indicate where a treatment was not normally associated with this charge band and where different values may have been applied.
Table 9: relative estimated times assigned for each treatment
| Treatment item | Unit | Band 1 | Band 2 | Band 3 |
|---|---|---|---|---|
| Examination only (estimated) | Per claim | 3.73 | 3.73 | 3.73 |
| Estimated OHAs or OHRs | Per claim | 4.96 | 4.96 | 4.96 |
| Radiographs | Per item | 1.28 | 1.28 | 1.28 |
| Scale and polish | Per claim | 5.84 | 5.84 | 5.84 |
| Fluoride varnish | Per tooth | 1.28 | 1.28 | 1.28 |
| Fissure sealant | Per tooth | 3.67 | 3.67 | 3.67 |
| Antibiotics | Per claim | 1.99 | 1.99 | 1.99 |
| Fillings | Per tooth | 7.49 | 7.49 | 7.49 |
| Extractions | Per tooth | 3.67 | 3.67 | 3.67 |
| Endodontics | Per tooth | 33.18 | 33.18 | 33.18 |
| Crowns | Per tooth | 5.48 | 5.48 | 58.81 |
| Inlays | Per tooth | 0.65 | 0.65 | 57.61 |
| Veneers | Per tooth | 6.74 | 6.74 | 47.37 |
| Bridges | Per tooth | 10.91 | 10.91 | 70.03 |
| Acrylic dentures | Per claim | 9.10 | 9.10 | 46.61 |
| Metal dentures | Per claim | 9.10 | 9.10 | 76.86 |
Notes about specific treatments
- The estimated time for fluoride varnish was set to 1.28 (the same as one radiograph) to reflect the time taken rather than the cost of materials following advice from NHSBSA clinical advisers.
- The estimated time for an OHA or OHR was estimated by NHSBSA clinical advisers (an exam was estimated to take about three-quarters of the time for an OHA or OHR, which equates to 33% longer for an OHA or OHR than exam) and this rate was applied. Note that the relative length of OHAs or OHRs was an estimate based on clinical considerations. The programme did not hold data on the length of examinations, nor data on how long an OHA or OHR examination took in prototypes. Further, there was probably a large variation in the length of individual OHAs or OHRs.
- Dentures: the data represented claims with dentures rather than per item (partial or full dentures) and the estimated was based on the average per claim for dentures.
- Band 1 and 2 claims with crowns, veneers, bridges, or dentures were estimated at shorter times to reflect the likelihood that this covered repairs rather than provision of items.
- The analysis excluded unspecified treatments which were coded as ‘other’ on the FP17 claim because we could not ensure they were recorded reliably between prototype and non-prototype contracts. At band 1 this included full case assessment, study casts, taking of material for pathological examination, adjustments to dentures and treatment of sensitive cementum or dentine. At band 2 it included periodontal surgery, apicectomy, sedation, post-operative care; and at band 3 it included occlusal appliances. Prototypes reported high numbers of ‘other’ treatments and the data quality of these was not investigated.
- Claims with no clinical data were excluded from the calculations and any contracts with high rates of missing clinical data were excluded from comparisons (none of these were prototype practices).
Assessment of oral health and risk
Population and individual oral health risk over time
Data source: appointment system
Measure: patient sample who had an OHA or OHR from April to June 2017 – tracking their subsequent risk status over time or to their next OHR
Oral health risk was measured in 4 separate domains (caries, periodontal disease, tooth surface loss, and soft tissue) at an OHA or OHR and the overall rating can be determined by the highest risk of these. Patients are classified on each domain as having a RAG rating (high to low risk) where age appropriate.
A sample of patients was selected and followed over time to monitor changes in oral health risk. Patients were included in the sample if they had an OHA or OHR between April and June 2017 (inclusive). Patient’s risk ratings recorded at the OHA or OHR during the sampling period were carried forward each month until the next OHR, where they were updated if there was any change. This was repeated for any subsequent ratings from OHRs, with ratings collated each month from July 2017 to August 2020. Where a rating was not assigned, or the patient was not eligible to receive this rating (for example, edentate patients), patients are grouped under the Missing category in the analysis.
Practices were excluded if they did not transmit appointments or had withdrawn during the sampling period. Comparison data were not available for non-prototype contracts.
Results were presented separately for adults (18 years or older) and children (17 years or younger), as they have different recommended recall intervals. There were 12,329 adults and 4,804 children included in the sample. After discovering that approximately 26% of patients did not return for a subsequent review, these groups of patients were represented separately in the analysis.
Results reflect the proportion of patients from the original sample with a given risk rating each month, rather than those patients actually seen in the practice each month.
The sample used for the population oral health risk analysis was also used to compare change in patient-level risk between 2 assessments. Patients were selected at time 1 if they had an OHA or OHR between April and June 2017, and their overall risk rating was recorded. For this group of patients, their next OHR (up to August 2020) was used as their Time 2 overall risk rating. The duration between the 2 ratings varied across patients, though this was not unexpected given the differences in recall intervals based on individual risk. Although enough time for all patients to return had been allowed, including those with the maximum recommended recall of 24 months, not all patients had returned by August 2020 (approximately 26% of adults and children).
Patients missing a risk rating at Time 1 were excluded from this analysis, resulting in 12,292 adult and 4,787 child patients.
Patient experience
Patient perspective measures
Measures: patient satisfaction with waiting times and overall satisfaction with the care received
Data for the patient experience measures were collected via a questionnaire distributed by the NHSBSA to patients who had received treatment at a prototype practice. A random selection of patients was sampled each month and response rates varied between 25 to 28%. There were approximately 3,200 responses in the financial year 2016 to 2017 and 4,100 responses in financial year 2017 to 2018. These figures include patients from practices that were active prototypes for the entire relevant financial year. Data from financial year 2018 to 2019 were not available due to concerns about data quality.
The full questionnaire asked patients about acceptability of waiting times, cleanliness of the practice, being able to speak and eat comfortably, and overall satisfaction with the care received. A selection of items from the questionnaire are presented in appendix 3.
A similar questionnaire (using a similar methodology) was sent to patients having received care from non-prototype contracts. This included all non-prototype contracts delivering NHS dental care. There were 2 items in this questionnaire deemed comparable with those in the prototype questionnaire. For one of these items the wording of the question (Q10) was the same, but response options were slightly different. The prototype questionnaire used ‘Very satisfied’ ‘Quite satisfied’, ‘Quite dissatisfied’ and ‘Very dissatisfied’, while the standard questionnaire used ‘Completely satisfied’ ‘Fairly satisfied’, ‘Fairly dissatisfied’ and ‘Very dissatisfied’. Results were based on approximately 57,000 responses (response rate of 25.6%) for financial year 2016 to 2017 and approximately 36,000 (response rate of 25.0%) responses for financial year 2017 to 2018. The full wording of the 2 comparable items is presented in appendix 4.
Both questionnaires were sent to the sampled patients via post. They had no knowledge of the questionnaire prior to receiving it in the mail and no incentives were offered for completing it. No reminders for non-completion were sent to the sampled patients.
Contract delivery and remuneration
Contract performance
Data sources:
- FP17 claims
- appointment system
Measures:
- activity delivered in prototype units of dental activity
- patients in capitation at end of financial year against contract targets
- delivery against standard UDA targets for non-prototype contracts
For prototypes, contract performance was a blended measure comprised of 2 key metrics:
- the number of prototype UDAs delivered within the financial year (the activity portion)
- the number of capitated patients seen by the practice within the previous 3 financial years (the capitation portion)
The expected patient list was based on the number of patients seen by the practice for an NHS appointment in the 3-year period to 31 March 2015 (for Wave 3 practices). The expected patient list did not include patients who had attended the practice only for the following reasons in that period: treatment on referral, urgent treatment, charge-exempt courses of treatment (this includes treatments that have no cost to the patient such as removal of sutures, arrest of bleeding, bridge repair, and prescriptions), orthodontic treatment, or treatment by a foundation dentist. Relevant changes in delivered and commissioned levels of UDAs were also taken into account. For example, if a practice was granted growth via additional UDAs by the commissioner, during the 3-year period, then the number of expected patients would also be increased proportionally.
A new patient joined the practice’s capitation list when they attended for an OHA. A patient remained on this list for a period of 3 years unless they attended for NHS treatment elsewhere, except where the patient attended another practice for urgent, referral or charge exempt treatment. In these cases, the patient remained on their host practice list. The 3-year capitation time period was reset at an IC visit or an OHR.
As the treatment needs of the practice population could change over time there was flexibility within the prototype remuneration system, whereby a practice could compensate for lower activity by increasing the number of patients in capitation. This is referred to as the exchange mechanism.
The aim of this analysis was to compare the overall contract performance of prototype practices, with that of non-prototype contracts. Since the metrics used to measure performance in the 2 systems were different, with non-prototype contracts being measured on activity alone, the comparison was made between the overall performance percentages. Practices were typically expected to have delivered between 96% and 100% of their contract, with performance below 96% incurring financial recovery. Under prototype arrangements, financial recovery was capped at 10%, with no additional recovery for performance below 90%. This cap for financially recovery was not available for non-prototype contracts. Performance in excess of 102% was not remunerated under either model.
The data used were obtained from FP17 forms and the appointment system. Capitation was counted by the number of unique patients for whom a band 1, 2 or 3 claim, or OHA or OHR, was made in the previous 36 months. For activity this included the number of UDAs delivered for banded courses of treatments, as well as urgent treatments and Regulation 11 Appliance Replacements.
The activity data were modified further to convert courses of treatment into prototype UDAs, though this varied between the 2 blends. In blend A practices, band 2 treatments attracted 2 UDAs each and band 3 treatments attracted 11 UDAs each. Band 1 treatments in blend A are not counted as this is covered as part of capitation remuneration. In blend B practices, the number of band 3 courses of treatments were counted at 9 UDAs each, with bands 1 and 2 covered under capitation. Under both blends, urgent treatments were counted at 1.2 UDAs each if the patient is in not in capitation, otherwise a practice gains no extra activity for carrying out urgent treatments on patients already on their list. The same principle holds true for charge-exempt treatments, which were valued at 0 to 1.2 UDAs for non-capitated patients. Regulation 11 treatments were counted the same way as band 3s for capitated patients (11 UDAs under blend A and 9 UDAs under blend B) but were worth 12 UDAs for non-capitated patients.
The above metrics of activity and capitation were measured against the respective targets for each practice, which were set out during the baseline year (the year before they joined the programme), using a similar methodology.
When calculating overall performance for prototype practices the financial split between the activity and capitation needed to be considered. The performance for each component was calculated independently before being combined. For the capitation performance, the capitated patients’ figure was simply divided by the capitation target (contractor’s expected capitated population, or CECP).
The activity performance was calculated in 2 steps: the first was by dividing the delivered activity in prototype UDAs by the target (expected minimum activity, or EMA). The second step involved the application of an ‘exchange mechanism’, which prevented practices from over-delivering on activity, in accordance with the programme’s principles of being focused on increased prevention and patient access.
If a practice had over-achieved on capitation, then this mechanism allowed them to also over-deliver on activity, to the same extent, in percentage terms. If a practice’s activity performance was greater than the capitation performance, but both less than 100%, then the activity performance was limited at the percentage of capitation performance. If activity performance was greater than 100% and capitation below 100%, then activity performance was limited to 100%. If both performance percentages were greater than 100%, with activity higher, then activity performance was limited by the capitation performance percentage.
The 2 percentages (capitation and activity) were then multiplied by their respective proportions of the total contract value and combined to give the overall performance figure.
To calculate the performance for non-prototype contracts, the total UDAs delivered were divided by the total number of UDAs contracted using the year-end methodology described in the prevention section. To be included in the sample, contracts had to be paid for by the NHSBSA, have at least 100 contracted UDAs, have a valid UDA contract value (this mitigated the effects of non-high-street contracts on the results). Any contracts associated with DCR practices were also excluded from the sample.
For the purpose of the analysis, and for reasons listed above, contract performance was grouped into the following ways ‘below 90%’, ‘90% to 96%’, ‘96% to 100%’, ‘100% to 102%’ and ‘over 102%’.
Patient charge revenue analysis and financial modelling
Data sources:
- FP17 claims
- NHS contractual payments
Measures: the percentage change in patient charge revenue from baseline in financial year 2014 to 2015 to financial year 2018 to 2019
Patient charge revenue was the sum of received patient charges in a given financial year and included patient charges for treatments by foundation dentists. The measure used patient charge revenue in pounds and as a percentage of gross NHS payments; this therefore factored in any changes in revenue and contract costs due to inflation.
Details about the practices included and adjustments for exiting practices and contract changes and the selection of comparable contracts are described in the section about 36-month patient capitation above.
Appendix 3: prototype patient experience questionnaire items
Q3: How do you feel about the length of time taken to get an appointment?
- It was as soon as was necessary
- It should have been a bit sooner
- It should have been much sooner
Q9: How satisfied are you with the NHS dentistry you received?
- Very satisfied
- Quite satisfied
- Quite dissatisfied
- Very dissatisfied
Appendix 4: non-prototype contract experience questionnaire items
Q9: How do you feel about the length of time taken to get an appointment with the dentist?
- It was as soon as was necessary
- It should have been a bit sooner
- It should have been much sooner
Q10: How satisfied are you with the NHS dentistry you received?
- Completely satisfied
- Fairly satisfied
- Fairly dissatisfied
- Very dissatisfied
Appendix 5: prototype practice monthly survey questions
Q1: Reference number This is the same unique reference number you used when completing the previous collection exercise – open-ended response
Q3: Date of completion (DD/MM/YYYY) – open-ended response
Q4: Name of the person completing this form – open-ended response
Q5: What are the total booked hours spent delivering NHS care for the month? – open-ended response
Q6: How many chairs do you have for your prototype contract? (please type a number)
Q7: How many of the above chairs are in use? (please type a number)
Q8: Please give any additional comments on the reported hours – open-ended response
Q9: Has there been a change in opening hours of the practice in the reporting period?
Q10: Please describe the changes in opening hours by selecting + or - the number of hours increased or decreased. – Monday – change in hours
Q11: Please describe the changes in opening hours by selecting + or - the number of hours increased or decreased. – Tuesday – change in hours
Q12: Please describe the changes in opening hours by selecting + or - the number of hours increased or decreased. – Wednesday – change in hours
Q13: Please describe the changes in opening hours by selecting + or - the number of hours increased or decreased. – Thursday – change in hours
Q14: Please describe the changes in opening hours by selecting + or - the number of hours increased or decreased. – Friday – change in hours
Q15: Please describe the changes in opening hours by selecting + or - the number of hours increased or decreased. – Saturday – change in hours
Q16: Please describe the changes in opening hours by selecting + or - the number of hours increased or decreased. – Sunday – change in hours
Q17: Over the reporting period was the practice accepting new NHS patients? (accepting all categories of patient, or accepting children and exempt only, or not accepting any new NHS patients)
Q18: Over the reporting period was the practice accepting new NHS patients? – not accepting any new NHS patients (what is the reason for this?)
Q19: How many new NHS patients did you see over this (February) reporting period? – open-ended response
Q20: Existing patients: urgent appointments
Q21: Existing patients: appointments (number of weeks) – dentist (OHA)
Q22: Existing patients: appointments (number of weeks) – dentist (OHR)
Q23: Existing patients: appointments (number of weeks) – dentist (interim care management)
Q24: Existing patients: appointments (number of weeks) – therapist (interim care management)
Q25: Existing patients: appointments (number of weeks) – extended role nurse (interim care management)
Q26: Existing patients: appointments (number of weeks) – hygienist (interim care management)
Q27: New NHS patients to the practice: first ever appointment with a dentist for an OHA (number of weeks).If the average waiting time is less than a week, please enter 0. If you are not accepting new patients, please enter 999. – open-ended response
Q28: What is the time (in days) until the 3rd next available appointment for either an OHA or OHR with any dentist? – open-ended response
Q29: Average appointment slot (in minutes) for adults during the reporting period – OHAs
Q30: Average appointment slot (in minutes) for adults during the reporting period – OHRs
Q31: Average appointment slot (in minutes) for children during the reporting period – OHAs
Q32: Average appointment slot (in minutes) for children during the reporting period – OHRs
Q33: Do you carry out any treatment during OHA or OHR appointments?
Q34: In addition to the assessment do you undertake: (please select)
- preventative interventions
- preventative interventions and treatment
- treatment
Q35: Have you extended any recall intervals within this reporting period in order to relieve pressure on the appointment book? If so, please describe the type of appointments and average increase in recall intervals, plus any other information you think would be useful to us.
Q36: Have you extended any recall intervals within this reporting period in order to relieve pressure on the appointment book? If so, please describe the type of appointments and average increase in recall intervals, plus any other information you think would be useful to us: – yes (please describe below)
Q37: Have you done anything else different in this reporting period to ease pressure on the appointment books or have you made any other changes?
Q38: Have you done anything else different in this reporting period to ease pressure on the appointment books or have you made any other changes? – yes (please describe below)
Q39: 1. What methods or systems do you have in place to collect patient feedback at your practice? – we do not have any systems in place
Q39: 2. What methods or systems do you have in place to collect patient feedback at your practice? – patients are able to write to or email the practice
Q39: 3. What methods or systems do you have in place to collect patient feedback at your practice? – active patient forum
Q39: 4. What methods or systems do you have in place to collect patient feedback at your practice? – practice patient questionnaire
Q39: 5. What methods or systems do you have in place to collect patient feedback at your practice? – suggestion or comment boxes
Q39: 6. What methods or systems do you have in place to collect patient feedback at your practice? – other (please describe)
Q41: Have you carried out any patient engagement activity this month?
Q42: Have you carried out any patient engagement activity this month? – yes (please provide further information)
Q43: Are you seeing any change in the level or type of concerns patients are raising in relation to waiting times in this reporting period (February) compared to the previous one (January)?
Q44: Are you seeing any change in the level or type of concerns patients are raising in relation to waiting times in this reporting period (February) compared to the previous one (January)? – other (please specify)
Q45: Have you noticed any common themes from the feedback provided to your practice?
Q46: Have you noticed any common themes from the feedback provided to your practice? – yes (please outline these themes)
Q47: Have you made any changes to the way you run your practice as a result of your patient engagement activity?
Q48: Have you made any changes to the way you run your practice as a result of your patient engagement activity? – yes (please describe these changes)
Q49: Have there been any changes in the way you deliver dental care as a result of your engagement activity?
Q50: Have there been any changes in the way you deliver dental care as a result of your engagement activity? – yes (please provide any details of these changes)
Q51: Are you aware of any issues being raised by carers?
Q52: Are you aware of any issues being raised by carers? – yes (please provide details of how these were raised and what steps have been taken to address these)
Q53: Reflecting on the last month, please provide any feedback on the overall pilot experience – positive
Q54: Reflecting on the last month, please provide any feedback on the overall pilot experience – negative
References
Department of Health, NHS Dental Services in England: An independent review led by Professor Jimmy Steele, 2009.
Dental Contract Reform Pilots Evaluation, 2012.
National Institute for Health and Care Excellence (NICE, 2004) – Dental checks: intervals between oral health reviews. Clinical Guideline (CG19).
NHS Dental Contract: proposals for pilots, December 2010.
Department of Health and Social Care (DHSC; 2018) – Dental Contract Reform: Evaluation of the first year of prototyping 2016-2017. Prepared by Professor Eric Rooney.
Finance and NHS Directorate (2015) – Dental contract reform: prototypes overview document, Department of Health.
Department of Health (2014) – NHS dental contract pilots – learning after first 2 years of piloting, prepared by Professor Jimmy Steele.
Department of Health and Social Care, and others (2014) – guidance – Delivering better oral health: an evidence-based toolkit for prevention
Regulations
SI 2005 No. 3361 – The NHS (General Dental Services Contracts) Regulations 2005.
SI 2005 No. 3373 – The NHS (Personal Dental Services Agreements) Regulations 2005.
SI 2005 No. 3477 – The NHS (Dental Charges) Regulations 2005.
Glossary
Caries
Decay of teeth. Dental caries may be defined as a bacterial disease of calcified tissues of teeth leading to destruction of the tooth tissue.
COT
Course of treatment.
DBOH (delivering better oral health)
Guidance developed by the Department of Health and Social Care, the Welsh Government, the Department of Health Northern Ireland, Public Health England, NHS England and NHS Improvement, seeking to ensure consistent approach across the UK to the prevention of oral disease.
DQOF (Dental Quality and Outcomes Framework)
Quality and outcome measures used in the pilots. The DQOF measures were based around the domains of patient safety, clinical outcomes and patient experience. Originally, there were plans to make adjustments to remuneration based on DQOF performance.
FP17
An electronic form used by performers to submit a claim for NHS dentistry provided in England.
IC (interim care)
Additional appointments where preventative care was provided as part of the clinical care pathway approach. The preventative care was preventive advice (such as advice on teeth brushing and oral hygiene) or a combination of preventive advice and treatment (such as a scale and polish or fluoride varnish).
NICE (National Institute for Health and Care Excellence)
The body that provides national guidance and advice on improving health and social care.
NHSBSA (NHS Business Service Authority)
The body whose dental services division centrally processes NHS dentistry data.
OHA (oral health assessment)
A comprehensive assessment of a patient’s oral health and medical and lifestyle factors that will impact the risk of disease in the future. This occurs for patents at the beginning of the care pathway approach.
OHR (oral health review)
The term used for subsequent assessments of a patient’s oral health and medical and lifestyle factors following their initial OHA.
Periodontal disease
Gum disease. Periodontitis is caused by the host immune response to the accumulation of dental plaque.
RAG (red, amber, green)
Classification used to advise patients of their oral health risk status following OHAs or OHRs.
UDA
Unit of dental activity.