DCMS Sectors Economic Estimates 2019: Trade
Updated 18 March 2022

© Crown copyright 2022
This publication is licensed under the terms of the Open Government Licence v3.0 except where otherwise stated. To view this licence, visit nationalarchives.gov.uk/doc/open-government-licence/version/3 or write to the Information Policy Team, The National Archives, Kew, London TW9 4DU, or email: psi@nationalarchives.gov.uk.
Where we have identified any third party copyright information you will need to obtain permission from the copyright holders concerned.
This publication is available at https://www.gov.uk/government/statistics/dcms-economic-estimates-2019-trade-report/dcms-sectors-economic-estimates-2019-trade
Notice of revision, 18 March 2022
Unscheduled revisions were made to the 2019 exports of goods data on 18 March 2022 as a result of corrections applied to the Overseas Trade in Goods statistics 2015 to 2019 by HMRC. Pre-2019 trade in goods data remain unchanged. Further information on these corrections can be found on the UK Trade Info website.
This release provides the following estimates:
- Exports and imports of goods (up to and including 2019)
- Exports and imports of tourism (exports defined as spending on goods and services by overseas visitors to the UK; and imports defined as spending by UK visitors overseas; again, up to and including 2019)
Exports and imports of services for 2015 to 2019 will be published in early 2021. There will be some minor revisions to this trade in services data up to and including 2018.
Due to the time period covered by this report, we do not expect the results have been significantly impacted by the coronavirus (COVID-19).
These statistics are part of a wider family of DCMS economic statistics (including gross value added, employment, business demographics etc.), which enable stakeholders to evaluate the economic contribution of DCMS sectors, which are not traditional National Account sectors, and to understand how current and future policy interventions can be most effective.
The DCMS sectors covered in this report are:
- Creative Industries
- Cultural Sector
- Digital Sector
- Sport
- Tourism [covered on a separate basis to the other sectors]
Civil Society is not covered in this release, as there are no formally recognised Civil Society imports or exports from the data sources available. Gambling and Telecoms are not included in this release as there are no goods associated with these sectors.
Headline findings
Trade in DCMS Sector (excl. Tourism and Civil Society)[footnote 1][footnote 3] goods in 2019, in current prices, was:
- £29.9billion of goods exports, 8.3% of total UK goods exports
- £53.6 billion of goods imports, 9.8% of total UK goods imports
These are shown in Figure 1 below, which covers exports and imports of goods between 2015 and 2019 (total amounts and as a percentage of total UK goods trade).
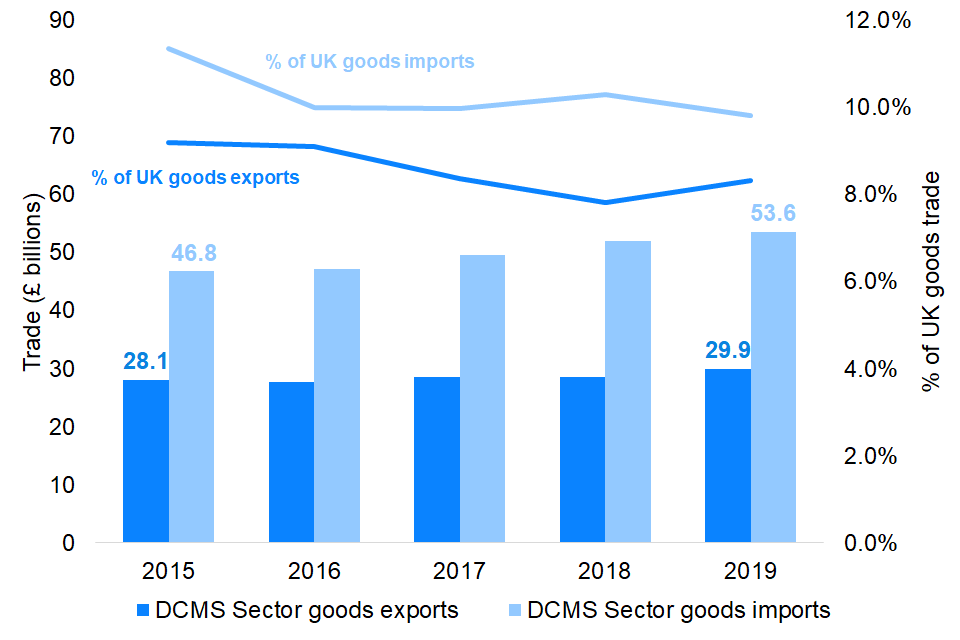
Figure 1: Trade in DCMS Sector (excl. Tourism and Civil Society) goods, as a percentage of the UK total: 2015 to 2019
Figure 1: Trade in DCMS Sector (excl. Tourism and Civil Society) goods, as a percentage of the UK total: 2015 to 2019
- Imports of goods for DCMS sectors have been consistently higher than exports of goods (2015 to 2019).
-
The difference in the proportion of UK total imports and exports accounted for by DCMS sectors (the lines) narrowed between 2018 and 2019 due to a fall, in nominal terms, of the value of UK exports.
- In 2019, £17.4bn (58.1% of the DCMS sector goods exports) were in the Digital Sector, followed by £13.8bn (46.2%) for the Creative Industries.
- In 2019, £43.2bn (80.6% of the DCMS sector total goods imports) were in the Digital Sector, followed by £11.4bn (21.3%) for the Creative Industries.
Readers should note that DCMS sectors are not mutually exclusive.
Trade with the European Union member states and with non-EU countries
- Of the £29.9bn of DCMS Sector goods exported in 2019, £13.9bn (46.4%) were exported to EU countries and £16.0bn (53.6%) were exported to non-EU countries.
- Of the £53.6bn of DCMS Sector goods imported in 2019, £22.9bn (42.7%) were imported to EU countries and £30.7bn (57.3%) were imported to non-EU countries.
Trade with individual countries
In 2019;
- £5.2bn of DCMS Sector goods were exported to the USA (17.4% of total DCMS Sector goods trade exported, by value), £2.9bn of goods were exported to France (9.7% of the DCMS Sector total), and £2.4bn of goods were exported to Ireland (7.9% of the DCMS sector total).
- £13.7 billion of DCMS Sector goods were imported from (mainland) China in 2019, (25.6% of all DCMS Sector goods imports), £7.4bn (13.8%) from the Netherlands, £5.1bn from the USA (9.5%) in 2019
1. Introduction
Code of Practice for Statistics
In June 2019, several publications in the DCMS Sector Economic Estimates series were badged as National Statistics. This affirms that the statistics have met the requirements of the Code of Practice for Statistics. However, badging of individual statistical publications is dependent upon the underlying data sources. DCMS Sector Economic Estimates 2019: Trade uses a mix of official and National Statistics. Specifically:
- The Trade in Goods data are badged as National Statistics
- The Trade in Tourism data are official statistics
- The Trade in Services data are also official statistics
Therefore DCMS Sector Economic Estimates 2019: Trade can be considered as an official statistic. It has been produced to the standards set out in the Code of Practice for Statistics.
Background
Released: 29 October 2020
Revised: 18 March 2020
Geographic Coverage: United Kingdom
This release provides estimates of exports and imports of goods for most DCMS Sectors[footnote 2] in current prices (i.e. not adjusted for inflation). Year on year increases are therefore likely to be higher than the ‘real’ (inflation-adjusted) value. Changes over time are therefore reported here as changes in the proportion of total UK imports and exports.
Estimates for imports and exports of services up to 2018 were published in early 2020, with estimates for 2019 due to be published in early 2021. Statistics for Tourism[footnote 3] are presented separately from the other sectors as they are produced and calculated on different bases. Therefore, Tourism features in a separate chapter. These statistics are further broken down by selected countries, regions and all continents (except Antarctica). Civil Society is excluded from this release due to there being no formally recognised imports or exports from the data sources available.
This report focuses on the latest estimates for Goods and the latest estimates for Tourism. The latest year of estimates is as follows:
- 2019 for Trade in Goods estimates; estimates for DCMS Sector trade in goods were published for 2018 & 2019 for the first time in this report on 29 October 2020. Estimates for exports of goods were revised following revisions to the underlying HMRC data on 18 March 2022.
- 2018 for Trade in Services; estimates for DCMS Sector trade in services were published for 2018 in February 2020. Estimates for 2019, and a more detailed report of Trade in Services, was published on 11 February 2021.
- 2019 for Trade in Tourism. These estimates were originally published as part on the ONS Travel Trends publication in May 2020, but key findings are reproduced here, with greater focus on DCMS and with a greater list of countries, using data from Visit Britain, a DCMS Arm’s Length Body.
Estimates of trade in goods have been constructed from HMRC National Statistics which also use international classification codes (Commodity (or CN) codes)[footnote 4]. They are calculated on a “cross-border” measure of trade. Estimates of trade in services[footnote 5] are constructed from ONS Official Statistics using international classifications (Standard Industrial Classification (SIC) codes). They are based on a change of ownership (balance of payments) measure of trade. As estimates of trade in services and trade in goods are based on different data sources, and calculated on different bases, they are presented as two separate statistics and cannot be added together or directly compared. These principles also apply to geographic breakdowns within the respective series.
Trade estimates for the Tourism sector, based on the latest (2019) International Passenger Survey (IPS) data on Travel Trends. The data looks at spend by overseas visitors to the UK (classed as exports), and also spend by UK visitors overseas (classed as imports). As spend is not disaggregated by spend on goods and services, for the Tourism sector only figures are reported as goods and services combined, and not directly comparable with the other estimates in this publication. As with the goods and services estimates for the other sectors, these statistics are broken down by selected individual countries, regions and continents.
For further information see Annex A and the Quality Assurance report accompanying this report.
Focus on both exports and imports
Although the focus of much trade policy tends to be on exports, both exports and imports are considered here. The reasoning behind including imports is that there is a connection between imports and well-being (imports affect the variety and prices of products and services available to consumers and thereby their living standards).
Changes in this publication
Compared to earlier Trade publications for the DCMS Sectors, there have been several revisions and improvements made to the series.
For Trade in Goods, this year’s data release contains a revised set of commodity codes, following a refresh of the list of codes. In particular, 14 extra codes (8 from 2015, and 6 from 2017) were identified; all of these were for Digital Sector goods, but two codes also spanned the Creative Industries and one also spanned the Culture Sector. This aims to get a better estimate of our sectors. This year’s estimates also include a more complete list of partner countries. Some analysis of adding in the 2015 codes found an impact of around 1-2% on DCMS Sector goods exports and around 5-6% on DCMS Sector goods imports, based on 2015 data.
There have been additional changes to the estimates for trade in goods with the European Union. Companies are not required to report imports or exports of goods from and to EU countries if the total value is below a set threshold (£250,000 for exports; £1.5m from 2014 onwards for imports). Therefore, to get a complete picture of the imports and exports of goods between the UK and EU countries, a ‘below threshold trade average’ (BTTA) needs to be estimated. Previously this was done using trade figures just above the threshold as a basis for those below, and the BTTA estimates were supplied to DCMS at a granularity sufficient for us to produce estimates for the DCMS sectors.
Estimates of BTTA at the high levels of granularity required for DCMS Sectors are no longer supplied, as they have been deemed less robust at these levels. Instead, BTTA estimates are only available at lower levels of granularity, where they are more robust. Analysis carried out by DCMS showed that removing BTTA trade had an impact of around 3.6% on the estimate of exports of DCMS Sector goods; and 5.3% on the estimate of imports of DCMS Sector goods.
Owing to a key DCMS user need of comparability of trade between EU and non-EU countries, a revised BTTA metric has been applied to this publication. This is a DCMS-specific approach and uses all data above the threshold as a way of allocating the more robust, lower-granular BTTA estimates to the DCMS Sector goods. Applying this led to estimates similar to the previous method; the revised method saw estimates 0.2-0.3% higher for exports of DCMS Sector goods, and 0.6-0.7% higher for imports of DCMS Sector goods. We will continue to evaluate this approach over time, and welcome any feedback.
For Trade in Tourism, the International Passenger Survey data series was revised. Statistics in this series cover the period 2014 to 2019 and the data for these years have all been revised. As a result, they are not comparable with statistics published earlier in this series, including 2009-13 data published earlier.
Understanding DCMS sector overlaps
Data is available for each DCMS Sector (excluding Civil Society) and sub-sectors within the Creative Industries, Digital Sector, and Cultural Sector. There is significant overlap between DCMS Sectors so users should be aware that the estimate for “DCMS Sectors Total” is lower than the sum of the individual sectors.
More information can be found in chapter two of the Methodology document accompanying this series.
In summary, the data presented in this report on trade:
- Are based on official and national statistics data sources
- Are based on internationally-harmonised codes, meaning the estimates are:
- Comparable at both a national and international level.
- Comparable over time, allowing trends to be measured and monitored.
- Subject to limitations of the underlying classifications and the extent to which they reflect the current balance and make-up of the UK economy. For example, the SIC codes were developed in 2007 and have not been revised since. Emerging sectors, such as digital trades, are therefore hard-to-capture and may be excluded.
- Represent best estimates of trade by DCMS Sectors. This means:
- Other estimates of trade by DCMS Sectors do exist, but the statistics in this report are best estimates based on the principles of international and year-on-year comparability as described above.
- The statistics in this report are nearly all based on survey data [the exports and imports of goods from non-EU countries is effectively a census of all non-EU trade] and, as with all data from surveys, there will be an associated margin of error[footnote 6].
- This means that for survey data, we cannot say an estimate of, for example, 20% is totally accurate. Our best estimates suggest that the figure is 20%, but due to the degree of error the true figure could perhaps be 18% or 23%.
- This is not an issue with the quality of the data or analysis, rather it is an inherent principle when using survey data to inform estimates.
Feedback
DCMS aims to continuously improve the quality of estimates and better meet user needs. Feedback on this report should be sent to DCMS via email at evidence@dcms.gov.uk.
2. Exports of Goods
This chapter summarises the key facts and trends for the exports of goods in the Creative Industries, Cultural Sector, Digital Sector and Sport. Tourism is covered separately in Chapter 5. There are no formally recognised goods associated with the Civil Society, Telecoms or Gambling sectors in the data sources available.
Figure 2.1: Exports of goods (£bn) by DCMS sector, current prices, 2019
Figure 2.1 shows the breakdown of exports of goods by individual sector. In 2019, the value of goods (in current prices) exported by sector was:
- £17.4bn for the Digital Sector (4.8% of UK goods exports, up from 4.7% in 2018)
- £13.8bn for the Creative Industries (3.8% of UK goods exports, up from 3.7% in 2018)
- £11.1bn for the Cultural Sector (3.1% of UK goods exports, up from 2.9% in 2018)
- £2.0bn for Sport (0.6% of UK goods exports, up from 0.4% in 2018)
Please note that, due to sector overlaps, (e.g. goods that are simultaneously classified as Creative Industries and Culture Sector), the DCMS Sector total (£29.9bn) is not the sum of the individual sectors.
The sector overlaps in the exports of goods is shown in Figure 2.2. The Creative Industries (pink bar) and Culture Sector (purple bars) overlap substantially; almost all of the Culture Sector goods exports come from goods that are also Creative Industries goods. The Digital Sector (orange bar) is smaller; the Digital Sector only overlaps 0.2% of UK goods exports with Culture, and 0.9% with Creative, which indicates that most Digital Sector goods exports come from goods that are not also classified as another DCMS sector.

Figure 2.2: Exports of goods by DCMS Sectors (excl. Tourism and Civil Society) as a percentage of total UK goods exports (%, to 1dp): 2019
*All DCMS Sectors’ here refers to the Creative Industries and the Digital, Cultural and Sport Sectors.
Figure 2.2: Exports of goods by DCMS Sectors (excluding Tourism and Civil Society) as a percentage of total UK goods exports (%, to 1dp): 2019
Changes over time
The increase in the nominal value (i.e., unadjusted for inflation or exchange rates) of DCMS sector goods exports between 2018 and 2019 was largely due to the Crafts and Sport industries, whereas the nominal value of Arts subsector goods fell over the same period.
Trade with individual countries
The five countries that the UK’s DCMS Sectors exported the most goods to by value in 2019 prices are shown in Figure 2.3 below. In 2019:
- £5.2bn of DCMS Sector goods were exported to the USA (17.4% of total DCMS Sector goods exports)
- £2.9bn of DCMS Sector goods were exported to France (9.7% of DCMS Sector goods exports)
- £2.4bn of DCMS Sector goods were exported to Ireland (7.9% of DCMS Sector goods exports)
- £2.3bn of DCMS Sector goods were exported to Switzerland (7.5% of DCMS Sector goods exports)
- £2.1bn of DCMS Sector goods were exported to Germany (7.0% of DCMS Sector goods exports)
This is broadly in line with previous years; USA has consistently been the country that DCMS Sectors export the most goods to. Across the top 5 countries, the Creative Industries and the Digital Sector were the largest exporting DCMS Sectors.
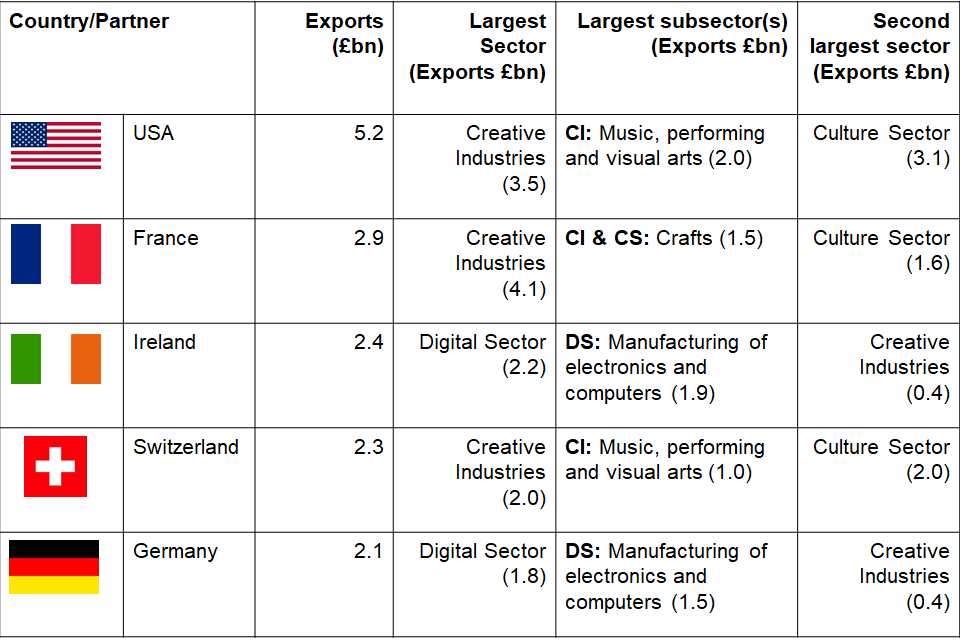
Figure 2.3: Five largest partner countries for DCMS Sector exports of goods: total exports, largest sectors and sub-sectors (2019)
Figure 2.3: Five largest partner countries for DCMS Sector exports of goods: total exports, largest sectors and sub-sectors (2019)
Trade with the European Union and non-European Union countries
Of the £29.9bn of DCMS Sector goods exported in 2019, £13.9bn (46.4%) were exported to EU countries and £16.0bn (53.6%) were exported to non-EU countries. Breaking this down by individual sector, in 2019
- £10.1bn (58.3%) of the Digital Sector goods exports were to EU countries and £7.3bn (41.7%) were to non-EU countries
- £3.9bn (28.3%) of the Creative Industries goods exports were to EU countries and £9.9bn (71.7%) were to non-EU countries
- £2.6bn (23.8%) of the Cultural Sector goods exports were to EU countries and £8.5bn (76.2%) were to non-EU countries
- £1.5bn (73.9%) of the Sport goods exports were to EU countries and £0.5bn (26.1%) were to non-EU countries
3. Imports of Goods
This chapter summarises the key facts and trends for the imports of goods in the Creative Industries, Cultural Sector, Digital Sector and Sport. Tourism is covered separately in Chapter 5. There are no formally recognised goods associated with the Civil Society, Telecoms or Gambling sectors in the data sources available
Figure 3.1: Imports of goods (£bn) by DCMS sector, current prices, 2019
Figure 3.1 shows the breakdown of imports of goods by individual sector. In 2019, the value of goods (in current prices) imported by sector was:
- £43.2bn for the Digital Sector (7.9% of UK goods imports, down from 8.5% in 2018)
- £11.4bn for the Creative Industries (2.1% of UK goods imports, up from 2.0% in 2018)
- £9.8bn for the Cultural Sector (1.8% of UK goods imports, up from 1.7% in 2018)
- £1.4bn for Sport (0.2% of UK goods imports, up from 0.3% in 2018)
Please note that, due to sector overlaps, (e.g. goods that are simultaneously classified as Creative Industries and Cultural Sector), the DCMS Sector total (£53.6bn) is not the sum of the individual sectors.
Changes over time
The value of goods (in current prices) imported by DCMS Sectors increased year on year between 2015 and 2019 (the years for which data is available), however users should be aware that these figures do not take inflation into account, and that the ‘real’ growth may be lower.
As can be seen above, the Digital Sector is the largest and main contributor to the DCMS Sector total. In particular, £40.5bn of ‘Manufacturing of electronics and computers’ subsector goods were imported in 2019 (93.8% of all Digital Sector goods imports) and goods in this sub-sector are the biggest driver of DCMS Sector goods imports performance.
Trade with individual countries
The five countries that the UK has imported the most DCMS Sector goods from, by value in 2019 prices, are shown in Figure 3.2 below. In 2019:
- £13.7bn of DCMS Sector goods were imported from (mainland) China, (25.6% of all DCMS Sector goods imports)
- £7.4bn of DCMS Sector goods were imported from the Netherlands (13.8% of all DCMS Sector goods imports)
- £5.1bn of DCMS Sector goods were imported from the USA (9.5% of all DCMS Sector goods imports)
- £3.4bn of DCMS Sector goods were imported from France (6.3% of all DCMS Sector goods imports)
- £3.3bn of DCMS Sector goods were imported from Germany (6.1% of all DCMS Sector goods imports)
This is broadly consistent with previous years; China is the largest source for DCMS sector goods imports to the UK. In most cases the ‘Manufacturing of electronics and computers’ subsector was the largest source of goods imports. However, with France, Crafts goods were the largest source of DCMS Sector goods imports.
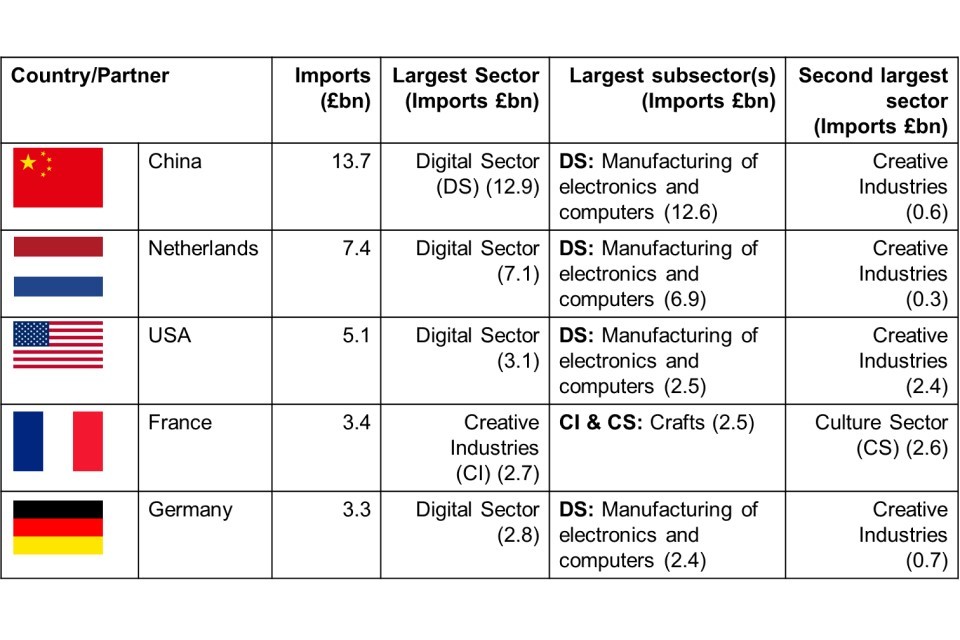
Figure 3.2: Five largest partner countries for the DCMS Sector imports of goods: total imports, largest sectors and sub-sectors (2019)
Trade with the European Union and non-European Union countries
Of the £53.6bn of DCMS Sector goods imported in 2019, £22.9bn (42.7%) were imported from EU countries and £30.7bn (57.3%) were imported from non-EU countries. Breaking this down by individual sector, in 2019:
- £5.4bn (47.8%) of the Creative Industries goods imports were from EU countries and £6.0bn (52.2%) were from non-EU countries
- £4.8bn (48.9%) of the Cultural Sector goods imports were from EU countries and £5.0bn (51.1%) were from non-EU countries
- £18.3bn (42.4%) of the Digital Sector goods imports were from EU countries and £24.9bn (57.6%) were from non-EU countries
- £0.4bn (31.1%) of the Sport goods imports were to EU countries and £0.9bn (68.9%) were from non-EU countries
4. Trade in Services note
We are planning to issue a revised set of Trade in Services statistics from 2015 to 2018. The revisions will include:
- Publishing a fuller set of countries than in previous Trade in Services publications.
- Small modifications in country classifications, following a further clarification in line with the Balance of Payments Vademecum.
Trade in Services estimates for 2019 are not yet available. They are expected to be published in February 2021.
The 2018 Trade in Services estimates are published on gov.uk. These look at imports and exports of services for the DCMS Sectors (excl. Tourism and Civil Society).
5. Trade in Tourism
This chapter details estimates of the value of trade in goods and services combined for Tourism, as well as the proportion of total UK trade in goods and services that is accounted for by Tourism. Estimates are given in current prices (i.e. not adjusted for inflation) and are based on the International Passenger Survey, for which the latest data available are from 2019; the IPS figures, going back to 2014, have been revised for this year and therefore are not directly comparable with earlier editions of this release. Expenditure by overseas tourist visitors to the UK is used as a proxy for exports of goods and services for Tourism. Expenditure by UK residents on their visits abroad is used as a proxy for imports of goods and services for Tourism.
Due to the time period covered by this report, we do not expect the results have been significantly impacted by the coronavirus (COVID-19).
This chapter also looks at the contribution of spending by visitors from the European Union to total UK Tourism exports, and the contribution of spending by UK residents in EU countries to total UK tourism imports.
We also discuss the (top five) countries whose residents spend the most on their visits to the UK, and the (top five) countries where UK residents spend the most on their visits abroad. Readers should bear in mind that we have not produced statistics for all countries (the list is shorter than for goods and services where, for the first time, a de facto full list of countries has been included) so rankings are based on the countries analysed only.
Further breakdowns by country are available from ONS.
Tourism exports
In 2019, the value of exports in the Tourism sector – the spending on both goods and services by overseas visitors to the UK – was £28.4bn. This is a rise of 7.3% on 2018, and similar to the 2017 total (£28.4bn), all measured in current prices (not adjusted for inflation). The 2019 figures is also 21.5% higher in current prices than in 2014, the first year of this revised series. The overall pattern since 2014 can be seen in Figure 5.1 below.
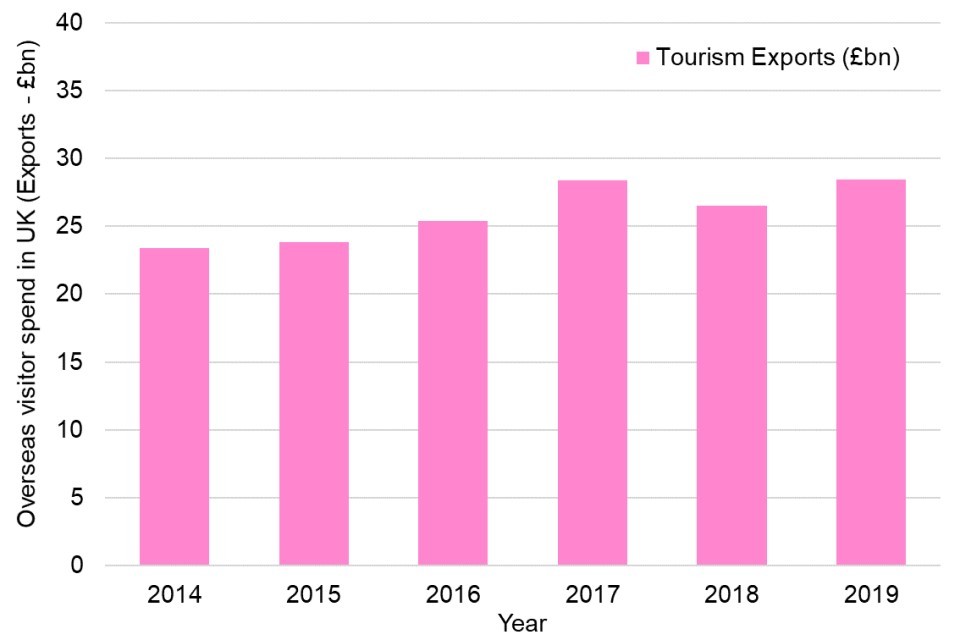
Figure 5.1: Spending by overseas visitors to the UK (Exports of Tourism), £bn: 2014 to 2019
Breakdowns by individual countries
Figure 5.2 shows the top five partner countries for exports of Tourism in 2019; that is to say, it presents estimates of the five countries whose tourists spent the most on goods and services when visiting the UK.
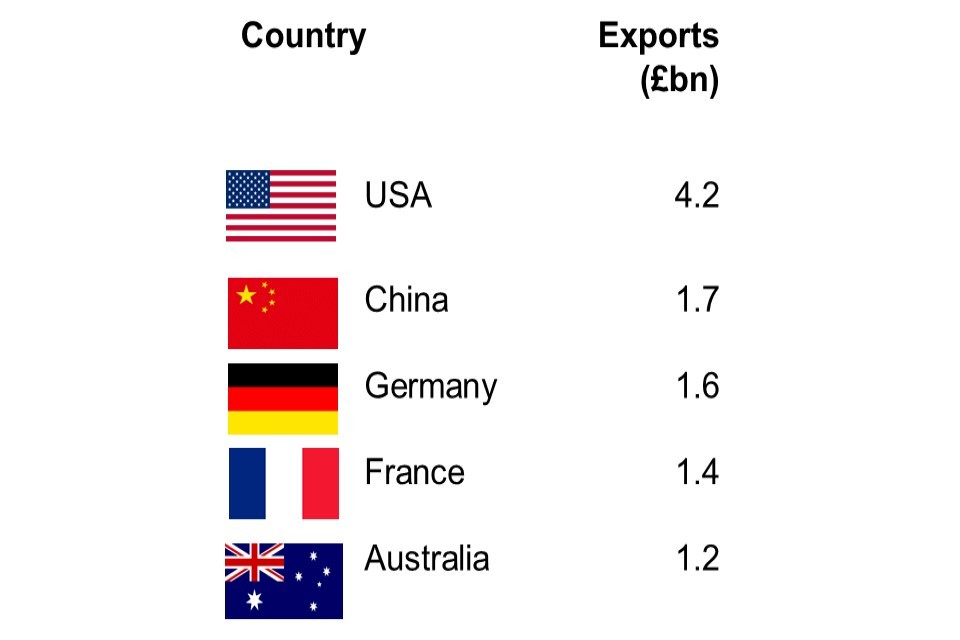
Figure 5.2: Key partners for exports of Tourism: 2019
In terms of individual countries, visitors from the USA spent the highest amount, at £4.2bn (14.7% of total overseas visitor spend in the UK). This is followed by (mainland) China (£1.7bn, 6.0% of the total); Germany (£1.6bn, 5.5%); France (£1.4bn, 4.9%); and Australia (£1.2bn, 4.1%).
The statistics are also broadly similar year-on-year, with the top five remaining the same from 2017 onwards. However, looking at trends since 2014, growth appears to have been faster for non-EU countries included in this analysis compared to EU countries; visitors to the UK from the Gulf states[footnote 7] spent £2.6bn in the UK in 2019, a growth in value of 59.3% in current prices, and China visitor spending (measured in current prices) in the UK grew by 63.7%. This compares to respective growth figures of 7.6% for Germany and 4.1% for France (4.1%). Meanwhile, tourists from Spain – the fifth largest spenders in the UK in 2014 – actually spent 21.0% less than they did in 2014.
Visitors to the UK from EU and non-EU countries
Visitors to the UK from European Union member states spent a total of £10.7bn (37.5%) when visiting the UK in 2019 (Figure 5.3). By contrast, visitors to the UK from non-EU member states spent a total of £17.8bn (62.5%) when visiting the UK in the same year.
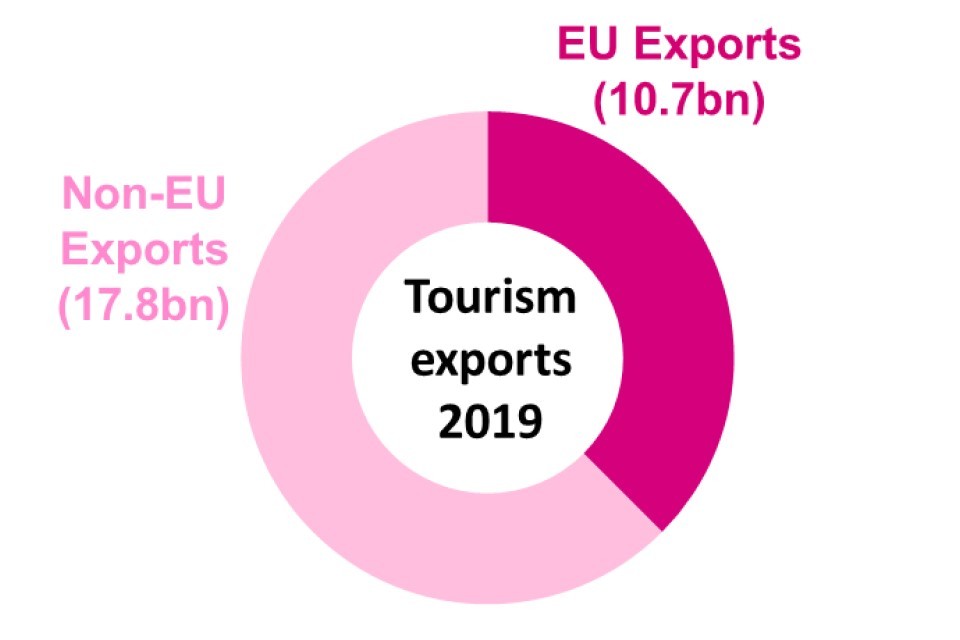
Figure 5.3: EU and non-EU breakdown of exports of Tourism: 2019
Tourism imports
In 2019 the value of imports in the Tourism sector (spending by UK visitors overseas) was £62.3bn. This was a 7.2% rise on the 2018 figure and represents a record high in this series at current prices, and is 44.7% higher than in 2014 (in current prices). The overall trend is shown in Figure 5.4 below.
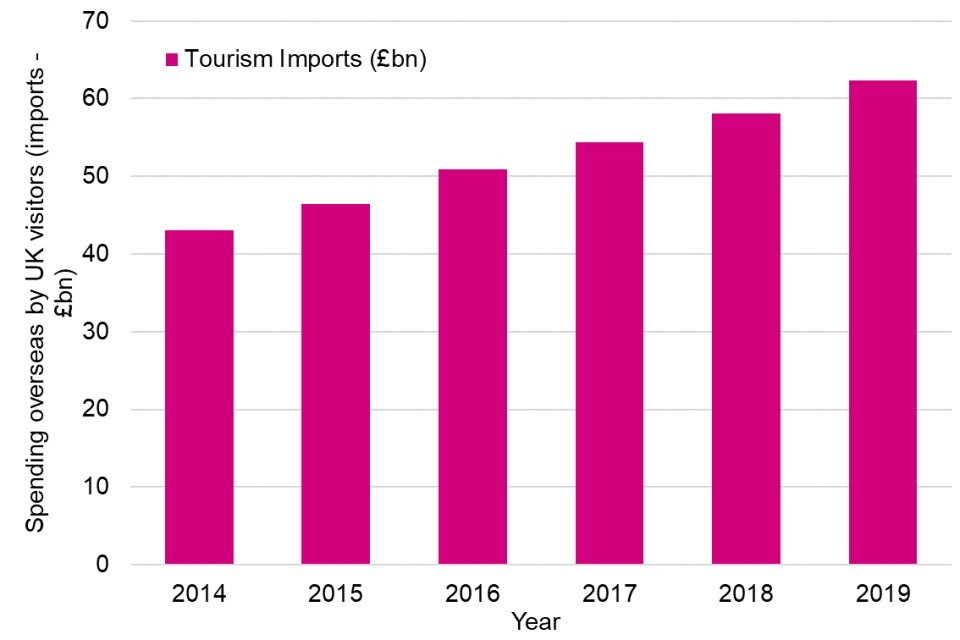
Figure 5.4: Spending by UK visitors overseas (Imports of Tourism), £bn: 2014 to 2019
Breakdowns by individual countries
Figure 5.5 shows the top five partner countries for imports of Tourism; that is to say, it presents estimates of the five countries where UK visitors spent the most on goods and services during their visits during 2019.
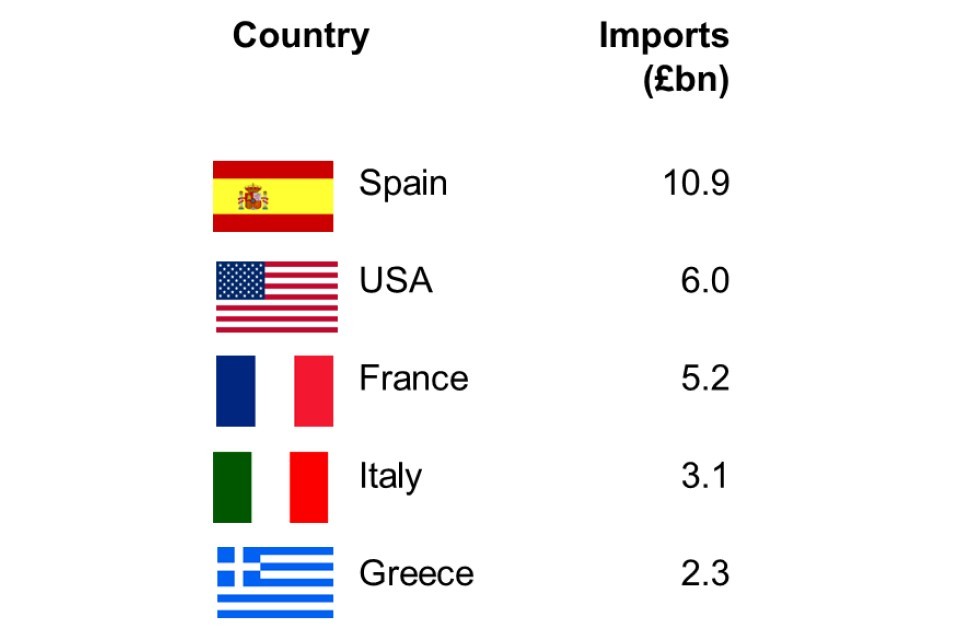
Figure 5.5: Key partners for imports of Tourism: 2019
Breaking down by individual countries, UK visitors spent the most money in Spain – an estimated £10.9bn (17.5% of total UK visitor spending on overseas holidays). This is followed by USA (£6.0bn, 9.6%); France (£5.2bn, 8.4%); Italy (3.1bn, 4.9%) and Greece (£2.3bn, 3.7%).
The statistics are broadly similar to previous years. The top five countries for UK visitor spend have been unchanged from 2016 onwards (when Greece overtook Portugal on the list). Growth has typically been strong through the period, with only the odd exception such as Ireland (grew only 4.1% between 2014 and 2019) and Australia (fell 1.0% 2014 to 2019).
Visitors from the UK to EU and non-EU countries
Additionally, UK visitors to the other European Union member states spent £35.3bn in 2019, 56.7% of total UK visitor spend overseas (Figure 5.6). By contrast, UK visitors to countries not in the EU spent a total of £27.0bn (43.3%) when visiting the UK in the same year.
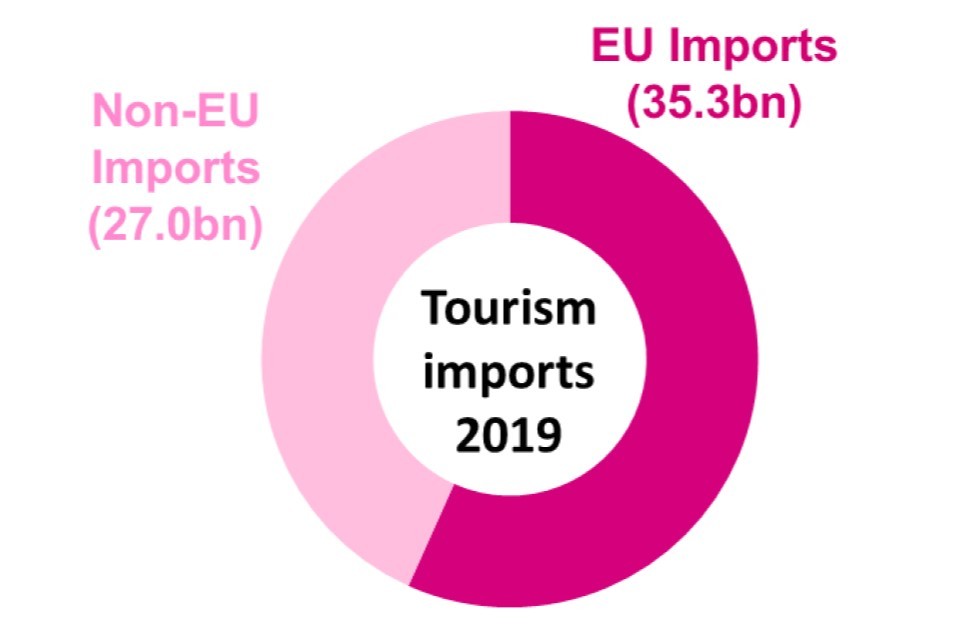
Figure 5.6: EU and non-EU breakdown of imports of Tourism: 2019
6. Next Steps
DCMS has developed a suite of economic estimates which help support policy and understand the economic impact our sectors have on the UK economy.
The next set of publications of DCMS sectors Economic Estimates are:
- DCMS Sector Economic Estimates 2019: Earnings full report (scheduled for November 2020)
- DCMS Sector Economic Estimates 2019: Gross Value Added (scheduled for November 2020)
The final dates will be announced via the DCMS statistical release calendar nearer the time.
Views on this publication are welcomed from users. Responses should be provided to evidence@dcms.gov.uk.
Annex A: Definitions and Limitations
This annex outlines the limitations of the data used within DCMS Sectors Economic Estimates: Trade. Further information is available in the methodology note.
The estimates set out in this report are robust but there are some limitations of which users should be aware:
Data on trade in goods are collected from HMRC’s Intrastat survey (for EU trade) and customs import and export entries (for non-EU trade), which record the movement (for trade purposes) of goods across international borders. As such, the data are gathered under the cross-border principle of trade.
Trade in services data - The estimates of trade in services are based on data from the ONS International Trade in Services (ITIS) dataset. These data are collected via survey and are gathered under the change of ownership principle of trade. The dataset does not provide full coverage of the economy and excluded sectors include: travel and transport; banking and other financial institutions; higher education; and most activities in the legal professions.
Estimates for trade in services estimates are not comparable to estimates of trade in goods as the two are based on different data sources.
Sport - For the purposes of this publication the statistical definition of sport has been used. This incorporates only those 4 digit Standard Industrial Classification (SIC) codes which are -predominately sport (see methodology note Table 2.1). DCMS also publishes estimates of sport based on the EU agreed Vilnius definition. The Vilnius definition is a more comprehensive measure of sport which considers the contribution of sport across a range of industries, for example sport advertising, and sport related construction. The DCMS Sport Satellite Account (SSA), which uses the more comprehensive Vilnius definition has not been included in these estimates. The SSA is based on domestic production and consumption, which is likely to differ from the imports/exports market. As a result, we cannot apply the SSA results to the Trade estimates. However, SSA estimates have been included in DCMS’ Gross Value Added (GVA) estimates, published on 5 February 2020.
Operation of historical sites and similar visitor attractions – It is recognised that, due to the limitations associated with SIC codes, the SIC code used in past publications as a proxy for the Heritage sector (91.03 - Operation of historical sites and building and similar visitor attractions) is likely to be an underestimate of this sector’s value. We have changed the name of the Heritage sector to ‘Operation for historical sites and similar visitor attractions’ to reflect this.
Tourism – estimates of trade in the tourism sector are based on the International Passenger Survey (IPS), which asks tourists to estimate how much they spent on both goods and services on their visits. This report features estimates of Trade in Tourism from 2014 to 2019; these are revised data owing to a revision in the IPS since last year’s publication.
Office for Civil Society - estimates of trade for this sector are not available as there are no formally recognised measures of imports or exports for this sector from the data sources currently available.
Estimates – The trade figures published in this report represent best estimates of trade in DCMS Sectors. Whilst they are based on robust official statistics data sources, they are gathered by means of surveys (with the exception of non-EU goods trade) and therefore are vulnerable to the inherent issues associated with observing a sample of the population rather than the whole population. The figures are therefore our best estimates of trade but have a margin of error.
More details of limitations are available in the methodology note.
Annex B: Further information
- The next update to these statistics will be published in February 2021, with the 2019 Trade in Services statistics.
- The responsible statistician for this release is Wilmah Tawaziwa. For enquiries on this release, please contact Wilmah on evidence@dcms.gov.uk.
- For general enquiries contact:
Department for Digital, Culture, Media and Sport,
100 Parliament Street,
London,
SW1A 2BQ.
Telephone: 020 7211 6000 - DCMS statisticians can be followed on Twitter via @DCMSInsight.
- The DCMS Sectors Economic Estimates: Trade release is an official statistics publication and has been produced to the standards set out in the Code of Practice for Statistics. Details of the pre-release access arrangements for this dataset have been published alongside this release.
-
Gambling, Telecoms and Civil Society sectors have no goods associated with them. ↩
-
Tourism is excluded from the main estimates because it is based on a different methodology, and different data source, to other DCMS Sectors (see further information in Annex A). However, the Trade in Tourism estimates are also presented in this report, separate from the main estimates, for the first time (it had previously been presented separately). ↩ ↩2
-
A definition for each sector is available in the associated methodology note, along with details of methods and data limitations. ↩
-
A by-product of this is that the Services estimates focus on industry (i.e. whether a surveyed business is classified in a DCMS sector industry). As the classification of businesses is based on their primary or main output only, the Services estimates for DCMS Sectors include trade of non-DCMS sector services by DCMS sector businesses, and exclude trade in DCMS Sector services by non-DCMS Sector businesses. ↩
-
The Goods estimates focus on product (i.e. whether a recorded good is a “DCMS Sector” good or not). Like Services, Goods estimates for DCMS Sectors may not be solely confined to DCMS Sector goods businesses (a non-DCMS Sector business may have exported or imported a DCMS Sector product) and vice versa. The Trade in Services data are based on the International Trade in Services (ITIS) dataset. This does not provide full coverage of the economy and excluded sectors include: travel and transport; banking and other financial institutions; higher education; and most activities in the legal professions. ↩
-
Sampling error is the error caused by observing a sample (as in a survey) instead of the whole population (as in a census). While each sample is designed to produce the “best” estimate of the true population value, a number of equal-sized samples covering the population would generally produce varying population estimates. ↩
-
Comprising Bahrain, Iraq, Kuwait, Oman, Qatar, Saudi Arabia and the United Arab Emirates ↩