Annex: comparing wild-type and variant vaccine benefits for autumn 2022
Updated 3 September 2022

© Crown copyright 2022
This publication is licensed under the terms of the Open Government Licence v3.0 except where otherwise stated. To view this licence, visit nationalarchives.gov.uk/doc/open-government-licence/version/3 or write to the Information Policy Team, The National Archives, Kew, London TW9 4DU, or email: psi@nationalarchives.gov.uk.
Where we have identified any third party copyright information you will need to obtain permission from the copyright holders concerned.
This publication is available at https://www.gov.uk/government/publications/covid-19-vaccines-for-autumn-2022-jcvi-advice-15-august-2022/annex-comparing-wild-type-and-variant-vaccine-benefits-for-autumn-2022
This annex is a summary of UK Health Security Agency analysis presented to the Joint Committee on Vaccination and Immunisation.
Introduction and methods
This analysis is to estimate the difference in the prevented number of hospital or intensive care unit (ICU) admissions from use of a variant vaccine compared to wild-type vaccine over the autumn and winter of 2022 to 2023.
The benefits of using a matched booster will depend on the following:
- The hospital or ICU admission rate in the absence of boosting. This can be estimated from rates seen in SARI-Watch (reference 1) over the past 6 months assuming this is related to a waned state in many. We assume a constant risk over autumn and winter 2022 to 2023 as we do not know when a wave may occur.
- The waned vaccine effectiveness (VE) of 3 doses and increase in effectiveness from using a wild type and a variant vaccine. This can be estimated from data on the waned VE of dose 3 and an assumption that a further dose would restore effectiveness to the post dose 3 level (reference 2). For the variant vaccine, to estimate increase in VE, the fold difference in neutralising titres for this vaccine compared to wild type (taken to be about 2) (references 3 and 4) is used and the increase estimated based on the paper of Cromer and others (reference 5).
- The delay to the start of vaccination from using a variant vaccine assuming it would not be available for all those eligible at the start of the programme. It is assumed it may be delayed so that September vaccinations are delayed to 1/3 being given in October, 1/3 in November, and 1/3 in December (1/3, 1/3, 1/3).
- The length of period we make the comparison for. Taken to be 7 months (September to March) on the assumption we are interested in the winter. Note that an October to April scenario would give the same results.
Parameters
Table 1 gives the parameters used.
Table 1: parameters for comparing variant and wild-type vaccination
| Parameter | Value | Source |
|---|---|---|
| Hospital or ICU rate per 100,000 per week by age in the absence of boosting | Age 50-64: hospital 10, ICU 0.75 Age 65-79: hospital 20, ICU 1 Age 80+: hospital 60, ICU 1 |
Reference 1. Note that this is multiplied by 4 for a monthly rate and by 28 for the whole autumn and winter period. |
| The waned VE of 3 doses and increase in effectiveness from using a wild type and a variant vaccine | Waned: hospital 50%, ICU 75% Wild post dose 4: hospital 85%, ICU 93% Variant post dose 4a: hospital 85%, ICU 93% Variant post dose 4b: hospital 88.5%, ICU 95.5% Variant post dose 4c: hospital 92%, ICU 98% |
References 2 and 3. From Cromer figure 3, a line was drawn horizontally from the assumed wild type VE to the correlates line then down to the titre this gives. This titre was then doubled and then a line drawn vertically up to the correlate line and across to a VE. Estimates are approximate as the actual formula for the correlates line was not available. The increase in VE obtained was seen as the maximum (scenario c) with other scenarios being no increase (scenario a) and half the increase (scenario b). Note also that it is assumed that after 3 months the relative effectiveness of 4 doses compared to waned 3 doses reduces by 10% a month bringing it back down towards waned 3-dose effectiveness. |
| Delay to start if using variant vaccine | No delay (100% month 1), or a delay of: no vaccination in month 1 then 1/3 given in each of months 2, 3, 4 (0, 1/3, 1/3, 1/3) | A fixed planning assumption. Note that for ages 50 to 64 years a delay was assumed (the no delay scenario not considered). |
| Length of period | 7 months (for example, September to March) | A fixed planning assumption |
Results
Figure 1 gives an example of applying the parameters to the hospitalisation incidence in the 50 to 64 age group where there is a delay for the variant vaccine and where the variant vaccine has effectiveness at 92% compared to wild type at 85% and no booster at 60%. To get the whole winter incidence the incidence each month is summed.
Figure 1: modelled monthly hospitalisation incidence with no booster (dashed line), with a wild-type vaccine given all in September (dotted line) and with a variant vaccine given with delay (solid line)
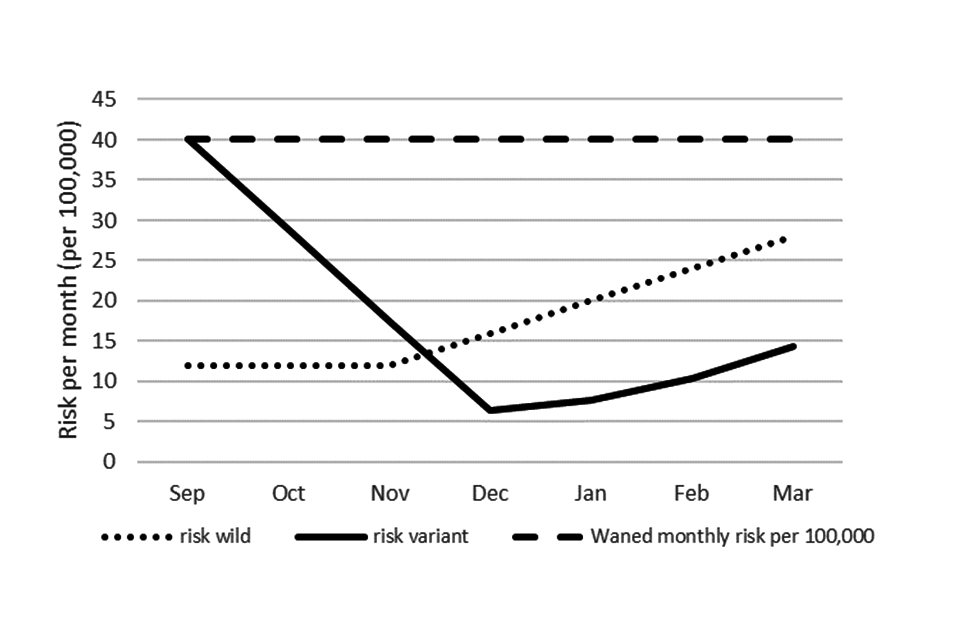
Text description of Figure 1
The figure shows 3 possible scenarios for the upcoming incidence of hospitalisations in 50 to 64 year olds from September 2022 to March 2023.
The first is where no autumn booster is given. This shows a constant monthly incidence of 40 hospitalisations per 100,000 population.
The second scenario is where a wild-type vaccine is introduced in September to all of this age group and shows in those vaccinated the incidence drops to 12 per 100,000 until November and then gradually increases to 28 per 100,00 by March as the vaccine protection wanes.
The final scenario shows a projection for when a variant vaccine is introduced with a delay, and this shows incidence falling from 10 per 100,000 in September to 6.4 per 100,000 in December and then an increase with waning of protection to 14.4 per 100,00 by March 2023.
Table 2a: benefits per 100,000 vaccinated from use of a variant vaccine compared to wild-type vaccine by age, delays and level of increased effectiveness (hospitalisation)
| Age | Delay | No booster risk in 7 months per 100,000 | VE wild and variant | Benefit per 100,000 from a variant vs wild-type vaccine |
|---|---|---|---|---|
| 50-64 | Yes (0, 1/3, 1/3, 1/3) | 280 | 85 and 85 | -29 |
| 50-64 | Yes (0, 1/3, 1/3, 1/3) | 280 | 85 and 88.5 | -15 |
| 50-64 | Yes (0, 1/3, 1/3, 1/3) | 280 | 85 and 92 | -1 |
| 65-74 | None | 560 | 85 and 85 | 0 |
| 65-74 | None | 560 | 85 and 88.5 | 39 |
| 65-74 | None | 560 | 85 and 92 | 78 |
| 65-74 | Yes (0, 1/3, 1/3, 1/3) | 560 | 85 and 85 | -59 |
| 65-74 | Yes (0, 1/3, 1/3, 1/3) | 560 | 85 and 88.5 | -31 |
| 65-74 | Yes (0, 1/3, 1/3, 1/3) | 560 | 85 and 92 | -3 |
| 75+ | None | 1,680 | 85 and 85 | 0 |
| 75+ | None | 1,680 | 85 and 88.5 | 118 |
| 75+ | None | 1,680 | 85 and 92 | 235 |
| 75+ | Yes (0, 1/3, 1/3, 1/3) | 1,680 | 85 and 85 | -176 |
| 75+ | Yes (0, 1/3, 1/3, 1/3) | 1,680 | 85 and 88.5 | -92 |
| 75+ | Yes (0, 1/3, 1/3, 1/3) | 1,680 | 85 and 92 | -8 |
Table 2b: benefits per 100,000 vaccinated from use of a variant vaccine compared to wild-type vaccine by age, delays and level of increased effectiveness (ICU)
| Age | Delay | No booster risk in 7 months per 100,000 | VE (wild and variant) | Benefit per 100,000 from a variant vs wild-type vaccine |
|---|---|---|---|---|
| 50-64 | Yes (0, 1/3, 1/3, 1/3) | 21 | 93 and 93 | -2 |
| 50-64 | Yes (0, 1/3, 1/3, 1/3) | 21 | 93 and 95.5 | 0 |
| 50-64 | Yes (0, 1/3, 1/3, 1/3) | 21 | 93 and 98 | 1 |
| 65-74 | None | 28 | 93 and 93 | 0 |
| 65-74 | None | 28 | 93 and 95.5 | 3 |
| 65-74 | None | 28 | 93 and 98 | 6 |
| 65-74 | Yes (0, 1/3, 1/3, 1/3) | 28 | 93 and 93 | -3 |
| 65-74 | Yes (0, 1/3, 1/3, 1/3) | 28 | 93 and 95.5 | -1 |
| 65-74 | Yes (0, 1/3, 1/3, 1/3) | 28 | 93 and 98 | 1 |
| 75+ | None | 28 | 93 and 93 | 0 |
| 75+ | None | 28 | 93 and 95.5 | 3 |
| 75+ | None | 28 | 93 and 98 | 6 |
| 75+ | Yes (0, 1/3, 1/3, 1/3) | 28 | 93 and 93 | -3 |
| 75+ | Yes (0, 1/3, 1/3, 1/3) | 0 | 93 and 95.5 | -1 |
| 75+ | Yes (0, 1/3, 1/3, 1/3) | 0 | 93 and 98 | 1 |
Comments:
-
if there are delays, they may negate benefits of variant vaccines within the winter period (but some benefit may remain beyond winter)
-
age 65 to 74 years potential benefits of up to approximately 78 per 100,000 vaccinations (1 from 1,280 doses)
-
age 75+ years potential benefits of up to 235 hospitalisations per 100,000 vaccinations (1 from 425 doses)
References
- National flu and COVID-19 surveillance report: 7 July 2022 (week 27), page 44.
- Stowe and others. Effectiveness of COVID-19 vaccines against Omicron and Delta hospitalisation: test negative case-control study.
- Vaccines and Related Biological Products Advisory Committee, 28 June 2022 presentation: mRNA-1273.214 Moderna COVID-19 investigational bivalent vaccine (original + Omicron)
- Vaccines and Related Biological Products Advisory Committee, 28 June 2022 meeting presentation: Pfizer/BioNTech COVID-19 Omicron-modified vaccine options
- Cromer and others. Neutralising antibodies predict protection from severe COVID-19.