Autism self-assessment exercise 2018: overview of results
Updated 20 June 2019

© Crown copyright 2019
This publication is licensed under the terms of the Open Government Licence v3.0 except where otherwise stated. To view this licence, visit nationalarchives.gov.uk/doc/open-government-licence/version/3 or write to the Information Policy Team, The National Archives, Kew, London TW9 4DU, or email: psi@nationalarchives.gov.uk.
Where we have identified any third party copyright information you will need to obtain permission from the copyright holders concerned.
This publication is available at https://www.gov.uk/government/publications/autism-self-assessment-framework-exercise/autism-self-assessment-exercise-2016-executive-summary
1. Completion rate and overall pattern of responses
One hundred and forty one local authorities responded to the 2018 autism self-assessment. This was down slightly from the 145 that responded to the 2016 exercise. In 4 regions, all local authorities responded. More northern regions had higher response rates.
Table 3 shows the number and proportion of authorities responding in each region and the proportion of questions they answered on average. Overall, responding authorities answered 99% of the questions requiring green, amber or red responses, 98% of those requiring yes or no, 85% of the other option questions and 83% of the number questions.
Table 3: Response rates by Region
| Region | Local authorities | Responding | Responding % | Questions answered by responders (%) |
|---|---|---|---|---|
| North East | 12 | 12 | 100% | 95% |
| North West | 23 | 23 | 100% | 91% |
| Yorkshire and The Humber | 15 | 15 | 100% | 92% |
| East Midlands | 9 | 9 | 100% | 94% |
| West Midlands | 14 | 13 | 93% | 89% |
| East of England | 11 | 10 | 91% | 92% |
| London | 33 | 30 | 91% | 93% |
| South East | 19 | 17 | 89% | 88% |
| South West | 16 | 12 | 75% | 90% |
| England | 152 | 141 | 93% | 91% |
2. Consultation
Local authorities were asked to consult widely in developing their local response. The table below shows the list of recommended groups and the proportion of local authorities reporting each having been involved.
Local authority departments of adult social services and children’s services and clinical commissioning groups were almost always involved, though there was some fall off in involvement of departments of children’s services.
Local education departments were involved in 68% of cases, local public health departments in 83% of cases, a rise from 75% in 2016, but Health and Wellbeing boards were only involved in 26% of cases, down from 32%.
Secondary healthcare providers were involved by 73% of responding areas (up from 53%), primary health care providers by 52%.
Of the criminal justice services, the police were the most commonly involved (71% - up from 57%). Involvement of court services and probation were both increased but to only 33% and 50% respectively.
Autistic adults were involved by 65% of responding authorities and informal carers, family and friends of autistic people by 70%, both of these figures were lower than in 2016. Table 4 shows this in more detail.
Table 4. Involvement of recommended groups in the consultation process
| Question | 2018 | 2016 |
|---|---|---|
| Local Authority Adult Social Services (Existing) | 141 (100%) | 145 (100%) |
| Local Authority Department of Children’s Services (Existing) | 129 (91%) | 140 (97%) |
| Local Education Authority (Existing) | 96 (68%) | 100 (69%) |
| Health and Wellbeing Board (Existing) | 37 (26%) | 46 (32%) |
| Local Authority Public Health Department (Existing) | 117 (83%) | 109 (75%) |
| Clinical Commissioning Group (Existing) | 139 (99%) | 139 (96%) |
| Primary Healthcare providers (Existing) | 73 (52%) | 77 (53%) |
| Secondary Healthcare providers (Existing) | 103 (73%) | 94 (65%) |
| Employment Service (Existing) | 97 (69%) | 89 (61%) |
| Business Sector (New) | 17 (12%) | |
| Police (Existing) | 100 (71%) | 83 (57%) |
| Probation Service (Existing) | 70 (50%) | 54 (37%) |
| Court Service (Existing) | 46 (33%) | 41 (28%) |
| Prisons located in the area (New) | 8 (6%) | |
| Local charitable/voluntary/self- advocacy/interest groups (Existing) | 112 (79%) | 126 (87%) |
| Autistic adults (Existing) | 92 (65%) | 114 (79%) |
| Informal carers, family, friends of autistic people (Existing) | 99 (70%) | 119 (82%) |
Sixty-one per cent of responding authorities reported that the response had been discussed with their local autism programme board (not asked in 2016). Ninety-one per cent reported the response had been signed off by the Director of Adult Social Services (up from 87%), 62% by the Director of Public Health (not asked in 2016), 72% by the CCG Chief Operating Officer (up from 67%) and 60% by the local autism programme board (up from 57%). Table 4 gives the full details.
A detailed breakdown of the involvement of each of these types of consultee for each responding local authority can be seen in the ‘Completion’ worksheet of the interactive spreadsheet/dashboard.
3. Overview of findings
The self-assessment exercise brings together the considered and shared perspectives of many hundreds of people, considering a little more than a hundred aspects of the work of more than 140 councils and their various statutory partners. As such it is impossible to give a simple summary of the pattern of progress it shows. Its purpose is to provide evidence about the areas of the Autism Strategy, and the parts of the country in which there seems to have been more or less progress towards meeting the strategic goals.
One way to give an initial overview is to look at the changes in self-rated responses to the ‘movement’ questions, simply coded questions that were asked in both this exercise and the previous one.
The methods section above describes how movement was scored. Table 5 shows an overview of the findings. Numbers in brackets after the section (row) headings indicate the number of comparable questions in the section. The right hand column and the bottom row summarise (respectively) the number of regions for each section, and sections for each region with overall positive and negative movement scores.
Table 5 Overall progress by section and region
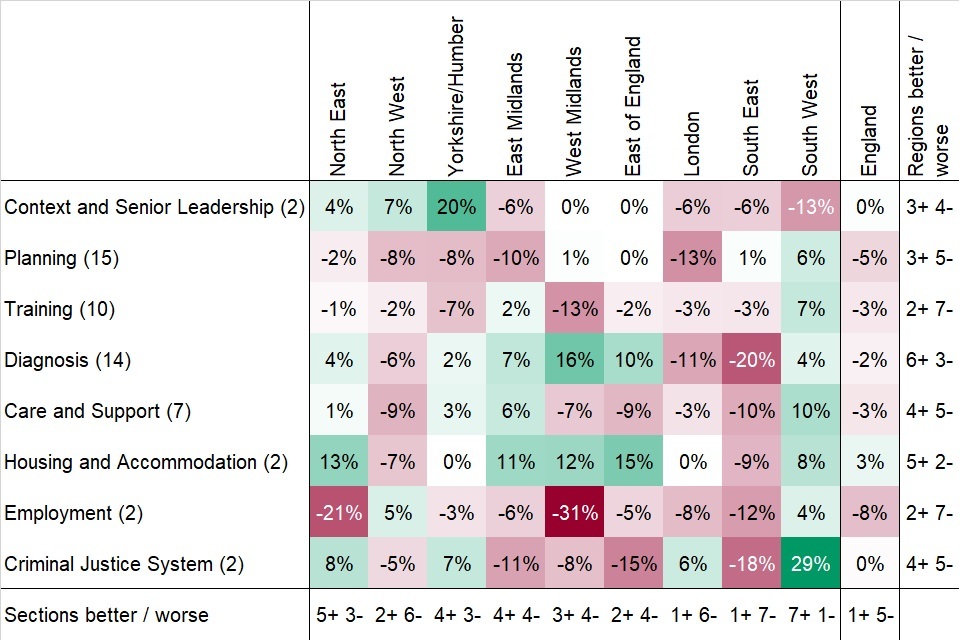
Table 5: overall progress by section and region
For England as a whole, only 1 of the 8 sections of the self-assessment, housing and accommodation, showed overall net positive movement. For this section, 5 regions showed net positive movement, 21 showed net negative movement and 2 showed no net movement.
The sections on employment and planning showed the largest net negative movement. Regionally, the South West showed the largest number of sections with net positive movement (although the South West also had the largest proportion of non-responding authorities), whilst the South East showed the largest number with net negative movement.
Variability between regions was presumably most reliably reported for those sections with larger numbers of questions - planning, training and diagnosis. In the training and planning sections a majority of regions showed net negative movement whilst in the diagnosis section, a majority showed net positive movement.
4. Context and senior leadership
For the purposes of reporting, we have combined the elements of the self-assessment describing the local context (the alignment of the local authority with clinical commissioning groups (CCGs) and the patterns of joint working) with those covering the roles and responsibilities of senior officers.
Planning between health and social care commissioners is simplified when they share common geographic boundaries. 69% of responding authorities reported that in planning services for autistic people they have only to work with a single CCG. 19% reported working with 2 or 3 CCGs and 11% with 4 or more.
Sixty-four per cent of local authorities also reported working with other local authorities in planning services for autistic people. Respondents have identified the local authorities they partner with, in additional comments to this question.
These arrangements commonly reflect former metropolitan county groupings or former county affiliations for new unitary authorities. In London, they commonly reflect local groupings commonly seen in healthcare provision (for example, the City with Hackney, Camden with Islington). In some parts of the country, they are reported as reflecting Transforming Care partnership areas.
The planning section of ‘Think Autism’ and the associated statutory guidance included a number of recommendations and expectations about the planning of services for adults with autism locally. These include:
- the appointment of a joint commissioner or senior manager with lead responsibility for services for adults with autism
- the development of a local commissioning plan for adults with autism based on the Joint Strategic Needs Assessment (JSNA) and other relevant local work
- the improvement of transition planning for young people with autism reaching school leaving age
- the improvement of transition planning and reasonable adjustments to services and support for older adults with autism reaching retirement age to enable them to live independently
The overall national pattern of movement in this section showed no net change. However, this was the resultant of positive movement in the three most northerly regions and negative movement in the three most southerly and the East Midlands.
Table 6 gives some detail about the leading officers assigned to manage the local autism strategy. The proportion of authorities reporting a strategic lead had slightly fallen, the proportion reporting a separate operational autism lead had slightly risen. For the first time, we asked about what proportion of their job these roles constituted for the individuals. Almost half of authorities did not answer this for autism leads. A further third reported that it comprised only 10% of their role (1/10 whole time equivalents) in terms of time allocated.
Respondents were asked about the responsibilities of the joint commissioner/senior manager; answers varied widely. Some suggested a wide vision of the role, leading locally to improve understanding of the needs of autistic people and to ensure that services address them (for example, Cheshire West and Chester). Some stressed the role in making links with local partners, some focused more on developing local policies. Some described a narrower role focussing on service commissioning sometimes also emphasising provider market development.
4.1 Senior officers and time allocated (as whole time equivalents WTEs)
4. How many CCGs relate to your area? (unchanged):
- 2018: 1 CCG: 69%; 2 or 3 CCGs: 19%; 4 or more CCGs 11%; Missing 1%
- 2016: 1 CCG 69%; 2 or 3 CCGs 19%; 4 or more CCGs: 11%; Missing: 1%
5. Are you working with other local authorities? (unchanged):
- 2018: Yes 64%; No 36%; Missing 0%
- 2016: Yes 57%; No 43%; Missing 0%
6. Do you have a designated strategic lead for autistic adult services? (unchanged):
- 2018: Yes 95%; No 5%; Missing 0%
- 2016: Yes 98%; No 2%; Missing 0%
- movement: -4
10. Is the strategic lead also the strategic joint commissioner? (unchanged):
- 2018: Yes 43%; No 45%; Missing 5%
- 2016: Yes 58%; No 41%; Missing 1%
11. How much time (WTEs out of 10) does the Strategic autism lead have? (new):
- 2018: 10 to full time 2%; 2 to 5 WTEs 21%; 1 WTE 36%; Missing 40%
13. How much time (WTEs out of 10) does the joint commissioner/senior manager have? (new):
- 2018: 10 to full time 3%; 2 to 5 WTEs 27%; 1 WTE 42%; Missing 28%
14. Does your area have a separate operational lead for autistic adults? (unchanged):
- 2018: Yes 65%; No 35%; Missing 0%
- 2016: Yes 63%; No 37%; Missing 0%
- movement: +5
5. Planning
The planning section of the self-assessment covers 4 main areas:
- information framework for planning
- involvement of local key stakeholders in planning
- extent of current consideration of the needs of autistic people in a wide range of services for the public
- whether older and younger autistic people’s needs are considered
5.1 Information for planning
Fifty-nine per cent of responding local authorities reported that the needs of autistic people were covered in their JSNA document (question 18), down from 68% in 2016. The proportion rating their performance in this area as ‘amber’, meaning that work is in progress rose from 28% to 33%.
A number of the comments by this group of authorities noted that autism had been a focus in previous years. 68% reported that autistic children’s needs were covered (question 19). This figure was not substantially changed from 2016. 77% reported that their strategic commissioning plan or equivalent covered the needs of autistic people, a fall from 84% in 2016.
Seventy-seven per cent of responding local authorities reported that their information systems gave them some information about the needs and service use of autistic people (question 20) but only 13% reported that this was comprehensive and regularly used. These figures were largely unchanged.
Comments to question 20 showed a very wide range of levels of capability. Some areas reported simply that clinical and social care information systems are capable of recording if a client has autism. Others reported extensive sharing of information between health and social care partners. Many commented directly or indirectly on the lack of clarity about what in relation to autism they should be recording since this no longer figures in statutory returns.
Eighty-seven per cent reported that they collect data on numbers of autistic people known to adult social services (question 21) and 37% reported that they publish more data about autistic people’s needs than is included in their JSNA (question 26). Both of these figures were largely unchanged.
Comments on the question about additional data provide extensive links to examples. Responses to the overall question of how adequate their current data resources are for planning services for autistic people (question 27) suggested councils were a little less satisfied with their position than in 2016.
5.2 Planning strategy and information
8. Is autism included and explicitly covered in your local JSNA? (unchanged):
- 2018: Green 59%; Amber 33%; Red 8%; Missing 1%
- 2016: Green 68%; Amber 28%; Red 3%; Missing 1%
- movement: -16
19. Does your local JSNA cover autistic children/young people (unchanged):
- 2018: Yes 68%; No 31%; Missing 1%
- 2016: Yes 70%; No 30%; Missing 0%
- movement: -3
20. Do you collect data on autistic people referred to/using adult social services (unchanged):
- 2018: Green 13%; Amber 77%; Red 11%; Missing 0%
- 2016: Green 13%; Amber 80%; Red 7%; Missing 0%
- movement: -3
21. Do you collect numbers of autistic people known to adult social services (unchanged):
- 2018: Yes 87%; No 12%; Missing 1%
- 2016: Yes 86%; No 14%; Missing 1%
- movement: +1
25. Does your strategic commissioning plan cover needs of autistic people (modified: clarified):
- 2018: Yes 77%; No 21%; Missing 1%
- 2016: Yes 84%; No 16%; Missing 0%
- movement: -10
26. Do you publish data about autistic people in addition to that in JSNA? (unchanged):
- 2018: Yes 37%; No 62%; Missing 1%
- 2016: Yes 40%; No 59%; Missing 1%
27. How adequate overall is your is data for planning and commissioning (unchanged):
- 2018: Green 2%; Amber or Green 30%; Amber 47%; Red or Amber 21%; Missing 0%
- 2016: Green 4%; Amber/Green 34%; Amber 45%; Red/Amber 14%; Red 1%; Missing 1%
- movement: -15
5.3 The planning community
The planning community was covered by 4 questions. In question 28, 57% of responding authorities reported that CCGs and healthcare providers were fully engaged in planning for and implementing NHS responsibilities in relation to the Autism Strategy in their local area, a slight fall from 2016. Thirty-eight per cent assigned themselves the ‘amber’ rating for this queston, indicating that CCG representatives were participating in the autism partnership board and in regular liaison about implementation.
Question 29 asked about representation of autistic people on the local autism partnership board. This is noted as being modified for clarification but the modification was very slight. The phrase used in 2016 was ‘local autism programme board’. This was replaced with ‘local autism partnership board’ to match the statutory guidance and a reference to the guidance added. 82% reported that there was an active and representative local autism partnership board. This was down from 90% in 2016.
Question 30, a new question asked whether this board had an autistic chair or co-chair - 29% of responding authorities reported that it did. Question 31, an old question, consistently worded from 2013 onwards, asked about the nature of involvement of autistic people and their families and carers in planning.
Fifty-seven per cent of responding authorities reported that at least 1 autistic person and 1 family carer regularly attend the autism partnership board and meaningfully contribute (‘amber’ rating). A further 32% reported that in addition to this, a cross-section of autistic people was meaningfully engaged in the planning and implementation of the autism strategy (‘green’ rating). Compared to 2016, this represented a substantial shift from ‘green’ to ‘amber’ ratings and a slight rise in ‘red’ ratings.
The overall movement score for the question was the second most negative of the whole set. In some cases on this question respondents had assigned themselves a lower rating than the detail provided in the comments seemed to suggest was appropriate. In 1 case, having reported some very substantial steps, the respondent, recording an ‘amber’ rating, noted that some members of the Partnership Board had proposed a ‘red’ rating as the progress fell short of what the Board wanted to achieve. It seems possible that some of the apparent backward movement on this item might reflect increased local aspiration.
5.4 Planning: community questions
28. Are LA & CCG(s) both engaged in planning or implementing the autism strategy (unchanged)
- 2018: Green 57%; Amber 38%; Red 4%; Missing 0%
- 2016: Green 62%; Amber 35%; Red 3%; Missing 0%
- movement: -8
29. Do you have an active & representative local autism partnership board (modified: clarified):
- 2018: Yes 82%; No 17%; Missing 1%
- 2016: Yes 90%; No 10%; Missing 1%
- movement: -12
30. Does your autism partnership board have autistic chair or co-chair (new):
- 2018: Yes 29%; No 62%; Missing 9%
31. How do you engage autistic people and family carers in planning (unchanged):
- 2018: Green 32%; Amber 57%; Red 11%; Missing 0%
- 2016: Green 51%; Amber 41%; Red 8%; Missing 0%
- movement: -24
5.5 The reach of planning
Four questions examined the extent to which reasonable adjustments had been put in place improving access for autistic people to important public services.
For general council services (question 32), there was a slight movement towards reporting a less satisfactory position. This question had one of the largest proportions of respondents rating themselves ‘Red’ (43% of responding authorities, up from 37% in 2016). The proportion giving themselves the highest rating also fell from 10% to 5%.
For NHS services including primary care or GP services, mental health and acute services (question 33), there was little change. For health and social care information and advice services (question 34) there were increases in the proportion rating themselves ‘green’ and the proportion rating themselves ‘red’. For other public services, including colleges and universities, libraries and public transport (question 35 part 1), a higher proportion of respondents reported their position as ‘green’.
A new question (35 part 2) asked if the local authority or its partners were encouraging autistic people to take part in:
- culture and leisure activities
- physical fitness programmes
- private sector services such as shopping
Twenty-five per cent of responding authorities rated themselves ‘green’ indicating a substantial programme of work in this area, 70% rated themselves ‘amber’ indicating that there were a few examples of activities of this type. Comments from authorities rating themselves ‘green’ in this area provided a wide range of examples.
5.6 Planning: reach questions
32. Are general council services reasonably adjusted for autistic people (unchanged):
- 2018: Green 5%; Amber 52%; Red 43%; Missing 1%
- 2016: Green 10%; Amber 54%; Red 37%; Missing 0%
- movement: -8
33. Are your local health services reasonably adjusted for autistic people? (unchanged):
- 2018: Green 15%; Amber 75%; Red 10%; Missing 0%
- 2016: Green 17%; Amber 74%; Red 8%; Missing 1%
- movement: -3
34. Is health or social care information, support or advice reasonably adjusted (unchanged):
- 2018: Green 20%; Amber 71%; Red 9%; Missing 0%
- 2016: Green 17%; Amber 80%; Red 3%; Missing 0%
- movement: -3
35(1). Are other public services reasonably adjusted for autistic people (unchanged):
- 2018: Green 18%; Amber 73%; Red 9%; Missing 0%
- 2016: Green 13%; Amber 76%; Red 8%; Missing 3%
- movement: +4
35(2). Are autistic people encouraged to participate in, for example, culture, leisure, sport (new):
- 2018: Green 25%; Amber 70%; Red 5%; Missing 0%
5.7 The life course, population groups and hate crime
The first question in the group (question 36) asked how well the process of transition from children’s to adult services accommodates autistic people.
The ‘green’ rating reported that this happened automatically, the ‘amber’ rating reported that it was triggered by parental request. Several other aspects of local arrangements are also covered by the rating descriptions. The overview of responses is in Table 10. 35% of responding authorities rated themselves ‘green’ on this (a slight fall) and 62% ‘Amber’ (a slight rise).
Five numeric questions (37 to 41) followed. These were seeking to identify the numbers of autistic children identified in schools in each of the last 4 years of schooling and the number completing transition in the previous year. The reported numbers for individual local areas and regional charts can be found in the accompanying workbook; the overall patterns of the responses are summarised in Chart 1.
More than 90% of responding authorities provided figures for the autistic children in the relevant school years. For comparability, the reported numbers of pupils are shown here as rates per 100,000 children in the population of the areas for the relevant school year. Half of the local figures reported for year 10 pupils lay between 1,053 and 1,891 per 100,000 (this is termed the inter-quartile range or IQR). The middle value (or median) was 1,438. The figures were similar for year 11 (IQR 942 to 1,869, median 1,352). After age 16, in years 12 and 13, the rate of identified autism in those students remaining in school was sharply lower: IQR 531 to 1,180, median 831 in year 12 and IQR 450 to 1,036, median 653 in year 13.
Autistic children appear to be selectively less likely than others to remain in school for sixth form education. The final bar on Chart 1 shows the rate of young people reported as having completed transition in the school year 2017 to 2018. These are shown as a rate per 100,000 population of school year 11 age.
A small number of authorities reported strikingly high numbers in all of these figures. In Chart 1 the bars are truncated so that the detail of the pattern for the majority of areas can be seen in reasonable detail; the maximum reported numbers are shown as annotations on the bars. Figures for the City of London and the Isle of Wight have been omitted from the analysis as the numbers for these areas are too small for reliable analysis.
Chart 1. Rates of autism in pupils in senior school years, and rates completing transition
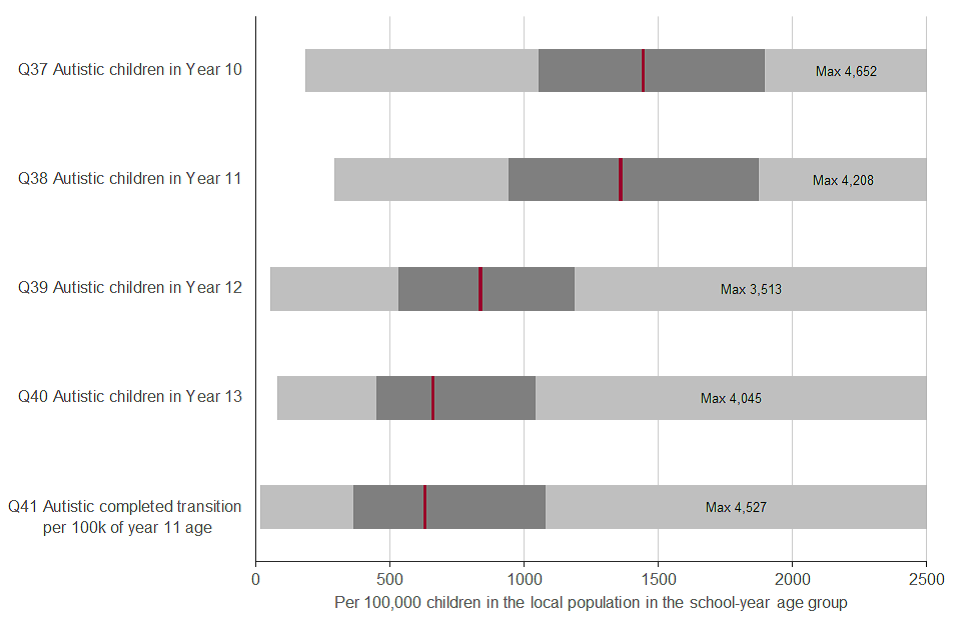
Chart 1: rates of autism in pupils in senior school years, and rates completing transition
A single question (42) asked about planning for autistic older adults. This showed some improvement in 2018 from a relatively weak position in 2016. 73% of responding authorities reported themselves ‘Amber’, up from 69% and 9% as ‘Green’, up from 8%. The number reporting themselves ‘Red’ fell from 23% to 18%.
Question 43 requested narrative comments about how local planning and strategy implementation took into account the needs of autistic women.
Many respondents stressed that planning was person-centred and therefore addressed individuals’ needs, or stated that the gendered needs arising from autism were being considered as part of local strategy development. Several reported the degree of gender imbalance in current service users. A minority specified particular local initiatives. These included a women’s post diagnostic support group, ensuring that autistic women were represented in consultative groups, and appointing local women autism champions. One respondent noted that they had recently been advised there was a lack of understanding of the particular needs of autistic women in services for new mothers.
Question 44 asked for narrative comments about how local planning and implementation of the Autism Strategy took into account the needs of autistic adults in black and minority ethnic communities. Many authorities stated that their local strategies made reference to their local black and minority ethnic communities. A few said they monitored the use of services by autistic people from these communities. A few respondents reported local discussions and awareness raising exercises about autism and mental health issues with important members of minority communities or members of specialist health teams addressing their needs.
Local responses to these narrative questions can be found in the Individual Questions worksheet of the interactive spreadsheet/dashboard.
A final, new question (45) was added at the end of the planning section. This asked whether local hate crime statistics identified autistic people specifically. 6% of responding authorities said this was the case.
A large proportion of respondents reported that this was not possible in their area because statistical reporting of hate crime categorised episodes in wider groupings. Incidents relating to autism would be reported under the ‘disability’ category but it is not possible to identify what proportion of that category they comprise. A number of areas indicated that work had been done text searching the reports of incidents. At least one area reported that their police force was planning to introduce specific reporting of autism in their statistics.
5.8 Planning: life course and hate-crime questions
36. How does CYP to adult service transition accommodate autistic people (modified: more precise):
- 2018: Green 35%; Amber 62%; Red 3%; Missing 0%
- 2016: Green 39%; Amber 59%; Red 1%; Missing 0%
- movement: -5
42. How are autistic older adults considered in planning in your area (unchanged):
- 2018: Green 9%; Amber 73%; Red 18%; Missing 0%
- 2016: Green 8%; Amber 69%; Red 23%; Missing 0%
- movement: +6
45. Do your local hate crime statistics identify autistic people (new)
- 2018: Yes 6%; No 91%; Missing 3%
5.9 Training
The training of staff providing relevant services to adults with autism is one of the 6 areas for which the Autism Act requires guidance to be provided. The original strategy stated that it is important that autism training should be available for everyone working in health or social care.
This goal was restated in ‘Think Autism’ as part of Priority Challenge 4 (‘I want the everyday services that I come into contact with to know how to make reasonable adjustments to include me and accept me as I am. I want the staff who work in them to be aware and accepting of autism.’)
Training should aim to change staff behaviour and attitudes as well as improve knowledge and understanding of autism. The guidance for implementing the strategy covers both general autism awareness training and specialised training for staff in key roles.
There were 14 questions in the Training section. The first (question 46) asked simply if there was a multi-agency training plan in place. 48% of responding authorities reported there was, almost unchanged from 2016. As part of this question, responders were invited to say more about what staff groups and agencies were included in these plans. This produced a strikingly wide range of responses. These can be seen in the ‘Individual Questions’ worksheet of the interactive spreadsheet dashboard.
The next question (47), asked responders to describe briefly the content of training included for staff of different professional groups and levels - 109 responded substantively, though relatively few provided information in the form invited. An exception was Plymouth which gave a very clear outline of their 3-tier approach in its multi-agency context.
Question 48 asked whether autism-awareness training was made available to all staff working in health and social care. This question is noted as having been modified since 2016 to make it more precise. The actual question was unchanged, the modification was simply the addition of a reference to the relevant recommendations in the Statutory Guidance.
In comparison to 2016, fewer respondents rated their authority’s performance ‘amber’; the proportions rating it ‘green’ and ‘red’ both rose. Question 49 followed up by asking whether levels of uptake of training by these staff was monitored. 75% of responding authorities reported that it was, an increase from 66% in 2016. This quesiton had the largest positive movement score.
Question 50 asked for an outline of the scope of staff considered eligible and the agreed frequency of training. The range of staff reported varied widely. Most authorities reported some types of training, often e-learning, were available to a wide range of staff. This was commonly reported as non-mandatory, though in several of these cases this was reported as under review.
Questions 51 and 52 asked for the actual numbers identified as eligible for training and the proportion of these currently up-to-date with training. Omitting the City of London and the Isles of Scilly, as their numbers were too small for useful analysis, 66 authorities (47% of those responding) provided a (non-zero) figure for the number eligible for training, 74 provided a figure for the number who were up-to-date and 59 provided both numbers.
The median numbers of staff considered eligible represented just under 300 per 100,000 of the local authority’s population. The IQR was from 135 to 885 per 100,000. Among the authorities able to provide both numbers in 2018, the median proportion of eligible staff reported as being up-to date with training was 25%, but the IQR for this was wide - from 9% to 57%.
Thirty-four local authorities provided numbers eligible for training in both years; the figure rose in 19 but fell in 13. Numbers up-to-date with training rose in 24 of the 40 authorities giving figures for both years, but fell in 16. Only 29 authorities provided all four figures. In these, 12 reported an increase in training coverage and 17 a decrease.
The accompanying spreadsheet gives values for the proportion of eligible staff up-to-date with training.
Three further questions covered aspects of the content of training. 75% of responding authorities reported that autistic self-advocates and/or family carers were involved in training (question 53), similar to the 77% in 2016.
Comments on ratings for this question provide a wealth of examples of ways this is done. Ratings for question 54 on specific training for staff doing statutory assessments depended not only on the provision of special training, but also uptake of it by relevant staff. This question had the second largest net negative movement. The ‘green’ rating required more than 75% of those in relevant roles to have attended training. Only 21% of responding authorities reported reaching this level, a fall from 28% in 2016. 35% reported their performance ‘amber’, indicating having at least 50% coverage; this was also a fall from 43%. The number reporting their performance ‘red’ (no specific training or below 50% attendance) rose from 28% to 43%.
Question 55 asked about training on the needs of older autistic adults. 12% of responding authorities reported that they provided this, unchanged from 2016. However, in comments added to this question, a substantial number reported that although they did not provide specific courses or modules on autism in older people, their courses did include material on this topic.
5.10 Training: policy and uptake
46. Do you have a multi-agency autism training plan in place (unchanged):
- 2018: Yes 48%; No 52%; Missing 0%
- 2016: Yes 50%; No 50%; Missing 0%
- movement: -2
48. Is autism awareness training for all health or social care staff (modified: more precise):
- 2018: Green 21%; Amber 63%; Red 16%; Missing 0%
- 2016: Green 18%; Amber 71%; Red 10%; Missing 1%
- movement: -1
49. Do you record level of autism training uptake by health /social care staff (modified):
- 2018: Yes 75%; No 24%; Missing 1%
- 2016: Yes 66%; No 32%; Missing 1%
- movement: +15
53. Are autistic self-advocates or family carers involved in training (unchanged):
- 2018: Yes 75%; No 23%; Missing 2%
- 2016: Yes 77%; No 22%; Missing 1%
- movement: -1
54. Is there specific autism training for staff doing statutory assessments (unchanged):
- 2018: Green 21%; Amber 35%; Red 43%; Missing 1%
- 2016: Green 28%; Amber 43%; Red 28%; Missing 1%
- movement: -24
55. Do you have specific training on the needs of autistic older adults (unchanged):
- 2018: Yes 12%; No 88%; Missing 0%
- 2016: Yes 12%; No 88%; Missing 0%
- movement: -1
Four questions in the training section asked about the extent of autism training in the workforce of other statutory agencies.
The first asked whether CCGs ensured that all primary and secondary healthcare providers included autism training as part of their ongoing workforce development. Forty-two per cent of responding authorities reported that their relating CCGs did; this was largely unchanged from 2016.
Comments to this question varied widely from those describing substantial programmes to those indicating CCGs were not working at this. In a number of cases the local Transforming Care Partnership was referenced as organising this. This raises the question of whether they were considering the task narrowly as an element of the work to provide for people who have had, or are at risk of, severe behavioural difficulties, rather than as an aspect of ensuring reasonable adjustments for all healthcare for all autistic people.
The other 3 questions concerned elements of the criminal justice service. All showed falls in the numbers of positive responses - 70% of responding authorities reported that their local police did autism awareness training, down from 81% in 2016, 26% reported this of court service staff, down from 34%, and 43% of probation services, down from 48%.
5.11 Staff training in partner agencies
56. Do CCGs ensure that health providers do workforce autism training (modified: more precise):
- 2018: Yes 42%; No 57%; Missing 1%
- 2016: Yes 43%; No 52%; Missing 4%
- movement: +2
57. Do local police do autism awareness training (unchanged):
- 2018: Yes 70%; No 26%; Missing 1%
- 2016: Yes 81%; No 17%; Missing 2%
- movement: -8
58. Do local court service staff (if any) do autism awareness training (unchanged):
- 2018: Yes 26%; No 66%; Missing 9%
- 2016: Yes 34%; No 48%; Missing 7%
- movement: -14
59. Do local probation staff do autism awareness training (unchanged)
- 2018: Yes 43%; No 47%; Missing 11%
- 2016: Yes 48%; No 46%; Missing 6%
- movement: -4
6. Diagnosis led by the local NHS Commissioner
For many people with autism and their families and carers, having a clear clinical diagnosis of autism is an important step towards leading fulfilling and rewarding lives. A diagnosis can help people understand their own and family members’ reactions and enable the diagnosed person to access services and support. This was considered of sufficient importance to be mentioned in the Autism Act itself.
The first autism strategy, Fulfilling and Rewarding Lives emphasised that a diagnosis is not an end in itself, but should be a part of an integrated set of opportunities to help people understand and accommodate this aspect of themselves. So how the pathway to any required support or further assessment after a person has received a diagnosis is important.
The management of local autism diagnosis pathways is led by NHS commissioners. ‘Fulfilling and Rewarding Lives’ and the accompanying statutory guidance made several recommendations about this process:
- NICE would develop a guideline setting out a model care pathway
- areas should appoint a lead professional to develop diagnostic and assessment services for adults with autism working closely with the specialised commissioning group
- a clear pathway to diagnosis should be in place by 2013
- recognition of an autism diagnosis should be a reason for offering an assessment of social care needs of the individual (under the NHS and Community Care Act 1990) and also the needs of a carer where relevant
- local authorities and health service commissioners should develop clear and accessible information for adults with autism and their families and carers about the diagnostic pathway
The statutory guidance following Think Autism restated this. For health services, it emphasised that post-diagnostic healthcare advice and support should form part of the diagnostic pathway. For local authorities, it emphasised that prompt sharing of information about people newly diagnosed was important and that people should be formally notified of their entitlement to an assessment of their social care needs.
7. Diagnostic services
A clear and trusted diagnostic pathway available locally was one of the ‘service ambitions’ identified in the first self-assessment exercise in 2011.
At that stage only 17% of authorities rated themselves ‘green’, indicating that a clear pathway had been developed locally. A further 62% rated themselves ‘amber’ (plan in progress).
Forty-six per cent rated themselves ‘amber’ to the question: ‘Following diagnosis does the pathway include the healthcare professional informing the adult diagnosed that under the NHS and Community Care Act 1990 LAs have a duty to carry out an assessment?’. The continuing importance of this issue was identified in ‘Think Autism. Priority Challenge 7 stated: ‘I want a timely diagnosis from a trained professional. I want relevant information and support throughout the diagnostic process.’
The questions on diagnosis services can broadly be divided into questions about the service itself and a group of question about the support offered after diagnosis to individuals identified as having autism.
Four of the questions about diagnoses asked for simply coded responses. The first, question 60, was the key question ‘have you got an established local autism diagnostic pathway?’ This question has not changed since 2014. This year no responding authority reported that they did not have a service, down from 2% in 2016 and 2014.
Forty-one per cent of responding authorities reported themselves as having an established diagnosis pathway meeting all the required specifications. This was a noticeable fall from the 54% of responding authorities that rated themselves this way in 2016. The difference was made up by the larger number rating their service as amber rather than ‘green’. The ratings benchmarks are as follows:
Green: a local diagnostic pathway is in place and accessible, GPs are aware and involved in the process. Wait from referral for a diagnosis and initial assessment is less than three months; NICE guidelines are implemented within the model.
Amber: local diagnosis pathway established or in process of implementation or sign-off but unclear referral route. A transparent but out of locality diagnostic pathway is in place. Some NICE guidelines are being applied.
Thirty-two local authorities moved their self-rating from ‘green’ (in 2016) to ‘amber’. The comments from these authorities most commonly reported that the key requirement they could not match was the NICE recommended waiting times. One noted that their diagnosis pathway was commissioned with a standard NHS 18 week referral-to-treatment time and was largely keeping to this.
The second most commonly identified issue was whether diagnostic services catered for people with learning disabilities. A number of large, predominantly rural areas indicated that the available service differed in parts of their area (for example in the need to cross administrative boundaries for assessment).
Overall the comments to question 60 indicate that in many places a substantial amount of careful planning and investment has been put into making diagnostic pathways both efficient and sensitive.
Question 61 asked when the pathway was established. Most responding authorities reported that their diagnostic service had been in place for several years. 48% reported it having existed since before April 2013, a further 27% since before April 2016. Only 3% reported it set up during the current year or anticipated a future date. 13% did not respond to this question.
Question 62 asked how many people had been sent out of area for diagnostic assessments - 31 responding authorities reported sending at least one person out of area, a similar figure to the 30 that did in 2016. In about half of these cases the actual numbers were very small.
Given the wide range of sizes of local authorities it makes sense to consider the number sent out-of-area as a proportion of the total number receiving diagnoses. Unfortunately this sum makes it clear that authorities were inconsistent about whether to include out-of-area diagnoses in the total diagnoses figure supplied in response to question 66 (below). The simplest and most robust way to report this was therefore in very broad groupings.
Numbers of out of area diagnoses are reported in the spreadsheet as a proportion of the sum of the combined total of diagnoses reported in question 66 and the out of area diagnoses reported in Question 62. 105 local authorities provided a figure in 2018, 4 fewer than in 2016; only 83 of these provided a figure in both years.
Of those providing a figure:
- 74% reported no out-of-area diagnoses, slightly down from 82% in 2016
- 5% reported a number that was less than 5% of the combined total described, effectively unchanged from 6% in 2016
- 14% reported a figure between 5% and 50% of the combined total, up from 9%
- 7% reported a figure that was 50% of the combined total or more, up from 4%
Question 63 asked about waiting times - 120 local authorities answered this question, down from 131 in 2016. Waiting times had risen, with the median value this year being 30 weeks (inter-quartile range 13 to 51) compared to 16 weeks (inter-quartile range 7 to 27) in 2016.
Of those able to give a figure, 27% were within the NICE recommended 13-week limit, substantially down from 52% in 2016 - 104 provided waiting figures in both 2016 and 2018. Of these, 24 (23%) reported a fall in average waiting time, 63% reported an increase. The movement score for this question assigned +1 for a fall in average time, -1 for a rise and 0 for no change. This question had the largest negative score.
Question 64 explored local waiting times further in a green-amber-red format, asking when local areas would be able to come within the 3-month limit between referral and the start of assessment recommended by NICE Quality Standard 51:
- 18% of responding authorities rated themselves ‘green’ (already met this standard)
- 18% rated themselves ‘amber’ (should meet the standard sustainably by end of March 2019)
- 62% rated themselves ‘red’ indicating that they could not anticipate reaching this standard by March 2019
These responses marked a substantial decline from 2016 when the numbers selecting corresponding options were 23%, 24% and 46%. Comments about responses to this question mostly documented actions to increase capacity.
The number of people currently waiting for a diagnostic assessment was explored in question 65 - 121 authorities provided a figure, slightly fewer than the 126 that reported this in 2016. The median figure from responding authorities rose from 7.8 per 100,000 population (inter quartile range 2.2 to 16.2) to 25.4 (IQR 10.3 to 43.0). The actual numbers reported show 19% reporting a fall in the number but 45% reporting a doubling or more and 28% reporting a fourfold or greater rise.
Question 66 asked how many people had received a diagnosis of autism in the year to March 2018. This question was worded exactly as in 2016. The numbers receiving a diagnosis had increased considerably.
These numbers are expressed as rates per 100,000 total population in the area - 120 local authorities provided an answer, slightly down from 124 in 2016. The median of the population-based rates for responding authorities was 13.6 (IQR 7.4 to 25.1). This was up from 9.7 (IQR 3.3 to 21.7). 94 local authorities provided usable data in both years. In 63% of these, the number of diagnoses rose, in 35% it was double the 2016 figure or more, and in 17% it had risen by four times or more.
Question 72, ‘How would you describe the local diagnostic pathway, i.e. Integrated with mainstream statutory services with a specialist awareness of autism for diagnosis or a specialist autism specific service?’ tries to clarify whether local services are complying with the recommendation in the NICE Quality Standards referenced above that: ‘The team conducting the assessment for children, young people or adults should be a specialist, integrated autism team with age-appropriate expertise, and should be part of the local autism diagnostic pathway’.
Eighty-one per cent of responding authorities stated that they had a specialist service, an increase from 70% in 2016. Eight respondents made what at first sight appear to be contradictory responses, reporting their services ‘Integrated’ but scoring themselves ‘green’ in response to question 60. The comments indicate that some areas consider it helpful to provide both types of service for individuals with different needs; one uses a mainstream community mental health team as a triage stage.
7.1 Diagnosis service questions
60. Do you have an established autism diagnosis pathway (unchanged):
- 2018: Green 41%; Amber 59%; Missing 0%
- 2016: Green 54%; Amber 43%; Red 2%; Missing 0%
- movement: -13
61. When was your local autism diagnosis pathway put in place (unchanged):
- 2018: Pre Apr 2013 48%; 2013/16 27%; 2016/17 5%; 2017/18 4%; 2018/19 2%; Future date 1%; Missing 13%
64. When will your diagnosis waiting times meet NICE recommendations (unchanged):
- 2018: Green 18%; Amber 18%; Red 62%; Missing 2%
- 2016: Green 23%; Amber 24%; Red 46%; Missing 8%
- movement: -14
72. Is your local diagnostic pathway a specialist service or part of mainstream mental health service (unchanged):
- 2018: Specialist 81%; Integrated 16%; Missing 4%
- 2016: Specialist 70%; Integrated 26%; Missing 3%
- movement: +13
73. Does a positive autism trigger an automatic care assessment offer (unchanged):
- 2018: Yes 36%; No 61%; Missing 3%
- 2016: Yes 48%; No 50%; Missing 3%
- movement: -16
8. Post-Diagnostic services
Question 73 started the subject of what happens after diagnosis - 36% of responding authorities reported that a care assessment was offered automatically on positive diagnosis, a fall from 48% in 2016.
A further series of questions (74 to 81) asked about the availability of:
- post-diagnostic assessments by clinical psychologists
- speech and language therapists
- occupational therapists
- post-diagnostic adjustment support
These questions asked for separate responses about people with and without learning disabilities; for clarity, responses are shown here in a separate table (table 14).
Availability was rated ‘green’ if ‘all services are reasonably adjusted to provide access to post diagnostic specialist assessments. Access to autism-specific services is also available when necessary’.
An ‘amber’ rating denoted they were ‘available everywhere. Mainly reasonably adjusted services, with some access to autism specific services (when necessary) and some generic services.
‘Red’ indicated ‘availability patchy or mainly generic services, with a small number of reasonably adjusted services.’ The final question for which responses are shown in this table asked whether post-diagnostic adjustment support was available. This simply required a yes or no answer. The table shows 2016 results in brackets after the 2018 results for comparison.
Six out of 8 of this group of question showed overall net positive movement scores for England as a whole. Three of the 6 questions with the largest positive net movement scores were in the group.
Table 14: Post diagnostic assessments and adjustment support
Percentages are of responding local authorities; percentages in brackets show the corresponding figure from the 2016 survey.
| Without learning disabilities | Psychology assessment | Speech and language therapy assessment | Occupational therapy assessment | Post diagnostic adjustment support |
|---|---|---|---|---|
| Green | 18% (17%) | 11% (12%) | 17% (12%) | - |
| Amber | 48% (35%) | 32% (28%) | 37% (34%) | - |
| Red | 34% (44%) | 54% (57%) | 45% (50%) | - |
| Yes | - | - | - | 70% (68%) |
| No | - | - | - | 26% (29%) |
| Missing | 1% (3%) | 3% (3%) | 1% (3%) | 4% (3%) |
| Movement | +10 | +0 | +10 | +6 |
| With learning disabilities | Psychology assessment | Speech and language therapy assessment | Occupational therapy assessment | Post diagnostic adjustment support |
|---|---|---|---|---|
| Green | 50% (52%) | 59% (51%) | 52% (51%) | - |
| Amber | 40% (37%) | 29% (35%) | 32% (32%) | - |
| Red | 8% (10%) | 9% (12%) | 12% (15%) | - |
| Yes | - | - | - | 91% (92%) |
| No | - | - | - | 3% (5%) |
| Missing | 2% (1%) | 3% (2%) | 4% (1%) | 6% (3%) |
| Movement | -2 | +10 | +4 | +2 |
A series of questions (67 to 72) asked about progress through the assessment stages that follow a positive diagnostic assessment. Very few local authorities seemed able to answer these - 31 provided partial data but in 24 of these, everyone identified as having been diagnosed was reported as having completed all subsequent assessments and receiving all appropriate interventions. This seems unlikely in a continuously operating system and suggests that the data-flows from which the respondents were working only report at the end of the process.
Six authorities provided answers appearing to show the progression of recently diagnosed individuals through the stages outlined in the question. Their responses are shown in the next table. They show interesting variations but with so few respondents able to provide data, the possible conclusions are limited. One interesting point is that only one reported any individuals who were not considered Care Act eligible.
Table 15. Progress through post-diagnostic assessment in services able to report
| Local authority | Diagnosed (rate) | Getting support | Awaiting support | No support needed | Assessment not complete | Not Care Act Eligible |
|---|---|---|---|---|---|---|
| Nottingham | 367 (111.5) | 32.7% | 4.9% | 54.5% | 7.9% | 0.0% |
| Oldham | 63 (27.0) | 82.5% | 0.0% | 12.7% | 0.0% | 4.8% |
| Rochdale | 96 (43.9) | 74.0% | 18.8% | 7.3% | 0.0% | - |
| Trafford | 37 (15.7) | 64.9% | 10.8% | 24.3% | 0.0% | - |
| Greenwich | 21 (7.4) | 47.6% | 23.8% | 28.6% | 0.0% | - |
| Cambridgeshire | 80 (12.3) | 56.3% | 0.0% | 37.5% | 6.3% | 0.0% |
A final question in this section asked whether local mental health crisis services were available to autistic people without learning disabilities. This question was modified slightly to clarify that it referred to availability to respond to mental health crises. Responses seemed to be more sharply defined than in 2016 with a higher proportion of responding authorities rating themselves ‘green’ or ‘red’ and fewer rating themselves ‘amber’ or not-responding.
8.1 Availability of crisis services
82. Does your local mental health crisis service work for autistic people without learning disabilities (modified: more precise):
- 2018: Green 11%; Amber 62%; Red 24%; Missing 3%
- 2016: Green 7%; Amber 69%; Red 17%; Missing 7% -1
- movement: -1
9. Care and support
Personalisation of social care is an integral part of the 2014 Strategy ‘Think Autism’. Both the strategy and the guidance make a number of recommendations about the care and support autistic adults should receive to live independently and to access mainstream services.
In Priority Challenge 9, ‘Think Autism’ sets out what is required: ‘I want staff in health and social care services to understand that I have autism and how this affects me’. Personalisation is intended to help ensure not only that there is a recognition of people’s individual needs, but that services are configured to meet them.
Question 83 asked the number of adults assessed as being eligible for adult social care services, with a diagnosis of autism and in receipt of a personal budget - 132 local authorities provided an answer to this (down from 144 in 2016). Their answers are presented in the spreadsheet as rates per 100,000 total population.
The mid-point (median) of local authority responses was equivalent to a rate of 32.3 (IQR 17.1 to 53.3), up from 25.8 (IQR 10.6 to 43.0) in 2016. Three out of 132 local authorities reported zero figures, down from 13 out of 144 in 2016 - 116 local authorities provided usable, non-zero figures in both years. Seventy-six (66%) of these showed a rise, 40 a fall.
Questions 84 and 85 asked how many of these did and did not also have learning disabilities. The responses show a surprisingly wide spread. Out of 117 respondents giving numbers that reconciled (the sum of the responses to questions 84 and 85 equalled the response to question 83), the median proportion with a learning disability was 82%, similar to the 85% figure from 2016 (when 108 provided data that reconciled).
However, in 15% of responding authorities, the figure was less than half and in 3it was none, whilst at the other end of the scale, in 10 local authorities all were reported as also having learning disabilities. The following chart shows this distribution with one bar for each of the local authorities providing data which reconciled.
Chart 2. Proportion of autistic people identified as eligible for social care who also have learning disabilities
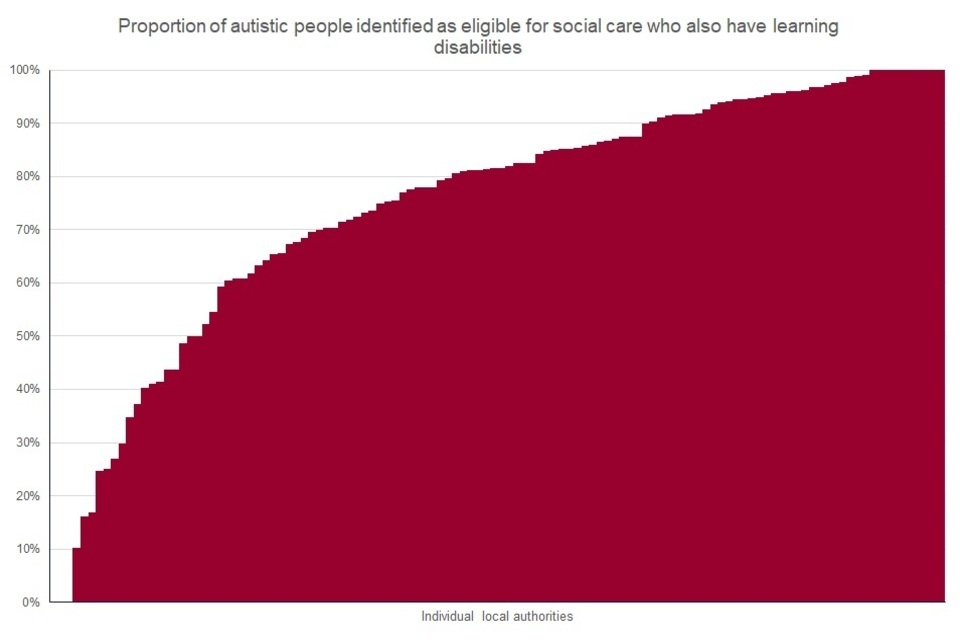
Chart 2: proportion of autistic people identified as eligible for social care who also have learning disabilities
Question 86 explored how easily autistic people could find out about autism-friendly entry points to local services. In the table, this question is noted as being altered because the order in which the options were presented was changed. However, the wording was substantially the same so the results should be comparable. 17% of responding authorities reported having an autism-specific information point, down from 22% in 2016.
This slight downward trend was also seen in questions about:
- the existence of a recognised pathway for autistic people who do not have a learning disability to access a care assessment and other support (question 87) - 77% responded yes, down from 83% in 2016
- provision of information about support opportunities (question 92) 19% rated themselves ‘green’, down from 26%
- the offering of care assessments to carers of autistic people (question 93) 74% rated themselves ‘green’, down from 81%
In several cases, the comments of authorities that had downgraded their rating from 2016 to 2018 indicated that this reflected greater involvement of self-advocates and family carers in the process of determining the ratings.
Responses to 3 other questions in this section were largely unchanged. These were question 88, ensuring autism training for all advocates working with autistic people (42% rated themselves ‘green’, from 45% in 2016), question 89, provision of advocacy for autistic people in relation to assessments and other key events (60% rated themselves ‘green’ from 61% in 2016) and question 91, provision of support options for autistic people not considered eligible for support under the Care act (96% from 95%).
There were 2 new questions in the section. Question 90 asked whether low-level interpersonal/preventive support opportunities were available as recommended in ‘Think Autism’ (para 3.2) - 89% of responding authorities reported it was. A wide range of examples was listed in the comments. This largely reflects the multitude of ways in which low-level support can be provided, although a small number of examples seemed outside the scope of the question.
Question 94 asked whether autistic people or their carers reported difficulty accessing local mental health services after their diagnosis had been made. 74% of responding authorities said this was the case. This yes/no question was unfortunately phrased so that the desirable rating was ‘no’, not ‘yes’. This is noted in the summary section.
9.1 Care and support
86. Do you have a single identifiable information point for all autistic people (modified):
- 2018: Autism-specific 17%; Single 24%; General 57%; Missing 1%
- 2016: Autism-specific 22%; Single 23%; General 54%; Missing 1%
- movement: -8
87. Is there a path for autistic people without LD to get care assessments or support (unchanged):
- 2018: Yes 77%; No 22%; Missing 1%
- 2016: Yes 83%; No 16%; Missing 1%
- movement: -5
88. Are all advocates working with autistic people trained in their specific needs (unchanged):
- 2018: Green 42%; Amber 42%; Red 14%; Missing 2%
- 2016: Green 45%; Amber 43%; Red 12%; Missing 0%
- movement: +2
89. Do autistic adults who need advocacy support get it for key assessments (unchanged)
- 2018: Green 60%; Amber 37%; Red 3%; Missing 1%
- 2016: Green 61%; Amber 37%; Red 3%; Missing 0%
- movement: +2
90. Are there low-level interpersonal/preventive support opportunities (new):
- 2018: Yes 89%; No 8%; Missing 3%
91. Are there support options for autistic people who are not Care Act eligible (modified: more precise)
- 2018: Yes 96%; No 4%; Missing 0%
- 2016: Yes 95%; No 5%; Missing 0%
- movement: +1
92. Is information about support opportunities adequate for autistic people (unchanged):
- 2018: Green 19%; Amber 74%; Red 6%; Missing 1%
- 2016: Green 26%; Amber 70%; Red 3%; Missing 1%
- movement: -12
93. Are carer assessments offered to carers of social care eligible autistic people (modified: more precise - question stem consistent with RAG):
- 2018: Green 74%; Amber 22%; Red 4%; Missing 1%
- 2016: Green 81%; Amber 16%; Red 3%; Missing 0%
- movement: -8
94. Do autistic diagnosees struggle to get mental health services (new):
- 2018: No (desired) 20%; Yes (not desired) 74%; Missing 6%
10. Housing and accommodation
The government aims to enable adults with autism and their families to have greater choice and control over where and how they live. This means that planning of local housing should take into account the needs of adults with autism.
Two questions considered housing and accommodation issues. Question 95 asked whether the local housing strategy and/or market position statement specifically identify autism.
Thirteen per cent of responding authorities, slightly up from 10% in 2016, rated themselves ‘green’ in this area indicating that a comprehensive range of types of housing needs were considered including estimates of numbers of placements required in each category. A further 54% (unchanged) rated themselves ‘amber’ indicating that the housing requirements of autistic people were considered though not to this level.
Question 96 asked whether the council had a policy that social housing providers should have at least one frontline staff member trained in autism to help people make applications and fill in necessary forms - 21% of responding authorities reported they did, unchanged from 2016.
10.1 Housing and accommodation
95. Does your local housing strategy identify needs of autistic people (unchanged);
- 2018: Green 13%; Amber 54%; Red 32%; Missing 1%
- 2016: Green 10%; Amber 54%; Red 36%; Missing 1%
- movement: +6
96. Do your local social housing providers have autism-trained staff (modified: clarified):
- 2018: Yes 21%; No 77%; Missing 2%
- 2016: Yes 21%; No 77%; Missing 2%
- movement: +1
11. Employment
Helping adults with autism into work was a key concern in the 2010 Autism Strategy, ‘Fulfilling and Rewarding Lives’. The guidance emphasised plans for employment as an aspect of effective transition planning. In ‘Think Autism’ the stress laid on the importance of employment opportunities was continued. Priority Challenge 15 stated: ‘I want support to get a job and support from my employer to help me keep it.’
Four questions explored work to support local employment opportunities for autistic people, 2 asked in previous years and 2 new.
Question 97 asked about a range of types of intervention some councils have used. The ‘green’ rating for this question listed a wide range of actions:
- autism included within the council’s employment or worklessness strategy
- a disability employment strategy
- focused autism-trained employment support
- proactive engagement with local employers specifically about employment and retention of autistic people engagement of the local job centre in supporting reasonable adjustments in the workplace via the Access to Work scheme
Twenty-nine per cent of responding councils identified with this level of activity, similar to the 32% in 2016. Sixty-four per cent rated themselves ‘amber’ (up from 58% in 2016) indicating that autism awareness is being delivered to employers on an individual basis, that local employment support services include autism and that some contact has been made with local job centres.
Question 98 asked whether transition to adult services has an employment focus. The stem of this question was slightly modified to clarify that it concerned transition processes for autistic young people but the wording of the guides to self-rating were unchanged.
Thirty-three per cent of responding authorities, down from 42% in 2016, rated their performance ‘green’ indicating that their transition plans included detailed reference to employment, that there was access to further development in relation to individual’s future aspirations and that choice and opportunities were available. Sixty-six per cent rated themselves ‘amber’, up from 57% in 2016, indicating that their transition plans included reference to employment opportunities.
This section had 2 new questions. Question 99 asked about whether at least some tailored support programmes for entry into employment or self-employment locally were specifically commissioned to provide support for young autistic people. The question was presented as a green-amber-red question but the ‘green’ and ‘amber’ response guidelines were identical, indicating that at least some such provision was commissioned as opposed to the ‘red’ response which reported that none was. This made the question a yes or no question and so it has been reported this way - 85% of responding authorities reported they had some provision.
Question 100 asked whether the local authority monitors the employment outcomes of autistic people who have received support or participated in programmes. 63% of responding authorities reported that they did.
11.1 Employment
97. How is employment of autistic people promoted in your area (unchanged):
- 2018: Green 29%; Amber 64%; Red 7%; Missing 0%
- 2016: Green 32%; Amber 58%; Red 9%; Missing 0%
- movement: -8
98. Does transition from school to adult services have an employment focus (modified: clarified):
- 2018: Green 33%; Amber 66%; Red 1%; Missing 0%
- 2016: Green 42%; Amber 57%; Red 1%; Missing 0%
- movement: -13
99. Is (self-) employment tailored support available for autistic people (new):
- 2018: Yes 84%; No 15%; Missing 1%
100. Does the local authority monitor employment outcomes of programmes (new):
- 2018: Yes 63%; No 35%; Missing 2%
11.2 Criminal Justice System
Background
The first Autism Strategy recommended that all staff within the criminal justice sector should have training and access to expertise to enable them to support people with autism. In addition, pathways through the system should be developed to identify other services they may need to work with.
This emphasis on the need for autism awareness in all parts of the Criminal Justice System is restated in’*Think Autism’. Priority Challenge 13 states: ‘If I break the law, I want the Criminal Justice System to think about autism and to know how to work well with other services.’
Two questions explored the local criminal justice system. In Question 101, criminal justice services (police, probation and, if relevant, court services) were said to be optimally involved (‘green’ rating) as key partners in planning for autistic adults by 6% of local authorities, down from 11% in 2016.
This required:
- regular involvement in the autism partnership board
- involvement of autistic people in the development of local criminal justice diversion schemes
- evidence of both joint working (for example alert card schemes) and joint or shared training for staff.
Sixty-four per cent of local authorities, similar to 66% in 2016, rated themselves ‘amber’ for this, indicating that adult social services and criminal justice services were in discussion and that there was at least some representation on the autism partnership board.
‘Appropriate adult’ services, staffed by people with autism awareness training (‘green’ rating) were reported to be available for autistic people in custody suites and nominated places of safety by 28% of responding authorities, up from 23% in 2016. Sixty-seven per cent reported that the service was available but not all the staff had had autism awareness training (‘amber’ rating). Both this and the most unsatisfactory position were self-assigned by a smaller proportion of authorities than in 2016 indicating overall progress.
11.3 Criminal justice services
101. Are Criminal Justice agencies engaged in local planning for autistic adults (unchanged):
- 2018: Green 6%; Amber 64%; Red 29%; Missing 1%
- 2016: Green 11%; Amber 66%; Red 22%; Missing 1%
- movement: -10
102. Is there an Appropriate Adult service for autistic people in custody suites (unchanged):
- 2018: Green 28%; Amber 67%; Red 4%; Missing 1%
- 2016: Green 23%; Amber 70%; Red 5%; Missing 2%
- movement: +9