Public opinion shifts behind our house building plans
In a dramatic shift in public opinion, a new survey shows a 19% surge in the number of people who support homes being built in their area.

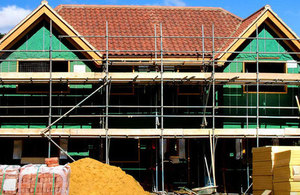
building site
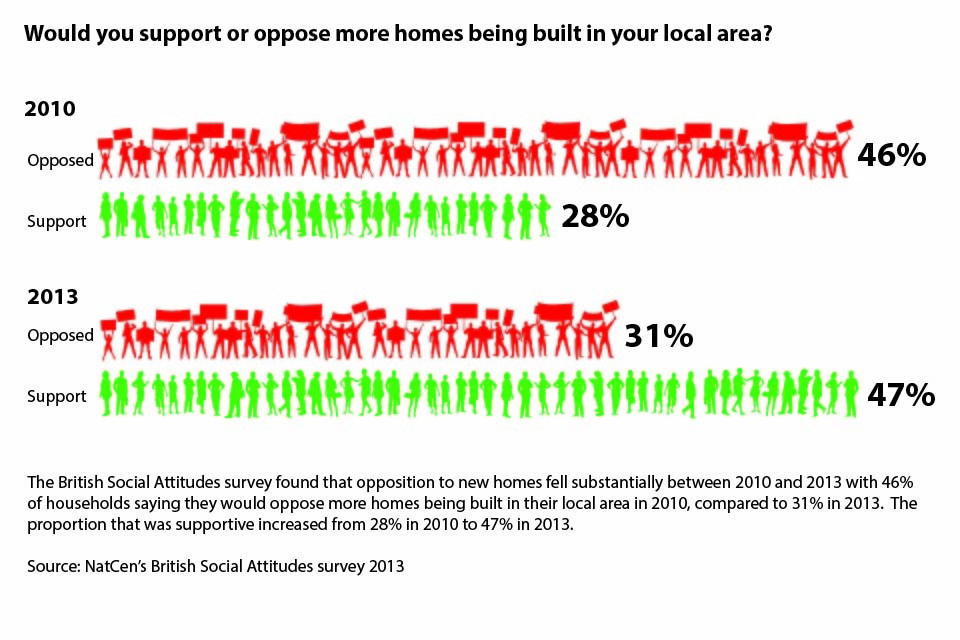
The British Social Attitudes survey reveals that between 2010 and 2013 those in favour of house building in their area rose from 28% to 47% and those opposed fell 15 percentage points from 46% in 2010 to 31% in 2013.
Housing Minister Brandon Lewis hailed the results as evidence that the government’s localist reforms of planning and housing had made this possible.
The majority of people (63%) agreed that greater local control and say over the planning system would make them more supportive of new homes.
Opposition fell most markedly among those living in country villages (51% to 21%), small cities and towns (45% to 34%).
The government has reformed planning so it can deliver the homes people want and need, by working with, not against, local communities. It has abolished top down housing targets that built widespread local resentment; it is prioritising locally led development on brownfield land; neighbourhood plans are being developed in over a thousand communities; and £2.2 billion of New Homes Bonus has rewarded communities for building new homes.
This shift in public opinion is being matched by improvements on the ground. Planning reforms and a new locally-led planning process are delivering real results and speeding up the system.
Since April 2010 more than 445,000 new homes have been delivered. Planning permission was granted for 216,000 new homes in England in 2013 to 2014. New orders in residential construction have risen to their highest level since 2007 to 2008. While housing starts in England are at their highest since 2007.
Housing Minister Brandon Lewis said:
Since 2010 there has been a dramatic swing in public opinion about house building. Now that local people have a bigger say over where new housing goes they are much happier to support house building in their area.
This is in stark contrast to the top down targets that imposed developments on people and pitted developer against community in a way that fuelled local resentment and brought house building to a near standstill.
The following infographic illustrates how opposition to new homes fell between 2010 and 2013.

Infographic showing that according to the British Social Attitudes survey 2013, opposition to new homes fell substantially between 2010 and 2013 with 46% of households saying they would oppose more homes being built in their local area in 2010, compared t
Other findings include:
- the proportion of respondents stating they would strongly oppose new homes being built in their local area almost halved from 15% in 2010 to 8% in 2013
- the proportion of respondents who said they would strongly support new homes more than doubled from 5% to 11%
- opposition fell across all age, tenure and income subgroups and among respondents living in different types of areas
- since 2010, opposition to housing has fallen most amongst aged 65 and over, where it fell from 52% in 2010 to 30% in 2013
- among the highest income quartile opposition fell from 49% to 33%
- the public has given its backing for policies such as the New Homes Bonus; when asked if “government provided local councils with more money to spend on local services for every new home built”, almost half (47%) said this would make them more supportive
- 38% agreed that support for new homes being built in their local area “depended on their design”; 48% agreed that “properties built in the last decade were better or much better designed, in terms of their external appearance, compared to those built around 20 or 30 years ago”; 27% thought design was worse or much worse
- 82% agreed “there is a shortage of homes that are affordable to buy in England”, with 73% agreeing there is a shortage “in my local area”
- 40% agreed “building more homes would improve the affordability of housing in my local area” while 55% agreed that homes “would continue to be unaffordable in my local area even if new homes are built”
Further information
- the number of first-time buyers is at its highest since 2007 (source: Halifax)
- repossessions are at their lowest since 2007 (source: Council for Mortgage Lenders) the number of new mortgage arrears is at the lowest since the Bank of England’s data series began in 2007.
- new home registrations rose by 30% in 2013 in England, the highest since 2007; and are up 60% in London, the highest for over 2 decades (source: NHBC)
- more council housing was started in London last year than in the 13 years combined of the last Labour government (source: DCLG)
- the number of empty homes in England have fallen to a 10-year low, and the number of long-term vacant properties has fallen by around a third since 2009 (source: DCLG)
- over 170,000 affordable homes have been delivered in England since April 2010; our Affordable Homes Programme will deliver 170,000 homes over the current spending review period (2011 to 2015), levering in £19.5 billion of public and private funding
A locally-led planning system
The government abolished the unpopular and ineffective Regional Strategies. Instead, the Duty to Co-Operate introduced by the Localism Act requires local authorities and other public bodies to work together constructively, actively and on an on-going basis when they are planning for strategic cross-boundary matters in their Local Plans.
The National Planning Policy Framework replaced over 1,000 pages of national policy to around 50, written simply and clearly. The planning guidance review streamlined planning guidance and reduced it from over 7,000 pages to a simple accessible online guide. This has made the planning system more accessible to local residents, local firms and local councillors, rather than it being the preserve of lawyers, non-governmental organisations, and town hall officials.
We have safeguarded national Green Belt protection and other important environmental designations, and given councils new powers to protect assets of community value, prevent unwanted garden grabbing and safeguard valuable green open spaces. The level of Green Belt development (land changing to residential use in the Green Belt) is at its lowest rate since modern records began in 1989.
Neighbourhood planning was introduced through the Localism Act, devolving down planning power to local people and helping them play a much stronger role in shaping their areas. Neighbourhood planning is proving very popular and over 1,000 communities have now applied for a neighbourhood area to be designated and 17 neighbourhood plans have passed referendum (with an average turn-out of 32% and an average ‘yes’ vote of 87%). Eleven of these plans are now fully in force, forming part of the statutory local plan, and giving communities real power to shape planning decisions.
The coalition government introduced the New Homes Bonus, which rewards housing growth through grants based on the Council Tax raised from additional homes and long-term empty homes brought into use. To date, over £2.2 billion of New Homes Bonus has been given to local councils. This has ensured that growing areas have had resources to meet the needs of new and existing communities. Local neighbourhoods with a neighbourhood plan will also benefit directly from the Community Infrastructure Levy.
The Local Plan making process was overhauled through the Localism Act. These reforms simplified plan-making, giving local authorities more choice in how they developed their Local Plans, and ensured that plan-making is more transparent. They also made clear that a planning inspector may only propose modifications to a Local Plan where requested to do so by the local authority, underscoring this government’s commitment to localism in practice.
Six years after the 2004 Planning Act, by May 2010, only 1 in 6 local authorities had an adopted core strategy. Now, some 79% of local planning authorities had published a draft Local Plan by 30 April this year.
Members of the public can undertake their own analysis of the housing module data, including generating charts, by using the British Social Attitudes Information System.
The full dataset of the entire survey will also be available to download from the UK Data Archive.
Office address and general enquiries
2 Marsham StreetLondon
SW1P 4DF
Contact form https://www.gov.uk/gui...
General enquiries: please use this number if you are a member of the public 030 3444 0000
If your enquiry is related to COVID-19 please check our guidance page first before you contact us - https://www.gov.uk/guidance/coronavirus-covid-19-guidance-for-local-government.
If you still need to contact us please use the contact form above to get in touch, because of coronavirus (COVID-19). If you send it by post it will not receive a reply within normal timescale.
Media enquiries
Email newsdesk@communities.gov.uk
Please use this number if you are a journalist wishing to speak to Press Office 0303 444 1209