Evidence note
Updated 24 June 2021

© Crown copyright 2021
This publication is licensed under the terms of the Open Government Licence v3.0 except where otherwise stated. To view this licence, visit nationalarchives.gov.uk/doc/open-government-licence/version/3 or write to the Information Policy Team, The National Archives, Kew, London TW9 4DU, or email: psi@nationalarchives.gov.uk.
Where we have identified any third party copyright information you will need to obtain permission from the copyright holders concerned.
This publication is available at https://www.gov.uk/government/consultations/total-restriction-of-online-advertising-for-products-high-in-fat-sugar-and-salt-hfss/evidence-note
Executive summary
From 18 March 2019 to 10 June 2019, the Department of Health and Social Care (DHSC) and the Department for Digital, Culture, Media and Sport (DCMS) held an open consultation on introducing further advertising restrictions on TV and online for high fat, sugar and salt (HFSS) products and published an accompanying impact assessment. On 27 July 2020, the UK government published a new obesity strategy 'Tackling obesity: empowering adults and children to live healthier lives' and committed to 2 things:
- to introduce a 9pm watershed for advertising HFSS products on TV
- to explore how the government could go further than a watershed online and consult on how the government would introduce a total ban of HFSS adverts online
The aim of this consultation is to gather and update evidence to help the government understand the impacts of a total ban of HFSS adverts online as well as how it would be implemented. The results of this consultation will help inform the government's final chosen policy for further online restrictions.
This evidence note outlines the cost and benefit of applying a total ban of HFSS adverts online and compares these with the watershed restriction proposed in 2019.
The methodology for restrictions on an online platform has been updated since the 2019 consultation stage impact assessment (IA); for all other impacts you should refer to the previous IA. As per government process this approach has been discussed with the Regulatory Policy Committee, and they are content with this approach to assess the impacts of the policy. They will review the final impact assessment following this consultation.
Options being considered
- option 0: do nothing option
- option 1: total ban for advertising HFSS products online
- option 2: 9pm watershed for advertising HFSS products online
Given the purpose of this consultation is to understand the impacts of a total ban online, this is presented as the preferred option in this assessment.
Costs and benefits for option 0
Under this option, there would be no additional regulation. This is the scenario that all other options are compared against. No costs or benefits have been monetised under this option.
Costs and benefits for option 1
The main categories of costs over the appraisal period are:
- transition costs of £4.2 million associated with familiarisation with the new regulations
- an estimated £4.6 billion lost revenue for online platforms
- £66 million lost revenue for advertising agencies
- a £27.5 million reduction in profits for retailers and manufacturers of HFSS products
The health benefits to the cohort of children from option 1 over the appraisal period are estimated to be:
- 127,000 Quality Adjusted Life Years, or a present value of £2.9 billion when monetised
- additional benefits to the government from NHS savings, estimated to be worth around £62 million
- social care savings of £49 million
- an additional £149 million of economic output through additional labour force participation which is delivered from reduced premature mortality
Additional benefits to businesses over the appraisal period include:
- a gain of £879 million in advertising cost savings for HFSS retailers and manufacturers
- a gain of £3.7 billion in additional revenue due to HFSS advertising being displaced from online to other forms of media
Costs and benefits for option 2
The main categories of costs over the appraisal period are:
- transition costs of £4.2 million associated with familiarisation with the new regulations
- an estimated £4.4 billion lost advertising revenue for online platforms
- £63 million lost revenue for advertising agencies
- a £20.3 million reduction in profits for retailers and manufacturers of HFSS products
The health benefits to the cohort of children from option 2 over the appraisal period are estimated to be:
- 93,000 Quality Adjusted Life Years, or a present value of £2.1 billion when monetised
- additional benefits to the government from NHS savings, estimated to be worth around £46 million
- social care savings of £36 million
- an additional £109 million of economic output through additional labour force participation which is delivered from reduced premature mortality
Additional benefits to businesses over the appraisal period include:
- a gain of £840 million in advertising cost savings for HFSS retailers and manufacturers
- a gain of £3.6 billion in additional revenue due to HFSS advertising being displaced from online to other forms of media
Costs and benefits to online platforms, advertising agencies and other forms of media have been appraised over 25 years. Costs to manufacturers and retailers have been appraised over 100 years. All health benefits have been appraised over 100 years.
Summary of costs and benefits
The table below outlines the expected impacts of the different policy options over the 25-year appraisal period with health benefits appraised over a 100-year period. Option 0 represents the do-nothing option against which the other options are compared. As such, the costs and benefits of this option are zero.
These estimates below only present the monetised costs and benefits at present value, and the non-monetised costs and benefits should also be considered when comparing these options.
Table 1: summary of the central estimates for the policy options (present value £m)
| Option | Total cost | Total benefit | Net Present Value |
|---|---|---|---|
| 0 | 0 | 0 | 0 |
| 1 | 4,724 | 7,772 | 3,048 |
| 2 | 4,507 | 6,717 | 2,210 |
Non-monetised costs and benefits
The following non-monetised costs and benefits are associated with both option 1 and option 2.
There are potential costs to businesses indirectly affected by the losses to online platforms, advertising agencies and manufacturers and retailers. For example, businesses employed to film or produce HFSS adverts.
Costs to restaurants from lost sales as a result of reduced advertising have not been estimated due to limited data.
It has not been possible to quantify any costs to content producers or social media users. Consumers may see cost increases if the burden of regulation is passed onto them. The cost of enforcing the regulations has not been quantified; the enforcement of advertising regulations falls to the Advertising Standards Agency.
There may also be additional transition costs to online media, such as scheduling changes or cancelled contracts with advertising agencies.
Children will experience additional health benefits associated with reduced obesity-related ill health and from lower salt, sugar and fat consumption. It's possible that overweight and obese children and those in lower socioeconomic groups will experience a higher calorie reduction and therefore greater benefits than the population average.
Reformulation of HFSS products may result in additional nutritional benefits and adults might also experience significant health benefits from reduced exposure to HFSS advertising.
Exposure through search advertising and social media sponsorship has not been quantified, as there is insufficient evidence on the effects of this type of promotion on children's HFSS consumption.
Reason for consultation
The government plans to introduce further advertising restrictions to reduce children's exposure to HFSS advertising. The evidence suggests that exposure to HFSS advertising can shape children's food choices, affecting what they eat and when they eat both immediately after being exposed to an advert [footnote 1],[footnote 2] and in the longer term by shaping food preferences.[footnote 3]
It is also known that regular overconsumption of food and drink high in calories, sugar and fat is one of the key factors leading to weight gain and, over time, obesity. Therefore, restricting the HFSS advertising children see could reduce overconsumption of these unhealthy foods and therefore help reduce obesity.
As part of the tackling obesity strategy, the government committed to taking further action on protecting children from HFSS exposure on TV and online. Government wants to go further online and are therefore consulting on the proposal to introduce a total ban for these adverts online. The government considers a total ban online is necessary for the following reasons:
- to future-proof the policy – children's media habits are changing, and they are spending more and more time online. 5 to 15 year-olds now spend 20 minutes more online each day than watching TV.[footnote 4] This is combined with a 450% increase in food and drink online advertising spend between 2010 and 2017.[footnote 5] This highlights that there are increasing numbers of children and increasing numbers of food and drink adverts online.
- concerns over transparency, independent data and potential issues with the way HFSS adverts are targeted away from children online – The government has concerns regarding dynamically served advertising, (for example, programmatic display, advertising in social media or pre/mid-roll advertising) which is typically targeted. Targeted adverts are served to a selected audience group based on known or inferred information about users. Research from the ASA last year, using online avatars to mimic the behaviour of different age groups, found that 2.4% of adverts served to avatars of all ages were for HFSS products, compared with 2.3% of adverts served to child avatars. This same study showed limited differentiation in the proportion of HFSS ads between avatars mimicking the behaviour of an adult and child sharing a device and avatars mimicking the behaviour of an adult. Additionally, targeted advertising doesn't address the fact that children can falsely report their age online. Ofcom data indicates that around 20% of 8 to 11s report having social media accounts, despite the minimum age for such accounts being 13.
These points, combined with other evidence outlined in the accompanying consultation document, highlight the need for strong advertising restrictions online. Given the scale of the obesity problem the country faces, the government considers that a total ban on HFSS advertising is required to effectively reduce children's online HFSS exposure and signal to industry, consumers and parents the government's determination to tackle it.
Rationale for intervention
Childhood obesity is one of the biggest health problems this country faces. Around one fifth of children in England are obese or overweight by the time they start primary school aged 4 to 5, and this rises to one third by the time they leave aged 10 to 11. This challenge disproportionately affects children in from the most deprived backgrounds, with those growing up in low income households more than twice as likely to be obese as those in higher income households. Children from black and minority ethnic families are also more likely than children from white families to be overweight or obese and this inequality gap is increasing.
Obesity damages children's mental health, with those who are overweight or obese more likely to experience bullying, stigmatisation and low self-esteem.[footnote 6] It also puts their physical health at risk. Overweight or obese children are more likely to develop Type 2 diabetes in childhood,[footnote 7] and are far more likely to go on to become obese adults,[footnote 8] with a higher risk of developing life-threatening conditions such as some forms of cancer, type 2 diabetes, heart disease [footnote 9] and liver disease.[footnote 10]
Although food habits are not perfectly stable over the life course, there is potential scope for influencing lifetime habits by intervening in childhood.[footnote 11]
Regular overconsumption is one of the key factors contributing to weight gain and, over time, obesity. Although some HFSS products will be purchased as part of a balanced diet and not contribute to obesity, they nevertheless represent the most focused group of adverts to target to reduce excess calorie consumption while minimising the impact on the wider market. Adjusting the consumption patterns of children by restricting their exposure to HFSS advertising therefore offers possible benefits in the long-term to both society and the individual.
As outlined in the 2019 consultation stage IA, one reason a regulatory intervention would typically be justified is when market failures are present. That is when a market, without regulation, leads to an inefficient or sub-optimal outcome from a societal perspective. The rationale for intervention is based on market failure due to the negative externalities generated by excessive consumption of HFSS food and drink and consumers not being fully aware of the implications on their future health.
A negative externality in this instance results from individuals only facing some of the costs associated with ill health as universal health care ensures the financial costs are borne by all taxpayers. Consequently, the health costs associated with excess calorie consumption are passed on to society and are not just experienced by the individual.
Although there are different cues that can affect food and drink purchases, it is clear from academic evidence that marketing and TV advertising can also be effective at influencing preferences and purchases. The promotion of unhealthy, high calorie food has been identified as a contributory factor to the increasing prevalence of obesity around the world. Children are thought to be particularly vulnerable to marketing techniques, with academic evidence showing their food preferences, purchasing and consumption can be influenced by advertising.[footnote 12] Relatively small but consistent levels of excessive calorie consumption is the key driver of obesity.
While recognising that other lifestyle factors will influence children's food consumption, such as socioeconomic status and behaviour of peers, there are multiple studies showing food advertising increases children's requests for advertised foods. It is logical to assume there may be myopic decision making by children, where short term gains are put ahead of future (unknown) health outcomes, as children are less equipped to understand the implications on their future health. Further evidence around children's food choices is set out in the 'Children's food choice autonomy and pester power' section in the consultation stage IA.
Options overview
Option 0: Do nothing
This is the 'Do nothing' option against which the costs and benefits of all other options are compared. For ease of understanding and to enable comparison of the options presented here, it is assumed that under this option, the current set of HFSS food advertising restrictions for online media would be retained.
As a result, this option assumes there is no change in age-specific rates of overweight and obesity but does assume that the average BMI of cohorts of individuals increases over time as they age. This increase in average BMI is based on modelled estimates of current experiences.[footnote 13]
Time-series data for online advertising of food and drink products is limited and a trend in HFSS spend over time could not be established. As a result, the do-nothing scenario assumes that there is no change in the current levels of HFSS advertising spend. It is important to note that the advertising market may change significantly over time.
There is evidence that children are spending more time online, potentially seeing more digital HFSS advertising. For comparison with other options, these trends have been factored into the estimated benefits by assuming that the gross level of children's exposure to HFSS advertising would change in line with these media usage trends for the next five years, with a flat trajectory thereafter. This is outlined in the 'options overview' section in the 2019 consultation stage IA.
Option 1: Advertising restriction on HFSS products in scope of the Soft Drinks Industry Levy (SDIL), and Public Health England's (PHE's) Sugar and Calorie Reduction Programmes, applied via a total ban online.
- This would target the products that are significant contributors to sugar and calories in children's diets, whilst ensuring that staples such as oil, butter and cheese are exempt. The products in scope will be reviewed to reflect the 2019 consultation responses received, but for the purpose of this analysis, they remain unchanged from the 2019 consultation.
Option 2: Advertising restriction on HFSS products in scope of the SDIL, and Public Health England's (PHE's) Sugar and Calorie Reduction Programmes. Applied via a 2100-0530 watershed online.
- This restriction would be based on the same categories of products outlined in option 1. However, a 2100-0530 watershed would be implemented online instead of a total online ban.
- This option has already been consulted on as part of the 2019 consultation, and therefore the government are not seeking views on this option. The cost and benefits of this option have been presented again in this document with the updated methodology in order to compare options 1 and 2.
Changes to the consultation stage IA methodology
This consultation should be considered a follow-up consultation to the 2019 consultation. As a result, some aspects of the policy have not been finalised.
Please see Section 3 of the consultation document for an overview of these. The final policy position will be finalised in the government's final consultation response later this year.
However, for the purposes of this consultation some changes to the methodology have been made in order to present an up to date picture for the online aspect of the policy. These changes are based on both consultation responses, more recent data and have been identified as factors that would make a material change to the estimated costs and benefits of a watershed and a total online ban of HFSS adverts. The interactions between the TV and online restrictions are set out in the 2019 consultation stage IA and have not been revised for this evidence note.
Table 2: summary of methodology changes
| Change to the methodology | Reason for change | Impact to costs and benefits |
|---|---|---|
| Increased estimate of the size of the online market | New evidence suggests this was previously underestimated. The revised estimate uses data from IAB UK & PwC. | An increased estimate of the size of the online market leads to increased costs and benefits of the policy. |
| The exposure time for online adverts (both video and non-video) has been shortened | Previous estimates were based on limited evidence. New evidence from Lumen using eye-tracking technology has been used.[footnote 14] | The reduced exposure time reduces the estimated benefits, all else being equal. |
| Increased estimate of the additional calorie consumption from 1 minute of exposure to broadcast HFSS advertising | Previously underestimated. The same evidence is used, however employing the weighted average rather than the standard average. | The additional calorie consumption per minute of advertising exposure leads to an increase in expected benefits and an increase in costs to manufacturers and retailers. |
| A new version (Version 3) of the calorie model | The model was updated to include liver disease, a limited capability for measuring comorbidities, extends the scope of the economic productivity analysis, and improves the accuracy of the QALY calculations, by reflecting the deterioration in health that naturally occurs as the population ages. | This results in increased benefits. This includes an increase in economic benefits due employment rate varying by disease, increase in health benefits due to changes in how comorbidities are modelled and the introduction of a new disease. |
| The impact on UK shareholders has been removed | Guidance from the Regulatory Policy Committee states that analysis should provide estimates of all costs and benefits falling on UK-based businesses and should not factor in the impacts of UK-owned businesses located overseas. | This results in an increase in costs due to increased HFSS food and drink manufactures lost profit as no adjustment has been made for profits from UK-owned businesses located overseas. |
| Reduced estimated savings to the NHS | Previous method not recognised as a measure of the opportunity cost of exchequer funding. | This results in decreased NHS savings. |
Cost and benefits
The points below outline the costs and benefits captured in the analysis for each option, holding everything else equal.
Monetised costs
- transition costs associated with businesses familiarising themselves with the new regulations and to train the relevant staff
- loss in sales revenue for ad agencies, online platforms and intermediaries
- loss in profit to retailers and manufacturers
Non-monetised costs
- potential price changes passed onto consumers
- the cost of enforcing the regulations
- the effects on content producers and social media users
- indirect costs to advert production as a result of reduced HFSS advert demand
- lost sales to restaurants from reduced online advertising spend
Monetised benefits
- a reduction in children's exposure to HFSS advertising and therefore calorie consumption, with a consequent reduction in childhood obesity prevalence
- a reduction in obesity-related morbidity and mortality, resulting in NHS and social care savings, and an increase in economic output
- additional revenue from adverts displaced from restricted media
- unspent advertising budgets retained by manufacturers and retailers
Non-monetised benefits
- the additional benefits from adults' lower exposure to HFSS advertising
- benefits as result of reformulation of products
- impact on productivity from preventing obesity related ill health
- reinvested cost savings to the NHS
- the benefits of preventing obesity-related ill health over and above the 6 obesity-related health conditions included in the model
- nutritional benefits from consumers making healthier choices in addition to reduced calorie consumption
Appraisal period
In the 2019 consultation stage IA, it was outlined that the default period of 10 years is inadequate in this case because it fails to capture the typically later life health conditions that this policy targets. The quantification of costs and benefits in this Evidence Note therefore assumes that the policy options are in place for 25 years.
However, as the health benefits derived from a reduction in the 6 obesity related conditions tend to develop later in adulthood, a cohort approach has continued to be taken to estimating the total costs and benefits of the policy options.
In modelling terms, this means that the benefits are only applied to the cohort of children who are alive or born into the model, within the 25-year period from the introduction of the policy, but that the benefits to them are modelled for 100 years from the policy's introduction. This is to ensure the lifelong impacts on the children impacted by the policy are fully considered. For consistency, industry costs resulting from the regulations are modelled over a 25-year period, but the costs that occur to retailers and manufacturers from children consuming fewer calories are also considered over 100 years. As outlined in the 2019 consultation stage IA (see 'Estimating Health Benefits from a Calorie Reduction' section), it has been assumed that children exposed to the policy for at least half of their childhood between the ages of 4 to15 years (i.e. exposed for at least 6 years) will have the full benefits of the policy, and those exposed for less than this will receive no benefits from the policy.
All costs and benefits have been discounted at the appropriate long-term discount rates and in accordance with standard practice set out in the HMT Green Book. This way, benefits received in the future can be compared against the costs which occur much sooner.
Costs and benefits for option 1
This section outlines the methodology, costs and benefits for option 1. The methodology here also applies to option 2.
Children's advertising exposure
The process to estimate the total number of child HFSS impacts in 2019 has five steps, labelled A-E outlined in figure 1. Steps A and B use a significantly different approach compared to the 2019 consultation stage IA, while steps C to E are mostly unchanged.
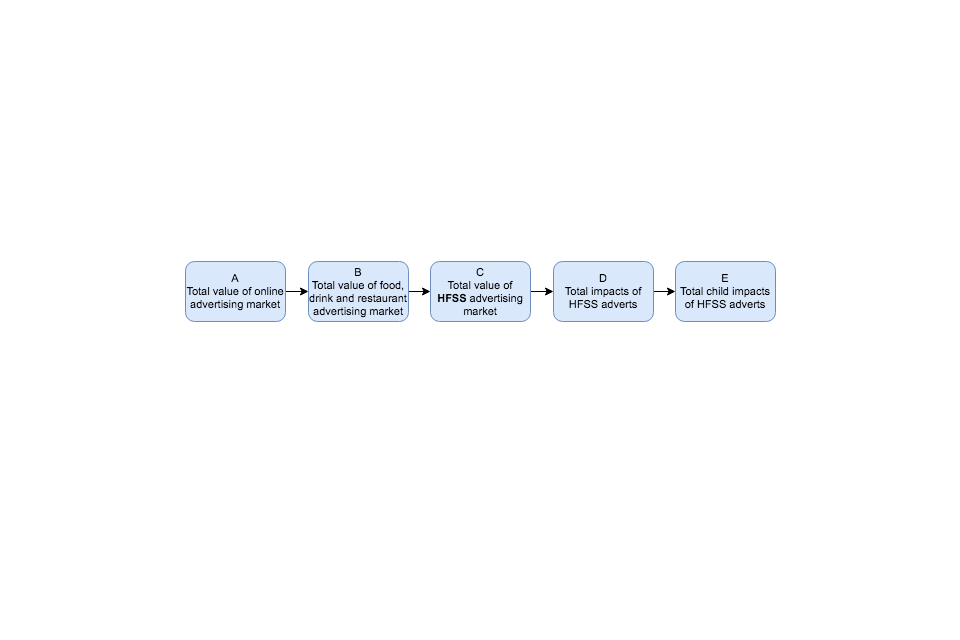
Figure 1: overall methodology for estimating the total number child HFSS impacts in 2019
Text-only description:
- step A: take the total size of the online advertising market in 2019
- step B: estimate the total size of the food, drink and restaurant advertising market in 2019
- step C: estimate the size of the total HFSS advertising market
- step D: estimate the total number of impacts from HFSS adverts
- step E: estimating the number of child HFSS impacts
Step A: take the total size of the online advertising market in 2019.
The IAB UK & PwC Digital Adspend Study is an annual census of UK media owners and advertising intermediaries and covers desktop and mobile advertising expenditure. The total size of the online advertising market was £13.6 billion in 2019. Excluding search and classified, the total is £5.4 billion.[footnote 15]
Table 4: IAB/PwC Adspend report, 2019 headline figures UK
| Type | Adspend 2019 (£m) |
|---|---|
| Search | 6,790 |
| Online display | 5,280 |
| Online classified | 1,450 |
| Other | 83 |
| Total | 13,603 |
Step B: estimate the total size of the food, drink and restaurant advertising market in 2019
The IAB UK & PwC Digital Adspend Study gives an industry breakdown of the share of online advertising spend (adspend) in 2019. Figure 2 below shows each industry's share of adspend; with industries which advertise food and drink shaded in darker purple. These sectors are 'consumer goods' (also known as fast moving consumer goods, or FMCG), 'retail' (which contains supermarkets and grocers) and 'restaurants'.

Figure 2: share of online display advertising in the UK by industrial sector, sectors with food and drink advertising shaded
Text-only description: there are 3 main sectors that include food and drink advertising. These are Consumer goods, which make up 11.52% of online display advertising, Retail which makes up 11.19%, and Restaurants at 2.25%.
Source: IAB UK & PWC Digital Adspend Study, 2019
The 'restaurants' category can be assumed to consist entirely of food and drink based advertising. The remaining two categories, 'consumer goods' and 'retail', will contain adverts for non-foods. According to Statista/GroupM, 82% of FMCG advertising spend (across all media channels) is for food and drink products.
The dominant food and drink advertisers in the 'retail' category are the major supermarkets. Ebiquity's Advertising Report 2018 found the top 6 supermarkets accounted for 19.3% of all channel advertising spend. For both 'consumer goods' and 'retail' it is assumed that the food/drink proportion of adspend is the same for online advertising as it is for all-channel advertising.
The table below uses these proportions to estimate the proportion of all food and drink-related online advertising spend: 14%. The estimate for the total size of the online food and drink advertising market is therefore 14% of £5.90 billion, or £743 million.
Table 5: calculating the proportion of internet advertising expenditure (adspend) which is for food and drink in the UK, 2019
| Category | Share of total online adspend | Food/drink share of category | Food/drink share of total online adspend within category |
|---|---|---|---|
| Consumer goods | 11.5% | 82.0% | 9.5% |
| Retail | 11.2% | 19.3% | 2.2% |
| Restaurants | 2.3% | 100.0% | 2.3% |
| Total | - | - | 13.9% |
Step C: estimate the size of the total HFSS advertising market
Evidence of the volume of HFSS advertising online is limited. The most reliable and accessible measure of what has been advertised and audience impacts, comes from ComScore. Their data covers display advertising on laptops and personal computers, which estimates show represents only 9% of the digital advertising market that would contain food and drink advertising. For the purposes of this evidence note, the same sample that was used for the 2019 consultation stage IA is being used.
Based on this data and the proportion of food and drink adverts that were HFSS in the ComScore sample, it is estimated that 59% of online food and drink adverts are for HFSS products. The estimate for the total size of the online HFSS food and drink advertising market is £438m (59% of £743m).
Step D: estimate the total number of impacts from HFSS adverts.
To approximate the total amount of HFSS impacts online,[footnote 16] the same methodology as the 2019 consultation stage IA has been implemented. This methodology takes the estimated value of the food and drink online market (£743 million) and apportions shares of this to the different types of digital advertising available (for example mobile display, desktop display, video pre-roll etc), proportional to their shares of the market. Following this, Kantar's estimates for a 'cost per thousand impacts/impressions' rate has been used, typical for each type of advertising, to derive the likely number of online impacts this level of spend may achieve. The results of this analysis are shown in table 6.
Table 6: estimates for all food and drink online advertising impacts in the UK, search and classified excluded, 2017
| Ad category | Proportion of adspend | Estimated cost per thousand impacts (Wavemaker) | Estimated Split of adspend (£m) | Estimated Impacts (bn) |
|---|---|---|---|---|
| Display banners desktop | 21.0% | £8.00 | £155.9 | 19.4 |
| Display banners mob | 9.8% | £8.00 | £72.9 | 9.1 |
| Display video - pre roll | 15.7% | £22.00 | £117 | 5.3 |
| Display video outstream | 21.1% | £5.00 | £156.9 | 31.4 |
| Other display video | 0.9% | £10.00 | £6.6 | 0.7 |
| Native | 24.2% | £0.50 | £179.9 | 359.9 |
| Other display | 2.4% | £4.00 | £17.6 | 4.4 |
| Other | 2.0% | £5.00 | £14.6 | 2.9 |
Step E: estimating the number of child HFSS impacts.
ComScore cannot report advertising impacts for a given audience demographic. Kantar Consulting have therefore used a bespoke modelling tool – CrossMedia – to estimate levels of exposure for children based on the reported impacts for adults. More information on CrossMedia's methodology can be found in Annex D of the 2019 consultation stage IA.
Applying the results of the CrossMedia tool, plus the proportion of online ads which are HFSS (59%) results in an estimated total of 15.1 billion online HFSS impacts to children in 2019.
Online viewing time
In order to convert children's HFSS impressions into time, to apply the evidenced link in viewing adverts and food consumption, evidence on the amount of time spent viewing online adverts has been identified. Research from Lumen has used eye tracking technology to estimate the average time that different types of advert, on different interfaces, are viewed. Results across desktop and mobile media are presented below.
Table 7: average attention time per viewed advert, seconds, 2020
| Desktop pre-roll | Desktop social newsfeed | Desktop MPU | Mobile pre-roll | Mobile social news feed | Mobile MPU |
|---|---|---|---|---|---|
| 4.6 | 3.5 | 1.3 | 3.1 | 3 | 1.4 |
Their research also demonstrated that even if an advert is delivered, it is not always viewable, and is not always looked at. Similar research by Inskin Media corroborates this finding and that for an advert to be looked at for up to one second, the advert needs to be viewable on the screen for 14 seconds. It also revealed that 25% of adverts defined as viewable, where 50% of the pixels are on screen for at least one second, are never looked at.
The Lumen research provides greater depth with analysis across advert types, but those results apply to adults only and there is no evidence to indicate whether children view adverts in the same way. As such a conservative estimate has been taken, only scaling the impressions by the viewed time, and do not scale for the proportion that are viewed. This means that our estimate is likely to overstate the volume of adverts that are viewed.
Weighting the advert types for the 44% on desktop and 56% on mobile and applying to a split of video and non-video (51% to 49% respectively)[footnote 17] gives average figures of 3.8s per video advert and 2.1s per non-video advert. In 2017, the ONS population estimates showed there were 9.4 million children aged 4 to 15. Using the above information, the child impacts are converted to a time exposure per child of 0.22 minutes per child per day. The table below shows the reduction in exposure to HFSS in child minutes per day based on the above analysis for an online ban, as under this option all exposure is assumed to be removed.
Table 8: reduction in child HFSS impacts and minutes of exposure under an online ban
| Type of advert | Impacts (bn) | Minutes (bn) | Minutes per child per day |
|---|---|---|---|
| Video | 7.69 | 0.48 | 0.14 |
| Non-video | 7.38 | 0.26 | 0.08 |
| Total | 15.07 | 0.74 | 0.22 |
The health benefits section below uses this figure to estimate the reduced mortality and morbidity with reduced exposure and associated reduction in calorie intake. This in turn is used to calculate the costs to manufacturers and retailers.
Limitations of measuring children's exposure
The exposure for video and display adverts has only been analysed and therefore have not included search or sponsorship of social media posts or videos.
For search advertising, only some of the adverts may have an advertising effect, and thereby change behaviour. For example, if a user searches for a fast food chain, the results may include both a text advert for that chain, and a link to the chain's website that is not labelled as an advert. In this case there is likely to be no advertising effect, as the user was already interested in finding more information from the fast food chain. Other searches not linked directly to a fast food chain may still however result in an advert being displayed. For example, if a user searches for a recipe and the food chains advert is displayed as text above the search results. This situation may have some advertising effect, where the user is drawn to the advert and may change behaviour as a result.
It has not been possible to distinguish these two scenarios in the analysis as each search provider will have a different set of algorithms to deliver adverts and there are almost an infinite number of search terms and there is no way of determining how many would have an advertising effect.
For sponsored posts or videos, the data is not available, nor the method to identify the proportion of these that would be classed as HFSS. For both types of advert or promotion, it is not possible to apply the evidence presented for online video and display adverts, due to the different nature of these adverts and therefore how users may perceive and interact with them. Further research is required to understand how search and social media sponsorship affects user behaviour.
The number of online impressions has been estimated by using a ‘cost per impressions’ (CPI) rate card, provided by Wavemaker. This is a necessary step required to convert from adspend to impressions. However, online advertising is frequently sold on a 'cost per click' (CPC, sometimes called 'cost per action') rate. Ideally, the estimation of total HFSS impressions should account for the variety of ways in which online advertising is bought and sold. However, in order to convert adspend to increased caloric intake, the CPI method was required.
Costs to business
As with the TV broadcast options in the 2019 consultation stage IA, the following assumptions have been applied around mitigation and advertising substitution:
- that the proportion of HFSS advertising that falls within SDIL and PHE reduction programmes was broadly comparable to that seen on broadcast television (87%)
- similar mitigations would be available to HFSS manufacturers to retain their advertising online (circa 15% of spend retained in a watershed scenario and 11% in a total ban scenario)
- as per broadcast television, online platforms could substitute 20% of their HFSS advertising with non-HFSS variants
The table below summarises the remaining cost to businesses after these assumptions have been applied.
Table 9: cost to online platforms of a total ban after mitigations, £m
| £m | Mid | Low | High |
|---|---|---|---|
| Total value of HFSS online ads | £437.9 | £437.9 | £437.9 |
| Percentage NPM select | 87% | 87% | 87% |
| Mitigations | 89% | 85% | 95% |
| Backfill | 80% | 70% | 90% |
| Cost to platforms | £271.2 | £226.7 | £325.7 |
Transition costs
As highlighted in the 'cost to businesses' section for option C in the 2019 consultation stage IA, given that programmatic advertising (the use of automated systems and processes to buy and sell advertising space online) accounts for upwards of 80% of the display market, online transition costs are expected to fall on all those who operate in the programmatic supply chain ‒ online platforms, intermediaries, manufacturers, retailers and advertising agencies. At this time, a reliable estimate on the number of people that would need to enact changes online is not available, so transition cost has not been monetised.
Transition costs for advertising agencies
The transition costs for advertising agencies has been estimated to be between £756k and £2.27 million and are based on estimations of the amount of time each organisation will need to familiarise itself with the new regulations and to train the relevant staff accordingly.
The median gross hourly wage rate for a professional in the UK is £19.57 per hour based on the 2019 Annual Survey of Hours and Earnings (ASHE). This is uprated by 22% to £23.88 per hour to account for non-wage labour costs such as national insurance and pensions. The wage rate will also vary by business depending on the size and scale of the organisation.
DCMS sector employment estimates show there are 145,000 employees in the advertising and marketing sector. It is assumed that not all employees will need to understand the new regulations and that only a small proportion will therefore be affected. For this reason, it is assumed that 50% of employees in relevant teams would need to undertake between 1 and 3 hours of training. A further downward adjustment is made on the basis of the type of advertising agencies tend to engage in: not all advertising agencies will be affected by the regulations, with many agencies operating in niche and specialised areas that wouldn't be affected by HFSS legislation. An industry report from IBIS world estimated that 41% of ad agency revenue was from "fast moving consumer goods" (majority food and drink). It is therefore assumed that 41% of employees in the sector would be affected by the new legislation and of those 59.5k, half of them would need training.
Table 10: transition costs for advertising agencies (based on 2019 ASHE data)
| Input variable | Low | Med | High |
|---|---|---|---|
| Wage rate (£/hrs) | 23.88 | 23.88 | 23.88 |
| Time required (hrs) | 1 | 2 | 3 |
| No. of likely affected employees[footnote 18] (000s) | 29.7 | 29.7 | 29.7 |
| Cost of training (£m) | 0.7 | 1.4 | 2.1 |
Transition costs for manufacturers/retailers
The transition cost for manufacturers/retailers is thought to be between £1.94 million and £3.99 million. One respondent to the 2019 consultation noted that: For manufacturers the requirements may be less extensive than for advertising agencies, but we still think that 2 to 3 person days per organisation is a more reasonable estimate that 1 to 3 hours. These estimates are considered to be reasonable but do not take account for business as usual strategy changes that manufacturers/retailers already undertake. Because of this, an adjustment has been made to the proposed figure by 1 person days, creating a range of between 1 and 2 person days per organisation. The wage rate is the same one used in the "Transition cost for advertisers" above.
Table 11: transition costs to manufacturers and retailers (based on 2019 ASHE data)
| Input variable | Low | Med | High |
|---|---|---|---|
| Wage rate (£/hrs) | 23.88 | 23.88 | 23.88 |
| Time required (hrs) | 8 | 12 | 16 |
| No of manufacturers | 9,800 | 9,800 | 9,800 |
| Cost: manufacturers (£m) | 1.9 | 2.8 | 3.7 |
Transition costs for online platforms and intermediaries
Transition costs are likely to vary significantly from platform to platform, reflecting the varying means by which advertising space is bought and sold, and the range of tools made available to advertisers to categorise and target their advertising. Although it can be assumed that the onus would be placed on the advertiser to ensure compliance with an HFSS online ban, many platforms and intermediaries will wish to support their clients and minimise inadvertent breaches by adapting their tools to provide extra assurance to those buying advertising space.
In addition, it is assumed that platforms will be required to take appropriate measures to further limit the likelihood breaches of the ban. The government invites views on what these measures might be, but expect an additional cost may arise in ensuring, for example, that clear complaints handling and takedown procedures are in place.
Ongoing costs
Cost to manufacturers and retailers
The restrictions are expected to reduce children's exposure to HFSS advertising and subsequently reduce their calorie consumption, resulting in weight loss and a decrease in the prevalence of obesity-related ill health. Any calorie reduction is expected to accrue from a decrease in consumption and therefore sales of HFSS products, with an associated decrease in profits for HFSS food and drink retailers and manufacturers.
To quantify the impact on food and drink retailers and manufacturers, it is assumed that the calorie reductions are derived from reduced purchasing of HFSS products brought back into the home for consumption. To calculate the impact to retailers and manufacturers, the methodology outlined in the 'cost to manufacturers and retailers' section in the 2019 consultation stage IA and highlighted in figure 3 below has been used. These costs do not take into account the adaptations manufacturers and retailers could make to their products in response to the regulations, which could offset some of the loss to profits.
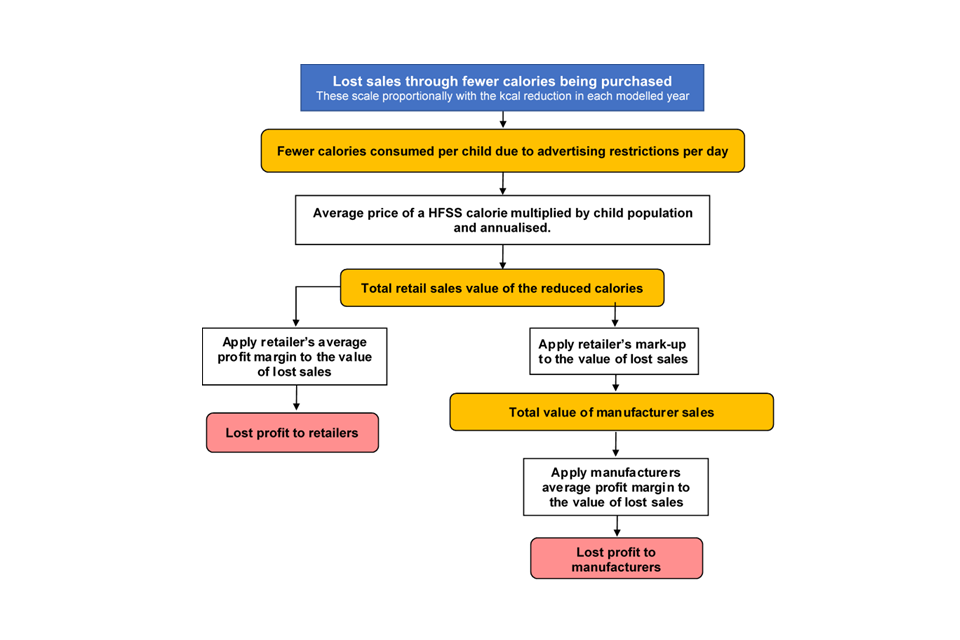
Figure 3: quantifying total costs to industry due to fewer calories being purchased
Text-only description: to quantify the cost to industry due to fewer calories being purchased, the average price of a HFSS calorie is multiplied by the number of reduced calories per child per day. This is then multiplied by the child population and annualised – to give the total retail sales value of the reduced calories. To calculate lost profit to retailers, retailers’ average profit margin is applied to the value of lost sales. To calculate lost profit to manufacturers, retailers’ mark-up and manufacturers’ average profit margin are applied to the value of lost sales.
Total value of lost retail sales
To estimate the retail sales value of the fewer calories being bought, the estimated daily calorie reduction (2.09kcal per child per day under a watershed and 2.84kcal under a total ban, which are calculated in the 'health benefits' section below) is multiplied by the price per Nutrition Profile Model (NPM) failing calorie[footnote 19] (£0.0011 outlined in table 14 of the 2019 consultation stage IA), the number of people experiencing a calorie reduction in each year and 365 days. The result of this calculation suggests the value of lost retail sales averages around £27 million per year under a total ban.
Lost profit to retailers
To calculate the impact on profits, a gross profit margin of 6%, as outlined in the 2019 consultation stage IA ('lost profit to food and drink manufacturers' section), is used.[footnote 20]
Applying this to the value of the reduction in sales of HFSS food and drink implies average annual lost profits to retailers of £10 million per year under a total ban.
Lost profit to food and drink manufacturers
Using the supermarket mark-ups of 52.5% as outlined in the 2019 consultation stage IA ('lost profit to food and drink manufacturers' section), gives an average loss in sales for manufacturers of £18m per year under a total ban. To calculate the impact on profits, a gross profit margin of 7% is applied, as outlined in the 2019 consultation stage IA, giving an average lost profit of around £0.6 million per year for manufacturers of HFSS products under a total ban.
Costs to advertising agencies
There is limited evidence on how advertising agencies, the intermediaries between HFSS manufacturers and broadcasters, would be impacted by this restriction. If agencies are acting on behalf of their manufacturers, then they are still likely to work with these clients and support them to advertise in unrestricted media. It is assumed that agencies would lose revenue if advertising spend was retained by HFSS manufacturers and retailers, and instead reinvested into other parts of their businesses.
Based on Kantar's modelling for the 2019 consultation-stage impact assessment, it is assumed that up to 18% of displaced advertising spend could be lost to this route. However, the commission, contracts or payment mechanisms agencies and HFSS manufacturing clients agree will be unique to each agreement and cannot be generalised. For the purposes of this analysis, it is assumed that agencies would forego a 7.5% commission on this lost advertising spend. This is approximately £3.9 million per annum under a total ban; £66 million over the appraisal period.
Non-monetised costs
Owing to the limited data and evidence available it has not been possible to monetise the costs to the following groups:
Costs to businesses
Lost sales to restaurants have not been estimated due to limitations in the data.
The restrictions could lead to impacts on businesses involved in the production of adverts if overall demand for advert production falls.
Costs to content creators including social media users
There is no data on the extent to which HFSS adverts currently support content creators online and where such adverts make up a substantial proportion of content creators incomes. It could be expected that certain types of content are associated with food and drink adverts, such as food blogs, and that these may therefore be affected to a greater extent than other types of content. Content producers and advertisers will still be able to substitute away from HFSS adverts.
Costs to consumers
As outlined in the 2019 consultation stage IA ('Cost to consumers' section), the policy is not expected to generate any costs to consumers. However, it is possible that businesses could choose to pass on the costs of complying with restrictions by increasing the price of HFSS products. On the other hand, products could be made cheaper as businesses respond to the restrictions through an increase in the use of price cuts or other below the line marketing.[footnote 21]
Due to the significant competition from retailers' own products, known as private label products, and discounters, manufacturers and retailers are likely to use price cuts to remain competitive on price. The likelihood and extent to which businesses would reallocate online advertising budgets to price cuts to offset the loss in sales will depend on how effective price cuts are at driving sales, relative to online advertising, and the level of price cuts businesses can afford in terms of profit margins and brand equity. This will be explored further in the consultation response.
Costs to the government and regulators
The Advertising Standards Authority (ASA) would implement and enforce the updated regulations, and a regulator acting as statutory backstop will need to be appointed to operate in co-regulation with the ASA. Both the ASA and the chosen statutory regulator will face a significant additional administrative burden in adapting to the regulation of a watershed or ban. The government would not expect the costs to the ASA to vary significantly in the case of either a ban or a watershed. These costs include monitoring, investigating complaints, providing guidance and training to advertisers, and other associated regulatory functions. Equally the costs to the statutory regulator of ensuring that platforms take appropriate measures to help ensure that the advertising served on their sites is compliant, are not vary significantly in either option. At present evidence of the likely costs is not available and this consultation will look at ascertain where possible the likely extent of these costs
Second order impacts
Impacts on price of slots
In the 2019 consultation stage IA, it was outlined that the trading of TV advert slots is driven by the supply of slots and the demand by advertisers and media buyers, with the demand being dependent on the nature of the product or service being marketed. Hence, the price of slots is usually based on how effectively it reaches the advertiser's target audience.
The slots available online are vast, and supply is not as restricted as it is for TV, which could impact how prices change following these restrictions. Therefore, any change in online advert prices is likely to be indiscernible.
Where adverts are displaced to other media, the increased demand may increase the price of these advertising spaces. Given the price mechanism is complex and across different media, an assessment of how average prices would change has not been made.
Spending switching to other areas
It is possible, for example, that consumers might adjust their consumption behaviour in response to consuming fewer calories, shift their purchasing to other goods advertised online. The choice of which goods are purchased might be influenced by alternative marketing strategies from the same businesses who would otherwise lose out from the restrictions. This type of behavioural change is a source of uncertainty in the analysis and as such could have a significant impact on individual businesses' sales, and on the estimated total net present value.
Health benefits
The methodology used to estimate the impact of the restrictions on children's calorie consumption is outlined in the 2019 consultation stage IA ('Modelling the Health Benefits of Advertising Restrictions' section) and highlighted in figure 4 below.

Figure 4: estimating the reduction in children’s calorie consumption
Text-only description: to estimate the average reduction in children’s calorie consumption, the reduction in HFSS advertising exposure is first adjusted for changes in online media use over the next 5 years. The estimated impact of HFSS advertising on children’s calorie consumption is then applied.
Taking into account children's changing media consumption
Given the downward trend in children's television viewings and the rapid rise in the amount of time children spend online, the amount of time children spend online is expected to increase by around 3.4% per year. This is based on Ofcom's 'Children and Parents: Media Use and Attitudes Report, updated with results from 2018. More recent data (2019) is available showing a continuing change in children's online consumption however it does not provide a comparable estimate for the time series used in the analysis, and therefore 2018 data has been used.
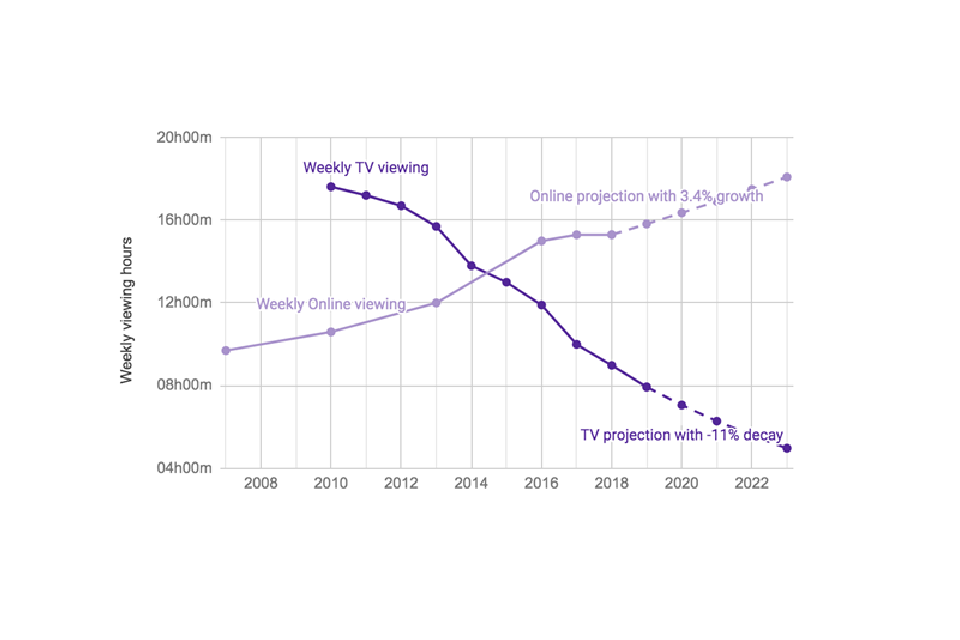
Figure 5: TV and online weekly viewing of children
Text-only description: children’s weekly viewing online has been increasing steadily since 2007, and is expected to continue to increase by 3.4% per year.
Sources: TV: BARB, 2019 (aged 4 to 15); Online: Ofcom, Media Use and Attitudes Report 2018 (aged 5 to 15)
Applying these adjustments to the exposure figures noted above suggests children will see 13.1 billion fewer HFSS adverts on TV annually under a watershed and 17.8 billion fewer under a total ban.
Estimating children's reduction in calorie consumption
Using the average length of an advertising slot, the advertising impacts are converted into minutes of HFSS advertising exposure, an approach outlined in the 2019 consultation stage IA.
To calculate the additional calorie consumption per minute of food advertising exposure, the evidence from the National Institute for Health Research (NIHR) Obesity Policy Research Unit (OPRU) meta-analysis has been used. However, for the additional calorie consumption, the weighted average has been used in the estimates below rather than the standard average used in the 2019 consultation stage IA. This estimate has been revised as the analysis assumes a linear relationship between advertising and consumption. Using the weighted averages, the meta-analysis shows 4.4 minutes of food advertising results in an additional 62.5kcal of consumption, compared to 60kcal when using standard averages.
These estimates show that 1 minute of exposure to broadcast HFSS advertising causes an additional consumption of 14.2 kcal. Similar to the 2019 consultation stage IA ('Health benefits methodology' section), it is assumed that the relationship between exposure and calorie consumption is linear, however it is not possible to conclusively say what effect a single minute of exposure, or multiples, would have on kcal consumption based on their findings.
Using the analysis of children's exposure to HFSS adverts presented earlier, the total additional calorie consumption associated with this exposure is calculated. HFSS advert exposure is estimated to be 0.22 minutes per child per day and is applied with the central estimate of additional consumption per minute of exposure of 14.2 kcal, which equates to additional calorie consumption of 3.64 kcal per day per child, or 1,329 kcal per year per child. As exposure is assumed to be removed entirely with an online ban, this equals the calories that would be removed under the ban.
Adjusting for displacement
As advertising is a dynamic market and advertisers will move to other media platforms where they can get the greatest exposure and return on their investment, it has been considered whether the proposed online ban results in displacement to other media, as well as shifts in the way food and drink manufacturers and producers advertise. This displacement is likely to offset a proportion of the health benefits if it leads to an increase in children's exposure to HFSS advertising.
The impact of these shifts will depend on children's use of these other types of media and the effectiveness of advertising campaigns on these other platforms. If HFSS advertising spend were to shift from platforms children use extensively, such as TV and online, to those which they do not, such as print newspapers, then the impact of displacement on children's exposure is likely to be small. Similarly, if HFSS advertising spend were to shift from platforms where it is more effective at changing consumption behaviours to those where it is less effective then the impact of displacement on children's calorie consumption is likely to be smaller.
In the short-term this shift is likely to be into video advertising in other sections of the media. However, in the long-term advertisers might decide not to invest in video advertising at all and switch their campaigns to different sections of the media, such as radio, out-of-home (for example billboards), newspapers, direct mail, online display and radio advertising. Alternatively, advertising spend removed from broadcast television and online platforms may be displaced into promotions or price reductions. This is discussed further in the Key Assumptions and Limitations of the Health Benefits Calculations section in the 2019 consultation stage IA.
For the 2019 consultation stage IA, Kantar estimated the degree of offsetting behaviour for each option (presented in the methodology section). For an online ban a similar level of displacement as was presented for the watershed option is expected. This is because most other media such as print and cinema, it is expected the returns to investing in space won't vary much directly before and after the watershed. There may be some displacement from online media to TV, though it is expected to be limited due to the watershed. For larger HFSS advertisers already active on both TV and online, the expectation is that there will be little or no displacement from online to TV. As TV advertising has higher barriers to entry, smaller food producers or retailers are also unlikely to utilise a post 9pm TV slot as a substitute for online advertising.
Table 12 below presents the degree of offsetting behaviour that has been estimated by Kantar. In the 2019 consultation stage IA ('Monetised Health benefits' section), it was expected that around 81% of HFSS advertising spend removed from broadcast TV and online would be displaced to other forms of media under a watershed ban.
Table 12: option 1 displaced advertising spend and children's HFSS advertising exposure (Source: Kantar analysis)[footnote 22]
| Channel | % displacement from TV and online | Does it have an impact on children's exposure? |
|---|---|---|
| TV | 0% | Yes |
| Online | 0% | Yes |
| Direct Mail | 3% | Yes |
| Out of Home | 26% | Yes |
| 22% | No | |
| Radio | 15% | Yes |
| Cinema | 15% | No |
| Lost | 19% | No |
Following the same assumptions in the 2019 consultation stage IA ('Monetised Health benefits' section), implies that displacing HFSS advertising to other forms of media will reduce the estimated calorie reduction by 22%. After adjusting for this displacement, it is estimated that children's calorie consumption will reduce by 2.84 kcal/day under a total ban.
Estimating health benefits using the calorie model
The calculations of the quantified benefits (including Quality Adjusted Life Years (QALYs)) are done within the DHSC Calorie Model. An improved Version 3 of this model is used in the analysis compared to version 2 which was used in the 2019 consultation stage IA ('Estimating health benefits from a calorie reduction' section). The updates to the calorie model have been done independently from this consultation process. This version added liver disease to the model, added a limited capability for measuring comorbidities, extended the scope of the economic productivity analysis, and improved the accuracy of the QALY calculations, by reflecting the deterioration in health that naturally occurs as the population ages.
For a full description of the calculations and the set of assumptions see Annex A – DHSC Calorie Model and the DHSC Calorie Model Technical Consultation Document.
This model simulates a control group of would-be overweight and obese adult population, compared with an intervention group. The intervention group has a lower average BMI, as calculated from the reduced daily calorie intake. The simulation is over 25 years.
The average BMI determines the likelihood of the following 6 conditions associated with obesity, which in turn have a fatality rate and a reduced quality of life: type 2 diabetes, coronary heart disease, stroke, colorectal cancer, liver disease and breast cancer. The savings to the NHS is calculated from the reduced treatment of each disease. Reductions in mortality are used to calculate the impact on economic output from an increased workforce. The costs of social care savings are calculated due to a reduced proportion of overweight, obese, and morbidly obese individuals and hence fewer people needing social care in the treatment scenario. Changes in QALYs are calculated from the reduced number of deaths and the reduction of people living with the diseases. These are then converted into monetised QALY using a conversion of how much society values a QALY.
There are multiple limitations, outlined in the 2019 consultation IA ('Key Assumptions and Limitations in the Health Benefits Calculations' section), that may result in either an under or over-estimate of the health benefits. It has not been possible to determine the total size of either of these impacts or whether one will outweigh the other.
Adjustment for partial exposure
To account for partial exposure to the policy, it is assumed that only children exposed to the policy for at least half of their childhood will have the full benefits of the policy, and otherwise they will receive no benefit. This has been captured in the model by creating a cohort of children who are exposed to the policy for at least 6 years, using the same methodology as outlined in the 2019 consultation stage IA (see table 11.
Monetised health benefits
After scaling up the outputs from the model for the UK population, the discounted health benefits through reduced mortality and morbidity accruing to the cohort of children are estimated at around 127,000 QALYs over the modelling period, or a present value of £2,886m when monetised at £60,000 per QALY. Reduced morbidity would also result in reduced cost pressures to the NHS, resulting in NHS savings of £62m. The additional NHS savings from reinvesting back into the NHS is not included in the estimates above, a factor that was previously included in the health benefits in the 2019 consultation stage IA ('Monetised Health benefits' section). Social care savings would amount to around £49m and reduced premature mortality would be expected to deliver an additional £149m of economic output through additional labour force participation.
Table 13: health benefit figures
| Benefit | Present value benefits |
|---|---|
| Quality adjusted life years | 127,000 |
| Monetised health benefit | £2.9 billion |
| NHS savings | £0.062 billion |
| Social care savings | £0.049 billion |
| Economic output | £0.15 billion |
| Total benefits | £3.13 billion |
Benefits to business
As outlined in Table 12, Kantar assessed that 81% of advertising revenue moving from television and online would displace to less-restricted advertising channels, such as print media and outdoor advertising. Under this option, businesses in these sectors would benefit from around £209.9 million of investment from HFSS advertisers under a watershed (£220 million under a total ban), £3.58 billion over the appraisal period (£3.74 billion under a total ban).
Kantar estimated that £49.2 million of advertising spend would be retained by HFSS manufacturers and retailers under a watershed (£51.5m under a total ban), based on 2017 data; £840 million over the appraisal period (£879 million under a total ban).
Non-monetised benefits
There are additional benefits that, owing to the limitations of the modelling, have not been monetised. These include:
- preventing obesity-related ill health that is likely to occur in addition to the 6 obesity-related health conditions included in the model
- nutritional benefits from consumers making healthier choices in addition to reduced calorie consumption
- the benefits resulting from adults' lower exposure to HFSS advertising
- the policy may encourage manufacturers and retailers to reformulate products, which would provide additional calorie reductions and nutritional benefits
- improvements to economic productivity resulting from a healthier workforce are not included
- reinvesting NHS savings back into the health service
However, as highlighted earlier there are multiple limitations that may result in either an under or overestimate of the health benefits and it has not been possible to determine whether one side outweighs the other.
Summary of costs and benefits of option 1: total ban for advertising HFSS products online
It has not been possible to quantify every aspect of the proposed policy. The table below outlines the costs and benefits of the policy, with quantifications where currently possible.
Table 14: summary of costs of option 1
| Group affected | Impact | Present value, £m, displacement adjusted |
|---|---|---|
| Online platforms | Transition costs | - |
| Online platforms | HFSS advertising revenue lost | 4,626.2 |
| Retailers and manufacturers of HFSS products | Transition costs | 2.8 |
| Retailers and manufacturers of HFSS products | HFSS profit lost | 27.5 |
| Advertising agencies | Transition costs | 1.4 |
| Advertising agencies | HFSS advertising revenue lost | 65.9 |
| Present value costs | - | 4,723.8 |
Table 15: summary of benefits of option 1
| Group affected | Impact | Present value, £m, displacement adjusted |
|---|---|---|
| Other forms of media | Additional revenue from adverts displaced from restricted media | 3,747.2 |
| Retailers and Manufacturers of HFSS products | Unspent advertising budgets retained by manufacturers and retailers | 879.0 |
| Government | NHS savings | 62 |
| Government | Social care savings | 49 |
| Consumers | Health benefits | 2,886 |
| Consumers | Economic benefits | 149 |
| Present value benefits | - | 7,772 |
| Total net present value | - | 3,048 |
Costs and benefits for option 2
The estimated costs and benefits for a 9pm watershed for advertising HFSS products online use the same methodology as in option 1.
Table 16: cost to online platforms of a watershed after mitigations, £m
| £m | Mid | Low | High |
|---|---|---|---|
| Total value of HFSS online ads | £437.9 | £437.9 | £437.9 |
| Percentage NPM select | 87% | 87% | 87% |
| Mitigations | 85% | 80% | 90% |
| Backfill | 80% | 70% | 90% |
| Cost to platforms | £259.1 | £213.3 | £308.6 |
Child exposure
Children's exposure to HFSS advertising is higher under a watershed, with 91% of the time children are active online takes place between 05:30 and 21:00. This is used to scale the exposure time for HFSS adverts and produces the following exposure time reductions compared to the do nothing baseline.
Table 17: reduction in child HFSS impacts and minutes of exposure under an online watershed
| Type of advert | Impacts (bn) | Minutes (bn) | Minutes per child per day |
|---|---|---|---|
| Video | 5.67 | 0.35 | 0.10 |
| Non-video | 5.44 | 0.19 | 0.06 |
| Total | 11.11 | 0.55 | 0.16 |
Accounting for the same growth in online consumption assumptions as in option 2 gives a total exposure reduction of 0.19 minutes per child per day.
Cost to business
Costs to manufacturers and retailers scale with the change in exposure and the linked calorie consumption. This is also the case for lost revenues to publishers. All other assumptions remain the same, including displacement adjustments.
Costs to advertising agencies
Under a watershed the costs to advertising agencies through lost sales is approximately £3.7 million per annum; £63 million over the appraisal period.
Costs to manufacturers and retailers
Under a watershed, the value of lost retail sales averages around £20 million per year, with average annual lost profits to retailers of £7 million per year. The value of lost manufacturer sales averages around £13 million per year, with an average lost profit of around £0.5 million per year.
Transition costs
Online platforms and intermediaries
As with a ban, these transition costs arise in part from an assumption that platforms and intermediaries will seek to adapt their tools to support clients in avoiding breaches in the rules. In addition, the variance in transition costs here, arising from the range of different tools and services offered by these platforms, may be wider for a watershed than a ban, given some platforms already have the functionality to time limit advertising. While adapting that functionality to ensure compliance with a watershed may still induce costs, the impact may be felt to a greater extent on those platforms which do not currently offer this functionality.
It is worth nothing here that platforms will be required to take appropriate measures to further limit the likelihood breaches of the ban, and the additional cost which may arise here.
The cost to consumers or the government is not expected to differ between an online ban and a watershed.
Health benefits
Using the exposure reduction above and combining this with the central estimate that 1 minute of exposure to broadcast HFSS advertising causes 14.2kcal of additional consumption, suggests that the online restrictions will reduce their calorie consumption by an additional 2.68kcal per day per child or 978 kcal per year per child.
After adjusting for displacement using the same estimates in option 1, it is estimated that children's calorie consumption will reduce by 2.09kcal/day under a watershed. The same approach in option is used to calculate the monetised benefits.
The costs and benefits adjusted for the watersheds effect on exposure are presented in the summary tables below.
Summary of costs and benefits of option 2: 9pm watershed for advertising HFSS products online
Table 18: summary of costs of option 2
| Group affected | Impact | Present value, £m, displacement adjusted |
|---|---|---|
| Online platforms | Transition costs | - |
| Online platforms | HFSS advertising revenue lost | 4,419.8 |
| Retailers and manufacturers of HFSS products | Transition costs | 2.8 |
| Retailers and manufacturers of HFSS products | HFSS profit lost | 20.3 |
| Advertising agencies | Transition costs | 1.4 |
| Advertising agencies | HFSS advertising revenue lost | 63.0 |
| #Present value costs | - | 4,507.3 |
Table 19: summary of benefits of option 2
| Group affected | Impact | Present value, £m, Displacement adjusted |
|---|---|---|
| Other forms of media | Additional revenue from adverts displaced from restricted media | 3,580.1 |
| Retailers and Manufacturers of HFSS products | Unspent advertising budgets retained by manufacturers and retailers | 839.8 |
| Government | NHS Savings | 46 |
| Government | Social Care Savings | 36 |
| Consumers | Health Benefits | 2,106 |
| Consumers | Economic Benefits | 109 |
| #Present value benefits | - | 6,717 |
| #Total net present value | - | 2,210 |
Sensitivity analysis
It should be recognised that the estimates included in this Evidence note generate illustrative costs based on plausible assumptions. The specific choices of these assumptions can have a substantial impact on the final estimates. At this stage it has not been possible to conduct a sensitivity analysis, however where possible the uncertainty of assumptions is outlined. A sensitivity analysis will be conducted in the consultation response.
Annex A: DHSC calorie model
This annex explains what the calorie model is, how it works and how it supports policy development. It also provides a brief history of how the model has developed over time.
What is the calorie model?
The calorie model is a simulation model, written in R, developed by analysts within the Dept. of Health & Social Care (DHSC). It draws on earlier modelling work developed by Public Health England (PHE).
Its purpose is to model the long-term impacts of policies that affect calorie intake at a population level. It uses estimates of change in calorie intake, along with other assumptions, to estimate the effect on health outcomes, NHS treatment costs, social care costs and changes in economic output.
Typically, the model is used to quantify the benefits associated with reductions in calories, but it can also model increases. The model is calibrated for the population in England[footnote 23] using 2016 data as the baseline.[footnote 24]
How does the model work (in overview)?
The calorie model is a cohort-based Markov model. That means that the population is divided into annual cohorts based on their year of birth, and the health of each cohort is modelled over time based on their expected body mass index (BMI) and the associated chances of acquiring an obesity-related condition. A change in calorie intake will affect BMI, which in turn affects the likelihood of ill health.
To track health over time, the members of each cohort are divided into one of several states: healthy, diagnosed with an obesity-related disease, or deceased. Each year, transitional probabilities are used to estimate how many people will change state, and new births are added in. The expected prevalence of obesity-related conditions, and associated impacts, can be estimated accordingly.
The effects of a policy intervention are modelled using a control and treatment approach, with a control scenario assuming no policy implementation, and a treatment scenario(s) assuming a change in calorie intake. The effects of the policy are measured by comparing the two scenarios over time.
What outputs does the model produce?
The main outputs for any given scenario are:
-
total net benefit (or cost) in net present value terms, likely to result from a calorie change, comprising:
- monetised value of any net change in health (measured in QALYs)[footnote 25]
- net change in NHS treatment costs
- net change in social care costs
- net change in (some) economic productivity impacts
- a timeline, showing when these effects are expected to occur
- the number of premature (under age 75) deaths expected in the scenario and compared with the control
The model also allows more detailed interrogation of (for example) different age groups or BMI changes, and it can also provide sensitivity analysis around input parameters.
How does the model work (in detail) and what assumptions are used?
The main input parameter is the expected change in calorie intake per person per day.[footnote 26]
This value (or range of values) must be created outside the model, using whatever research, analysis or estimation techniques are available. The calorie model can explore the effect of a calorie change and perform sensitivity analysis around any assumed figure. But it cannot identify the correct calorie value to use.
The calorie change can be varied according to the age and gender of the population affected. This allows (for example) policies that focus on children only to be assessed.
Changes in weight and BMI caused by the reduction in daily calories are calculated (see para 17 and footnote 6 for the methodology) and are used as a starting point for the remainder of the analysis within the model.
The model then considers the implications of the calorie imbalance reduction on 6 diseases associated with obesity: type 2 diabetes, coronary heart disease, stroke, colorectal cancer, breast cancer and liver disease. This is done by considering changes in prevalence and mortality rates for each disease caused by changes in BMI to calculate the number of deaths avoided in the treatment scenario.
The model makes some allowance for comorbidities. In previous versions, the only transition an individual in a disease state could make was to move to the dead state or else stay in the relevant disease state, the possibility of disease to disease transition has since been added to model comorbidities. However, the model has no state memory and so when an individual undergoes a disease to disease transition, they no longer incur the costs associated with their first disease. To reduce the impact of this lack of state memory disease to disease transitions are only allowed from less severe to more severe diseases. The order of severity is shown here, with severity increasing from left to right:
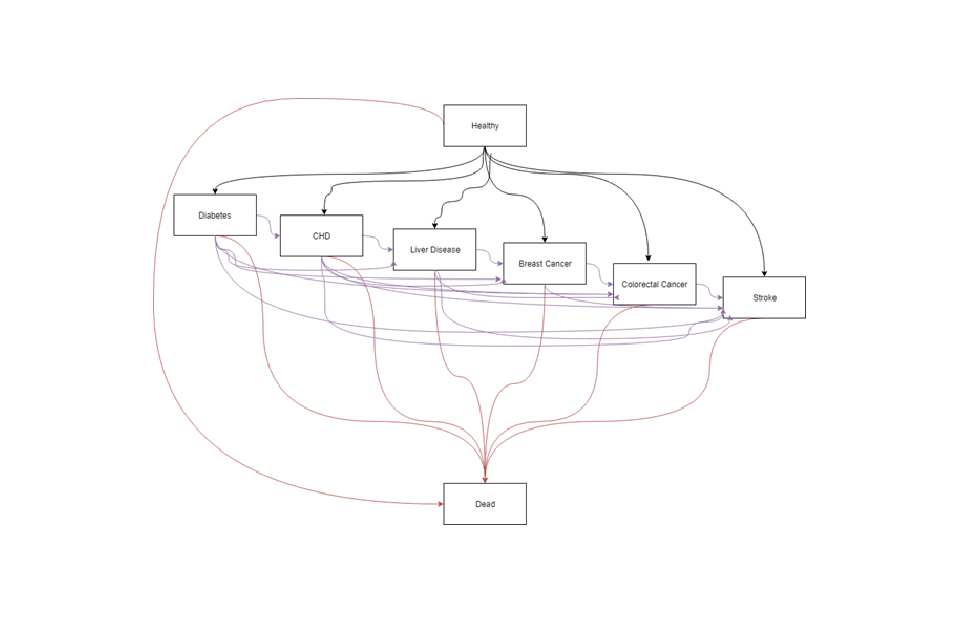
Figure 6: DHSC calorie model
Text-only description: the order of severity in the model is: type 2 diabetes, coronary heart disease, liver disease, breast cancer, colorectal cancer, stroke.
BMI analysis
Individual weights are modelled using the differential equations from Hall et al.[footnote 27]
This approach assumes an individual's weight to consist of body fat, and fat-free mass (summed together to give the total body weight). The BMI projection through life is done by considering the imbalance between energy in and energy out, and by assuming that an individual will remain on the same BMI percentile through life. The model also draws on research from Ara et al[footnote 28] to model how the BMI of the control group would change over time. This evidence was based on an overweight and obese population but is assumed in the absence of anything superior to provide a reasonable approximation for those with a healthy BMI.
Differential equations were implemented in the model using the deSolve package in R. The original model predicted the same weight loss per kcal reduction regardless of original body weight, which was noted at the time as being a necessary simplification. This limitation has been removed and the use of the differential equations in the new model forecasts a greater reduction in body weight per kcal reduction in diet in individuals with more excess weight.
These updates allow us to model changes in weight that occur in childhood. The equations include a growth term which tends to zero at age 18, meaning the model naturally transitions from childhood into adulthood.
There is no evidence available to link excess weight to the modelled conditions during childhood and hence no health benefits have been modelled during childhood. If any undiscovered associations exist, this would imply the calculations underestimate the benefits.
Groups of people considered within the model
The model splits the population by age, sex, and 5 BMI categories: underweight, healthy weight, overweight, obese, and very obese. Age can be modelled in individual years or in grouped categories as desired. Age-specific parameters (such as mortality rate, or incidence of a condition) are applied at the correct time as required.
Some weight loss health benefits occur in adults that are not overweight but have a BMI greater than 22 kg/m2. The risk of the 6 health conditions modelled increases linearly with a BMI level of 22 upwards, and so including a healthy weight group in the model allows the extra benefits to be modelled. Underweight is modelled as a separate group to avoid any bias.
The starting population is defined by the user, meaning a policy can be considered that only applies a calorie reduction to children, to children and adults, or only applies to adults.
The new model utilises Markov modelling to calculate the transitions of the population between states, where states are defined as healthy, having a condition (where each condition is a separate state), or deceased. The Markov modelling was handled by the heemod package in R. The probabilities of being in a state are used as inputs into the heemod package, which can then simulate how the states will develop over time, starting the model with 100% of the population in the healthy state.
For every cycle of the Markov model (equivalent to one year), the model calculates what proportion of the population will be in each state using the predicted probabilities (which as in the original model, are BMI-dependent). This gives a trajectory of the proportion of the total population in each state every year.
The previous model considered the possibility of people living with one condition but dying of another. This version of the model has made the simplification that people have no more than one condition given there is currently a lack of evidence on the health effects of having several of these conditions.
Calculating results
Savings to the NHS are calculated from the reduced treatment requirements for each disease.
Economic productivity effects are assessed in two categories. First, reductions in mortality are used to calculate the impact of mortality on economic output from an increased workforce. This is done by considering everyone within a cohort to earn the median wage of a person of that age and gender, with a larger workforce present in the treatment scenario.
Secondly, V3 of the model calculates the impact of morbidity on economic output using an employment rate that varies with disease state. This change has been made to reflect the lower productivity and rates of employment seen for individuals with one of the 6 modelled diseases.
Costs of social care savings are calculated due to a reduced proportion of overweight, obese, and morbidly obese individuals and hence fewer people needing social care in the treatment scenario. This assumes that the probability of requiring social care increases with BMI.
Changes in QALYs are calculated from the reduced number of deaths and the reduction of people living with the diseases. These are then converted into monetised QALY using a conversion of how much society values a QALY.
People who fall ill with an obesity-related illness in later life may already be in less than perfect health. Accordingly, the model does not assume a QALY value of one for individuals in the "healthy" state (which in model terms means they are free of obesity-related illness). Instead, an age detriment is applied to all QALY values. This is done to allow for the increased prevalence of diseases not explicitly included in the model at older ages.
The model uses a QALY disease detriment to calculate the QALY value for an individual in the disease state.
Discount rates are applied to monetary values to account for changes in the treatment of costs and benefits that arise over different periods of time. This allows future values to be considered at present value in line with Treasury Green Book principles.
Results can be modelled over a user-defined timeframe. For most analysis, a longer timescale is considered appropriate, as many of the health benefits do not arise until middle age or older. Equally, uncertainty increases as the forecast period widens.
The model can be run for a longer time-period and (based on ONS population projections) will add new children each year who will be born into the model. This means a policy that runs for multiple years can be modelled on children who will be born during the duration of the policy.
Once a policy has finished running, the model will stop adding new children to the population. However, it will continue to model benefits on the existing population for as long as the user defines. This allows the benefits that do not occur until much later in life to be modelled over the lifetime of the population.
How robust and reliable is the model?
The model has been developed and enhanced over several years, reflecting both changes in evidence and improvements in modelling capabilities. The model has been independently assured and the results have been used to support economic analysis in published Impact Assessments on a regular basis. The analysis is best available.
However, the model does have several significant limitations.
- It predicts the effect of a given change in calorie intake. It cannot predict the effect of policy on calorie intake, and so is reliant on the external analysis used to produce such estimates.
- The model, of necessity is a simplified representation of real-world events. It does not consider all potential health conditions, all types of individual circumstances and all types of economic impact.
- The model assumes that past performance (in terms of treatment costs, transition probabilities, population profiles and many other parameters) are a reasonable basis from which to predict the future.
- Results will vary according to the evaluation period chosen.
Work continues over time to refine and improve the model and mitigate any limitations. Sensitivity analysis and optimism bias are both regularly used to ensure any model results are interpreted and used appropriately.
Developmental history of the model
PHE first developed a weight management economic assessment tool in 2014.
This was used to support analysis on sugar reduction and later calorie reduction, and through a series of changes eventually became Version 1 of the Calorie Model, developed by DHSC and PHE working together.
The model and its assumptions were the subject of a Technical Consultation Document which DHSC published in 2018.
The original model was developed in Microsoft Excel, but an upgraded version was developed in the ‘R’ programming language, by DHSC analysts following the consultation. This ‘version 2’ of the model was more flexible and it allowed more accurate modelling of weight loss or gain, a longer evaluation period (if desired) and greater ability to model different groups of people. It became possible to model adults and children separately.
These ‘version 2’ changes were published in 'Further advertising restrictions for products high in fat, salt and sugar: impact assessment': Annex E.
Differences in version 3
Version 3 (the current model) was developed by DHSC analysts in late 2019 and is now in use. This version:
- added liver disease to the model
- added a limited capability for measuring comorbidities
- extended the scope of the economic productivity analysis
- improved the accuracy of the QALY calculations, by reflecting the deterioration in health that naturally occurs as the population ages
Quality assurance (QA) was carried out in line with the principles set out in the government Aqua book.
PHE provided independent assurance to complement the work within DHSC.
Annex B: summary of costs and benefits for a 9pm watershed for advertising HFSS products on TV
The online restrictions will be implemented alongside a 9pm watershed for advertising HFSS products on TV. The costs, benefits and methodology for a 9pm watershed on TV is outlined in the 2019 consultation stage IA (see option B) and includes transition costs of around £1 million, a loss of around £111.6 million in advertising revenue per year for broadcasters and a loss up to £1.5 million per year in commission for advertising agencies. Furthermore, retailers and manufacturers of HFSS products will see their profits reduce by on average £0.6 million and £0.2 million per year, respectively.
The health benefits are estimated to be around 64,000 Quality Adjusted Life Years, or a present value of £1.4 billion when monetised. There would be additional health benefits to the population from reinvesting cost savings back into the NHS; these are estimated to be worth around £0.6 billion. Social care savings would amount to £40 million and reduced premature mortality would be expected to deliver an additional £31 million of economic output.
Other forms of media are also expected to gain £1.6 billion worth of additional revenue over the appraisal period due to HFSS advertising being displaced from TV. Likewise, HFSS retailers and manufacturers are expected to gain £0.3 billion in advertising cost savings.
It is important to consider that these estimates assume that businesses will try to mitigate costs by displacing advertising to other mediums and in the case for option B in the 2019 consultation stage IA, to online media. As restrictions on TV advertising would be accompanied with online restrictions (either option 1 or 2 outlined in this document), the estimates presented above will change. The impacts of the final policy following this consultation will be presented in the consultation response.
References
-
Halford JC et al. (2007). Beyond-brand effect of television (TV) food advertisements/commercials, in Public Health Nutrition 11(9):897-904 ↩
-
Halford JC, Gillespie J, Brown V, Pontin EE, Dovey TM. (2004). Effect of television advertisements for foods on food consumption in children. Appetite. Apr 1;42(2):221-5. ↩
-
Hastings G, Stead M, McDermott L, Forsyth A, MacKintosh AM, Rayner M, Godfrey C, Caraher M, Angus K. (2003). Review of research on the effects of food promotion to children. London: Food Standards Agency. Sep 22. ↩
-
Estimated weekly hours of media consumption at home or elsewhere, among users, by age: 2018 - Children and parents media use and attitudes – see figure 1 in the consultation document ↩
-
AA/WARC Expenditure Reports 2017 & 2019 ↩
-
Gatineau M, Dent M. (2011). Obesity and mental health. National Obesity Observatory: Oxford UK ↩
-
Abbasi A, Juszczyk, D, et al. (2017). Body mass index and incident type 1 and type 2 diabetes in children and young adults: a retrospective cohort study. Journal of the Endocrine Society, 1(5), 524-537 ↩
-
Simmonds, M, Llewellyn et al. (2016). Predicting adult obesity from childhood obesity: a systematic review and meta analysis. Obesity reviews, 17(2), 95-107 ↩
-
Guh et al. (2009). The incidence of co-morbidities related to obesity and overweight: a systematic review and meta- analysis. BMC Public Health, 9(1), 88 ↩
-
Scheen, A J. (2002). Obesity and liver disease. Best Practice & Research Clinical Endocrinology and Metabolism, 14(4), 703-716 ↩
-
Hursti UK. Factors influencing children's food choice. Annals of medicine. 1999 Jan 1;31(sup1):26-32. ↩
-
Cairns, G., Angus, K., Hastings, G. & Caraher, M. (2013). Systematic reviews of the evidence on the nature, extent and effects of food marketing to children. A retrospective summary. Appetite, 62, pp. 209-215. ↩
-
Ara et al. (2012) What is the clinical effectiveness and cost-effectiveness of using drugs in treating obese patients in primary care? A systematic review. Health technology assessment (Winchester, England);16(5):iii, (accessed 28/06/2018). ↩
-
Provided by Lumen Research ↩
-
Search advertising contains a component of search-engine optimisation, which impacts the order of site search results and likelihood of directing children to HFSS advertisers, but does not constitute a HFSS advert. It has not been possible to estimate the child impressions associated with this form of spend. As per the 2019 consultation stage impact assessment, search and classified ads have been excluded from the modelling. (Accessed: 02/10/2020) ↩
-
An 'impact' is defined as one view of an advert by one person. Therefore, ten impacts could be ten views by one person or one advert viewed by ten people. ↩
-
AA/WARC Expenditure Report April 2018 ↩
-
Out of the 145,000 employed in the sector (DCMS Economic estimates) - 145,000*0.41=59,500 ↩
-
An NPM failing product is a food product with an NPM of 4 or greater or a drink with an NPM of 1 or greater. ↩
-
Gross margins ranging from around 6% at Tesco and Sainsbury's to around 4% at Morrisons These figures are based on the amount of gross profit these retailers reported in their annual accounts. ↩
-
'Below the line marketing' is marketing outside of traditional advertising formats, such as price promotions. ↩
-
Based on Kantar's estimate of displacement cinema and press would see a negligible increase in children's exposure relative to that estimated on television or online. We have assumed that the interaction of film classification with the Cinema Advertising Association's system of pre-clearance of HFSS advertising in cinemas helps to account for this limited exposure. For print Ofcom's Digital Day report estimates that in 2016, 3% of 6 to 11 year-olds read magazines and 1% read newspapers each week (print and digital). For 11 to 15 year-olds, 4% read magazines and 10% newspapers each week. It seems reasonable to assume that HFSS advertising shifting to newspapers or magazines would have relatively little impact on children's advertising exposure. This is before taking account of CAP food advertising restrictions in publications that have a child audience of 25% or more, which would reduce HFSS exposure in print media further. ↩
-
Model results can be applied to the rest of the UK by applying a pro-rata adjustment based on population size. This may not take full account of demographic and health-related differences but should suffice on an indicative basis. ↩
-
We use Health Survey for England (HSE) and Office for National Statistics (ONS) population data and projections. ↩
-
Quality-adjusted life years (QALYs) are the standard currency used in health evaluations to measure the duration and quality of life combined. A value of 1.00 represents a year of life in perfect health. Someone living with an obesity-related condition is assumed on average to have a lower quality of life and/or a lower life expectancy than someone of similar age without that condition. The social value of QALYs (ie the value placed on them by the public) is £60,000 each. Further detail on how and why QALYs are used is provided in the Treasury Green Book (page 72). (Accessed: 02/10/2020) ↩
-
Equivalent inputs (such as an expected change in weight or BMI status) can also be used with appropriate conversion upfront. ↩
-
Hall KD, Butte NF, Swinburn BA, Chow CC. Dynamics of childhood growth and obesity: development and validation of a quantitative mathematical model. The lancet Diabetes & endocrinology. 2013 Oct 1;1(2):97-105. ↩
-
Ara, R., L. Blake, L. Gray, M. Hernández, M. Crowther, A. Dunkley, F. Warren et al. "What is the clinical effectiveness and cost-effectiveness of using drugs in treating obese patients in primary care? A systematic review." Health technology assessment (Winchester, England) 16, no. 5 (2012) ↩