Statistical release: October to December 2022 (quarter 3, financial year 2022 to 2023)
Updated 26 July 2023
Applies to England, Scotland and Wales

© Crown copyright 2023
This publication is licensed under the terms of the Open Government Licence v3.0 except where otherwise stated. To view this licence, visit nationalarchives.gov.uk/doc/open-government-licence/version/3 or write to the Information Policy Team, The National Archives, Kew, London TW9 4DU, or email: psi@nationalarchives.gov.uk.
Where we have identified any third party copyright information you will need to obtain permission from the copyright holders concerned.
This publication is available at https://www.gov.uk/government/statistics/housing-benefit-statistics-on-speed-of-processing-for-2022-to-2023/statistical-release-october-to-december-2022-quarter-3-financial-year-2022-to-2023
Housing Benefit (HB) is an income related benefit that is intended to help meet housing costs for rented accommodation.
This summary contains statistics on the average time taken (speed of processing) to process new HB claims and change of circumstances to existing HB claims for Great Britain. The average used is the mean and is measured in calendar days, rounded to the nearest day.
Reference to rolling average annual figures (covering the year up to each point) are included in this bulletin to smooth seasonality and illustrate the trend over time. For more information on this please see our background information note.
1. Main stories
The main stories for quarter 3 2022 to 2023 (October 2022 to December 2022) are:
-
the average speed of processing for new HB claims is 20 calendar days in the latest quarter, which is one day lower than last quarter and one day higher than the same quarter a year earlier. Since quarter 3 2020 to 2021, the rolling average year-end figures show the general trend to be an increasing one
-
the average speed of processing for change of circumstances to an existing HB claim is 8 calendar days in the latest quarter, which is one day lower than last quarter and the same as quarter 3 2021 to 2022. Since quarter 4 2020 to 2021, the rolling average year-end figures showed the trend to be slightly increasing, however the increase has slowed in the latest quarter
2. Average speed of processing
Rolling average year-end figures for average speed of processing for new HB claims show an increasing trend since quarter 3 2020 to 2021
Average speed of processing data at GB level by claim type (quarterly and year-end figures) for quarter 1 2012 to 2013 to quarter 3 2022 to 2023
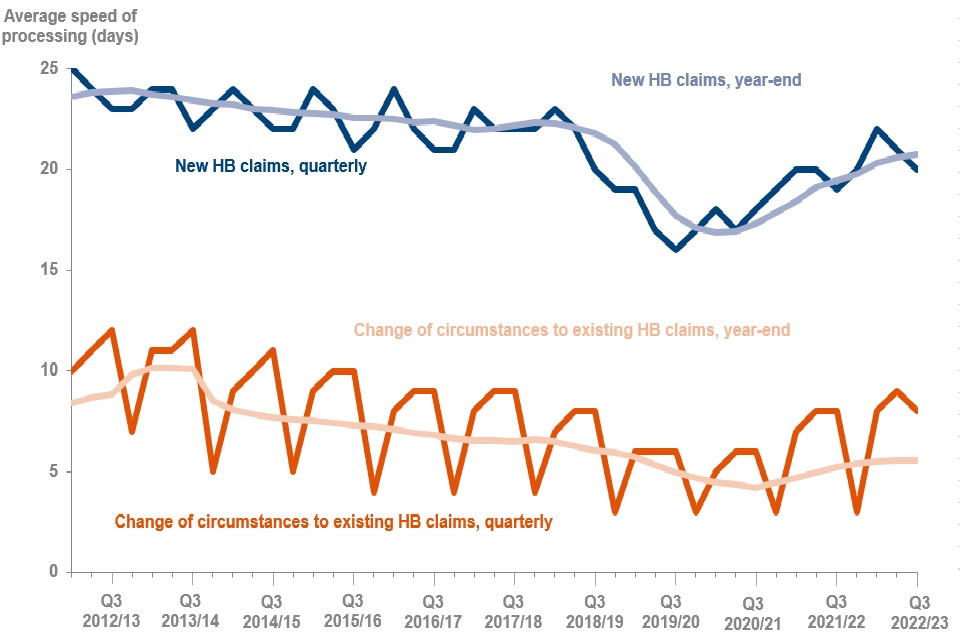
Note: year-end data are calculated using a quarterly rolling average over each annual period. Please see our background methodology note for more information about how we calculate year-end averages.
The average time taken to process a new HB claim during the latest quarter was 20 calendar days. This is one day lower than the previous quarter and one day higher than the same quarter a year earlier.
Historically, rolling average year-end speed of processing days for new HB claims show a decreasing trend to quarter 4 2019 to 2020, where they remained stable to quarter 2 2020 to 2021. However, since the year ending quarter 3 2020 to 2021 the rolling average number of days follows an increasing trend. This coincides with the changes to operational processes, including the reallocation of resource, due to the historic and continued impact of the COVID-19 pandemic.
The average number of days taken to process a change of circumstance to an existing HB claim during the latest quarter was 8 calendar days. This is one day lower than quarter 2 2022 to 2023 and the same as quarter 3 2021 to 2022.
Rolling average year-end times for change of circumstances to existing HB claims peaked in the year ending quarter 1 2013 to 2014 then steadily decreased to quarter 3 2020 to 2021. Since quarter 4 2020 to 2021 the rolling average year-end figures showed the trend to be slightly increasing, however in the latest quarter this increase has slowed.
It is useful to note that in quarter 4 each year, the volume of change of circumstances to existing HB claims increases, due to the end of the financial year before the uprating of rent. However, the average number of days to process those claims decreases because LAs tend to allocate extra resource to process these changes. In the other quarters, the volume of change of circumstances to existing HB claims decrease and have a higher average speed of processing.
Focusing on monthly average processing times allows us to view in-quarter variation. In quarter 3 2022 to 2023, the monthly average number of calendar days to process new HB claims was:
- 21 calendar days for October
- 20 calendar days for November and
- 19 calendar days for December
In quarter 3 2022 to 2023, the monthly average number of calendar days to process change of circumstances to existing HB claims was:
- 9 calendar days for October
- 9 calendar days for November and
- 7 calendar days for December
3. Volumes of new HB claims and change of circumstances to existing HB claims
On average, LAs process a greater number of change of circumstances to existing HB claims than new HB claims.
Volume of HB Claims in GB, quarter 3 2022 to 2023
| Type of Claim | Number of Claims processed | Proportion of Claims Processed |
|---|---|---|
| New HB Claims | 91,000 | 8% |
| Change of Circumstances to existing HB Claims | 990,000 | 92% |
During the latest quarter there were 91,000 (8%) new HB claims processed and 990,000 (92%) change of circumstances to existing HB claims processed in GB. This compares to 83,000 (8%) new HB claims and 1 million (92%) change of circumstances to existing HB claims at the same quarter a year earlier.
The volume of new HB claims at year-end has increased slightly
Average number of new HB claims processed (quarterly and year-end volumes) quarter 1 2012 to 2013 to quarter 3 2022 to 2023
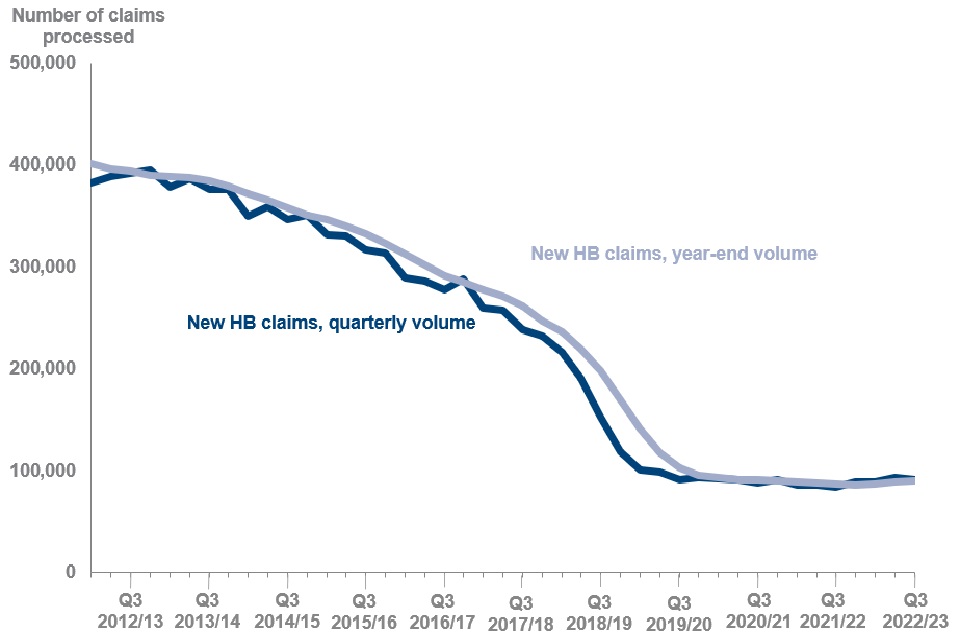
During the latest quarter there were 91,000 new HB claims processed, which is a decrease of 1,300 (1%) since last quarter, and an increase of 7,900 (10%) when compared to the same quarter a year earlier. Rolling average year-end figures showed a decreasing trend from quarter 1 2012 to 2013 up until quarter 3 2019 to 2020. The figure hit a low point at quarter 4 2021 to 2022, followed by a slightly increasing trend seen up to the latest quarter.
It should be noted that the number of new HB claims processed is not comparable with the DWP HB caseload statistics. The total number of claims processed in these statistics include all HB claims processed regardless of outcome, whereas HB caseload statistics are HB claims which are live and in payment. This means that the numbers and trends described in this release may be different to those described in the HB caseload statistics.
Year-end rolling averages for the volume of change of circumstances to existing HB claims has been decreasing but the downward trend is slowing
Average number of change of circumstances to existing HB claims processed (quarterly and year-end volumes) quarter 1 2012 to 2013 to quarter 3 2022 to 2023
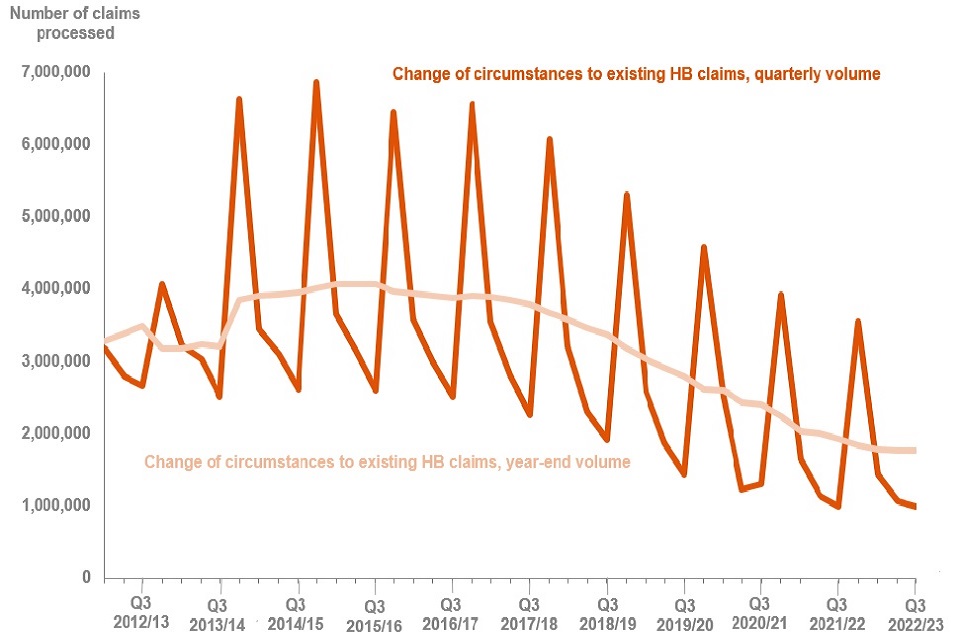
During the latest quarter there were 990,000 changes of circumstances for existing HB claims processed, which is a decrease of 69,000 (6%) since last quarter and a decrease of 6,200 (1%) when compared to the same quarter a year earlier. Historical rolling average year-end figures showed an increasing trend until quarter 2 2015 to 2016 but have decreased since then. More recently, the downward trend is slowing.
It is useful to note that in quarter 4 each year, the volume of change of circumstances to existing HB claims increases sharply, due to the end of the financial year before the uprating of rent.
The majority of claims processed are due to change of circumstances with a much lower proportion attributed to new claims
Percentage of claims processed by type (year-end figures) quarter 1 2012 to 2013 to quarter 3 2022 to 2023
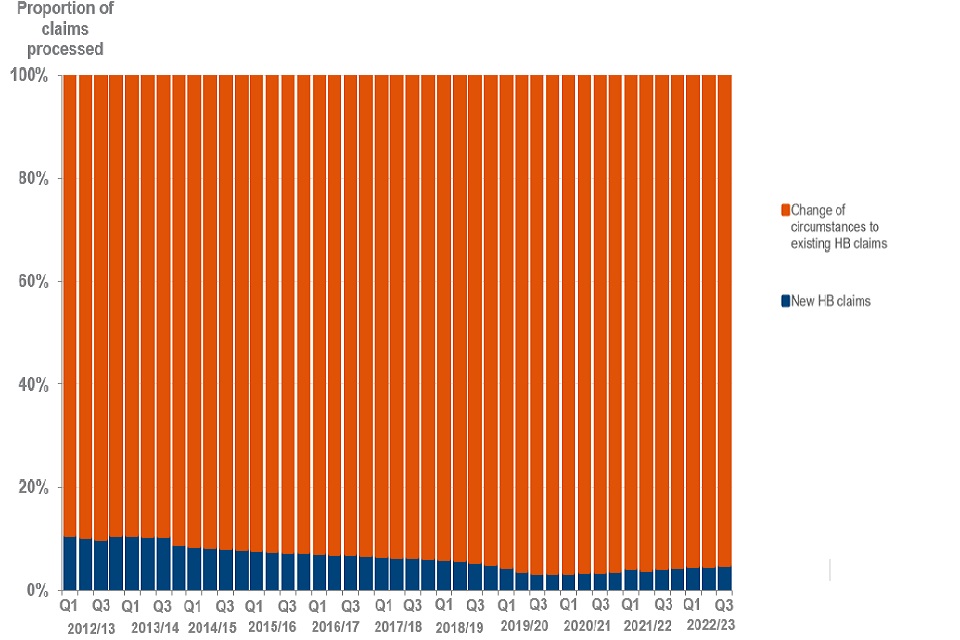
Note: Figures are based on rolling average year-end data. Please see our background methodology note for more information about how we calculate year-end averages.
Since the 2012 to 2013 financial year, there have been a greater number of change of circumstances to existing HB claims processed, compared with new HB claims. Rolling average year-end figures show a very gradual decrease in the percentage of new claims processed when compared with change of circumstances until quarter 2 2019 to 2020. The figure remained stable until quarter 3 2020 to 2021, but since then there has been a slight increasing trend.
Although the proportion of new HB claims, when compared to change of circumstances to existing HB claims, has increased at year-end, this is mainly due to a decreasing volume of change of circumstances to existing HB claims whilst new HB claim volumes have increased very slightly.
The changes in volume of both new HB claims and change of circumstances to existing HB claims are due to the impact of the Universal Credit (UC) roll-out, which has also affected figures reported at the LA level. The rollout of UC was completed in December 2018 and now the majority of new applications for help with housing costs are processed through UC across GB and only claims made in particular circumstances are eligible for HB.
Volumes of both new HB claims and change of circumstances to existing HB claims are changing, but at different rates. This is due to the change in the types of claims being processed. For example, changes to a claimant’s circumstances may lead to a claimant being moved to UC, however, there are a small number of people that are still able to apply for HB, including pensioners, who have fewer changes to declare, and working age claimants who are in supported, sheltered or temporary housing. Read about who can get Housing Benefit. It should be noted that care should be exercised when interpreting data at a LA level in the accompanying data tables.
4. Average speed of processing by Local Authority
Quarterly average number of days to process new HB claims and change of circumstances to existing HB claims can be illustrated at the LA level for GB. For a more detailed breakdown see table 1 of the accompanying data tables.
The average number of days to process new HB claims varies by Local Authority
Average speed of processing at local authority level for new HB claims for quarter 3 2022 to 2023
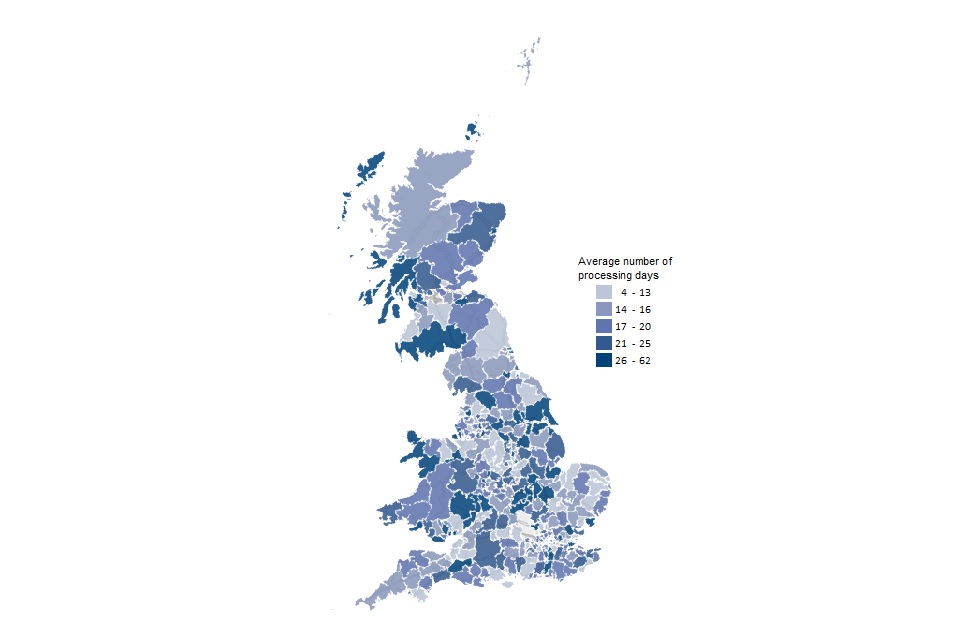
Details for the average speed of processing for individual LAs can be seen in table 1 of the accompanying data tables
On average a new HB claim takes longer to process than a change of circumstance to an existing HB claim. Detailed figures in the accompanying data tables show greater variability for new HB claims in comparison to change of circumstances to existing HB claims.
The quarterly average number of days to process new HB claims at the LA level ranged from 4 to 62 calendar days during quarter 3 2022 to 2023:
- 292 (81%) of LAs had a quarterly average of 4 to 25 calendar days
- 64 (18%) of LAs took on average between 26 to 47 calendar days
- 3 (1%) of LAs took on average between 55 to 62 calendar days
Variations between the average number of days that each LA takes to process a new HB claim or a change of circumstance to an existing HB claim should be seen in context with changes relating to operational processes, including conversions of computer systems and LA mergers.
The average number of days to process change of circumstances to existing HB claims varies by Local Authority
Average speed of processing at local authority level for change of circumstances to existing HB claims for quarter 3 2022 to 2023
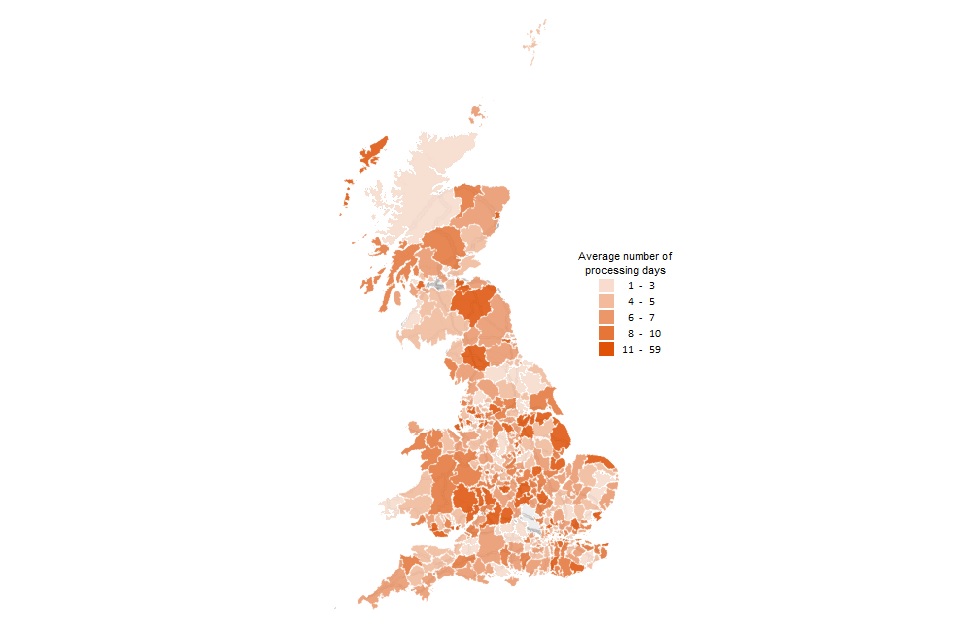
Details for the average speed of processing for individual LAs can be seen in table 1 of the accompanying data tables
The quarterly average number of days to process change of circumstances to existing HB claims at the LA level ranged from 1 to 59 calendar days during quarter 3 2022 to 2023:
-
294 (82%) of LAs had a quarterly average number of 1 to 10 calendar days
-
61 (17%) of LAs took on average between 11 to 28 calendar days
-
4 (1%) of LAs took on average between 36 to 59 days
5. What you need to know
National, Official and Experimental Statistics are produced in accordance with the Statistics and Registration Service Act 2007 and the Code of Practice for Statistics. This release contains Official Statistics on speed of processing of HB claims for quarter 3, 2022 to 2023. They are compiled following the standards of trustworthiness, quality and public value set out within the Code.
The statistics are released quarterly in April, July, October and January and are sourced from data originally collected via administrative systems, the Single Housing Benefit Extract.
The statistics show speed of processing of new HB claims and change of circumstances to existing HB claims. The volume of new HB claims and change of circumstances to existing HB claims are also included here for context. The total days to process are included in supporting detailed tables that can be viewed in the HB: Statistics on speed of processing collection page including a breakdown at LA level.
Genuine variations between months can occur at a LA level. For example, some of these are caused by time limited issues or localised changes in operational policy. Hence, figures for individual LAs should be interpreted with care.
Quarterly and annual totals may not be entirely consistent with monthly figures. This is because any LAs that do not have data for every month of the quarter or year are not included in the quarterly or annual breakdowns. Average year-end figures include data over the previous 12 months, but there may be inconsistencies where LAs do not have available data for the period.
From April 2013, UC was introduced. Read more about UC. The process of migrating claimants to UC began with single claimants and was expanded to other claimant types via the UC Full Service (UCFS). The UCFS rollout was completed in December 2018 and it is now available in every Jobcentre across the UK. Read the rollout schedule for Full Service. UCFS implementation dates for each LA are provided in the accompanying data tables for this release.
Figures included in this release are rounded in line with our rounding policy as outlined in the following table and in our background methodology note.
| Range | Rounded to the nearest |
|---|---|
| 0 to 1,000 | 10 |
| 1,001 to 10,000 | 100 |
| 10,001 to 100,000 | 1,000 |
| 100,001 to 1,000,000 | 10,000 |
| 1,000,001 to 10,000,000 | 100,000 |
| 10,000,001 to 100,000,000 | 1,000,000 |
Specific Local Authority data issues
It is worth noting that speed of processing times are derived from LA administrative systems. Sometimes changes to LAs’ IT processes and system conversions can result in higher levels of LA speed of processing times for months while these changes are taking place. Sometimes we need to omit certain LA data due to concerns over the quality of the data however the omission of LA data does not change the story in the release but can sometimes have a slight impact on regional level figures.
The following LA’s have been omitted this quarter due to data concerns:
- HB speed of processing statistics do not include figures for Gloucester LA because of a cyber-attack suffered by the LA impacting data provision. Therefore, speed of processing figures for Gloucester will be omitted in line with our standard approach for handling missing data or data with quality concerns. Analysis for Gloucester using historical data shows that the GB and regional (South West) level speed of processing figures are not impacted by the omission of Gloucester data. Volumes of both types of HB claims are likely to be affected by less than 1% at GB level and around 4% at regional (South West) level
Hackney LA have now resumed the supply of HB speed of processing data to DWP. Their data is included within this release but because recovery work in Hackney is ongoing, speed of processing figures are still likely to be impacted
6. Where to find out more
Background methodology note
Read the background information and frequently asked questions on statistics for the average time taken to process HB claims (previously right time indicator statistics).
Other National and Official Statistics
DWP publish HB Caseload National Statistics. The statistics are published quarterly showing monthly caseload figures which are measured on a claimant basis. Full statistics on HB caseload since August 2013 are available from Stat-Xplore and Excel.
DWP also publish HB Debt Recovery National Statistics showing fraud volumes and incorrectly overpaid benefit based on data from LAs.
Read details of other National and Official Statistics produced by the DWP.
Historical data
The historical Housing Benefit & Council Tax Benefit Claims Administration Quarterly Performance Data which is available from 2007 to 2008 are based on clerical returns made by individual LAs. Breakdowns of New HB Claims and Change of Circumstances to existing HB Claims Speed of Processing are available historically, and the New HB Claims Speed of Processing are broadly comparable over time. However, a change in definition for Change of Circumstances to existing HB Claims between 2007 to 2008 and 2009 to 2010 means that direct comparison of this element with Speed of Processing statistics is not meaningful.
DWP publication guidance
Read the DWP statistical summary policies and statements for information about policies and procedures on DWP National and Official Statistics, including a Quality Guideline, Confidentiality and Access Policy Statement, Pre-release Access arrangements and Statement of Administrative Sources.
Feedback
DWP welcomes feedback on all the statistical publications as it ensures that publications remain relevant to the users. Please use the HB Speed of Processing questionnaire to send us any specific feedback that you may have on this publication. DWP will use the information to:
- target future consultations at interested users
- shape the future direction of statistics development to address user needs; help ensure value for money, whilst giving users a structured way of expressing their views
Completed questionnaires can be returned by e-mail to cbm.stats@dwp.gov.uk. Users can also join the Stats UserNet “Welfare and Benefit Statistics” community. DWP announces items of interest to users via this forum, as well as replying to users’ questions.
Press enquiries should be directed to the DWP Press Office, telephone: 0115 965 8781.
Other enquiries about these statistics should be directed by email to:
Producer of this release: Michael Hatton and Navneet Rai cbm.stats@dwp.gov.uk
Lead statistician: James Gray james.gray9@dwp.gov.uk
ISBN: 978-1-78659-514-0