School inspection data summary report (IDSR) guide
This guide provides an overview of the inspection data summary report (IDSR) for primary and secondary schools, including schools with a sixth form, and gives guidance on how to interpret the data.
Applies to England
Overview of the Ofsted IDSR
Inspectors use the IDSR when they are preparing for, and during, school inspections. The IDSR summarises and analyses the data (statistical information) that is available about a school. It is designed to be used alongside our school inspection toolkit, to guide inspectors’ conversations with school leaders. It is not meant to provide a complete picture of a school or any judgement or assessment of a school.
The IDSR can contain sensitive information about schools and colleges. It is the responsibility of each user to make sure they store and share the IDSR appropriately and securely. Please see our IDSR conditions of use and storage statement.
During a school inspection, inspectors gather evidence of the quality of education from various sources. This includes nationally generated information about pupils’ progress and attainment. The IDSR only provides a starting point. Inspectors will want to see first-hand evidence of the quality of education that pupils experience and to understand how well leaders know what it is like to be a pupil at the school.
Example IDSRs
These example IDSRs contain made-up data for a fictional primary school and a fictional secondary school with a sixth form:
IDSRs are generated based on school data at a point in time and will be different from school to school.
Access your school’s Ofsted IDSR
As a web page on our website
You can access the report directly through our Ofsted IDSR service or through the Department for Education (DfE)’s Analyse School Performance (ASP) service. You will need a DfE Sign-in account and associated permissions for the school(s). Users who want to look at data from more than one school should use our direct link.
Ofsted cannot give or take away access to DfE Sign-in accounts or add schools. But the approver for your school or organisation will be able to help. To find out who your approver is, log in to your DfE Sign-in account and click on the ‘Services’ tab. Then click on ‘See approvers at an organisation’.
Reporting data issues
The data in the IDSR is mainly provided by the DfE. If your question is about the values displayed, such as the Attainment 8 score or cohort, check whether the IDSR data matches the data on the Analyse school performance (ASP) website and Compare school and college performance in England websites. If the IDSR data matches the information on these websites, then please contact the DfE. If your question is about calculations that are only used in the IDSR, for example standard deviations and confidence intervals, please email the IDSR team. We will respond as soon as possible.
Link to a predecessor or successor school
If applicable, the Ofsted IDSR service will provide a link to a predecessor (or successor) school’s IDSR. Some schools with a predecessor will not have a link. This is because we do not include predecessor schools if there was no data on them.
School details
The information about the school at the beginning of the report comes from the DfE’s Get Information about Schools (GIAS) service.
The trust
Data source: the Ofsted inspection outcome data and the DfE’s GIAS service.
This section provides information about the multi-academy trust (MAT) that the school belongs to. It only applies to schools that are part of a MAT.
It has information about the number of schools in the trust and their latest inspection outcomes. All-through schools are counted as secondary schools. Schools inspected under the renewed education inspection framework (EIF) from November 2025 onwards will be graded in up to 9 evaluation areas. Schools inspected in the academic year 2024/25 did not receive an overall effectiveness grade.
The grade profile of schools within a MAT displays the latest inspection outcome that schools have received under their current URNs or if they have not yet been inspected. It is split into 4 sections:
-
schools inspected from November 2025
-
schools last inspected in the 2024/25 academic year
-
schools last inspected prior to September 2024
-
schools not yet inspected
If a school was last inspected under a different URN before it joined the MAT, it will be counted in the ‘Not yet received graded or ungraded inspection’ group until it is inspected as part of the MAT. However, if it was last inspected before it joined the MAT and still has the same URN that it had when it was inspected, the outcome from that inspection will be counted in the grade profile of the MAT.
Context of the school
This section of the IDSR contains contextual information about the school and its pupils. This covers the following: school characteristics, ethnicity, special educational needs (SEN), year group and prior attainment.
School characteristics
Data source: the DfE’s January school census for 2025, 2024 and 2023 and children in need census for 2024, 2023 and 2022.
The chart shows school-level information for the last 3 years. For a school that has a sixth form, an additional row will show information for Years 12, 13 and, where applicable, 14.
The chart contains the following measures:
-
the number of pupils on roll
-
the percentage of pupils receiving free school meals (FSM): pupils who are or have been eligible for FSM and have claimed them during Reception to Year 11 sometime in the last 6 years – referred to as FSM6 (FSM data is not collected for sixth forms)
-
the percentage of pupils who are children in need: this is defined under the Children Act 1989 as a child who is unlikely to reach or maintain a satisfactory level of health or development, or their health or development will be significantly impaired without the provision of children’s social care services, or the child is disabled. Children in need include pupils on child in need plans or child protection plans, looked after children, care leavers and disabled children. It also includes children waiting for a referral to be considered or an assessment to be completed. These are pupils who were a child in need at any point during the reporting year, for example between 1 April and 31 March inclusive. Referrals leading to no further action or assessments that have been closed with no further action, or where the case has been referred to early help are not included in the IDSR children in need data
-
the percentage of pupils who receive special educational needs (SEN) support but do not have an education, health and care (EHC) plan
-
the percentage of pupils who have a statement of SEN or an EHC plan
-
the percentage of pupils whose first language is not English or is believed to be other than English
-
the stability percentage for the school
-
the pupil deprivation level
-
the school deprivation level
For each measure, the school’s figures are shown for each of the last 3 years. Other than for special schools, text and shading are used to show where the school sits within the national distribution of all schools.
Other than for special schools, there are separate rows for each measure, which show the average for the local area of the school. Text and shading are used to show the banding of the local area average within the national distribution of all schools. The local averages are based on the DfE spring census of pupils at schools in the same phase. Local area averages are not shown for the school number on roll, location deprivation or stability measures.
Local area is based on the middle-layer super output area (MSOA) in which the school resides. MSOAs are made up of usually 4 or 5 groups of lower-layer super output areas (LSOAs). LSOAs are geographical areas designed to improve the reporting of statistics on small areas in England and Wales. They are made up of between 400 and 1,200 households and have a population of between 1,000 and 3,000 people. MSOAs comprise between 2,000 and 6,000 households and have a resident population of, generally, between 5,000 and 15,000 people. MSOAs fit within local authorities. The MSOA used in the IDSR for each school will be displayed at the top of this section. For more information about MSOAs, visit the Office for National Statistics website.
Below are the possible bandings for this section:
-
Well above average (blue shading)
-
Above average
-
Close to average
-
Below average
-
Well below average (orange shading)
National distribution banding shows how the school or local average figure compares with the national figure. Except for the school location deprivation measure, if the value is more than 0.5 standard deviations (SDs) above the national rate, it is classed as ‘Above average’. If it is less than 0.5 SDs below the national rate, it is classed as ‘Below average’. If it is more than one SD above the national rate, it is classed as ‘Well above average’ and highlighted in blue. If it is at less than one SDs below the national rate, it is classed as ‘Well below average’ and highlighted in orange. Otherwise, it is ‘Close to average’ and shown in grey.
More information about these statistical concepts and how to interpret the tables and charts in the IDSR can be found in the Understanding the data in the IDSR section.
Except for the school location deprivation measure, schools are compared with schools in the same phase: primary (including middle deemed primary) or secondary (including middle deemed secondary, and all-through schools).
The banding for the school location deprivation measure is based on quintiles rather than SDs.
Stability is a measure of the percentage of pupils who were admitted to the school at the standard time of admission. The stability percentage is calculated by dividing the number of pupils who meet the stability criteria by the number of all eligible pupils (pupils in Years 1 to 11 with a single or main dual registration at the school at the time of the January school census). The stability measure is not available for school sixth forms.
A pupil is counted as stable if they joined the school:
-
in or before September in Year 1
-
in or before the month by which at least 5% of their year group also joined the school
-
in a month/national curriculum year combination in which at least 40% of the year group joined the school, which must equate to at least 10 pupils in primary schools or 20 pupils in secondary schools
-
in a month/national curriculum year combination in which at least 10% of the year group joined the school, which must equate to at least 10 pupils in primary schools or 20 pupils in secondary schools, and the same month/national curriculum year combination met these criteria in at least one other year group in the school
The school location deprivation refers to the level of deprivation in the school’s local area, which is based on the 2021 LSOA that the school falls within. The pupil deprivation level is about the deprivation of pupils who attend the school. Each deprivation indicator is based on the Income Deprivation Affecting Children Index (IDACI). The IDACI is based on 2025 English indices of deprivation.
The IDACI measures the proportion of all children aged 0 to 15 living in income-deprived families. It is a subset of the income-deprivation domain, which measures the proportion of the population in an area experiencing deprivation relating to low income. The definition of ‘low income’ that we use includes those people who are out of work and those who are in work but have low earnings and who satisfy the respective means tests.
You can read further information about the data used.
The DfE uses different rules to allocate 16- to 18-year-old students (where applicable) to the different measures. The year group characteristics are based on the census data, so there may be students who were no longer on roll at the January census but are still allocated to the provider for accountability purposes.
Ethnicity
Data source: the DfE’s January school census for 2025.
The chart displays the ethnic groups within the whole school. There are 17 possible ethnic groups:
-
White: British
-
White: Irish
-
White: Traveller of Irish Heritage
-
White: Gypsy/Roma
-
White: Any other White background
-
Mixed: White and Black Caribbean
-
Mixed: White and Black African
-
Mixed: White and Asian
-
Mixed: Any other Mixed background
-
Asian or Asian British: Indian
-
Asian or Asian British: Pakistani
-
Asian or Asian British: Bangladeshi
-
Asian or Asian British: Any other Asian background
-
Black or Black British: Caribbean
-
Black or Black British: African
-
Black or Black British: Any other Black background
-
Chinese
‘Any other ethnic group’ is also displayed. ‘Parent/pupil preferred not to say’ and ‘Ethnicity not known’ are not displayed.
The corresponding national value for each group is displayed.
If the school has a sixth form, a separate ethnicity chart will be displayed.
SEN
Data source: the DfE’s January school census for 2025 and Get Information about Schools (GIAS) service.
The table displays the number of pupils in the school who have special educational needs (SEN) and the primary need category. The 2 halves of the table represent pupils who have SEN support and pupils who have an education, health and care (EHC) plan.
It also shows the school year that the pupil is in. The text above the tables displays any resourced provision that the school has. This could be a SEN unit, resourced provision or both. The capacity represents how many pupils the provision displayed can accommodate. The type of SEN provision lists, where applicable, the type of SEN that is provided for.
This section also displays how many pupils with SEN have received free school meals (FSM) at any time during the last 6 years and/or who are looked-after children (in the care of the local authority for a day or more or who have been adopted from care).
SEN units are special provisions within a mainstream school where pupils with SEN are taught in separate classes for at least half their time. They:
-
are designated by the local authority specifically for making SEN provision, and sometimes accommodate pupils registered at other schools on a part-time basis
-
receive funding per place, and usually top-up funding for any additional costs of support required by individual pupils
-
cater for a specific type or types of SEN (for example autistic spectrum disorder)
-
are usually for pupils with an EHC plan, but may also provide support for pupils with SEN support
Schools should only use this indicator where the SEN unit has been formally recognised as such by the local authority in which the school is located.
Resourced provisions are places that are reserved at a mainstream school for pupils with a specific type of SEN who are taught for at least half their time within mainstream classes, but require a base and some specialist facilities around the school. They:
-
are designated by the local authority specifically for making this kind of SEN provision
-
receive funding per place, and usually top-up funding for any additional costs of support required by individual pupils
-
cater for a specific area or areas of SEN (for example specific learning difficulties)
-
are usually for pupils with an EHC plan, but could include pupils with SEN support
The capacity of the SEN unit and/or resourced provision (how many pupils it/they can accommodate) will also be displayed alongside the type of SEN provision.
Schools should only use this indicator where the resourced provision has been formally recognised as such by the local authority in which the school is located.
Most pupils placed in units will have an EHC plan. It is unlikely that a child would be placed in a unit and also receive support from resourced provision, but a school could have resourced provision for one type of need and a unit for another.
Year group
Data source: the DfE’s January school census for 2025, children in need census for 2024 and children looked after return for 2025.
The year group table provides information about the characteristics of the pupils in each year group. This section will appear for all schools that submit a January school census return to the DfE.
The table presents data on pupils who were recorded as part of the DfE’s January school census. This means that the data for each year group is about the pupils who were in that year group during the last academic year.
The measures included in the table are:
-
the number of pupils on roll
-
the percentage of pupils receiving free school meals (FSM): pupils who are or have been eligible for FSM and have claimed them, during Reception to Year 11, sometime in the last 6 years – referred to as FSM6 (FSM data is not collected for sixth forms)
-
the percentage of pupils whose first language is not English or is believed to be other than English
-
the number of pupils identified as young carers
-
the percentage of pupils who are children in need: this is defined under the Children Act 1989 as a child who is unlikely to reach or maintain a satisfactory level of health or development, or their health or development will be significantly impaired without the provision of children’s social care services, or the child is disabled. Children in need include pupils on child in need plans or child protection plans, looked after children, care leavers and disabled children. It also includes children waiting for a referral to be considered or an assessment to be completed. These are pupils who were a child in need at any point during the reporting year, for example between 1 April and 31 March inclusive. Referrals leading to no further action or assessments that have been closed with no further action, or where the case has been referred to early help are not included in the IDSR children in need data
-
the number of looked-after children: these are pupils who were looked after for at least one day during the reporting year and were aged 4 to 15 at 31 August; this excludes looked-after children under an agreed series of short placements and those who were on remand/committed for trial or sentence and accommodated by the local authority. IDSRs using the January 2025 school census will show children who were looked after between 1 April 2024 and 31 March 2025 inclusive
No highlighting is applied to this table; figures are presented for information only.
The DfE uses different rules to allocate 16- to 18-year-old students (where applicable) to the different measures. The year group characteristics are based on the census data, so there may be students who were no longer on roll at the DfE’s January school census but are still allocated to the provider for accountability purposes.
Prior attainment
Data source: the DfE’s January school census for 2025.
The prior attainment table shows how the school’s pupils performed at the previous key stage compared with all pupils in that year group nationally.
This section will only appear for schools with any year groups in the secondary age range (Years 7 to 11 inclusive), because there is limited prior attainment data available for other year groups.
The table presents data on pupils who were recorded as part of the DfE’s January school census. This means that the data for each year group refers to pupils who were in that year group in the last academic year. The data in the table focuses on the performance of these secondary-age pupils in their key stage 2 assessments:
-
The pupils who were in Years 7, 8 and 9 in the latest year’s data and sat assessments when they were in key stage 2; the data for these year groups is based on the proportion of the school’s pupils who achieved the expected standard at key stage 2.
-
The pupils who were in Years 10 and 11 in the latest year’s data and did not sit assessments when they were in key stage 2 because of the COVID-19 pandemic, so no prior attainment data is available.
Outlining indicates whether the proportion of the school’s pupils who achieved the expected standard at key stage 2 was above (blue outline) or below (orange outline) the national proportion. The outlining appears if the school value is more than one standard deviation away from the national value. If the proportion is one standard deviation or less away from the national value, the text ‘Close to national’ is displayed. If the number of pupils in the specified year group was 5 or below, the text ‘Small cohort’ is displayed.
Staffing
Data source: the DfE’s November 2024, 2023, 2022 and 2021 school workforce census data.
The staffing section of the IDSR provides information about several areas relating to staffing.
The proportion of education support staff relative to teaching staff
This sentence reports on the proportion of education support staff relative to teaching staff in the latest year and, where applicable, the 2 previous years.
Example sentence
The proportion of education support staff relative to teaching staff was in the lowest 20% of all schools in [latest year], [previous year] and [furthest year].
Teacher absence
A sentence gives the percentage of teachers with at least one period of sickness absence compared with the national rate for the latest 3 years.
Another sentence reports on the average number of days lost to teacher sickness absence in the latest year only.
Example sentences
-
The percentage of teachers with at least 1 period of sickness absence was significantly above national in [latest year].
-
Two days on average were lost to teacher sickness absence in [latest year]. This was in the lowest 20% nationally.
Staff retention
Information on staff turnover is calculated using the number of full-time equivalent (FTE) turnover leavers and the total FTE staff at the school. A school is considered to have high staff turnover if its turnover rate was in the highest 20% in any of the previous 3 years. Low staff turnover is not highlighted. Special schools are compared with primaries.
Turnover and leavers at a school level can be very volatile from year to year. When looking at rates of leavers and turnover, it is important to consider school size, because this has a particularly big impact on turnover rates for small schools.
Example sentences
-
At the time of the November [latest year] census, there was 1 full-time vacant teacher post in the school.
-
Staff turnover was in the highest 20% in: [latest year], [previous year].
Attendance and behaviour
This section contains data for daily attendance, overall attendance, persistent absence, suspensions and permanent exclusions. There is a set of tables and charts for each topic, providing data for the school and a comparison with the national average for the most recent 3 years of available data.
Daily attendance
Data source: the DfE’s 2025/26 daily attendance collection up to and including summer part 1.
Schools share this data through their management information system (MIS) via Wonde to the DfE.
Ofsted receives aggregated school-level attendance summary data, not individual pupil records.
The data includes:
- overall attendance and absence rates
- attendance patterns by pupil groups (such as FSM and SEN)
This is the same summary information your school sees in its half-termly attendance summary report on View your education data (VYED). As such, Ofsted does not receive daily attendance data for special schools.
Schools are responsible for ensuring attendance data recorded in their MIS is accurate and up to date.
Further information can be found in the DfE’s user guide.
Attendance and persistent absence
Data source: the DfE’s 2024/25 (3 term), 2023/24 (3 term), 2022/23 (3 term) and 2018/19 (3 term) academic year data from the ‘Pupil absence in schools in England’ statistical release series.
Other than for special schools, this section contains tables and charts for overall attendance and persistent absence, which provide data for the school and a comparison with the national average. To compare the school value with the national average, we have calculated standard deviations (SDs) and confidence intervals (CIs). More information about these statistical concepts and how to interpret the tables and charts in the IDSR can be found in the Understanding the data in the IDSR section.
For special schools, this section contains only tables presenting the school level values for overall attendance and persistent absence.
The overall attendance and persistent absence measures are calculated only for those pupils who are of compulsory school age – that is aged between 5 and 15 as at the start of the academic year (31 August). You can find more information on how this is collected and calculated in the DfE’s Pupil absence statistics methodology.
Each set of tables and charts is available for 3 different pupil groups within the cohort of pupils of compulsory school age:
-
all pupils enrolled at the school
-
free school meals (FSM) pupils: those who have been eligible for FSM at any time during the last 6 years – referred to as FSM6
-
pupils who have a statement of special educational needs (SEN) or an education, health and care (EHC) plan, or who receive SEN support but do not have an EHC plan
This section includes data for 2018/19 because, nationally, attendance declined sharply in 2020/21 during the COVID-19 pandemic and has not recovered. Inclusion of 2018/19 data will show whether the school has managed to return to pre-pandemic attendance levels. The 2018/19 data is visually separated from the most recent 3 years to highlight the break in the time trend.
Attendance
This section contains tables and charts showing the overall attendance of pupils at the school, as a percentage. This is calculated as:
100 – ((number of absence sessions/number of sessions it was possible to attend) * 100)
Absence is the total of all authorised and unauthorised absences.
Tables
Each table contains the following:
-
Year – This is the academic year and number of terms the data relates to (for example, 2024/25 (2 term) means the autumn and spring terms of the 2024/25 academic year).
-
Cohort – This is the number of pupils of compulsory school age enrolled at the school in the specified pupil group.
-
School – This is the overall attendance rate of all pupils of compulsory school age.
-
National – This shows the average overall attendance rate for all schools in the same phase of education: primary (including middle deemed primary) or secondary (including middle deemed secondary and all-through schools). The national is not displayed for special schools.
-
National distribution banding – This shows how the school’s overall attendance rate compares with the national rate. If the school’s rate is more than 0.5 SDs above the national rate, it is classed as ‘Above’ and highlighted in green. If the school’s rate is more than 0.5 SDs below the national rate, it is classed as ‘Below’ and highlighted in red. Otherwise it is ‘Close to average’ and shown in grey. Due to the methodology used to calculate overall attendance, this banding does not indicate statistical significance. The national distribution banding is not displayed for special schools.
-
Trend – This shows whether the school trend is in line with the national trend, or if the school’s attendance has improved or declined relative to the national change. Trends are not available for 2018/19 as no earlier comparator year is displayed. A school’s attendance could be lower than in the previous year, but the trend could say ‘Relative improvement’ if the national change was a greater decline. The trend is not displayed for special schools.
-
School context – This indicates whether the whole school has a higher-than-average proportion of pupils who have been eligible for FSM at any time during the last 6 years (FSM6), or a higher-than-average proportion of pupils with SEN (including those who receive SEN support, or have a statement of SEN or an EHC plan). For example, it will say ‘High – FSM’ if the school’s proportion of FSM pupils is more than one SD higher than the proportion of FSM pupils nationally. The school context is not displayed for special schools.
Charts
Other than for special schools, below each table is a set of charts illustrating how the school’s overall attendance rate compares to the national distribution (that is, to all other schools in the same phase of education), for the last 3 years. Each chart contains the following elements:
-
The national average – This is shown as a turquoise-coloured vertical dashed line.
-
Three sections corresponding to the proportion of schools whose overall attendance rate is above, below or close to the national average (based on 0.5 SDs above or below the mean).
-
The school’s overall attendance rate – This is shown as a coloured circle in one of the sections. The circle will be green if the school’s overall attendance rate is more than 0.5 SDs above the national average, red if it is more than 0.5 SDs below the national average, and grey is if it is close to the national average.
Overall attendance data is negatively skewed: a small number of schools have very low attendance so there is a long below-the-national-average section, but only approximately a quarter of schools fall into this band.
Persistent absence
A pupil is identified as being persistently absent if they miss 10% or more of their possible sessions.
Tables
Each table in the persistent absence section contains the same information as overall attendance. However, there are some slight differences in how the figures are calculated, which are highlighted below:
-
Year – This is the academic year and number of terms the data relates to (for example, 2024/25 (2 term) means the autumn and spring terms of the 2024/25 academic year).
-
Cohort – This is the number of pupils of compulsory school age enrolled at the school in the specified pupil group.
-
School – This is the percentage of pupils who are persistently absent at the school. This is calculated by dividing the number of persistently absent pupils by the cohort and is expressed as a percentage.
-
National – This is the national average percentage of pupils who are persistently absent: the mean across all schools in the same phase of education. The national is not displayed for special schools.
-
National distribution banding – This shows how the persistent absence rate for the school compares with the national rate. This is calculated differently from overall attendance, as it uses both the SD and a CI to indicate whether the school’s persistent absence rate is, statistically, significantly above or below the national average. School values that are significantly above average – Above (sig+) – are highlighted red. School values that are significantly below average – Below (sig−) – are highlighted green. All other values are shown in grey. More details about how the bandings are calculated and how to interpret them can be found in the Understanding the data in the IDSR section. The national distribution banding is not displayed for special schools.
-
Trend – This indicates whether there has been a statistically significant increase or decrease in the school’s persistent absence rate in a particular year, compared with the previous year. The year 3 rate is compared with 2018/19 to illustrate how persistent absence has changed since the COVID-19 pandemic. Trends are not available for 2018/19, as no earlier comparator year is displayed. The national distribution banding is not displayed for special schools.
-
School context – This shows whether the school has a higher-than-average proportion of pupils with FSM or SEN. The school context is not displayed for special schools.
Charts
Other than for special schools, below each table is a set of charts illustrating how the school’s persistent absence rate compares to the national average (that is, to all other schools in the same phase of education) in the last 3 years. Each chart contains the following elements, which are mainly calculated in a similar way to those of the overall attendance charts (see above):
-
The national average – This is shown as turquoise-coloured vertical dashed line.
-
Three sections corresponding to the proportion of schools whose persistent absence rate is above, below or close to the national average.
-
The school’s persistent absence rate – This is shown as a coloured circle in one of the sections. The circle will be green if the school’s persistent absence rate is significantly below the national average, red if it significantly above the national average, and grey is if it not significantly above or below the national average.
-
The CI – This is shown by horizontal lines extending from the school value (coloured circle). This defines the range in which the true school value is likely to fall and illustrates whether the school’s persistent absence rate is significantly above or below the national average. See the Understanding the data in the IDSR section for more details on how to interpret CIs.
Persistent absence data is positively skewed: a small number of schools have a very high percentage of pupils who are persistent absent, so there is a long above-the-national-average section, but only approximately a quarter of schools fall into this band. Some of these high rates may be due to errors in the source data.
Suspensions and permanent exclusions
Data source: the DfE’s 2024/25 (spring term), 2024/25 (autumn term), 2023/24 (3 term) and 2022/23 (3 term) academic year data.
This section contains tables and charts for suspensions and permanent exclusions. These provide data for the school and a comparison with the national average.
The number and proportion of pupils who have had suspensions or permanent exclusions in a school are often very small, especially in primary schools. These figures should be interpreted with caution, particularly when making comparisons over time. The suspensions and permanent exclusions data can be up to one year behind and therefore may not relate to the same cohort as other IDSR data.
Further information about pupil exclusion statistics can be found in the DfE’s pupil exclusion statistics methodology publication.
Whole school
The whole-school measure includes all year groups in the school.
One or more suspensions
This section contains tables and, other than for special schools, charts displaying information about pupils who have had one or more suspensions, for the most recent 3 years for which data is available.
The data is available for 3 different pupil groups:
-
all pupils enrolled at the school
-
free school meals (FSM) pupils: those who have been eligible for FSM at any time during the last 6 years (FSM6)
-
special educational needs (SEN) pupils: pupils who have a statement of SEN or an education, health and care (EHC) plan, or who receive SEN support but do not have an EHC plan
To compare the school’s data with the national average, we have calculated standard deviations (SDs) and confidence intervals (CIs). More information about these statistical concepts and how to interpret the tables and charts in the IDSR can be found in the Understanding the data in the IDSR section.
Tables
Each table contains:
-
Year – This is the academic year and the term(s) the data relates to.
-
Cohort – This is the number of pupils enrolled at the school in the specified pupil group.
-
School – This is the percentage of pupils who have had one or more suspensions in the academic year. This is calculated by dividing the number of pupils suspended by the cohort and is expressed as a percentage.
-
National – This is the national average percentage of pupils who have had one or more suspensions: the mean of all schools in the same phase of education – primary (including middle deemed primary) or secondary (including middle deemed secondary and all-through schools). The national is not displayed for special schools.
-
National distribution banding – This shows how the school’s suspension rate compares with the national rate. This comparison uses both the SD and a CI to indicate whether the school’s suspension rate is, statistically, significantly above or below the national average. School values that are significantly above average – Above (sig+) – are highlighted red. School values that are significantly below average – Below (sig−) – are highlighted green. All other values are shown in grey. More details about how the bandings are calculated and how to interpret them can be found in the Understanding the data in the IDSR section. The national distribution banding is not displayed for special schools.
-
Trend – This indicates whether there has been a statistically significant increase or decrease in the school’s suspension rate in a particular year from the previous year. Trends are not available for year 3, as no earlier comparator year is displayed. Trend is not applicable for any comparisons that would involve termly data, due to fluctuations across terms.
-
School context – This shows whether the whole school has a higher-than-average proportion of pupils who have been eligible for FSM at any time during the last 6 years (FSM6), or a higher-than-average proportion of pupils with SEN (including those who receive SEN support, or have a statement of SEN or an EHC plan). For example, it will say ‘High – FSM’ if the school’s proportion of FSM pupils is more than one SD higher than the proportion of FSM pupils nationally. The school context is not displayed for special schools.
Charts
Other than for special schools, below each table is a set of charts illustrating how the school’s suspension rate compares to the national average for the last 3 years. Each chart contains the following elements:
-
The national average percentage of pupils who have had one or more suspensions – This is shown as a turquoise-coloured vertical dashed line.
-
Three sections corresponding to the proportion of schools whose suspension rate is above, below or close to the national average.
-
The school’s rate – This shows the percentage of pupils at the school who have one or more suspensions, shown as a coloured circle in one of the sections. The circle will be green if the school’s suspension rate is significantly below the national average, red if it significantly above the national average, and grey is if it not significantly above or below the national average.
-
The CI – This is shown by horizontal lines extending from the school value (coloured circle). It defines the range in which the true school value is likely to fall and illustrates whether the school’s suspension rate (percentage of pupils who have had one or more suspensions) is significantly above or below the national rate. See the Understanding the data in the IDSR section for more details on how to interpret CIs.
Suspension rate data is positively skewed, especially for primary schools, because many schools have a very low suspension rate. However, a small number of schools have a higher rate, so there is a long above-the-national-average section, but only approximately a quarter of schools fall into this band. Some of these high rates may be due to errors in the source data.
Two or more suspensions
This section contains tables and, other than for special schools, charts displaying information about pupils who have had 2 or more suspensions for the most recent 3 years for which data is available.
The data is available for 3 different pupil groups:
-
All pupils enrolled at the school
-
FSM pupils: those who have been eligible for FSM at any time during the last 6 years (FSM6)
-
SEN pupils: those pupils who receive SEN support but who do not have an EHC plan or those who have a statement of SEN or an EHC plan
To compare the school value with the national average, we have calculated SDs and CIs. More information about these statistical concepts and how to interpret the tables and charts in the IDSR can be found in the Understanding the data in the IDSR section.
Tables
Each table contains:
-
Year – This is the academic year and the term(s) the data relates to.
-
Cohort – This is the number of pupils enrolled at the school in the specified pupil group.
-
School – This is the percentage of pupils who have had 2 or more suspensions in the academic year. This is calculated by dividing the number of pupils who have been suspended at least twice by the cohort and is expressed as a percentage.
-
National – This shows the national average percentage of pupils who have had 2 or more suspensions: the mean of all schools in the same phase of education – primary (including middle deemed primary) or secondary (including middle deemed secondary and all-through schools). The national is not displayed for special schools.
-
National distribution banding – This shows how the school’s suspension rate compares with the national rate. This comparison uses both the SD and a CI to indicate whether the school’s suspension rate is, statistically, significantly above or below the national average. School values that are significantly above average – Above (sig+) – are highlighted red. School values that are significantly below average – Below (sig−) – are highlighted green. All other values are shown in grey. More details about how the bandings are calculated and how to interpret them can be found in the Understanding the data in the IDSR section. The national distribution banding is not displayed for special schools.
-
Trend – This shows whether there has been a statistically significant increase or decrease in the school’s suspension rate in a particular year, compared with the previous year. Trends are not available for Year 3, as no earlier comparator year is displayed. Trend is not applicable for any comparisons that would involve termly data, due to fluctuations across terms.
-
School context – This indicates whether the whole school has a higher-than-average proportion of pupils who have been eligible for FSM at any time during the last 6 years (FSM6), or a higher-than-average proportion of pupils with SEN (including those who receive SEN support, or have a statement of SEN or an EHC plan). For example, it will say ‘High – FSM’ if the school’s proportion of FSM pupils is more than one SD higher than the proportion of FSM pupils nationally. The school context is not displayed for special schools.
Charts
Other than for special schools, below each table is a set of charts illustrating how the school’s suspension rate compares to the national average for the last 3 years. Each chart contains the following elements:
-
The national average percentage of pupils who have had 2 or more suspensions, shown as a turquoise-coloured vertical dashed line.
-
Three sections corresponding to the proportion of schools whose suspension rate is above, below or close to the national average.
-
The school’s rate – This shows the percentage of pupils at the school who have had 2 or more suspensions, shown as a coloured circle in one of the sections. The circle will be green if the school’s suspension rate is significantly below the national average, red if it significantly above the national average, and grey is if it not significantly above or below the national average.
-
The CI – This is shown by horizontal lines extending from the school value (a coloured circle). It defines the range in which the true school value is likely to fall and illustrates whether the school’s suspension rate (percentage of pupils who have had 2 or more suspensions) is significantly above or below the national average. See the Understanding the data in the IDSR section for more details on how to interpret CIs.
Suspension rate data is positively skewed, especially for primary schools, because many schools have a very low suspension rate. However, a small number of schools have a higher rate, so there is a long above-the-national-average section, but only less than a quarter of schools fall into this band. Some of these high rates may be due to errors in the source data.
Suspension reasons
This section contains 2 tables, both of which contain data for the most recent 3 years for which data is available.
The first shows the total number of suspensions at the school across the 3 years. This is based on the number of suspensions, not the number of pupils who have been suspended.
The second table shows the reasons for suspensions across the 3 years. For each suspension, up to 3 reasons (from a fixed list) can be recorded to provide detail on why the suspension was issued, for example ‘persistent disruptive behaviour’. These reasons are recorded without weighting or prioritisation. The table lists any reasons for suspensions across the most recent 3 years, and the total number of suspensions recorded with each specified reason per year. This table will only be displayed if there has been at least 1 suspension across the 3 years. Due to the ability to record more than 1 reason per suspension, the total number of reasons may exceed the total number of suspensions.
Permanent exclusions reasons
This section contains 2 tables, both of which contain data for the most recent 3 years for which data is available.
The first table shows the total number of permanent exclusions at the school across the 3 years. For comparison, the table also contains the national average number of permanent exclusions, profiled by phase of education. The national is not displayed for special schools.
The second table shows the reasons for permanent exclusions across the 3 years. For each exclusion, up to 3 reasons (from a fixed list) can be recorded to provide detail on why the exclusion was issued, for example ‘physical assault against a pupil’. These reasons are recorded without weighting or prioritisation. The table lists any reasons for permanent exclusions across the most recent 3 years and the total number of permanent exclusions recorded with each specified reason per year. This table will only be displayed if there has been at least 1 permanent exclusion across the 3 years. Due to the ability to record more than 1 reason per exclusion, the total number of reasons may exceed the total number of permanent exclusions.
16 to 18
Data source: the DfE’s 2024/25 (spring term), 2024/25 (autumn term), 2023/24 (3 term) and 2022/23 (3 term) academic year data.
Data for 16-to-18-year-olds includes data for the school’s sixth form, if it has one: Years 12, 13 and, where applicable, 14. Charts and indications of statistical significance are not available for 16-to-18-year-olds, due to the low number of suspensions and permanent exclusions in the age group.
Suspension reasons
This section contains 3 tables, each of which contains data for the most recent 3 years for which data is available.
The first shows the total number of suspensions in the school’s sixth form across the 3 years. This is based on the number of suspensions, not the number of students who have been suspended.
The second table shows the number of students who have had 1 or more suspensions across the most recent 3 years. Due to the low number of suspensions nationally in school sixth forms, it not possible to make the same statistical comparisons as for the whole-school measure. Instead, we present suspensions in the same way as permanent exclusions and display the school number and the national average, profiled by phase of education. The national is not displayed for special schools. For the same reason, the IDSR does not show school sixth-form students who have had 2 or more suspensions or 10 or more suspensions.
The third table shows the reasons for suspensions across the 3 years. For each suspension, up to 3 reasons (from a fixed list) can be recorded to provide detail on why the suspension was issued, for example ‘persistent disruptive behaviour’. The reasons are recorded without weighting or prioritisation. The table lists any reasons for suspensions across the most recent 3 years, and the total number of suspensions recorded with each specified reason per year. This table will only be displayed if there has been at least 1 suspension across the 3 years. Due to the ability to record more than 1 reason per suspension, the total number of suspension reasons may exceed the total number of suspensions.
Permanent exclusion reasons
This section contains 2 tables, both of which contain data for the most recent 3 years for which data is available.
The first table shows the total number of permanent exclusions in the school’s sixth form across the 3 years. For comparison, the table also contains the national average number of permanent exclusions, profiled by phase of education. The national is not displayed for special schools.
The second table shows the reasons for permanent exclusions in the school’s sixth form across the 3 years. For each exclusion, up to 3 reasons (from a fixed list) can be recorded to provide detail on why the exclusion was issued, for example ‘physical assault against a pupil’. These reasons are recorded without weighting or prioritisation. The table lists any reasons for permanent exclusions across the most recent 3 years and the total number of permanent exclusions recorded with each specified reason. This table will only be displayed if there has been at least 1 permanent exclusion across the 3 years. Due to the ability to record more than 1 reason per exclusion, the total number of exclusion reasons may exceed the total number of permanent exclusions.
Links to alternative provision and other providers
Data source: the DfE’s autumn term 2025 alternative provision (AP) placements data.
The table shows information about AP placements. This section will appear for all schools that submitted information on AP placements in the latest data.
The placements include AP, companies, providers registered with the UK Register of Learning Providers, further education and other schools.
The total number of pupils is shown, as well as the number of pupils attending full time and part time. Numbers in brackets are additional pupils who were attending the AP but left during the census period.
Example
| URN | UKPRN | Companies House number | Postcode | Provider type | Provider name | Total pupils | Full time | Part time |
|---|---|---|---|---|---|---|---|---|
| 123456 | - | - | AB1 2AB | Free Schools Alternative Provision | Example Academy | 4 (2) | 2 (1) | 2 (1) |
In the example school above, 6 pupils in total were placed at the AP; 3 of these were part time and 3 were full time. However, the ‘Total pupils’ column shows that 4 pupils remained in the placement at the end of the census period, and 2 had left during the census period. The final 2 columns show that one full-time pupil and one part-time pupil left during the period.
Pupil movement
Data source: movement between the DfE’s January school censuses for 2024 and 2025, 2023 and 2024, and 2022 and 2023.
We have used pupil-level data from the DfE’s January school census to identify pupils who were in each school in January of a given year, and whether they were still in the same school in January of the following year.
The pupil movement section presents 2 different measures of pupil movement:
-
pupils who were present in Year 10 in the first school census, but not in Year 11 at the same school in the second census
-
pupils who were present in the first school census in Years 7, 8, 9 or 10, but did not appear at the same school in the second census
The pupil movement section of the IDSR only covers pupil movement for secondary Years 7, 8, 9 or 10.
We do not use the census data from other school terms for this analysis, for example the autumn term census. This may mean that the figures do not match those produced by some schools or local authorities.
We developed a logistic multi-level model that uses contextual factors to estimate the proportion of pupils who we might expect to leave each school. This is for movements between Years 10 and 11 only. Our analysis shows that these contextual factors are associated with higher levels of pupil movement. The contextual factors that the model takes into account are pupil and school characteristics. Pupil movement between Years 10 and 11 may be highlighted as ‘significant’ if pupil movement was higher than estimated by the model. The following are the pupil characteristics:
-
gender
-
eligibility for free school meals in the past 6 years
-
speaking English as an additional language
-
key stage 2 attainment (low, middle, high or not present in key stage 2)
-
having special educational needs (SEN), especially social, emotional or mental health issues
-
being in either the White Irish Traveller or White Roma ethnic group
-
being looked after by a local authority
-
Income Deprivation Affecting Children Index (IDACI) of home postcode
The model also takes into account whether the school area is urban.
When calculating the significance of Year 10 to 11 pupil movements between 2024 and 2025, the prior attainment for these pupils (at the end of key stage 2) was not available for use in our multi-level model. This was due to COVID-19 disrupting key stage tests for these pupils in 2020. This means that the significance flag for moves between 2024 and 2025 is not comparable with previous years.
This section of the IDSR also provides information about pupils who have left the school and then do not appear in the subsequent DfE January school census in one of the following school types:
-
maintained nursery
-
primary
-
middle deemed primary
-
middle deemed secondary
-
secondary
-
all through
-
special school (including non-maintained special schools)
-
pupil referral unit/alternative provision
-
academy (including free schools, university technical colleges and studio schools)
-
city technology college
There are destinations outside of the census that the pupil may have moved to, which the school may have information about that they can share with inspectors.
This section is not produced for special schools or service children’s education providers.
Qualifications
Key stage 4 subject entries
Data source: the DfE’s final 2025, final 2024 and final 2023 data.
This section shows the subjects that a particular school entered pupils for in the latest 3 years and the number of entries for each. It also highlights whether the school had a high or low average point score (APS) in a particular subject compared with other schools, where applicable.
The entries figure represents the number of exam entries rather than the number of pupils entered. Exam entries are counted in the academic year when the pupil who entered for the exam reached the end of key stage 4. Therefore, if a pupil was entered for the same subject in 2 different exam seasons, this would count as 2 entries in the academic year when they finished their key stage 4 study. For example, a pupil was entered for GCSE English literature when they were in Year 10, then was entered again for GCSE English literature when they were in Year 11 in the most recent year. This would count as 2 entries in GCSE English literature in the most recent performance year.
Discounting has not been applied to this table, so it includes entries that may not have counted in performance measures. The purple shading is darker where there was a greater number of entries. Subjects are grouped by English Baccalaureate (EBacc) and sector subject area and then listed alphabetically by subject. EBacc subjects are presented at the top by default. The sector subject areas are based on those listed in the qualification descriptions.
A shaded box and corresponding text appear if the school’s APS for pupils in a particular subject is more than 0.5 standard deviations (SDs) above or below the national APS in that subject. There are further details about standard deviations later in this document.
The word ‘Below’ will appear if the school’s APS is less than the national APS: −0.5 SDs or more in point score. The word ‘Above’ will appear if the school’s APS is greater than the national APS: +0.5 SDs or more in point score. This interpretation of the APS will only be available if the number of entries for that subject in the school was greater than 5, and if the school entry rate was above the national entry rate in that subject.
Qualification type is also included, which covers the following:
-
AS level
-
EBacc AS level
-
EBacc GCSE
-
EBacc level 1/level 2 certificate
-
Free Standing Mathematics Qualification level 3
-
GCSE
-
graded music
-
level 1/level 2 certificate
-
level 1 certificate
-
level 1/2 certificate
-
level 2 certificate
-
other at level 1
-
other at level 2
Please note that for technical awards, any entries for a level 1 qualification may be grouped with those for the level 2 qualification in the same subject. Such figures will be represented as a single row where the ‘Qualification type’ is listed as ‘Level 1/2’.
The cohorts above the section represent total pupil numbers at the end of key stage 4.
16 to 18 qualification types
Data source qualification type: the DfE’s final 2025, final 2024 and final 2023 data.
This table displays the proportion of students undertaking each type of qualification.
Students may be working towards more than one type of qualification and so may be counted more than once. Students taking courses that are not full qualifications are not included. Students taking academic qualifications other than A levels are not included in the table under individual qualification types but are included in the cohort information. Therefore, the percentages may not add up to 100.
Below the table is a sentence that appears when there is something significant or exceptional to highlight about the proportion of students who have not taken any level 3 or level 2 DfE-approved qualification in the latest year. This highlights when a school is in the highest or lowest 20% nationally for the latest year or the latest 2 years.
A sentence will also be shown if the school is delivering T levels in 2025/26, as shown in published DfE data.
16 to 18 retention
Data source retention: the DfE’s final 2025, final 2024 and final 2023 data.
This section provides data on the extent to which a provider retained students until the end of the main learning aim of their study programme in the latest 3 years. The measure used in this section is ‘Retained and assessed’.
Students are counted in the ‘Retained and assessed’ measure if they are retained until the end of their course and are assessed. The assessment may not necessarily be in the same subject or type of qualification that they were aiming for when their studies began. However, the assessment must be at the same level and at least the same size as the main aim. For example, a student with an original main aim of tech level at size 1 would be considered as retained and assessed with an applied general exam result of at least size 1. Data is presented for 4 study programmes:
-
A levels (including AS level)
-
level 3 applied general
-
level 3 tech level
-
level 2 technical certificate
Highlighting is applied on this table. Blue boxes are displayed when all students were retained, and the cohort was greater than 5. Orange boxes are displayed when the value is in the bottom decile when compared to all providers and the cohort is greater than 5.
The DfE’s 16 to 18 qualifications guidance lists all the qualifications that count in the performance tables each year from 2018 to 2026. The DfE also publishes further guidance about 14 to 19 technical and applied qualifications. The definition of a student’s study programme is based on their main aim. The DfE’s 16 to 18 accountability measures technical guide provides further information on how this is defined.
16 to 18 subject entries
Data source: the DfE’s final 2025, final 2024 and final 2023 data.
This section shows the subjects that the school entered students for in the latest 3 years and the number of entries for each.
The entries figure represents the number of exam entries rather than the number of students entered. Exam entries are counted in the academic year when the student who was entered for the exam reached the end of their 16 to 18 course of study. Therefore, if a student was entered for the same subject in 2 different exam seasons, this would count as 2 entries in the academic year when they finished their course of study. For example, a student who was entered for a technical certificate in business studies when they were in Year 12 was entered again when they were in Year 13 in the latest year. This would count as 2 entries in the business studies technical certificate in the latest performance year. Discounting has not been applied to this table, so this includes entries that may not have counted in performance measures. The purple shading is darker where there was a higher number of entries. Subjects are grouped by sector subject area and listed alphabetically, first by area then by subject. Qualification type is also included, which covers the following:
-
A level
-
Applied single award
-
Applied double award
-
Pre-U principal
-
International Baccalaureate
The cohorts above the section represent the total number of students at the end of 16 to 18 studies.
Achievement in phonics and at key stage 2
Data sources:
Phonics and multiplication tables check – the DfE’s final 2025, final 2024 and final 2023 data.
Key stage 2 – the DfE’s final 2025, final 2024, final 2023 and final 2022 data.
What data is included in this section?
This section provides information about school performance in phonics and at key stage 2, covering an array of attainment and progress measures, as detailed below.
The attainment measures are:
-
Key stage 2 reading, writing and mathematics (RWM) meeting the expected standard
-
Key stage 2 RWM achieving the higher standard
-
Key stage 2 reading meeting the expected standard
-
Key stage 2 reading achieving the higher standard
-
Key stage 2 writing meeting the expected standard
-
Key stage 2 writing achieving greater depth
-
Key stage 2 mathematics meeting the expected standard
-
Key stage 2 mathematics achieving the higher standard
-
Key stage 2 English grammar, punctuation and spelling (EGPS) meeting the expected standard
-
Key stage 2 EGPS achieving the higher standard
-
Year 4 multiplication tables check (MTC) score
-
Phonics screening check (Year 1) meeting the expected standard
The progress measures are:
-
Key stage 2 reading progress
-
Key stage 2 writing progress
-
Key stage 2 mathematics progress
Wherever possible, data is presented for these measures for the most recent 3 years and is provided separately to cover:
-
all pupils – all pupils included in the measure
-
disadvantaged pupils – those pupils included in the measure who were eligible for free school meals at any time during the last 6 years and/or were looked-after children (in the care of the local authority for a day or more or who have been adopted from care)
-
low/middle/high prior attainers – those pupils included in the measure, for whom records of their performance at key stage 1 were available and who were grouped into the low/middle/high prior attainment categories, respectively, according to DfE definitions of these categories. Further information about how these categories are defined is available in the Primary school accountability guide
The exact data and breakdowns available will vary by the measure, the pupil group, and the school’s particular cohort, as described below:
-
For the all pupils group, all key stage 2 attainment measures are available, and the data sources are: the DfE’s final 2025, final 2024 and final 2023 data.
-
For the disadvantaged pupil group, all key stage 2 attainment measures for pupils meeting the expected standard are available, but pupils achieving the higher standard/greater depth are not available. The data sources are: the DfE’s final 2025, final 2024 and final 2023 data.
-
For the Year 4 MTC score, breakdowns of results for disadvantaged pupils and low/middle/high prior attainers are not available, and the data sources are: the DfE’s final 2025, final 2024 and final 2023 data.
-
For the phonics screening check (Year 1) meeting the expected standard, breakdowns of results for disadvantaged pupils and low/middle/high prior attainers are not available, and the data sources are: the DfE’s final 2025, final 2024 and final 2023 data.
-
For all key stage 2 progress measures, broken down for all pupils, disadvantaged pupils and low/middle/high prior attainers, the data sources are: the DfE’s final 2023 and final 2022 data. This is because pupils reaching the end of key stage 2 in 2025 and 2024 did not sit their key stage 1 assessments, which are used as the baseline prior attainment for progress, due to COVID-19 disruption.
-
For low/middle/high prior attainers, all key stage 2 attainment measures for pupils meeting the expected standard are available, but pupils achieving the higher standard/greater depth are not available. The data sources are: the DfE’s final 2023 and final 2022 data. This is because pupils reaching the end of key stage 2 in the most recent 2 data years did not sit their key stage 1 assessments, which are used to define the prior attainment groups, due to COVID-19 disruption.
-
Individual schools may be missing a year, or years, of data for a given measure and/or pupil group if they did not have any pupils in that group in that year. This is particularly likely to affect smaller primary schools.
Additionally, wherever possible, we have averaged school and national results across data years to produce what we call a multi-year average. The IDSR will calculate either a 3-year or 2-year average depending on the national availability of data for each measure and pupil group combination. This helps us smooth out year-to-year fluctuations in the data so we can spot genuine trends and significant patterns that might otherwise be hidden. This is particularly important in small schools, where a single pupil’s outcome can disproportionately affect the data.
You can find more information on the accountability measures in this DfE guidance document:
How is school performance assessed?
For each measure and pupil group combination, an assessment is provided of school performance for each available year of data (and for the multi-year average, where available). For each year of data, the methodology examines the national distribution of schools for that measure and pupil group and shows where a school sits within that distribution. That means the school values for disadvantaged pupils and low/middle/high prior attainers are compared to the national values for disadvantaged pupils and low/middle/high prior attainers, respectively.
The national distributions for each measure, pupil group and data year are determined using the statistical concept of standard deviations (SDs). This concept adapts to each unique distribution and takes into account the variation or spread of values. Each national distribution is centred around the relevant national value and divided into bandings: ‘Below’, ‘Close to average’ and ‘Above’.
Ultimately, combining the national distribution bandings, the national value, the school value’s position within the distribution, and a measure of statistical confidence in the school value, there are 7 possible interpretations of school performance:
-
Above (sig+)
-
Above (non-sig)
-
Close to average (sig+)
-
Close to average (non-sig)
-
Close to average (sig−)
-
Below (non-sig)
-
Below (sig−)
The full details of how we arrive at these interpretations and what each of them mean are available later in this document.
Tables
For the all-pupil group and for low/middle/high prior attainers, each table contains:
-
Year – This is the academic year the data relates to (for example, 2023 means 2022/23).
-
Cohort – This indicates the number of pupils included in the measure.
-
School – This shows the school value for that measure.
-
National – This shows the national value for that measure.
-
National distribution banding – This indicates the assessment of school performance in that measure compared to the national picture. This will be one of the 7 possible interpretations described in the ‘How is school performance assessed?’ section above. The school values that fall into the ‘Close to average’ banding, and those that are not, statistically, significantly different from national (non-sig) will be coloured grey. Those that fall into the ‘Above’ banding and are, statistically, significantly above the national value will be highlighted in green. Those that fall into the ‘Below’ banding and are, statistically, significantly below the national value will be highlighted in red.
-
Trend – This shows whether there has been a statistically significant increase or decrease in the school value in a particular year from the previous year. Trends are not available: for progress measures; for the furthest year of any measure, as no comparator year is displayed. Trend is available for all pupils and low/middle/high prior attainers, but not for disadvantaged pupils.
-
Cohort context – This indicates whether the relevant year group has a high proportion of pupils who are or have been eligible for free school meals (FSM) and have claimed them at some time in the last 6 years (FSM6) or have high special educational needs (SEN) or low stability. Key stage 2 measures use Year 6, Year 4 MTC and phonics Year 1 cohort characteristics. For example, it will say ‘High – FSM’ in the key stage 2 tables if the school’s FSM6 proportion in Year 6 is greater than the national FSM6 proportion in Year 6, plus one SD. For each measure and data year combination, the context stated will be the same in every table, regardless of which pupil group the table represents more generally. This is because the cohort context column describes the context for all pupils within the relevant year group, rather than the context for the subset of the year group represented in the disadvantaged or low/middle/high prior attainers table.
The tables for the disadvantaged pupil group will contain much of the same information as those for all pupils and low/middle/high prior attainers. However, there are some differences:
-
In the table for the disadvantaged group, the column ‘National distribution banding’ relates to the national distribution for disadvantaged pupils.
-
The table for the disadvantaged group does not contain the ‘Trend’ column.
-
An additional column, ‘National (non dis)’, is provided to display the national value for that measure for the non-disadvantaged group.
-
An additional column, ‘Gap’, is provided to display the difference between the school value for disadvantaged pupils and the national value for non-disadvantaged pupils.
-
An additional column, ‘Gap trend’, indicates whether there has been a change in the gap in a particular year, compared with the previous year. First, we look at the year in question in isolation – if a school’s disadvantaged group is outperforming the national non-disadvantaged group, the gap will be identified as ‘Positive gap’. If a school’s disadvantaged group is performing less well than the national non-disadvantaged group, however, we will measure how a school’s disadvantaged gap has changed from one year to the next. As each year’s gap is based on a different cohort, which may be a different size, the reliability of that change varies, so the cohorts from the 2 comparator years are combined into an effective sample size. Across all schools, the average change and its standard deviation are calculated for each subject and measure. Each school’s change is then converted into a Z-score (which shows how unusual or typical a value is compared to the rest of the data) and adjusted using the effective sample size, ensuring that large, reliable cohorts are emphasised and small, noisy cohorts are down-weighted. Using the weighted Z-score, if the gap in a particular year is deemed to be greater than in the previous year, the trend will be identified as ‘Widening’. If the gap in a particular year is deemed to be smaller than in the previous year, the trend will be identified as ‘Narrowing’. Otherwise, the trend will be identified as ‘No meaningful change’. Gap trends are not available for the furthest year, as no comparator year is displayed, although we will still identify if the school has a positive gap as these do not require a comparator year.
Charts
Below each table is a set of charts illustrating the national distribution for each measure and pupil group. These are represented as horizontal plots of the bandings around the national value. These plots illustrate the information that goes into the assessment of the school performance for a measure, as described in the ‘How is school performance assessed?’ section above. Data is provided for up to the latest 3 years and the multi-year average, where available. Every chart contains the following elements:
-
The national value for the measure – This is shown as a turquoise-coloured vertical dashed line.
-
Three sections that represent the bandings in the national distribution – The proportion of schools that sit in each banding nationally is also provided, to help represent the volume in that section of the distribution.
-
The school value for the measure – This is shown as a coloured circle in one of the sections. For school values that fall into the ‘Close to average’ banding, and/or those that are not, statistically, significantly different from the national value (non-sig), the dot will be coloured grey. For those that fall into the ‘Above’ banding and are, statistically, significantly above the national value, the dot will be coloured green. Those that fall into the ‘Below’ banding and are, statistically, significantly below the national value will be highlighted in red.
-
The confidence interval (CI) – This is shown by horizontal lines extending from the school value (coloured circle). It defines the range in which the true school value is likely to fall and illustrates whether the school value is significantly above or below the national value. See the Understanding the data in the IDSR section for more details on how to interpret CIs.
In addition, the charts for the disadvantaged pupil group will show the national value for that measure for the non-disadvantaged group as a purple-coloured vertical dotted line.
Summary of achievement in phonics and at key stage 2
These tables summarise school performance compared to the national average across all achievement measures in the report for all years for which data is available. There are versions of the table that focus on the attainment measures only and versions that focus on progress measures only.
Separate summaries are also provided for all pupils, for disadvantaged and for low/middle/high prior attainers on separate tabs. To determine school performance for these pupil groups, the school value is compared to the corresponding national value for that pupil group. That means that the school values for disadvantaged pupils and low/middle/high prior attainers are compared to the national values for disadvantaged pupils and low/middle/high prior attainers, respectively.
The summary tables will allow users to get a full summary of the achievement bandings and statistical significance contained in the individual sections for each measure. It will show consistent and compelling outcomes but also fluctuations across the years.
Measures are ordered as they are in the individual sections later in the IDSR and headline measures are highlighted at the top of the summary table. The headline measures are:
-
% RWM ES – key stage 2 RWM meeting the expected standard
-
% RWM HS – key stage 2 RWM achieving the higher standard
The measure names act as links to the individual section for each measure so that users can easily navigate to further detailed analysis.
As described in the introduction to this section of the guidance, the exact combination of data years and pupil group breakdowns available for each measure varies. The major impacts of these variations on the summary tables are described below:
-
Key stage 2 progress measures are only available for a maximum of 2 data years (2022 and 2023).
-
Breakdowns of results for the low/middle/high prior attainer are only available for a maximum of 2 data years (2022 and 2023).
-
We do not produce breakdowns by pupil group of the measures of phonics Year 1 meeting the expected standard, the Year 4 MTC score, or any Key Stage 2 attainment measures for pupils achieving the higher standard/greater depth, so these measures will never appear on any of the summary charts outside the ‘All pupils’ tab.
Phonics screening check expected standard
Additional sentences will be displayed above the table of outcomes in the phonics screening check. Sentences will be available for both Year 1 and Year 2 pupils, where relevant. The sentences show:
-
the total number of pupils who were eligible to be screened for phonics
-
the number of pupils who sat the check, and who did not, where applicable
-
the number of pupils who did not meet the expected standard, where applicable
-
the average mark for pupils who did not meet the expected standard (where the number not meeting the standard was greater than 5)
Example sentences
There were 59 pupils who were eligible for the phonics screening check in Year 1 in [latest year]; 54 of them sat the check and 5 did not. Of those who sat the check, 15 pupils did not meet the phonics expected standard; their average mark was 21.
There were 18 pupils who were eligible for the phonics screening check in Year 2 in [latest year]; 12 of them sat the check and 6 did not. Of those who sat the check, 3 pupils did not meet the phonics expected standard.
The number of pupils who did not sit the phonics screening check includes (where applicable): the number who were absent, the number who were disapplied, and the number for whom there was maladministration.
Early years foundation stage profile nationals
Data source: the DfE’s 2023/24 early years foundation stage (EYFS) profile results publication.
From Autumn 2025, the IDSR will include published national headline data on the percentage of pupils with a good level of development as well as the national percentage at the expected standard for the 7 areas of learning and associated early learning goals within the ‘Other’ section of the IDSR. No school-level data will be included until the DfE makes this available in Autumn 2026.
Measures that will be presented in this section:
-
Good level of development
-
Communication and language
-
Listening, attention and understanding
-
Speaking
-
-
Personal, social and emotional development
-
Self-regulation
-
Managing self
-
Building relationships
-
-
Physical development
-
Gross motor skills
-
Fine motor skills
-
-
Literacy
-
Comprehension
-
Word reading
-
Writing
-
-
Mathematics
-
Number
-
Numerical patterns
-
-
Understanding the world
-
Past and present
-
People, culture and communities
-
The natural world
-
-
Expressive arts and design
-
Creating with materials
-
Being imaginative and expressive
-
The content in this section is based on the DfE’s EYFS profile results published here: Early years foundation stage profile results, Academic year 2023/24.
Achievement at key stage 4
Data sources:
Attainment – the DfE’s final 2025, final 2024, final 2023 and final 2022 data.
Progress – the DfE’s final 2024, final 2023 and final 2022 data.
What data is included in this section?
This section provides information about school performance at key stage 4, covering an array of attainment and progress (including value added (VA)) measures.
The attainment measures are:
-
Overall attainment 8
-
English and mathematics % at grade 4 or above/grade 5 or above
-
English element of attainment 8
-
English % at grade 4 or above/grade 5 or above
-
Mathematics element of attainment 8
-
Mathematics % at grade 4 or above/grade 5 or above
-
Science % at grade 4 or above/grade 5 or above
-
Languages % at grade 4 or above/grade 5 or above
-
Humanities % at grade 4 or above/grade 5 or above
-
EBacc element of attainment 8
-
Open element of attainment 8
The progress measures (including VA) are:
-
Overall progress 8
-
English element of progress 8
-
Mathematics element of progress 8
-
Science VA
-
Languages VA
-
Humanities VA
-
EBacc element of progress 8
-
Open element of progress 8
Wherever possible, data is presented for these measures for the most recent 3 years and is provided separately to cover:
-
all pupils – all pupils included in the measure
-
disadvantaged pupils – those pupils included in the measure who were eligible for free school meals at any time during the last 6 years and/or were looked-after children (in the care of the local authority for a day or more or who have been adopted from care)
-
low/middle/high prior attainers – those pupils included in the measure, for whom records of their performance at key stage 2 were available and who were grouped into the low/middle/high prior attainment categories, respectively, according to DfE definitions of these categories. Further information about how these categories are defined is available in the Secondary accountability measures (including Progress 8 and Attainment 8) guidance)
The exact data and breakdowns available will vary by the school type, the measure, the pupil group, and the school’s particular cohort, as described below:
-
For the all and the disadvantaged pupil groups, the data sources for key stage 4 attainment measures are: the DfE’s final 2025, final 2024 and final 2023 data.
-
For low/middle/high prior attainers, the data sources for key stage 4 attainment measures are: the DfE’s final 2024, final 2023 and final 2022 data. This is because pupils reaching the end of key stage 4 in 2025 did not sit their key stage 2 assessments, which are used to define the prior attainment groups, due to COVID-19 disruption.
-
For all key stage 4 progress measures, broken down for all pupils, disadvantaged pupils and low/middle/high prior attainers, the data sources are: the DfE’s final 2024, final 2023 and final 2022 data. This is because pupils reaching the end of key stage 4 in 2025 did not sit their key stage 2 assessments, which are used as the baseline prior attainment for progress, due to COVID-19 disruption.
-
For UTCs and studio schools, Progress 8 is not included. These establishments typically start educating pupils at age 14, partway through the 5-year period covered by P8, with a focus on preparing pupils for their future careers by providing an integrated academic and professional education.
-
Individual schools may be missing a year, or years, of data for a given measure and/or pupil group if they did not have any pupils in that group in that year.
You can find more information on the accountability measures in this DfE guidance document: Secondary accountability measures (including Progress 8 and Attainment 8).
How is school performance assessed?
For each measure and pupil group combination, an assessment is provided of school performance for each available year of data. For each year of data, the methodology examines the national distribution of schools for that measure and pupil group and shows where a school sits within that distribution. This means that the school values for disadvantaged pupils and low/middle/high prior attainers are compared to the national values for disadvantaged pupils and low/middle/high prior attainers, respectively.
The national distributions for each measure, pupil group, and data year are determined using the statistical concept of standard deviations (SDs). This concept adapts to each unique distribution and takes into account the variation or spread of values. Each national distribution is centred around the relevant national value and divided into one of 3 bandings: ‘Below’, ‘Close to average’ and ‘Above’.
Ultimately, combining the national distribution bandings, the national value, the school value’s position within the distribution, and a measure of statistical confidence in the school value, there are 7 possible interpretations of school performance.
-
Above (sig+)
-
Above (non-sig)
-
Close to average (sig+)
-
Close to average (non-sig)
-
Close to average (sig−)
-
Below (non-sig)
-
Below (sig−)
The full details of how we arrive at these interpretations and what each of them mean are available later in this document.
Tables
For the all-pupil group and for low/middle/high prior attainers, each table contains:
-
Year – This is the academic year the data relates to (for example, 2023 means 2022/23).
-
Cohort – This indicates the number of pupils included in the measure.
-
School – This shows the school value for that measure.
-
National – This shows the national value for that measure.
-
National distribution banding – This indicates the assessment of school performance in that measure compared to the national picture. This will be one of the 7 possible interpretations described in the ‘How is school performance assessed?’ section above. The school values that fall into the ‘Close to average’ banding and those that are not, statistically, significantly different from national (non-sig) will be coloured grey. Those that fall into the ‘Above’ banding and are, statistically, significantly above the national value will be highlighted in green. Those that fall into the ‘Below’ banding and are, statistically, significantly below the national value will be highlighted in red.
-
Trend – This shows whether there has been a statistically significant increase or decrease in the school value in a particular year from the previous year. Trends are not available: for progress measures; for the furthest year of any measure, as no comparator year is displayed; between 2022 and 2023, where applicable, due to differences in grading post pandemic. Trend is available for all pupils and low/middle/high prior attainers, but not for disadvantaged pupils.
-
Cohort context – This indicates whether the Year 11 cohort has a high proportion of pupils who are or have been eligible for free school meals (FSM) and have claimed them at some time in the last 6 years (FSM6), or have high special educational needs (SEN), a high proportion of low prior attainers or low stability. For example, it will say ‘High – FSM’ if the school’s FSM6 proportion in Year 11 is greater than the national FSM6 proportion in Year 11, plus one SD. The FSM, SEN and stability flags relate to the whole year group, so will therefore be the same across all measures and pupil groups within the same year. However, the flag for low prior attainers is specific to each measure, so will therefore only be the same across all pupil groups within the same measure in the same year, and could differ from measure to measure.
The tables for the disadvantaged pupil group will contain much of the same information as those for all pupils and low/middle/high prior attainers. However, there are some differences:
-
In the table for the disadvantaged group, the column ‘National distribution banding’ relates to the national distribution for disadvantaged pupils.
-
The table for the disadvantaged group does not contain the ‘Trend’ column.
-
An additional column, ‘National (non dis)’, is provided to display the national value for that measure for the non-disadvantaged group.
-
An additional column, ‘Gap’, is provided to display the difference between the school value for disadvantaged pupils and the national value for non-disadvantaged pupils.
-
An additional column, ‘Gap trend’, indicates whether there has been a change in the gap in a particular year, compared with the previous year. First, we look at the year in question in isolation – if a school’s disadvantaged group is outperforming the national non-disadvantaged group, the gap will be identified as ‘Positive gap’. If a school’s disadvantaged group is performing less well than the national non-disadvantaged group, however, we will measure how a school’s disadvantaged gap has changed from one year to the next. As each year’s gap is based on a different cohort, which may be a different size, the reliability of that change varies, so the cohorts from the 2 comparator years are combined into an effective sample size. Across all schools, the average change and its standard deviation are calculated for each subject and measure. Each school’s change is then converted into a Z-score (which shows how unusual or typical a value is compared to the rest of the data) and adjusted using the effective sample size, ensuring that large, reliable cohorts are emphasised and small, noisy cohorts are down-weighted. Using the weighted Z-score, if the gap in a particular year is deemed to be greater than in the previous year, the trend will be identified as ‘Widening’. If the gap in a particular year is deemed to be smaller than in the previous year, the trend will be identified as ‘Narrowing’. Otherwise, the trend will be identified as ‘No meaningful change’. Gap trends are not available for the furthest year, as no comparator year is displayed, although we will still identify if the school has a positive gap as these do not require a comparator year.
Charts
Below each table is a set of charts illustrating the national distribution for each measure and pupil group. These are represented as horizontal plots of the bandings around the national value. These plots illustrate the information that goes into the assessment of the school performance for a measure, as described in the ‘How is school performance assessed?’ section above. Data is provided for up to the latest 3 years, where available. Every chart contains the following elements:
-
The national value for the measure – This is shown as a turquoise-coloured vertical dashed line.
-
Three sections that represent the bandings in the national distribution – The proportion of schools that sit in each banding nationally is also provided to help represent the volume in that section of the distribution.
-
The school value for the measure – This is shown as a coloured circle in one of the sections. For school values that fall into the ‘Close to average’ banding, and/or those that are not, statistically, significantly different from national (non-sig) value, the dot will be coloured grey. For those that fall into the ‘Above’ banding and are, statistically, significantly above the national value, the dot will be coloured green. Those that fall into the ‘Below’ banding and are, statistically, significantly below the national value will be highlighted in red.
-
The confidence interval (CI) – This is shown by horizontal lines extending from the school value (coloured circle). It defines the range in which the true school value is likely to fall and illustrates whether the school value is significantly above or below the national value. See the Understanding the data in the IDSR section for more details on how to interpret CIs.
In addition, the charts for the disadvantaged pupil group will show the national value for that measure for the non-disadvantaged group as a purple-coloured vertical dotted line.
Summary of achievement at key stage 4
These tables summarise school performance compared to national performance across all achievement measures in the report for all years for which data is available. There are versions of the table that focus on the attainment measures only and versions which focus on progress (including VA) measures only.
Separate summaries are provided for all pupils, disadvantaged and low/middle/high prior attainers on separate tabs. To determine school performance for each of these pupil groups, the school value is compared to the corresponding national value for each pupil group. This means that the school values for disadvantaged pupils and low/middle/high prior attainers are compared to the national values for disadvantaged pupils and low/middle/high prior attainers, respectively.
The summary tables will allow users to get a full summary of the achievement bandings and statistical significance contained in the individual sections for each measure. It will show consistent and compelling outcomes but also fluctuations across the years.
Measures are ordered as they are in the individual sections later in the IDSR and headline measures are highlighted at the top of the summary table. The headline measures are:
-
Overall A8 – overall attainment 8 score
-
E&M % 4+ – English and mathematics % at grade 4 or above
-
E&M % 5+ – English and mathematics % at grade 5 or above
-
Overall P8 – overall progress 8 score
The measure names act as links to the individual section for each measure so that users can easily navigate to further detailed analysis.
Achievement at 16 to 18
Data sources:
Attainment – the DfE’s final 2025, final 2024 and final 2023 data.
Progress – the DfE’s final 2025 and revised 2024 data.
What data is included in this section?
This section provides information about school performance at 16 to 18, covering an array of attainment and progress measures.
The attainment measures are:
-
A level average point score (APS)
-
Best 3 A levels APS
-
Applied general APS
-
Tech level APS
-
Tech cert APS
-
A level AAB %
The progress measures are:
-
A level VA
-
Applied general VA
-
Tech level VA
Wherever possible, data is presented for these measures for the most recent 3 years and is provided separately to cover:
-
all pupils – all pupils included in the measure
-
grade 0 to 3/4 to 6/7 to 9 prior attainment bands – those pupils included in the measure, for whom records of their performance at key stage 4 were available and who were grouped into the grade 0 to 3/4 to 6/7 to 9 prior attainment bands, respectively. Average prior attainment bands for A level qualifications are based on GCSE grades only. Average prior attainment bands for applied general and tech level qualifications are based on all key stage 4 results.
The exact data and breakdowns available will vary by the measure, the pupil group, and the school’s particular cohort, as described below:
-
the progress measures are only available for the most recent 2 performance years (2024 and 2025). This is because pupils reaching the end of key stage 5 in 2023 did not sit their key stage 4 assessments, which are used as the baseline prior attainment for progress, due to COVID-19 disruption
-
breakdowns of outcomes by prior attainment are only available for progress measures, not for attainment measures
You can find more information on the accountability measures in this DfE guidance document:
16 to 18 accountability measures technical guide
How is school performance assessed?
For each measure, an assessment is provided of school performance in each available year. For each year of data, the methodology examines the national distribution of schools for that measure and pupil group and shows where a school sits within that distribution. This means that the school’s progress values for GCSE grades 0 to 3/4 to 6/7 to 9 prior attainment bands are compared to the national values for GCSE grades 0 to 3/4 to 6/7 to 9 prior attainment bands, respectively.
The national distributions for each measure, pupil group and data year are determined using the statistical concept of standard deviations (SDs). This concept adapts to each unique distribution and takes into account the variation or spread of values. Each national distribution is centred around the relevant national value and divided into bandings: ‘Below’, ‘Close to average’ and ‘Above’.
Ultimately, combining the national distribution bandings, the national value, the school value’s position within the distribution, and a measure of statistical confidence in the school value, there are 7 possible interpretations of school performance.
-
Above (sig+)
-
Above (non-sig)
-
Close to average (sig+)
-
Close to average (non-sig)
-
Close to average (sig−)
-
Below (non-sig)
-
Below (sig−)
The full details of how we arrive at these interpretations and what each of them mean are available later in this document.
Tables
For the all-pupil group and for prior attainers (progress measures only), each table contains:
-
Year – This is the academic year the data relates to (for example, 2023 means 2022/23).
-
Cohort/Entries – The name and contents of this column vary depending on the measure. For the Best 3 A levels APS and A level AAB % measures, the column header is ‘Cohort’ and it shows the number of pupils included in these measures. For A level APS, Applied general APS, Tech level APS, and Tech cert APS, the column header is ‘Entries’ and it shows the total size of entries that count towards those measures. For A level VA, Applied general VA, and Tech level VA, the column header is also ‘Entries’ and it shows the total number of entries in that qualification type by students with prior attainment.
-
School – This shows the school value for that measure.
-
National – This shows the national value for that measure.
-
National distribution banding – This indicates the assessment of school performance in that measure compared to the national picture. This will be one of the 7 possible interpretations described in the ‘How is school performance assessed?’ section above. The school values that fall into the ‘Close to average’ banding and those that are not, statistically, significantly different from national values (non-sig) will be coloured grey. Those that fall into the ‘Above’ banding and are, statistically, significantly above the national value will be highlighted in green. Those that fall into the ‘Below’ banding and are, statistically, significantly below the national value will be highlighted in red.
-
Trend – This shows whether there has been a statistically significant increase or decrease in the school value in a particular year from the previous year. Trends are not available: for progress measures; for the furthest year, as no comparator year is displayed. Trend is available for all pupils and prior attainers (progress measures only).
-
Cohort context – This indicates whether the Year 13 cohort has high special educational needs (SEN). The SEN flag relates to the whole year group, so will therefore be the same across all measures and pupil groups within the same year. For example, it will say ‘High – SEN’ if the school’s proportion of pupils with SEN in Year 13 is greater than the national proportion of pupils with SEN in Year 13, plus one SD. For progress measures, a high proportion of entries that are from low prior attainers could also be shown. The low prior attainment band here refers to prior attainment of GCSE grades 0 to 3. The flag for low prior attainers, however, is specific to each measure, so will therefore only be the same across all pupil groups within the same measure in the same year, and could differ from measure to measure.
Charts
Below each table is a set of charts illustrating the national distribution for each measure and pupil group. These are represented as horizontal plots of the bandings around the national value. These plots illustrate the information that goes into the assessment of the school performance for a measure, as described in the ‘How is school performance assessed?’ section above. Data is provided for up to the last 3 years, where available. Every chart contains the following elements:
-
The national value for the measure – This is shown as a turquoise-coloured vertical dashed line.
-
Three sections that represent the bandings in the national distribution – The proportion of schools that sit in each banding nationally is also provided to help represent the volume in that section of the distribution.
-
The school value for the measure – This is shown as a coloured circle in one of the sections. For school values that fall into the ‘Close to average’ banding, and/or those that are not, statistically, significantly different from national (non-sig), the dot will be coloured grey. For those that fall into the ‘Above’ banding and are, statistically, significantly above the national value, the dot will be coloured green. Those that fall into the ‘Below’ banding and are, statistically, significantly below the national value will be highlighted in red.
-
The confidence interval (CI) – This is shown by horizontal lines extending from the school value (coloured circle). It defines the range in which the true school value is likely to fall and illustrates whether the school value is significantly above or below the national value. See the Understanding the data in the IDSR section for more details on how to interpret CIs.
Summary of achievement at 16 to 18
These tables summarise school performance compared to national performance across all achievement measures in the report for all years for which data is available. There are versions of the table that focus on the attainment measures only, and versions that focus on progress measures only.
Separate summaries are also provided for all pupils and prior attainers (progress measures only) on separate tabs. To determine school performance for these pupil groups, the school value is compared to the corresponding national value for that pupil group. This means that the school values for prior attainers are compared to the national values for the respective prior attainers.
The summary tables will allow users to get a full summary of the achievement bandings and statistical significance contained in the individual sections for each measure. It will show consistent and compelling outcomes but also fluctuations across the years.
Measures are ordered as they are in the individual sections later in the IDSR. The measure names act as links to the individual section for each measure so that users can easily navigate to further detailed analysis.
Destinations
After key stage 4
Data source: the DfE’s revised for 2023 leavers, revised for 2022 leavers and revised for 2021 leavers data.
This table displays the proportion of pupils who continued to sustain specified destinations. This data is publicly available and comes from the DfE’s destinations collection.
The destination information in this section relates to the pupils who were in key stage 4, 2 years before the pupils that the latest performance data in the IDSR relates to, and who have sustained their destination for 6 months after completing key stage 4. Information on pupils from the same cohort who did not sustain their destination for 6 months is also presented, alongside the category for which no activity beyond key stage 4 was captured.
Other than for special schools, blue boxes indicate a figure that is, statistically, significantly above the national average. Orange boxes indicate a figure that is, statistically, significantly below the national average.
Otherwise, the banding will be identified as ‘Non-sig’, unless there is insufficient data to perform the statistical test, in which case it will be identified as ‘Not available’.
Where data has been suppressed, this follows the rules used by the DfE.
A separate table will be presented for disadvantaged pupils. The national figure used for comparison is the national average for all pupils who are not disadvantaged. Disadvantaged pupils are those who were eligible for free school meals (FSM) at any time during the last 6 years and/or looked-after children (in the care of the local authority for a day or more or who have been adopted from care).
IDSRs for service children’s education providers will only have the destinations for the latest year due to data availability.
After 16 to 18
Data source: the DfE’s revised for 2023 leavers, revised for 2022 leavers, and revised for 2021 leavers data.
This table displays the proportion of students who completed their study programme at the provider and went on to sustained education or employment, and those who went on to a destination that was not sustained or whose activity was not captured. It further shows the proportion of all students who went on to an apprenticeship, to any education, and to higher education.
The destination information in this section relates to the 16 to 18 cohort from 2 years before the cohort to which the latest performance data in the IDSR relates, and who have sustained their destination for 6 months after completing 16 to 18 education. Information about pupils from the same cohort who did not sustain their destination for 6 months is also presented alongside the category for which no activity beyond 16 to 18 was captured.
Other than for special schools, blue boxes indicate a figure that is, statistically, significantly above the national average. Orange boxes indicate a figure that is, statistically, significantly below the national average.
Otherwise, the banding will be identified as ‘Non-sig’, unless there is insufficient data to perform the statistical test, in which case it will be identified as ‘Not available’.
Where data has been suppressed, this follows the rules used by the DfE.
A separate table will be presented for disadvantaged pupils. The national figure used for comparison is the national average for all pupils who are not disadvantaged. Disadvantaged pupils are those who were eligible for FSM at any time during the last 6 years and/or looked-after children (in the care of the local authority for a day or more or who have been adopted from care).
For the destinations, the DfE uses a flexible end year to determine which students are included in the measure. The DfE’s 16 to 18 accountability measures technical guide contains further information about the methodology.
This data is taken from the DfE destinations collection, which includes full definitions of the measures used and further breakdowns of the data.
Report card
The final section of the IDSR is the report card data section. This section displays the data that will eventually be presented alongside the inspection report. Measures in the report card are derived from the IDSR. For further details about these measures and the associated methodologies, please see the guidance above.
This section is split into the following areas:
-
School and pupil context
-
All pupils’ performance
-
Disadvantaged pupils’ performance
-
Disadvantaged pupils’ performance gap
-
Destinations after 16
-
Absence
Only a subset of measures that are published by the DfE will be presented in this section. For key stage 2 and 16 to 18 measures, when data is based on provisional datasets it will not appear in this section because this is not published by the DfE.
School and pupil context
Contextual measures about the school and its pupils will be presented first in this section. The school value will be presented along with a banding that shows how this value compares to other schools nationally.
The following school and pupil contextual measures will be included:
-
Total pupils
-
School capacity
-
Pupils eligible for free school meals (FSM6)*
-
Pupils with an education, health and care (EHC) plan
-
Pupils with special educational needs (SEN) support
-
School location deprivation
-
Resourced provision or special education needs and/or disabilities (SEND) unit
-
Type of specialist provision
*Measure will not be available for sixth forms.
All pupils’ performance
The all-pupils’ performance section displays outcomes for all pupils alongside the national average.
The following measures will be included for key stage 2 (for all pupils and disadvantaged pupils):
-
Pupils meeting the expected standard in reading, writing and mathematics
-
Pupils meeting the expected standard in reading
-
Pupils meeting the expected standard in teacher-assessed writing
-
Pupils meeting the expected standard in mathematics
The following measures will be included for key stage 4 (for all pupils and disadvantaged pupils):
-
English and mathematics GCSE
-
Attainment 8
-
Progress 8
The following measures will be included for 16 to 18 (all pupils only):
-
A level average point score (APS)
-
A level value added (VA)
The possible bandings are (based on those used in IDSR achievement sections):
-
Below
-
Close to average
-
Above
More information about these statistical concepts and how to interpret the tables and charts in the IDSR can be found in the Understanding the data in the IDSR section.
Disadvantaged pupils’ performance
The disadvantaged pupils’ performance section displays the outcomes for this pupil group alongside the national average for disadvantaged pupils. The measures presented in this section are the same suite displayed in the ‘All pupils’ performance’ section.
The possible bandings are (based on those used in corresponding IDSR achievement sections):
-
Below
-
Close to average
-
Above
More information about these statistical concepts and how to interpret the tables and charts in the IDSR can be found in the Understanding the data in the IDSR section.
Disadvantaged pupils’ performance gap
The disadvantaged pupils’ performance gap section displays the outcomes for this pupil group but now displays the national figures for non-disadvantaged pupils. The final column shows the difference between the school’s disadvantaged pupil outcomes and the national non-disadvantaged value. If the school’s disadvantaged pupil outcomes are lower than the non-disadvantaged national figures, then the gap will be a negative value. The measures presented in this section are the same suite displayed in the ‘All pupils’ performance’ section.
Destinations after key stage 4
This section displays the percentage of pupils staying in education or employment for at least 2 terms after the end of secondary school (key stage 4). Where available it will show the latest 3 years’ data.
The possible bandings are (based on those used in corresponding IDSR achievement sections):
-
Below
-
Average
-
Above
-
Not available
More information about these statistical concepts and how to interpret the tables and charts in the IDSR can be found in the Understanding the data in the IDSR section.
Absence
To reflect data published on the DfE’s Compare school and college performance site site, absence instead of attendance will be displayed in this section. As such, bandings will be the opposite of those in the IDSR attendance section (for those cases where the school sits in the ‘Above’ or ‘Below’ banding).
The following absence measures will be included:
-
Overall absence
-
Persistent absence
The possible bandings are:
-
Below
-
Close to average
-
Above
More information about these statistical concepts and how to interpret the tables and charts in the IDSR can be found in the Understanding the data in the IDSR section.
Understanding the data in the IDSR
How is school performance assessed?
This section describes how we assess a school’s value for each measure to give an interpretation of their outcome compared to the national figure.
For each measure, an assessment is provided of the school outcome in each available year of data (and for the multi-year average, where available). For each year of data, we examine the national distribution of schools for that measure and pupil group and show where a school sits within that distribution. That means, for example, that the school values for disadvantaged pupils are compared to the national values for disadvantaged pupils.
The national distributions for each measure, pupil group and data year are determined using the statistical concept of standard deviations (SDs). This concept adapts to each unique distribution and takes into account the variation or spread of values. A small SD indicates that data is clustered tightly around the mean, and a large SD indicates that data is more spread out. Each national distribution is centred around the relevant national value.
Together, the national value and SD are used to create 3 bandings within the distribution:
-
‘Close to average’ – a central range in the distribution, calculated by adding and subtracting 0.5 SDs from the national value
-
‘Below’ – an area of the distribution where values are less than the national value minus 0.5 SDs
-
‘Above’ – an area of the distribution where values are greater than the national value plus 0.5 SDs
As school values tend to be more closely clustered together around the national value, the ‘Close to average’ banding will usually be narrower than the ‘Above’ and ‘Below’ bandings where values are more spread out and have greater variation. For the same reason, the ‘Close to average’ banding will tend to account for a greater proportion of the school values than either the ‘Above’ or ‘Below’ bandings alone.
Further information about standard deviations and bandings can be found later in this section.
The distributions are represented within the IDSR by horizontal plots of the bandings centred around the national value. Within these plots, the school value’s position on the distribution is represented as a dot. The location of the dot (that is, in which banding it is located) determines the school’s banding for the measure. The proportion of schools that are located in each banding nationally is also provided to help represent the volume in that section of the distribution.
In the IDSR, we recognise that there is random variability around any school-level data, caused by the size of a school’s cohort. Larger cohorts mean greater statistical confidence in the school value and, therefore, that any difference between the school and national value is due to school factors. This statistical confidence in a school’s value is determined through the calculation of a confidence interval (CI). Using CIs, we can define a range in which the true school value is likely to fall. This range is represented on the distribution plots in the IDSR by horizontal lines extending from the school value (dot) to indicate statistical confidence.
Together, the national value, school value, and CI in relation to the school value are used to determine the statistical significance of the school value compared to the national value:
-
Not significantly different from national (non-sig) – the school CI crosses the national value
-
Significantly below national (sig−) – the whole CI for the school sits below (to the left of) the national value
-
Significantly above national (sig+) – the whole CI for the school sits above (to the right of) the national value
Please note that it is possible for a school’s value to be in the ‘Close to average’ banding, but for the value to be significantly different from the national value (either below or above it). Similarly, it is possible for the school value to in the ‘Below’ or ‘Above’ banding, but for the school value not to be significantly different from the national value.
Further information about confidence intervals and statistical significance can be found later in this section.
Overall, the assessment of school performance in each measure, pupil group and data year is represented in the IDSR through horizontal distribution plots, and through tables. The tables provide some of the underlying values from the distribution plots (school value, national value), along with interpretation of the school value. Combining the school banding and statistical significance gives 7 possible interpretations in the table:
-
Above (sig+)
-
Above (non-sig)
-
Close to average (sig+)
-
Close to average (non-sig)
-
Close to average (sig−)
-
Below (non-sig)
-
Below (sig−)
The school values that fall into the ‘Close to average’ banding, and those that are not, statistically, significantly different from the national value (non-sig) will be coloured grey. Those that fall into the ‘Above’ banding and are, statistically, significantly above the national value will be highlighted in green. Those that fall into the ‘Below’ banding and are, statistically, significantly below the national value will be highlighted in red.
Standard deviations and bandings
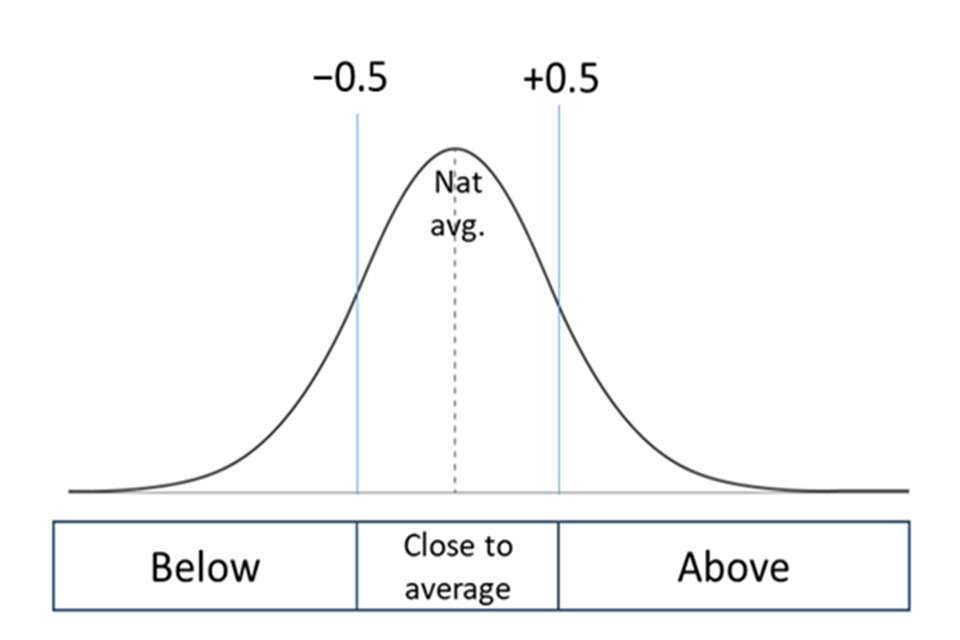
This bell curve illustrates a normal distribution. The horizontal axis is divided into three labelled sections: ‘Below’ on the left, ‘Close to average’ in the centre, and ‘Above’ on the right. The mean is marked as ‘Nat avg.’ Two vertical lines at minus 0.5 and plus 0.5 standard deviations from the mean enclose a shaded region labelled ‘Close to average’.
An SD adapts to each unique distribution and reflects variation or spread of values.
This is an example of a normal national distribution of school values. The IDSR then defines a central range on this distribution, which is defined as ‘Close to average’. The range is calculated by adding and subtracting 0.5 SDs from the national average. Using 0.5 SDs provides a more compact range, better reflecting the central tendency and reducing the influence of outlying values in skewed datasets.
As values tend to be more closely compacted together around the mean (national average) the ‘Close to average’ box will usually be narrower than the ‘Above’ and ‘Below’ boxes, where values are more spread out and there is a greater range/variation of values.
The following schools are not included in the national distribution or SD calculations:
-
special schools
-
alternative provision (AP)/pupil referral units (PRUs)
-
nurseries
The national average used in the calculation to ascertain plus and minus 0.5 SDs is the pupil-derived national average that includes all state schools in England.
Confidence intervals
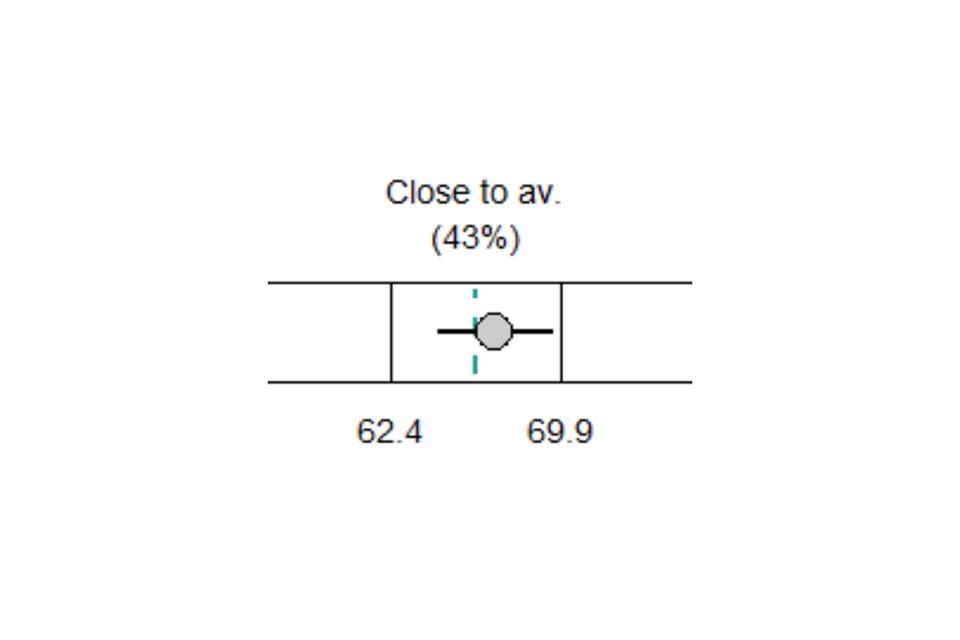
This is a section of a distributional analysis showing the ‘Close to average’ range. Close to average is represented by a rectangular box and ranges from 62.4 to 69.9 along the horizontal axis. Inside the box, there is a grey dot (indicating a school’s observed performance) and a horizontal line through the grey dot (indicating the confidence interval of their performance). There is also a vertical turquoise dashed line indicating the national average.
A CI explains the range within which the true value is likely to fall. In the IDSR, we recognise that around any school-level data there is random variability caused by the size of a school’s cohort. Larger cohorts mean greater confidence that any difference from the national average is due to school factors.
Statistical significance
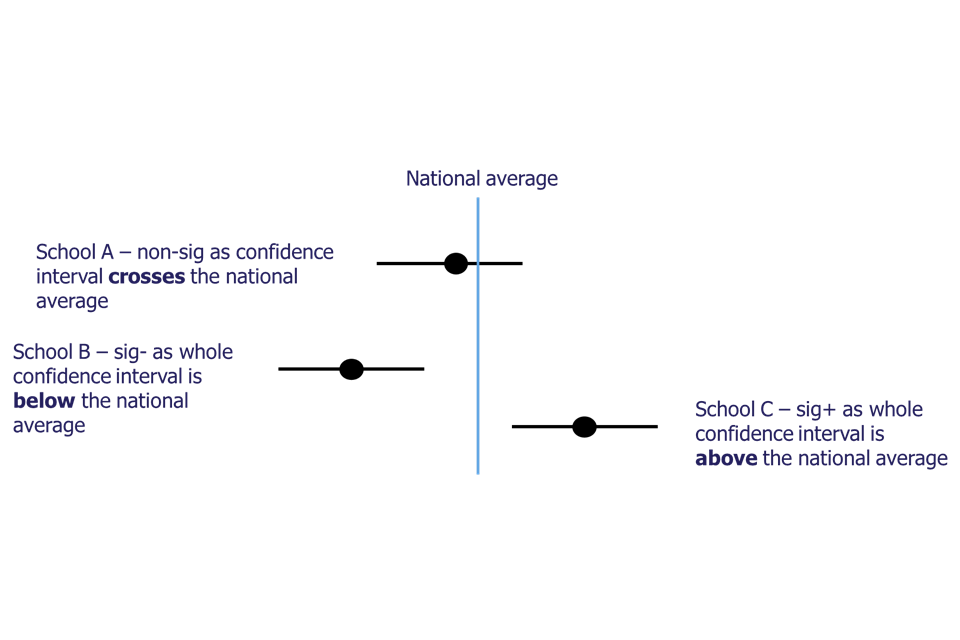
This image shows a comparison of confidence intervals for 3 schools against the national average. The national average is marked by a vertical blue line. Each school is represented by a black dot (indicating their observed performance) and a horizontal line through the black dot (indicating the confidence interval of their performance). The position of the confidence intervals in relation to the national average indicates whether a school outcome is statistically significant.
Assessment data and information are starting points for inspectors’ discussion with schools. We use statistical significance testing to draw attention to noteworthy values. These values show when differences in the school’s performance may be due to more than chance variation. The IDSR uses bandings based on SDs as well as statistical significance testing. This allows us to look at relative performance across time while highlighting noteworthy changes.
The figure above is an example of how the CI is used to decide statistical significance. It helps us quickly assess whether a school’s outcomes stand out in a statistically reliable way, or whether they fall within the expected range of variation. If the CI does not cross the national average line, we can say that the school’s performance is statistically significant – either significantly above (sig+) or significantly below (sig−) the national average. If the CI does cross the national average line, then the school’s performance is not statistically different from the national average – this is labelled as non-significant (non-sig).
For progress measures, the DfE provides Ofsted with the 95% CIs, enabling us to calculate the statistical significance. The DfE publishes guidance about the Progress 8 data and confidence intervals.
There can be slight differences between Compare school and college performance in England and the IDSR, including for Progress 8, because of different ways of rounding figures. For ‘Compare school and college performance in England’, the bandings are calculated from rounded data, which is an established convention in the performance tables. The bandings in the performance tables, and whether a school’s score is considered to be above or below average (significantly different from 0), are based on the published value of the CI at 2 decimal places. For example, a school with an upper confidence limit of −0.00234, which is rounded up and shown as 0.00, is not treated as significantly below average. The IDSR, however, uses unrounded values and will, for example, show a school with an upper confidence limit of −0.00234 as significantly below average. Statistical significance calculations use cohort size, or number of pupils, in the calculation. Therefore, a large cohort is much more likely to show a statistically significant difference from national averages than a small cohort.
Significance calculation for threshold measures
In some instances, we use a normal approximation to the binomial distribution to identify statistically significant differences between proportions of pupils.
Before applying the test, we check that nP and n(1−P) are greater than or equal to 5.
Where:
-
P = the national average of pupils reaching the expected standard
-
n = the total number of pupils
The calculation is as follows:
Z = (pₛ − pₙ) / √[pₙ(1 − pₙ) / nₛ]
Where:
-
pₛ = sample proportion
-
pₙ = null hypothesis proportion
-
nₛ = sample size
If Z>1.96, then the result is statistically significantly positive (Sig+).
If Z<−1.96, then the result is statistically significantly negative (Sig−).
Otherwise not statistically significant.
Attendance and behaviour
The first release of the IDSR in each academic year includes absence data. This will be in the form of 1-term data before being updated with 2-term and then 3-term data later in the academic year.
The suspensions and permanent exclusions data can be up to 1 year behind.
For absence and suspensions, special schools are compared with the national value for secondary schools. For permanent exclusions, special schools are compared with the national value for special schools.
Special schools and pupils with SEN
An IDSR is produced for special schools. However, it may contain very little information about the performance of pupils.
Pupils with special educational needs (SEN) are a diverse group with differing needs and expectations. Therefore, the IDSR will no longer display any averages for this group.
The IDSR provides contextual information for the group, including the breakdown of the number of pupils with SEN by primary need.
Junior and middle schools
For junior schools, a standard sentence explains that we know from national data that pupils, on average, have higher attainment scores at the end of key stage 2 than pupils at all other primary schools. However, on average they make less progress, which may be for a variety of reasons.
For middle schools, a standard sentence explains that due to the age range of pupils, they will have only attended a middle school for a short time before they take their key stage 2 tests.
Inspectors should be aware of this and, as with any inspection, carefully consider a range of information and data.
Missing data
There are a few possible reasons why data for some years is not shown in charts and tables for a particular measure:
-
The measure did not exist, was defined differently or was not available to Ofsted for that year; if this is the case, the data is shown as a dash.
-
The school had no pupils for a particular measure in that year; if this is the case, the cohort will be shown as a 0 and a dash will be shown for the measure.
-
If the school recently changed legal status, for example from a local authority-maintained school to a sponsor-led academy, the data may be shown under the predecessor school name or unique reference number (URN) in the DfE’s Analyse School Performance (ASP). Normally, schools that open part way through an academic year will have their performance data attached to the predecessor school, but attendance data is attached to the successor school. For consistency, the IDSR will match the DfE methodology for these schools.
National figures
The national figures may differ from the figures published in the DfE’s performance tables and ASP. This is due to the varying decimal precisions used between organisations and because we do not include special schools.
The ‘FSM6 and/or CLA’ pupil group is compared with the national figure for pupils who are not ‘FSM6 and/or CLA’.
Prior attainment pupil groups are compared with their respective pupil group nationally.
Service children’s education providers have been assigned a phase based on the ages of pupils in the school.
Cohorts and numbers of pupils included
Cohorts display the total number of pupils based on the group and year of the measure presented.
For measures when all pupils were entered, the cohort shows the number of pupils the measure is based on. For some measures, it is used as the denominator for percentages.
If there have been any leavers and joiners, then the cohort number shown on progress and attainment data may not match the context section. The context section is a snapshot of the day the school census is taken in January of that year.
The ‘Number of pupils included’ on progress pages only includes pupils with prior attainment information.
16 to 18 cohorts
The DfE uses different rules to allocate students to the different measures. The year group characteristics are based on the census data, so there may be students who are no longer on roll but are still allocated to the provider for accountability purposes.
For the destinations, the DfE uses a flexible end year to determine which students are included in the measure. There are more details in the accountability guide.
Conditions of use
The IDSR conditions of use and storage are that:
-
the IDSR is to be used only for educational and analytical purposes and for informing inspection, not for any other purpose
-
data presented in the IDSR is to be shared only with those who need it and are authorised to have access to it
-
only nominated users may access the IDSR, and these users must be made aware that they cannot share the IDSR without permission from the data owner (the school or college)
-
the IDSR should be saved in a secure location with limited access
Data protection
When accessing the data in the Ofsted IDSR service, you must recognise the privacy of that data and always comply with the Data Protection Act 2018. The Data Protection Act 2018 is the UK’s implementation of the General Data Protection Regulation (GDPR). You must ensure that you use the data that you have access to for the purpose for which the service was set up and that you do not use the data for any other purpose. You must ensure that the data is processed securely and that it is not subject to any unauthorised use or disclosure.
Updates to this page
-
We have updated the IDSR for all schools with the DfE’s 2025/26 daily attendance collection up to and including summer part 1. The IDSR guidance has been updated to reflect this latest update.
-
We have updated the IDSR for all schools with the DfE’s 2025/26 daily attendance collection up to and including spring part 2. The IDSR guidance has been updated to reflect this latest update.
-
We have updated the IDSR for all schools with spring 2024/25 suspensions and permanent exclusions data. The IDSR guidance has been updated to reflect this latest update.
-
We have updated the IDSR for all schools with the latest and final data. The IDSR guidance has been amended to reflect these latest updates.
-
We have updated the IDSR for all schools with the DfE’s 2025/26 daily attendance collection up to and including spring part 1. The IDSR guidance has been updated to reflect this.
-
We have updated the IDSR for all schools with latest pupil movement data, introduced new format summary tables and updated the methodology underpinning the gap trend. The IDSR guidance has been updated to reflect these changes.
-
The guidance has been updated to reflect that we have updated the IDSR for all schools with new daily attendance data.
-
We have updated the IDSR for all schools with the latest available data including revised 16 to 18 performance data. The IDSR guidance has been updated to reflect these updates.
-
We have updated the IDSR for all applicable schools with revised key stage 4 data. The IDSR guidance has been updated to reflect these updates.
-
We have updated IDSRs with 2024/25 autumn term exclusions data. The IDSR guidance has been updated to reflect this change.
-
We have updated the IDSR for all applicable schools with 2025 revised key stage 2, provisional 16 to 18, final phonics, 2 term absence and final multiplication tables check data. The IDSR guidance has been updated to reflect these updates.
-
We have updated the IDSR for all schools with provisional 2025 key stage 4 data. The IDSR guidance has been updated to reflect this change.
-
We have released the 2025 provisional primary IDSR, with several developments for the renewed inspection framework, for all schools. The IDSR guidance now reflects all new developments and data updates. The main data updates are the latest 2025 key stage 2, phonics, contextual data, 1-term absence, final exclusions for 2024 and new alternative provision placements data.
-
We have updated the IDSR for all applicable schools with final key stage 2, key stage 4 and 16 to 18 data. We have also updated absence data with the final 3-term data. The IDSR guidance has been updated to reflect this change.
-
We have updated the IDSR for all secondary schools with revised 2024 key stage 4 and level 3 value-added data. The IDSR guidance has been updated to reflect this update.
-
We have updated the IDSR for all schools with revised 2024 key stage 2 and 16 to 18 performance data. The IDSR guidance has been updated to reflect this change.
-
Updated the IDSR for all secondary schools with provisional 2024 key stage 4 data. The IDSR guidance has been updated to reflect this change.
-
Updated the IDSR guidance for all schools with 2-term (autumn & spring) absence data for 2023/24, provisional destinations data for 2022/23, final phonics data for 2024, and multiplication tables check (MTC) data for 2024.
-
We have released the 2024 primary IDSR with IDSR developments for all schools, as highlighted in our September newsletter. The guidance now reflects all new data updates. The main data updates are the latest 2024 key stage 2, phonics, contextual data, 1-term absence, final exclusions for 2023 and new alternative provision placements data.
-
We have updated the IDSR for all schools with final (key stages 2, 4 and 16 to 18) 2023 data as well as 3-term absence. The guidance has been updated to reflect these changes.
-
We have updated the IDSR for all secondary schools with revised 2023 key stage 4 and 16 to 18 data. The guidance has been updated to reflect these changes.
-
We have updated the IDSR for all schools including schools with a sixth form with the latest pupil movement data for 2022/23 and revised key stage 2 data. We have updated the IDSR for all schools including schools with a sixth form, with the latest pupil movement data for 2022/23, and revised key stage 2 data. The guidance has been updated to reflect these changes.
-
We have updated the IDSR for all schools including schools with a sixth form with the latest absence data for 2022/23 (autumn and spring terms), final key stage 1 and final multiplication tables data. The guidance has been updated to reflect these changes.
-
We have updated the IDSR for secondary schools and schools with a sixth form, with the latest provisional 2023 key stage 4 and 16 to 18 data. The guidance has also been updated to reflect these changes.
-
We have released the 2023 primary IDSR with IDSR developments for all schools, as highlighted in our last newsletter. The main data updates are latest 2023 key stage 2, key stage 1, phonics, contextual data and 2021/22 suspensions and permanent exclusions.
-
We have updated the inspection data summary report (IDSR) for all schools. The main changes includes the 16 to 18 final 2022 data, including the updated retention measure. We also updated the trust/local authority level information section to include the most recent inspection outcome (graded or ungraded) based on latest URN for trusts only.
-
We have updated the inspection data summary report (IDSR) for all schools. The following data has been updated: Key stage 4 - final, Key stage 2 – final (including the multiplication tables check) and absence data – 3 terms.
-
Updated the secondary inspection data summary report (IDSR). The main changes are revisions to key stage 4, 16-18 data, pupil movement between 2021 and 2022 and destinations data. Also included are changes to the way we calculate key stage 4 subject entries.
-
Updated the primary inspection data summary report (IDSR). The main changes are revised key stage 2, final key stage 1 and final phonics data. Also included are minor changes to the pupil movement section of the secondary school IDSR.
-
Updated with absence data.
-
Ofsted has released the 2022 secondary IDSR and the guidance has been updated to reflect this. The main changes include the release of 2022 key stage 4 attainment and progress data, key stage 5 attainment and developments to the pupil movement section.
-
Ofsted has released the 2022 primary IDSR and the guidance has been updated to reflect this. The main changes are latest 2022 key stage 2, key stage 1, phonics, contextual data and 2020/21 suspensions and permanent exclusions. Also included are updates on the new functionality to remove sentences highlighted in grey.
-
Guidance updated to reflect that EYFS profile data is no longer included in the inspection data summary report (IDSR).
-
Updated with absence and finance data.
-
The guidance has been updated to reflect the new web-based IDSR format, new data received since their last release and the integration of school sixth form guidance.
-
Guidance updated in response to user queries, including information on what ‘not authorised’ means, clarification on average number of qualifications for 2021 and further details about the stability measure.
-
Ofsted have released a November 2021 IDSR and the guidance has been updated to reflect this. The main changes are latest 2021 contextual data, a new section for 2021 subject entries and new terminology for suspensions. Supporting tables spreadsheet updated: 2021 prior attainment national averages, autumn 2020 absence bounds, suspensions bounds have been updated or added to for 2021. No performance bounds have been updated. Sentence master list updated to reflect minor improvements/changes/combinations to current area of interest sentences and incorporating 2020 and 2021 figures where applicable.
-
New section of guidance added for the release of autumn 2020 absence data. This data is based on the DfE census collection and has been provided as a new section within the IDSR.
-
Added two spreadsheets: sentence master list and supporting data tables.
-
Guidance amended to reflect the latest version of the IDSR, including example reports.
-
Updated guidance to incorporate the addition of 'service children education providers' and the supporting tables have been updated to reflect the release of revised key stage 4 data.
-
Updated to include final 2019 EYFS, supporting tables updated with revised KS2, data for disadvantaged pupils and final 2019 EYFS and a new master list of all 2019 areas of interest sentences.
-
Updated the guidance to enhance users understanding of the ‘grey’ area of interest sentences and added more direct links for ease of use.
-
Updated supporting data tables to include key stage 1 attainment of the expected standard by Early Years Foundation Stage prior outcome.
-
Updates the 'English Baccalaureate entry' section.
-
Updated guide and data tables following further releases of data.
-
Added IDSR guidance for secondary schools.
-
Added a link to the DfE Sign-in for users to log into Analyse School Performance to view and download their schools' IDSR. Also added an example secondary school IDSR.
-
Added 2019 supporting data tables.
-
Added an example inspection data summary report.
-
First published.