Vehicle speed compliance statistics for Great Britain: 2020
Published 13 July 2021

© Crown copyright 2021
This publication is licensed under the terms of the Open Government Licence v3.0 except where otherwise stated. To view this licence, visit nationalarchives.gov.uk/doc/open-government-licence/version/3 or write to the Information Policy Team, The National Archives, Kew, London TW9 4DU, or email: psi@nationalarchives.gov.uk.
Where we have identified any third party copyright information you will need to obtain permission from the copyright holders concerned.
This publication is available at https://www.gov.uk/government/statistics/vehicle-speed-compliance-statistics-for-great-britain-2020/vehicle-speed-compliance-statistics-for-great-britain-2020
About this release
This statistical release presents estimates of car compliance with speed limits in free-flowing conditions on roads in Great Britain.
These are based on speed data from a sample of Department for Transport’s Automatic Traffic Counters (ATCs), chosen to exclude locations where external factors might restrict driver behaviour (for example, junctions, hills, sharp bends and speed cameras).
The statistics provide insights into speeds at which drivers choose to travel when free to do so, but are not estimates of average speeds across the whole network, which are available separately.
The release also presents information from a range of other sources relevant to vehicle speeds and compliance.
In 2020, under free-flowing traffic conditions, 56% of cars exceeded the speed limit on 30mph roads compared to 53% on motorways and 12% on national speed limit single carriageway roads.
Table 1: Proportion of vehicles exceeding the speed limits by road class in Great Britain, 2020
| Cars | LCVs (vans ) | Articulated HGVs | Rigid HGVs | Short Buses | Long Buses | Motorcycles | |
|---|---|---|---|---|---|---|---|
| Motorways | 53 | 55 | 2 | .. | .. | .. | 58 |
| National Speed Limit Single Carriageways | 12 | .. | 35 | 41 | 45 | 48 | 29 |
| 30mph roads | 56 | 58 | 46 | 49 | 29 | 24 | 67 |
.. Data is not available
Speed compliance in 2020 was slightly lower than previous years, which can be partly attributed to the impact of the coronavirus (COVID-19) pandemic on traffic levels (see context section). Previously, vehicle speed compliance has remained broadly stable from 2011 to 2019.
In 2020, the proportion of cars exceeding the speed limit by more than 10mph was much lower than overall speeding, at:
- 13% on motorways
- 6% on 30mph roads
- 2% on 60mph roads
For all vehicle types, speed compliance tended to be highest on National Speed Limit (NSL) single carriageways and lowest on 30mph roads.
The average car speeds, under free-flow conditions, were:
- at the speed limit on motorways (70mph)
- slightly above the speed limit for 30mph roads (31mph)
- under the speed limit on 60mph roads (51mph)
Context
The annual speed compliance statistics normally show very little variation in compliance with the speed limit from year to year so without the coronavirus pandemic impact on traffic levels we would expect speed limit compliance to have remained in line with previous years.
In late March 2020, the UK entered its first national lockdown. There was an immediate large drop in daily traffic levels, which particularly affected April to June 2020, this can be seen in (Figure 1). Traffic levels recovered slowly, before declining again in the autumn and winter, when further local and national restrictions were seen due to the pandemic.
The trends in speed limit compliance presented can often be seen to coincide with these exceptional changes in road traffic, this can be seen in (Figure 2). Generally during periods of reduced traffic speed limit exceedances have been higher on most vehicle types, though it should be noted that other factors such as changes in season and weather may also have been having an impact.
Quarterly statistics for car speed limit compliance throughout 2020 and 2021 have been published to provide more timely information on compliance with speed limits during the coronavirus pandemic. These statistics show a more accurate picture of car speed limit compliance during the pandemic as they represent a shorter time period.
Figure 1: Daily motor vehicle use on roads in Great Britain, since March 2020
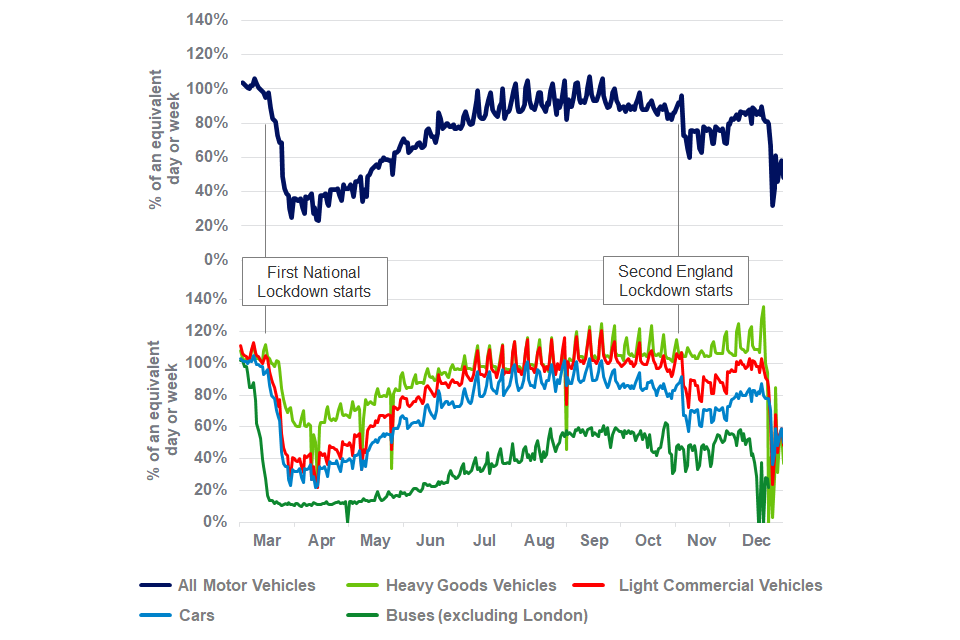
In March 2020 there was a sudden drop in traffic levels for all motor vehicles which recovered slowly. A drop is also seen in November but this was not as large. Heavy goods vehicles were least affected. Buses (excluding London) were most affected.
For more information, see transport use during the coronavirus pandemic.
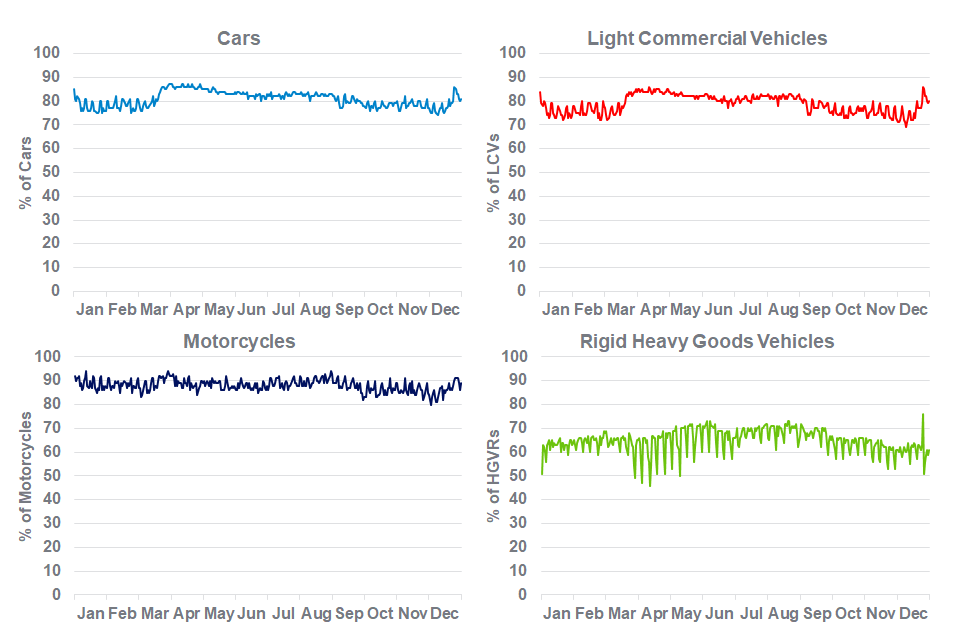
Figure 2: Proportion of vehicles exceeding the speed limit in Great Britain, 2020
National speed limit single carriageways and 30mph roads saw an increase in proportion of vehicles exceeding the speed limit during March 2020. This slowly returned to more normal levels as restrictions eased.
Key dates
Table 2: Key dates during the coronavirus pandemic
| Date of Introduction | Coronavirus events |
|---|---|
| 23 March 2020 | UK enters first national lockdown |
| 30 June 2020 | UK introduces first local lockdown |
| 14 October 2020 | England introduces 3 tier system |
| 23 October 2020 | Wales introduces fire-break lockdown, ends 9 November |
| 2 November 2020 | Scotland introduces 5 tier system |
| 5 November 2020 | England enters second national lockdown, ends 2 December |
| 19 December 2020 | Tier 4 introduced for London, South East and East of England |
| 20 December 2020 | Wales enters third national lockdown |
| 26 December 2020 | Large parts of England enter tier 4 |
| 5 January 2021 | England enters third national lockdown. Scotland enters second national lockdown |
Understanding and interpreting these statistics
What do free-flow speeds tell us?:
- free-flow speeds reflect the speeds drivers may travel at when free to do so
- they are not representative of the level of speeding across the whole road network, which we would expect to be lower
What roads are covered?
Only sites where the road conditions are free-flowing and there are no junctions, hills, sharp bends, speed enforcement cameras or other traffic calming measures. The statistics do not cover roads where the road layout or traffic calming measures are likely to constrain vehicle speeds. This includes smart motorways.
Comparing data between years
Only broad-scale comparisons of patterns in compliance and speeds over time periods of 5 or more years can be made confidently, unless the changes are large and the context is clear.
The impact of the coronavirus pandemic in 2020 stands as a rare case where the changes were large and the context clear.
What conclusions can be drawn from the 20mph sample?
The 20mph free-flow sites have no traffic calming measures or other features to restrict speed, and tend to be through-roads, so are not typical of all 20mph roads.
20mph roads should not be compared year-on-year due to high turnover in sites.
Key terms
Exceeding the speed limit
Vehicles travelling at a speed higher than their applicable speed limit are defined as “exceeding the speed limit”.
Free-flow speed
Free-flow speeds are observed in locations where external factors which might restrict driver behaviour (for example, junctions, hills, sharp bends and speed enforcement cameras) are not present.
Speed limits
Speed limits for cars are 70mph on Motorways and 60mph on National Speed Limit Single Carriageways. A complete breakdown of national speed limits can be found on the speed limits webpage.
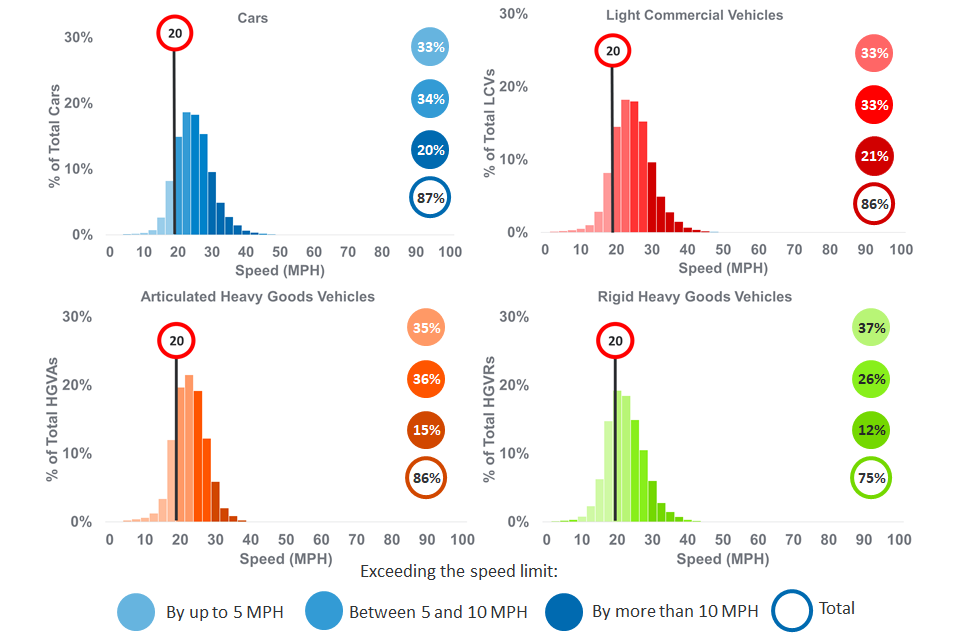
Car compliance with speed limits
Under free-flowing conditions, the proportions of cars complying with the speed limit were 47% on motorways, 88% on national speed limit (NSL) single carriageways and 44% on 30mph roads.
On NSL single carriageway roads 12% of cars exceeded the speed limit, compared to 56% on 30mph roads and 53% on motorways.
The proportion of cars exceeding the speed limit by over 10mph on 30mph roads was 6%, whilst 2% and 13% exceeded the speed limit by more than 10mph on NSL single carriageway roads and motorways respectively.
Figure 3: Distribution of car speeds by road type in Great Britain, 2020 (Table SPE0111)
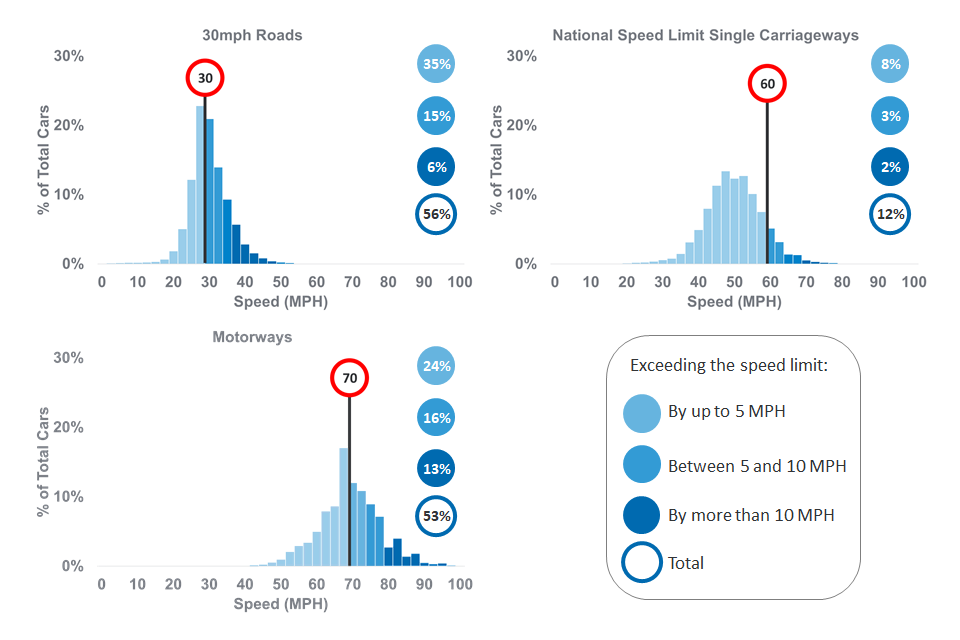
30mph roads had the highest proportion of cars exceeding the speed limit. Motorways had the highest proportion of cars exceeding the speed limit by more than 10mph.
Light Commercial Vehicle (van) compliance with speed limits
In free-flow conditions, the proportions of vans complying with the speed limit were 45% on motorways and 42% on 30mph road.
On motorways, 55% of vans exceeded the speed limit compared to 58% on 30mph roads.
The proportion of vans exceeding the speed limit by over 10mph on 30mph roads was 7%, while 16% exceeded the speed limit on motorways by more than 10mph.
Figure 4: Distribution of van speeds by road type in Great Britain, 2020 (Table SPE0111)
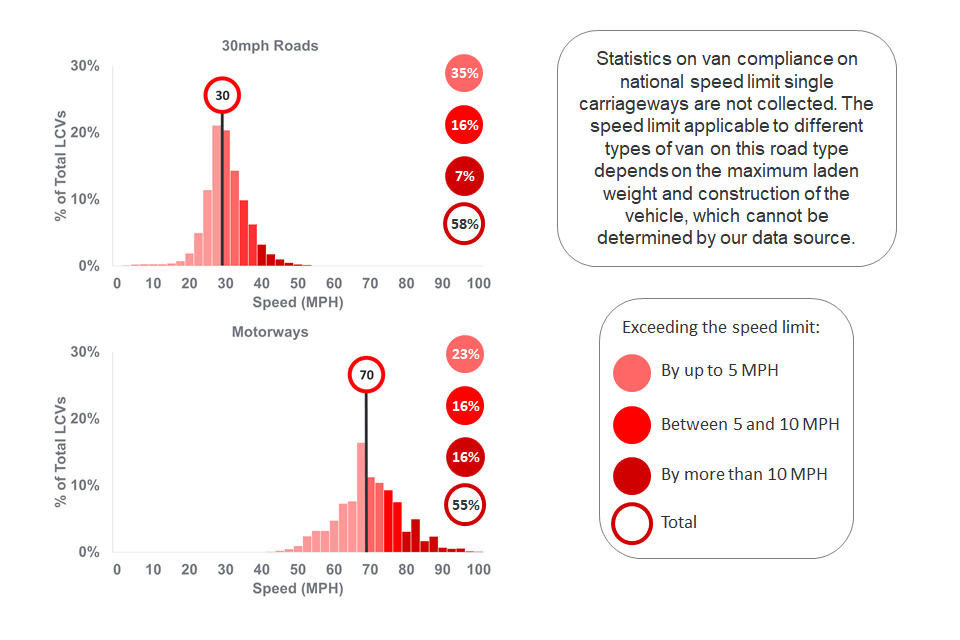
30mph roads had the highest proportion of vans exceeding the speed limit but motorways had the highest proportion of vans exceeding the speed limit by more than 10mph.
Articulated HGV (HGVA) compliance with speed limits
In free-flow conditions, the proportions of articulated HGVs complying with the speed limit were 98% on motorways, 65% on NSL single carriageways and 54% on 30mph roads.
On motorways, 2% of articulated HGVs exceeded the speed limit, compared to 35% on NSL single carriageway roads and 46% on 30mph roads.
The proportion of articulated HGVs exceeding the speed limit by over 10mph on 30mph roads was 3%, while less than 1% exceeded the speed limit by more than 10mph on motorways and NSL single carriageway roads.
The low proportion of HGVAs exceeding the speed limit on motorways can be attributed to legislation requiring all HGVs over 3.5 tonnes to be fitted with speed limiters to 56mph.
Figure 5: Distribution of Articulated HGV speeds by road type in Great Britain, 2020 (Table SPE0111)
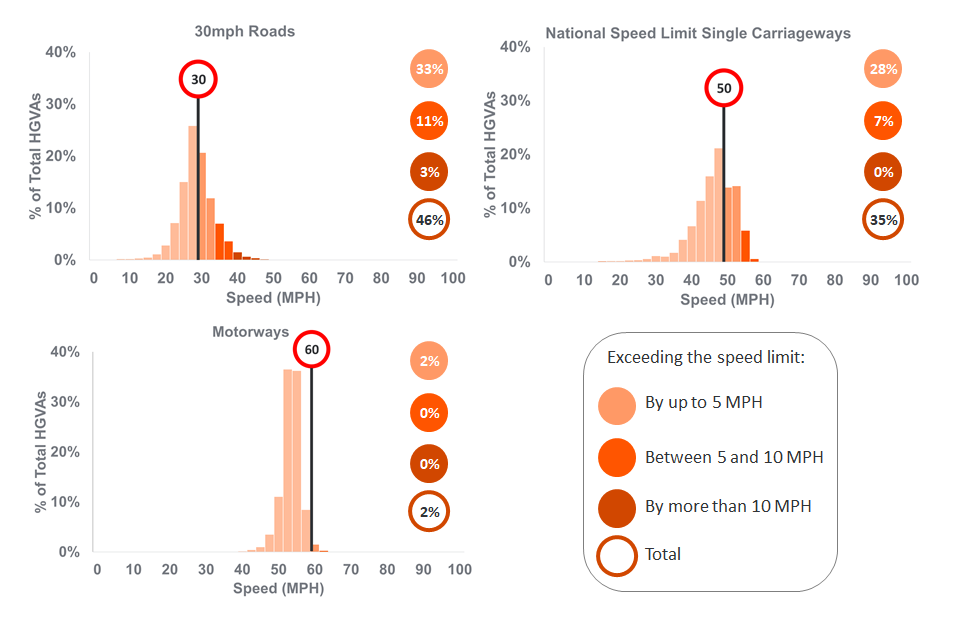
30mph roads had the highest proportion of articulated heavy goods vehicles exceeding the speed limit. Due to articulated heavy goods vehicles being speed limited, 2% exceeded the speed limit by up to 5mph on motorways, and 0% from 5mph and above.
Rigid HGV (HGVR) compliance with speed limits
In free-flow conditions, the proportions of rigid HGVs complying with the speed limit were 59% on NSL single carriageways and 51% on 30mph roads.
On NSL single carriageway roads 41% of rigid HGVs exceeded the speed limit, compared to 49% on 30mph roads.
The proportion of rigid HGVs exceeding the speed limit by over 10mph on 30mph roads was 5%, and 4% on NSL single carriageways.
Figure 6: Distribution of Rigid HGV speeds by road type in Great Britain, 2020 (Table SPE0111)
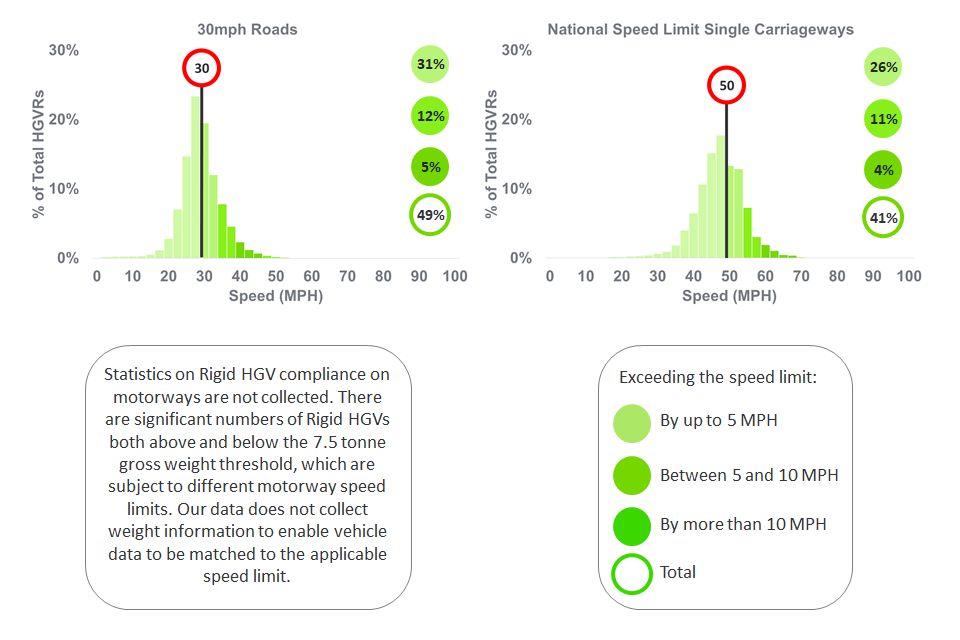
30mph roads and national speed limit single carriageways showed similar distributions in rigid heavy goods vehicles. 5% exceeded the speed limit by more than 10mph on 30mph roads. 4% did so on national speed limit single carriageways.
Change in speed limits for HGVs over 7.5 tonnes maximum laden weight
On 6 April 2015, in England and Wales only, the national speed limit for HGVs more than 7.5 tonnes maximum laden weight increased from 50mph to 60mph on dual carriageways, and from 40mph to 50mph on single carriageways.
Because rigid HGVs above and below the 7.5 tonne threshold have different applicable speed limits and the ATC sites cannot determine laden weight, we cannot calculate speed compliance data. Therefore, speed compliance statistics are only available for articulated HGVs.
More detailed studies of the impact of these changes were produced and published in a final report in July 2020.
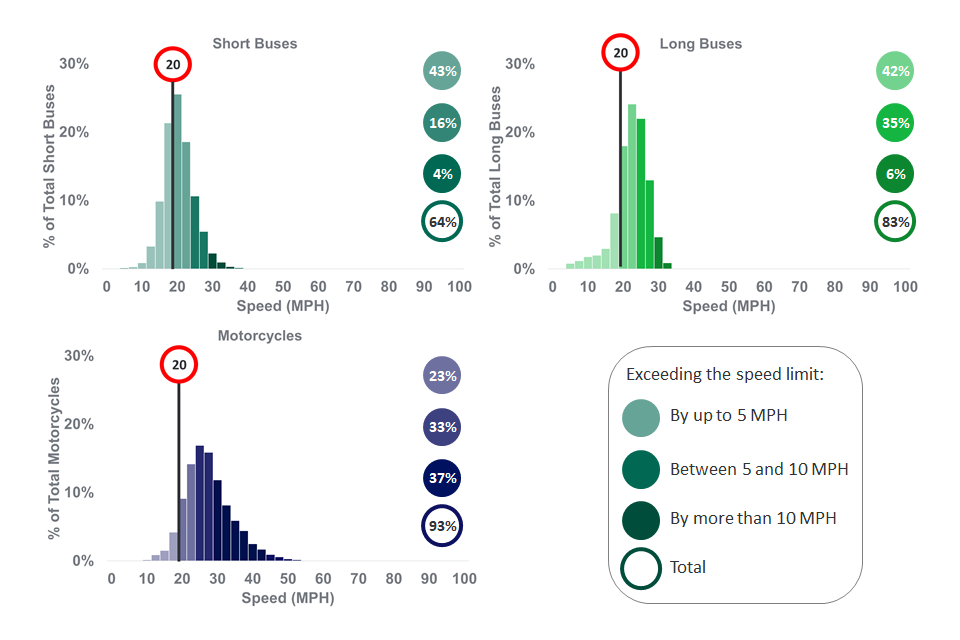
Short bus compliance with speed limits
In free-flow conditions, the proportions of short buses (under 12m) complying with the speed limit were 55% on NSL single carriageway and 71% on 30mph roads.
In free-flow conditions, the proportions of short buses exceeding the speed limit was 45% on NSL single carriageways and 29% on 30mph roads.
The proportion of short buses exceeding the speed limit by over 10mph on NSL single carriageway and 30mph roads was 6% and 2% respectively.
Figure 7: Distribution of short buses speeds by road type in Great Britain, 2020 (Table SPE0111)
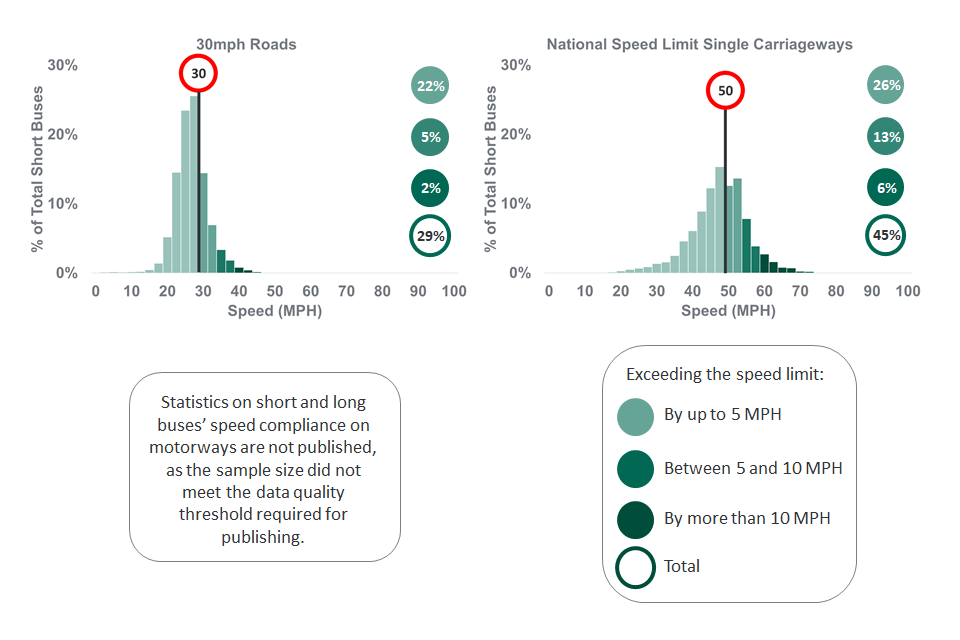
5% of short buses exceeded the speed limit between 5 and 10mph on 30mph roads, compared to 13% on national speed limit single carriageways.
Long bus compliance with speed limits
On 30mph roads and NSL single carriageways 76% and 52% of long buses (over 12m) complied with the speed limit respectively.
In free-flow conditions, the proportions of long buses exceeding the speed limit was 48% on NSL single carriageways and 24% on 30mph roads.
The proportion of long buses exceeding the speed limit by over 10mph on 30mph roads and NSL single carriageways was 1% and 4% respectively.
Figure 8: Distribution of long buses speeds by road type in Great Britain, 2020 (Table SPE0111)
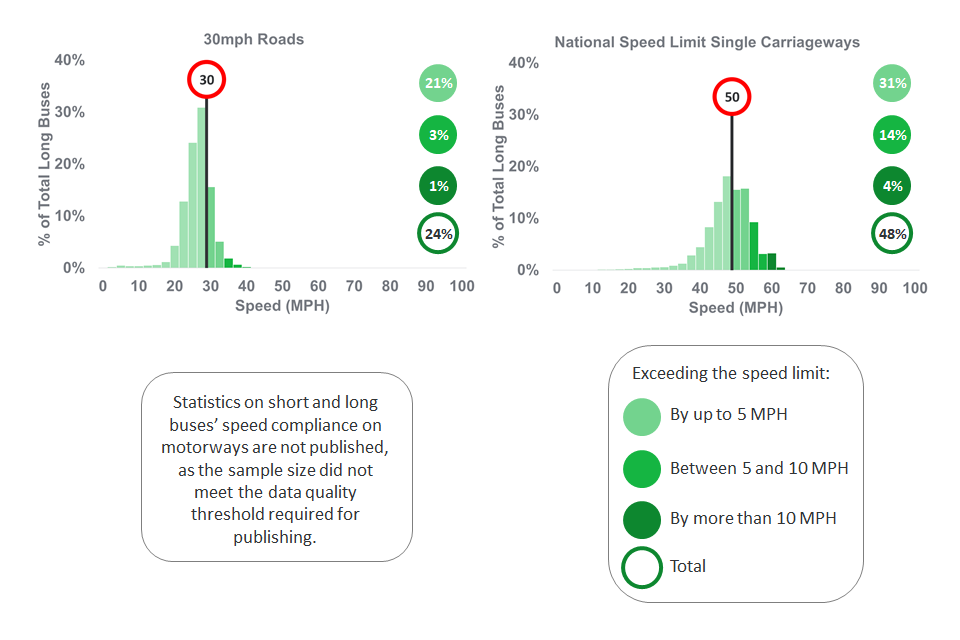
National speed limit single carriageways saw the highest proportion of long buses exceeding the speed limit by up to 5mph only. 3% exceeded the speed limit between 5 and 10mph whereas 14% did on national speed limit single carriageways.
Motorcycle compliance with speed limits
In free-flow conditions, the proportions of motorcycles complying with the speed limit were 42% on motorways, 71% on NSL single carriageways and 33% on 30mph roads.
On motorways and 30mph roads 58% and 67% of motorcycles exceeded the speed limit respectively, compared to 29% on NSL single carriageways.
The proportion of motorcycles exceeding the speed limit by over 10mph on motorways was 22%, higher than other vehicle types, compared to 19% of motorcycles on 30mph and 11% on NSL single carriageway roads.
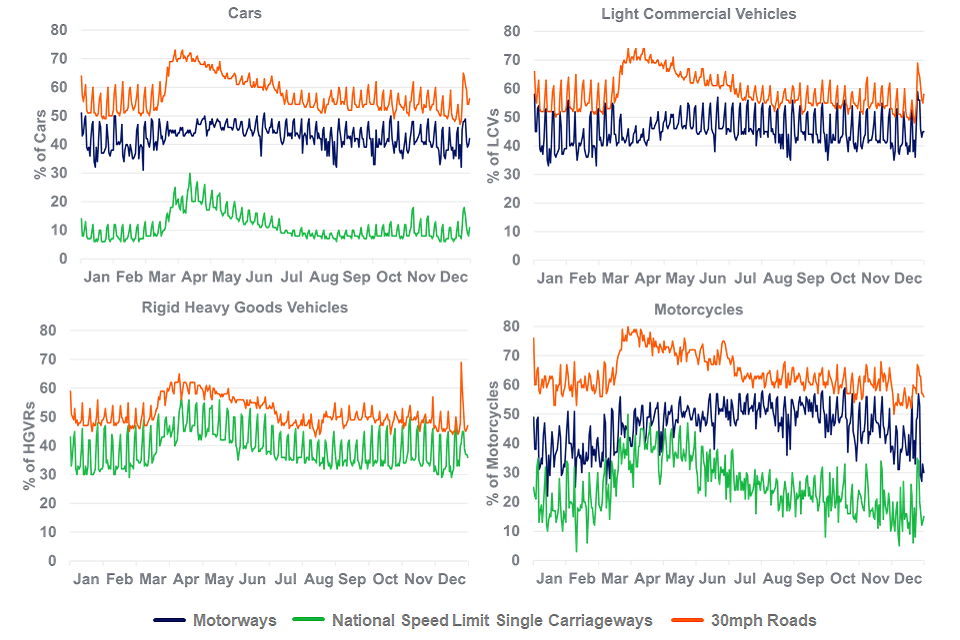
Figure 9: Distribution of motorcycle speeds by road type in Great Britain, 2020 (Table SPE0111)
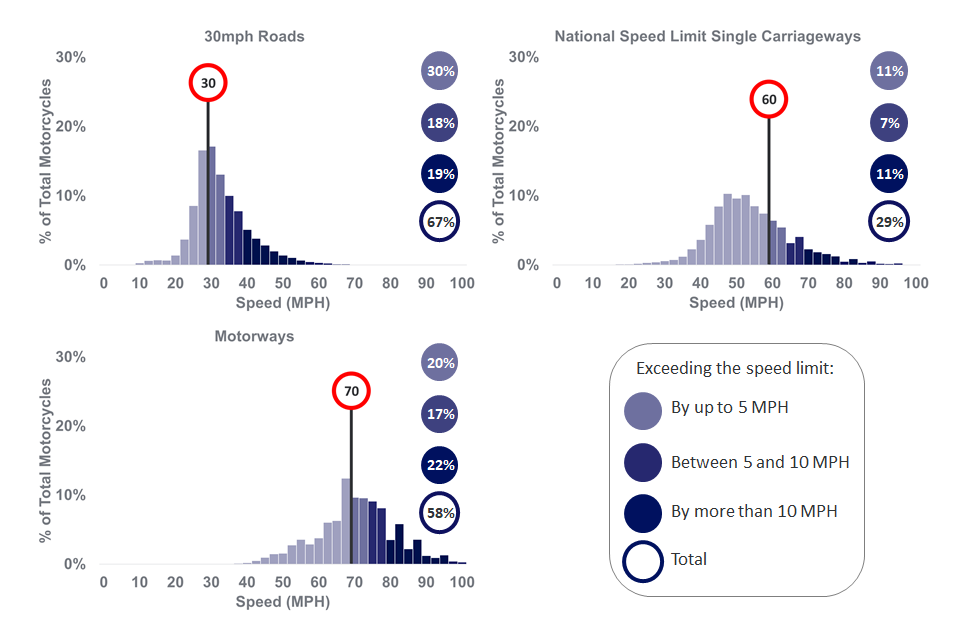
30mph roads saw the highest proportion of motorcycles exceeding the speed limit. Motorways saw the highest proportion exceeding the speed limit by more than 10mph and national speed limit single carriageways saw the lowest.
Speed limit compliance by time of day
In free-flow conditions, most vehicle classes saw a higher proportion of vehicles exceeding the speed limit during the night and a lower proportion during the day.
30mph roads saw the greatest differences in proportion of vehicles exceeding the speed limit between during the day and during the night. These are generally the roads where higher volumes of pedestrians might be expected.
For most vehicle types, a slightly lower proportion of vehicles were seen exceeding the speed limit during rush hour periods. However, due to road traffic levels dropping during periods of 2020, peak rush hour periods were less pronounced in comparison to previous years.
Figure 10a: Percentage of vehicles exceeding the speed limit by time of day in Great Britain, 2020 (Table SPE0113)
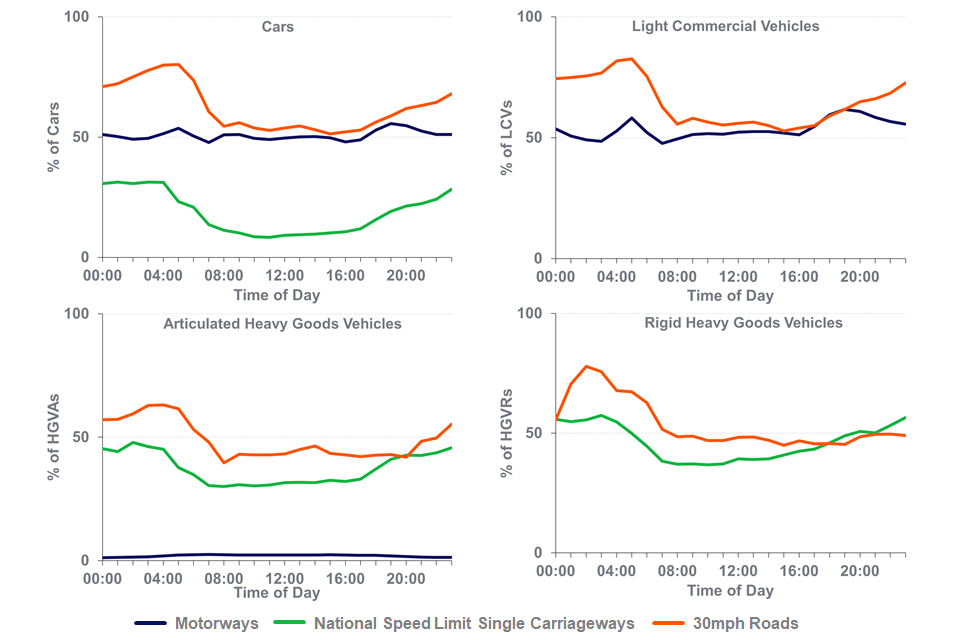
30mph saw the highest proportion of vehicles exceeding the speed limit, with the highest figures seen during the early hours of the morning and the lowest during rush hour periods.
Figure 10b: Percentage of vehicles exceeding the speed limit by time of day in Great Britain, 2020 (Table SPE0113)
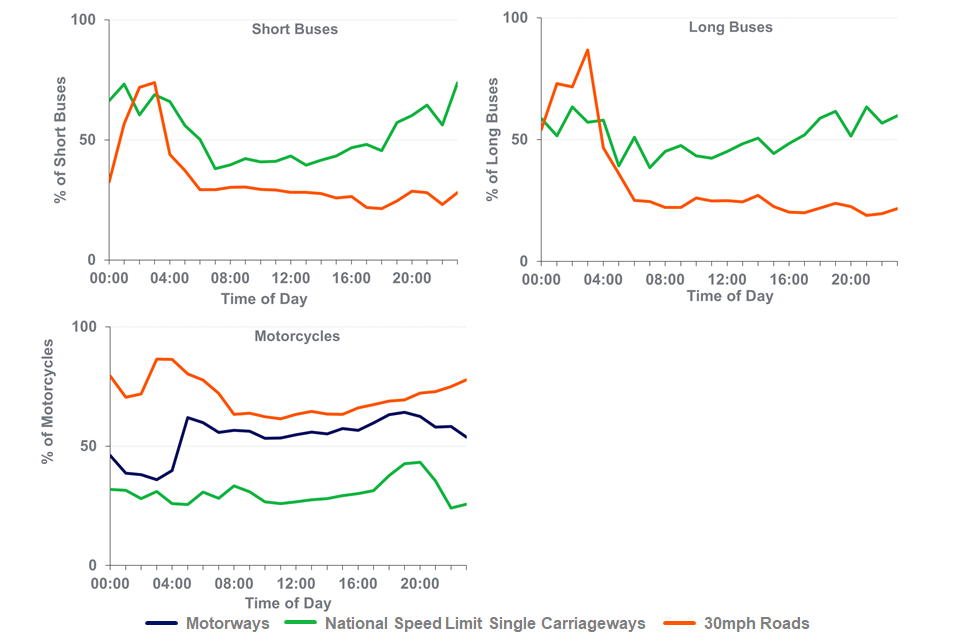
Short and long buses saw a sharp increase in speed limit exceedance in the early hours of the morning on 30mph roads. This dropped and remained relatively stable between 4am and 10pm.
Speed limit compliance by day of week
On all road types the percentage of vehicles exceeding the speed limit is generally consistent from Monday to Friday and from Saturday to Sunday. For most vehicle types, 30mph roads saw larger differences between Saturday and Sunday, but still differed from weekday figures. Therefore, we are able to categorise speed limit exceedance by weekday or weekend.
On motorways, 48% of cars exceeded the speed limit during weekdays, rising to 55% on weekends. On 30mph roads, 52% of cars exceeded the speed limit on weekdays compared to 59% on weekends. Whereas 9% of cars exceeded the speed limit on weekdays for NSL single carriageways rising to 11% on weekends.
For almost all vehicle classes and road types, the percentage of vehicles exceeding speed limits on weekends are equal to or higher than the percentage exceeding the speed limit on weekdays; short buses on 30mph roads are an exception.
Figure 11a: Percentage of vehicles exceeding the speed limit by day of week in Great Britain, 2020 (Table SPE0115)
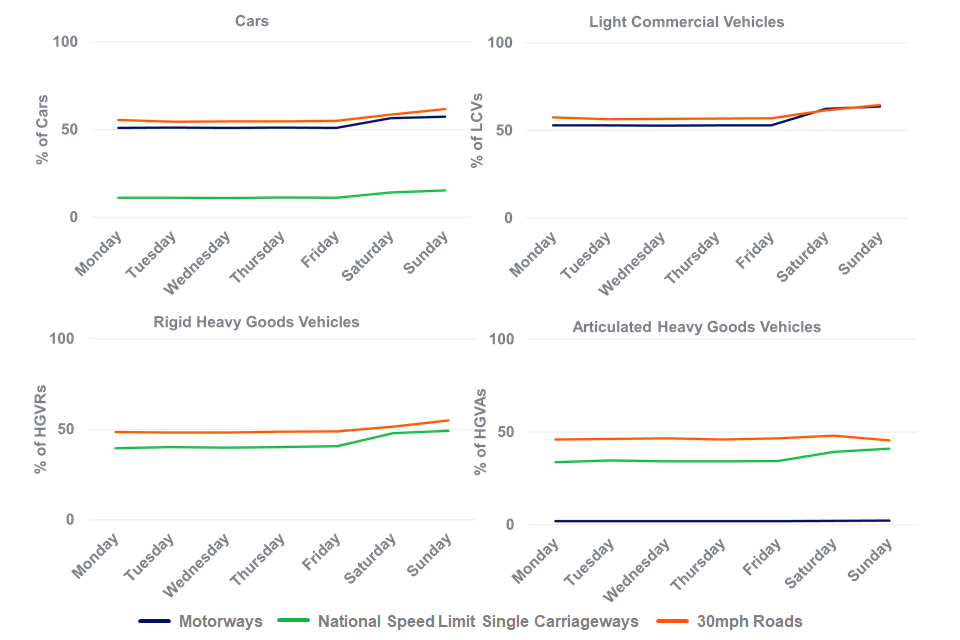
All road types show a consistent % of vehicles exceeding the speed limit on weekdays, with a slight increase on Saturdays and another slight increase on Sundays.
Figure 11b: Percentage of vehicles exceeding the speed limit by day of week in Great Britain, 2020 (Table SPE0115)
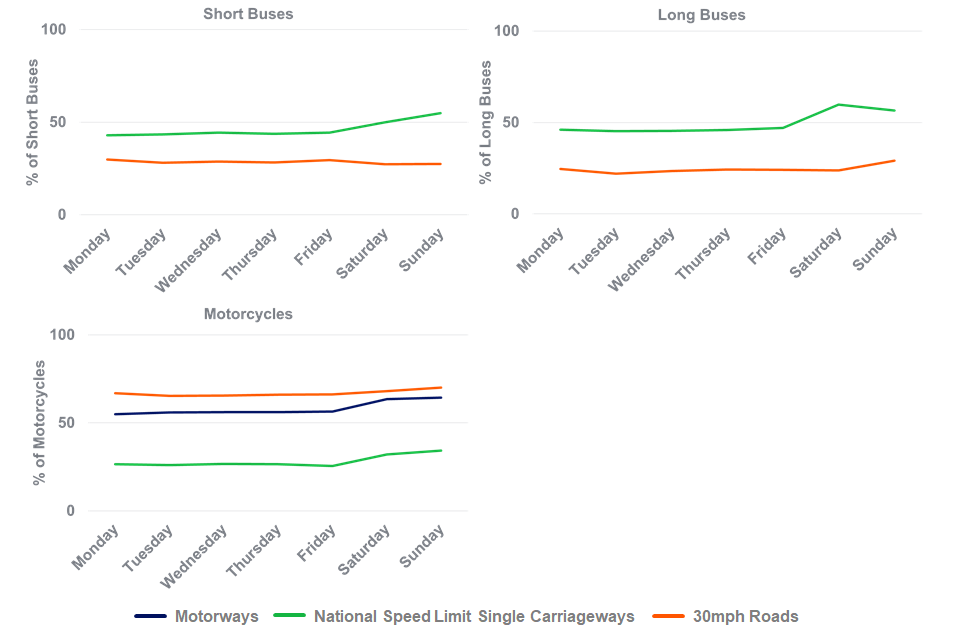
All road types show a consistent % of vehicles exceeding the speed limit on weekdays, with a slight increase on Saturdays and another slight increase on Sundays. Short buses showed a slight decrease at the weekend on 30mph roads.
Average free-flow speeds by road and vehicle type
This section presents the average free-flow speeds at which drivers choose to travel as observed at sampled ATC locations. The average free-flow speed for each vehicle type is correlated with the applicable speed limit for that road type. These are not average speeds across the whole network. These can be found at road congestion and travel time statistics.
For motorways and national speed limit single carriageway sites, the average free-flow speed is at or below the designated speed limit for each vehicle type. This is particularly marked for single carriageway sites where speeds are significantly below the relative speed limits, which is consistent with the greater compliance with speed limits on those roads.
For 30mph sites the average free-flow speed is slightly above the speed limit for 3 vehicle types (cars, motorcycles and vans), with averages for all vehicle types ranging from 28mph to 34mph overall.
For the 20mph sites (which are not thought to be representative of all 20mph roads), the average speed is above the speed limit for all vehicle types, ranging from 22mph to 29mph but below the average speeds seen on the 30mph roads.
Figure 12: Average free-flow speeds by vehicle type and road type in Great Britain, 2020 (Table SPE0111)
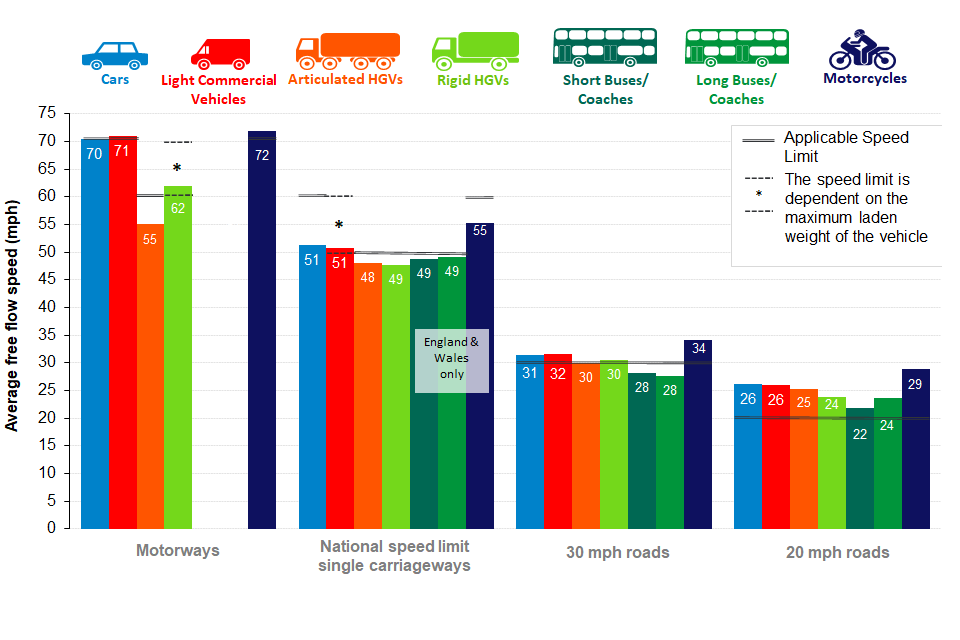
Motorcycles showed the highest average free flow speed for all road types, whereas buses and articulated heavy goods vehicles showed the lowest.
Vehicle speeds on 20mph roads
The department also has data for a number of ‘free-flow’ sites with 20mph speed limits, however the data from these need to be interpreted with additional caution because:
By their nature, roads with 20mph speed limits are particularly likely to have traffic calming measures in place, or not be ‘free-flow’ for other reasons (for example, narrow, or with many corners and bends). Indeed DfT guidance suggests that 20mph limits are most effective when they have traffic calming measures or when average vehicle speeds are already below 24mph.
The 20mph ‘free-flow’ sites tend to be on ‘through routes’ rather than smaller residential streets – reflecting the constraints both of finding ‘free-flow’ traffic conditions and locations suitable for the installation of automatic traffic monitoring equipment. Thus quieter residential streets which may make up a large proportion of 20mph roads will be under-represented in the data.
Therefore the ‘free-flow’ 20 mph sites in this data set will tend to be unrepresentative of 20mph limits in general, and this effect will be much greater than for other speed limits considered above. These factors need to be taken into account when looking at the results for 20 mph sites available in this data set.
In 2018, DfT published the results of a detailed research study into 20mph limits without traffic calming measures, which can provide a more detailed and rounded picture for these roads.
Key findings show:
- 20mph limits are supported by the majority of residents and drivers
- there has been a small reduction in average (median) speed – less than 1mph
- vehicles travelling at higher speeds before the introduction of the 20mph limit have reduced their speed more than those already travelling at lower speeds
Figure 13: Proportion of vehicles exceeding the speed limit in Great Britain on 20mph roads, 2020
20mph roads saw an increase in the proportion of vehicles exceeding the speed limit in March 2020. This steadily returned to normal and remained largely consistent throughout the remainder of the year.
Vehicle speeds on 20mph roads in the sample show that in 2020 HGVRs and short buses saw greater speed compliance than other vehicle types.
Under free-flow conditions, 87% of cars exceeded the speed limit at the 20mph sites. 20% exceed the speed limit by more than 10mph (Figure 14a and 14b).
On 20mph roads, 87% of cars exceeded the speed limit during weekdays, and 89% during the weekend (Figure 15).
Most vehicle classes saw a higher percentage of vehicles exceeding the speed limit during the night and a lower percentage of vehicles exceeding the speed limit during the rush hour.
Figure 14a: Distribution of vehicle speeds on 20mph roads in Great Britain, 2020 (Table SPE0111)
A similar proportion of vehicles exceed the speed limit by up to 5mph and between 5 and 10mph, except for rigid heavy goods vehicles where a higher proportion exceeded the speed limit by up to 5mph.
Figure 14b: Distribution of vehicle speeds on 20mph roads in Great Britain, 2020 (Table SPE0111)
Short and long buses saw a low proportion exceeding the speed limit by more than 10mph compared to by up to 5mph. Motorcycles saw a higher proportion exceeding the speed limit by more than 10mph compared to by up to 5mph.
Figure 15: Percentage of cars exceeding the speed limit on 20mph roads by time of day in Great Britain, 2020 (Table SPE0113)
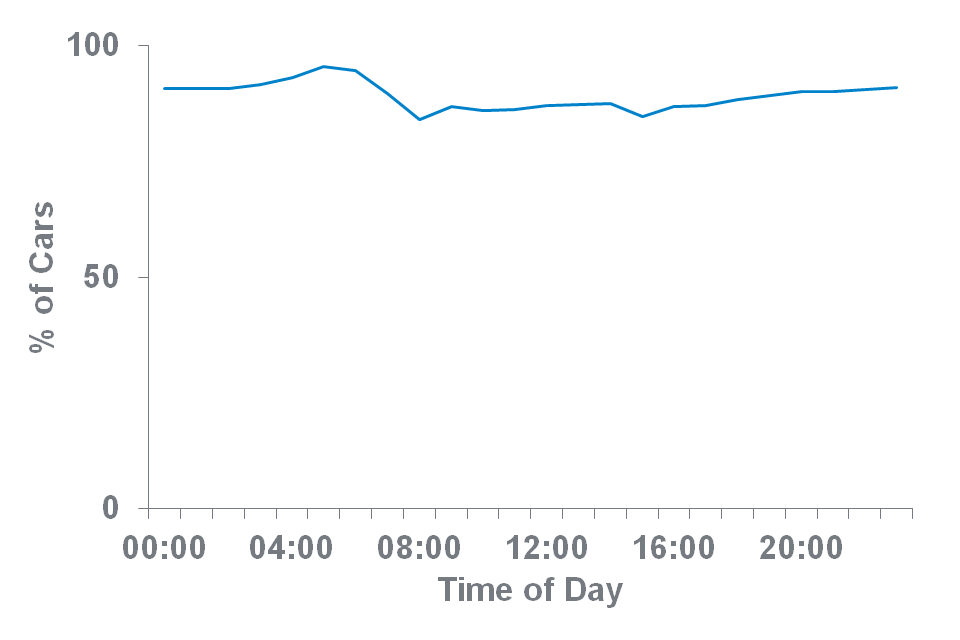
The lowest % of cars exceeding the speed limit on 20mph was during the rush hour periods. The highest % was the early hours of the morning, peaking around 6am.
Reasons for breaking the speed limit
The RAC report on motoring 2020 asked users to select up to 3 reasons why they exceed the speed limit for each road class. The respondents who admitted to exceeding the speed limit on motorways selected a greater number of reasons on average than those who admitted exceeding the speed limit on 20mph roads.
Of these 5 reasons, the top reason given was “I drive according to the speed of other road users” cited by 39% of motorway users and 28% of 30mph road users. On 20mph roads, users most often cited the speed limit being inappropriate as the contributor to their exceeding the speed limit (45%).
Figure 16: Reasons for breaking the speed limit on motorways, 30mph and 20mph roads
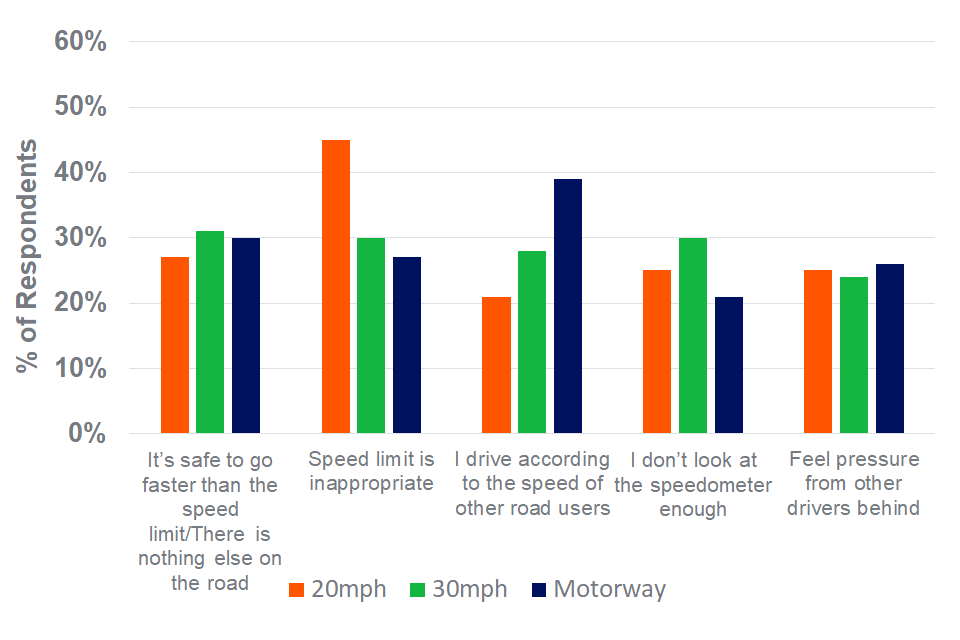
‘Speed limit is inappropriate’ and ‘I drive according to the speed of other road users’ had the most disparity between road types. 45% of drivers on 20mph roads felt the speed limit was inappropriate, compared to under 30% for motorway drivers.
Source: RAC report on motoring, 2020
This data comes from the RAC’s report on motoring 2020. The report is published annually and is based on drivers’ attitudes to motoring, including a section on speeding and attitudes to speeding. It is based on an online quota-based survey of UK motorists. Drivers who admitted to exceeding the speed limit on particular types of road were asked their reasons for doing so, which are shown here. These are not National Statistics but are included here to provide additional context.
For motorways, there is a category in the reasons given called “It is safe to go faster than the speed limit”. For 30mph roads, this category is not present but there is another category called “No vehicles or pedestrians on the road”. These 2 have been taken together in this analysis, as it is deemed that they are covering broadly the same safety issue but fitted for the differing nature of the different road types.
The results are taken from respondents who self-reported as speeding “frequently” or “occasionally” on the listed roads.
The sample size was higher for motorways (1660) than for 30mph roads (1056) or 20mph road (1130) with each respondent able to choose up to 3 answers. As respondents are able to select more than one answer, the total percentage exceeds 100% for each road type. This does not indicate more individuals exceeding the speed limit, but a wider variety of reasons given.
Speed offences
This section reports on previously published data directly relating to speeding offences and road traffic accidents involving speeding.
During the coronavirus pandemic, road traffic levels decreased (see context section). This has likely influenced the number of prosecutions for motoring offences, including speeding offences.
Key terms
Fixed Penalty Notice (FPN)
Offered to motorists to avoid prosecution for various motoring offences (for example, speeding, neglect of traffic directions and using a mobile phone while driving) by paying a prescribed financial penalty.
Speed awareness courses
National Driver Offender Retraining Scheme (NDORS) is a set of schemes unique to the UK, where a motorist who has been caught committing a traffic offence at a ‘low level’, such as speeding, is given an opportunity to attend a course focusing on re-education designed to achieve greater compliance with the road traffic legislation.
Conviction ratio
The number of convictions as a proportion of the number of proceedings. These are calculated on a principal offence basis.
Motor vehicle offences relating to exceeding the speed limit
Figure 17: Indices of motor vehicle offences relating to exceeding the speed limit, 2011 to 2020 (Table SPE0201)
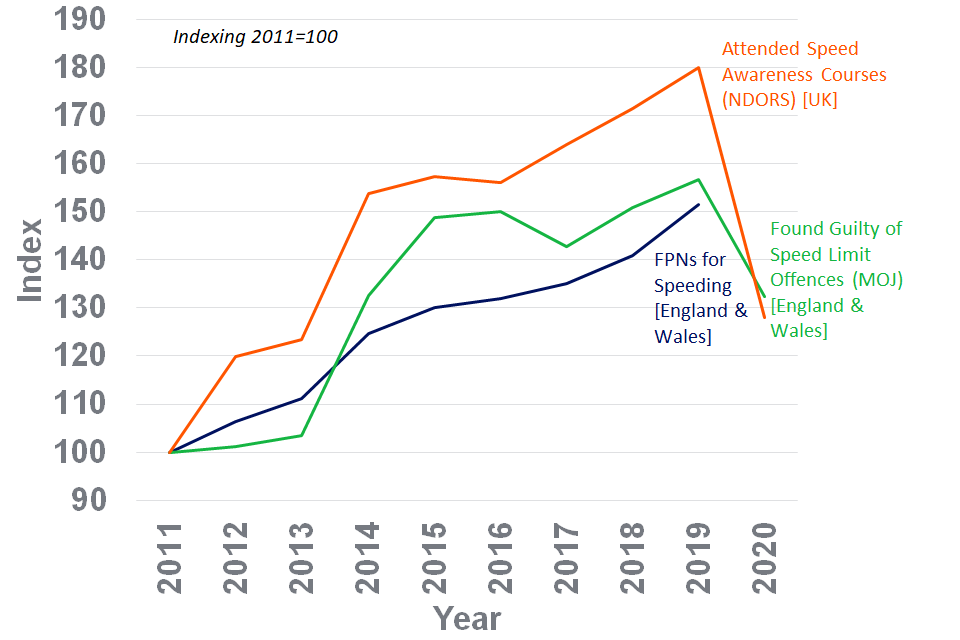
Although number of motor vehicle offences relating to exceeding the speed limit has been steadily increasing since 2011, 2020 saw a sudden drop in speed awareness courses and those found guilty of speed limit offences.
Sources: Home Office (HO), Ministry of Justice (MoJ) and National Driver Retraining Scheme (NDORS)
Outcomes following speed limit offences
The PentiP system recorded 2.67 million speed limit offences in England and Wales in 2019, an increase of 7.6% compared with the previous year.
The scope of the Home Office series includes those cases which resulted in either a FPN being issued to the driver, a driver retraining course (such as a speed awareness course) was attended by the individual, or cases where the individual faced court action.
The 2020 figures for speed limit offences will be published by the Home Office in October 2020.
Speeding offences
There was an 90% conviction ratio for people proceeded against for speed limit offences in England and Wales in 2020 (150,000 were found guilty).
33% of motoring convictions in 2020 were for speed limit offences.
The number of people found guilty of speed limit offences has decreased since 2019. The number of people found guilty of all motoring convictions (not shown in Figure 17) has also decreased. This is likely to be influenced by fewer car journeys being made throughout 2020 during the pandemic period.
Speed awareness courses
In 2020, 1.19 million drivers attended a speed awareness course in the UK, a decrease from 1.39 million in 2019. Since 2014, there have been over 1 million speed awareness course attendances per year.
The decrease in speed awareness courses attendance in 2020 is likely to be influenced by only virtual courses being made available due to the closure of physical classrooms during the pandemic period. Furthermore, in 2020, not all courses were available in all police forces due to the pandemic.
In preceding years, there has generally been an increase seen in speed courses attended, which reflects changes to courses that are available.
The speed awareness course data include those Driver Retraining Course Attendances processed in Scotland, Northern Ireland or locally by police forces that are not included in Home Office’s FPN series.
Vehicle headway
This section provides information about the time gaps between pairs of vehicles. This time gap is referred to as headway.
Headway
Headway is the measurement of time between the 2 vehicles. The Highway Code (rule 126) states that all drivers “should allow at least a 2 second gap between you and the vehicle in front on roads carrying faster moving traffic”, and “this should be at least doubled” in inclement conditions.
More information can be found on the Highway Code.
Key findings
In 2020, 81% of cars, 82% of LCVs, and 75% of motorcycles left the recommended 2 seconds gap between themselves and other vehicles.
A higher percentage of vehicles with slower speed limits leave the recommended minimum 2 second gap: 90% of HGVAs, 85% of HGVRs and 88% of buses and coaches.
Adherence to the recommended 2 second gap has remained relatively stable since 2011, with the exception of 2020 where adherence has increased. This could be partly due to the decreased traffic levels on roads during the coronavirus pandemic period, causing less congestion on roads.
The proportion of vehicles leaving a gap of 6 seconds or more has increased compared to previous years. Again, this could be partly due to lower traffic levels allowing vehicles to increase their headway.
Figure 18: Distribution of time gaps between vehicles, split by type of vehicle behind, 2020 (Table SPE0114)
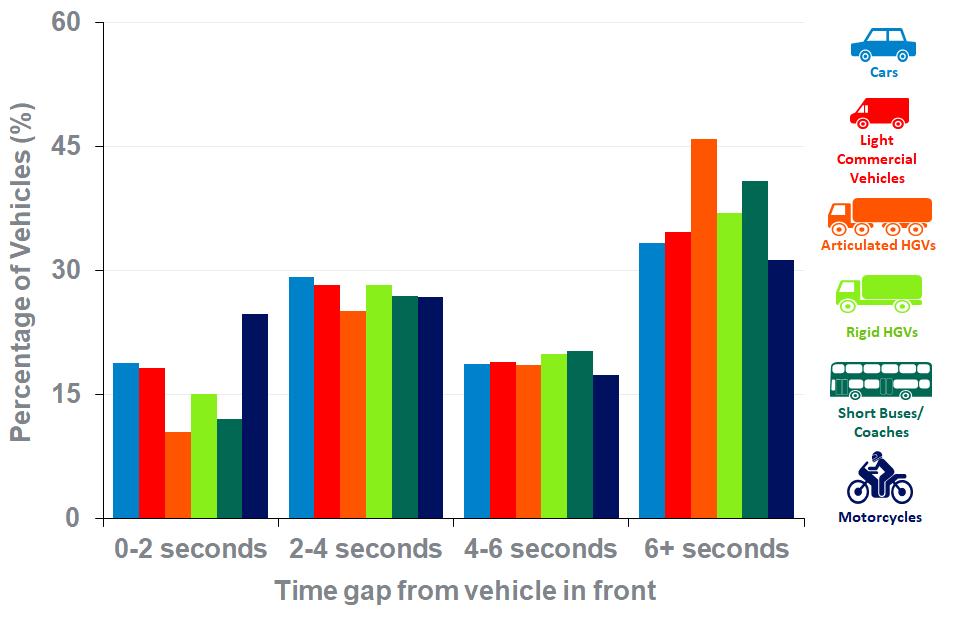
A time gap of 6 seconds and above was seen in a higher % of all vehicle types compared to lower time gaps. A time gap of between 0 and 2 seconds was seen in the lowest % of vehicles.
Background information
What’s changed in this release
Since the last release, we have conducted another review of our list of ATC sites to ensure they continue to reflect free-flow sites of each road class. Sites that have been removed have changed road class, road layout, or have in-road traffic calming measures such as chicanes or speed bumps. Motorways undergoing smart motorway works or which have become smart motorways have been excluded from the sample.
The section presenting statistics relating to speed as a contributory factor in road accidents has been excluded from this release. These statistics typically cover the year prior to the year reported throughout the release (this year would cover up to 2019 only). Due to exceptional changes in trends seen throughout 2020, data relating to previous years has been excluded. The data can still be found in the statistical tables published alongside this release.
Vehicle definitions
Table 4: Definition of vehicles
| Car | Includes cars, car derived vans and dual purpose vehicles |
|---|---|
| LCV (van) | Light Commercial Vehicle, goods vehicle of 3.5 tonnes gross weight and under |
| HGV | Heavy Goods Vehicle, goods vehicle of over 3.5 tonnes gross weight. For the purpose of these statistics, rigid 2-axle HGVs cannot be assigned definitively to a national speed limit, since it is not known whether or not they are over 7.5 tonnes gross weight. Therefore no speed limit compliance statistics can be produced for these vehicles for motorways. All other observed HGVs are assumed to have more than 7.5 tonnes maximum laden weight and therefore have been assigned the speed limit for such vehicles |
| Motorcycle | Two Wheeled Motor Vehicle, here simplified to motorcycles, including scooters and mopeds |
| Short Bus | Includes buses and coaches of 12m length or below |
| Long Bus | Includes buses and coaches over 12m in length. Long buses have different speed restrictions on motorways to short buses, therefore separate statistics are produced for each |
Speed limits on different road types
See the speed limits webpage for more information on the complete breakdown of national speed limits.
All vehicles have the same speed limit on 20mph and 30mph roads.
Figure 19: Applicable speed limits for motorways and national speed limit single carriageways
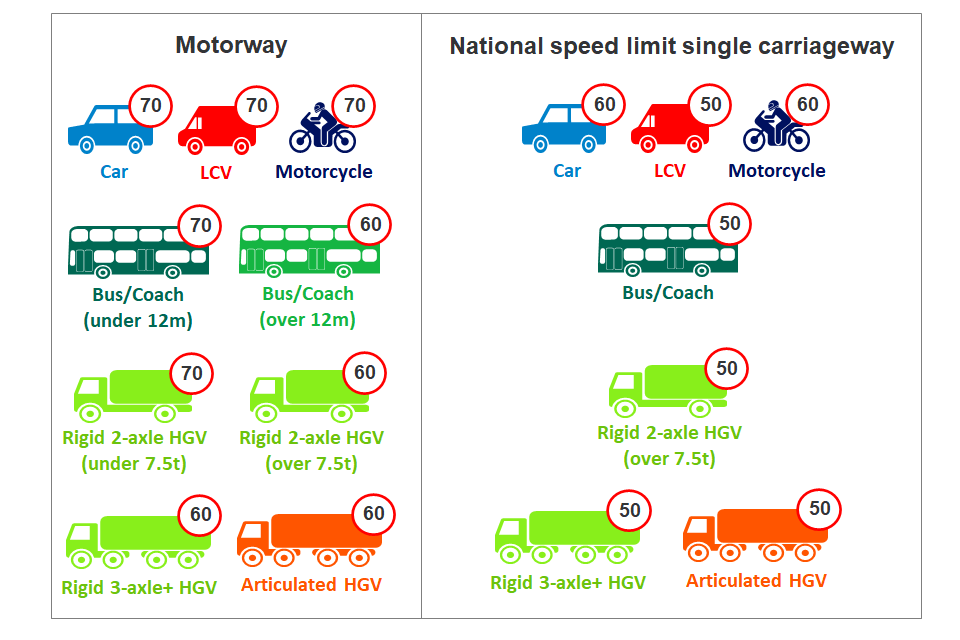
Rigid and articulated heavy goods vehicles and long buses have a speed limit of 60 on motorways. Vans, buses, rigid and articulated heavy goods vehicles all have a speed limit of 50 on national speed limit single carriageways.
Sources, strengths and weaknesses of the data
Following an annual sample review, these estimates are based on traffic speed data collected from a current sample of 79 Automatic Traffic Counters (ATCs) operated by DfT. In some cases (for example motorways), 2 ATCs may be covering different directions of traffic flow at the same location. The number of individual vehicles observed in the production of these statistics was 371 million. The breakdown for each year is shown in Table 5.
Table 5: Number of Automatic Traffic Counters and vehicles used to produce free-flow vehicle speed statistics for Great Britain, 2011 to 2021
| Year | Automatic Traffic Counters used | Vehicles used (millions) | Significant proportion of data removed from (number of sites) |
|---|---|---|---|
| 2011 | 99 | 685 | 3 motorways |
| 2012 | 99 | 702 | 3 motorways |
| 2013 | 98 | 605 | 3 motorways |
| 2014 | 105 | 567 | 3 motorways |
| 2015 | 107 | 743 | 3 motorways |
| 2016 | 107 | 725 | 0 |
| 2017 | 92 | 637 | 0 |
| 2018 | 102 | 655 | 0 |
| 2019 | 79 | 510 | 0 |
| 2020 | 79 | 371 | 0 |
| 2020 January to June | 78 | 91 (cars only) | 1 motorway |
| 2020 July to September | 77 | 66 (cars only) | 1 30mph road |
| 2020 October to December | 77 | 50 (cars only) | 0 |
| 2021 January to March | 78 | 32 (cars only) | 0 |
The ATC technology used to collect this data can experience technical failures and produce output data which is incorrect and not representative of the traffic passing the counter. The methodology accounts for these occasions and removes any data which is not accurately recorded, as well as during times when traffic volumes are unexpectedly low or high.
The ATCs classify vehicles using the number of axles, the axle spacing and the length of the vehicle.
Full guidance on the sources and methods used to compile these statistics, plus information on speed limits, can be found on the guidance page.
Detailed information on the reported accidents data used in this release can be found in the reported road casualties annual report.
Detailed information on the Home Office data used in this release can be found in the user guide to police powers and procedures.
Detailed information on the Ministry of Justice data used in this release can be found at criminal justice statistics quarterly.
Average speed statistics for both local authority managed ‘A’ roads and the Strategic Road Network are available online as part of a suite of travel time measures from the road congestion and reliability statistics. Note that this series also uses the term “free-flow speed” but this is calculated in a different way (for example, ‘capped’ at national speed limits) and using a different data source to the statistics presented in this release.
Next update
The 2021 release is due to be published in 2022. We are continuing to review methodologies and the coverage of these statistics and further changes may be reflected in the next publication. We welcome feedback on this publication including content, timing, and format via email to road traffic statistics.
National Statistics
National Statistics are produced to high professional standards set out in the National Statistics Code of Practice. They undergo regular quality assurance reviews to ensure they meet customer needs.
Free-flow vehicle speed statistics were assessed by the UK Statistics Authority against the Code of Practice and were designated as National Statistics in February 2013.
Details of Ministers and officials who receive pre-release access to these statistics up to 24 hours before release can be found on the pre-release access page.
Department for Transport (DfT) statistics Twitter feed
To hear more about DfT statistics publications as they are released, please follow us on Twitter.