UK House Price Index summary: September 2022
Published 16 November 2022

© Crown copyright 2022
This publication is licensed under the terms of the Open Government Licence v3.0 except where otherwise stated. To view this licence, visit nationalarchives.gov.uk/doc/open-government-licence/version/3 or write to the Information Policy Team, The National Archives, Kew, London TW9 4DU, or email: psi@nationalarchives.gov.uk.
Where we have identified any third party copyright information you will need to obtain permission from the copyright holders concerned.
This publication is available at https://www.gov.uk/government/statistics/uk-house-price-index-for-september-2022/uk-house-price-index-summary-september-2022
1. Headline statistics for September 2022
The average price of a property in the UK was £294,559
The annual price change for a property in the UK was 9.5%
The monthly price change for a property in the UK was 0.0%
The monthly index figure (January 2015 = 100) for the UK was 154.5
Estimates for the most recent months are provisional and are likely to be updated as more data is incorporated into the index. Read Revisions to the UK HPI data.
Next publication of UK HPI
The October 2022 UK HPI will be published at 9.30am on Wednesday 14 December 2022. See the calendar of release dates for more information.
2. Economic statement
The annual percentage change rate for average UK house prices for September 2022 was 9.5%, compared with 13.1% in the year to August 2022 and 15.2% in the year to July 2022. Two factors caused annual percentage change to slow this month:
- UK house prices remained unchanged between August and September 2022.
- UK house prices rose sharply in September 2021, which coincided with changes to Stamp Duty Land Tax.
Average UK house prices increased by a smaller amount between July and September 2022 than the same period last year. This base effect has led to the slowing of annual percentage change since July 2022.
Average UK house prices increased by £3,200 between July and August 2022 and remained unchanged between August and September 2022. In contrast, average UK house prices increased by £7,500 between July and August 2021, and by £8,600 between August and September 2021. It is likely that average house prices were slightly inflated in September 2021 as buyers in England and Northern Ireland rushed to complete property purchases before Stamp Duty Land Tax changes at the end of September 2021. Further information on the impact that changes to land taxes had on UK house prices in 2021 can be found in previous ONS releases.
Steadily increasing prices throughout 2022 resulted in the average UK house price reaching record high levels. The average UK house price was £295,000 in September 2022, which is £26,000 higher than this time last year, and unchanged since August 2022. Average house prices increased over the year to £314,000 (9.6%) in England, to £224,000 in Wales (12.9%), to £192,000 in Scotland (7.3%) and to £176,000 in Northern Ireland (10.7%).
On a non-seasonally adjusted basis, average house prices in the UK remained unchanged between August and September 2022, with a 0.0% change in price. This is down from an increase of 3.3% during the same period a year earlier (August and September 2021).
House price growth was strongest in the South West where prices increased by 11.9% in the year to September 2022. The lowest annual percentage change was in North East, where prices increased by 5.8% in the year to September 2022.
The Royal Institution of Chartered Surveyors’ (RICS’) September 2022 UK Residential Market Survey reported that new buyer enquiries continue to decline for the fifth consecutive month, with supply on the market remaining restricted.
The Bank of England’s Agents summary of business conditions 2022 Q3 reported that demand for property still exceeded supply. However prospective homebuyers had become more cautious due to concern about rising living costs.
The UK Property Transactions Statistics showed that in September 2022, on a seasonally adjusted basis, the estimated number of transactions of residential properties with a value of £40,000 or greater was 103,930. This is 36.8% lower than a year ago (September 2021). Between August and September 2022, UK transactions increased by 0.2% on a seasonally adjusted basis.
The Bank of England’s Money and Credit September 2022 release reported that mortgage approvals for house purchases, an indicator of future borrowing, decreased significantly to 66,800 in September 2022, from 74,400 in August 2022. This is below the 6-month average of 67,200.
3. Price changes
3.1 Annual price change
Annual price change for UK by country over the past 5 years

Download this chart’s data (CSV, 1KB)
Average house prices in the UK increased by 9.5% in the year to September 2022, down from 13.1% in August 2022.
At the country level, the largest annual house price growth in the year to September 2022 was recorded in Wales, where house prices increased by 12.9%.
England saw house prices increase by 9.6% in the year to September 2022.
Scotland saw houses prices increase by 7.3% in the year to September 2022.
Northern Ireland saw house prices increase by 10.7% over the year to Quarter 3 (July to September) 2022.
3.2 Average price by country and government office region
Price, monthly change and annual change by country and government office region
| Country and government office region | Price | Monthly change | Annual change |
|---|---|---|---|
| England | £314,278 | 0.0% | 9.6% |
| Northern Ireland (Quarter 3 - 2022) | £176,131 | 4.1% | 10.7% |
| Scotland | £191,941 | -0.9% | 7.3% |
| Wales | £223,798 | 2.0% | 12.9% |
| East Midlands | £252,982 | 0.0% | 11.3% |
| East of England | £362,197 | 0.1% | 10.4% |
| London | £544,113 | -0.6% | 6.9% |
| North East | £163,768 | 0.3% | 5.8% |
| North West | £219,005 | 0.6% | 9.1% |
| South East | £403,515 | -0.2% | 10.3% |
| South West | £336,583 | 0.3% | 11.9% |
| West Midlands Region | £253,864 | -0.3% | 10.1% |
| Yorkshire and The Humber | £212,593 | 0.0% | 8.5% |
Download this table’s data (CSV, 1KB)
Price changes by country and government office region
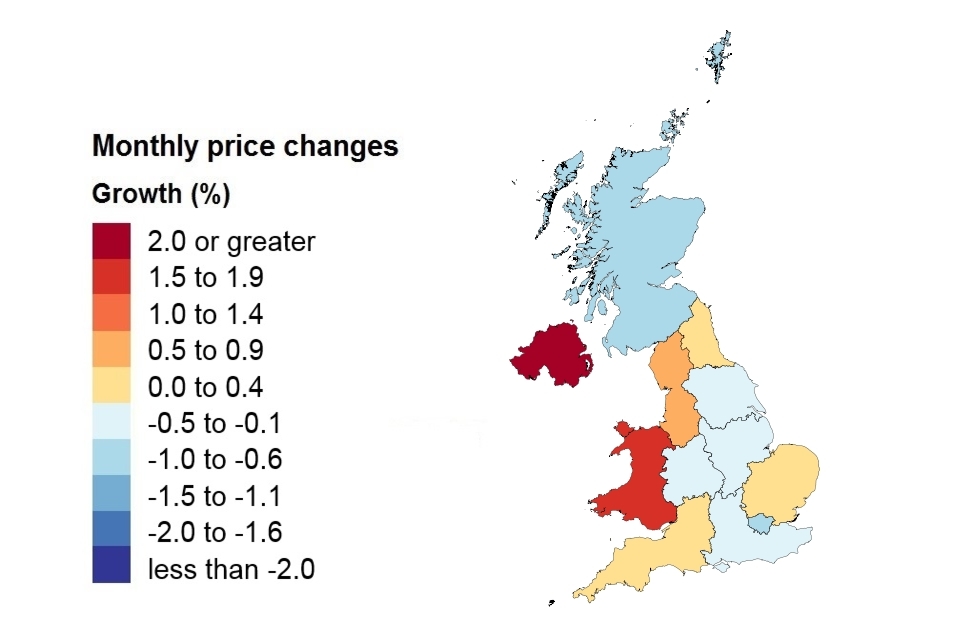
On a non-seasonally adjusted basis, average house prices in the UK remained unchanged between August 2022 and September 2022, This compares with an increase of 3.3% during the same period a year earlier (August and September 2021).
On a seasonally adjusted basis, average house prices in the UK increased by 0.1% between August 2022 and September 2022.
Note: The Northern Ireland figure represents a 3-month change and is not comparable with the other regions and countries.
3.3 Average price by property type
Average monthly price by property type
| Property type | September 2022 | September 2021 | Difference |
|---|---|---|---|
| Detached | £463,150 | £415,681 | 11.4% |
| Semi-detached | £286,654 | £258,268 | 11.0% |
| Terraced | £241,880 | £221,471 | 9.2% |
| Flat or maisonette | £232,987 | £222,368 | 4.8% |
| All | £294,559 | £269,003 | 9.5% |
Download this table’s data (CSV, 1KB)
4. Sales volumes
The amount of time between the sale of a property and the registration of this information varies. It typically ranges between 2 weeks and 2 months but can be longer. Volume figures for the most recent 2 months are not yet at a reliable level for reporting, so they are not included in the report. Published transactions for recent months will increase as later registered transactions are incorporated into the index.
Sales volume data is also available by property status (new build and existing property) and funding status (cash and mortgage) in our downloadable data tables. Transactions involving the creation of a new register, such as new builds, are more complex and require more time to process. Read Revisions to the UK HPI data for more information.
4.1 Sales volumes
Number of sales volumes by country
Comparing the provisional volume estimate for the current month with the revised volume estimate for the corresponding month in the previous year
| Country | July 2022 | July 2021 |
|---|---|---|
| England | 51,838 | 46,709 |
| Northern Ireland (Quarter 3 - 2022) | 2,134 | 2,821 |
| Scotland | 9,349 | 10,991 |
| Wales | 3,023 | 3,506 |
Note: Comparing the provisional volume estimate for the current month with the revised 12-month volume estimate.
Download this table’s data (CSV, 1KB)
Note: The ‘Difference’ column has been removed from this table as the latest month’s data are not yet complete.
Note: The number of property transactions for July 2022 will increase as more transactions are incorporated into the index. See our Revisions Policy for more information.
Comparing the provisional volume estimate for July 2021 with the provisional estimate for July 2022, volume transactions increased by 264.7% in England, decreased by 12.4% in Scotland and increased by 199.9% in Wales. Northern Ireland’s volume transactions decreased by 15.0% in the year to Quarter 3 2022.
UK Property Transaction Statistics published by HM Revenue & Customs (which differ in coverage but are more complete for this period) report that on a non-seasonally adjusted basis, in the year to July 2022 volume transactions increased by 41.9% in England, increased by 6.1% in Wales, decreased by 11.1% in Scotland, and decreased by 9.6% in Northern Ireland.
4.2 Sales volumes for the UK over the past 5 years
Sales volumes for 2018 to 2022 by country: July

Download this table’s data (CSV, 1KB)
Note: The number of property transactions for July 2022 will increase as more transactions are incorporated into the index. See our Revisions Policy for more information.
Comparing the provisional volume estimate for July 2021 with the provisional estimate for July 2022, UK volume transactions increased by 133.6% in the year to July 2022.
UK Property Transaction Statistics published by HM Revenue & Customs (which differ in coverage but are more complete for this period) report that on a non-seasonally adjusted basis, UK volume transactions increased by 31.4% in the year to July 2022.
5. Property status for UK
Transactions involving the creation of a new register, such as new builds, are more complex and need more time to process. This means they can take longer to appear in the land registers. The volume of new build transactions for the most recent 2 months are not at a reliable level for reporting the breakdown between new build and existing resold property, so they are not included in the report.
New build and existing resold property
| Property status | Average price July 2022 | Monthly change | Annual change |
|---|---|---|---|
| New build | £383,076 | 1.6% | 18.4% |
| Existing resold property | £284,611 | 2.0% | 14.7% |
Download this table’s data (CSV, 1KB)
Note: Since the October 2017 release, amendments have been made to our estimation model when calculating our provisional estimate. Find out further information and the impact of this change in the methods used to produce the UK HPI.
6. Buyer status for Great Britain
First time buyer and former owner occupier
For Great Britain only, Northern Ireland data is not available for buyer status.
| Type of buyer | Average price September 2022 | Monthly change | Annual change |
|---|---|---|---|
| First time buyer | £245,350 | 0.1% | 8.9% |
| Former owner occupier | £345,044 | -0.1% | 10.1% |
Download this table’s data (CSV, 1KB)
7. Funding status for Great Britain
Cash and mortgage
For Great Britain only, Northern Ireland data is not available for funding status.
| Funding status | Average price September 2022 | Monthly change | Annual change |
|---|---|---|---|
| Cash | £278,324 | -0.2% | 8.5% |
| Mortgage | £307,711 | 0.1% | 9.8% |
Download this table’s data (CSV, 1KB)
8. Housing transaction distributions
Between April and June 2022, there were 186,804 property sales.
The most popular price range for:
- England was £175,000 to £199,999 – 10,198 properties were purchased
- Scotland was £125,000 to £149,999 – 2,520 properties were purchased
- Wales was £125,000 to £149,999 – 1,113 properties were purchased
- Northern Ireland was £125,000 to £149,999 – 911 properties were purchased
The charts below show the distribution of housing transactions for Q2 (April to June) 2022 for countries of the UK. Data for Great Britain is presented in bands of £25,000 up to £10 million, followed by a larger band for over £10 million. Data for Northern Ireland is presented in bands of £25,000 up to £500,000, followed by a larger band for over £500,000.
In line with the UK HPI revisions policy, the number of transactions will increase as more data are incorporated into the index, which would also impact the distributions presented in this analysis.
England housing transactions
| Price band | Housing transactions |
|---|---|
| less than £25,000 | 14 |
| £25,000 - £49,999 | 433 |
| £50,000 - £74,999 | 2471 |
| £75,000 - £99,999 | 5123 |
| £100,000 - £124,999 | 6985 |
| £125,000 - £149,999 | 9109 |
| £150,000 - £174,999 | 10162 |
| £175,000 - £199,999 | 10198 |
| £200,000 - £224,999 | 9396 |
| £225,000 - £249,999 | 9497 |
| £250,000 - £274,999 | 9258 |
| £275,000 - £299,999 | 8031 |
| £300,000 - £324,999 | 7032 |
| £325,000 - £349,999 | 6579 |
| £350,000 - £374,999 | 5787 |
| £375,000 - £399,999 | 5349 |
| £400,000 - £424,999 | 4387 |
| £425,000 - £449,999 | 3948 |
| £450,000 - £474,999 | 3528 |
| £475,000 - £499,999 | 3210 |
| £500,000 - £524,999 | 2349 |
| £525,000 - £549,999 | 2135 |
| £550,000 - £574,999 | 2038 |
| £575,000 - £599,999 | 1839 |
| £600,000 - £624,999 | 1552 |
| £625,000 - £649,999 | 1399 |
| £650,000 - £674,999 | 1371 |
| £675,000 - £699,999 | 1134 |
| £700,000 - £724,999 | 992 |
| £725,000 - £749,999 | 863 |
| £750,000 - £774,999 | 925 |
| £775,000 - £799,999 | 724 |
| £800,000 - £824,999 | 639 |
| £825,000 - £849,999 | 575 |
| £850,000 - £874,999 | 594 |
| £875,000 - £899,999 | 493 |
| £900,000 - £924,999 | 439 |
| £925,000 - £949,999 | 366 |
| £950,000 - £974,999 | 348 |
| £975,000 - £999,999 | 336 |
| £1,000,000 - £1,249,999 | 1841 |
| £1,250,000 - £1,499,999 | 1197 |
| £1,500,000 - £1,749,999 | 671 |
| £1,750,000 - £1,999,999 | 382 |
| £2,000,000 - £4,999,999 | 787 |
| £5,000,000 - £9,999,999 | 76 |
| greater than £10,000,000 | 28 |
Scotland housing transactions
| Price band | Housing transactions |
|---|---|
| less than £25,000 | 71 |
| £25,000 - £49,999 | 636 |
| £50,000 - £74,999 | 1568 |
| £75,000 - £99,999 | 2452 |
| £100,000 - £124,999 | 2397 |
| £125,000 - £149,999 | 2520 |
| £150,000 - £174,999 | 2373 |
| £175,000 - £199,999 | 2219 |
| £200,000 - £224,999 | 1813 |
| £225,000 - £249,999 | 1642 |
| £250,000 - £274,999 | 1488 |
| £275,000 - £299,999 | 1270 |
| £300,000 - £324,999 | 1022 |
| £325,000 - £349,999 | 786 |
| £350,000 - £374,999 | 637 |
| £375,000 - £399,999 | 474 |
| £400,000 - £424,999 | 416 |
| £425,000 - £449,999 | 283 |
| £450,000 - £474,999 | 262 |
| £475,000 - £499,999 | 175 |
| £500,000 - £524,999 | 182 |
| £525,000 - £549,999 | 101 |
| £550,000 - £574,999 | 116 |
| £575,000 - £599,999 | 91 |
| £600,000 - £624,999 | 82 |
| £625,000 - £649,999 | 56 |
| £650,000 - £674,999 | 67 |
| £675,000 - £699,999 | 43 |
| £700,000 - £724,999 | 47 |
| £725,000 - £749,999 | 33 |
| £750,000 - £774,999 | 29 |
| £775,000 - £799,999 | 30 |
| £800,000 - £824,999 | 22 |
| £825,000 - £849,999 | 23 |
| £850,000 - £874,999 | 17 |
| £875,000 - £899,999 | 11 |
| £900,000 - £924,999 | 10 |
| £925,000 - £949,999 | 9 |
| £950,000 - £974,999 | 9 |
| £975,000 - £999,999 | 10 |
| £1,000,000 - £1,249,999 | 43 |
| £1,250,000 - £1,499,999 | 24 |
| £1,500,000 - £1,749,999 | 13 |
| £1,750,000 - £1,999,999 | 13 |
| £2,000,000 - £4,999,999 | 5 |
| £5,000,000 - £9,999,999 | 0 |
| greater than £10,000,000 | 0 |
Wales housing transactions
| Price band | Housing transactions |
|---|---|
| less than £25,000 | 1 |
| £25,000 - £49,999 | 21 |
| £50,000 - £74,999 | 157 |
| £75,000 - £99,999 | 557 |
| £100,000 - £124,999 | 778 |
| £125,000 - £149,999 | 1113 |
| £150,000 - £174,999 | 1014 |
| £175,000 - £199,999 | 868 |
| £200,000 - £224,999 | 665 |
| £225,000 - £249,999 | 589 |
| £250,000 - £274,999 | 484 |
| £275,000 - £299,999 | 445 |
| £300,000 - £324,999 | 315 |
| £325,000 - £349,999 | 284 |
| £350,000 - £374,999 | 225 |
| £375,000 - £399,999 | 208 |
| £400,000 - £424,999 | 113 |
| £425,000 - £449,999 | 123 |
| £450,000 - £474,999 | 94 |
| £475,000 - £499,999 | 81 |
| £500,000 - £524,999 | 64 |
| £525,000 - £549,999 | 48 |
| £550,000 - £574,999 | 48 |
| £575,000 - £599,999 | 53 |
| £600,000 - £624,999 | 29 |
| £625,000 - £649,999 | 22 |
| £650,000 - £674,999 | 20 |
| £675,000 - £699,999 | 25 |
| £700,000 - £724,999 | 9 |
| £725,000 - £749,999 | 11 |
| £750,000 - £774,999 | 14 |
| £775,000 - £799,999 | 19 |
| £800,000 - £824,999 | 9 |
| £825,000 - £849,999 | 6 |
| £850,000 - £874,999 | 6 |
| £875,000 - £899,999 | 2 |
| £900,000 - £924,999 | 3 |
| £925,000 - £949,999 | 2 |
| £950,000 - £974,999 | 3 |
| £975,000 - £999,999 | 2 |
| £1,000,000 - £1,249,999 | 9 |
| £1,250,000 - £1,499,999 | 5 |
| £1,500,000 - £1,749,999 | 2 |
| £1,750,000 - £1,999,999 | 0 |
| £2,000,000 - £4,999,999 | 0 |
| £5,000,000 - £9,999,999 | 0 |
| greater than £10,000,000 | 0 |
Northern Ireland housing transactions
| Price band | Housing transactions |
|---|---|
| less than £25,000 | 6 |
| £25,000 - £49,999 | 97 |
| £50,000 - £74,999 | 425 |
| £75,000 - £99,999 | 831 |
| £100,000 - £124,999 | 807 |
| £125,000 - £149,999 | 911 |
| £150,000 - £174,999 | 816 |
| £175,000 - £199,999 | 602 |
| £200,000 - £224,999 | 354 |
| £225,000 - £249,999 | 289 |
| £250,000 - £274,999 | 203 |
| £275,000 - £299,999 | 167 |
| £300,000 - £324,999 | 134 |
| £325,000 - £349,999 | 97 |
| £350,000 - £374,999 | 82 |
| £375,000 - £399,999 | 55 |
| £400,000 - £424,999 | 44 |
| £425,000 - £449,999 | 24 |
| £450,000 - £474,999 | 16 |
| £475,000 - £499,999 | 15 |
| greater than £500,000 | 103 |
9. Access the data
Download the data as CSV files or access it with our UK HPI tool.
Data revisions
View any revisions to previously published data in the data downloads or find out more about revisions in our guidance About the UK HPI.
10. About the UK House Price Index
The UK House Price Index (UK HPI) is calculated by the Office for National Statistics and Land & Property Services Northern Ireland. Find out about the methodology used to create the UK HPI.
Data for the UK House Price Index is provided by HM Land Registry, Registers of Scotland, The Land & Property Services/Northern Ireland Statistics & Research Agency and the Valuation Office Agency.
Find out more about the UK House Price Index.
11. Contact
Eileen Morrison, Data Services Team Leader, HM Land Registry
Email eileen.morrison@landregistry.gov.uk
Telephone 0300 006 5288
Aimee North, Head of Housing Market Indices, Office for National Statistics
Email aimee.north@ons.gov.uk
Telephone 01633 580090
Ciara Cunningham, Statistician for the Northern Ireland HPI
Email ciara.cunningham@finance-ni.gov.uk
Telephone 028 90 336035
Garreth Jones, Land & Property Data Team, Registers of Scotland
Email Garreth.Jones@ros.gov.uk
Telephone 0131 378 4114