UK House Price Index summary: November 2023
Published 17 January 2024

© Crown copyright 2024
This publication is licensed under the terms of the Open Government Licence v3.0 except where otherwise stated. To view this licence, visit nationalarchives.gov.uk/doc/open-government-licence/version/3 or write to the Information Policy Team, The National Archives, Kew, London TW9 4DU, or email: psi@nationalarchives.gov.uk.
Where we have identified any third party copyright information you will need to obtain permission from the copyright holders concerned.
This publication is available at https://www.gov.uk/government/statistics/uk-house-price-index-for-november-2023/uk-house-price-index-summary-november-2023
1. Headline statistics for November 2023
The average price of a property in the UK was £284,950
The annual price change for a property in the UK was -2.1%
The monthly price change for a property in the UK was -0.8%
The monthly index figure (January 2015 = 100) for the UK was 149.5
Estimates for the most recent months are provisional and are likely to be updated as more data is incorporated into the index. Read Revisions to the UK HPI data.
Next publication of UK HPI
The December 2023 UK HPI will be published at 9.30am on Wednesday 14 February 2023. See the calendar of release dates for more information.
2. Economic statement
Average UK house price annual inflation was negative 2.1% (provisional estimate) in the 12 months to November 2023, compared with negative 1.3% (revised estimate) in the 12 months to October 2023.
The average UK house price was £285,000 in November 2023 (provisional estimate), which is £6,000 lower than 12 months ago. Average house prices in the 12 months to November 2023 decreased in England to £302,000 (negative 2.9%), decreased in Wales to £213,000 (negative 2.4%) and increased in Scotland to £194,000 (2.2%). The average house price increased in the year to Q3 (Jul to Sep) 2023 to £180,000 in Northern Ireland (2.1%).
On a non-seasonally adjusted basis, average UK house prices decreased by 0.8% between October 2023 and November 2023, compared with no change (0.0%) during the same period 12 months ago.
Annual house price inflation was highest in the North East where prices decreased by 0.4% in the 12 months to November 2023. London was the English region with the lowest annual inflation, where prices decreased by 6.0% in the 12 months to November 2023.
The Royal Institution of Chartered Surveyors’ (RICS’) November 2023 UK Residential Market Survey reported a downturn in buyer demand. When viewed at the regional and country level, most parts of the UK continue to see negative demand readings, although Northern Ireland and the North West of England exhibit a much flatter picture compared to the average.
The Bank of England’s Agents summary of business conditions 2023 Q3 reported that higher mortgage rates had been the main factor in a further weakening of housing market activity. Demand was lower than supply for the first time in a few years and it is seen as unlikely to pick up until mortgage rates stop rising.
HMRC’s UK Property Transactions Statistics showed that in November 2023, on a seasonally adjusted basis, the estimated number of transactions of residential properties with a value of £40,000 or greater was 80,780. This is 21.5% lower than 12 months ago (November 2022). Between October 2023 and November 2023, UK transactions decreased by 1.2% on a seasonally adjusted basis.
The Bank of England’s Money and Credit November 2023 release reported that mortgage approvals for house purchases, an indicator of future borrowing, increased to 50,100 in November 2023 from 47,900 in October 2023.
3. Price changes
3.1 Annual price change
Annual price change for UK by country over the past 5 years

Download this chart’s data (CSV, 1KB)
Average house prices in the UK decreased by 2.1% (provisional estimate) in the 12 months to November 2023, down from a decrease of 1.3% (revised estimate) in October 2023.
At the country level, the highest annual house price percentage change in the 12 months to November 2023 was recorded in Scotland, where house prices increased by 2.2%.
England saw average house prices decrease by 2.9% in the 12 months to November 2023.
Wales saw average house prices decrease by 2.4% in the 12 months to November 2023.
Northern Ireland saw average house prices increase by 2.1% over the 12 months to Quarter 3 (July to September) 2023.
3.2 Average price by country and government office region
Price, monthly change and annual change by country and government office region
| Country and government office region | Price | Monthly change | Annual change |
|---|---|---|---|
| England | £301,613 | -1.2% | -2.9% |
| Northern Ireland (Quarter 3 - 2023) | £179,530 | 3.1% | 2.1% |
| Scotland | £194,006 | 1.1% | 2.2% |
| Wales | £212,866 | -0.3% | -2.4% |
| East Midlands | £243,577 | -0.8% | -3.0% |
| East of England | £346,659 | -0.2% | -3.3% |
| London | £505,283 | -2.2% | -6.0% |
| North East | £159,871 | -0.2% | -0.4% |
| North West | £213,333 | -0.9% | -2.0% |
| South East | £385,844 | -0.4% | -2.3% |
| South West | £319,221 | -2.7% | -4.1% |
| West Midlands Region | £243,655 | -3.1% | -3.4% |
| Yorkshire and The Humber | £209,526 | 0.0% | -0.8% |
Download this table’s data (CSV, 1KB)
Price changes by country and government office region
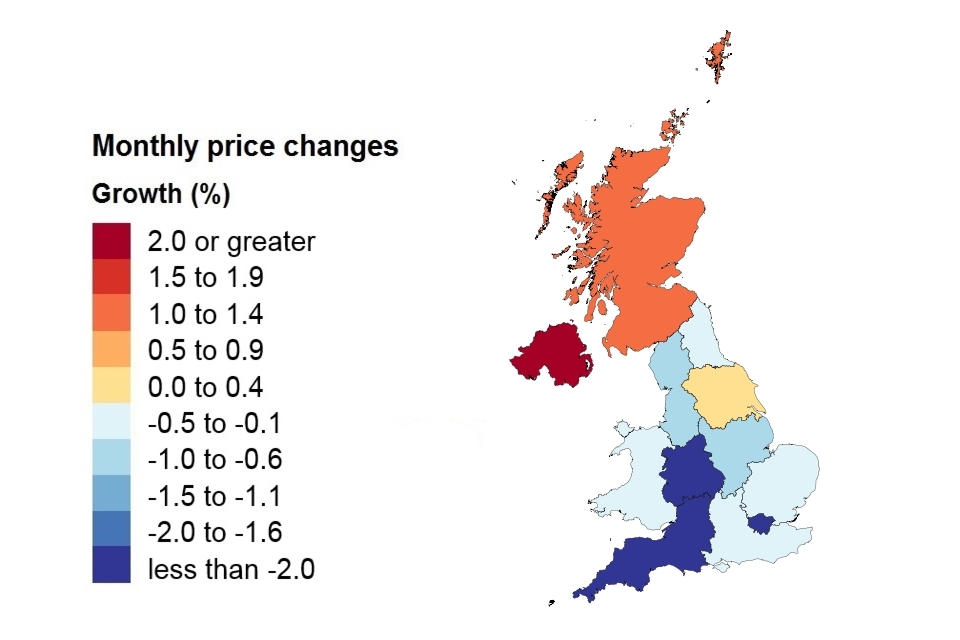
On a non-seasonally adjusted basis, average house prices in the UK decreased by 0.8% between October 2023 and November 2023, compared with no change (0.0%) during the same period 12 months ago (October 2022 and November 2022). On a seasonally adjusted basis, average house prices in the UK decreased by 0.4% between October 2023 and November 2023.
Note: The Northern Ireland figure represents a 3-month change and is not comparable with the other regions and countries.
3.3 Average price by property type
Average monthly price by property type
| Property type | November 2023 | November 2022 | Difference |
|---|---|---|---|
| Detached | £453,746 | £457,043 | -0.7% |
| Semi-detached | £276,967 | £281,749 | -1.7% |
| Terraced | £230,368 | £239,455 | -3.8% |
| Flat or maisonette | £227,718 | £231,945 | -1.8% |
| All | £284,950 | £291,092 | -2.1% |
Download this table’s data (CSV, 1KB)
4. Sales volumes
The amount of time between the sale of a property and the registration of this information varies. It typically ranges between 2 weeks and 2 months but can be longer. Volume figures for the most recent 2 months are not yet at a reliable level for reporting, so they are not included in the report. Published transactions for recent months will increase as later registered transactions are incorporated into the index.
Sales volume data is also available by property status (new build and existing property) and funding status (cash and mortgage) in our downloadable data tables. Transactions involving the creation of a new register, such as new builds, are more complex and require more time to process. Read Revisions to the UK HPI data for more information.
In recent periods, the total transaction volumes available to calculate UK HPI estimates for the latest months have been lower than historically (see UK HPI QMI Section 2.2: Accuracy). This has arisen from a combination of total transaction volumes in England and Wales falling over the past year (HMRC has reported a 22% fall in the 12 months to November 2023) and a reduction in the proportion of transactions, processed by HM Land Registry, for the first estimate. The sample for the latest estimate is about half of usual volumes. The processing of new build properties has been particularly affected.
The Office for National Statistics and HM Land Registry are working together to resolve this, including seeking a greater balance between processing recently received applications and those that are older to help preserve the quality of UK HPI statistics.
In 2020, we introduced pooling for new build transactions for certain months in England and Wales. In December 2023, we implemented a methodology improvement to the Great Britain model, which increased UK coherence and improved UK HPI statistics quality. From December 2023, HM Land Registry increased UK HPI processing, so the proportion of total transactions processed for the first estimate is expected to increase from 14 February 2024’s release.
In the meantime, users should be aware that revisions may be larger than usual and are advised to note the significantly greater uncertainty around new build prices.
4.1 Sales volumes
Number of sales volumes by country
Comparing the provisional volume estimate for the current month with the revised volume estimate for the corresponding month in the previous year
| Country | September 2023 | September 2022 |
|---|---|---|
| England | 39,498 | 69,868 |
| Northern Ireland | 1,841 | 2,191 |
| Scotland | 8,382 | 10,115 |
| Wales | 2,343 | 3,738 |
Note: Comparing the provisional volume estimate for the current month with the revised 12-month volume estimate.
Download this table’s data (CSV, 1KB)
Note: The ‘Difference’ column has been removed from this table as the latest month’s data are not yet complete.
Note: The number of property transactions for September 2023 will increase as more transactions are incorporated into the index. See our Revisions Policy for more information.
Comparing the provisional UK HPI volume estimate for September 2022 with the provisional UK HPI volume estimate for September 2023, volume transactions decreased by 26.5% in England, 15.0% in Scotland and 20.2% in Wales. Northern Ireland’s UK HPI volume transactions decreased by 13.7% in the year to Quarter 3 2023.
UK Property Transaction Statistics published by HM Revenue & Customs (which differ in coverage but are more complete for this period) report that in the 12 months to September 2023, on a non-seasonally adjusted basis, HMRC volume transactions decreased by 19.7% in England, 15.6% in Scotland, 15.6% in Wales and 16.1% in Northern Ireland.
4.2 Sales volumes for the UK over the past 5 years
Sales volumes for 2019 to 2023 by country: September

Download this table’s data (CSV, 1KB)
Note: The number of property transactions for September 2023 will increase as more transactions are incorporated into the UK HPI index. See our Revisions Policy for more information.
Comparing the provisional UK HPI volume estimate for September 2022 with the provisional UK HPI volume estimate for September 2023, UK volume transactions decreased by 24.2%.
UK Property Transaction Statistics published by HM Revenue & Customs (which differ in coverage but are more complete for this period) report that on a non-seasonally adjusted basis, HMRC volume transactions for the UK decreased by 19.1% in the 12 months to September 2023.
5. Property status for UK
Transactions involving the creation of a new register, such as new builds, are more complex and need more time to process. This means they can take longer to appear in the land registers. The volume of new build transactions for the most recent 2 months are not at a reliable level for reporting the breakdown between new build and existing resold property, so they are not included in the report.
New build and existing resold property
| Property status | Average price September 2023 | Monthly change | Annual change |
|---|---|---|---|
| New build | £396,098 | -5.1% | 8.3% |
| Existing resold property | £282,350 | -0.1% | -1.4% |
Download this table’s data (CSV, 1KB)
Note: Since the October 2017 release, amendments have been made to our estimation model when calculating our provisional estimate. Find out further information and the impact of this change in the methods used to produce the UK HPI.
6. Buyer status for Great Britain
First time buyer and former owner occupier
For Great Britain only, Northern Ireland data is not available for buyer status.
| Type of buyer | Average price November 2023 | Monthly change | Annual change |
|---|---|---|---|
| First time buyer | £236,326 | -0.9% | -2.6% |
| Former owner occupier | £334,205 | -0.8% | -1.9% |
Download this table’s data (CSV, 1KB)
7. Funding status for Great Britain
Cash and mortgage
For Great Britain only, Northern Ireland data is not available for funding status.
| Funding status | Average price November 2023 | Monthly change | Annual change |
|---|---|---|---|
| Cash | £269,762 | -0.7% | -2.3% |
| Mortgage | £296,816 | -0.9% | -2.2% |
Download this table’s data (CSV, 1KB)
8. Access the data
Download the data as CSV files or access it with our UK HPI tool.
Data revisions
View any revisions to previously published data in the data downloads or find out more about revisions in our guidance About the UK HPI.
10. About the UK House Price Index
The UK House Price Index (UK HPI) is calculated by the Office for National Statistics and Land & Property Services Northern Ireland. Find out about the methodology used to create the UK HPI.
Data for the UK House Price Index is provided by HM Land Registry, Registers of Scotland, The Land & Property Services/Northern Ireland Statistics & Research Agency and the Valuation Office Agency.
Find out more about the UK House Price Index.
A key determinant of house prices is the demographic characteristics of the area in which the property is located. The UK HPI uses the socio-demographic classification, known as Acorn, in the hedonic regression model to measure the affluence of the area.
Prior to 20 December 2023’s publication, property transactions in Great Britain were excluded from the regression model if their Acorn classification was missing. From 20 December 2023’s publication, these properties are included in the regression model from January 2023’s data onwards, but are given less weight in the calculations, as described above. This methodology improvement aligns how transactions with missing Acorn classification are used in the Great Britain model and Northern Ireland model, increasing coherence across the UK and improving the quality of UK HPI statistics.
11. Contact
Eileen Morrison, Data Services Team Leader, HM Land Registry
Email eileen.morrison@landregistry.gov.uk
Telephone 0300 006 5288
Aimee North, Head of Housing Market Indices, Office for National Statistics
Email aimee.north@ons.gov.uk
Telephone 01633 580090
Ciara Cunningham, Statistician for the Northern Ireland HPI
Email ciara.cunningham@finance-ni.gov.uk
Telephone 028 90 336035
Garreth Jones, Land & Property Data Team, Registers of Scotland
Email Garreth.Jones@ros.gov.uk
Telephone 0131 378 4114