
UK House Price Index England: May 2026
Updated 31 July 2026

© Crown copyright 2026
This publication is licensed under the terms of the Open Government Licence v3.0 except where otherwise stated. To view this licence, visit nationalarchives.gov.uk/doc/open-government-licence/version/3 or write to the Information Policy Team, The National Archives, Kew, London TW9 4DU, or email: psi@nationalarchives.gov.uk.
Where we have identified any third party copyright information you will need to obtain permission from the copyright holders concerned.
This publication is available at https://www.gov.uk/government/statistics/uk-house-price-index-for-may-2026/uk-house-price-index-england-may-2026
1. Headline statistics for May 2026
The average price of a property in England was £292,000
The annual price change of a property in England was 2.3%
The monthly price change of a property in England was 0.1%
The index figure for England (January 2023 = 100) was 102.2
Estimates for the most recent months are provisional and are likely to be updated as more data is incorporated into the index. Read the revision policies.
Next publication of UK HPI
The June 2026 UK HPI will be published at 9.30am on Wednesday 19 August 2026. See the calendar of release dates for more information.
2. Economic statement
Average house prices in England increased by 2.3% in the 12 months to May 2026, to £292,000 (provisional estimate). This was down from a rise of 4.0% (revised estimate) in the 12 months to April 2026 and above the average UK house price annual inflation of 2.7% (provisional estimate) in the 12 months to May 2026.
The slowing in the UK annual rate was driven by a base effect from the aftermath of last year’s Stamp Duty Land Tax (SDLT) changes in England and Northern Ireland on 1 April 2025, similar to SDLT effects seen previously. The annual rate slowed in May 2026 because average UK house prices rose by a smaller amount (0.3%) between April and May 2026 than in the same period a year ago (1.5%).
The North East had the highest growth, where the average house price increased by 5.9% in the 12 months to May 2026. The lowest annual percentage change was in London, where prices decreased by 3.7% in the 12 months to May 2026.
On a non-seasonally adjusted basis, average house prices in England increased by 0.1% between April 2026 and May 2026, down from an increase of 1.8% in the same period 12 months ago. On a seasonally adjusted basis, average house prices in England remained the same between April 2026 and May 2026.
In England, semi-detached houses showed the highest annual percentage change out of all property types, increasing by 4.1% in the 12 months to May 2026 to £291,000. Flats and maisonettes showed the lowest annual percentage change, decreasing by 2.2% in the 12 months to April 2026 to £217,000.
As with other indicators in the housing market, which typically fluctuate from month to month, it is important not to put too much weight on one month’s set of house price data.
3. Price change
3.1 Annual price change
Annual price change for England and London over the past 4 years

Download this chart’s data (CSV, 2KB)
Average house prices in England increased by 2.3% in the 12 months to May 2026 (provisional estimate), down from a rise of 4.0% in the 12 months to April 2026 (revised estimate).
In London, average house prices decreased by 3.7% in the 12 months to May 2026, down from a decrease of 2.3% in the 12 months to April 2026.
Annual price change by local authority for England
Low numbers of sales transactions in some local authorities and London boroughs, such as City of London, can lead to volatility in the series. While we make efforts to account for this volatility, the change in price in these local levels can be influenced by the type and number of properties sold in any given period. Geographies with low number of sales transactions should be analysed in the context of their longer-term trends rather than focusing on monthly movements.
Note: data for City of London for the months of July and August 2021 have been suppressed due to unusually low transaction numbers and the resulting impact on the quality of data.
| Local authorities | May 2026 | May 2025 | Difference |
|---|---|---|---|
| Adur | £373,082 | £370,089 | 0.8% |
| Amber Valley | £236,305 | £222,809 | 6.1% |
| Arun | £323,532 | £316,160 | 2.3% |
| Ashfield | £188,423 | £186,031 | 1.3% |
| Ashford | £344,404 | £342,095 | 0.7% |
| Babergh | £325,407 | £320,583 | 1.5% |
| Barking and Dagenham | £360,889 | £361,602 | -0.2% |
| Barnet | £590,583 | £616,939 | -4.3% |
| Barnsley | £173,077 | £166,700 | 3.8% |
| Basildon | £357,972 | £363,072 | -1.4% |
| Basingstoke and Deane | £366,291 | £377,108 | -2.9% |
| Bassetlaw | £207,844 | £201,991 | 2.9% |
| Bath and North East Somerset | £406,169 | £402,356 | 0.9% |
| Bedford | £332,893 | £311,863 | 6.7% |
| Bexley | £408,585 | £399,903 | 2.2% |
| Birmingham | £232,657 | £233,260 | -0.3% |
| Blaby | £281,459 | £282,752 | -0.5% |
| Blackburn with Darwen | £165,437 | £159,848 | 3.5% |
| Blackpool | £133,919 | £127,215 | 5.3% |
| Bolsover | £186,908 | £179,977 | 3.9% |
| Bolton | £200,126 | £193,803 | 3.3% |
| Boston | £179,027 | £175,529 | 2.0% |
| Bournemouth Christchurch and Poole | £315,473 | £318,735 | -1.0% |
| Bracknell Forest | £401,886 | £400,016 | 0.5% |
| Bradford | £187,452 | £177,551 | 5.6% |
| Braintree | £321,485 | £322,667 | -0.4% |
| Breckland | £275,544 | £267,411 | 3.0% |
| Brent | £548,895 | £567,835 | -3.3% |
| Brentwood | £530,088 | £520,390 | 1.9% |
| Brighton and Hove | £403,999 | £409,739 | -1.4% |
| Broadland | £314,426 | £292,124 | 7.6% |
| Bromley | £524,638 | £523,362 | 0.2% |
| Bromsgrove | £330,194 | £333,490 | -1.0% |
| Broxbourne | £403,029 | £405,364 | -0.6% |
| Broxtowe | £253,567 | £248,832 | 1.9% |
| Buckinghamshire | £485,824 | £472,463 | 2.8% |
| Burnley | £129,643 | £124,358 | 4.3% |
| Bury | £238,266 | £231,225 | 3.0% |
| Calderdale | £189,509 | £180,339 | 5.1% |
| Cambridge | £467,028 | £474,445 | -1.6% |
| Cambridgeshire | £334,500 | £327,745 | 2.1% |
| Camden | £805,837 | £859,265 | -6.2% |
| Cannock Chase | £226,761 | £223,896 | 1.3% |
| Canterbury | £346,674 | £329,976 | 5.1% |
| Castle Point | £367,237 | £359,436 | 2.2% |
| Central Bedfordshire | £354,320 | £347,955 | 1.8% |
| Charnwood | £278,883 | £265,448 | 5.1% |
| Chelmsford | £382,131 | £380,621 | 0.4% |
| Cheltenham | £329,183 | £317,485 | 3.7% |
| Cherwell | £357,800 | £343,419 | 4.2% |
| Cheshire East | £302,367 | £292,009 | 3.5% |
| Cheshire West and Chester | £268,449 | £253,654 | 5.8% |
| Chesterfield | £203,110 | £192,410 | 5.6% |
| Chichester | £436,312 | £440,698 | -1.0% |
| Chorley | £214,636 | £204,908 | 4.7% |
| City of Bristol | £354,924 | £347,152 | 2.2% |
| City of Derby | £205,425 | £201,406 | 2.0% |
| City of Kingston upon Hull | £133,485 | £129,061 | 3.4% |
| City of London | £626,980 | £871,875 | -28.1% |
| City of Nottingham | £190,806 | £192,121 | -0.7% |
| City of Peterborough | £235,773 | £233,441 | 1.0% |
| City of Plymouth | £219,145 | £211,316 | 3.7% |
| City of Westminster | £836,331 | £1,083,519 | -22.8% |
| Colchester | £298,257 | £299,614 | -0.5% |
| Cornwall | £279,722 | £269,049 | 4.0% |
| Cotswold | £408,433 | £393,138 | 3.9% |
| County Durham | £137,167 | £131,403 | 4.4% |
| Coventry | £220,410 | £217,563 | 1.3% |
| Crawley | £333,662 | £328,675 | 1.5% |
| Croydon | £396,760 | £398,175 | -0.4% |
| Cumberland | £173,130 | £163,032 | 6.2% |
| Dacorum | £454,770 | £454,786 | 0.0% |
| Darlington | £157,239 | £154,315 | 1.9% |
| Dartford | £337,333 | £339,912 | -0.8% |
| Derbyshire | £239,158 | £225,948 | 5.8% |
| Derbyshire Dales | £343,049 | £322,022 | 6.5% |
| Devon | £304,674 | £308,773 | -1.3% |
| Doncaster | £172,857 | £166,003 | 4.1% |
| Dorset | £326,381 | £321,826 | 1.4% |
| Dover | £271,263 | £268,597 | 1.0% |
| Dudley | £229,616 | £219,668 | 4.5% |
| Ealing | £568,887 | £583,754 | -2.5% |
| East Cambridgeshire | £347,020 | £328,595 | 5.6% |
| East Devon | £344,347 | £344,573 | -0.1% |
| East Hampshire | £440,217 | £437,305 | 0.7% |
| East Hertfordshire | £460,485 | £441,827 | 4.2% |
| East Lindsey | £212,312 | £203,311 | 4.4% |
| East Riding of Yorkshire | £220,913 | £213,801 | 3.3% |
| East Staffordshire | £224,622 | £216,388 | 3.8% |
| East Suffolk | £279,914 | £274,198 | 2.1% |
| East Sussex | £316,368 | £319,577 | -1.0% |
| Eastbourne | £250,523 | £260,534 | -3.8% |
| Eastleigh | £307,883 | £307,910 | 0.0% |
| Elmbridge | £750,157 | £751,622 | -0.2% |
| Enfield | £469,164 | £472,453 | -0.7% |
| Epping Forest | £535,682 | £506,596 | 5.7% |
| Epsom and Ewell | £568,755 | £552,777 | 2.9% |
| Erewash | £224,509 | £215,791 | 4.0% |
| Essex | £360,087 | £356,100 | 1.1% |
| Exeter | £281,197 | £287,474 | -2.2% |
| Fareham | £326,107 | £326,168 | 0.0% |
| Fenland | £225,725 | £222,146 | 1.6% |
| Folkestone and Hythe | £311,163 | £306,122 | 1.6% |
| Forest of Dean | £289,671 | £288,963 | 0.2% |
| Fylde | £228,737 | £217,382 | 5.2% |
| Gateshead | £158,765 | £149,408 | 6.3% |
| Gedling | £246,120 | £238,789 | 3.1% |
| Gloucester | £242,097 | £231,119 | 4.8% |
| Gloucestershire | £317,246 | £305,188 | 4.0% |
| Gosport | £236,660 | £234,830 | 0.8% |
| Gravesham | £341,472 | £338,508 | 0.9% |
| Great Yarmouth | £205,316 | £206,249 | -0.5% |
| Greenwich | £463,436 | £463,057 | 0.1% |
| Guildford | £522,008 | £552,948 | -5.6% |
| Hackney | £608,470 | £607,897 | 0.1% |
| Halton | £195,813 | £183,653 | 6.6% |
| Hammersmith and Fulham | £729,407 | £818,323 | -10.9% |
| Hampshire | £362,998 | £360,264 | 0.8% |
| Harborough | £346,278 | £323,205 | 7.1% |
| Haringey | £633,853 | £619,051 | 2.4% |
| Harlow | £313,497 | £307,896 | 1.8% |
| Harrow | £530,021 | £528,124 | 0.4% |
| Hart | £486,882 | £471,512 | 3.3% |
| Hartlepool | £131,342 | £127,786 | 2.8% |
| Hastings | £236,879 | £245,975 | -3.7% |
| Havant | £315,078 | £306,467 | 2.8% |
| Havering | £452,798 | £440,384 | 2.8% |
| Herefordshire | £286,995 | £274,093 | 4.7% |
| Hertfordshire | £467,251 | £455,864 | 2.5% |
| Hertsmere | £562,261 | £547,105 | 2.8% |
| High Peak | £254,489 | £244,672 | 4.0% |
| Hillingdon | £467,887 | £471,081 | -0.7% |
| Hinckley and Bosworth | £260,282 | £255,246 | 2.0% |
| Horsham | £440,863 | £435,292 | 1.3% |
| Hounslow | £501,326 | £513,864 | -2.4% |
| Huntingdonshire | £306,605 | £294,636 | 4.1% |
| Hyndburn | £138,477 | £127,489 | 8.6% |
| Ipswich | £219,718 | £223,824 | -1.8% |
| Isle of Wight | £238,456 | £241,759 | -1.4% |
| Islington | £669,879 | £715,858 | -6.4% |
| Kensington and Chelsea | £1,255,567 | £1,405,728 | -10.7% |
| Kent | £345,918 | £340,546 | 1.6% |
| King’s Lynn and West Norfolk | £262,525 | £255,489 | 2.8% |
| Kingston upon Thames | £582,403 | £582,633 | 0.0% |
| Kirklees | £205,971 | £197,852 | 4.1% |
| Knowsley | £188,727 | £183,176 | 3.0% |
| Lambeth | £545,315 | £561,431 | -2.9% |
| Lancashire | £189,240 | £181,569 | 4.2% |
| Lancaster | £193,434 | £191,793 | 0.9% |
| Leeds | £246,699 | £238,002 | 3.7% |
| Leicester | £230,107 | £225,605 | 2.0% |
| Leicestershire | £285,663 | £275,952 | 3.5% |
| Lewes | £370,799 | £361,694 | 2.5% |
| Lewisham | £496,774 | £485,831 | 2.3% |
| Lichfield | £337,175 | £322,630 | 4.5% |
| Lincoln | £186,722 | £186,037 | 0.4% |
| Lincolnshire | £218,313 | £211,732 | 3.1% |
| Liverpool | £184,670 | £176,211 | 4.8% |
| Luton | £282,653 | £284,704 | -0.7% |
| Maidstone | £352,309 | £350,737 | 0.4% |
| Maldon | £385,342 | £379,657 | 1.5% |
| Malvern Hills | £337,558 | £324,859 | 3.9% |
| Manchester | £247,469 | £246,330 | 0.5% |
| Mansfield | £188,718 | £189,779 | -0.6% |
| Medway | £292,653 | £293,955 | -0.4% |
| Melton | £288,513 | £285,822 | 0.9% |
| Merton | £597,138 | £604,982 | -1.3% |
| Mid Devon | £285,941 | £291,105 | -1.8% |
| Mid Suffolk | £318,641 | £305,775 | 4.2% |
| Mid Sussex | £430,711 | £429,061 | 0.4% |
| Middlesbrough | £138,122 | £136,215 | 1.4% |
| Milton Keynes | £324,767 | £326,925 | -0.7% |
| Mole Valley | £540,643 | £536,800 | 0.7% |
| New Forest | £375,728 | £373,444 | 0.6% |
| Newark and Sherwood | £234,266 | £222,422 | 5.3% |
| Newcastle upon Tyne | £207,029 | £199,719 | 3.7% |
| Newcastle-under-Lyme | £201,524 | £195,488 | 3.1% |
| Newham | £405,002 | £410,605 | -1.4% |
| Norfolk | £271,947 | £263,804 | 3.1% |
| North Devon | £277,867 | £276,218 | 0.6% |
| North East Derbyshire | £254,787 | £230,447 | 10.6% |
| North East Lincolnshire | £148,294 | £144,950 | 2.3% |
| North Hertfordshire | £416,735 | £401,967 | 3.7% |
| North Kesteven | £241,121 | £236,394 | 2.0% |
| North Lincolnshire | £181,761 | £171,289 | 6.1% |
| North Norfolk | £293,640 | £295,684 | -0.7% |
| North Northamptonshire | £256,769 | £248,641 | 3.3% |
| North Somerset | £312,303 | £293,513 | 6.4% |
| North Tyneside | £200,392 | £193,134 | 3.8% |
| North Warwickshire | £265,742 | £261,241 | 1.7% |
| North West Leicestershire | £286,826 | £270,695 | 6.0% |
| North Yorkshire | £270,320 | £263,374 | 2.6% |
| Northumberland | £209,135 | £193,095 | 8.3% |
| Norwich | £237,629 | £224,512 | 5.8% |
| Nottinghamshire | £231,438 | £225,557 | 2.6% |
| Nuneaton and Bedworth | £226,538 | £222,026 | 2.0% |
| Oadby and Wigston | £263,380 | £265,825 | -0.9% |
| Oldham | £212,997 | £206,737 | 3.0% |
| Oxford | £473,467 | £463,356 | 2.2% |
| Oxfordshire | £418,038 | £407,298 | 2.6% |
| Pendle | £151,427 | £139,856 | 8.3% |
| Portsmouth | £252,325 | £252,973 | -0.3% |
| Preston | £186,418 | £168,388 | 10.7% |
| Reading | £351,267 | £359,797 | -2.4% |
| Redbridge | £495,947 | £484,110 | 2.4% |
| Redcar and Cleveland | £154,696 | £142,263 | 8.7% |
| Redditch | £243,585 | £243,589 | 0.0% |
| Reigate and Banstead | £483,340 | £475,161 | 1.7% |
| Ribble Valley | £283,325 | £278,198 | 1.8% |
| Richmond upon Thames | £788,872 | £808,949 | -2.5% |
| Rochdale | £208,286 | £199,748 | 4.3% |
| Rochford | £411,367 | £389,639 | 5.6% |
| Rossendale | £189,243 | £188,688 | 0.3% |
| Rother | £343,529 | £342,088 | 0.4% |
| Rotherham | £192,309 | £186,960 | 2.9% |
| Rugby | £274,942 | £274,279 | 0.2% |
| Runnymede | £482,170 | £472,628 | 2.0% |
| Rushcliffe | £338,301 | £326,840 | 3.5% |
| Rushmoor | £330,954 | £324,764 | 1.9% |
| Rutland | £295,693 | £308,872 | -4.3% |
| Salford | £231,153 | £246,247 | -6.1% |
| Sandwell | £209,354 | £203,506 | 2.9% |
| Sefton | £222,406 | £214,882 | 3.5% |
| Sevenoaks | £553,752 | £532,800 | 3.9% |
| Sheffield | £220,804 | £213,279 | 3.5% |
| Shropshire | £280,739 | £272,237 | 3.1% |
| Slough | £329,713 | £344,784 | -4.4% |
| Solihull | £336,572 | £323,606 | 4.0% |
| Somerset | £280,768 | £272,715 | 3.0% |
| South Cambridgeshire | £422,363 | £420,731 | 0.4% |
| South Derbyshire | £261,231 | £246,752 | 5.9% |
| South Gloucestershire | £340,401 | £333,239 | 2.1% |
| South Hams | £363,603 | £388,813 | -6.5% |
| South Holland | £231,156 | £217,547 | 6.3% |
| South Kesteven | £254,647 | £251,422 | 1.3% |
| South Norfolk | £314,302 | £309,055 | 1.7% |
| South Oxfordshire | £470,720 | £451,392 | 4.3% |
| South Ribble | £211,406 | £204,506 | 3.4% |
| South Staffordshire | £309,923 | £297,550 | 4.2% |
| South Tyneside | £159,318 | £153,515 | 3.8% |
| Southampton | £235,757 | £237,436 | -0.7% |
| Southend-on-Sea | £328,939 | £315,666 | 4.2% |
| Southwark | £578,683 | £573,553 | 0.9% |
| Spelthorne | £429,916 | £445,375 | -3.5% |
| St Albans | £638,489 | £619,609 | 3.0% |
| St Helens | £182,923 | £168,077 | 8.8% |
| Stafford | £263,494 | £251,629 | 4.7% |
| Staffordshire | £249,109 | £239,192 | 4.1% |
| Staffordshire Moorlands | £226,249 | £210,880 | 7.3% |
| Stevenage | £317,948 | £304,843 | 4.3% |
| Stockport | £318,163 | £301,875 | 5.4% |
| Stockton-on-Tees | £169,010 | £164,731 | 2.6% |
| Stoke-on-Trent | £151,355 | £144,143 | 5.0% |
| Stratford-on-Avon | £392,880 | £382,014 | 2.8% |
| Stroud | £348,815 | £335,638 | 3.9% |
| Suffolk | £282,134 | £277,158 | 1.8% |
| Sunderland | £145,921 | £136,492 | 6.9% |
| Surrey | £521,400 | £521,741 | -0.1% |
| Surrey Heath | £457,454 | £431,680 | 6.0% |
| Sutton | £445,451 | £441,535 | 0.9% |
| Swale | £294,113 | £283,618 | 3.7% |
| Swindon | £261,170 | £254,526 | 2.6% |
| Tameside | £209,691 | £204,997 | 2.3% |
| Tamworth | £231,488 | £224,173 | 3.3% |
| Tandridge | £476,832 | £501,302 | -4.9% |
| Teignbridge | £302,202 | £306,105 | -1.3% |
| Telford and Wrekin | £216,685 | £217,370 | -0.3% |
| Tendring | £259,697 | £258,541 | 0.4% |
| Test Valley | £370,329 | £368,464 | 0.5% |
| Tewkesbury | £327,410 | £308,870 | 6.0% |
| Thanet | £267,616 | £269,188 | -0.6% |
| Three Rivers | £576,942 | £584,163 | -1.2% |
| Thurrock | £327,028 | £319,684 | 2.3% |
| Tonbridge and Malling | £403,227 | £396,950 | 1.6% |
| Torbay | £222,289 | £227,570 | -2.3% |
| Torridge | £257,052 | £257,208 | -0.1% |
| Tower Hamlets | £444,332 | £519,727 | -14.5% |
| Trafford | £393,244 | £370,164 | 6.2% |
| Tunbridge Wells | £452,286 | £452,437 | 0.0% |
| Uttlesford | £480,733 | £474,775 | 1.3% |
| Vale of White Horse | £407,966 | £393,812 | 3.6% |
| Wakefield | £197,140 | £191,933 | 2.7% |
| Walsall | £214,032 | £210,681 | 1.6% |
| Waltham Forest | £524,337 | £508,785 | 3.1% |
| Wandsworth | £659,547 | £702,271 | -6.1% |
| Warrington | £253,937 | £243,549 | 4.3% |
| Warwick | £366,942 | £354,973 | 3.4% |
| Warwickshire | £305,609 | £298,922 | 2.2% |
| Watford | £395,360 | £386,834 | 2.2% |
| Waverley | £567,214 | £555,417 | 2.1% |
| Wealden | £388,501 | £392,297 | -1.0% |
| Welwyn Hatfield | £453,552 | £426,935 | 6.2% |
| West Berkshire | £400,698 | £399,752 | 0.2% |
| West Devon | £294,782 | £288,322 | 2.2% |
| West Lancashire | £229,547 | £224,850 | 2.1% |
| West Lindsey | £207,424 | £195,335 | 6.2% |
| West Northamptonshire | £292,495 | £287,415 | 1.8% |
| West Oxfordshire | £417,246 | £427,589 | -2.4% |
| West Suffolk | £297,440 | £290,714 | 2.3% |
| West Sussex | £374,551 | £373,280 | 0.3% |
| Westmorland and Furness | £227,987 | £213,463 | 6.8% |
| Wigan | £194,494 | £184,512 | 5.4% |
| Wiltshire | £327,384 | £322,329 | 1.6% |
| Winchester | £476,639 | £462,099 | 3.1% |
| Windsor and Maidenhead | £584,743 | £583,785 | 0.2% |
| Wirral | £217,407 | £204,062 | 6.5% |
| Woking | £441,435 | £439,769 | 0.4% |
| Wokingham | £495,261 | £510,333 | -3.0% |
| Wolverhampton | £216,339 | £200,401 | 8.0% |
| Worcester | £251,703 | £246,433 | 2.1% |
| Worcestershire | £285,239 | £279,336 | 2.1% |
| Worthing | £299,298 | £310,849 | -3.7% |
| Wychavon | £321,348 | £310,522 | 3.5% |
| Wyre | £188,175 | £186,594 | 0.8% |
| Wyre Forest | £234,413 | £226,586 | 3.5% |
| York | £308,786 | £298,816 | 3.3% |
| England | £292,095 | £285,526 | 2.3% |
Download this table’s data (CSV, 11KB)
Average price by local authority for England
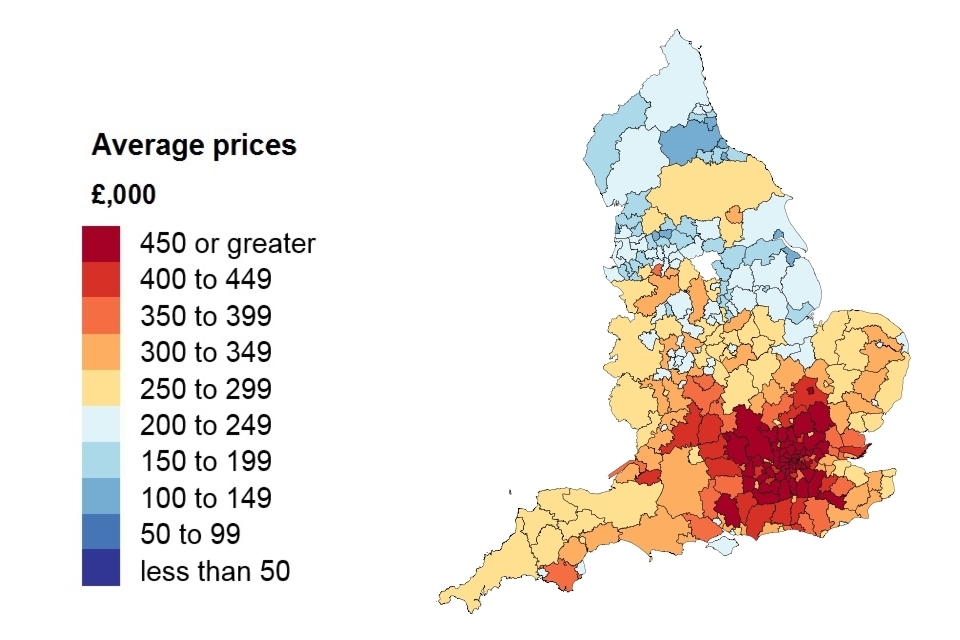
In May 2026, the most expensive area in England to purchase a property was Kensington and Chelsea, where the average cost was £1.3 million. In contrast, the cheapest area to purchase a property was Burnley, where the average cost was £130,000.
3.2 Annual price change by London borough
| London borough | May 2026 | May 2025 | Difference |
|---|---|---|---|
| Barking and Dagenham | £360,889 | £361,602 | -0.2% |
| Barnet | £590,583 | £616,939 | -4.3% |
| Bexley | £408,585 | £399,903 | 2.2% |
| Brent | £548,895 | £567,835 | -3.3% |
| Bromley | £524,638 | £523,362 | 0.2% |
| Camden | £805,837 | £859,265 | -6.2% |
| City of London | £626,980 | £871,875 | -28.1% |
| City of Westminster | £836,331 | £1,083,519 | -22.8% |
| Croydon | £396,760 | £398,175 | -0.4% |
| Ealing | £568,887 | £583,754 | -2.5% |
| Enfield | £469,164 | £472,453 | -0.7% |
| Greenwich | £463,436 | £463,057 | 0.1% |
| Hackney | £608,470 | £607,897 | 0.1% |
| Hammersmith and Fulham | £729,407 | £818,323 | -10.9% |
| Haringey | £633,853 | £619,051 | 2.4% |
| Harrow | £530,021 | £528,124 | 0.4% |
| Havering | £452,798 | £440,384 | 2.8% |
| Hillingdon | £467,887 | £471,081 | -0.7% |
| Hounslow | £501,326 | £513,864 | -2.4% |
| Islington | £669,879 | £715,858 | -6.4% |
| Kensington and Chelsea | £1,255,567 | £1,405,728 | -10.7% |
| Kingston upon Thames | £582,403 | £582,633 | 0.0% |
| Lambeth | £545,315 | £561,431 | -2.9% |
| Lewisham | £496,774 | £485,831 | 2.3% |
| Merton | £597,138 | £604,982 | -1.3% |
| Newham | £405,002 | £410,605 | -1.4% |
| Redbridge | £495,947 | £484,110 | 2.4% |
| Richmond upon Thames | £788,872 | £808,949 | -2.5% |
| Southwark | £578,683 | £573,553 | 0.9% |
| Sutton | £445,451 | £441,535 | 0.9% |
| Tower Hamlets | £444,332 | £519,727 | -14.5% |
| Waltham Forest | £524,337 | £508,785 | 3.1% |
| Wandsworth | £659,547 | £702,271 | -6.1% |
Download this table’s data (CSV, 2KB)
Average price by London borough
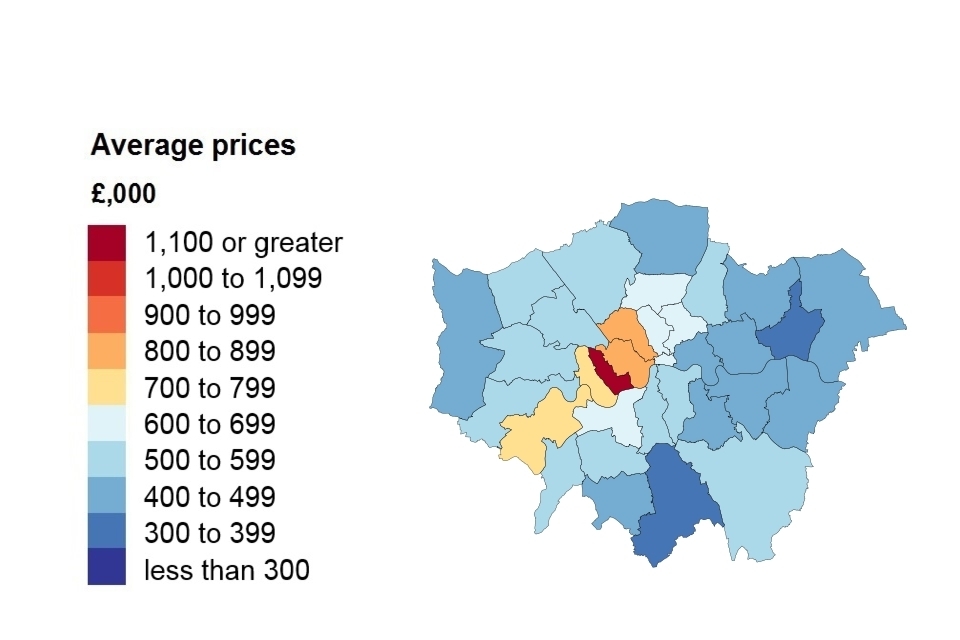
In May 2026, the most expensive London borough to purchase a property was Kensington and Chelsea, where the average cost was £1.3 million. In contrast, the cheapest borough to purchase a property was Barking and Dagenham, where the average cost was £361,000.
3.3 Average price change by property type
Average price change by property type for England
| Property type | May 2026 | May 2025 | Difference |
|---|---|---|---|
| Detached | £473,921 | £462,334 | 2.5% |
| Semi-detached | £290,791 | £279,341 | 4.1% |
| Terraced | £244,279 | £236,783 | 3.2% |
| Flat or maisonette | £217,421 | £222,264 | -2.2% |
| All | £292,095 | £285,526 | 2.3% |
Download this table’s data (CSV, 1KB)
4. Sales volumes
The amount of time between the sale of a property and the registration of this information varies. It typically ranges between 2 weeks and 2 months but can be longer. Volume figures for the most recent 2 months are not yet at a reliable level for reporting, so they are not included in the report. Published transactions for recent months will increase as later registered transactions are incorporated into the index.
Sales volume data is also available by property status (new build and existing property) and funding status (cash and mortgage) in our downloadable data tables. Transactions involving the creation of a new register, such as new builds, are more complex and require more time to process. Read Revisions to the UK HPI data for more information.
4.1 Sales volumes by local authority
Sales volumes for England by local authority
Comparing the provisional volume estimate for the current month with the revised volume estimate for the corresponding month in the previous year.
| Local authorities | March 2026 | March 2025 |
|---|---|---|
| Adur | 42 | 162 |
| Amber Valley | 121 | 345 |
| Arun | 169 | 507 |
| Ashfield | 79 | 271 |
| Ashford | 135 | 261 |
| Babergh | 83 | 272 |
| Barking and Dagenham | 71 | 254 |
| Barnet | 172 | 759 |
| Barnsley | 186 | 523 |
| Basildon | 166 | 476 |
| Basingstoke and Deane | 163 | 449 |
| Bassetlaw | 105 | 314 |
| Bath and North East Somerset | 159 | 498 |
| Bedford | 121 | 394 |
| Bexley | 161 | 544 |
| Birmingham | 535 | 1,582 |
| Blaby | 79 | 246 |
| Blackburn with Darwen | 97 | 285 |
| Blackpool | 113 | 234 |
| Bolsover | 73 | 179 |
| Bolton | 188 | 461 |
| Boston | 42 | 140 |
| Bournemouth Christchurch and Poole | 332 | 967 |
| Bracknell Forest | 93 | 319 |
| Bradford | 412 | 906 |
| Braintree | 135 | 408 |
| Breckland | 144 | 332 |
| Brent | 85 | 386 |
| Brentwood | 70 | 272 |
| Brighton and Hove | 192 | 700 |
| Broadland | 131 | 382 |
| Bromley | 252 | 840 |
| Bromsgrove | 73 | 260 |
| Broxbourne | 62 | 222 |
| Broxtowe | 90 | 265 |
| Buckinghamshire | 416 | 1,435 |
| Burnley | 81 | 185 |
| Bury | 154 | 382 |
| Calderdale | 199 | 401 |
| Cambridge | 61 | 220 |
| Cambridgeshire | 491 | 1,602 |
| Camden | 86 | 387 |
| Cannock Chase | 71 | 240 |
| Canterbury | 138 | 406 |
| Castle Point | 79 | 225 |
| Central Bedfordshire | 244 | 860 |
| Charnwood | 139 | 432 |
| Chelmsford | 154 | 450 |
| Cheltenham | 84 | 334 |
| Cherwell | 132 | 383 |
| Cheshire East | 381 | 1,114 |
| Cheshire West and Chester | 306 | 805 |
| Chesterfield | 76 | 223 |
| Chichester | 76 | 285 |
| Chorley | 100 | 265 |
| City of Bristol | 393 | 1,107 |
| City of Derby | 204 | 495 |
| City of Kingston upon Hull | 177 | 389 |
| City of London | 4 | 30 |
| City of Nottingham | 173 | 418 |
| City of Peterborough | 125 | 379 |
| City of Plymouth | 290 | 541 |
| City of Westminster | 95 | 363 |
| Colchester | 167 | 495 |
| Cornwall | 562 | 1,352 |
| Cotswold | 65 | 219 |
| County Durham | 447 | 992 |
| Coventry | 173 | 561 |
| Crawley | 64 | 196 |
| Croydon | 223 | 760 |
| Cumberland | 271 | 601 |
| Dacorum | 118 | 331 |
| Darlington | 101 | 251 |
| Dartford | 90 | 301 |
| Derbyshire | 701 | 1,932 |
| Derbyshire Dales | 49 | 185 |
| Devon | 744 | 1,969 |
| Doncaster | 249 | 579 |
| Dorset | 354 | 1,146 |
| Dover | 84 | 287 |
| Dudley | 219 | 588 |
| Ealing | 134 | 537 |
| East Cambridgeshire | 73 | 228 |
| East Devon | 148 | 381 |
| East Hampshire | 106 | 276 |
| East Hertfordshire | 139 | 428 |
| East Lindsey | 130 | 359 |
| East Riding of Yorkshire | 326 | 846 |
| East Staffordshire | 115 | 261 |
| East Suffolk | 263 | 575 |
| East Sussex | 508 | 1,430 |
| Eastbourne | 85 | 243 |
| Eastleigh | 140 | 349 |
| Elmbridge | 86 | 393 |
| Enfield | 105 | 508 |
| Epping Forest | 84 | 364 |
| Epsom and Ewell | 60 | 222 |
| Erewash | 81 | 232 |
| Essex | 1,257 | 4,140 |
| Exeter | 105 | 288 |
| Fareham | 104 | 324 |
| Fenland | 98 | 230 |
| Folkestone and Hythe | 94 | 335 |
| Forest of Dean | 61 | 196 |
| Fylde | 83 | 211 |
| Gateshead | 137 | 336 |
| Gedling | 70 | 297 |
| Gloucester | 112 | 291 |
| Gloucestershire | 530 | 1,654 |
| Gosport | 87 | 189 |
| Gravesham | 65 | 222 |
| Great Yarmouth | 83 | 223 |
| Greenwich | 144 | 560 |
| Guildford | 129 | 342 |
| Hackney | 95 | 482 |
| Halton | 62 | 223 |
| Hammersmith and Fulham | 91 | 476 |
| Hampshire | 1,215 | 3,364 |
| Harborough | 103 | 285 |
| Haringey | 112 | 503 |
| Harlow | 67 | 201 |
| Harrow | 105 | 357 |
| Hart | 93 | 284 |
| Hartlepool | 73 | 186 |
| Hastings | 76 | 193 |
| Havant | 85 | 262 |
| Havering | 191 | 631 |
| Herefordshire | 144 | 392 |
| Hertfordshire | 889 | 2,879 |
| Hertsmere | 86 | 229 |
| High Peak | 81 | 227 |
| Hillingdon | 135 | 549 |
| Hinckley and Bosworth | 103 | 311 |
| Horsham | 138 | 392 |
| Hounslow | 131 | 460 |
| Huntingdonshire | 157 | 491 |
| Hyndburn | 71 | 141 |
| Ipswich | 98 | 233 |
| Isle of Wight | 167 | 325 |
| Islington | 98 | 408 |
| Kensington and Chelsea | 64 | 284 |
| Kent | 1,284 | 3,916 |
| King’s Lynn and West Norfolk | 127 | 357 |
| Kingston upon Thames | 96 | 367 |
| Kirklees | 320 | 788 |
| Knowsley | 66 | 257 |
| Lambeth | 167 | 794 |
| Lancashire | 1,049 | 2,707 |
| Lancaster | 113 | 268 |
| Leeds | 571 | 1,471 |
| Leicester | 153 | 323 |
| Leicestershire | 597 | 1,837 |
| Lewes | 110 | 281 |
| Lewisham | 185 | 638 |
| Lichfield | 89 | 271 |
| Lincoln | 71 | 184 |
| Lincolnshire | 663 | 1,888 |
| Liverpool | 288 | 698 |
| Luton | 99 | 250 |
| Maidstone | 137 | 377 |
| Maldon | 69 | 216 |
| Malvern Hills | 53 | 223 |
| Manchester | 289 | 731 |
| Mansfield | 65 | 210 |
| Medway | 204 | 567 |
| Melton | 52 | 167 |
| Merton | 88 | 470 |
| Mid Devon | 82 | 183 |
| Mid Suffolk | 101 | 303 |
| Mid Sussex | 127 | 441 |
| Middlesbrough | 80 | 223 |
| Milton Keynes | 222 | 551 |
| Mole Valley | 65 | 213 |
| New Forest | 155 | 434 |
| Newark and Sherwood | 111 | 283 |
| Newcastle upon Tyne | 175 | 520 |
| Newcastle-under-Lyme | 72 | 231 |
| Newham | 101 | 401 |
| Norfolk | 851 | 2,237 |
| North Devon | 89 | 231 |
| North East Derbyshire | 91 | 261 |
| North East Lincolnshire | 138 | 296 |
| North Hertfordshire | 94 | 388 |
| North Kesteven | 123 | 328 |
| North Lincolnshire | 152 | 337 |
| North Norfolk | 117 | 251 |
| North Northamptonshire | 302 | 835 |
| North Somerset | 237 | 633 |
| North Tyneside | 145 | 441 |
| North Warwickshire | 59 | 165 |
| North West Leicestershire | 95 | 284 |
| North Yorkshire | 635 | 1,517 |
| Northumberland | 269 | 782 |
| Norwich | 117 | 312 |
| Nottinghamshire | 618 | 1,975 |
| Nuneaton and Bedworth | 94 | 348 |
| Oadby and Wigston | 26 | 112 |
| Oldham | 143 | 363 |
| Oxford | 73 | 215 |
| Oxfordshire | 515 | 1,626 |
| Pendle | 89 | 175 |
| Portsmouth | 127 | 373 |
| Preston | 137 | 311 |
| Reading | 118 | 335 |
| Redbridge | 146 | 439 |
| Redcar and Cleveland | 112 | 250 |
| Redditch | 47 | 183 |
| Reigate and Banstead | 121 | 427 |
| Ribble Valley | 62 | 164 |
| Richmond upon Thames | 112 | 440 |
| Rochdale | 159 | 391 |
| Rochford | 55 | 273 |
| Rossendale | 65 | 161 |
| Rother | 97 | 240 |
| Rotherham | 179 | 481 |
| Rugby | 102 | 337 |
| Runnymede | 76 | 193 |
| Rushcliffe | 98 | 335 |
| Rushmoor | 59 | 206 |
| Rutland | 36 | 90 |
| Salford | 192 | 738 |
| Sandwell | 166 | 382 |
| Sefton | 243 | 562 |
| Sevenoaks | 77 | 312 |
| Sheffield | 395 | 901 |
| Shropshire | 260 | 706 |
| Slough | 52 | 211 |
| Solihull | 197 | 444 |
| Somerset | 513 | 1,388 |
| South Cambridgeshire | 102 | 433 |
| South Derbyshire | 129 | 280 |
| South Gloucestershire | 250 | 696 |
| South Hams | 74 | 277 |
| South Holland | 88 | 239 |
| South Kesteven | 129 | 361 |
| South Norfolk | 132 | 380 |
| South Oxfordshire | 107 | 372 |
| South Ribble | 82 | 290 |
| South Staffordshire | 85 | 217 |
| South Tyneside | 102 | 242 |
| Southampton | 176 | 399 |
| Southend-on-Sea | 163 | 446 |
| Southwark | 126 | 610 |
| Spelthorne | 74 | 253 |
| St Albans | 117 | 422 |
| St Helens | 160 | 317 |
| Stafford | 142 | 330 |
| Staffordshire | 704 | 1,920 |
| Staffordshire Moorlands | 62 | 203 |
| Stevenage | 53 | 184 |
| Stockport | 240 | 712 |
| Stockton-on-Tees | 151 | 380 |
| Stoke-on-Trent | 160 | 352 |
| Stratford-on-Avon | 137 | 413 |
| Stroud | 119 | 344 |
| Suffolk | 719 | 1,762 |
| Sunderland | 188 | 405 |
| Surrey | 948 | 3,075 |
| Surrey Heath | 97 | 231 |
| Sutton | 121 | 485 |
| Swale | 146 | 395 |
| Swindon | 188 | 549 |
| Tameside | 140 | 460 |
| Tamworth | 68 | 167 |
| Tandridge | 74 | 207 |
| Teignbridge | 141 | 297 |
| Telford and Wrekin | 114 | 371 |
| Tendring | 149 | 480 |
| Test Valley | 117 | 283 |
| Tewkesbury | 89 | 270 |
| Thanet | 114 | 345 |
| Three Rivers | 74 | 219 |
| Thurrock | 123 | 395 |
| Tonbridge and Malling | 111 | 371 |
| Torbay | 110 | 320 |
| Torridge | 45 | 186 |
| Tower Hamlets | 154 | 563 |
| Trafford | 168 | 510 |
| Tunbridge Wells | 93 | 304 |
| Uttlesford | 62 | 280 |
| Vale of White Horse | 112 | 377 |
| Wakefield | 245 | 648 |
| Walsall | 163 | 458 |
| Waltham Forest | 123 | 603 |
| Wandsworth | 226 | 924 |
| Warrington | 174 | 491 |
| Warwick | 142 | 416 |
| Warwickshire | 534 | 1,679 |
| Watford | 61 | 206 |
| Waverley | 93 | 334 |
| Wealden | 140 | 473 |
| Welwyn Hatfield | 85 | 250 |
| West Berkshire | 119 | 390 |
| West Devon | 60 | 126 |
| West Lancashire | 79 | 234 |
| West Lindsey | 80 | 277 |
| West Northamptonshire | 340 | 961 |
| West Oxfordshire | 91 | 279 |
| West Suffolk | 174 | 379 |
| West Sussex | 683 | 2,302 |
| Westmorland and Furness | 245 | 551 |
| Wigan | 258 | 679 |
| Wiltshire | 428 | 1,154 |
| Winchester | 106 | 308 |
| Windsor and Maidenhead | 101 | 372 |
| Wirral | 271 | 634 |
| Woking | 73 | 260 |
| Wokingham | 114 | 439 |
| Wolverhampton | 143 | 319 |
| Worcester | 84 | 251 |
| Worcestershire | 463 | 1,514 |
| Worthing | 67 | 319 |
| Wychavon | 116 | 327 |
| Wyre | 87 | 302 |
| Wyre Forest | 90 | 270 |
| York | 146 | 450 |
| England | 41,354 | 120,728 |
Note: The ‘Difference’ column has been removed from this table as the latest month’s data are not yet complete.
Note: The number of property transactions for March 2026 will increase as more transactions are incorporated into the index. See our Revisions Policy for more information.
Comparing provisional UK HPI volume estimates for March 2025 with the provisional UK HPI volume estimate for March 2026, volume transactions decreased by 42.6% in England.
UK Property Transaction Statistics published by HM Revenue & Customs (which differ in coverage but are more complete for this period) report that in the 12 months to March 2026, on a non-seasonally adjusted basis, HMRC volume transactions decreased by 41.6% in England.
4.2 Sales volumes by London borough
| London borough | March 2026 | March 2025 |
|---|---|---|
| Barking and Dagenham | 71 | 254 |
| Barnet | 172 | 759 |
| Bexley | 161 | 544 |
| Brent | 85 | 386 |
| Bromley | 252 | 840 |
| Camden | 86 | 387 |
| City of London | 4 | 30 |
| City of Westminster | 95 | 363 |
| Croydon | 223 | 760 |
| Ealing | 134 | 537 |
| Enfield | 105 | 508 |
| Greenwich | 144 | 560 |
| Hackney | 95 | 482 |
| Hammersmith and Fulham | 91 | 476 |
| Haringey | 112 | 503 |
| Harrow | 105 | 357 |
| Havering | 191 | 631 |
| Hillingdon | 135 | 549 |
| Hounslow | 131 | 460 |
| Islington | 98 | 408 |
| Kensington and Chelsea | 64 | 284 |
| Kingston upon Thames | 96 | 367 |
| Lambeth | 167 | 794 |
| Lewisham | 185 | 638 |
| Merton | 88 | 470 |
| Newham | 101 | 401 |
| Redbridge | 146 | 439 |
| Richmond upon Thames | 112 | 440 |
| Southwark | 126 | 610 |
| Sutton | 121 | 485 |
| Tower Hamlets | 154 | 563 |
| Waltham Forest | 123 | 603 |
| Wandsworth | 226 | 924 |
Note: The ‘Difference’ column has been removed from this table as the latest month’s data are not yet complete.
Note: The number of property transactions for March 2026 will increase as more transactions are incorporated into the UK HPI index. See our Revisions Policy for more information.
Comparing the provisional UK HPI volume estimate for March 2025 with the provisional UK HPI volume estimate for February 2026, UK volume transactions decreased by 36.7%.
UK Property Transaction Statistics published by HM Revenue & Customs (which differ in coverage but are more complete for this period) report that on a seasonally adjusted basis UK decreased by 40.6% in the 12 months to March 2026.
4.3 Sales volumes for England
Sales volumes for England over the past five years
| Date | Sales volumes for England |
|---|---|
| March 2022 | 75,440 |
| March 2023 | 57,529 |
| March 2024 | 54,167 |
| March 2025 | 120,728 |
| March 2026 | 41,354 |
Download this chart’s data (CSV, 1KB)
4.4 Sales volumes for London
Sales volumes for London over the past 5 years
| Date | Sales volumes for London |
|---|---|
| March 2022 | 8,630 |
| March 2023 | 6,571 |
| March 2024 | 5,952 |
| March 2025 | 16,812 |
| March 2026 | 4,199 |
Download this chart’s data (CSV, 1KB)
5. Property status
Transactions involving the creation of a new register, such as new builds, are more complex and need more time to process. This means they can take longer to appear in the land registers. The volume of new build transactions for the most recent 2 months are not at a reliable level for reporting the breakdown between new build and existing resold property, so they are not included in the report.
New build and existing resold property for England by region
| Region | Average new build March 2026 | Average existing March 2026 | New build monthly change | Existing monthly change | New build annual change | Existing annual change |
|---|---|---|---|---|---|---|
| London | £504,870 | £545,689 | 3.5% | 0.1% | -1.5% | -1.8% |
| North East | £300,064 | £157,746 | 2.6% | -0.6% | 5.3% | -1.1% |
| East Midlands | £369,190 | £236,312 | 3.3% | 0.4% | 6.4% | 0.2% |
| East of England | £451,523 | £331,567 | 2.2% | -0.4% | 5.5% | -0.4% |
| North West | £289,739 | £212,484 | 2.1% | -0.5% | 4.2% | -0.8% |
| South East | £503,837 | £374,060 | 2.9% | 0.2% | 4.6% | -0.9% |
| South West | £402,523 | £299,534 | 2.9% | 0.6% | 5.7% | -0.3% |
| West Midlands Region | £343,678 | £242,810 | 1.7% | -1.3% | 6.0% | -0.4% |
| Yorkshire and The Humber | £314,495 | £203,687 | 2.0% | -1.0% | 5.0% | -0.6% |
| England | £392,112 | £286,532 | 2.6% | -0.2% | 4.8% | -0.7% |
Download this table’s data (CSV, 1KB)
Note: Since the October 2017 release, amendments have been made to our estimation model when calculating our provisional estimate. Find out further information and the impact of this change in methods used to produce the UK HPI.
6. Buyer status
| Region | Average first time buyer price May 2026 | Average former owner occupier price May 2026 | First time buyer monthly change | Former owner occupier monthly change | First time buyer annual change | Former owner occupier annual change |
|---|---|---|---|---|---|---|
| London | £465,145 | £683,412 | -1.1% | -1.4% | -3.7% | -3.5% |
| North East | £143,288 | £195,023 | 0.5% | 0.7% | 6.1% | 5.6% |
| East Midlands | £205,358 | £283,571 | -0.6% | -0.2% | 3.2% | 3.1% |
| East of England | £278,064 | £409,646 | 0.1% | 0.5% | 2.3% | 2.3% |
| North West | £190,317 | £263,588 | 1.3% | 1.5% | 5.9% | 5.7% |
| South East | £300,441 | £477,005 | 0.6% | 0.9% | 1.3% | 1.3% |
| South West | £249,143 | £362,800 | -0.6% | -0.2% | 1.9% | 1.6% |
| West Midlands Region | £210,065 | £299,075 | -0.7% | -1.0% | 3.0% | 2.4% |
| Yorkshire and The Humber | £180,330 | £248,575 | 0.1% | 0.2% | 4.6% | 4.0% |
| England | £244,288 | £355,823 | 0.0% | 0.2% | 2.3% | 2.3% |
Download this table’s data (CSV, 1KB)
We have identified an error in the calculation of first-time buyer and former owner occupier prices prior to January 2026. We advise caution when comparing breakdowns for first time buyers and former owner occupiers before and after the January 2026 estimates.
7. Funding status
Cash and mortgage indicator for England by region
| Region | Average cash price May 2026 | Average mortgage price May 2026 | Cash monthly change | Mortgage monthly change | Cash annual change | Mortgage annual change |
|---|---|---|---|---|---|---|
| London | £575,650 | £538,729 | -1.8% | -1.1% | -6.4% | -2.9% |
| North East | £153,533 | £168,999 | 0.8% | 0.5% | 6.2% | 5.8% |
| East Midlands | £239,334 | £241,323 | -0.3% | -0.4% | 3.3% | 3.1% |
| East of England | £328,649 | £341,860 | 0.5% | 0.3% | 2.1% | 2.4% |
| North West | £206,921 | £225,100 | 1.5% | 1.4% | 5.8% | 5.7% |
| South East | £372,764 | £384,779 | 1.0% | 0.7% | 1.2% | 1.3% |
| South West | £305,414 | £301,108 | -0.3% | -0.4% | 1.4% | 1.9% |
| West Midlands Region | £244,791 | £248,927 | -1.1% | -0.8% | 2.4% | 2.8% |
| Yorkshire and The Humber | £205,101 | £210,063 | 0.2% | 0.1% | 4.3% | 4.3% |
| England | £278,246 | £297,767 | 0.2% | 0.1% | 2.1% | 2.4% |
Download this table’s data (CSV, 1KB)
8. Repossession sales volumes
Due to a period of 2 weeks to 2 months between completion and registration of sales, volume figures for the most recent 2 months are not yet complete, so they are not included in the report.
Repossession sales volumes by government office region
| Region | Sales volume March 2026 |
|---|---|
| East Midlands | 6 |
| East of England | 4 |
| London | 20 |
| North East | 14 |
| North West | 13 |
| South East | 21 |
| South West | 9 |
| West Midlands Region | 11 |
| Yorkshire and The Humber | 13 |
| England | 111 |
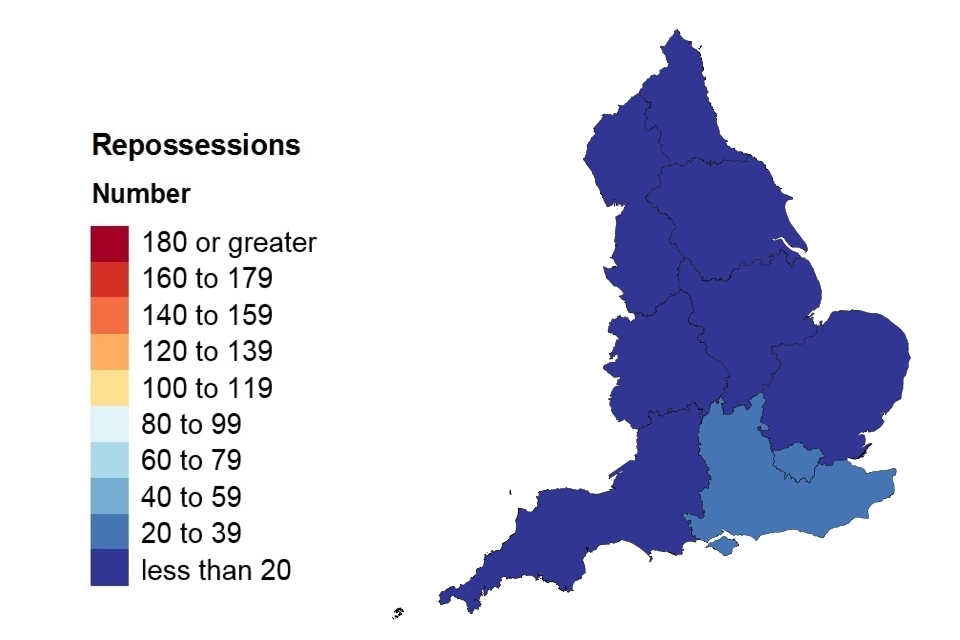
Download the data for England and Wales (CSV, 7KB)
9. Access the data
Download the data as CSV files or access it with our UK HPI tool.
Data revisions
View any revisions to previously published data in the data downloads or find out more about revisions in our guidance About the UK HPI.
10. About the UK House Price Index
The UK House Price Index (UK HPI) is calculated by the Office for National Statistics and Land & Property Services Northern Ireland. Find out about the methodology used to create the UK HPI.
Data for the UK House Price Index is provided by HM Land Registry, Registers of Scotland, The Land & Property Services/Northern Ireland Statistics & Research Agency and the Valuation Office Agency.
Find out more about the UK House Price Index.
11. Contact for England queries
Eileen Morrison, Data Services Team Leader, HM Land Registry
Email eileen.morrison@landregistry.gov.uk
Telephone 0300 006 5288