UK House Price Index summary: June 2025
Published 20 August 2025

© Crown copyright 2025
This publication is licensed under the terms of the Open Government Licence v3.0 except where otherwise stated. To view this licence, visit nationalarchives.gov.uk/doc/open-government-licence/version/3 or write to the Information Policy Team, The National Archives, Kew, London TW9 4DU, or email: psi@nationalarchives.gov.uk.
Where we have identified any third party copyright information you will need to obtain permission from the copyright holders concerned.
This publication is available at https://www.gov.uk/government/statistics/uk-house-price-index-for-june-2025/uk-house-price-index-summary-june-2025
1. Headline statistics for June 2025
The average price of a property in the UK was £269,000
The annual price change for a property in the UK was 3.7%
The monthly price change for a property in the UK was 1.4%
The monthly index figure (January 2023 = 100) for the UK was 103.1
Estimates for the most recent months are provisional and are likely to be updated as more data is incorporated into the index. Read Revisions to the UK HPI data.
Next publication of UK HPI
The July 2025 UK HPI will be published at 9.30am on Wednesday 17 September 2025. See the calendar of release dates for more information.
In September 2024’s release, UK House Price Index (UK HPI) estimates were revised from January 2022 onwards by making use of price data processed outside the UK HPI’s normal 12-month revision period. In October 2024’s release, UK HPI returned to the usual 12-month revision period. Users should be aware that revisions may be larger than usual and should note the significantly greater uncertainty around new build prices.
Previously, UK HPI had a reference period of January 2015. In February 2025’s release, UK HPI’s reference period was updated to January 2023, so UK HPI indices now report January 2023 equals 100. Re-referencing ensures the UK HPI reflects the price of the “average” property currently being sold and shifts the entire price level series for each geography and breakdown by a constant percentage without affecting inflation rates. Read more in the Office for National Statistics’ Keeping average house prices up to date blog and in the 19 February 2025 UK HPI release.
On 20 August 2025, the Office for National Statistics (ONS) introduced an improvement to HPI’s imputation method for Great Britain, which reduces initial over-estimation of new build estimates in provisional estimates. Due to reducing the initial over-estimation of new build inflation, we have reported a larger downwards revision to recent months’ estimates this month, as expected. On average, the UK HPI annual inflation rate between June 2024 and May 2025 has been revised down by 0.5 percentage points. Since this methods improvement increases the accuracy of our initial estimates, we expect overall revisions between provisional (1st) and final revised (13th) UK HPI estimates to be smaller moving forwards. More detail about this methods improvement is available in section 4.9 of HM Land Registry’s About the UK House Price Index document.
ONS will continue to monitor revisions and identify potential further methods improvements in the future.
2. Economic statement
Average UK house price annual inflation was 3.7% (provisional estimate) in the 12 months to June 2025, up from the revised estimate of 2.7% in the 12 months to May 2025.
The average UK house price was £269,000 in June 2025 (provisional estimate), which is £9,000 higher than 12 months ago. Average house prices in the 12 months to June 2025 increased in England to £291,000 (3.3%), increased in Wales to £210,000 (2.6%) and increased in Scotland to £192,000 (5.9%). The average house price increased in the year to Q2 (Apr to Jun) 2025 to £185,000 in Northern Ireland (5.5%).
On a non-seasonally adjusted basis, average UK house prices increased by 1.4% between May 2025 and June 2025, compared with an increase of 0.4% in the same period 12 months ago. On a seasonally adjusted basis, average house prices in the UK increased by 0.9% between May 2025 and June 2025.
Of the English regions, annual house price inflation was highest in the North East, where prices increased by 7.8% in the 12 months to June 2025. London was the English region with the lowest annual inflation, where prices increased by 0.8% in the 12 months to June 2025.
The Royal Institution of Chartered Surveyors’ (RICS’) June 2025 UK Residential Market Survey reported that sales market activity appears to stabilise and that house prices still display a flat, marginally negative trend at the aggregate level.
HMRC’s UK Property Transactions Statistics showed that in June 2025, on a seasonally adjusted basis, the estimated number of transactions of residential properties with a value of £40,000 or greater was 94,000. This is 1.3% higher than 12 months ago (June 2024). Between May 2025 and June 2025, UK transactions increased by 13.4% on a seasonally adjusted basis. On a non-seasonal basis between May 2025 and June 2025, HMRC reported that transactions volumes increased by 20.9% in England, decreased by 11.2% in Scotland, increased by 10.5% in Wales and increased by 14.4% in Northern Ireland. The increase in UK transactions volumes in June 2025 (particularly in England and Northern Ireland) reflect volumes rising towards more typical levels following the low April 2025 transaction volumes coinciding with the 1 April 2025 Stamp Duty Land Tax (SDLT) changes.
The Bank of England’s Money and Credit June 2025 release reported that mortgage approvals for house purchases, an indicator of future borrowing, increased by 900 to 64,200 in June.
The Bank of England’s Agents’ summary of business conditions - 2025 Q2 reported that although buyers are taking longer to make a decision to purchase, demand seems to be firming up and house prices are growing by mid-single digits in percentage terms. The exception is London and the south where market sentiment remains gloomy, demand is weak and there is some evidence of falling prices.
3. Price changes
3.1 Annual price change
Annual price change for UK by country over the past 5 years

Download this chart’s data (CSV, 1KB)
Average UK house price annual inflation was 3.7% (provisional estimate) in the 12 months to June 2025, up from the revised estimate of 2.7% in the 12 months to May 2025.
The average UK house price was £269,000 in June 2025 (provisional estimate), which is £9,000 higher than 12 months ago. Average house prices in the 12 months to June 2025 increased in England to £291,000 (3.3%), increased in Wales to £210,000 (2.6%) and increased in Scotland to £192,000 (5.9%). The average house price increased in the year to Q2 (Apr to Jun) 2025 to £185,000 in Northern Ireland (5.5%).
3.2 Average price by country and government office region
Price, monthly change and annual change by country and government office region
| Country and government office region | Price | Monthly change | Annual change |
|---|---|---|---|
| England | £290,956 | 1.3% | 3.3% |
| Northern Ireland | £185,108 | 0.3% | 5.5% |
| Scotland | £191,927 | 2.2% | 5.9% |
| Wales | £209,728 | 0.7% | 2.6% |
| East Midlands | £238,635 | 0.6% | 4.4% |
| East of England | £337,920 | 1.2% | 3.7% |
| London | £561,309 | 0.6% | 0.8% |
| North East | £163,679 | 3.4% | 7.8% |
| North West | £212,057 | 2.5% | 5.0% |
| South East | £383,486 | 1.4% | 2.8% |
| South West | £301,660 | 0.5% | 1.5% |
| West Midlands Region | £246,910 | 1.8% | 3.5% |
| Yorkshire and The Humber | £204,410 | 0.7% | 3.3% |
Download this table’s data (CSV, 1KB)
Price changes by country and government office region
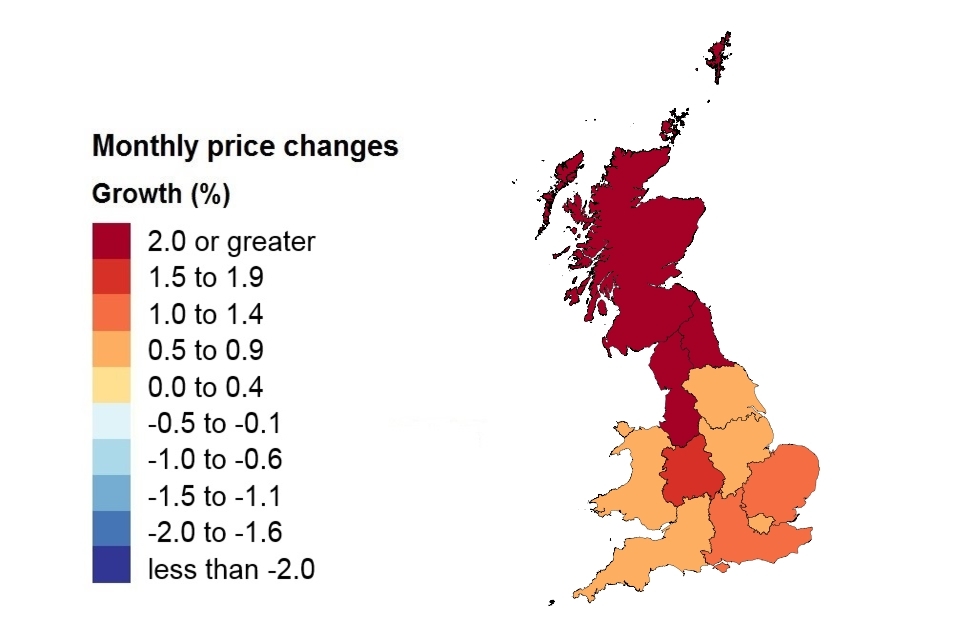
On a non-seasonally adjusted basis, average UK house prices increased by 1.4% between May 2025 and June 2025, compared with an increase of 0.4% in the same period 12 months ago. On a seasonally adjusted basis, average house prices in the UK increased by 0.9% between May 2025 and June 2025.
3.3 Average price by property type
Average monthly price by property type
| Property type | June 2025 | June 2024 | Difference |
|---|---|---|---|
| Detached | £437,904 | £419,358 | 4.4% |
| Semi-detached | £271,985 | £258,910 | 5.0% |
| Terraced | £226,922 | £217,952 | 4.1% |
| Flat or maisonette | £196,303 | £195,694 | 0.3% |
| All | £269,079 | £259,585 | 3.7% |
Download this table’s data (CSV, 1KB)
4. Sales volumes
ONS and HM Land Registry have been working collaboratively to improve transactions volumes available for use in UK HPI and reduce the size of revisions. In 2024, HM Land Registry successfully returned to processing over 40% of HM Revenue and Customs’ provisional sales estimate for UK HPI’s first estimate (the target specified in the UK HPI Quality and methodology). UK HPI sales volume estimates for older periods and new builds remain lower than historical averages, but continue to improve.
Users should be aware that revisions may be larger than historically and should note the greater uncertainty around new build prices.
4.1 Sales volumes
Number of sales volumes by country
Provisional UK HPI estimates for June 2025 are based on approximately 32,400 records for England, 7,600 for Scotland, and 1,900 for Wales. This represents 45% of HMRC’s provisional sales estimate for June 2025, as detailed in their Monthly property transactions completed in the UK with value of £40,000 or above estimates. Over time, more records will become available for recent periods, which will be used to revise UK HPI estimates and sales volumes, in line with the revision policy published by the ONS and HMLR.
Sales estimates from UK HPI differ from estimates from HMRC because of different data sources, revision period size and coverage. HMRC’s Quality report states there are likely to be inaccuracies in their data because of reporting or keying errors, such as misclassification between residential and non-residential transactions. However, HMRC take steps to reduce this measurement error. Another reason for differences could be that residential property transactions, where the buyer or seller is a corporate body, company or business, are excluded from UK HPI data, but included in HMRC data.
Further information on data sources, revision policy, methods and quality is available in HMLR’s UK HPI guidance.
Comparing the provisional volume estimate for the current month with the revised volume estimate for the corresponding month in the previous year
| Country | April 2025 | April 2024 |
|---|---|---|
| England | 18,719 | 48,641 |
| Northern Ireland | 1,498 | 1,838 |
| Scotland | 7,598 | 7,770 |
| Wales | 1,981 | 2,617 |
Note: Comparing the provisional volume estimate for the current month with the revised 12-month volume estimate.
Download this table’s data (CSV, 1KB)
Note: The ‘Difference’ column has been removed from this table as the latest month’s data are not yet complete.
Note: The number of property transactions for April 2025 will increase as more transactions are incorporated into the index. See our Revisions Policy for more information.
Comparing the provisional UK HPI volume estimate for April 2024 with the provisional UK HPI volume estimate for April 2025, volume transactions decreased by 15.0% in England, decreased by 0.6% in Scotland and increased by 49.1% in Wales. Northern Ireland’s UK HPI volume transactions decreased by 11.3% in the year to Quarter 2 2025.
UK Property Transaction Statistics published by HM Revenue & Customs (which differ in coverage but are more complete for this period) report that in the 12 months to April 2025, on a non-seasonally adjusted basis, HMRC volume transactions decreased by 32.3% in England, decreased by 1.6% in Scotland, increased by 13.6% in Wales and decreased by 25.0% in Northern Ireland.
4.2 Sales volumes for the UK over the past 5 years
Sales volumes for 2021 to 2025 by country: April

Download this table’s data (CSV, 1KB)
Note: The ‘Difference’ column has been removed from this table as the latest month’s data are not yet complete.
Note: The number of property transactions for April 2025 will increase as more transactions are incorporated into the UK HPI index. See our Revisions Policy for more information.
Comparing the provisional UK HPI volume estimate for April 2024 with the provisional UK HPI volume estimate for April 2025, UK volume transactions decreased by 8.9%.
UK Property Transaction Statistics published by HM Revenue & Customs (which differ in coverage but are more complete for this period) report that on a non-seasonally adjusted basis, HMRC volume transactions for the UK decreased by 27.1% in the 12 months to April 2025.
New build and existing resold property
| Property status | Average price April 2025 | Monthly change | Annual change |
|---|---|---|---|
| New build | £368,354 | 2.0% | 14.2% |
| Existing resold property | £257,426 | -2.7% | 1.6% |
Download this table’s data (CSV, 1KB)
Note: Since the October 2017 release, amendments have been made to our estimation model when calculating our provisional estimate. Find out further information and the impact of this change in the methods used to produce the UK HPI.
5. Buyer status for Great Britain
First time buyer and former owner occupier
For Great Britain only, Northern Ireland data is not available for buyer status.
| Type of buyer | Average price June 2025 | Monthly change | Annual change |
|---|---|---|---|
| First time buyer | £227,495 | 1.4% | 3.4% |
| Former owner occupier | £331,139 | 1.4% | 3.8% |
Download this table’s data (CSV, 1KB)
6. Funding status for Great Britain
Cash and mortgage
For Great Britain only, Northern Ireland data is not available for funding status.
| Funding status | Average price June 2025 | Monthly change | Annual change |
|---|---|---|---|
| Cash | £256,306 | 1.5% | 3.0% |
| Mortgage | £278,487 | 1.4% | 3.9% |
Download this table’s data (CSV, 1KB)
7. Access the data
Download the data as CSV files or access it with our UK HPI tool.
Data revisions
View any revisions to previously published data in the data downloads or find out more about revisions in our guidance About the UK HPI.
8. Housing transaction distributions
Between January and March 2025, there were 199,202 property sales.
The most popular price range for:
- England was £250,000 - £274,999 – 10,801 properties were purchased
- Scotland was £125,000 to £149,999 – 1,832 properties were purchased
- Wales was £150,000 to £174,999 – 836 properties were purchased
- Northern Ireland was £175,000 to £199,999 – 802 properties were purchased
The charts below show the distribution of housing transactions for Q1 (January to March) 2025 for countries of the UK. Data for Great Britain is presented in bands of £25,000 up to £10 million, followed by a larger band for over £10 million. Data for Northern Ireland is presented in bands of £25,000 up to £500,000, followed by a larger band for over £500,000.
In line with the UK HPI revisions policy, the number of transactions will increase as more data are incorporated into the index, which would also impact the distributions presented in this analysis.
England housing transactions
| Price band | Housing transactions |
|---|---|
| less than £25,000 | 33 |
| £25,000 - £49,999 | 364 |
| £50,000 - £74,999 | 1,532 |
| £75,000 - £99,999 | 3,394 |
| £100,000 - £124,999 | 5,063 |
| £125,000 - £149,999 | 7,313 |
| £150,000 - £174,999 | 9,183 |
| £175,000 - £199,999 | 10,275 |
| £200,000 - £224,999 | 10,371 |
| £225,000 - £249,999 | 10,703 |
| £250,000 - £274,999 | 10,801 |
| £275,000 - £299,999 | 9,863 |
| £300,000 - £324,999 | 9,327 |
| £325,000 - £349,999 | 8,512 |
| £350,000 - £374,999 | 8,217 |
| £375,000 - £399,999 | 7,553 |
| £400,000 - £424,999 | 6,593 |
| £425,000 - £449,999 | 5,876 |
| £450,000 - £474,999 | 4,969 |
| £475,000 - £499,999 | 4,309 |
| £500,000 - £524,999 | 3,618 |
| £525,000 - £549,999 | 3,198 |
| £550,000 - £574,999 | 2,840 |
| £575,000 - £599,999 | 2,543 |
| £600,000 - £624,999 | 2,334 |
| £625,000 - £649,999 | 2,046 |
| £650,000 - £674,999 | 1,635 |
| £675,000 - £699,999 | 1,477 |
| £700,000 - £724,999 | 1,270 |
| £725,000 - £749,999 | 1,140 |
| £750,000 - £774,999 | 1,043 |
| £775,000 - £799,999 | 872 |
| £800,000 - £824,999 | 845 |
| £825,000 - £849,999 | 687 |
| £850,000 - £874,999 | 759 |
| £875,000 - £899,999 | 625 |
| £900,000 - £924,999 | 524 |
| £925,000 - £949,999 | 403 |
| £950,000 - £974,999 | 453 |
| £975,000 - £999,999 | 362 |
| £1,000,000 - £1,249,999 | 1,696 |
| £1,250,000 - £1,499,999 | 940 |
| £1,500,000 - £1,749,999 | 503 |
| £1,750,000 - £1,999,999 | 284 |
| £2,000,000 - £4,999,999 | 572 |
| £5,000,000 - £9,999,999 | 43 |
| greater than £10,000,000 | 11 |
Scotland housing transactions
| Price band | Housing transactions |
|---|---|
| less than £25,000 | 55 |
| £25,000 - £49,999 | 570 |
| £50,000 - £74,999 | 1,008 |
| £75,000 - £99,999 | 1,440 |
| £100,000 - £124,999 | 1,639 |
| £125,000 - £149,999 | 1,832 |
| £150,000 - £174,999 | 1,743 |
| £175,000 - £199,999 | 1,479 |
| £200,000 - £224,999 | 1,266 |
| £225,000 - £249,999 | 1,271 |
| £250,000 - £274,999 | 1,054 |
| £275,000 - £299,999 | 931 |
| £300,000 - £324,999 | 805 |
| £325,000 - £349,999 | 630 |
| £350,000 - £374,999 | 511 |
| £375,000 - £399,999 | 434 |
| £400,000 - £424,999 | 382 |
| £425,000 - £449,999 | 299 |
| £450,000 - £474,999 | 235 |
| £475,000 - £499,999 | 164 |
| £500,000 - £524,999 | 122 |
| £525,000 - £549,999 | 101 |
| £550,000 - £574,999 | 98 |
| £575,000 - £599,999 | 70 |
| £600,000 - £624,999 | 66 |
| £625,000 - £649,999 | 61 |
| £650,000 - £674,999 | 55 |
| £675,000 - £699,999 | 41 |
| £700,000 - £724,999 | 24 |
| £725,000 - £749,999 | 28 |
| £750,000 - £774,999 | 26 |
| £775,000 - £799,999 | 18 |
| £800,000 - £824,999 | 22 |
| £825,000 - £849,999 | 19 |
| £850,000 - £874,999 | 20 |
| £875,000 - £899,999 | 12 |
| £900,000 - £924,999 | 12 |
| £925,000 - £949,999 | 8 |
| £950,000 - £974,999 | 7 |
| £975,000 - £999,999 | 7 |
| £1,000,000 - £1,249,999 | 38 |
| £1,250,000 - £1,499,999 | 19 |
| £1,500,000 - £1,749,999 | 7 |
| £1,750,000 - £1,999,999 | 4 |
| £2,000,000 - £4,999,999 | 3 |
| £5,000,000 - £9,999,999 | 0 |
Wales housing transactions
| Price band | Housing transactions |
|---|---|
| less than £25,000 | 0 |
| £25,000 - £49,999 | 13 |
| £50,000 - £74,999 | 117 |
| £75,000 - £99,999 | 303 |
| £100,000 - £124,999 | 536 |
| £125,000 - £149,999 | 782 |
| £150,000 - £174,999 | 836 |
| £175,000 - £199,999 | 776 |
| £200,000 - £224,999 | 640 |
| £225,000 - £249,999 | 540 |
| £250,000 - £274,999 | 511 |
| £275,000 - £299,999 | 430 |
| £300,000 - £324,999 | 267 |
| £325,000 - £349,999 | 241 |
| £350,000 - £374,999 | 208 |
| £375,000 - £399,999 | 188 |
| £400,000 - £424,999 | 138 |
| £425,000 - £449,999 | 121 |
| £450,000 - £474,999 | 98 |
| £475,000 - £499,999 | 75 |
| £500,000 - £524,999 | 38 |
| £525,000 - £549,999 | 52 |
| £550,000 - £574,999 | 40 |
| £575,000 - £599,999 | 35 |
| £600,000 - £624,999 | 27 |
| £625,000 - £649,999 | 16 |
| £650,000 - £674,999 | 15 |
| £675,000 - £699,999 | 18 |
| £700,000 - £724,999 | 11 |
| £725,000 - £749,999 | 14 |
| £750,000 - £774,999 | 10 |
| £775,000 - £799,999 | 8 |
| £800,000 - £824,999 | 4 |
| £825,000 - £849,999 | 6 |
| £850,000 - £874,999 | 7 |
| £875,000 - £899,999 | 1 |
| £900,000 - £924,999 | 4 |
| £925,000 - £949,999 | 1 |
| £950,000 - £974,999 | 2 |
| £975,000 - £999,999 | 2 |
| £1,000,000 - £1,249,999 | 7 |
| £1,250,000 - £1,499,999 | 7 |
| £1,500,000 - £1,749,999 | 2 |
| £1,750,000 - £1,999,999 | 1 |
| £2,000,000 - £4,999,999 | 1 |
Northern Ireland housing transactions
| Price band | Housing transactions |
|---|---|
| less than £25,000 | 4 |
| £25,000 - £49,999 | 53 |
| £50,000 - £74,999 | 197 |
| £75,000 - £99,999 | 490 |
| £100,000 - £124,999 | 610 |
| £125,000 - £149,999 | 758 |
| £150,000 - £174,999 | 784 |
| £175,000 - £199,999 | 802 |
| £200,000 - £224,999 | 569 |
| £225,000 - £249,999 | 463 |
| £250,000 - £274,999 | 377 |
| £275,000 - £299,999 | 281 |
| £300,000 - £324,999 | 207 |
| £325,000 - £349,999 | 158 |
| £350,000 - £374,999 | 157 |
| £375,000 - £399,999 | 116 |
| £400,000 - £424,999 | 82 |
| £425,000 - £449,999 | 70 |
| £450,000 - £474,999 | 51 |
| £475,000 - £499,999 | 41 |
| greater than £500,000 | 173 |
9. About the UK House Price Index
The UK House Price Index (UK HPI) is calculated by the Office for National Statistics and Land & Property Services Northern Ireland. Find out about the methodology used to create the UK HPI.
Data for the UK House Price Index is provided by HM Land Registry, Registers of Scotland, The Land & Property Services/Northern Ireland Statistics & Research Agency and the Valuation Office Agency.
Find out more about the UK House Price Index.
A key determinant of house prices is the demographic characteristics of the area in which the property is located. The UK HPI uses the socio-demographic classification, known as Acorn, in the hedonic regression model to measure the affluence of the area.
Prior to 20 December 2023’s publication, property transactions in Great Britain were excluded from the regression model if their Acorn classification was missing. From 20 December 2023’s publication, these properties are included in the regression model from January 2023’s data onwards, but are given less weight in the calculations, as described above. This methodology improvement aligns how transactions with missing Acorn classification are used in the Great Britain model and Northern Ireland model, increasing coherence across the UK and improving the quality of UK HPI statistics.
10. Contact
Eileen Morrison, Data Services Team Leader, HM Land Registry
Email eileen.morrison@landregistry.gov.uk
Telephone 0300 006 5288
Aimee North, Head of Housing Market Indices, Office for National Statistics
Email aimee.north@ons.gov.uk
Telephone 01633 580090
Ciara Cunningham, Statistician for the Northern Ireland HPI
Email ciara.cunningham@finance-ni.gov.uk
Telephone 028 90 336035
Garreth Jones, Land & Property Data Team, Registers of Scotland
Email Garreth.Jones@ros.gov.uk
Telephone 0131 378 4114